Article

Embodied and Operational Energy of a Case Study Villa in UAE with Sensitivity Analysis

by
Abdul Rauf
1,*,
Daniel Efurosibina Attoye
1 and
Robert Crawford
2
1
Architectural Engineering Department, United Arab Emirates University, Al Ain 15551, United Arab Emirates
2
Faculty of Architecture, Building and Planning, The University of Melbourne, Parkville, VIC 3010, Australia
*
Author to whom correspondence should be addressed.
Buildings 2022, 12(9), 1469; https://doi.org/10.3390/buildings12091469
Submission received: 31 July 2022 / Revised: 24 August 2022 / Accepted: 5 September 2022 / Published: 16 September 2022
(This article belongs to the Special Issue ZEMCH—Zero Energy Mass Custom Home International Research 2021)

Abstract

:
Extensive focus on operational energy research has positively impacted both academia and policymakers, facilitating new strategies that reduce the energy consumed by building occupants. Much less emphasis has, however, been given to embodied energy. Consequently, although studies now show that embodied energy can be responsible for up to 50% of a building’s life cycle energy, little is known about the embodied energy associated with the construction of buildings, materials, and components in the study context. The aim of this study is to investigate the current scenario in the United Arab Emirates (UAE) by calculating the embodied energy of a residential villa, and estimating the initial, recurrent, and demolition and disposal embodied energies over a 50-year building life span. A detailed assessment of the embodied energy associated with the construction of the case study villa was carried out using an input–output hybrid approach, followed by a sensitivity analysis focused on variations related to the energy associated and consumed, as well as the adoption of renewable energy sources. The findings show that the initial embodied energy was 57% of the life cycle embodied energy and 19% of the life cycle energy of the villa while the recurrent embodied energy was 43% of the life cycle embodied energy and 14% of the life cycle energy of the villa. The life cycle embodied energy of the villa, over a 50-year life span was 36% of the life cycle energy. This paper also highlights the impact of adding a solar PV system and lists multiple areas for future studies related to embodied energy and its benefit to stakeholders in the building industry.

1. Introduction

Globally, the consensus on the impact of buildings and the built environment is definitive; responsible for over 40% of global energy consumption, 36% of all CO2 emissions [1,2], and 28% of greenhouse gas emissions [3], with predictions of a rise in global energy consumption by 50% by 2050 [4]. The United Arab Emirates (UAE) and some countries in the Gulf Corporation Countries (GCC), however, have different figures.
Generally speaking, as energy use increases, there is a comparative rise in emissions, either during manufacture or along the energy chain from generation to distribution [5,6]. Other studies have shown that there is a strong relationship between emissions and energy consumption, noting that energy consumption has a direct environmental impact [7,8]. Thus, reducing energy use would theoretically, reduce emissions both directly and indirectly. Sustainable thinking related to energy planning and design is therefore vital; however, in some contexts and sectors, such as the building sector, the need is more severe.
According to some studies, the building sector in the UAE is reported to consume about 70% of the electricity produced and due to the climatic condition of the region, almost 70% is used for cooling [9,10]. This is operational energy, the energy used for space heating, cooling, or ventilation, as well as lighting, hot water provision, and power for electrical appliances [11,12].
However, it is not only operational energy that informs the impact of buildings on the environment. Studies have recently argued that there is a need for comprehensive and further consideration of the frequently, unexplored aspect of embodied energy [13,14,15,16]. This refers to the energy associated with the building’s production, and use—either renovation and replacement, as well as demolition [17]. It includes raw material extraction and transportation, manufacturing of products, transportation to the site, and final construction at the building site [14,16,18,19].
Previous studies have now argued that there is a need for international attention to bridge the gap poised by this lack of investigation and engage a more comprehensive assessment beyond a single focus on operational energy [14,16]. Other authors have recently asserted that the global movement toward a sustainable emphasis on planning, and, specifically, a sustainable energy transition requires a key emphasis on embodied energy [20].
There have been attempts in the literature to underscore the importance and investigate the proportion of embodied energy in several case study investigations. For traditional or conventional buildings, it has been reported that embodied energy may account for 2–38% of the life cycle energy [21]. However, for the new trends in low-energy buildings, embodied energy has been reported to be as high as 50% [21,22] or 60% [23]. There are indeed variations that arise in these assessments due to the type of embodied energy assessment method; however, in a previous work, Rauf and Crawford (2013) used a comprehensive embodied energy calculation method in their investigation. The study showed that the life cycle embodied energy in an Australian building in Melbourne may be 60%, and thus higher than the life cycle operational energy, assuming a 50-year lifespan of the building [24].
Currently, the international community of researchers, construction professionals, and policymakers is beginning to appreciate the need for a transition towards low-energy buildings; however, this shift has unaddressed negative impacts. Some studies argue that the reduction in operational energy advanced by passive buildings and high-performing buildings leads to an increase in the use of building materials [22,25], which ultimately leads to an increase in embodied energy [26].
In the context of the United Arab Emirates (UAE), there is inadequate data to properly approximate the embodied energy of the construction materials used in the buildings, making investigations in this area difficult [27,28]. This affirms the crucial need for research in the context and region to emphasize embodied energy, particularly since there is a significant national interest in high-performing and low-operational energy buildings based on high consumption patterns. Thus, the primary aim of this paper is to address this gap by investigating the proportion of embodied energy associated with residential buildings in the UAE using a case study investigation approach. Attention is given to the total life cycle energy demand, including both the initial embodied energy and recurrent embodied energy, as well as the operational energy over a 50-year building lifespan of the selected representative UAE residential building.

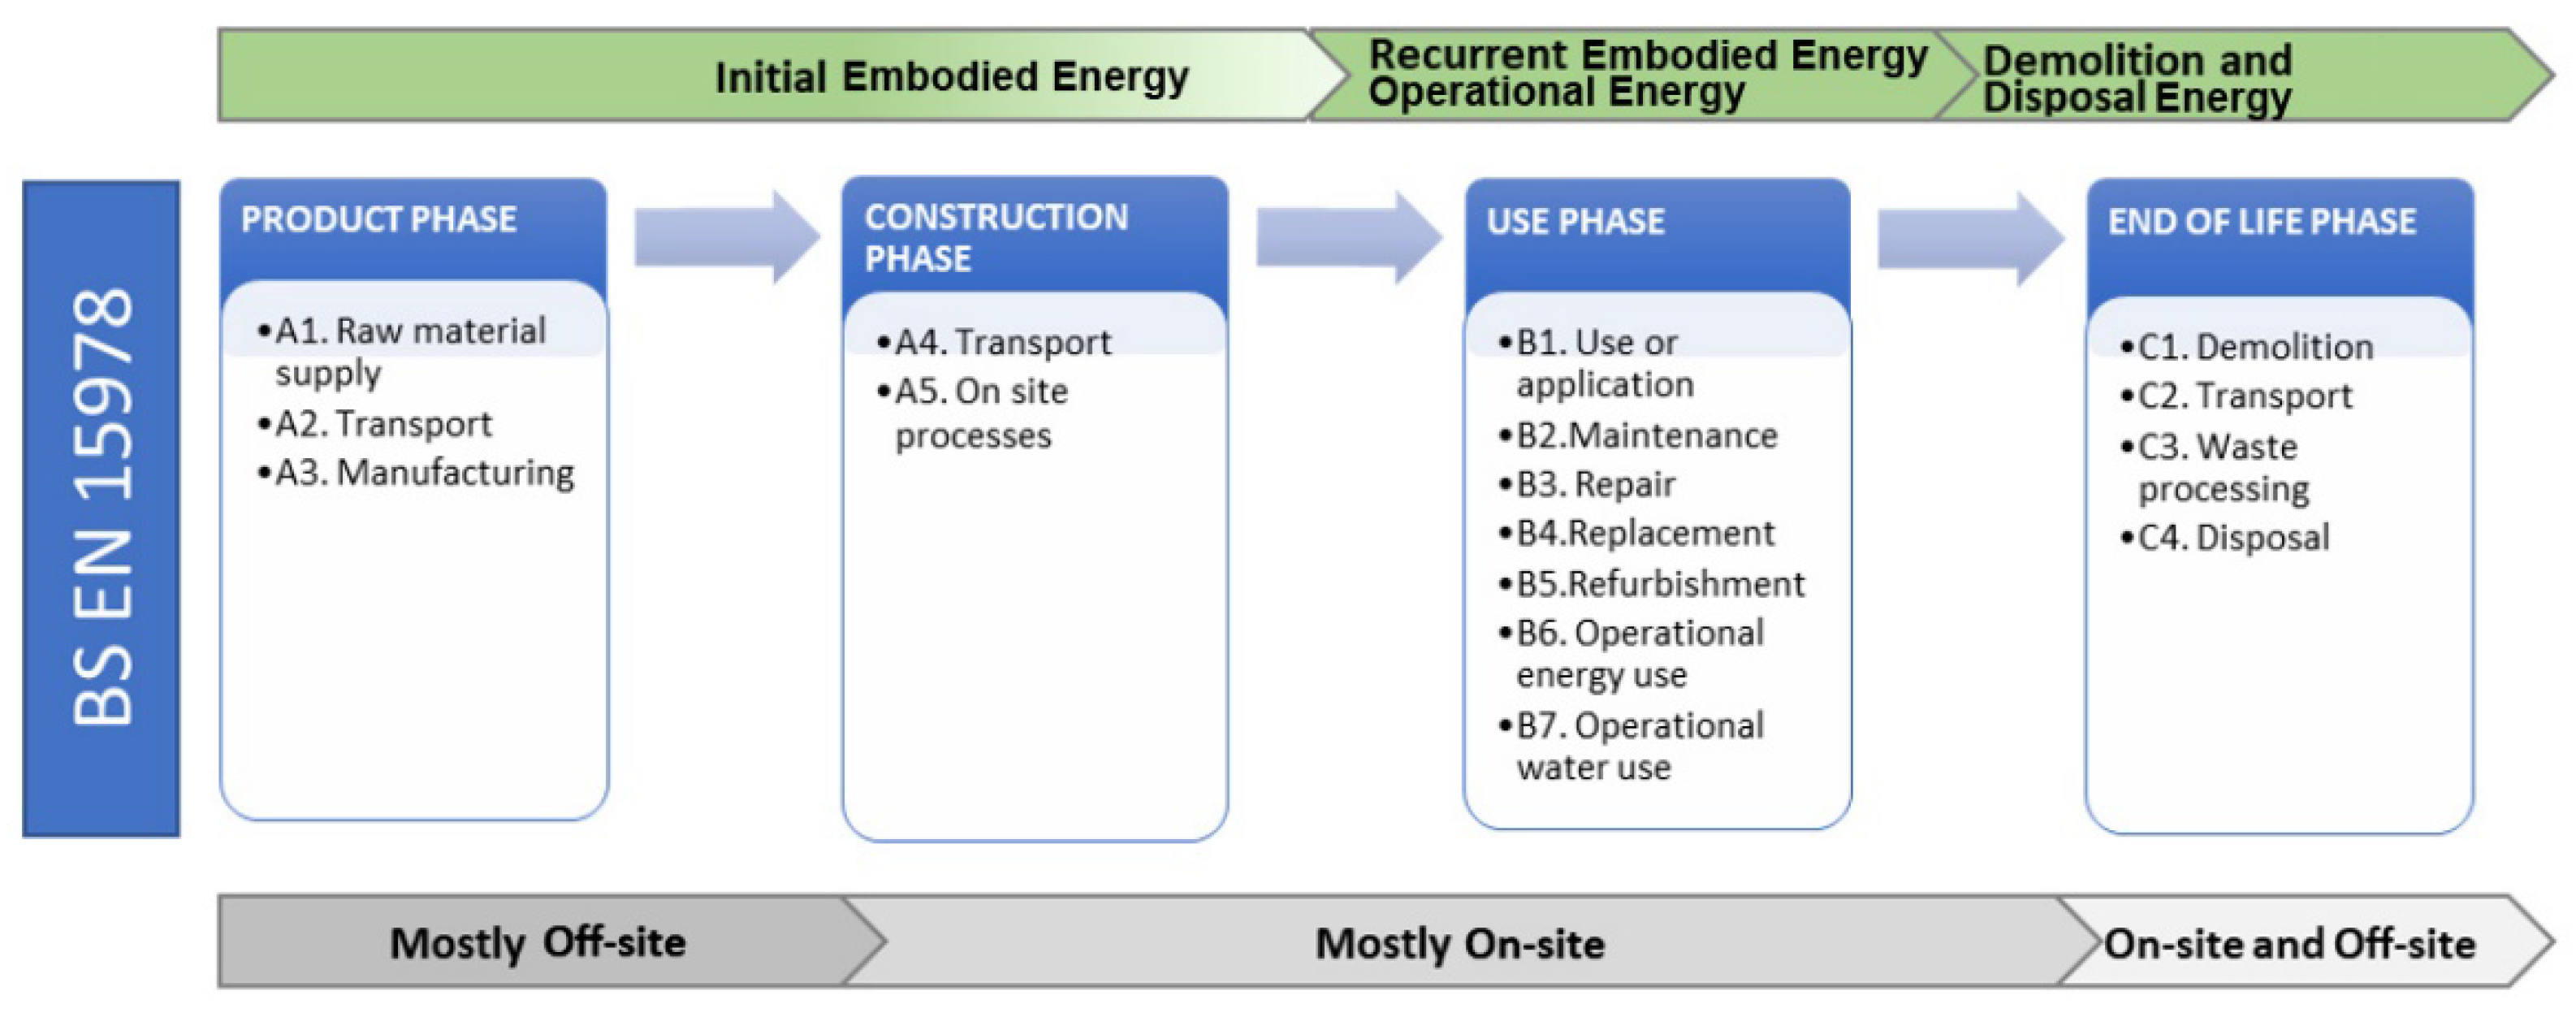
2. Life Cycle Energy Analysis

Several studies have embarked on investigations in multiple contexts to calculate both the embodied associated and operational energy consumed by a building. When this assessment is calculated with a scope that covers the entire lifespan of the building, it is called a life cycle energy analysis (LCEA). Such investigations have been conducted on office buildings [29,30], commercial buildings [31,32], and residential buildings [33,34,35].
A succinct definition of the LCEA is to consider it in relation to a standard life cycle assessment (LCA); an LCEA is simply a more focused version of the life cycle assessment (LCA), which concentrates only on the energy associated or consumed over the lifespan of the building [36]. By this definition, it is clear that LCEA includes an assessment of both embodied energy and operational energy [37]. It is associated with the manufacturing, construction, operation, and maintenance, as well as the demolition and end-of-life phases of the building [16,36]. Thus, a proper LCEA deals closely with the environmental aspects of building impact [38].
In the literature, investigations have explored and investigated various operational energy calculation methods [39,40,41]. These methods are well established and help to promote clarity in this field of research. The reverse is, however, the case in relation to embodied energy assessments as methods are still underdeveloped and not fully understood [42]. In a recent review, Omrany et al. (2020) suggested that some strategies that were employed to reduce the building’s operational energy resulted in an increase in embodied energy [36].
In estimating the life cycle energy of a building, multiple factors come to bear; for example, the energy consumption of systems, energy sources, material specifications, construction methods, and other human factors such as energy use patterns and behavior [40,43]. The CEN—EN 15978 provides some standardization that outlines the life cycle of a building as a function of the various stages that it undergoes over its life span. It reflects the activities associated with production, construction, use, and end-of-life stages. The standard provides a classic summary of the broad considerations that define and describe a detailed life cycle energy assessment [44].

2.1. Embodied Energy of Buildings

In order to define “embodied energy”, it is necessary to understand that energy is associated with every stage of a building’s life cycle. Before building construction commences, the building already has begun to consume a significant amount of energy. There are direct and indirect energies associated with every building, while direct energy is the energy related to the construction of the building, indirect energy is associated with the extraction and manufacture of raw materials used in the construction [45]. Thus, there is energy used directly onsite and offsite during construction and related processes, as well as indirectly in relation to the use of materials and equipment.
There are three components of embodied energy: initial embodied energy (IEE) refers to all energy associated with the initial construction, including the energy used in material manufacture, transportation, and delivery. Secondly, recurrent embodied energy (REE) is the energy that is consumed or associated with servicing the building during its lifespan; it relates to repair, replacement, and general maintenance of the building. Finally, there is the energy associated with demolition and disposal at the end-of-life stage of the building [26,46]. The sum of these various components is called the life cycle embodied energy of the building [20,26,42,47]. Figure 1 shows the relationship between the life cycle stages of a building as defined by BS EN 15978 and associated embodied energy components [44,48]. The boundaries for various life cycle stages include the product phase (A1 to A3), construction phase (A4 to A5), use phase (B1 to B7), and end-of-life phase (C1 to C4). While the first two phases relate closely to the initial embodied energy (IEE) assessment, the use phase relates to the operational and recurrent embodied energy (REE) assessment, and the end-of-life phase, to the demolition and disposal embodied energy (DEE) assessment.
Although reported as significantly important, there seems to be some lack of clarity in embodied energy assessments as most studies in this area do not clearly explain the calculation method; according to a review by Dixit (2019), only about 30% of related studies actually state the calculation approach [46]. Other key issues that impact the embodied energy assessment apart from the calculation method include the material database and system boundary [36,46,49]. Other important considerations based on the scope of the study include the architectural design, service life of materials, and building service life [16,50]. Table 1 lists some of the factors investigated by several researchers that impact the calculated embodied energy in the respective cases.
A previous study indicated that life cycle embodied energy can be as high as 60%, and thus, significantly more than the life cycle operational energy [24]. Other studies report that EE makes up 35% of the primary energy for advanced retrofit homes [57], and 67% for high-energy performing buildings, compared to 32% for conventional construction [30]. These studies suggest that embodied energy for high-performing buildings may be greater due to the use of more materials, when compared with standard construction [22,26].

2.2. Embodied Energy Assessment Methods

The assessment of embodied energy can be carried out using various approaches. The common methods include process analysis, input–output analysis, and hybrid analysis [16,25,46]. Selection of a particular embodied energy assessment method is considered one of the reasons for differences in the calculated values across different studies [18]. In recent times, leading researchers have argued and worked towards a direct response to this issue, stating that a global standard for carrying out these assessments is needed [46].
The process analysis is one of the common methods that has been used in different contexts to assess both simulated and case study investigations on embodied energy [35,58] and to evaluate product manufacturing from a sustainability dimension [59]. This method is based on data sourced from various processes, products, and locations, as well as environmental flows and information to assess the embodied energy of a product [16,18] and approximate energy aspects [60]. Due to incomplete manufacturer data used in this approach, the system boundary may be prone to incomplete ness [16,18,46,61]. In some cases, complex supply chain issues may also cause uncertainties in how reliable this approach is [16,46]. Some researchers argue that the number of steps makes it time-consuming [62] and the results may have truncation errors due to stated uncertainties in the process [61,63].
The inputoutput analysis is another common method that has been used in different contexts to assess both simulated and case study investigations on embodied energy, and it has been used in several studies [32,54,55]. The simultaneous dual-tracking of energy flow and monetary transactions applied in this method to assess a supply chain is used to ensure the completeness of the system boundary [18,42,60]. This robust and very comprehensive approach has been labeled as an alternative approach for life cycle assessment (LCA) [64]. Some studies argue that it, however, has disadvantages that relate to its “…homogeneity, proportionality, and inadequate considerations of the economies of scale” [50]. This is a result of data mismatch due to the comparison and collation of extracted national economic data and different products across different sectors [24,46,60,65]. Dixit concludes that energy inputs may inaccurately be counted twice with the results consequently being incorrect or unreliable [46].
The hybrid analysis seeks to adapt the advantages of previous analysis methods into one calculation approach [66], in a way that addresses their limitations [67]. This approach is the most comprehensive technique in computing life cycle inventories [18,68]. This assertion argues that it allows for the combination of bottom-up industrial process data and top-down macroeconomic input–output data. There are two variations of this approach, either a process-based hybrid analysis (PBHA) or an input–output-based hybrid analysis (IOBHA). In general, the process-based hybrid analysis as an approach focuses on the quantification of individual products delivered in addition to energy intensities extrapolated using the input–output analysis [61,69]. This second component is mathematically computed for each material by adding process data results of the energy required to produce it, to “the difference between the total energy intensity of the input–output path of the basic material, and then multiplying it by the total price of the basic material” [69].
On the other hand, the input–output-based hybrid analysis is used to solve the limitation of the process analysis/process-based hybrid analysis [70]. Recently, it was suggested that though this approach applies an integrated system boundary, its input–output data are liable to be outdated or miss new product data [25]. Other authors [68,71,72] have asserted that the lack of a database may limit the accuracy of an embodied energy calculation even in an input–output hybrid analysis. However, other authors [16,18], argue that embodied energy calculations using this approach combine several steps such as energy data aggregated from process analysis with system boundary completeness improved by hybrid material energy intensity figures and input–output data. In addition, the approach makes use of an integrated process and the input–output data at the material level to create and define hybrid material energy coefficients” [18].

3. Research Method

The core research objective of this study was to quantify the total life cycle energy demand, the initial embodied energy, and the recurrent embodied energy for a residential building in the UAE. To accomplish this task, a representative 5-bedroom residential villa in the UAE was selected. The period of analysis chosen for this study was 50 years based on the assumption that a building will be used for that period. It is also assumed that at the end of this period, the building would be at the end of its useful life and ready for demolition.
Based on the referenced literature in Section 2, the selected approach for calculating the embodied energy for the current investigation was the input–output hybrid approach. In addition, secondary data from previous studies were used to approximate the operational energy of the building and the calculation of its life cycle energy. There are few comparatively related investigations with a robust material database reference in the UAE on embodied energy that define the system boundaries, embodied energy coefficients, and intensities needed for this investigation. Due to the absence of comprehensive energy intensity data for different building materials and components used in the construction industry in the UAE, the EPIC database compiled by the University of Melbourne, Australia [48], was used in this study to calculate embodied energy.

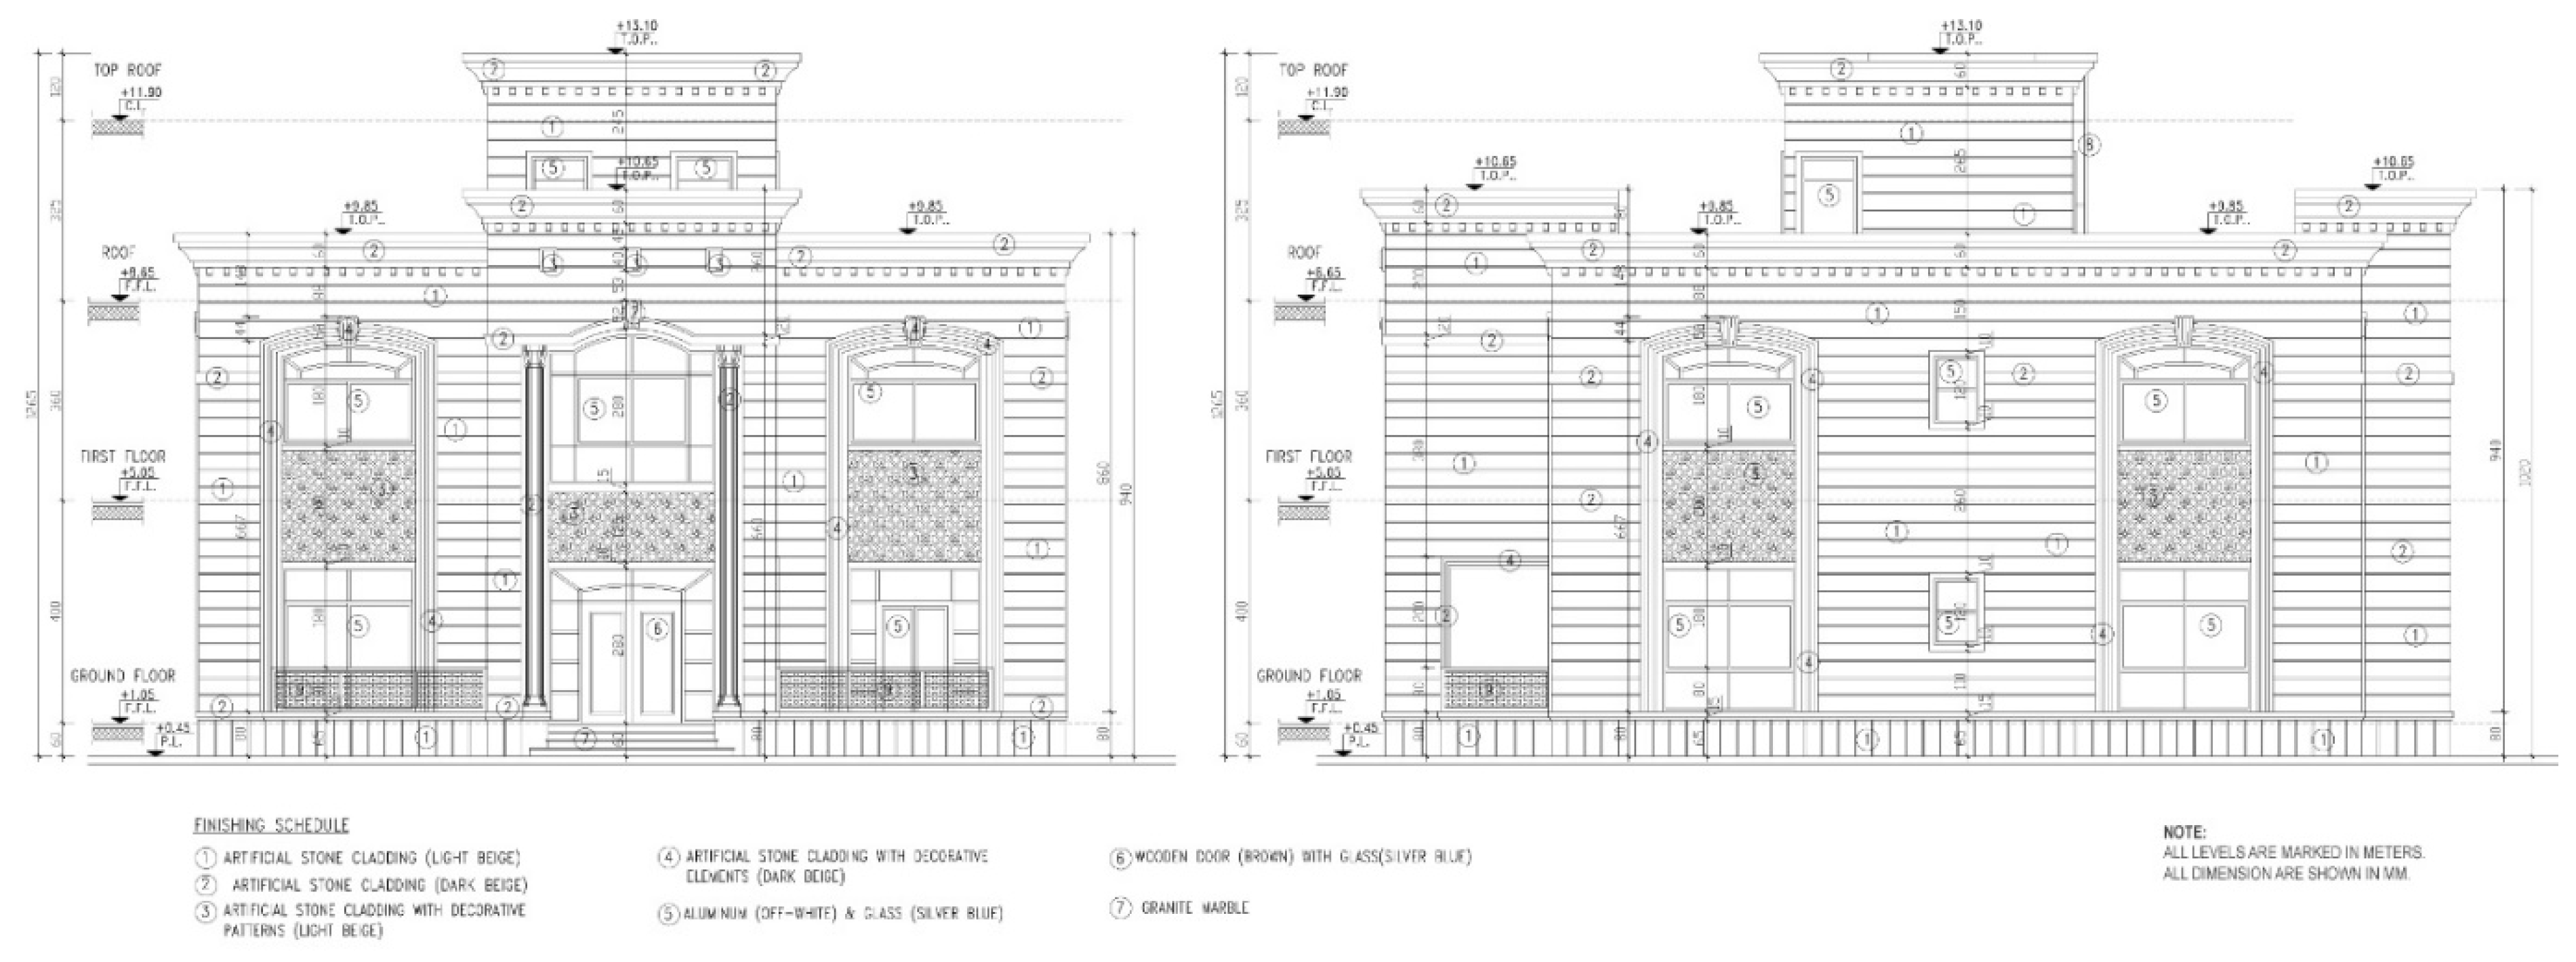
3.1. Case Study Building

A two-story 5-bedroom villa located in Al Ain with a total floor area of 532 m2 was used as the case study for this analysis (See Figure 2). Generally, a residential villa is the default style of housing for UAE citizens, provided by the government or personally built. Examples of such developments are frequently found in various neighborhoods across the Emirates [73] and range from 3 to 10 bedrooms [74,75]. The selected villa was constructed using conventional materials and construction systems including a concrete slab floor, hollow block walls, and plaster. Wall finishes include ceramic tiles, and oil and acrylic paint; the ceiling was made of plasterboard and the floors are covered with ceramic tiles. The windows are double-glazed and aluminum-framed, and the doors and their frames were made of teak wood.
A full material schedule was received from the firm that designed the building and was used for the EE calculations. Table 2 shows a summary of the major materials used in the construction of the villa. The table reports the delivered quantities extracted from the schedule, wastage factor extracted from the literature [16], and energy coefficients from the EPiC database [48]. The EPIC database has been used beyond Australia, in the Mediterranean [76], American [77], and Italian research contexts [78]. The database provides robust data on over 250 construction materials, and clarity on the calculation procedure based on detailed top-down macro-economic data combined with bottom-up process data for the assessment protocols [16,48,76,77,78].
A few assumptions for the current assessment in the UAE context were made as stated below. These were made to clarify the parameters for the embodied energy calculations and improve the reliability of the results. These were:
  • The building was constructed with no specific green rating system requirements. This ensures that the EPIC material definitions and data provided are appropriately applicable.
  • Standard dimensions were used for component specifications where the material schedule did not give explicit information. For example, the thickness of doors and glazing. This ensures the universality of the assessment and allows for the verification and reproduction of the results in future studies.

3.2. Initial Embodied Energy

Using the IOBHA approach, the embodied energy of the case study building was calculated by multiplying the delivered quantities of each material by the embodied energy coefficient of the respective material, which was obtained from the EPIC database. The resultant figure gives the process-based hybrid embodied energy of the building. In the next step, the energy embodied in non-material inputs was calculated to complete the system boundary and the value was added to the process-based hybrid embodied energy EE value. This remainder—for non-material inputs, was calculated with the use of a disaggregated energy-based input–output model. A detailed description about the use of the input–output-based hybrid analysis to calculate the initial embodied energy of the case study villa is available in [16].

3.3. Recurrent Embodied Energy

To calculate the recurrent embodied energy, two values are of critical importance; firstly, the material service life (MSL), i.e., the number of years a specific material would be used before it needs to be replaced by a new one. For this, a literature review was conducted on the service life values for different materials and components. Average service life values from the available literature were used for this study. Some of the service life values were adjusted and assumptions were made based on current trends where the service life value of any material or component was not available. Secondly, a period of analysis that approximates the lifespan of the building. Based on the average service life of residential buildings in the available literature, a building service life of 50 years was used for this study. These two values will determine how many times a material or component will be replaced over the lifetime of the building.
The recurrent embodied energy of the case study villa was calculated as per its initial embodied energy. The delivered material quantities associated with each replacement were multiplied by the respective material embodied energy coefficients. These values included the direct and indirect energy associated with the manufacture of materials. To complete the system boundary, the non-material inputs or remainder associated with materials being replaced were then calculated as per the initial embodied energy calculation. The energy embodied in each material was then multiplied by the number of replacements for that material over the life of the building and summed to determine the total recurrent embodied energy associated with the building. A detailed description about the use of the input–output-based hybrid analysis to calculate the recurrent embodied energy of the case study villa is available in [16].

3.4. Operational Energy

To compute the total life cycle energy (LCE), the operational energy (OPE) needed for the heating, cooling, and running of household appliances was approximated. Electricity consumption was determined based on secondary data available in the literature for the UAE [75,79,80,81]. This electricity consumption data from these sources were aggregated, and average gas consumption for cooking for an average family size suitable for this villa was added to calculate the operational energy requirements.

4. Results and Discussion

In this section, results from the different aspects of this study are presented with accompanying discussions. Firstly, the life cycle embodied energy (including initial and recurrent embodied energy) results, the operational energy approximations, and the total life cycle energy of the case study building, reporting the IEE, REE, and OPE values for a 50-year life span. Secondly, the results of a sensitivity analysis, which was conducted to depict three potential alternative scenarios, were reported.

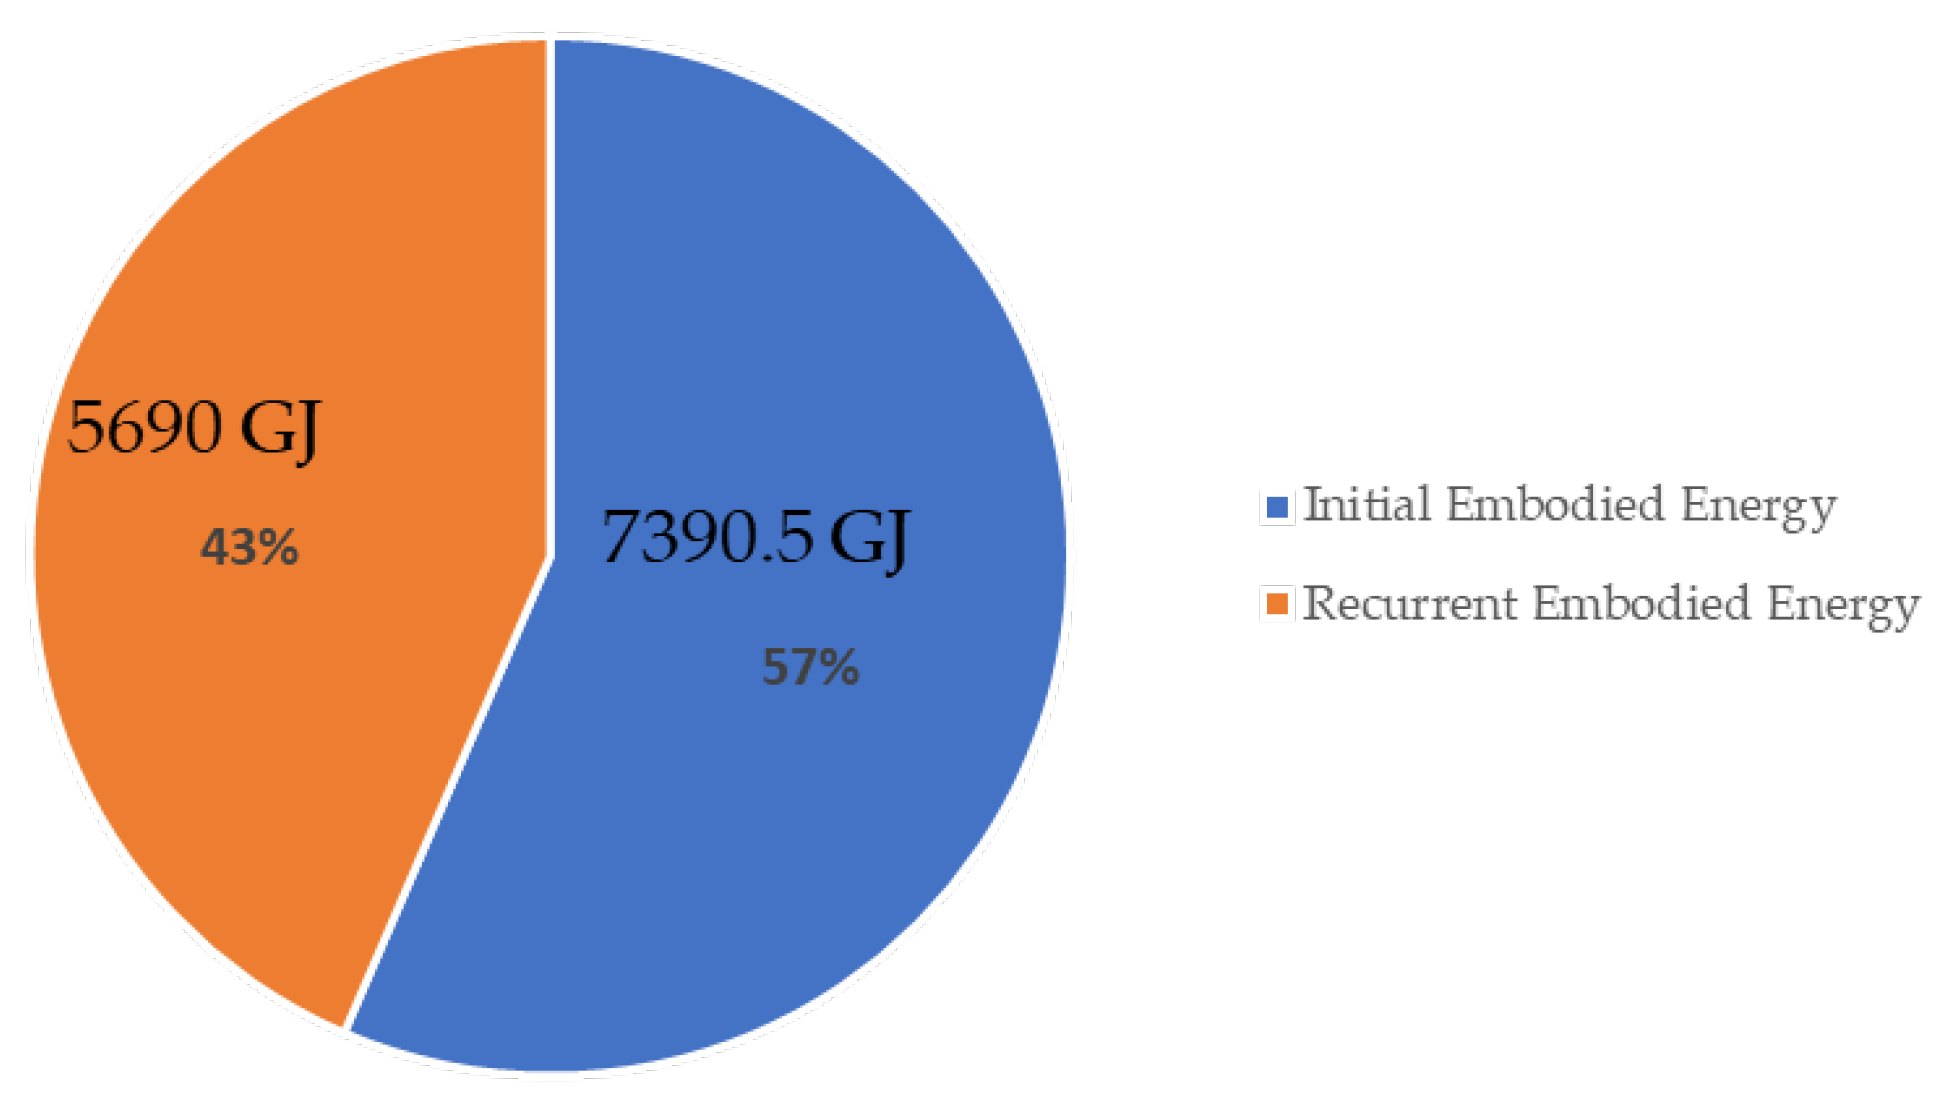
4.1. Life Cycle Embodied Energy

In line with the foregoing, the embodied energy for the selected case study villa was calculated. This section presents the results of this assessment, highlighting the initial and recurrent embodied energy, in relation to the operational energy of the villa. The life cycle energy, as well as the life cycle embodied energy values, are reported along with the results of the sensitivity analysis.
The IOBHA assessment method was used to calculate firstly, the embodied energy associated with the initial construction of the case study villa, and this was found to be 7390.5 GJ (13.9 GJ/m2). Relative to some other studies that also used the IOBHA method, the embodied energy per square meter: 13.9 GJ/m2 is slightly higher (11.7 GJ/m2 [82]; 13 GJ/m2 in a study by [16]). Extensive use of energy-intensive materials such as concrete for the roof, floors, and blockwork resulted in this increase in embodied energy.
Nevertheless, the assessment method is a key factor in understanding these results. Other researchers who used the process analysis, for instance, found the embodied energy to be 2.86 GJ/m2 and 5.09 GJ/m2 in two different case study building assessments [83]. Therefore, we can infer that the more robust system boundary of the IOBHA, explained in Section 2.2, has given a more detailed assessment, and hence a recorded higher associated embodied energy demand.
The recurrent embodied energy associated with the case study villa over an assumed lifespan of 50 years was found to be 5690 GJ (10.7 GJ/m2). Thus, the life cycle embodied energy (LCEE) that sums both the initial and recurrent, was 13,080.51 GJ (24.6 GJ/m2). Figure 3 shows that the LCEE is composed of 52% initial embodied energy and 48% recurrent embodied energy.

4.2. Life Cycle Operational Energy

Using secondary data sourced from multiple UAE studies, the average value of the operational energy for a residential villa was estimated to be 273.36 kWh/m2/y [75,79,80,81]. Based on the floor area of the case study villa (532 m2), the estimated operational energy was 145,432.84 kWh/y. This is equivalent to about 523.56 GJ/y or 0.9841 GJ/m2/y. Since the building’s lifespan is 50 years, the life cycle embodied energy will be 26,177.91 GJ (49.2 GJ/m2). Thus, across the entire lifespan of the building, operational energy will constitute 66% of the life cycle energy of the villa. This result confirms the emphasis on design and policy strategies toward reducing operational energy as a means of decreasing the energy consumed by UAE residential villas.

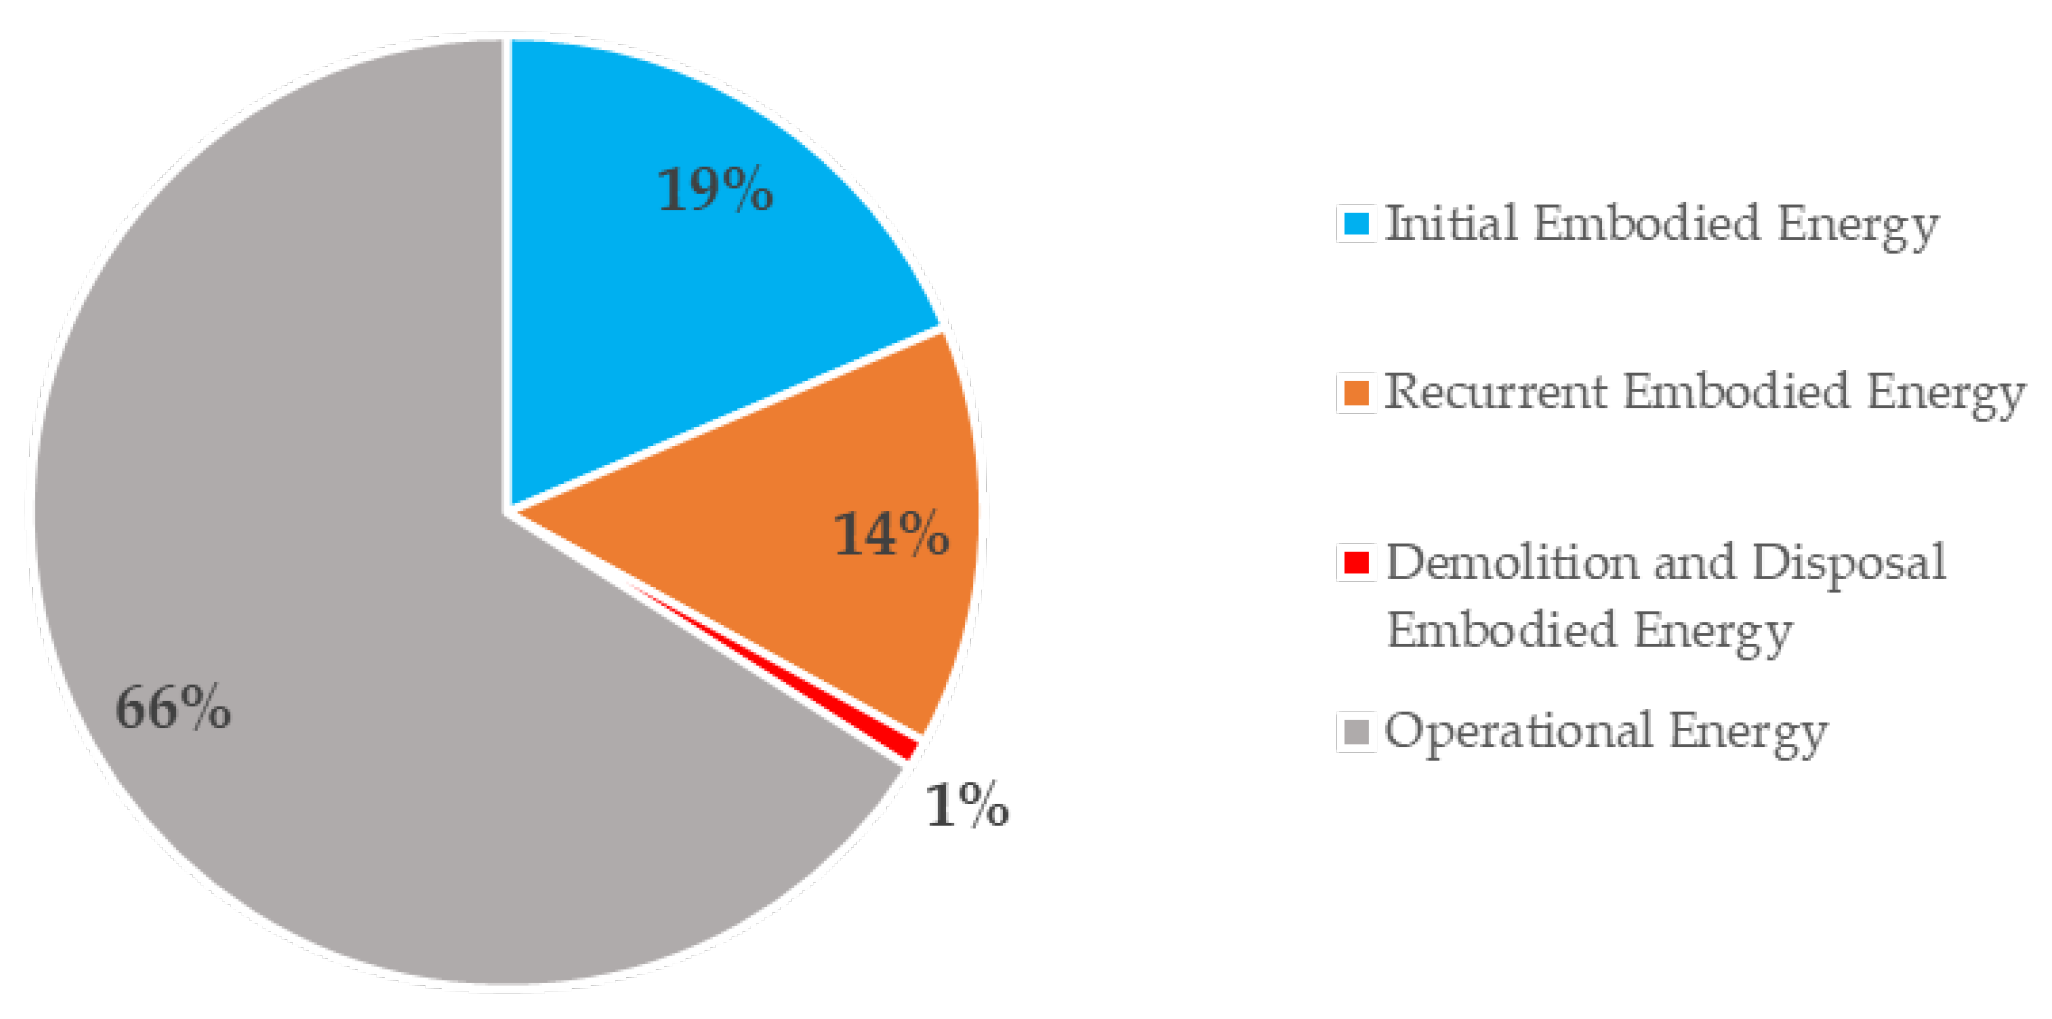
4.3. Life Cycle Energy

The final step in the assessment procedure for this investigation was the summation of the villa’s life cycle energy over the 50-year period. To compute this, initial, recurrent, and operational energies have already been calculated; however, the demolition and disposal energies are assumed to be 1% of the life cycle energy demand [17], or 0.2% [84,85]. Contrariwise, some other studies note that this demolition energy is negligible [26]; however, to complete the boundary and ensure reliability, 1% was used as a safe approximation. Thus, based on the previous values, the LCE as the sum of the IEE, REE, and OPE calculated was 39,258.42 GJ, since the DDE was 1% of this value: 392.58 GJ, the total life cycle energy would be 39,651.01 GJ (77.3 GJ/m2). Figure 4 shows a comparison of the LCEE and LOPE for the case study.
The figure shows that the total embodied energy was 33% of the life cycle energy, of which 19% was initial and 14% was recurrent embodied energy, while operational energy was 64% of the life cycle energy. In general, the results show that the embodied energy, which is often neglected in design and energy research considerations, makes a significant contribution (35%) to the total energy consumed by the building during its lifespan. Results from this study also suggest the importance of including the recurrent embodied energy in building life cycle energy analyses, which various previous studies have ignored in their life cycle analyses [42].
The life cycle embodied energy results present certain other considerations. Firstly, the LCEE is about 57% of the OPE, which is a percentage that is too significant to be ignored in the building design and material specification. Operational energy requirements for a building, on the other hand, are expected to be reduced with the installation of more energy-efficient energy systems and appliances in the future. It is also important to note that efforts to reduce the operational energy demand of buildings tend to focus on using more materials to improve the thermal performance of the building envelope. Since a considerable amount of energy can be used in the manufacture of these building materials, this can result in an increase in embodied energy. This shows the importance of monitoring, to ensure that energy demands are not inadvertently shifted from one area (i.e., operational) to another (i.e., embodied). The UAE also aims to increase the contribution of clean energy sources in the total capacity mix to 50% by 2050, as compared to 98% of its electricity in 2018 using natural gas-fired generation [86]. This shift towards clean energy will help further reduce the GHG emissions associated with the operational energy consumption by a building. As a result, the importance of embodied energy will increase further, as mining and manufacturing processes for material production are expected to rely mainly on fossil fuels for a much longer time.

4.4. Sensitivity Analysis

The results of this study give a clear picture to aid understanding of the various defining components of a building’s life cycle energy. The current study shows that while the initial embodied energy is constant over the lifespan of a building, the recurrent embodied energy changes based on the material service life. This is the result of decisions made during the design process that may have long-term, unintended consequences on the associated or consumed energy over the building life span.
Some studies have put forward hybrid methods to facilitate decision making based on uncertainty estimates [87] and are particularly applicable in life cycle assessments [87,88], similar to the objective of the present study. This section presents the results of a multi-focused sensitivity analysis conducted under three possible scenarios. Scenario 1 focuses on the impact of introducing solar PV panels as an alternative energy source. The introduction of renewables provides an opportunity to highlight the potential simultaneous impact of its integration on the LOPE as well as the LCEE of the villa. In line with the foregoing, scenarios 2 and 3, respectively, also broadly depict the impact that other factors may have on both the operational and the embodied energy associated with the villa.

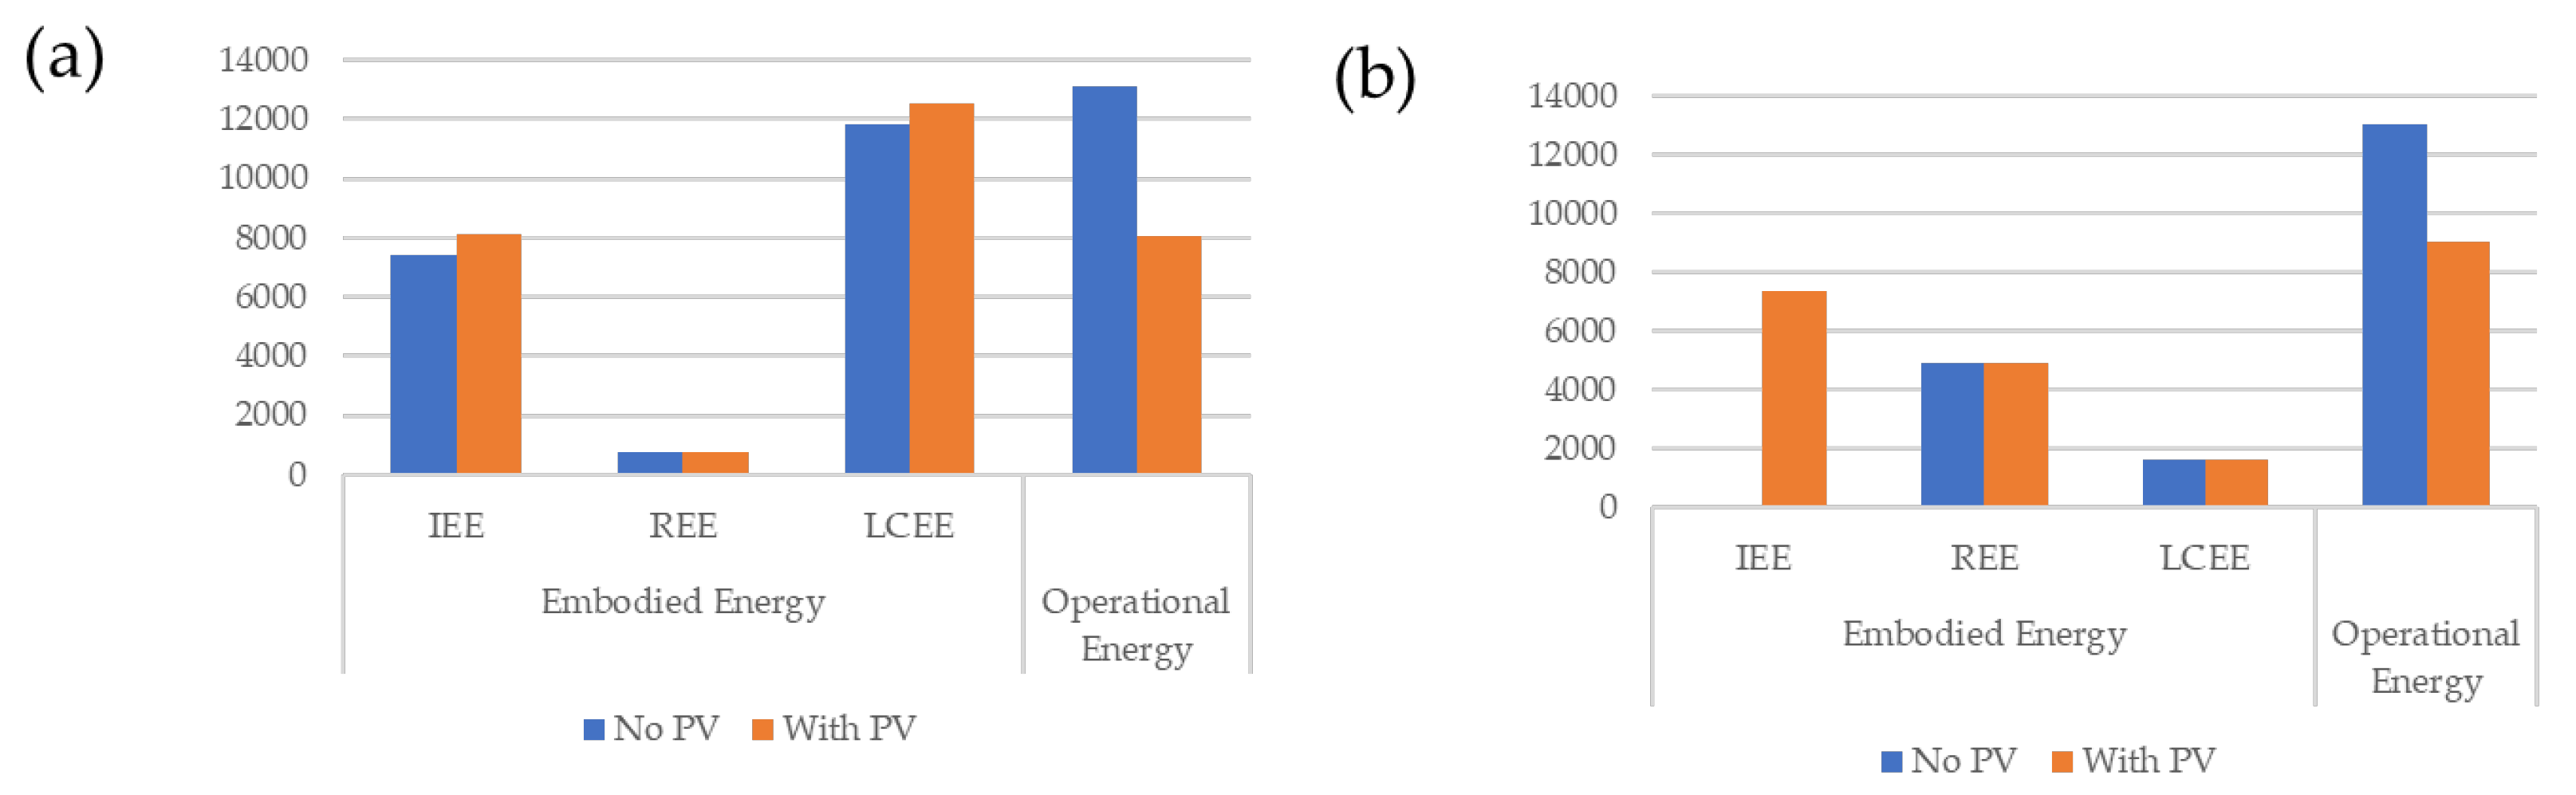
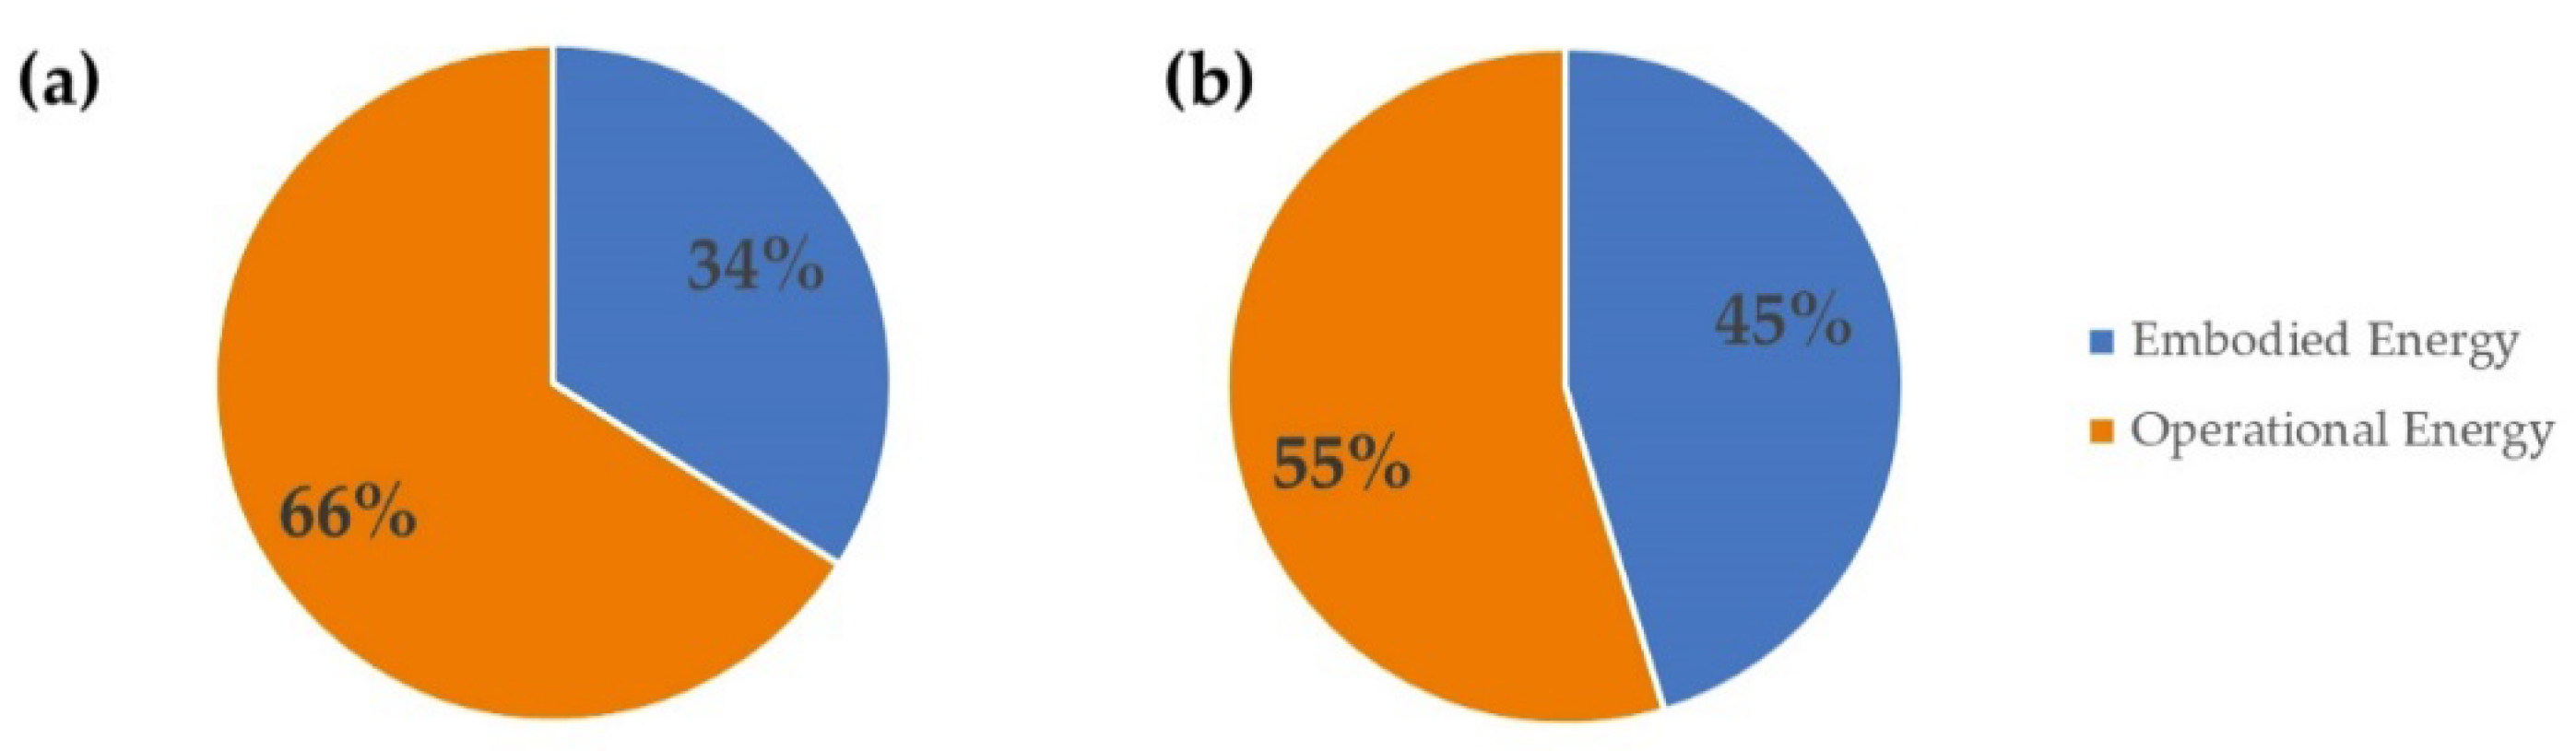
4.4.1. Scenario 1: Adoption of Renewable Energy Using a Rooftop Solar PV System

In this first scenario, the adoption of solar rooftop PV panels as an alternative energy source was considered. The simultaneous impact of PV panels on both the life cycle operational energy and life cycle embodied energy were analyzed and compared with the base case. To assess this, the PV system was sized, annual output calculated, degradation rate approximated, and life cycle output computed using both basic PV output formula and the PVWatts online tool by the US National Renewable Energy Laboratory (NREL).
To calculate the PV system size, the following formula was used:
PV system size (SIZE) = Array Area (m2) × 1 kW/m2 × Module Efficiency (%)
Size = 133 × 1 × 0.18 = 23.94 kW
For the calculation, we assumed that the rooftop PV system covers 50% of the total roof area as per the architectural design drawings to allow for natural ventilation and temperature control, as well as to avoid shadows from parapet walls. The selected PV modules were 350 W Solar PV panels with an efficiency of 18%, and physical dimensions of 1956 mm × 992 mm × 40 mm manufactured by Maysun Solar located in Dubai, UAE.
Annual Energy Output (Q) = PV Capacity × peak hours × 365
Q = 24.2 × 6.37 × 365 = 55,661.7 kWh
In the above, peak solar hours for the UAE are taken as 6.37 h [89], and the calculated annual energy output of the system was 55,661.7 kWh or 200.4 GJ. Subtracting this from the building’s annual operating energy, which was 523.5 GJ, gives a new OPE of 323.1 GJ. However, Jordan and Kurtz (2013) reviewed about 2000 simulations in different studies to approximate the degradation rate of the solar PV panels. The study shows that the PV modules have a mean annual degradation rate of 0.8% [90]. Consequently, the PV output for year 0 to 25 (200.4 GJ/y) leads to a 38.7% drop in the building’s OPE. However, the PV output for year 26 to 50 was assumed to have dropped by 20% based on the referenced literature above. Although the efficiency drop is yearly, the cumulative approximation provides a simple preliminary explanation for the current analysis.
Thus, annual PV output for year 26 to 50 was found to be 160.3 GJ, which will lead to a 30.6% drop in the building’s OPE during this period. Table 3 below summarizes the impact of the rooftop PV system on the life cycle embodied energy of the villa.
Similarly, we investigated the impact of the rooftop solar system on the life cycle embodied energy of the villa. To approximate the embodied energy of the rooftop solar PV system, secondary data from multiple studies report an average of 1500 kWh/m2 [91,92,93,94,95]. This includes associated energy from the manufacture of the solar panels, inverters, and other components of the balance of system (BOS), as well as the maintenance equipment. Next, we assumed that although the PV system generally degrades annually by 0.8%, the system will remain functional for the 50-year lifecycle of the building and will, thus, need no replacement. Based on the foregoing, the life cycle embodied energy of the PV system LCEE is 199,500 kWh or 718.2 GJ. When added to the villa’s embodied energy, this leads to the following: IEE increases by 9.7%, REE increases by 0%, and LCEE increases by 11.5%. Figure 5 and Figure 6 reflect the impact of the adoption of a PV system on both the LOPE, LCEE, and proportions of the LCE, with further discussions below.

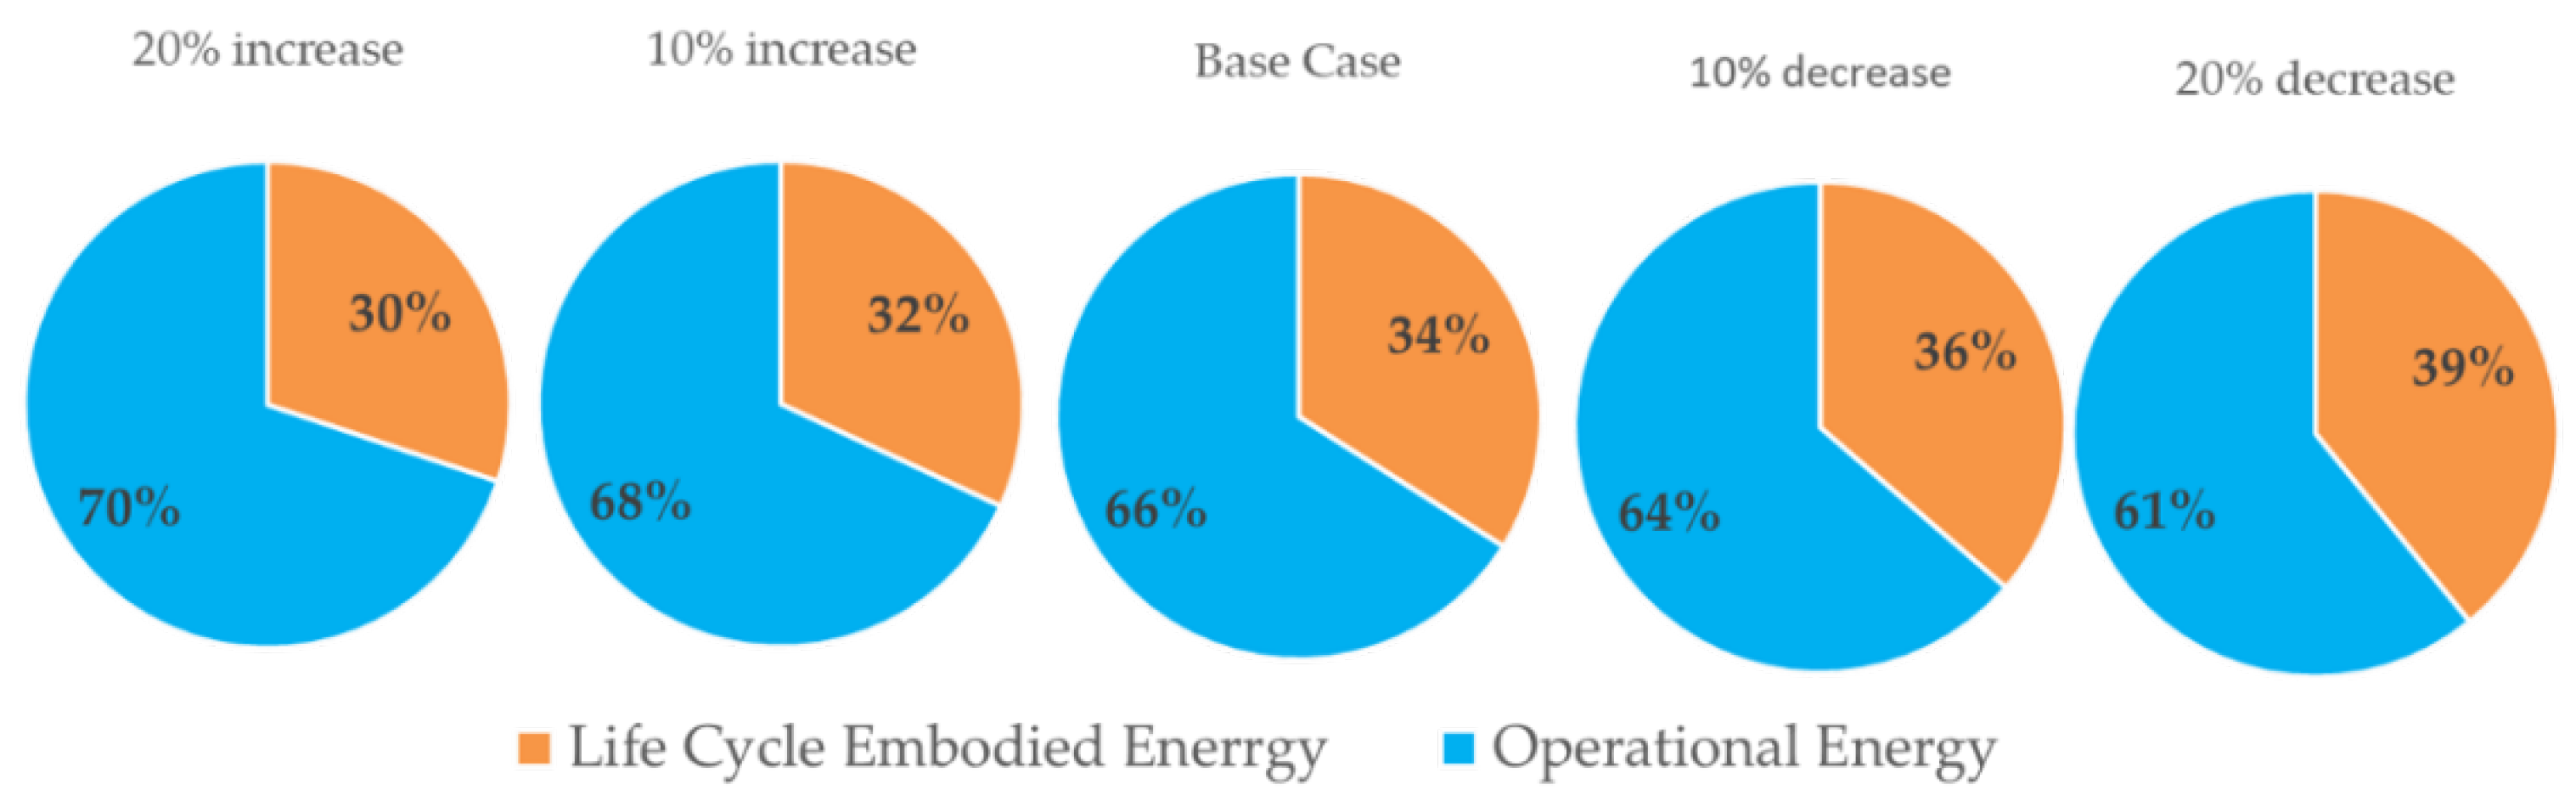
4.4.2. Scenario 2: Varying the Operational Energy Due to Other Subjective/Unplanned Factors

A few studies have also shown the impact of varying operational energy with similar intent expressed in this section [51,96,97]. However, the increase or decrease in a building’s operational energy is dependent on several factors. User behavior has been reported as a determining factor that may lead to increased or decreased operational energy consumption [26,98,99] while other studies have explored renewable energy potentials [100,101] to reduce fossil fuel-based operational energy consumption [102,103]. Other factors such as policy, technological innovation, and awareness about the potential impacts of climate change, may also lead to a change in the operational energy consumption pattern [104,105].
Figure 7 below shows how varying the operational energy impacts the proportion of components that sum up the life cycle energy. The figure shows that for every 10% variation in operational energy, the LCE proportion for both operational and embodied energy changes by about 2% to 3%. The OPE will range from 61% to 70% while the LCEE will range from 30% to 39%. As a result of technological innovation, and changes in user behavior due to the awareness about the potential impacts of climate change and other factors discussed earlier, there is a likelihood of a reduction in operational energy demand per dwelling. In this context, an increase in the life cycle embodied energy proportion due to the decrease in operational energy demand will further increase the importance of considering embodied energy in efforts to reduce the energy consumption associated with the building sector.

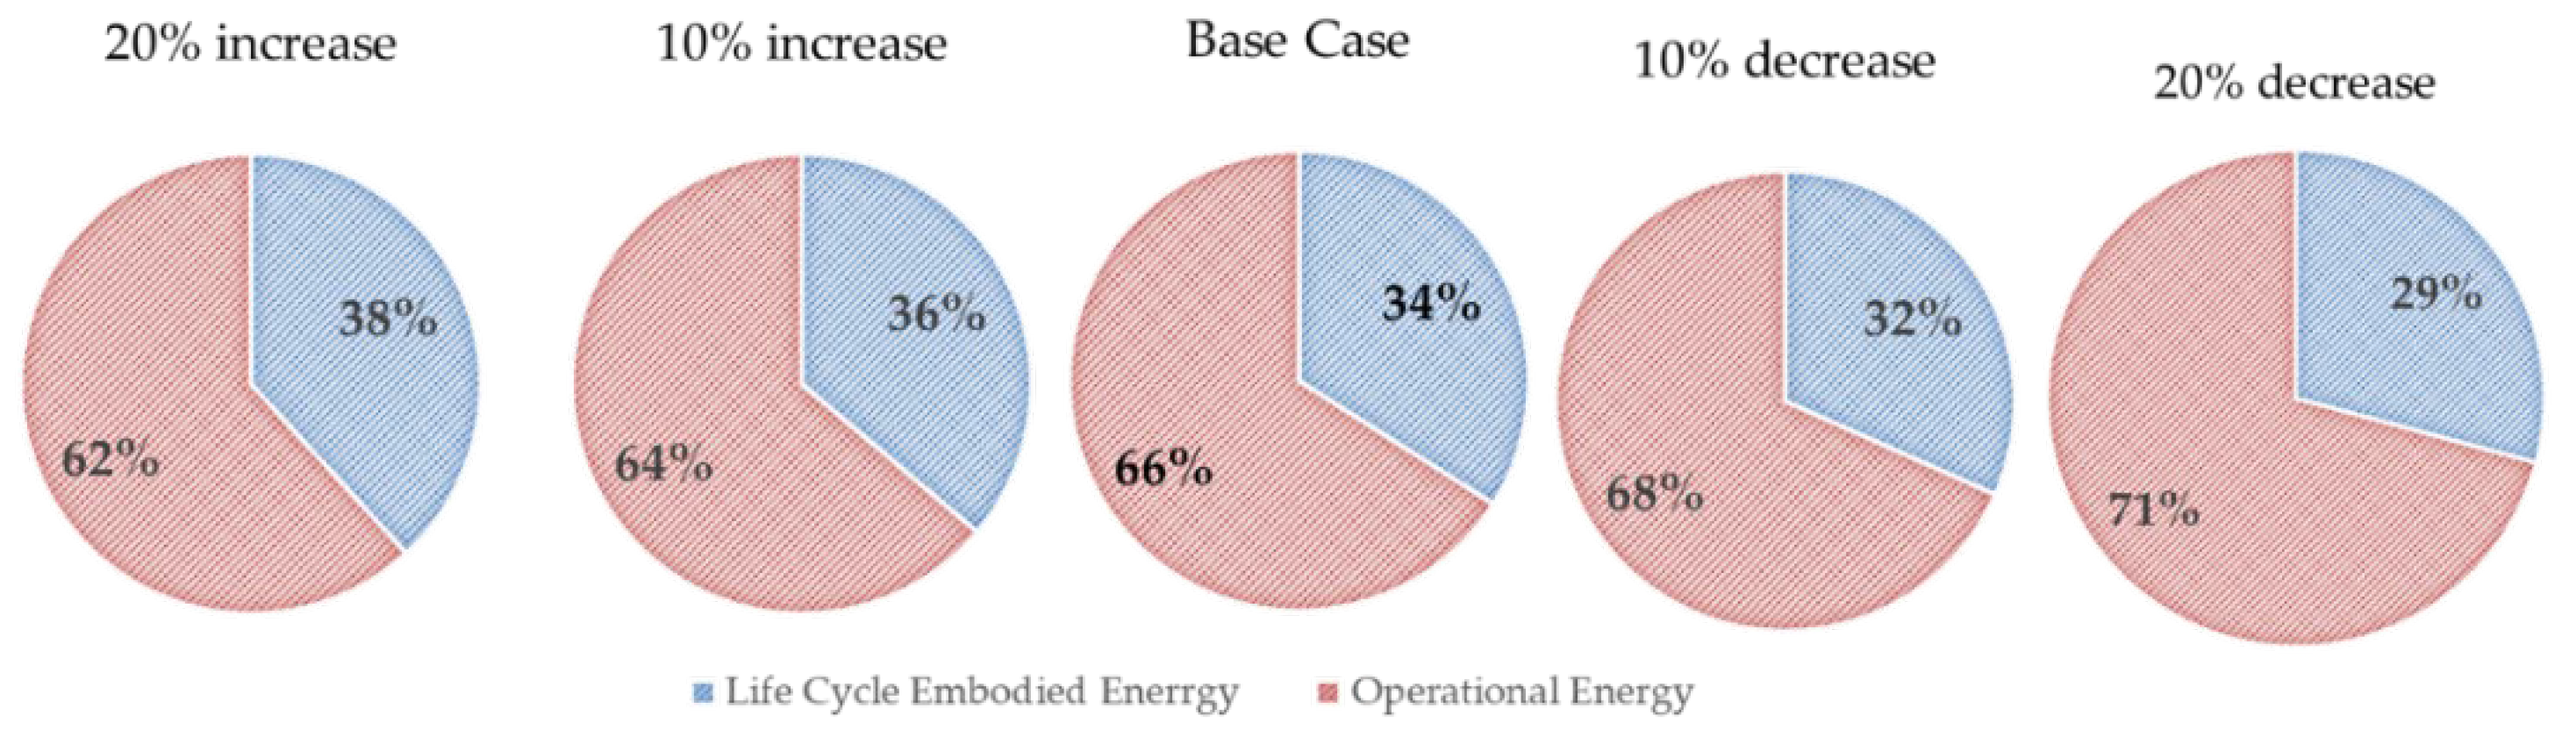
4.4.3. Scenario 3: Varying the Life Cycle Embodied Energy Due to Other Subjective/Unplanned Factors

Another hypothetical situation was created to explore a scenario where the life cycle embodied energy was varied, but the operational energy was kept constant. The reasoning behind the embodied energy variations is based on certain considerations. Firstly, we have previously stated that the assessment method used in embodied energy calculations plays a significant role in determining the results of the analysis. Due to the incomplete or overestimation of data, it is possible that there could be some errors in the final results of embodied energy calculations. Secondly, it is possible that over time the manufacturing process for individual materials or components may change, such as the type of raw materials, extraction, sterilization, or manufacturing process, or sub-component assembly methods used in production. Consequently, less or more embodied energy may be associated with material production. Thirdly, the embodied energy of materials and components is inherently based on the mix of fuels using the manufacturing process, as well as transportation to the site. This mix of fuels implies that over time, a company may switch to renewable-based energy from fossil fuels. Alternatively, the materials and components may be manufactured using renewable energy but may be transported either by fossil fuel-driven trucks or by sea. Each scenario presented may impact the embodied energy; thus, the variation in this sensitivity analysis is intended to cover such possibilities.
Figure 8 below shows how varying the life cycle embodied energy impacts the proportion of life cycle energy. Similar to Section 4.4.2, this figure shows that for every 10% variation in embodied energy, the LCE proportion for both operational and embodied energy changes by about 2% to 3%. Moreover, while the LCEE ranges from 29% to 38%, the OPE ranges from 62% to 71%. As discussed earlier, most efforts to reduce the energy consumption of buildings are focused on reducing operational energy. Most of the time, this is achieved at the expense of embodied energy (for example, by adding more insulation materials in the building envelope or by increasing the number of glass layers in external windows). This suggests that the chances of increasing the proportion of embodied energy in life cycle energy requirements are much higher. This increase in the significance of life cycle embodied energy also implies that efforts should be made to reduce the life cycle embodied energy.
Comparing Figure 7 and Figure 8, we can thus infer that in this case study, variations in embodied energy have a relatively similar significant impact on the life cycle energy of the case study villa under consideration when compared with variations in operational energy. In general, the assertion of the sensitivity analysis, and of this study, is that life cycle energy represents a quantitative construct of multiple components: operational energy, as well as initial, recurrent, and demolition embodied energy. Each component plays an important role in defining the building’s impact on the environment. Thus, it is critical to ensure that embodied energy is given sufficient consideration along with operational energy across the life cycle of buildings.

5. Conclusions

This study has focused on the calculation of the life cycle energy for a case study villa in the UAE. The analysis shows that the embodied energy and operational energy of the villa, over a 50-year life span, were found to be 34% and 66% of the life cycle energy, respectively. The initial embodied energy was about 57% of the life cycle embodied energy and 19% of the life cycle energy of the building. The recurrent embodied energy was about 43% of the life cycle embodied energy and 14% of the life cycle energy of the building. These results suggest that embodied energy is critical in life cycle energy assessments and represents a significant percentage of the life cycle energy consumption of residential buildings. In addition, considering that the type of materials selected impacts the overall embodied energy, it is necessary for both designers and clients to be made aware of the life cycle consequences of their design decisions.
A sensitivity analysis was carried out to review the potential changes in life cycle energy proportions due to the adoption of renewable energy using a rooftop solar PV system. The analysis showed that the adoption of a solar PV system resulted in a significant increase (from 34% to 45%) in the proportion of embodied energy. This shows that an increase in the use of more renewable sources of energy in future building sectors will necessitate a focus on efforts to reduce the embodied energy consumption of buildings. A sensitivity analysis was also carried out to review the potential changes in life cycle energy proportions due to +20% or −20% variation in the life cycle embodied energy (LCEE), as well as operational energy (OPE). The analysis showed that in a scenario where the LCEE is varied, its proportion could range from 29% to 38% of the life cycle energy, while the OPE share could range from 62% to 71% of the life cycle energy. If, however, the OPE was varied, its share in life cycle energy could range from 61% to 70% while the share of LCEE would range from 30% to 39% of the life cycle energy. This confirms that the impact of embodied energy is irrefutable and will become a bigger challenge if efforts are made to only reduce the operational energy.
On the basis of the significance of operational and embodied energy shown in this study, these results may be applicable in other countries where climatic conditions and construction methods are similar. As opposed to the operational energy requirements to cool the buildings in the harsh climate of the UAE, regions with less harsh climates may result in further increases in the significance of life cycle embodied energy. This confirms that in order to reduce the environmental impacts associated with the building sector, every possible effort should be made to reduce the embodied energy consumption of buildings along with the operational energy.

Future Research

This research has shown the significance of embodied and operational energy of a residential villa in the UAE. There is a need to expand the body of knowledge to the other building types in this area. Furthermore, in order to reduce the environmental impacts associated with energy use, similar to operational energy, further research is required to propose and implement different strategies to reduce the initial and recurrent embodied energy in buildings. To achieve this aim, the effect of the service life of the buildings and their materials on life cycle embodied energy should be investigated in different scenarios. Similarly, the recycling potential of different building materials can influence the embodied energy requirements of buildings and needs to be investigated.

Author Contributions

Conceptualization, A.R., D.E.A. and R.C.; methodology, A.R. and D.E.A.; software, A.R. and D.E.A.; formal analysis, A.R. and D.E.A.; investigation, A.R. and D.E.A.; resources, A.R.; data curation, D.E.A.; writing—original draft preparation, D.E.A.; project results writing—review and editing, A.R., D.E.A. and R.C.; visualization, D.E.A.; supervision, A.R.; funding acquisition, A.R. All authors have read and agreed to the published version of the manuscript.

Funding

The authors wish to appreciate and acknowledge that this work was supported by the United Arab Emirates University Start-Up Grant (G00003524).

Conflicts of Interest

The authors declare no conflict of interest.

References

  1. World Energy Council. World Energy Issues Monitor 2020: Decoding New Signals of Change. 2020. Available online: https://www.worldenergy.org/assets/downloads/World_Energy_Issues_Monitor_2020_-_Full_Report.pdf (accessed on 1 July 2022).
  2. William, M.A.; Suárez-López, M.J.; Soutullo, S.; Fouad, M.M.; Hanafy, A.A. Enviro-Economic Assessment of Buildings De-carbonization Scenarios in Hot Climates: Mindset toward Energy-Efficiency. Energy Rep. 2022, 8, 172–181. [Google Scholar] [CrossRef]
  3. International Energy Agency; United Nations Environment Programme. 2018 Global Status Report: Towards a Zero-Emission, Efficient, and Resilient Buildings and Construction Sector. Global Alliance for Buildings and Construction. 2018. Available online: https://www.worldgbc.org/sites/default/files/2018%20globalabc%20global%20status%20report.pdf (accessed on 1 July 2022).
  4. U.S. Energy Information Administration. EIA Projects Nearly 50% Increase in World Energy Usage by 2050, Led by Growth in Asia—Today in Energy—U.S. Energy Information Administration (EIA). 2019. Available online: https://www.eia.gov/todayinenergy/detail.php?id=41433 (accessed on 11 October 2020).
  5. Dones, R.; Heck, T.; Hirschberg, S. Greenhouse Gas Emissions from Energy Systems, Comparison and Overview. In Encyclopedia of Energy; Cleveland, C.J., Ed.; Elsevier: Amsterdam, The Netherlands, 2004; pp. 77–95. [Google Scholar] [CrossRef]
  6. Hoang, A.T.; Foley, A.M.; Nižetić, S.; Huang, Z.; Ong, H.C.; Ölçer, A.I.; Pham, V.V.; Nguyen, X.P. Energy-related approach for reduction of CO2 emissions: A critical strategy on the port-to-ship pathway. J. Clean. Prod. 2022, 355, 131772. [Google Scholar] [CrossRef]
  7. Coolen, J.W.P.; Vanaverbeke, J.; Dannheim, J.; Garcia, C.; Birchenough, S.N.R.; Krone, R.; Beermann, J. Generalized changes of benthic communities after construction of wind farms in the southern North Sea. J. Environ. Manag. 2022, 315, 115173. [Google Scholar] [CrossRef] [PubMed]
  8. Jin, T.; Kim, J. What is better for mitigating carbon emissions—Renewable energy or nuclear energy? A panel data analysis. Renew. Sustain. Energy Rev. 2018, 91, 464–471. [Google Scholar] [CrossRef]
  9. Lin, M.; Afshari, A.; Azar, E. A data-driven analysis of building energy use with emphasis on operation and maintenance: A case study from the UAE. J. Clean. Prod. 2018, 192, 169–178. [Google Scholar] [CrossRef]
  10. UAE Government. The UAE State of Energy Report 2019. 2019. Available online: https://www.moei.gov.ae/assets/download/a70db115/Energy%20Report-2019-Final-Preview-1%20(1).pdf.aspx (accessed on 1 July 2022).
  11. Ding, G.K.C. The Development of a Multi-Criteria Approach for the Measurement of Sustainable Performance for Built Projects and Facilities. Ph.D. Thesis, University of Technology Sydney, Sydney, NSW, Australia, 2004. [Google Scholar]
  12. Fay, R.; Treloar, G.; Iyer-Raniga, U. Life-cycle energy analysis of buildings: A case study. Build. Res. Inf. 2000, 28, 31–41. [Google Scholar] [CrossRef]
  13. Dixit, M.K.; Fernández-Solís, J.L.; Lavy, S.; Culp, C.H. Need for an embodied energy measurement protocol for buildings: A review paper. Renew. Sustain. Energy Rev. 2012, 16, 3730–3743. [Google Scholar] [CrossRef]
  14. Dixit, M.K. Life cycle embodied energy analysis of residential buildings: A review of literature to investigate embodied energy parameters. Renew. Sustain. Energy Rev. 2017, 79, 390–413. [Google Scholar] [CrossRef]
  15. Crawford, R.H.; Stephan, A.; Prideaux, F. The EPiC database: Hybrid embodied environmental flow coefficients for construction materials. Resour. Conserv. Recycl. 2022, 180, 106058. [Google Scholar] [CrossRef]
  16. Rauf, A. The Effect of Building and Material Service Life on Building Life Cycle Embodied Energy. Ph.D. Thesis, University of Melbourne, Melbourne, VIC, Australia, 2016. [Google Scholar]
  17. Crowther, P. Design for disassembly to recover embodied energy. In Proceedings of the 16th International Conference on Passive and Low Energy Architecture, Melbourne, VIC, Australia, September 1999; pp. 95–100. [Google Scholar]
  18. Crawford, R.H. Life Cycle Assessment in the Built Environment; Routledge: Abingdon, UK, 2011. [Google Scholar]
  19. Karimpour, M.; Belusko, M.; Xing, K.; Bruno, F. Minimising the life cycle energy of buildings: Review and analysis. Build. Environ 2014, 73, 106–114. [Google Scholar] [CrossRef]
  20. Cottafava, D.; Ritzen, M. Circularity indicator for residentials buildings: Addressing the gap between embodied impacts and design aspects. Resour. Conserv. Recycl. 2021, 164, 105120. [Google Scholar] [CrossRef]
  21. Sartori, I.; Hestnes, A.G. Energy use in the life cycle of conventional and low-energy buildings: A review article. Energy Build. 2007, 39, 249–257. [Google Scholar] [CrossRef]
  22. Thormark, C. Energy and resources, material choice and recycling potential in low energy buildings. In Proceedings of the International CIB Conference SB07 Sustainable Construction, Materials and Practices, Lisbon, Portugal, 12–14 September 2007; p. 7. Available online: http://www.buildingreen.net/assets/cms/File/070530_SB2007_Thormark.pdf (accessed on 1 July 2022).
  23. Shadram, F.; Johansson, T.D.; Lu, W.; Schade, J.; Olofsson, T. An integrated BIM-based framework for minimizing embodied energy during building design. Energy Build. 2016, 128, 592–604. [Google Scholar] [CrossRef]
  24. Rauf, A.; Crawford, R.H. The relationship between material service life and the life cycle energy of contemporary residential buildings in Australia. Archit. Sci. Rev. 2013, 56, 252–261. [Google Scholar] [CrossRef]
  25. Su, X.; Tian, S.; Shao, X.; Zhao, X. Embodied and operational energy and carbon emissions of passive building in HSCW zone in China: A case study. Energy Build. 2020, 222, 110090. [Google Scholar] [CrossRef]
  26. Azari, R.; Abbasabadi, N. Embodied energy of buildings: A review of data, methods, challenges, and research trends. Energy Build. 2018, 168, 225–235. [Google Scholar] [CrossRef]
  27. Tabet Aoul, K.A.; Hagi, R.; Abdelghani, R.; Akhozheya, B.; Karaouzene, R.; Syam, M. The existing residential building stock in UAE: Energy efficiency and retrofitting opportunities. In Proceedings of the 6th Annual International Conference on Architecture and Civil Engineering, ACE, Singapore, 14–15 May 2018; p. 216379. [Google Scholar]
  28. Mawed, M.; Al Bairam, I.; Al-Hajj, A. Linking Between Sustainable Development and Facilities Management Strategies: An Integrated Approach for Evaluating the Sustainability of Existing Building in the UAE. In Proceedings of the International Conference on Sustainable Futures 2017, Manama, Bahrain, 26 November 2017; p. 33. [Google Scholar]
  29. Azzouz, A.; Borchers, M.; Moreira, J.; Mavrogianni, A. Life cycle assessment of energy conservation measures during early stage office building design: A case study in London, UK. Energy Build. 2017, 139, 547–568. [Google Scholar] [CrossRef]
  30. Giordano, R.; Serra, V.; Demaria, E.; Duzel, A. Embodied energy versus operational energy in a nearly zero energy building case study. Energy Proced. 2017, 111, 367–376. [Google Scholar] [CrossRef]
  31. Almeida, M.; Ferreira, M.; Barbosa, R. Relevance of embodied energy and carbon emissions on assessing cost effectiveness in building renovation—Contribution from the analysis of case studies in six European countries. Buildings 2018, 8, 103. [Google Scholar] [CrossRef] [Green Version]
  32. Dixit, M.K.; Singh, S. Embodied energy analysis of higher education buildings using an input-output-based hybrid method. Energy Build. 2018, 161, 41–54. [Google Scholar] [CrossRef]
  33. Dascalaki, E.G.; Argiropoulou, P.; Balaras, C.A.; Droutsa, K.G.; Kontoyiannidis, S. Analysis of the embodied energy of construction materials in the life cycle assessment of Hellenic residential buildings. Energy Build. 2021, 232, 110651. [Google Scholar] [CrossRef]
  34. Rauf, A.; Crawford, R.H. Building service life and its effect on the life cycle embodied energy of buildings. Energy 2015, 79, 140–148. [Google Scholar] [CrossRef]
  35. Tavares, V.; Lacerda, N.; Freire, F. Embodied energy and greenhouse gas emissions analysis of a prefabricated modular house: The “Moby” case study. J. Clean. Prod. 2019, 212, 1044–1053. [Google Scholar] [CrossRef]
  36. Omrany, H.; Soebarto, V.; Sharifi, E.; Soltani, A. Application of life cycle energy assessment in residential buildings: A critical review of recent trends. Sustainability 2020, 12, 351. [Google Scholar] [CrossRef]
  37. Allacker, K. Sustainable Building: The Development of an Evaluation Method. Ph.D. Thesis, KU Leuven, Leuven, Belgium, 2010. [Google Scholar]
  38. Muazu, R.I.; Rothman, R.; Maltby, L. Integrating life cycle assessment and environmental risk assessment: A critical review. J. Clean. Prod. 2021, 293, 126120. [Google Scholar] [CrossRef]
  39. Geng, Y.; Ji, W.; Wang, Z.; Lin, B.; Zhu, Y. A review of operating performance in green buildings: Energy use, indoor environmental quality and occupant satisfaction. Energy Build. 2019, 183, 500–514. [Google Scholar] [CrossRef]
  40. Mantesi, E.; Chmutina, K.; Goodier, C. The office of the future: Operational energy consumption in the post-pandemic era. Energy Res. Soc. Sci. 2022, 87, 102472. [Google Scholar] [CrossRef]
  41. Zhao, H.; Magoulès, F. A review on the prediction of building energy consumption. Renew. Sustain. Energy Rev. 2012, 16, 3586–3592. [Google Scholar] [CrossRef]
  42. Rauf, A.; Crawford, R.H. The effect of material service life on the life cycle energy of residential buildings. In Proceedings of the ASA2012: The 46th Annual Conference of the Architectural Science Association (Formerly ANZAScA)–Building on Knowledge: Theory and Practice, Gold Coast, QLD, Australia, 14–16 November 2012. [Google Scholar]
  43. Luthra, S.; Kumar, A.; Sharma, M.; Garza-Reyes, J.A.; Kumar, V. An analysis of operational behavioural factors and circular economy practices in SMEs: An emerging economy perspective. J. Bus. Res. 2022, 141, 321–336. [Google Scholar] [CrossRef]
  44. CEN-EN 15978; Sustainability of Construction Works—Assessment of Environmental Performance of Buildings—Calculation Method. European Committee for Standardization: Brussels, Belgium, 2011. Available online: https://standards.globalspec.com/std/1406797/EN%2015978 (accessed on 1 July 2022).
  45. Cole, R.J. Energy and greenhouse gas emissions associated with the construction of alternative structural systems. Build. Environ. 1998, 34, 335–348. [Google Scholar] [CrossRef]
  46. Dixit, M.K. Life cycle recurrent embodied energy calculation of buildings: A review. J. Clean. Prod. 2019, 209, 731–754. [Google Scholar] [CrossRef]
  47. Cole, R.J.; Kernan, P.C. Life-cycle energy use in office buildings. Build. Environ. 1996, 31, 307–317. [Google Scholar] [CrossRef]
  48. Crawford, R.H.; Stephan, A.; Prideaux, F. Environmental Performance in Construction (EPiC) Database; The University of Melbourne: Melbourne, VIC, Australia, 2019. [Google Scholar]
  49. Feng, K.; Wang, Y.; Lu, W.; Li, X. Weakness of the Embodied Energy Assessment on Construction: A Literature Review. In Proceedings of the ICCREM 2016: BIM Application and Off-Site Construction, Edmonton, AB, Canada, 29 September–1 October 2016; pp. 547–559. [Google Scholar]
  50. Rauf, A.; Attoye, D.E.; Crawford, R.H. Life Cycle Energy Analysis of a House in UAE. In Proceedings of the ZEMCH 2021 International Conference, Dubai, United Arab Emirates, 26–28 October 2021; pp. 13–23. Available online: http://zemch.org/proceedings/2021/ZEMCH2021.pdf (accessed on 1 July 2022).
  51. Ajayi, S.O.; Oyedele, L.O.; Ilori, O.M. Changing significance of embodied energy: A comparative study of material specifications and building energy sources. J. Build. Eng. 2019, 23, 324–333. [Google Scholar] [CrossRef]
  52. Wen, T.J.; Siong, H.C.; Noor, Z.Z. Assessment of Embodied Energy and Global Warming Potential of Building Construction Using Life Cycle Analysis Approach: Case Studies of Residential Buildings in Iskandar Malaysia. Energy Build. 2015, 93, 295–302. [Google Scholar] [CrossRef]
  53. Monahan, J.; Powell, J.C. An Embodied Carbon and Energy Analysis of Modern Methods of Construction in Housing: A Case Study Using a Lifecycle Assessment Framework. Energy Build. 2011, 43, 179–188. [Google Scholar] [CrossRef]
  54. Wang, J.; Yu, C.; Pan, W. Life cycle energy of high-rise office buildings in Hong Kong. Energy Build. 2018, 167, 152–164. [Google Scholar] [CrossRef]
  55. Omar, W.M.S.W. A hybrid life cycle assessment of embodied energy and carbon emissions from conventional and industrialised building systems in Malaysia. Energy Build. 2018, 167, 253–268. [Google Scholar] [CrossRef]
  56. García-Sanz-Calcedo, J.; de Sousa Neves, N.; Fernandes, J.P.A. Measurement of Embodied Carbon and Energy of HVAC Facilities in Healthcare Centers. J. Clean. Prod. 2021, 289, 125151. [Google Scholar] [CrossRef]
  57. Koezjakov, A.; Urge-Vorsatz, D.; Crijns-Graus, W.; Van den Broek, M. The relationship between operational energy demand and embodied energy in Dutch residential buildings. Energy Build. 2018, 165, 233–245. [Google Scholar] [CrossRef]
  58. Lolli, N.; Fufa, S.M.; Inman, M. A parametric tool for the assessment of operational energy use, embodied energy and embodied material emissions in building. Energy Proced. 2017, 111, 21–30. [Google Scholar] [CrossRef]
  59. Escobar, N.; Laibach, N. Sustainability check for bio-based technologies: A review of process-based and life cycle approaches. Renew. Sustain. Energy Rev. 2021, 135, 110213. [Google Scholar] [CrossRef]
  60. Baird, G.; Alcorn, A.; Haslam, P. The energy embodied in building materials-updated New Zealand coefficients and their significance. Trans. Instit. Prof. Eng. N. Z. Civil Eng. Sect. 1997, 24, 46–54. [Google Scholar]
  61. Treloar, G.J. Extracting embodied energy paths from input–output tables: Towards an input–output-based hybrid energy analysis method. Econ. Syst. Res. 1997, 9, 375–391. [Google Scholar] [CrossRef]
  62. Fan, Y.; Wu, X.; Shao, L.; Han, M.; Chen, B.; Meng, J.; Wang, P.; Chen, G. Can constructed wetlands be more land efficient than centralized wastewater treatment systems? A case study based on direct and indirect land use. Sci. Total Environ. 2021, 770, 144841. [Google Scholar] [CrossRef] [PubMed]
  63. Suh, S.; Lenzen, M.; Treloar, G.J.; Hondo, H.; Horvath, A.; Huppes, G.; Jolliet, O.; Klann, U.; Krewitt, W.; Moriguchi, Y.; et al. System boundary selection in life-cycle inventories using hybrid approaches. Environ. Sci. Technol. 2004, 38, 657–664. [Google Scholar] [CrossRef]
  64. Malik, A.; Egan, M.; du Plessis, M.; Lenzen, M. Managing sustainability using financial accounting data: The value of input-output analysis. J. Clean. Prod. 2021, 293, 126128. [Google Scholar] [CrossRef]
  65. Cellura, M.; Guarino, F.; Longo, S.; Mistretta, M.; Orioli, A. The role of the building sector for reducing energy consumption and greenhouse gases: An Italian case study. Renew. Energy 2013, 60, 586–597. [Google Scholar] [CrossRef]
  66. Lenzen, M.; Crawford, R. The path exchange method for hybrid LCA. Environ. Sci. Technol. 2009, 43, 8251–8256. [Google Scholar] [CrossRef]
  67. Crawford, R.H.; Bontinck, P.-A.; Stephan, A.; Wiedmann, T.; Yu, M. Hybrid life cycle inventory methods—A review. J. Clean. Prod. 2018, 172, 1273–1288. [Google Scholar] [CrossRef]
  68. Allende, A.; Stephan, A.; Crawford, R. The life cycle embodied energy and greenhouse gas emissions of an Australian housing development: Comparing 1997 and 2019 hybrid life cycle inventory data. In Proceedings of the 54th International Conference of the Architectural Science Association (ANZAScA), Auckland, New Zealand, 26–27 November 2020. [Google Scholar]
  69. Crawford, R.H. Using Input-Output Data in life Cycle Inventory Analysis; Deakin University: Geelong, VIC, Australia, 2004. [Google Scholar]
  70. Treloar, G.J. Comprehensive Embodied Energy Analysis Framework; Deakin University: Geelong, VIC, Australia, 1998. [Google Scholar]
  71. Mao, C.; Shen, Q.; Shen, L.; Tang, L. Comparative study of greenhouse gas emissions between off-site prefabrication and conventional construction methods: Two case studies of residential projects. Energy Build. 2013, 66, 165–176. [Google Scholar] [CrossRef] [Green Version]
  72. Morini, A.A.; Ribeiro, M.J.; Hotza, D. Carbon footprint and embodied energy of a wind turbine blade—A case study. Int. J. Life Cycle Assess. 2021, 26, 1177–1187. [Google Scholar] [CrossRef]
  73. Galal Ahmed, K.; Alipour, S.M.H. More dense but less walkable: The impact of macroscale walkability indicators on recent designs of emirati neighborhoods. City Territory Archit. 2021, 8, 12. [Google Scholar] [CrossRef]
  74. Abuimara, T.; Tabet Aoul, A. Window thermal performance optimization in governmental Emirati housing prototype in Abu Dhabi, UAE. In Proceedings of the Sustainable Buildings 2013 Conference Series, Dubai, United Arab Emirates, 8–10 December 2013. [Google Scholar]
  75. Giusti, L.; Almoosawi, M. Impact of building characteristics and occupants’ behaviour on the electricity consumption of households in Abu Dhabi (UAE). Energy Build. 2017, 151, 534–547. [Google Scholar] [CrossRef]
  76. Stephan, A.; Stephan, L. Achieving net zero life cycle primary energy and greenhouse gas emissions apartment buildings in a Mediterranean climate. Appl. Energy 2020, 280, 115932. [Google Scholar] [CrossRef]
  77. Venkatraj, V.; Dixit, M.K. Life cycle embodied energy analysis of higher education buildings: A comparison between different LCI methodologies. Renew. Sustain. Energy Rev. 2021, 144, 110957. [Google Scholar] [CrossRef]
  78. Boja, N.; Borz, S.A. Energy Inputs in Motor-Manual Release Cutting of Broadleaved Forests: Results of Twelve Options. Energies 2020, 13, 4597. [Google Scholar] [CrossRef]
  79. Abu-Hijleh, B.; Jaheen, N. Energy and economic impact of the new Dubai municipality green building regulations and potential upgrades of the regulations. Energy Strategy Rev. 2019, 24, 51–67. [Google Scholar] [CrossRef]
  80. AlQubaisi, A.; Al-Alili, A. Efficient Residential Buildings in Hot and Humid Regions: The Case of Abu Dhabi, UAE. Int. J. Therm. Environ. Eng. 2018, 17, 29–40. [Google Scholar]
  81. Bande, L.; Cabrera, A.G.; Kim, Y.K.; Afshari, A.; Ragusini, M.F.; Cooke, M.G. A building retrofit and sensitivity analysis in an automatically calibrated model considering the urban heat island effect in Abu Dhabi, UAE. Sustainability 2019, 11, 6905. [Google Scholar] [CrossRef]
  82. Treloar, G.; Fay, R.; Love, P.E.D.; Iyer-Raniga, U. Analysing the life-cycle energy of an Australian residential building and its householders. Build. Res. Inf. 2000, 28, 184–195. [Google Scholar] [CrossRef]
  83. Pakdel, A.; Ayatollahi, H.; Sattary, S. Embodied energy and CO2 emissions of life cycle assessment (LCA) in the traditional and contemporary Iranian construction systems. J. Build. Eng. 2021, 39, 102310. [Google Scholar] [CrossRef]
  84. Chen, C. CiteSpace: A Practical Guide for Mapping Scientific Literature; Nova Science Publishers: Hauppauge, NY, USA, 2016. [Google Scholar]
  85. Scheuer, C.; Keoleian, G.A.; Reppe, P. Life cycle energy and environmental performance of a new university building: Modeling challenges and design implications. Energy Build. 2003, 35, 1049–1064. [Google Scholar] [CrossRef]
  86. U.S. Energy Information Administration. Country Analysis Executive Summary: United Arab Emirates. 2020. Available online: https://www.eia.gov/international/content/analysis/countries_long/United_Arab_Emirates/uae_2020.pdf (accessed on 1 July 2022).
  87. Wang, E.; Shen, Z. A hybrid Data Quality Indicator and statistical method for improving uncertainty analysis in LCA of complex system—Application to the whole-building embodied energy analysis. J. Clean. Prod. 2013, 43, 166–173. [Google Scholar] [CrossRef]
  88. Huijbregts, M.A. Application of uncertainty and variability in LCA. Int. J. Life Cycle Assess. 1998, 3, 273–280. [Google Scholar] [CrossRef]
  89. Rahman, S.; Said, Z.; Issa, S. Performance evaluation and life cycle analysis of new solar thermal absorption air conditioning system. Energy Rep. 2020, 6, 673–679. [Google Scholar] [CrossRef]
  90. Jordan, D.C.; Kurtz, S.R. Photovoltaic Degradation Rates—An Analytical Review. Prog. Photovolt. Res. Appl. 2013, 21, 12–29. [Google Scholar] [CrossRef]
  91. Hammond, G.; Jones, C. Inventory of Carbon & Energy (ICE) Version 1.5 Beta; University of Bath, Department of Mechanical Engineering: Bath, UK, 2006. [Google Scholar]
  92. Knapp, K.; Jester, T. Empirical investigation of the energy payback time for photovoltaic modules. Solar Energy 2001, 71, 165–172. [Google Scholar] [CrossRef]
  93. Krauter, S.; Rüther, R. Considerations for the calculation of greenhouse gas reduction by photovoltaic solar energy. Renew. Energy 2004, 29, 345–355. [Google Scholar] [CrossRef]
  94. Leckner, M.; Zmeureanu, R. Life cycle cost and energy analysis of a Net Zero Energy House with solar combisystem. Appl. Energy 2011, 88, 232–241. [Google Scholar] [CrossRef]
  95. Nawaz, I.; Tiwari, G.N. Embodied energy analysis of photovoltaic (PV) system based on macro- and micro-level. Energy Policy 2006, 34, 3144–3152. [Google Scholar] [CrossRef]
  96. Ardente, F.; Beccali, G.; Cellura, M.; Lo Brano, V. Life cycle assessment of a solar thermal collector: Sensitivity analysis, energy and environmental balances. Renew. Energy 2005, 30, 109–130. [Google Scholar] [CrossRef]
  97. Wijayasundara, M.; Crawford, R.H.; Mendis, P. Comparative assessment of embodied energy of recycled aggregate concrete. J. Clean. Prod. 2017, 152, 406–419. [Google Scholar] [CrossRef]
  98. Elkhapery, B.; Kianmehr, P.; Doczy, R. Benefits of retrofitting school buildings in accordance to LEED v4. J. Build. Eng. 2021, 33, 101798. [Google Scholar] [CrossRef]
  99. Azar, E.; Al Ansari, H. Framework to investigate energy conservation motivation and actions of building occupants: The case of a green campus in Abu Dhabi, UAE. Appl. Energy 2017, 190, 563–573. [Google Scholar] [CrossRef]
  100. Rodriguez-Ubinas, E.; Alantali, M.; Alzarouni, S.; Alhammadi, N. Evaluating the performance of PV modules in buildings (BIPV/BAPV) and the soiling effect in the UAE desert setting. Int. J. Energy Prod. Manag. 2020, 5, 293–301. [Google Scholar] [CrossRef]
  101. Al Dakheel, J.; Tabet Aoul, K. Building Applications, opportunities and challenges of active shading systems: A state-of-the-art review. Energies 2017, 10, 1672. [Google Scholar] [CrossRef]
  102. Ahmed, W.; Asif, M. A critical review of energy retrofitting trends in residential buildings with particular focus on the GCC countries. Renew. Sustain. Energy Rev. 2021, 144, 111000. [Google Scholar] [CrossRef]
  103. Chohan, A.H.; Memon, Z.A.; Che-Ani, A.I.; Arar, M.S.; Awad, J. Adaptation of Grid Tied Photovoltaic (GT-PV) System as Retrofit Renewable Energy Model for Single-Family House in UAE. Int. J. Integr. Eng. 2021, 13, 130–147. [Google Scholar]
  104. de Oliveira Fernandes, M.A.; Keijzer, E.; van Leeuwen, S.; Kuindersma, P.; Melo, L.; Hinkema, M.; Gonçalves Gutierrez, K. Material-versus energy-related impacts: Analysing environmental trade-offs in building retrofit scenarios in the Netherlands. Energy Build. 2021, 231, 110650. [Google Scholar] [CrossRef]
  105. Gulotta, T.M.; Cellura, M.; Guarino, F.; Longo, S. A bottom-up harmonized energy-environmental models for europe (BOHEEME): A case study on the thermal insulation of the EU-28 building stock. Energy Build. 2021, 231, 110584. [Google Scholar] [CrossRef]
Figure 1. Life cycle stages of a building as defined by BS EN 15978 and associated energy.
Buildings 12 01469 g001
Figure 2. Front and side elevation of case study villa.
Buildings 12 01469 g002
Figure 3. Proportion of initial and recurrent embodied energy for the case study villa.
Buildings 12 01469 g003
Figure 4. Life cycle energy of the case study building over 50 years.
Buildings 12 01469 g004
Figure 5. Impact of a PV system on life cycle embodied and operational energies: (a) Impact from zero to 25 years; (b) from 26 to 50 years.
Buildings 12 01469 g005
Figure 6. Impact of a PV system on life cycle energy: (a) Without PV; (b) With PV.
Buildings 12 01469 g006
Figure 7. Proportion of Operational energy and Life cycle embodied energy based on variations in operational energy (Scenario 2).
Buildings 12 01469 g007
Figure 8. Proportion of Operational energy and Life cycle embodied energy based on variations in life cycle embodied energy (Scenario 3).
Buildings 12 01469 g008
Table 1. A summary of various investigated factors for embodied energy assessment in previous studies.
Investigated FactorBuilding TypeCountryReference
Material Service LifeResidentialAustralia[16,34,50]
Building Service LifeResidentialAustralia[16,34]
Assessment methodResidentialAustralia[16,34]
Material specificationResidentialPortugal[35]
OfficeUK[51]
Energy sourceOfficeUK[51]
Passive designResidentialChina[25]
House layoutResidentialPortugal[35]
Construction methodResidentialMalaysia[52]
Construction/Structural materialResidentialPortugal[35]
ResidentialUK[53]
OfficeUK[51]
Architectural design/case studyOfficeHong Kong[54]
Residential & OfficeMalaysia[55]
EducationalUSA[32]
ResidentialGreece[33]
HealthSpain[56]
Geographical locationResidential and InstitutionalAustria, Denmark
Sweden, Spain,
Czech Republic,
Portugal
[31]
Table 2. Sample from Material schedule and EPIC database table used in the IOBHA assessment procedure (Adapted from [16,48,50]).
Material/ComponentUnitQtyWastage FactorDelivered QuantityEnergy Intensity (GJ/Unit)Average Service Life (Years)
SUPERSTRUCTURE WORKColumnsM3211.1524.152.40450
BeamsM3261.1529.92.40450
Staircase and Entrance StepsM3161.1518.42.40450
Solid Slabs 25 cm thickM31121.15128.82.40450
Solid Slabs 18 cm thickM351.155.752.40450
DomeM30 50
ParapetM3301.1534.52.40450
BLOCKS WORK20 cm Solid Block—60 m2 @425 kg/m2KG25,5001.0526,7750.002650
20 cm Hollow Block with Insulation—440 m2KG121,0001.05127,0500.002650
20 cm Hollow Block with Insulation—440 m2KG6601.056930.002650
20 cm Hollow Block—620 m2 @275 g/m2KG170,5001.05179,0250.002650
10 cm Hollow Block—150 m2 @275 kg/m2KG41,2501.0543,312.50.002650
INTERNAL FINISHINGINTERNAL FINISHING
FLOORING
Floor Finishing (F1—Granite Marble) 35 m2kg19251.32502.50.016325
Floor Finishing (F1—Granite Marble)—Steps-LM 16 steps (7.2 m2)kg3961.3514.80.016325
Floor Finishing (F2—Perlato Marble) 132 m2kg72601.394380.016325
Floor Finishing (F2—Marble)—Steps-LM-56 (56 × 0.45)LM13861.31801.80.016325
Floor Finishing (F2—Marble)—Thresholders (32 × 0.45)LM7921.31029.60.016325
Floor Finishing (F3—Granite Ceramic) 204 m2kg11,2201.0511,7810.018925
Floor Finishing (F4—Ceramic) 52 m2kg28601.0530030.018925
Floor Finishing (F5—Ceramic) 24 m2kg13201.0513860.018925
Floor Finishing (F6—Ceramic) 12 m2kg6601.056930.018925
Roof Floor Finishing (F7—Cement Tiles) 240 m2kg13,2001.0513,8600.004320
WALLS
Plaster 1530 m2kg29,926.801.338,904.840.006535
Wall Finishing (W2) (Washable Emulsion Paint) 1530 m2kg1691.05177.71910.11110
Wall Finishing (W3) (Ceramic Tiles) 3 m height 278 m2kg15,2901.0516,054.50.018925
Wall Finishing (W4) (Ceramic Tiles) 3 m height 58 m2kg31901.053349.50.018925
Wall Finishing (W5) (Ceramic Tiles) 3 m height 32 m2kg17601.0518480.018925
Table 3. Impact of PV panel adoption on Life cycle operational energy.
Building DataPV Data
Roof area (m2)266PV area (m2)133 m2 (50% of roof area)
Annual energy consumption (GJ)523.5Annual PV production (GJ)Year 0 to 25200.4
Year 26 to 50160.3
Total360.7
Life cycle operational energy (GJ)26,176.7Life cycle PV output (GJ)Year 0 to 255010
Year 26 to 504007.5
Total9017.5
New Life cycle operational energy (GJ) *17,159.2
* Modified/new LOPE is based on subtraction of energy from the PV system over the 50-year period.
Publisher’s Note: MDPI stays neutral with regard to jurisdictional claims in published maps and institutional affiliations.

