Abstract
Despite their favorable physical and mechanical properties for structural use, tropical woods, such as Iroko (Milicia excelsa), present knowledge gaps to be filled mainly about their mechanical characterization, which currently limit their use or result in under- or overdimensioned structural elements. Visual classification, one of the most used methods for characterizing wood, is inaccurate in the case of Iroko due to the wide variety of geographical locations in which this species can be found. In addition, mechanical characterization using test pieces with structural dimensions leads to high and impractical costs. In this context, this study aims to verify the mechanical properties of Iroko (imported from the Republic of the Congo) from small size specimens, a process that is currently standardized only for softwoods, and to verify the correlation of different properties through bending properties and ultrasound tests. Prior to the bending tests, the speed of propagation of ultrasonic waves was measured using the direct method. The results obtained show a good correlation between density and bending properties and the velocity of propagation of ultrasonic waves.
1. Introduction
Iroko is widely used as a raw material in structural elements due to its excellent mechanical and physical properties [1,2]. According to European standards, the wood of Iroko is assigned to a strength class of D40, as defined in EN 338 [3]. This strength class is recognized by the European standard EN 1912 [4], which is based on the classification made by the British Standard BS 5756 [5]. Geographically, the Iroko species is found in the rainforest of the Congo River basin, covering Democratic Republic of Congo, Congo, the Central African Republic, Angola, Cameroon, Tanzania, Rwanda and Burundi. The Iroko trees also extend west to Guinea Bissau, east to Ethiopia, and south to Zimbabwe and Mozambique. Due to the recognized quality of its wood, it was also introduced in the United States [6].
The standard BS 5756 [5] uses visual inspection procedures for the classification of all tropical hardwoods. As such, the discrimination of the species or the origin of the wood is not taken into account. A direct consequence of this strategy is that this standard is applicable to a wide range of situations, without taking into account adaptations to particular conditions and species [7]. The vastness of the geographical area where Iroko wood can be found has proven to have effects on its genetic and morphological diversity [8]. This means that the visual classification, provided by the standard BS 5756 [5], is hardly adequate to classify all kinds of Iroko wood. In addition, the procedures of visual and mechanical classification implemented by the European standards to classify wood mechanical properties, namely using standards EN 14081 [9], EN 408 [10] and EN 384 [11], are focused primarily on softwood, but there is an implicit acceptance that they are also applicable to tropical hardwoods [12].
The use of small size specimens instead of structural size specimens, as permitted by the EN 384 [11] for hardwoods, poses obvious advantages in terms of economic costs and workability [2]. In addition to these advantages, one must consider that the vast majority of the mechanical properties of the database of tropical woods were obtained using small size specimens [13]. In this sense, several research projects have been undertaken so that, instead of classifying the tropical hardwood species through structural size specimens, correlation factors between the properties of the small size and structural size specimens are established for the modulus of elasticity (MoE) in bending [13,14]. This correlation principle is also described in EN 384 [11]. The standard is based on average values obtained on small clear specimens, subjected to bending tests, for the subsequent assignment of their respective reference properties by the application of factors. According to this method, these factors should be determined by the use of, at least, three similar species and, for each species, by the relationship between the characteristic values obtained from the structural dimension test pieces and the mean values of the small test pieces.
However, studies have shown that similar averages of bending properties obtained from small size specimens may correspond to significant differences between species when testing structural size specimens. One such example was presented by Ravenshorst and Kuilen [15] when analyzing the species of Cumaru (Dypterix odorata) through two samples, one originating from Brazil and the other from Peru, in which the bending strength of one origin was more than 40% higher.
Besides that, non-destructive tests (NDTs) present themselves as an option to assess the intrinsic properties of building materials that can later be correlated with the mechanical characterization, level of degradation and located defects. Such techniques bring many advantages in terms of cost and agility, in addition to preserving the integrity of the specimen.
In the last few decades, the development of new non-destructive methods and techniques aiming at the assessment of the conservation status of wooden elements is notorious, replacing or complementing traditional techniques [16]. Ultrasonic pulse velocity test (UPV) is one of the techniques that has been widely studied and used in the inspection of wood components of existing structures [17]. Essentially, the method consists of the emission of ultrasonic waves through one of the axes of the element, making it possible to measure the speed of propagation of the waves and to correlate the measurements with the desired parameters.
In this sense, efforts have been made around the globe in order to improve and better understand the technique potential and range. Guntekin et al. [18] obtained a good correlation between the dynamic modulus of elasticity from the UPV test and the mechanical properties from bending tests in Turkey. Van de Kuilen and Ravenshorst [19], in the Netherlands, established relationships for the classification of tropical hardwoods from the combination of dynamic modulus of elasticity and density, based on the principle that woods of the same species can be classified in different classes. Baar et al. [20] published a study carried out in the Czech Republic on the prediction of mechanical properties of five species of tropical hardwoods from ultrasound measurements. Perlin et al. [21] established a new methodology to detect the position of the pith from the UPV, in Brazil. Proto et al. [22] performed an analysis of the quality of the wood based on UPV measurements in standing trees, seeking to maximize the extracted value of a forest in Italy, in addition to many other studies with different purposes around the world.
The present study intends to develop an expeditious procedure for the classification of tropical hardwoods using low-cost procedures that are simple to implement in the laboratory by using small clear specimens and UPV tests. In this sense, this work seeks to propose a different formulation for the calculation of the characteristic values in bending as an alternative to the procedure described by EN 384 [11], in order to eliminate the need for structural size specimens tests and the use of similar species for the determination of the correlation factors. The proposed procedure has been applied to the specific case of Iroko wood imported from the Republic of the Congo.
2. Materials and Methods
The EN 384 [11] considers that the mechanical characterization of hardwood can be obtained from small clear specimens. For this purpose, the existence of correlation coefficients between structural size specimens and small clear specimens free from defects from at least three similar species is required. It is also necessary that at least 40 small clear specimens originating from at least five trees of the same species be analyzed. Accordingly, the logs were subjected to visual inspection according to BS 5756 [5]. From the logs, small specimens free from defects were sawn and prepared, according to ISO 3133 [23], by a private sawmill, the importer, that has supplied the specimens for the experimental campaign. The specimens were stored in a climatic chamber (Fitoclima EDTU, from Aralab 28000, Lisbon, Portugal) at 20 °C and a relative humidity of 65%, according to ISO 3129 [24], where they remained until their weight stabilized. The weight of the small specimens was considered stabilized when, after successive weighings spaced by a minimum of 6 hours, the difference in weight readings was less than 0.5%. The weights were calculated using 20 selected small specimens.
The experimental campaign started after the stabilization of the small specimens. First, all the specimens were weighed and subjected to tests in order to quantify the speed of propagation of an ultrasonic wave. Subsequently, three-point static bending tests were performed up to failure. Finally, a small sample with 2.5 cm length was cut as close as possible from the failure zone of each specimen. These samples were weighed and placed in an oven to dry completely to calculate the moisture content and the density, according to ISO 3130 [25] and ISO 3131 [26], respectively. Table 1 presents the properties evaluated in this experimental program and the applied standard.

Table 1.
Reference standards for each property evaluated in the experimental program.
2.1. Visual Grading by BS 5756
Before any experimental evaluation, and still in the log form, it was possible to grade the Iroko wood through BS 5756 [5] based on the visual appreciation of some singularities. For that, five logs (average diameter of 90 cm, Figure 1) were selected from five different Iroko trees (Milicia excelsa), imported from Congo. The following visual singularities were evaluated in accordance with BS 5756 [5] and EN 1310 [27]: the existence of knots and their dimensions; fiber inclination; wane, fissures, bow, spring and twist. Verifying all those natural defects and anomalies, the five logs were confirmed as belonging to strength class D40 as predicted by EN 1912 [4] for this hardwood.
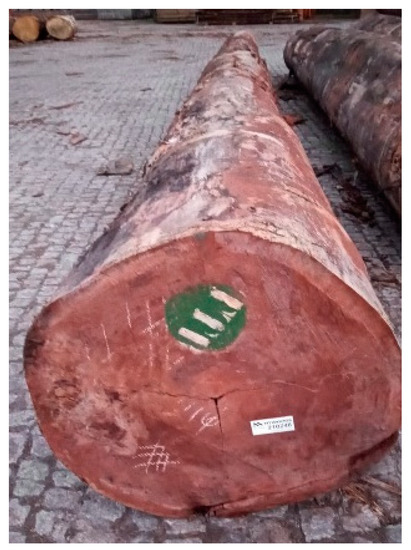
Figure 1.
Iroko (Milicia excelsa) log.
2.2. Moisture Content and Density Measurements
The stabilization process was considered terminated when, after successive weighings with a minimum of 6 hours spacing, the difference was below 0.5%. Before each weighing, the specimens were placed in a desiccator with silica to cool down, without any moisture content exchange with the environment. After cooling, the samples were immediately weighed to prevent changes in moisture content of the specimen greater than 0.1%.
According to ISO 3130 [25] and ISO 3131 [26], the moisture content () and the wood density () of each specimen were calculated.
As recommended and described by EN 384 [11], the density values have been adjusted to a moisture content of 12%, since the density expressed for a moisture content of 12% is considered the reference density of the wood by the standard. According to EN 384 [11], the density value is reduced by 0.5% if the value of moisture content is above 12% and increased by 0.5% if the moisture content is below 12%.
2.3. Ultrasound Measurements
After weighing the specimens to determine their densities, ultrasonic measurements were carried out. These measurements consist of the recording of the time that the ultrasound wave takes to cross the specimen along its longitudinal axis, through the direct method. Measurements were made by using the PROCEQ equipment, with ultrasound probes of 22 kHz attached to the specimens using gel and taking the measured value as the average of three readings.
From the wave travel time and the length of the sample, the propagation speed of the wave was determined. As the propagation speed of the wave varies according to the moisture content of the specimen, it is necessary to correct the propagation speed for the reference moisture content of 12%. For this correction, the procedure proposed by Sandoz [28] was applied. In [28], it is proposed that, for moisture contents between 5% and 30%, the rate of propagation of the wave varies in the order of 0.8% per percent change in moisture content.
Apart from the study conducted by Sandoz [28], there have been other studies (e.g., [29,30]) that have investigated the relation between the moisture content below the fiber saturation point and the speed of propagation of the ultrasonic wave, but most of them have addressed softwood species, e.g., [31].
Then, with the density of the specimen adjusted to 12% of moisture content, the dynamic modulus of elasticity () of each test piece was determined as:
where is the wave velocity and is the wood density for a moisture content .
2.4. Modulus of Elasticity and Strength in Bending
To avoid significant changes in the moisture content of the specimens after their removal from the climatic chamber, each specimen was tested in bending just after the ultrasound measurements. The 3-point bending tests followed ISO 3133 [23] in terms of setup and loading procedure.
Given the high number of specimens and the variability of density between them, a large amplitude of the maximum load values would be expected, causing constant changes in the load speed between tests. For this reason, in order to meet the ISO 3133 [23] requirement, which is to achieve the maximum load within 90 ± 30 s, the samples were divided into four groups, according to their mass (Table 2). In this way, the velocity of load application was defined for each group, ensuring that the failure occurred in the range defined by the standard. The values of the applied load varied from 0.09 mm/s to 0.15 mm/s and are presented in Table 2.
Table 2.
The division of the sample into groups for the bending tests.
Bending strength was measured by testing all specimens to failure. Unlike other properties, such as density, according to EN 384 [11], the bending strength does not need to be corrected to the reference moisture content value of 12%. However, ISO 3133 [23] recommends a correction with a variation of 1% per percent change in moisture content.
The load-deformation curve was used to calculate the modulus of elasticity in bending. To compute it, Equation (2), as presented in EN 408 [10], was used. This considers the force-deflection graph in a range of 10% to 40% of maximum strength as:
where is the increment in load (N) on the regression line with a correlation coefficient of 0.99 or higher, between 40% () and 10% () of the maximum load value, is the increment of deformation (mm) corresponding to , is the span in bending (mm), and is the second moment of area (mm4). If a correlation coefficient of at least 0.99 is not possible, the examined range is shortened to 30% and 20%.
2.5. Correlation between Properties
Based on the properties previously determined, correlations factors were established to define probabilistic relationships between each of them.
The analysis of the relation between different mechanical properties among themselves and with the ultrasound velocity was carried out in four different phases. In Phase 1, all experimental results were directly included, without considering any correction of the moisture content. In Phase 2, the experimental values were corrected by taking into account the moisture content, as described above.
Since the objective of this work is to characterize the mechanical properties of hardwood samples free of defects, the possibility of existing unobservable defects must be considered. In this sense, a certain level of heterogeneity in the results was to be expected, especially if one considers the following:
- The possibility of the existence of natural defects in wood, in particular, defects not detectable by the naked eye;
- Possible errors committed during the experimental campaign due to the sensitivity of the tests themselves, and in particular, the ultrasound test.
Based on these reasons, it is assumed that the results of the characteristics of the specimens could have been influenced, thus achieving inconsistent results, as there was the condition that the specimens would be free from defects.
To this effect, values very different from the general population were defined as outliers and removed from the analysis in the third phase. The lower and upper limits considered for the third phase are defined as [32]:
where is the lower limit, is the lower quartile (the 25th percentile), is the upper quartile (the 75th percentile), and is the upper limit.
These bounds excluded the upper and lower 0.35% of samples, under the assumptions of a Gaussian distribution.
In general, the process was based on the determination of expressions of linear regression that best fit the results obtained from the correlations between each pair of properties. Subsequently, the differences between the expected values, defined by the expression of linear regression, and the actual value obtained were determined. These values were called residues. The third step corresponded to the elimination of the pairs of results whose residues were excluded by applying Equations (3) and (4), considered to be "abnormal" values.
The fourth and last phase corresponded to the elimination of the 5% of residues situated furthest from the final expression of the linear regression between the properties to be linked. This principle has already been applied in other studies. A similar process was applied by Ravenshorst and Kuilen [33] when drawing up a proposal for the determination of the characteristic value of the bending strength of a wood genus.
Figure 2 summarizes each step of the experimental campaign adopted in this study.
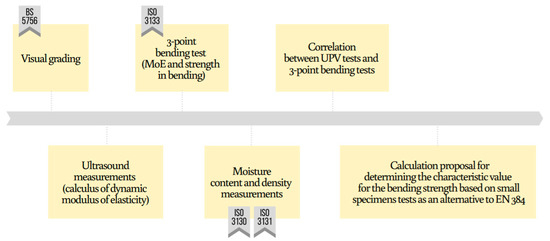
Figure 2.
Timeline of the methodology adopted.
3. Results
3.1. Determination of Mean Values of Mechanical Properties
3.1.1. Moisture Content
Table 3 presents the results of the moisture content obtained in accordance with ISO 3130 [25].
Table 3.
Values of moisture content (w) and values of the sample corrected for wood moisture content of 12% (density (ρ12), bending strength (fm12), modulus of elasticity in bending (Em12), velocity of transmission of the wave (V12), dynamic modulus of elasticity (Edin12)) using ISO 3130 [25], ISO 3133 [23] and EN 384 [11].
3.1.2. Density
Table 3 presents the results of the densities obtained in accordance with ISO 3131 [26] after correction for the moisture content of 12%, according to the procedures recommended by EN 384 [11], leading to an average density with a final value of 743.12 kg/m3.
3.1.3. Bending Strength
Table 3 summarizes the average results obtained for the bending strength in accordance with ISO 3133 [23]. It must be pointed out that, and as emphasized earlier, it was necessary to correct the values obtained in bending tests to account for moisture contents different from 12%.
EN 384 [11] requires that the specimens with a moisture content lower than 8% at the time of the test should be excluded. As all the tests were performed within a moisture content above 8%, it was not necessary to exclude any result.
3.1.4. Modulus of Elasticity in Bending ()
Table 3 presents the final results for the modulus of elasticity measured from the testing campaign. The standard states that, for the range between 8% and 18% moisture content, the value of must differ 1% for each percentage value to be corrected, increasing or decreasing for moisture content above or below 12%, respectively. As such, and in accordance with the EN 384 [11], for specimens with a moisture content greater than 18% the correction was made by taking into consideration the referred moisture content value.
3.1.5. Dynamic Modulus of Elasticity ()
Table 3 presents the final results of the readings of the velocity of the ultrasound. The correction of the wave propagation velocity to take into account moisture contents other than 12% was carried out in accordance with Sandoz [28].
Considering the procedures of the correction methodologies of moisture content in EN 384 [11] and the correlation assumed by Sandoz [28] between the propagation velocity of the ultrasonic wave and the moisture content, the dynamic modulus of elasticity of each specimen test was quantified, as shown in Table 3.
3.2. Correlation between Properties
Figure 3 shows the correlation between density and modulus of elasticity in bending and Table 4 summarizes the results obtained. The results obtained show that there is a moderate correlation between the density and the modulus of elasticity in bending, in particular when outliers are removed (Phase 3).
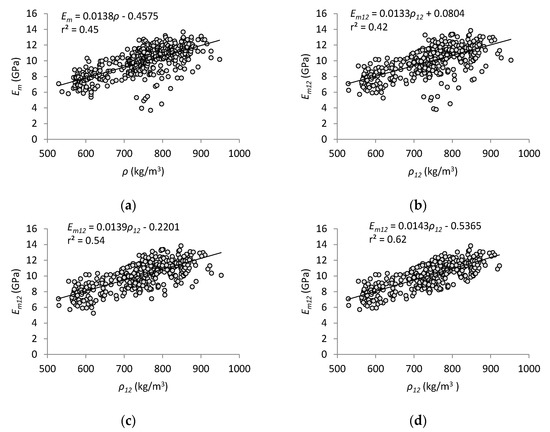
Figure 3.
Correlation between density (ρ) and modulus of elasticity (Em): (a) With the moisture content at the time of the tests (Phase 1); (b) After the correction for a 12% of moisture content (Phase 2); (c) After excluding the outliers (Phase 3); (d) After excluding 5% of the values farthest from the linear regression expression.
Table 4.
Correlation between density (ρ) and modulus of elasticity in bending (Em).
Figure 4 shows the correlation between density and bending strength and Table 5 summarizes the results obtained. Here too, it is possible to see a substantial increase in the correlation between the two properties from the exclusion of values that go beyond the limits imposed by Equations (3) and (4).
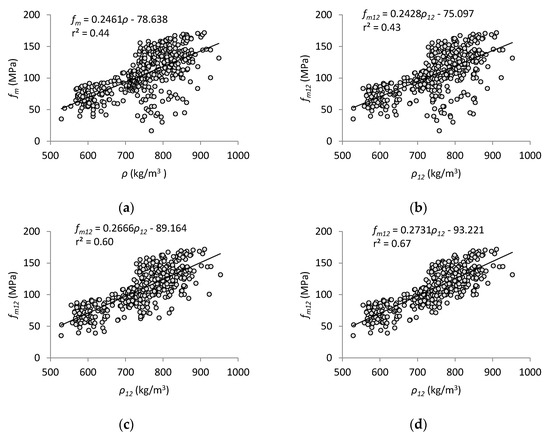
Figure 4.
Correlation between density (ρ) and bending strength (fm): (a) With the moisture content at the time of the tests (Phase 1); (b) After the correction for a 12% of moisture content (Phase 2); (c) After excluding the outliers (Phase 3); (d) After excluding 5% of the values farthest from the linear regression expression.
Table 5.
Correlation between density (ρ) and bending strength (fm).
The correlation between the modulus of elasticity and the bending strength is presented in Figure 5 and the values are summarized in Table 6. The results show high correlation even for Phase 1, revealing that the analysis in the elastic range is appropriate to the classification of the strength capacity of Iroko.
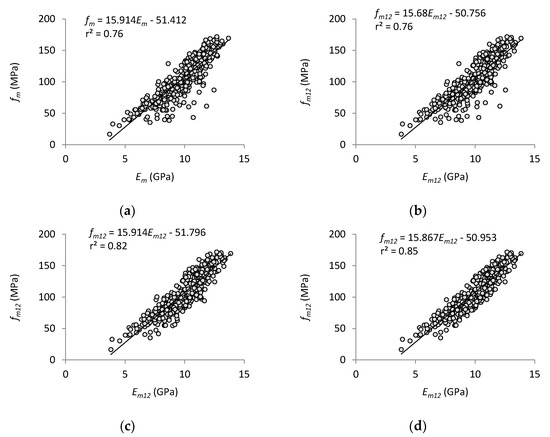
Figure 5.
Correlation between modulus of elasticity (Em) and bending strength (fm). (a) With the moisture content at the time of the tests (Phase 1); (b) After the correction for a 12% of moisture content (Phase 2); (c) After excluding the outliers (Phase 3); (d) After excluding 5% of the values farthest from the linear regression expression.
Table 6.
Correlation between modulus of elasticity (Em) and strength (fm) in bending.
Figure 6 and Figure 7 show, respectively, the correlation between the dynamic modulus of elasticity, computed by using the density and the ultrasound velocity, according to Equation (1), and the modulus of elasticity and the bending strength. Additionally, respectively, Table 7 and Table 8 summarize the results, and once again, in Phase 3, it is possible to see high correlation values of 0.806 and 0.708 for both correlations. In the case of correlation between the dynamic modulus of elasticity and the modulus of elasticity in bending, a very strong correlation is noticed since Phase 2, when the results are corrected to the moisture content of 12% (r2 = 0.74).
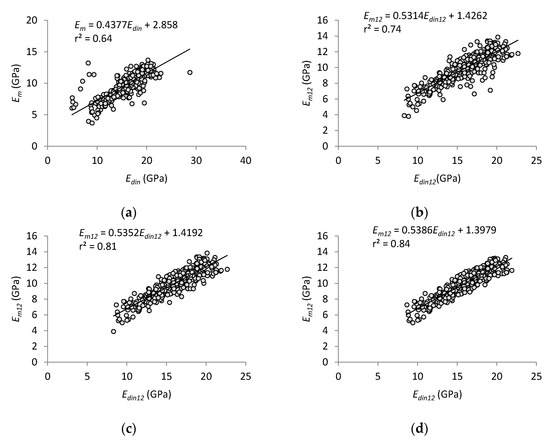
Figure 6.
Correlation between dynamic modulus of elasticity (Edin) and modulus of elasticity (Em). (a) With the moisture content at the time of the tests (Phase 1); (b) After the correction for a 12% of moisture content (Phase 2); (c) After excluding the outliers (Phase 3); (d) After excluding 5% of the values farthest from the linear regression expression.
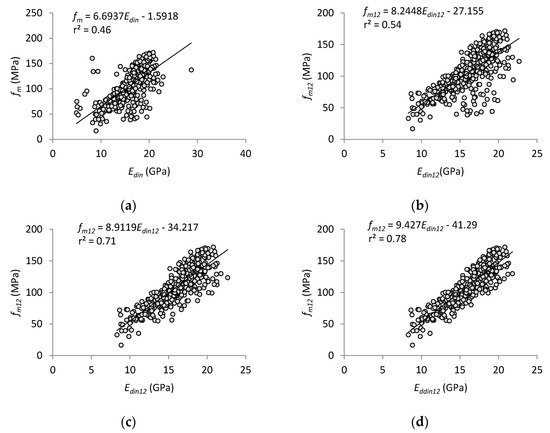
Figure 7.
Correlation between dynamic modulus of elasticity (Edin) and bending strength (fm). (a) With the moisture content at the time of the tests (Phase 1); (b) After the correction for a 12% of moisture content (Phase 2); (c) After excluding the outliers (Phase 3); (d) After excluding 5% of the values farthest from the linear regression expression.
Table 7.
Correlation between dynamic modulus of elasticity (Edin) and modulus of elasticity in bending (Em).
Table 8.
Correlation between dynamic modulus of elasticity (Edin) and bending strength (fm).
Despite the existence of four phases in the correlations between the properties, for the proposed model of the present study, only Phase 2 was considered, since Phase 3 and Phase 4 require more in-depth analysis.
4. Calculation Proposal for Determining the Characteristic Value for the Bending Strength Based on Small Specimens Tests
In a first analysis, the test results obtained in this study for the mechanical properties based on small specimens are very close to the values reported in [34] and by CIRAD [35], and are in agreement with the range proposed by PROTA [36], as it can be depicted in Table 9. Since the logs from which the test specimens were extracted had been assigned the D40 strength class, the results obtained from the test campaign would be compared with the characteristic values corresponding to that class.
Table 9.
Comparison between values of the so-called reference properties (density, modulus of elasticity in bending and bending strength) suggested by different studies.
Ravenshorst and Kuilen [33] presented results of test campaigns using small and full size specimens of Cumaru (Dypterix odorata), from different sources (Brazil and Peru). The results obtained from the tests conducted on small specimens were very similar. However, the bending strength of the full-size specimens of one of the origins was more than 40% higher than the small size. As a conclusion, this study recommended the use of 0.66 slope of the regression lines of small sizes and full sizes to predict the 5th percentile value of the full size specimen out of the parametric 5th percentile value of the small (both clears and non-clears), multiplied by a factor of 0.9. This factor of 0.9 brings into account the presence of weak specimens. This consideration is in agreement with the safety factor of 0.9 over the 5th percentile value assumed by EN 384 [11], in the alternative method proposed to quantify the mechanical properties of hardwood species based on small samples free from defects.
In this sense, it is proposed that the characteristic value of the bending strength should be obtained through the 5th percentile of the small clear test pieces, free of defects, as it occurs with structural size test pieces, in opposition to using the mean of the results.
By combining the presented considerations, Equation (5) is proposed for the determination of the characteristic value of the bending strength.
where represents the characteristic value of the bending strength of the sample and is the 5th percentile obtained from the tests on small clear specimens.
The 5th percentile is the value for which 5% of the results are less than or equal to [11] (in the case of this study, with 420 specimens, the 5th percentile corresponds to the 21st lowest result). Considering that, the value obtained for the 5th percentile was 51.48 MPa. The sample should correspond to the strength class D35. Curiously, if the correction of the moisture content to 12% followed the procedure defined in ISO 3133 [23], the result of the 5th percentile would be 52.81 MPa, which would give a result of of 40.4 MPa, corresponding to class D40.
5. Discussion
From the final averages results obtained for the properties of Iroko, after moisture content corrections for 12%, which followed the EN 384 [11], it is observed that they confirm the values obtained in similar studies with small clear specimens (Table 9). The density value obtained, 743 kg/m3, is very similar to the values obtained by Amoah et al. [37], 752 kg/m3, and Wu [38], 786 kg/m3, and nearly 16% above the value obtained by Tsoumis [34], 620 kg/m3.
Based on the results obtained in this study regarding density, the Iroko wood samples analyzed could be classified as belonging to strength class D40, according to what is stipulated in the EN 338 [3]. In the case of the bending strength, the average value obtained of 105 MPa is very similar to the value of 111 MPa obtained by Tsoumis [34]. On the other hand, the modulus of elasticity in bending, 9.95 GPa, is a little above the range presented by Cheng et al. [39], 9.3–9.4 GPa, and nearly 13% below the value of 11.27 GPa obtained by Tsoumis [34]. These studies were also carried out with small specimens free from defects, subjected to 3-point bending tests.
Regarding the correlation between the properties obtained by the tests performed, the values fit the expected behavior for wood. The correlation between density and modulus of elasticity or density and bending strength shows that such properties are influenced by the wood density, where denser woods of the same species tend to be more resistant. However, a correlation of r2 = 0.421 is obtained for MoE and r2 = 0.432 for bending strength (both in Phase 2) due to the large number of factors that affect the wood behavior, such as the size of the growth rings, the direction of fibers, the place of extraction of the specimen in relation to the log, etc. Defects, such as knots and fissures, were not mentioned since the tests were carried out on small test specimens theoretically free from defects.
The correlation between the dynamic modulus of elasticity obtained from the UPV tests and the static modulus of elasticity presents coherent values when compared with those found in the literature. Several and independent studies showed results in a correlation range of 0.55–0.87, aligned with the values obtained in the present study, as is summarized in Table 10.
Table 10.
Correlations between the dynamic modulus of elasticity obtained from UPV and the static modulus of elasticity, obtained by different studies.
In the present study, as a consequence of the good correlation between the modulus of elasticity and the bending strength (r2 = 0.756), a correlation of r2 = 0.54 was obtained between the dynamic modulus of elasticity and the bending strength.
The procedure described by EN 384 [11], cited in Section 1, to determine the bending characteristic values using small specimens can lead to factors that do not represent reality due to the dependence on similar species, which are poorly specified in the standard. This would have direct implications on the safety side of the structures and on the side of the wastage of the material. This raises the question of to which extent the considerations made by EN 384 [11] for the implementation of this procedure will be a viable and credible option. The model presented by the authors in Section 4 tries to cope with this situation. In the case of the bending strength, based on the principle of the high homogeneity of tropical timber, especially when there are no defects, it is proposed to use the 5th percentile of the test results on small clear specimens to measure the characteristic value of the wood species.
Naturally, the proposed Equation (5) needs an exhaustive testing campaign, with new species, in order to be able to calibrate the coefficients presented for the expressions of the modulus of elasticity and of the bending strength. Moreover, an inter-laboratory collaborative procedure involving diverse hardwood species may be fundamental to validate the proposed model.
6. Conclusions
After carrying out the experimental campaign for the mechanical characterization of Iroko wood, imported from the Republic of the Congo, based on small test specimens, it was possible to obtain results compatible with the expectations based on previous studies and available databases. The main achievements of this study are:
- Average strength and modulus of elasticity in bending of 105.3 MPa and 9.95 GPa, respectively;
- The classification of the Iroko wood studied in class D40 when using Equation (5) from the use of the 5th percentile adjusted to a moisture content of 12%;
- Eliminating the need for comparison with other similar species as recommended by the alternative method proposed by EN 384 [11];
- Good correlations between the results obtained in the non-destructive ultrasound test (wave propagation speed and dynamic modulus of elasticity) and the bending strength parameters obtained from the destructive tests.
The performance of these tests can be used as a basis for future tests on other tropical species, or even Iroko, in order to reaffirm and implement the precision of the methodology adopted in this study. In addition, further studies may attest the veracity of the considerations made, for Phases 3 and 4, in which outliers have been identified, which in turn may lead to a greater capacity to assess the mechanical properties of the wood.
It is expected that studies aiming at characterizing tropical hardwoods in a cheaper, simpler and more accurate way should be developed. Thus, more options and models of calculations adaptable to all different factors that influence wood behavior may emerge, increasing its market competitiveness and deepening the knowledge about one of the most traditional materials in the world, which still has a lot to be studied.
Author Contributions
Investigation, C.C.; data curation, C.C.; formal analysis, C.C.; writing—original draft, C.C.; Methodology, M.T., D.F.L. and A.R.; investigation, M.T., D.F.L. and A.R.; Conceptualization, L.C.N. and J.M.B.; methodology, L.C.N. and J.M.B.; validation, L.C.N. and J.M.B.; project administration, L.C.N. and J.M.B. All authors were responsible for writing—review and editing, All authors have read and agreed to the published version of the manuscript.
Funding
This research received no external funding.
Institutional Review Board Statement
Not applicable.
Informed Consent Statement
Not applicable.
Data Availability Statement
The data presented in this study are openly available in repository Universidade Nova at http://hdl.handle.net/10362/27870.
Conflicts of Interest
The authors declare no conflict of interest.
References
- Ouinsavi, C.; Sokpon, N.; Bada, O. Utilization and traditional strategies of in situ conservation of iroko (Milicia excels Welw. C.C. Berg) in Benin. For. Ecol. Manag. 2005, 207, 341–350. [Google Scholar] [CrossRef]
- Geert, R.; Kuilen, J.W. Comparison of methods of strength classification of tropical hardwood timber. In Proceedings of the Eleventh World Conference on Timber Engineering, Riva Del Garda, Italy, 20–24 June 2010; pp. 20–24. [Google Scholar]
- EN 338:2009. Structural Timber—Strength Classes; European Committee for Standardization: Brussels, Belgium, 2009. [Google Scholar]
- EN 1912:2012. Structural Timber—Strength Classes. Assignment of Visual Grades and Species; European Committee for Standardization: Brussels, Belgium, 2012. [Google Scholar]
- BS 5756:2007. Visual Grading of Hardwood—Specification; British Standards: London, UK, 2007. [Google Scholar]
- Agro Forest Tree Database: A Tree Reference and Selection Guide Version 4.0. Available online: https://www.worldagroforestry.org/publication/agroforestree-database-tree-reference-and-selection-guide-version-40 (accessed on 7 February 2021).
- Arriaga, F.; Íñiguez, G.; Esteban, M.; Fernández-Golfín, J.I. Structural Tali timber (Erythrophleumivorense A. Chev., Erythrophleumsuaveolens Brenan.): Assessment of strength and stiffness properties using visual and ultrasonic methods. Holz Roh. Werkst. 2006, 64, 357–362. [Google Scholar] [CrossRef]
- Ouinsavi, C.; Sokpon, N. Morphological Variation and Ecological Structure of Iroko (Milicia excelsa Welw. C.C. Berg) Populations across Different Biogeographical Zones in Benin. Int. J. For. Res. 2010, 2010, 658396. [Google Scholar]
- EN 14081-1:2005. Timber Structures—Strength Graded Structural Timber with Rectangular Cross Section—Part 1: General Requirements; European Committee for Standardization: Brussels, Belgium, 2005. [Google Scholar]
- EN 408:2012. Timber Structures—Structural Timber and Glued Laminated Timber—Determination of Some Physical and Mechanical Properties; European Committee for Standardization: Brussels, Belgium, 2012. [Google Scholar]
- EN 384:2010. Structural Timber. Determination of Characteristic Values of Mechanical Properties and Density; European Committee for Standardization: Brussels, Belgium, 2010. [Google Scholar]
- Kuilen, J.W.G.; Ravenshorst, G.J.P.; Brunetti, M.; Crivellaro, A. Species independent strength grading of hardwoods. In Proceedings of the International Scientific Conference on Hardwood Processing (ISCHP 07), Florence, Italy, 24–26 September 2007; pp. 165–170. [Google Scholar]
- Jamil, A.W.M.; Zamin, J.M.; Omar, M.K.M. Relationship between mechanical properties of structural size and small clear specimens of timber. J. Trop. For. Sci. 2013, 25, 12–21. [Google Scholar]
- Wahab, M.J.A.; Jumaat, M.Z. Investigation of Linearity between Mechanical Properties of Wood Using Graphical Method. Sains Malays. 2014, 43, 211–218. [Google Scholar]
- Ravenshorst, G.J.P.; Kuilen, J.W.G. Comparison of methods of strength classification of (tropical) hardwood timber. In Proceedings of the World Conference on Timber Engineering (WCTE 2010), Trento, Italy, 20–24 July 2010; pp. 1–9. [Google Scholar]
- Branco, J.M.G.; Sousa, H.S. Métodos de Inspeção e Classificação Visual de Elementos de Madeira: Manual de Curso, 1st ed.; University of Minho: Braga, Portugal, 2014. [Google Scholar]
- Ross, R.J.; Hunt, M.O. Stress Wave Timing Non-Destructive Evaluation Tools for Inspecting Historic Structures. A Guide for Use and Interpretation; US Department of Agriculture, Forest Service, Forest Product Laboratory: Madison, WI, USA, 2000; p. 15.
- Guntekin, E.; Ozkan, S.; Yilmaz, T. Prediction of bending properties for beech lumber using stress wave method. Maderas Cienc. Tecnol. 2014, 16, 93–98. [Google Scholar] [CrossRef]
- Van De Kuilen, J.W.; Ravenshorst, G. Relationships Between Non-Destructive Measurements and Mechanical Properties of Tropical Hardwoods. In Proceedings of the World Conference on Timber Engineering WCTE 2018, Seoul, Korea, 20–23 August 2018. [Google Scholar]
- Baar, J.; Tippner, J.; Rademacher, P. Prediction of mechanical properties—Modulus of rupture and modulus of elasticity—of five tropical species by nondestructive methods. Maderas Cienc. Tecnol. 2015, 17, 239–252. [Google Scholar] [CrossRef]
- Perlin, L.P.; do Valle, A.; Pinto, R.C.A. New method to locate the pith position in a wood cross-section based on ultrasonic measurements. Constr. Build. Mater. 2018, 168, 733–739. [Google Scholar] [CrossRef]
- Proto, A.R.; Macrì, G.; Bernardini, V.; Russo, D.; Zimbalatti, G. Acoustic evaluation of wood quality with a non-destructive method in standing trees: A first survey in Italy. iForest 2017, 10, 700–706. [Google Scholar] [CrossRef]
- ISO 3133:1975. Wood—Determination of Ultimate Strength in Static Bending; International Organization for Standardization: Geneva, Switzerland, 1975. [Google Scholar]
- ISO 3129:1975. Wood—Sampling Methods and General Requirements for Physical and Mechanical Tests; International Organization for Standardization: Geneva, Switzerland, 1975. [Google Scholar]
- ISO 3130:1975. Wood—Determination of Moisture Content for Physical and Mechanical Tests; International Organization for Standardization: Geneva, Switzerland, 1975. [Google Scholar]
- ISO 3131:1975. Wood—Determination of Density for Physical and Mechanical Tests; International Organization for Standardization: Geneva, Switzerland, 1975. [Google Scholar]
- EN 1310:1997. Round and Sawn Timber—Method of Measurement of Features; European Committee for Standardization: Brussels, Belgium, 1997. [Google Scholar]
- Sandoz, J.L. Grading of construction timber by ultrasound. Wood Sci. Technol. 1989, 2, 95–108. [Google Scholar] [CrossRef]
- Böstrom, L. Machine strength grading: Comparison of four different systems. Build. Technol. Sp. Rep. 1994, 49, 57. [Google Scholar]
- Barrett, J.D.; Hong, J.P. Moisture content adjustment for dynamic modulus of elasticity of wood members. Wood Sci. Technol. 2010, 44, 485–495. [Google Scholar] [CrossRef]
- Nocetti, M.; Brunetti, M.; Bacher, M. Effect of moisture content on the flexural properties and dynamic modulus of elasticity of dimension chestnut timber. Eur. J. Wood Prod. 2015, 73, 51–60. [Google Scholar] [CrossRef]
- Ryan, T.P. Estatística Moderna para Engenharia, 1st ed.; Elsevier Editora Ltd.: Rio de Janeiro, Brazil, 2009. [Google Scholar]
- Ravenshorst, G.J.P.; Kuilen, J.W.G. An innovative species independent strength grading model. In Proceedings of the 9th World Conference on Timber Engineering, Portland, OR, USA, 6–10 August 2006. [Google Scholar]
- Tsoumis, G. Science and Technology of Wood, 1st ed.; Van Nostrand Reinhold: New York, NY, USA, 1991. [Google Scholar]
- CIRAD, French Agricultural Research Centre for International Development—Tropix 7. The Main Technological Characteristics of 245 Tropical Wood Species. Available online: https://tropix.cirad.fr/en (accessed on 19 February 2021).
- PROTA. Plant Resources of Tropical Africa; PROTA Foundation: Wageningen, The Netherlands, 2008. [Google Scholar]
- Amoah, M.; Appiah-Yeboahand, J.; Okai, R. Characterization of Physical and Mechanical Properties of Branch, Stem and Root Wood of Iroko and Emire Tropical Trees. Res. J. Appl. Sci. 2012, 4, 1755–1761. [Google Scholar]
- Wu, Y.; Wang, S.; Zhou Xing, C.; Zhang, Y. Use of nano indentation and silviscan to determine the mechanical properties of 10 hardwood species. Wood Fiber Sci. 2009, 41, 64–73. [Google Scholar]
- Cheng, J.; Yang, J.; Liu, P. Wood Science Records; China Forestry Publishing Company: Beijing, China, 1992. [Google Scholar]
- Machado, J.S.; Palma, P. Non-destructive evaluation of the bending behaviour of in-service pine timber structural elements. Mater. Struct. 2011, 44, 901–910. [Google Scholar] [CrossRef]
- Miná, A.S.; Oliveira, F.R.; Júnior, C.C.; Dias, A.A.; Sales, A. Avaliação não destrutiva de postes de madeira por meio de ultra-som. Sci. For. 2004, 65, 188–196. [Google Scholar]
- Oliveira, F.R.; Candian, M.; Lucchette, F.F.; Júnior, C.C.; Sales, A. Avaliação de propriedades de madeira por meio de utra-som. In Proceedings of the Pan-American Conference for Nondestructive Testing PANNDT—III, Rio de Janeiro, Brazil, 2–7 June 2003. [Google Scholar]
Publisher’s Note: MDPI stays neutral with regard to jurisdictional claims in published maps and institutional affiliations. |
© 2021 by the authors. Licensee MDPI, Basel, Switzerland. This article is an open access article distributed under the terms and conditions of the Creative Commons Attribution (CC BY) license (http://creativecommons.org/licenses/by/4.0/).