Article

Residual Strength of Reinforced Concrete Beams under Sequential Small Impact Loads

1
Excellence Center in Infrastructure Technology and Transportation Engineering (ExCITE), Department of Civil Engineering, Chiang Mai University, Chiang Mai 50200, Thailand
2
Department of Civil Engineering, Prince of Songkla University, Songkhla 90110, Thailand
3
School of Engineering and the Built Environment, Edinburgh Napier University, Edinburgh EH10 5DT, UK
4
Center of Excellence in Sustainable Disaster Management, School of Engineering and Technology, Walailak University, Nakhonsithammarat 80161, Thailand
*
Author to whom correspondence should be addressed.
Buildings 2021, 11(11), 518; https://doi.org/10.3390/buildings11110518
Submission received: 4 October 2021 / Revised: 31 October 2021 / Accepted: 2 November 2021 / Published: 4 November 2021
(This article belongs to the Section Building Structures)

Abstract

:
Sequential small impact loads may not collapse structures directly but could weaken the strength of structures. This study aimed to investigate the impact of these sequential small impact loads on the strength of the reinforced concrete beams. First, six sequential impact loads were applied to the test specimens. Then, the residual static capacity of the impacted specimens was determined by the ultimate static load test, compared with those of undamaged specimens. The experiment was composed of 12 specimens having identical dimensions. The variable parameters were the magnitude of the axial load and shear reinforcement. Under the sequential small impacts, the axial load improves the impact performance. It reduces the tensile strain of the longitudinal reinforcement. Hence, the flexural tensile crack propagation is limited. In addition, the local damage at the impact location is minimized and the shear plug induced diagonal shear crack is prevented. The axial force is also able to diminish the adverse effect of the large spacing stirrups. Large impact load could alter the failure of a designed flexural critical reinforced concrete beam without axial load to the shear failure. Although the axial load improves the impact response, the Residual Resistance Index (RRI) decreases with axial load. For the damaged specimens with axial load, the ultimate static load is lower than the calculated concrete shear capacity and more severe diagonal shear cracks were found. It can be obviously said that the prior impact damage decreases the concrete shear capacity.

1. Introduction

Most of the reinforced concrete structures are designed to withstand static loads. However, the structures may experience dynamic forces during their service life, such as wind load or force from an earthquake. Accidentally, an impact load may present due to an exposure of the structures, e.g., seismic building pounding or bridge column vehicle collision [1,2]. Some structures may be subjected to blast loading, and strengthening of substandard structural elements is required, e.g., using CFRP [3,4]. Columns of the bridge structures across a river are an example of the colliding of debris flow or ship bumping. In an earthquake event, two adjacent buildings with small gaps have some chances of seismic pounding. Columns and guardrails in the parking building also need an impact resistance design for vehicle crashes. However, to ease the design calculation as suggested by several design codes [5,6], the high strain rate dynamic load is often estimated, equivalent to an amplified static load. The magnitude of the equivalent static force is determined to account for the inertia effect. However, the actual dynamic response under the high strain rate dynamic load is more complicated than amplifying the acting force. The failure mode is able to shift from the expected flexural mode to brittle shear mode [7]. Hence, the equivalent static force method is applicable with some limitations [8,9].
Several impact actions on the reinforced concrete structures have raised many research interests. There have been several research studies on the impact response and failure mechanisms of reinforced concrete beams. Local crushing at the impact point is found, especially when the impact speed is high. Shear plug failure and shear mechanism are the primary keys of the impact failure phenomena. At the early loading stage, the inertia effect plays an essential role in the impact load resistance. The impact behavior of reinforced concrete members has been experimentally investigated through a series of tests. Simple RC beams under impact loading from free-falling weight were studied, including the studies conducted by these researchers [10,11]. Their results have addressed the impact behavior and shear failure mechanism.
Due to the cost and time, numerical simulation has been widely adopted as a tool to investigate the impact response of reinforced concrete members [12,13,14,15,16]. Tantrapongsaton et al. [12] adopted LS-DYNA with material models accounting for high strain effect to analyze the impact responses of reinforced concrete beams. Failure modes of the beams with different amounts of reinforcements were discussed for the minimum required reinforcement. Dynamic response and shear demand of reinforced concrete beams under impact load were numerically investigated by Zhao and Qian [13]. The 3D finite element model was developed and used to identify the affecting factors, including the impact velocity, impact mass, and beam span-to-depth ratio.
The presence of axial load on the reinforced concrete member significantly influences the impact resistance [14]. Chen et al. [15] numerically investigated the prestressed RC beam subjected to blast loading using LS-DYNA code. Lui et al. [17] experimentally investigated the behavior of axially loaded circular RC columns. The results showed that the axial loads have a considerable influence on the dynamic response of the column. The axial load improves the impact resistance and deformation of the columns. The local failure was found for the specimens with a low reinforcement ratio. However, the local failure was greatly reduced for the specimens with a high reinforcement ratio.
The literature mentioned above mainly discussed the impact resistance of reinforced concrete members under a large single impact force to obtain the failure mechanism. In some cases, structures are subjected to lighter and occasionally repeated impact loads without causing significant damage. The small repeated load cannot collapse the structures but indeed decreases the capacity to carry permanent loads. However, only a few research studies have been concerned with the deterioration of the members under the sequential impact load. Adhikary et al. [18] conducted an experimental examination on the impact response of reinforced concrete beams under a single impact load with the imparted energy smaller than the member capacity. Subsequently, quasi-static bending tests were conducted to determine the residual behavior. The residual behavior has also been reported by a group of studies [19,20,21]. The residual strength of geopolymer concrete beams was increased with the inclusion of fiber [21]. For the sequential impact load test, Saatci and Vecchio [9] conducted three repeated variable impact energies for the impact test on reinforced concrete beams. The impact energy and reinforcement were the main parameters. However, the impact energy was at a high level to enable the failure of the test specimens. In addition, the effect of axial force was not included in the study. Tami et al. [22] proposed a relationship between the number of impacts and cumulative residual displacement to indicate the accumulated damage of the reinforced concrete beams. Nevertheless, the work did not mention the residual load-carrying capacity.
This research is aimed to study the impact behavior of reinforced concrete beams under the sequential lateral small impact loads. Six repetitions of the impact actions were applied to the test specimens. Then, the residual static capacity of the impacted specimens was determined by the ultimate static load test. The experiment was composed of 12 specimens having identical dimensions. The variable parameters were the magnitude of the axial load and shear reinforcement. Based on the experimental results, the effects of the study parameters on the impact responses and the capacity deterioration due to the sequential impacts are discussed.

2. Materials and Methods
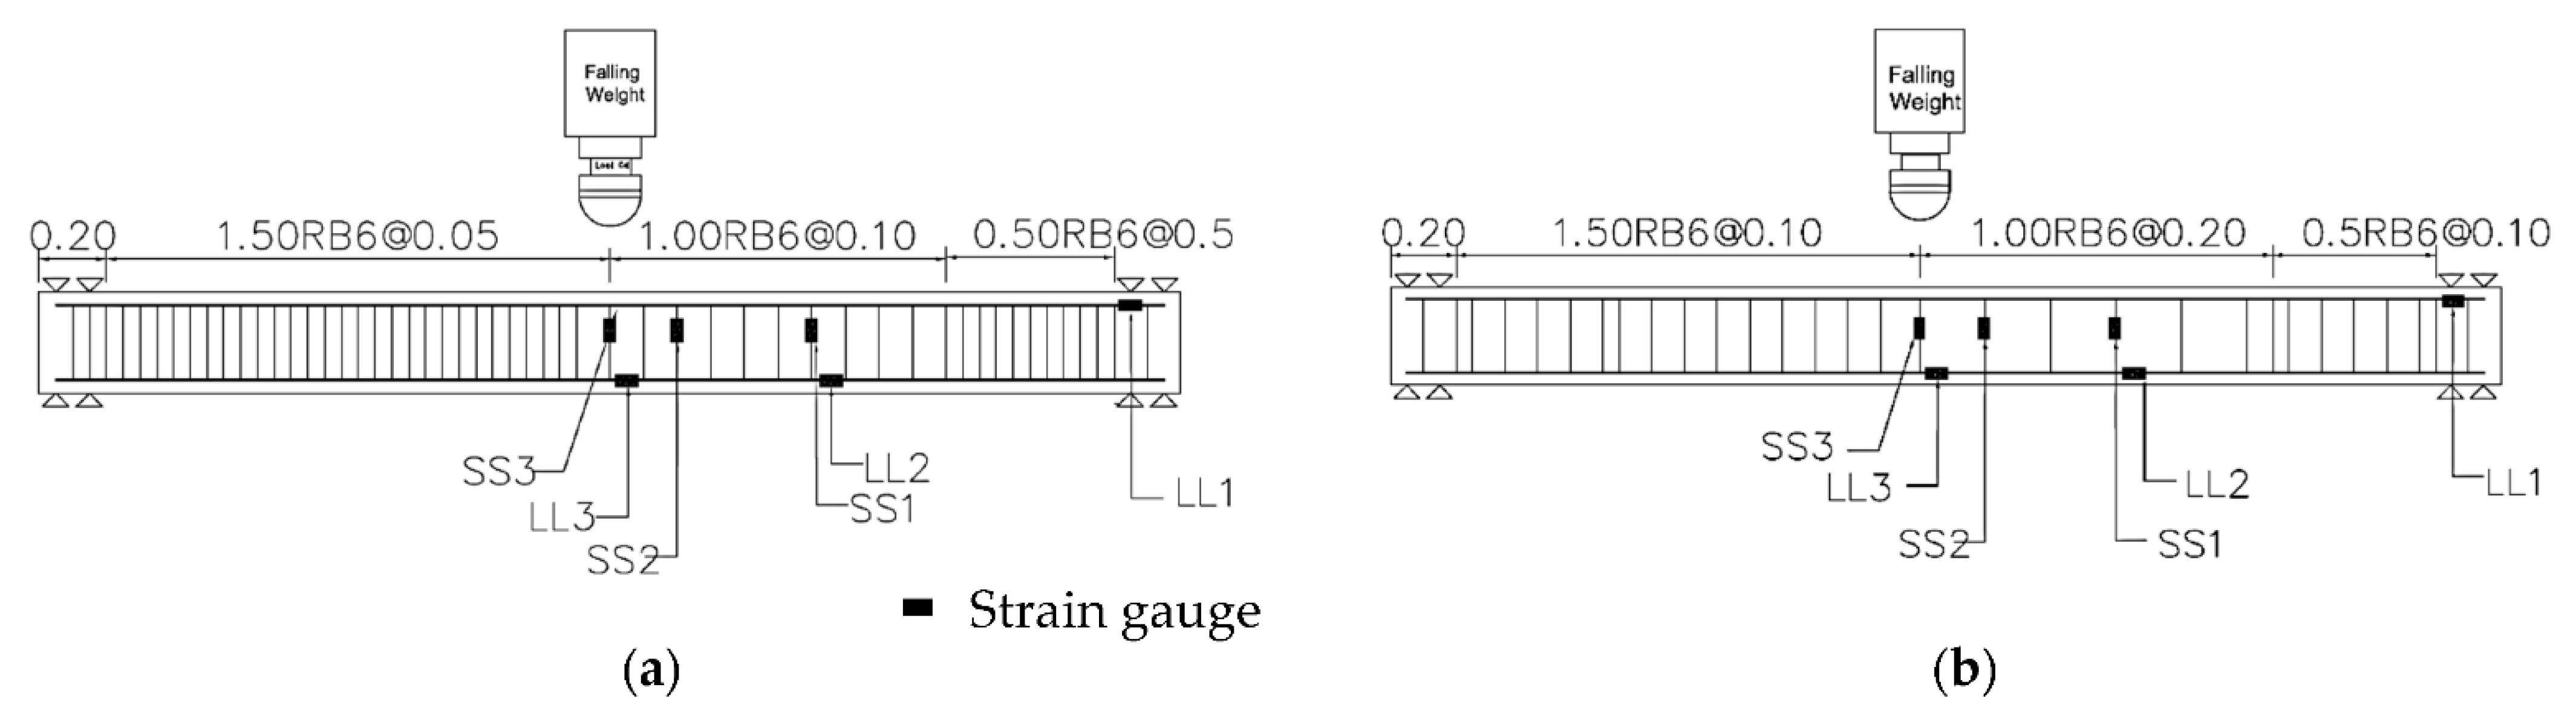
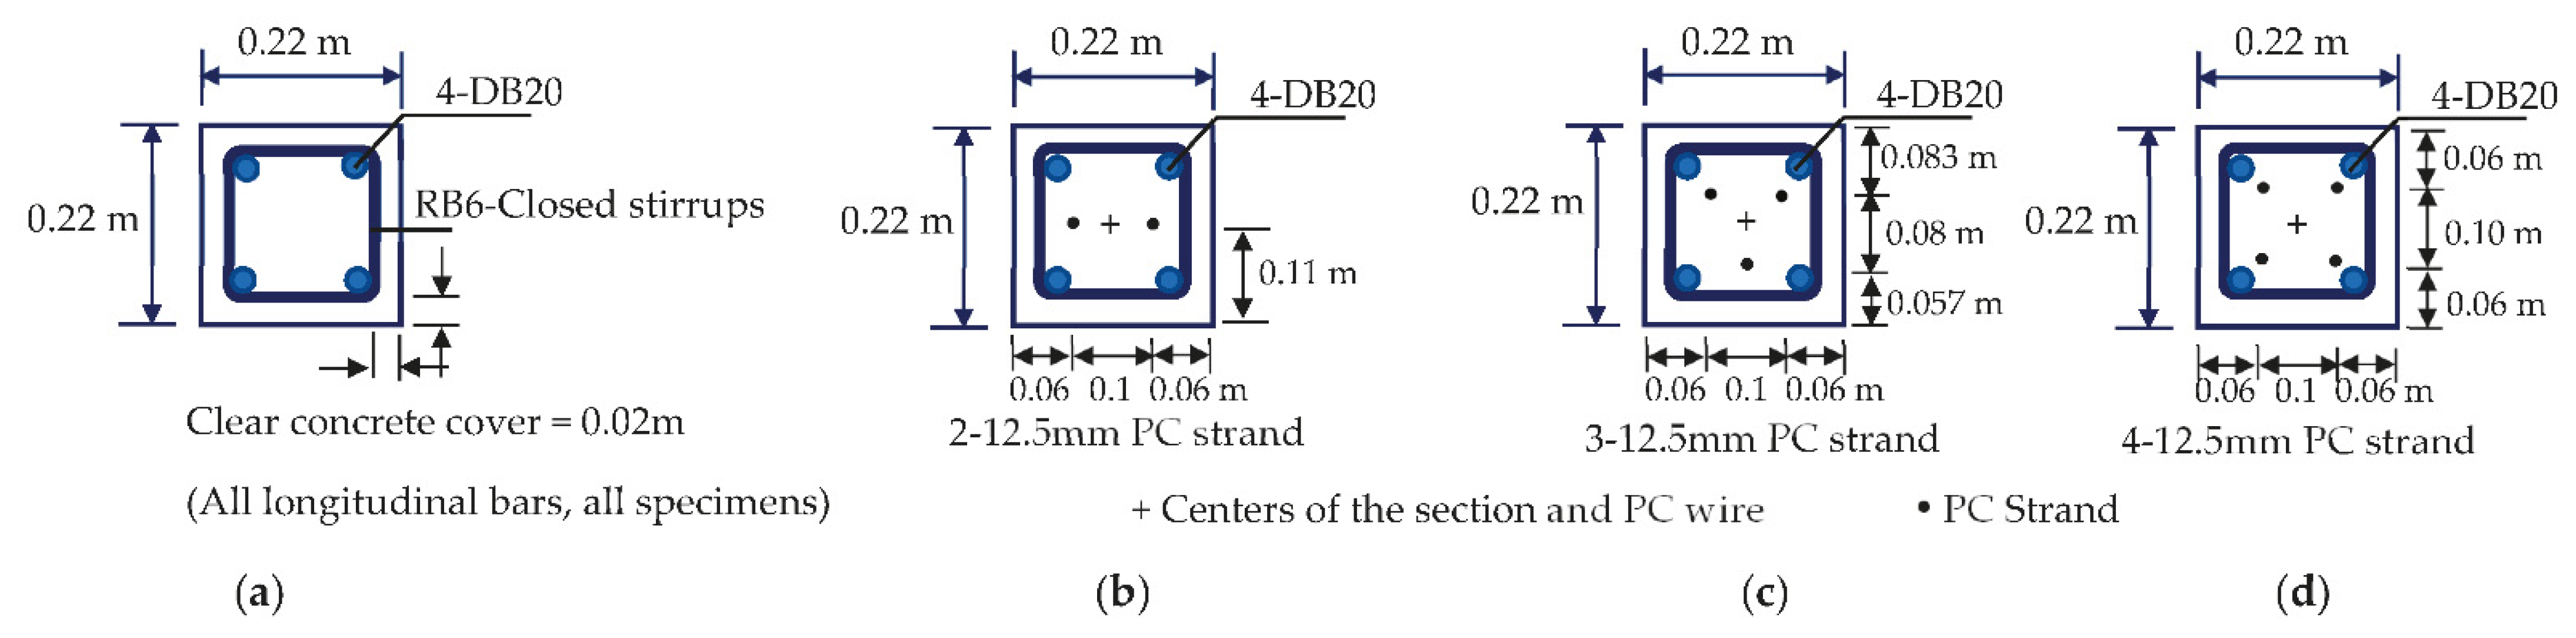
2.1. Test Specimens

There were 12 specimens of reinforced concrete beam specimens with identical dimensions. The cross-section was a 220 mm × 220 mm square section. The span length of the test was 3.0 m, as shown in Figure 1. For all the specimens, the longitudinal reinforcement was four DB20 bars at the corners. The shear reinforcement was 6 mm round steel (RB6). From the tension test, the yield strengths of the DB20 and RB6 bars were 500 and 318 MPa, respectively. All of the specimens were cast at the same time with the 28-day concrete compressive strength of 40 MPa. To control the shear failure in a weaker shear span, a higher amount of shear reinforcement in the other shear span was provided, as shown in Figure 1.
The tests were divided into two series, i.e., the sequential impact test in Series I and the ultimate static test in Series II. After completing the Series I tests, the damaged specimens were taken to apply the ultimate static point load at the midspan. The residual capacity was observed and compared with that of undamaged specimens. Loading point and support conditions of the tests in Series II resembled those in Series I. The nomenclature of the specimens is given as IP-a or SP-a, where I or S is the impact test or the ultimate static test, P is the magnitude of the axial force (percentage of A g f c ), and a is the spacing of the stirrup. For example, specimen I21-2 is the impact test specimen with the magnitude of the axial force of 0.21 A g f c and the spacing of stirrup is 200 mm, where A g is the cross-section area and f c is the 28-day concrete compressive strength.
Prestressing wire with a nominal diameter of 12.50 mm was used for introducing the axial load in the specimens. The wires were arranged in a way so that the centers of the axial force and the cross-section were aligned with each other. As shown in Figure 2, the wires were arranged in the specimens so that the axial load was applied concentrically. Two, three, or four wires were used to generate the axial load of 14%, 21%, and 28% of A g f c , respectively. The magnitudes of the axial load are common values for typical columns. Based on the specimen details, the test setup, and the ACI318 specification [23], the calculated static capacities based on the flexural failure and diagonal shear failure of the beams under a concentric load at midspan are determined as shown in Table 1. The calculated static capacity ratio is between 0.461 and 0.621, indicating that all the specimens are flexural controlled beams. The calculations of the static capacity of the damaged specimens in Series II are not included.

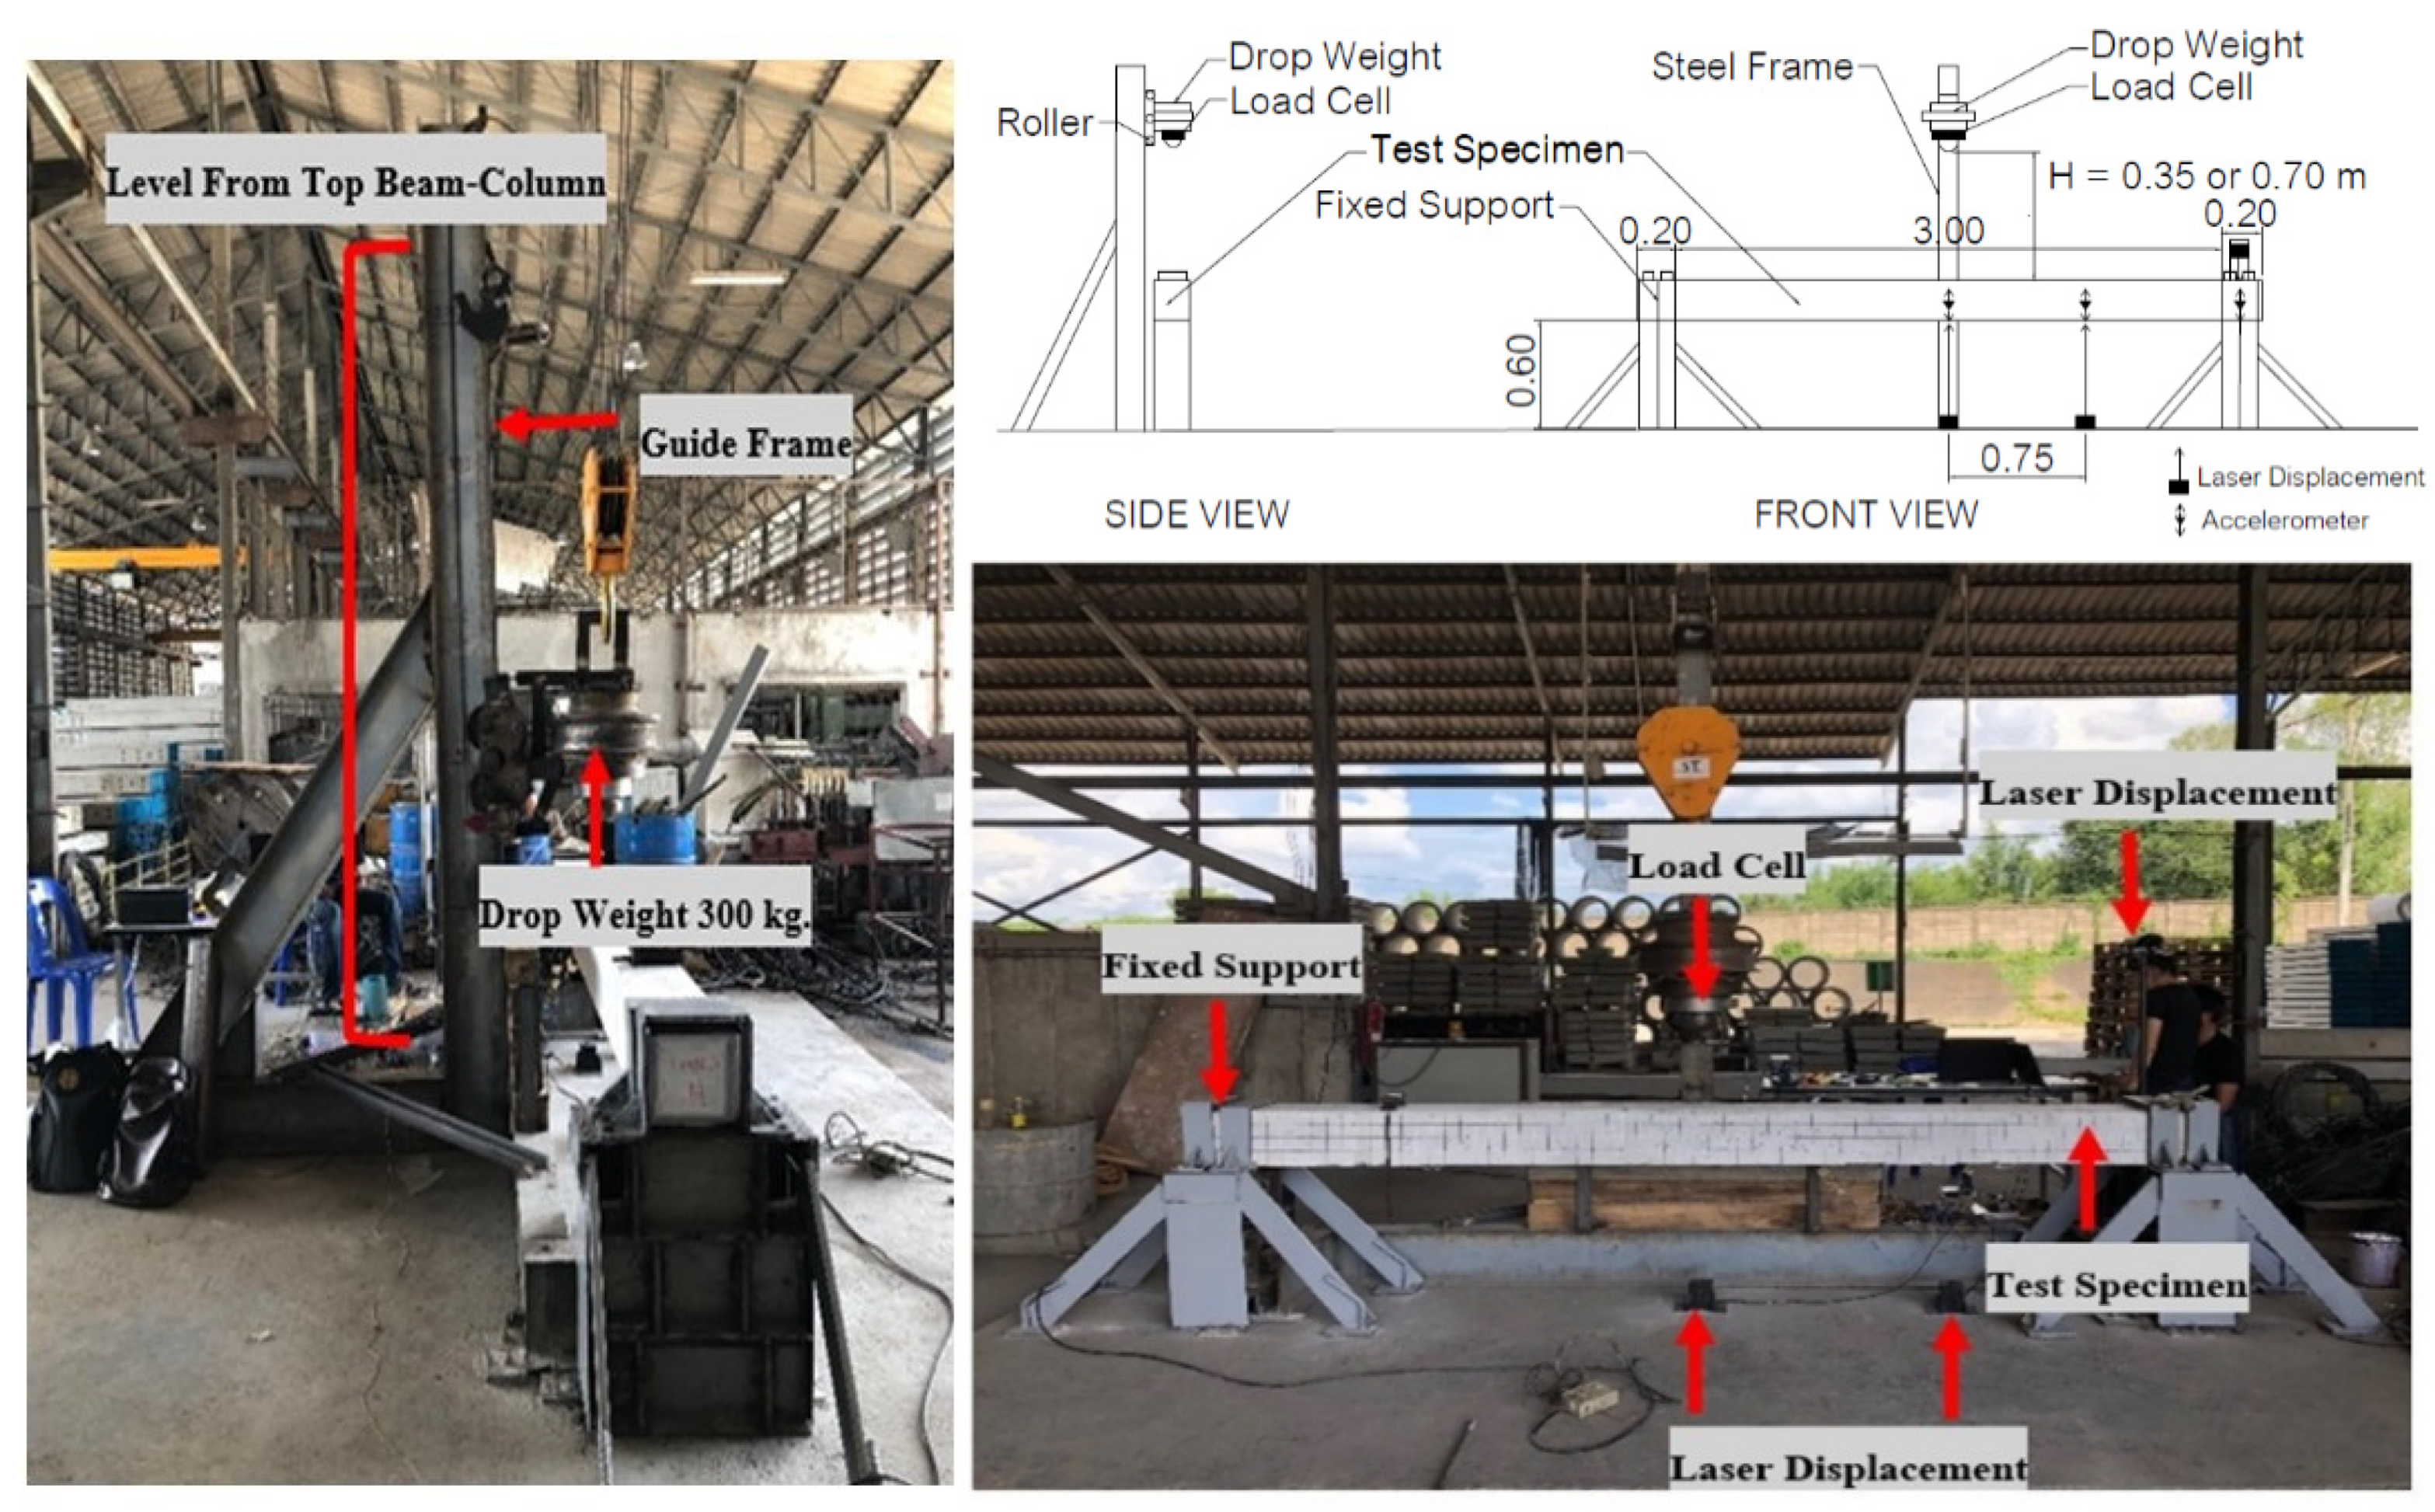
2.2. Sequential Small Impact Loading

Figure 3 shows the experimental setup of the impact test. The specimens were supported to prevent vertical movements. The clear span was 3.00 m. The test arrangement was made with zero overhang spans on the left and the right sides. This zero-length is to avoid the counterbalance of the inertia effect from the overhang part. The loading frame was located on one side of the specimen. A guide rail with rollers was provided to control the drop weight to travel at the desired height and impact location. A hemispherical head with a radius of 77 mm was attached to the impact point of the drop hammer. A high sampling rate load cell was attached to the drop weight to measure the impact time history during the test. The drop weight was 300 kg. Vertical deflection and acceleration time history were measured using laser displacement sensors and accelerometers, respectively. Three deflections and three accelerations were monitored at midspan, shear span (at 0.75 m from the midspan), and at the support. A high-speed digital data acquisition system was used to collect the measured data at a 1 kHz sampling rate.
Six repetitions of weight dropping were applied for each specimen in the test Series I. The weight was kept constant at 300 kg for every dropping, but the falling height was 0.35 m for the first two drops and 0.70 m for the next four drops. To ensure that the six sequential impacts could be continued sequentially before failure, a single impact was estimated and confirmed as a small impact. Since the single impact was small, elastic impact response based on the energy balance concept was simply adopted, and the vertical impact factor (n) is approximated as
n = 1 + 1 + 2 h η Δ s
where h is the dropping height (m), η represents the efficiency of energy conversion from the kinetic energy to the strain energy, and Δ s is the static deflection caused by the static force mg = 300 × 9.806 = 2942 N. Using the impact factor equation shown above with η = 0.9 [24] and cracked section with Icr = 0.4 Ig, the impact force for a single 0.7 m dropping height of the 300 kg mass is approximated as 250 kN. The value is higher than the ultimate capacities shown in Table 1. However, the high strain rate effect also drastically increases the strengths of concrete and steel reinforcement [25,26,27,28,29]. Hence, under every 0.7 m single impact in the test Series I, the specimens were expected to respond below the failure state. In the test, the first two drops with a lower dropping height of 0.35 m were applied and checked for significant damage before applying the next four 0.7 m drops. The two different falling heights of 0.35 and 0.7 m result in 2.62 and 3.71 m/s impact velocities, respectively. After the end of each drop, deformations were checked to ensure that the specimen was at rest. Then crack propagation was investigated and pen marking of the crack opening was made before the next drop.

3. Sequential Impact Test Results

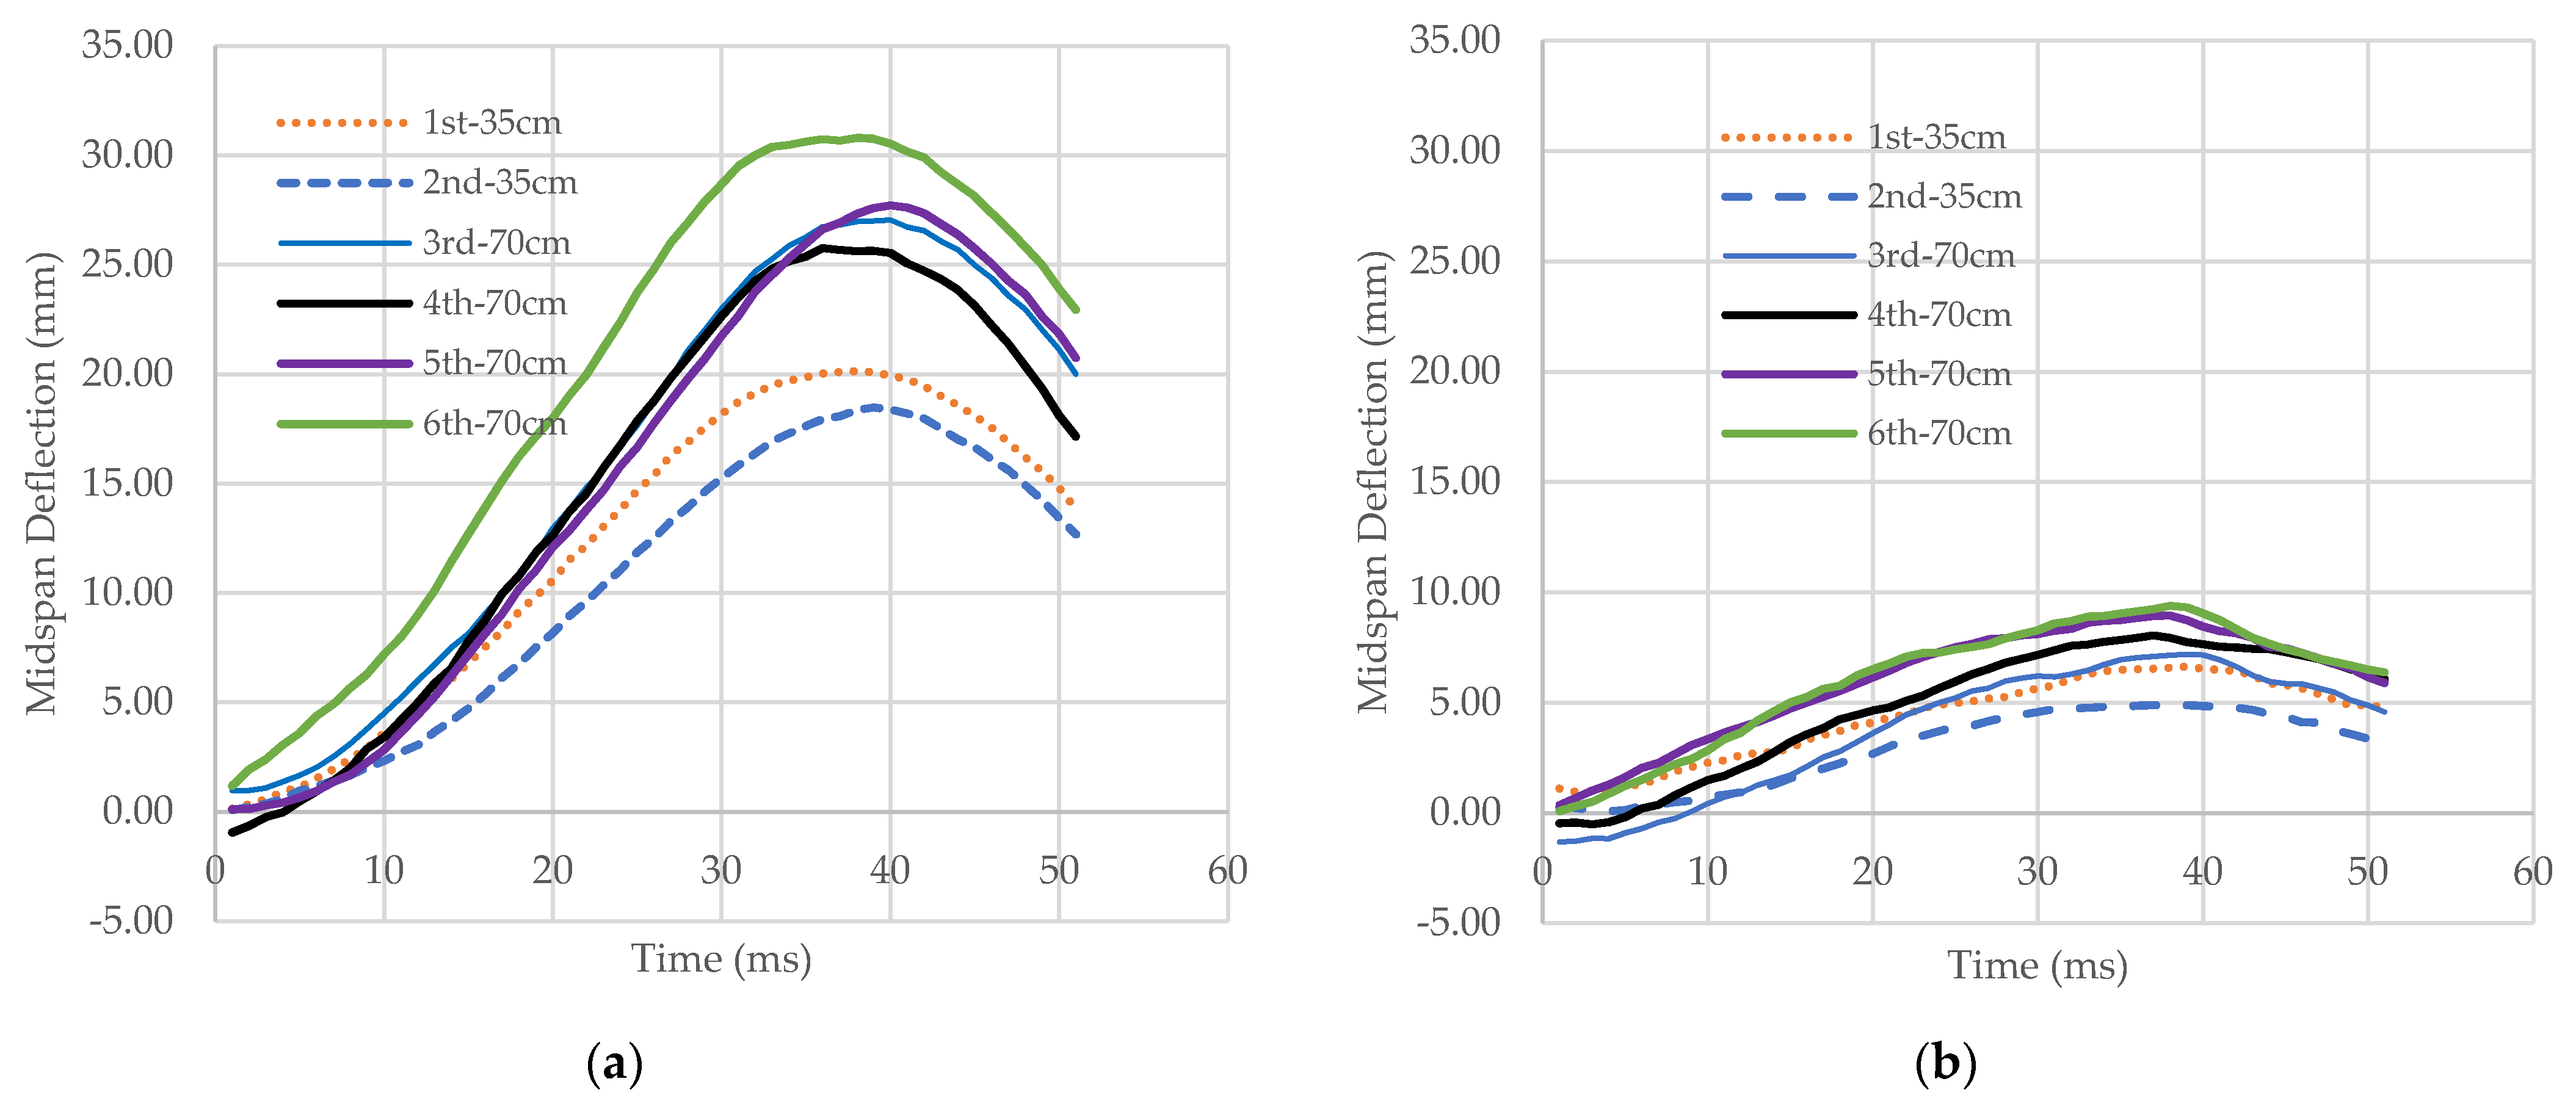
3.1. Impact Force and Midspan Deflection Time History

Figure 4 and Figure 5, respectively, show the impact force and midspan deflection time history under the six sequential drops of specimens I00-1 and I28-2. The results of the two specimens were selected to, respectively, represent the impact responses of specimens without axial force and the highest axial force in the test series. From the figure, for each drop, the peak impacts occurred after the collision and were then followed by the small impact waves. At the initial stages, the small negative impact force was observed due to the inertia effect under the dynamic equilibrium [9]. Table 2 summarizes the peak impact force (PI) for every drop. From Figure 4a, the magnitudes of the impact force increase with the increase of the drop height. However, the impact force under the 4th–6th drops was less than the impact force of the 3rd drop. This is because the impact of the 3rd drop severely damaged the specimen. From Figure 4b, the magnitude of the impact forces was maintained with the same drop heights (under the 3rd to 6th drops). There were only a few damages to the I28-2 specimen with the presence of the high axial load.
For the midspan deflection time history, as shown in Figure 5, the peak midspan deflection occurred at 35 ms, which was delayed from the time of the peak impact force. The delay of the peak displacement time was also observed by Tami et al. [22]. The increase of the dropping height induced higher damage resulting in stiffness degradation and higher midspan deflection. The axial force increased the member stiffness and hence smaller midspan deflection was observed for specimen I28-2.

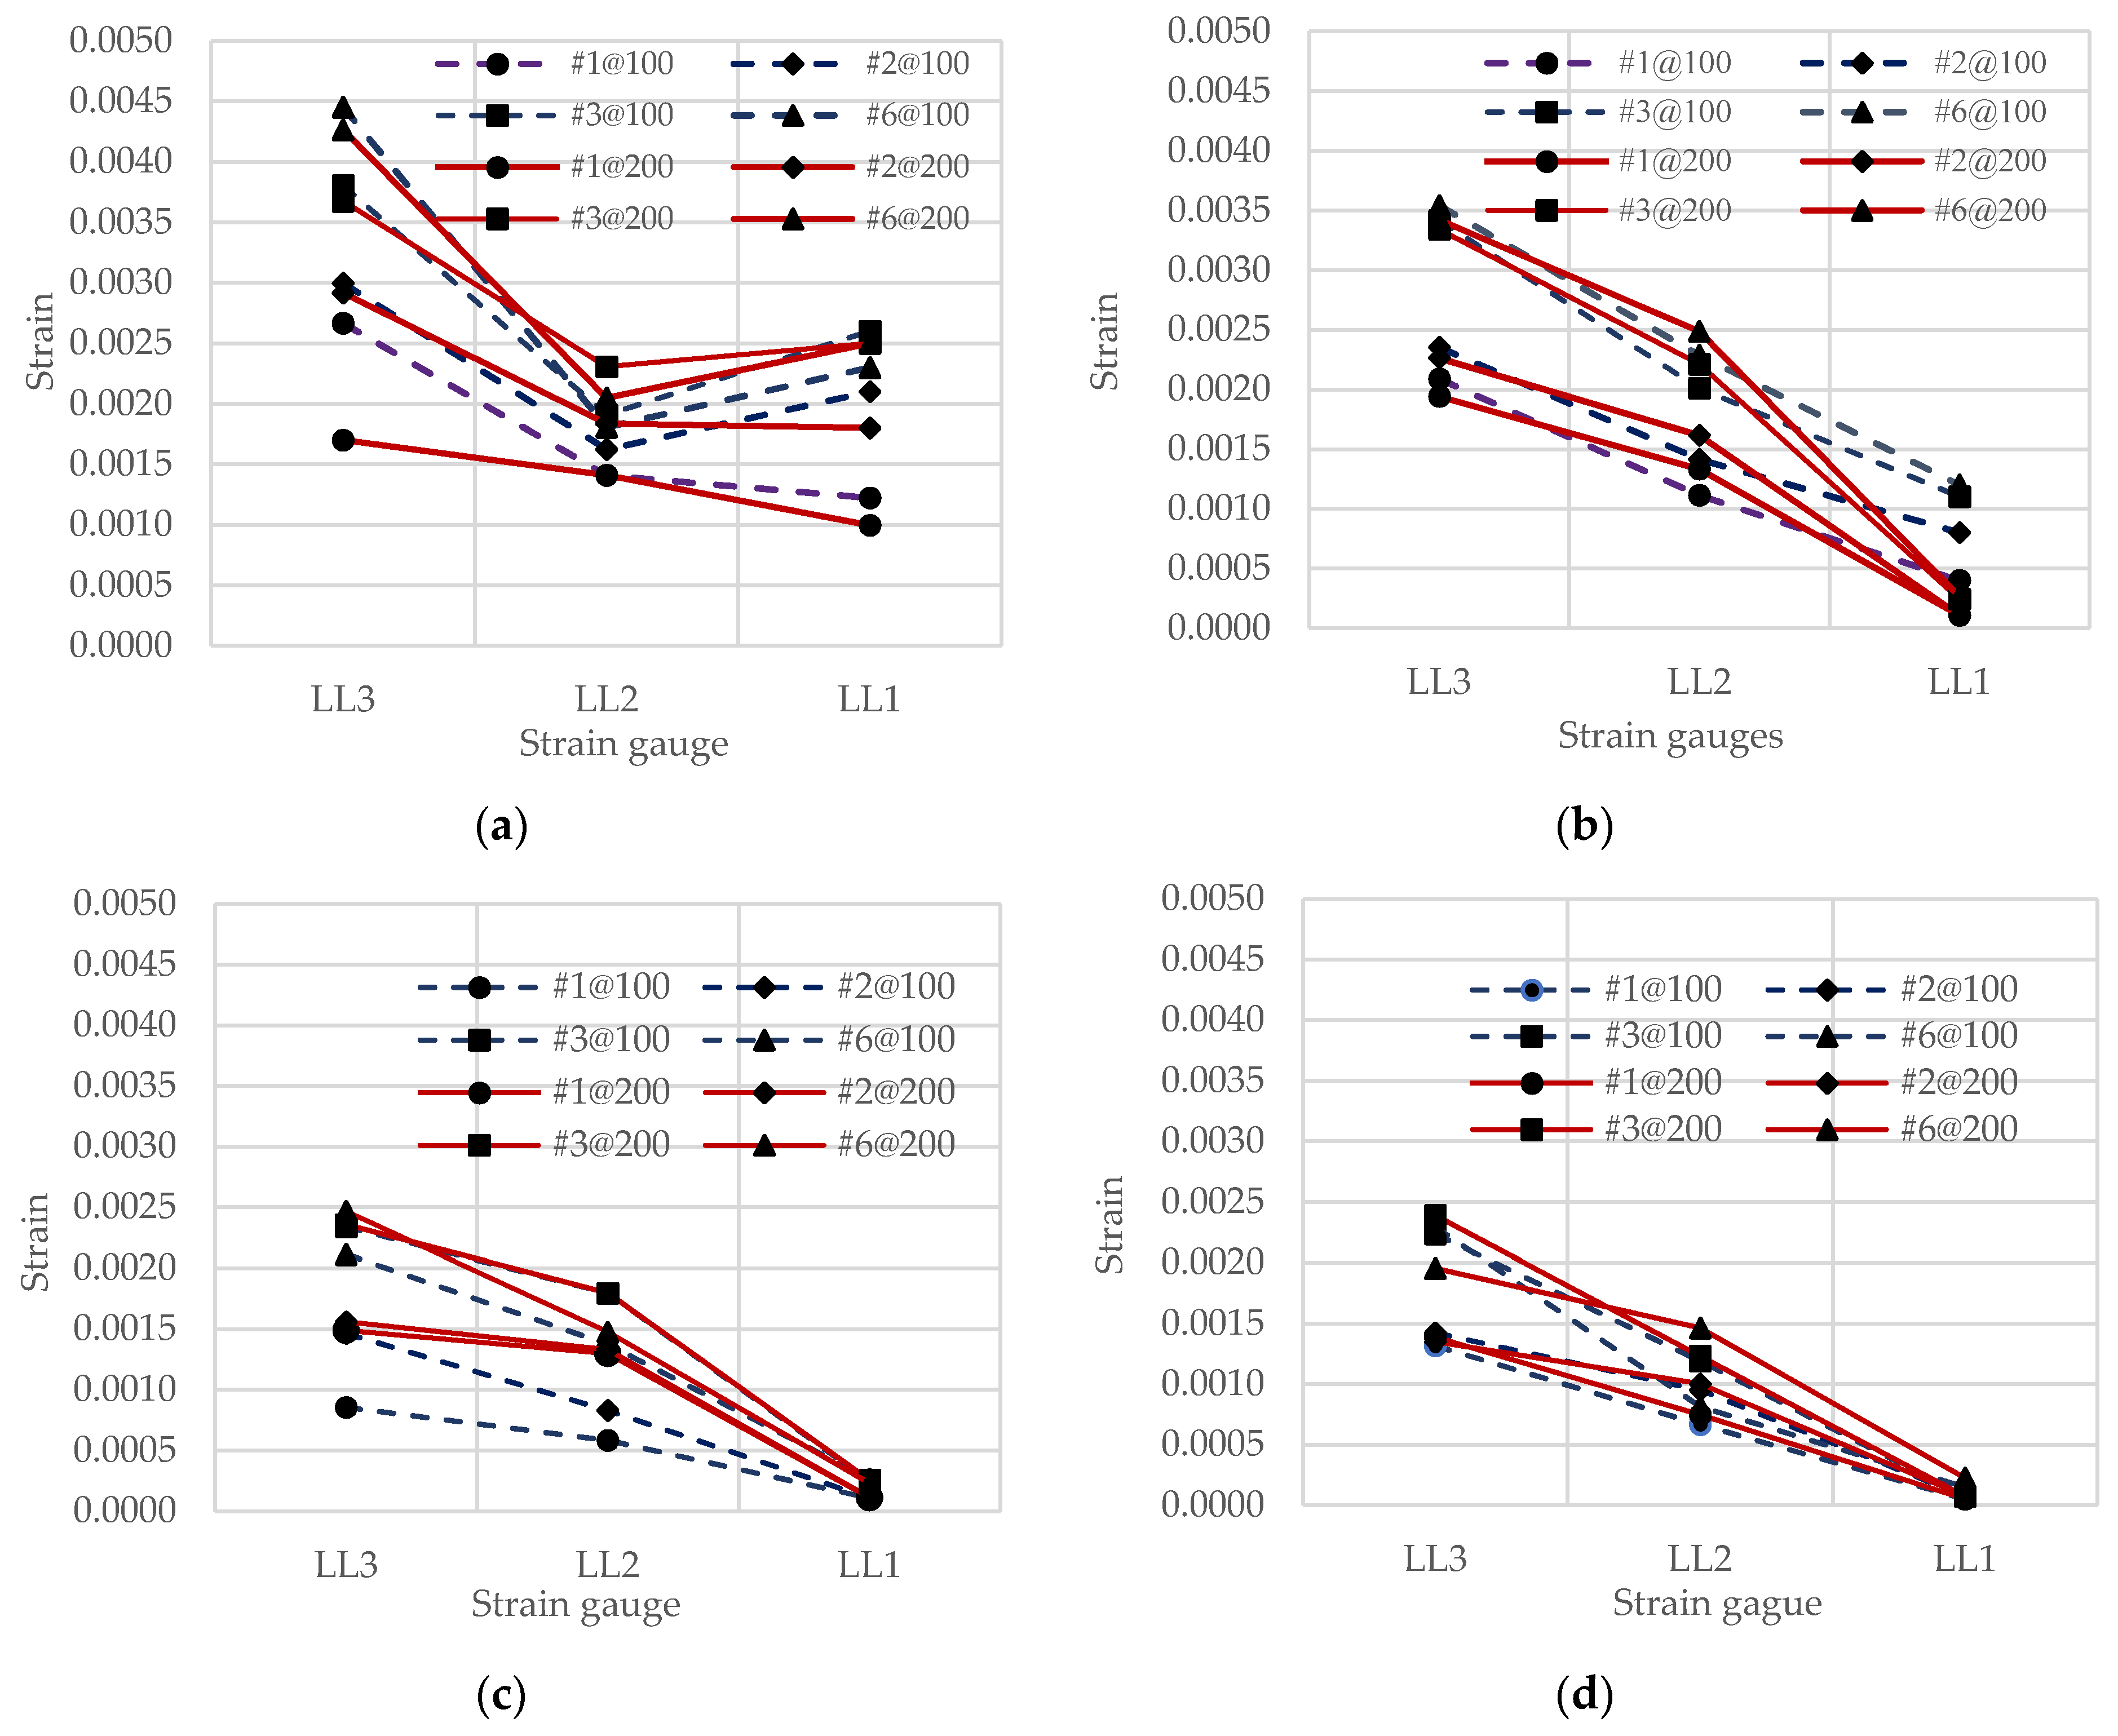
3.2. Strains of Longitudinal Reinforcement

From Figure 1, strain measurements of the longitudinal reinforcement were undertaken on the bottom bar at the midspan (Strain gauge no. LL3), 60 cm from the center (strain gauge no. LL2), and the top bar at the support (strain gauge no. LL1). Figure 6 shows the maximum strain of the longitudinal reinforcements at the three different locations under the sequential impact loads. With similar strain values, the figure omits the plot of the strains from the 3rd to 6th drops to reduce the number of lines for better observation. The dotted and thick lines represent the strain of specimens with the stirrup spacing of 100 and 200 mm, respectively. From the figures, the maximum tensile strain was at the midspan of the bottom reinforcement. The longitudinal strains were increased with the increase of the impact energy and the impact repetition. The strain of the longitudinal reinforcement was increased significantly from the 1st, 2nd, and 3rd drops. However, the strains after the 4th to the 6th drops were a little increased from the 3rd drop. This is because the 3rd drop caused a more severe diagonal shear crack (plug shear) near the impact point at the midspan. Hence, stress from the sequential drops was redistributed and concentrated on the diagonal crack and slightly increased the midspan longitudinal strain of the bottom reinforcement. The axial load decreased the tensile force generated by the impact loads. At the support, there was a significant tensile strain of the top reinforcement for non-axial load members. It is because the dynamic equilibrium causes the reversed negative bending moment near supports at the initial stages of the impact response. However, the tensile strain of the top reinforcement was nearly zero for the case of high axial load members (I21 and I28). For I28 specimens, strains at LL2 were also almost zero. Hence, it can be seen that a higher axial force increases the overall impact response and the local effect at the impact location is, therefore, the critical failure condition.

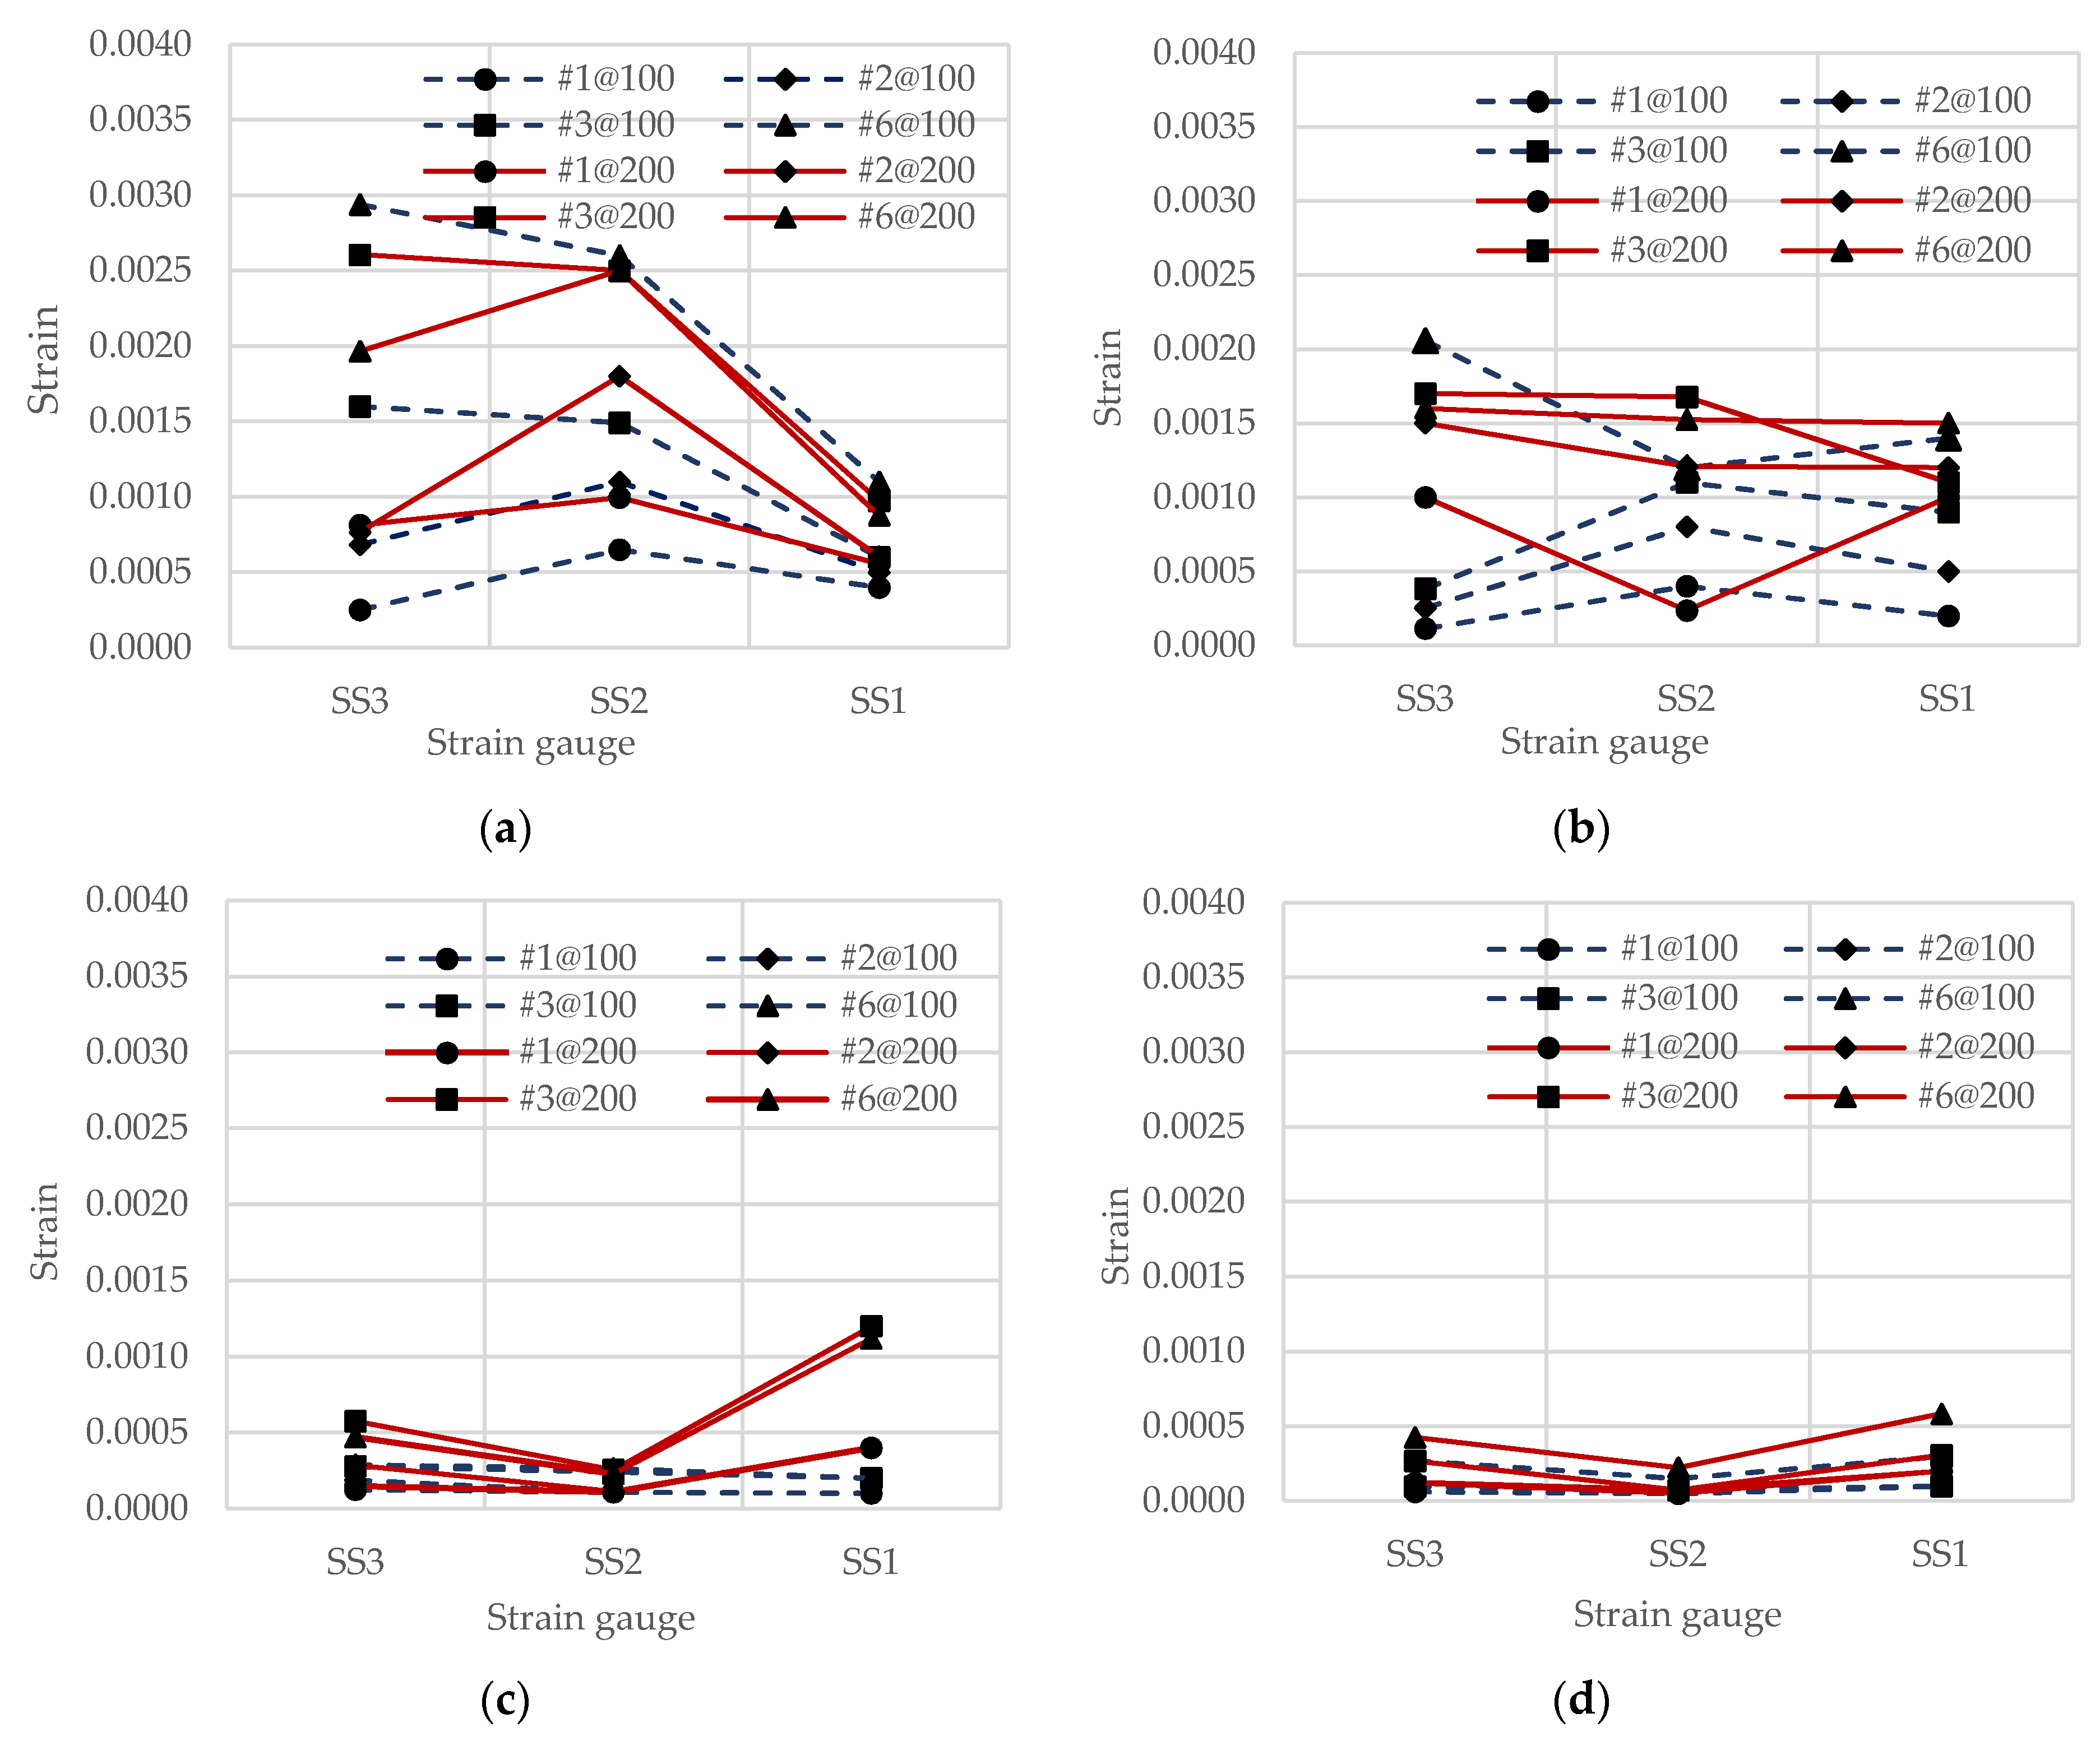
3.3. Strains of Stirrups
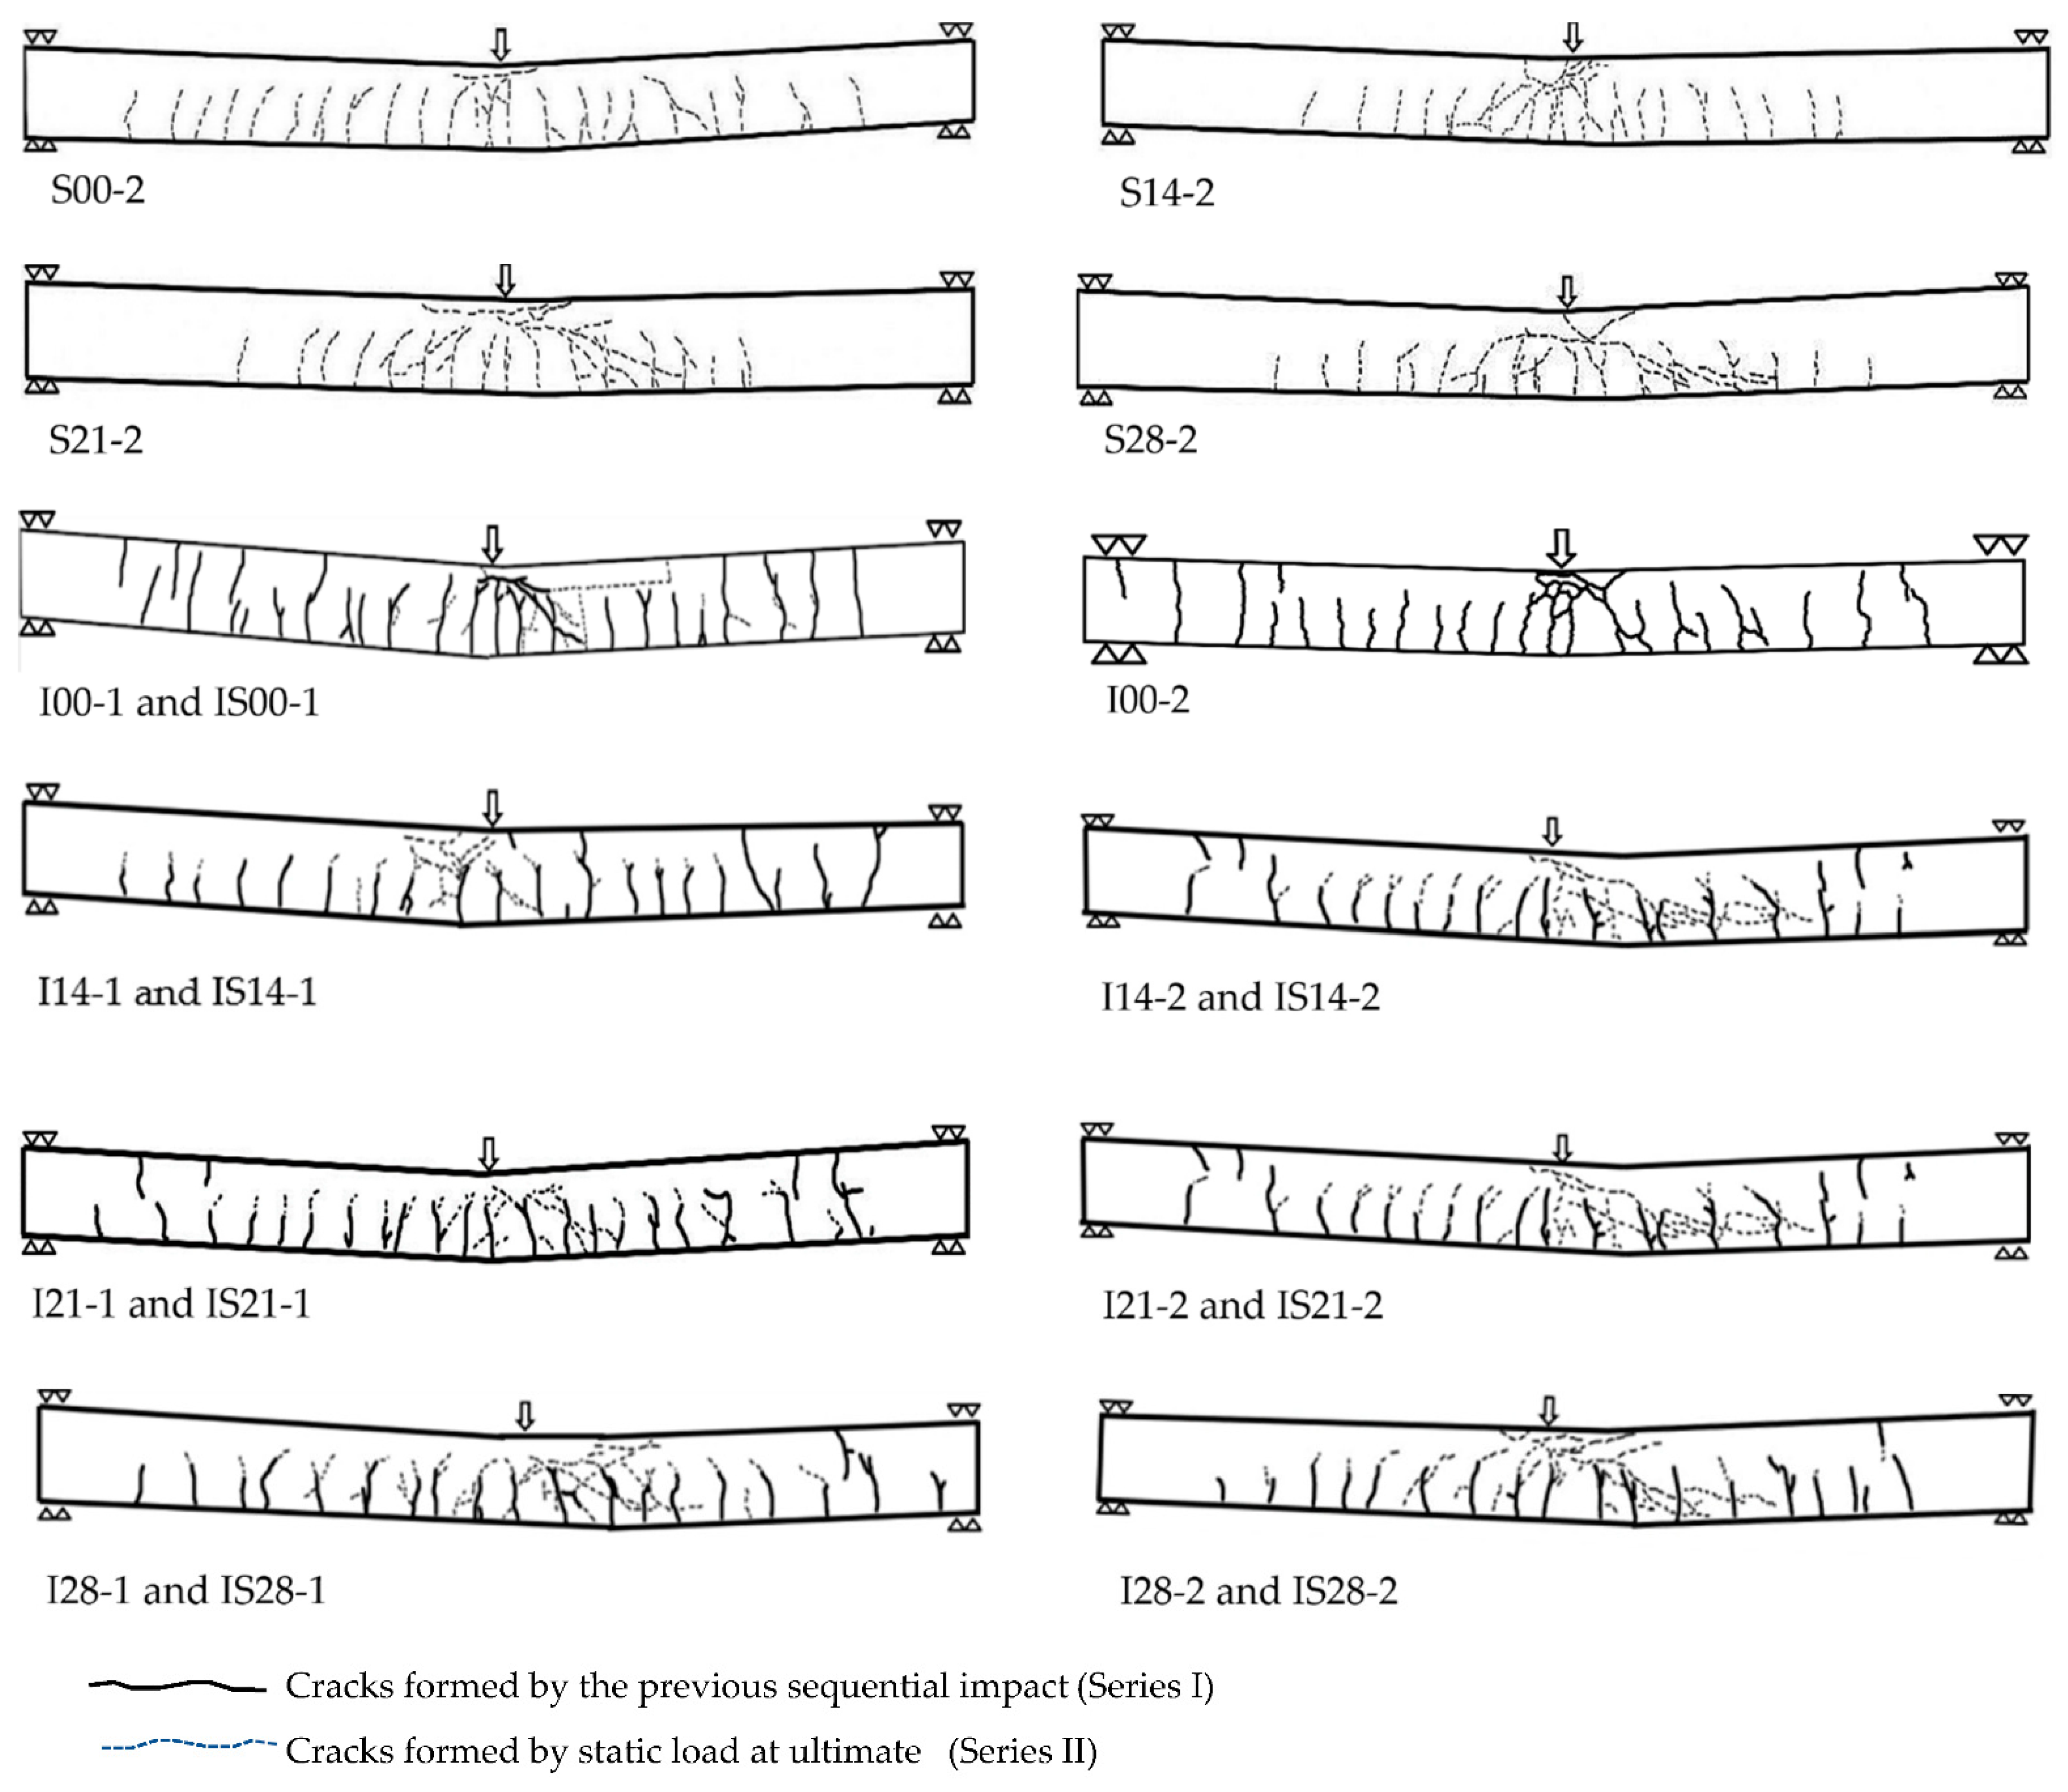
Strains of stirrups were measured at the three locations, as shown in Figure 1 with SS1, SS2, and SS3. The small amount of shear reinforcement with larger stirrup spacing (200 mm) was very weak in the shear plug failure mechanism. The specimens with less axial or non-axial loads showed that the stirrups strain at the impact area was higher than in other locations. The measured strains are shown in Figure 7.
From Figure 7, for specimens with the same amount of the axial load, the strains in stirrups of specimens with high spacing (200 mm) were higher than those with low spacing (100 mm). The increase of the strain under the impact repetition was seen, especially for the non-axial load specimens (I00-1 and I00-2). For the non-axial load specimen, strain at gauge SS2 was much higher than the strain in other locations, especially at the 3rd impact repetition. However, the strain at gauges SS1, SS2, and SS3 was almost the same for the specimens with higher axial load. The repetition of the impact load gently increased the strain. The values of the strain in stirrups are well related to the crack propagation discussed in the next section.

3.4. Crack Pattern

The crack patterns of the test specimens in Series I after the last impact are shown in Figure 8. At the first two impacts, for all specimens, flexural cracks around the midspan were found. There were no diagonal cracks. For the higher impacts (the 3rd–6th drops), local damage at the impact point and shear plug cracking were found for the specimens without axial load (I00-1 and I00-2). Specimen I00-2 with larger stirrup spacing was severely damaged by the local damage and shear plug failure (then, this specimen was not taken for the test in Series II). The axial load prevented the local damage and shear plug failure mechanism. The higher impact load increases the propagation of the previous flexural cracks. In addition, vertical cracks near the support that propagate from top to bottom were observed. Comparing the test specimens with different axial loads, the higher axial load reduces tensile stress leading to a small number of cracks, regardless of the stirrup spacing. In addition, it prevents the local damage at the impact point and shear plug failure mechanism.

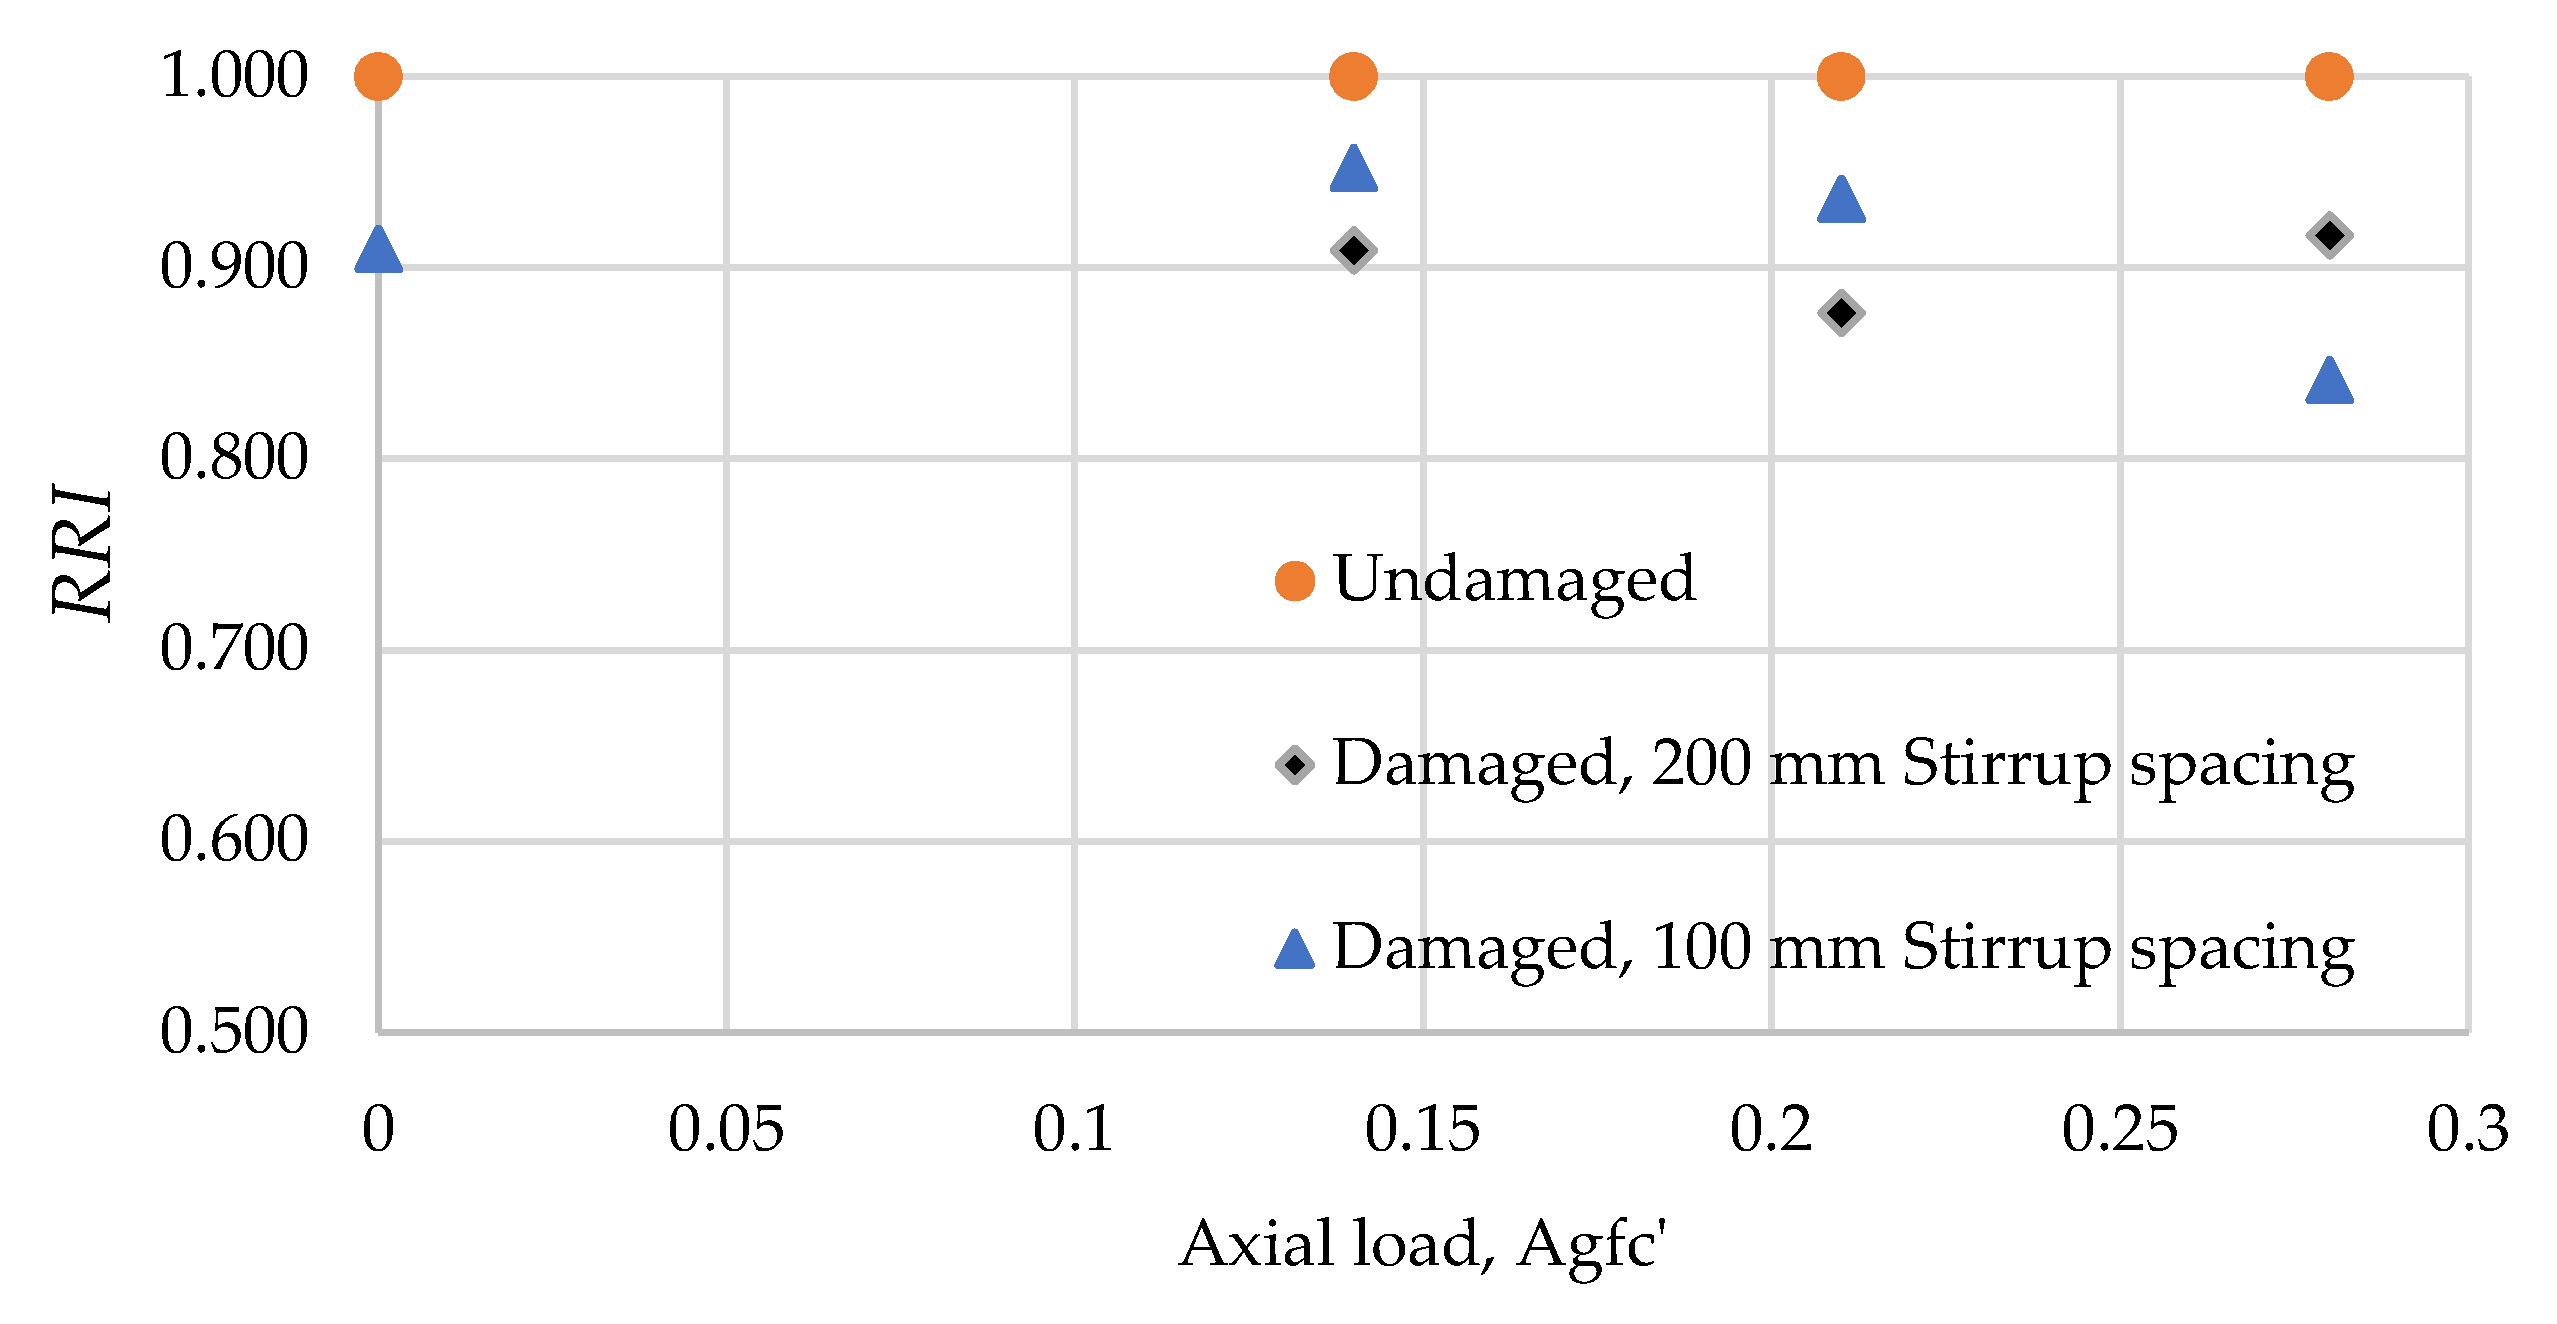
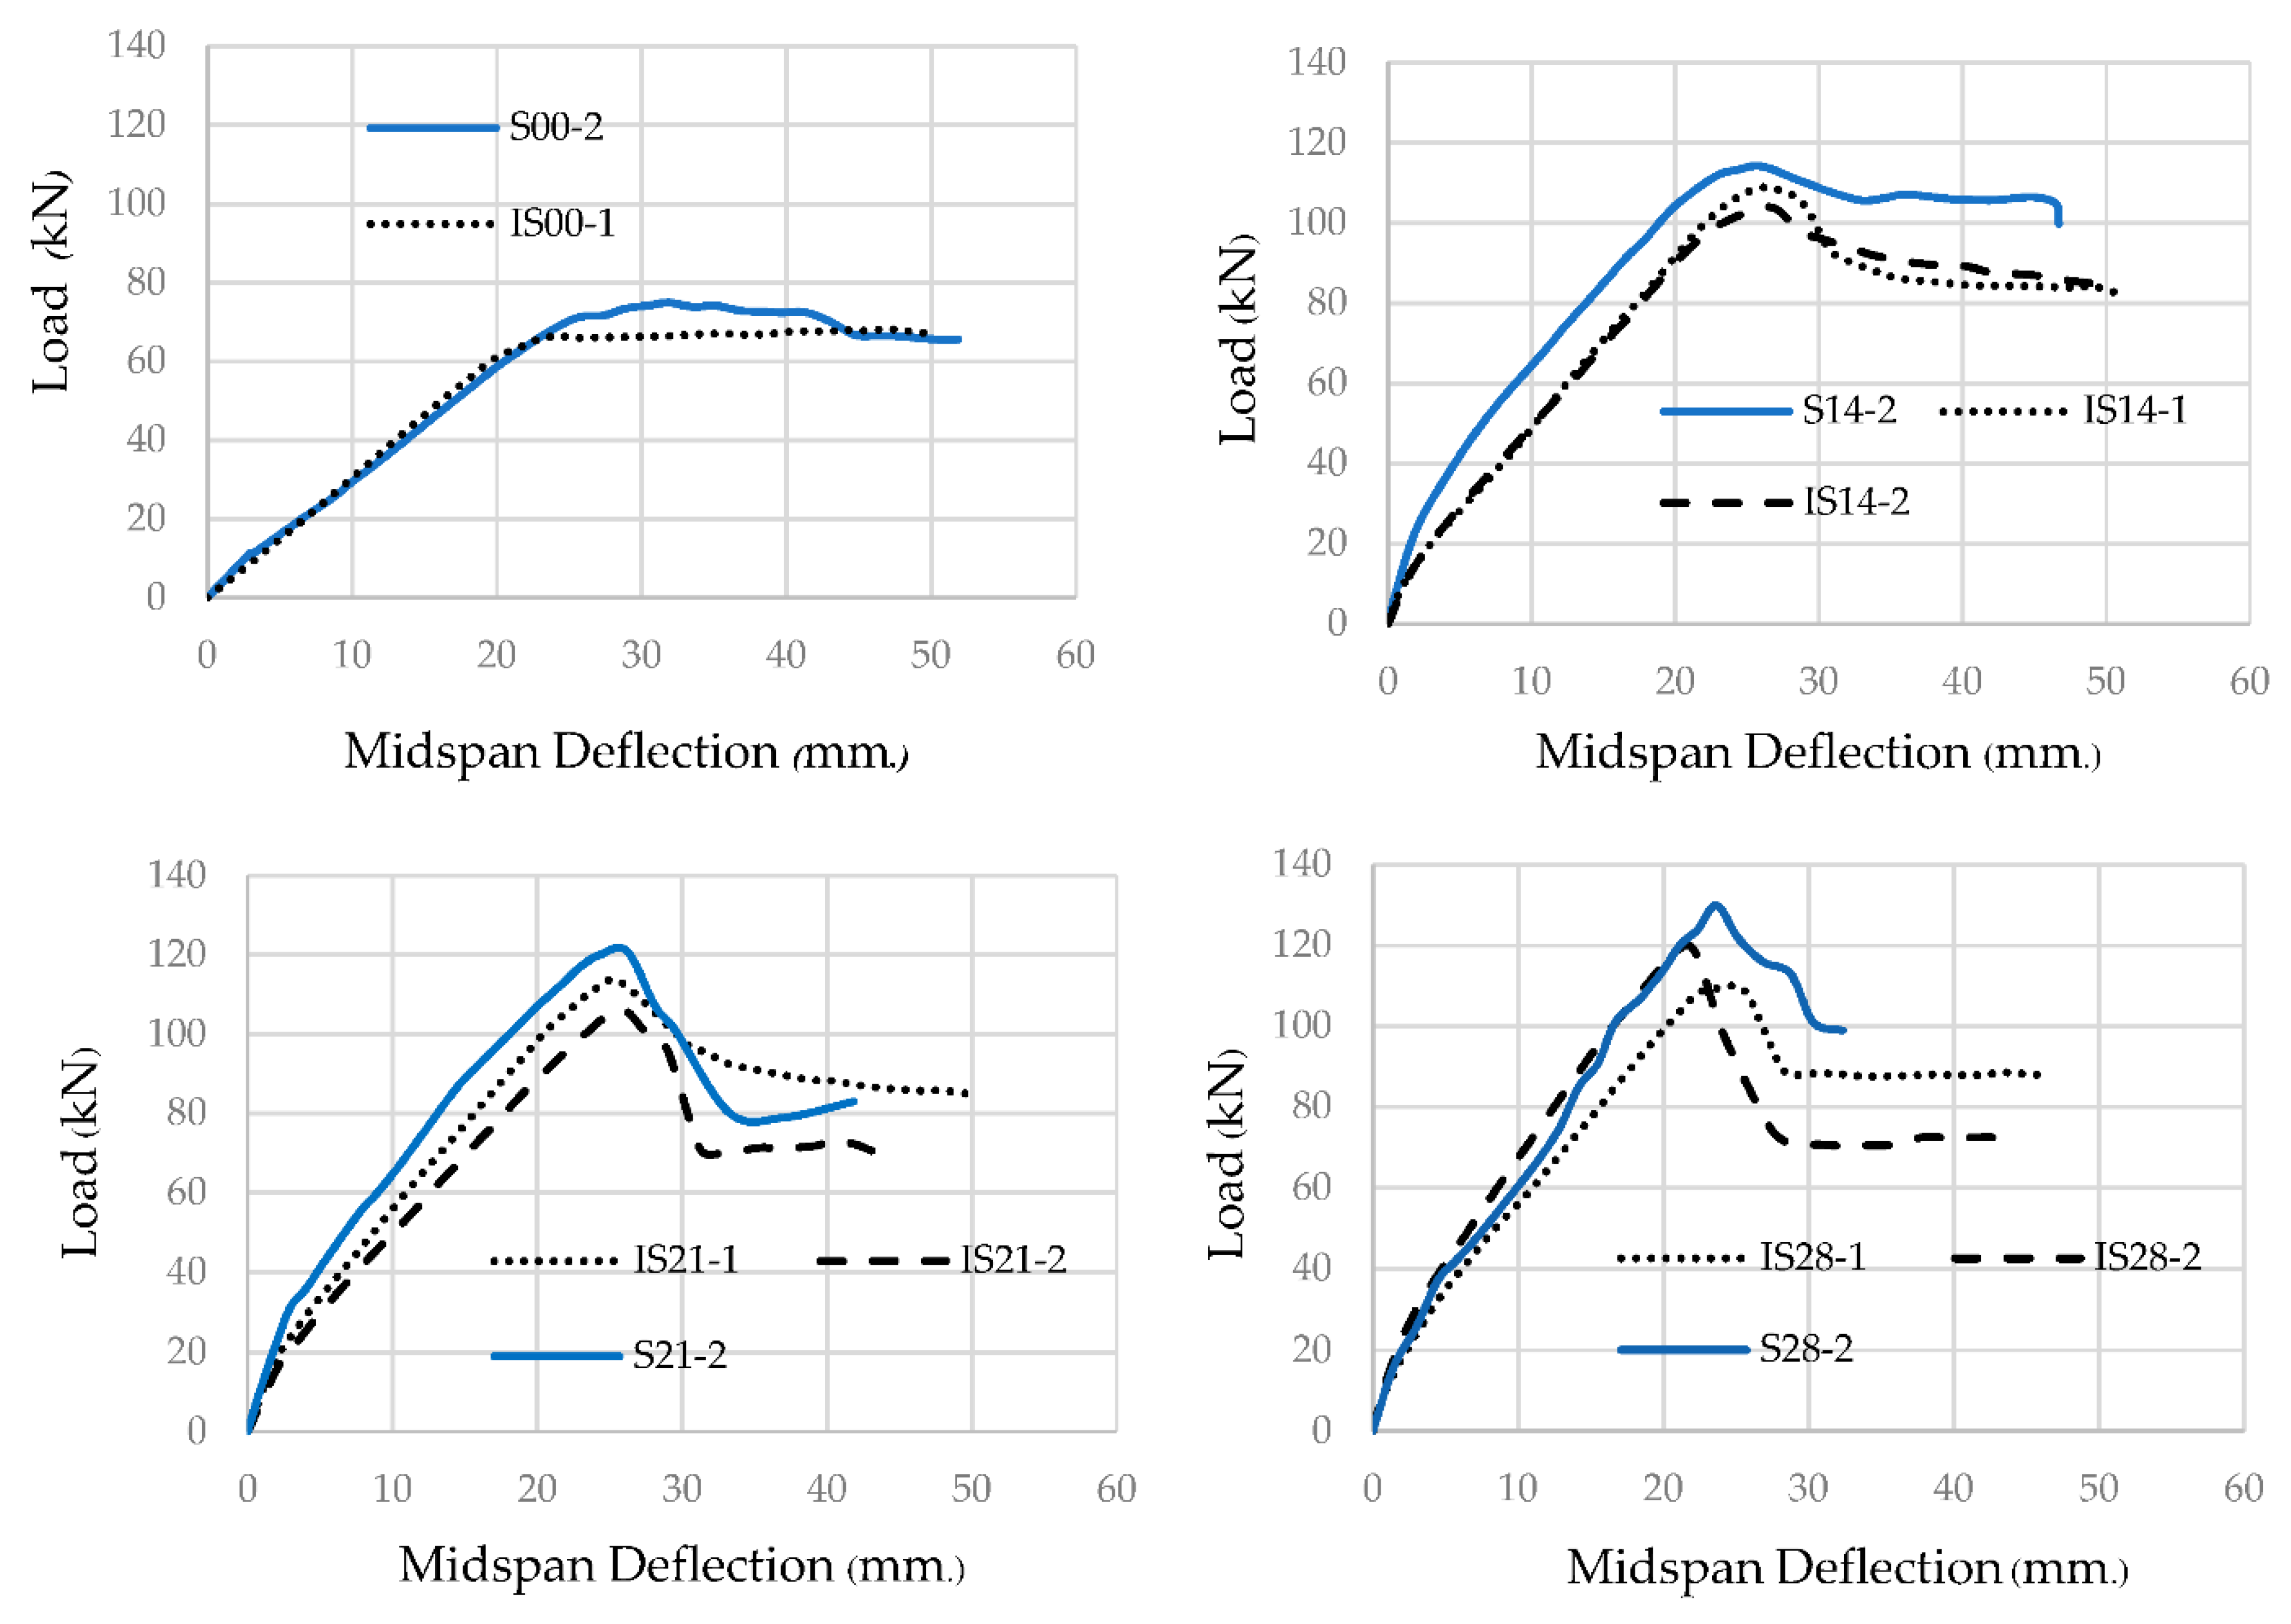
4. Static Reserved Strength

Ultimate static point load at midspan was applied to the undamaged and damaged specimens in the test Series II, as shown in Table 1. The capacity of the undamaged and damaged specimens with the same axial load were compared for the Residual Resistance Index, calculated as shown in Equation (2) [18]. Table 3 and Figure 9 show the ultimate capacity and the Residual Resistance Index (RRI) defined in Equation (2). It is shown that the index declines with the level of the axial load. Therefore, although the axial load increases the impact resistance, deterioration due to the sequential small impacts reduces the safety margin more. Figure 10 shows the load-midspan deflection curve of the specimens in the test Series II. The initial uncracked stiffness of the undamaged specimens is higher than those of the damaged specimens. However, after cracking, similar values of the stiffness are obtained. At the ultimate, crack patterns were observed, as shown in Figure 8. The thick line represents cracks generated by the prior sequential impact load, and the dotted line is the cracks formed by the ultimate static load. All specimens failed in the flexural mode. For the damaged specimens with axial load, the ultimate load is lower than the calculated concrete shear capacity, shown in Table 1. However, more severe diagonal shear cracks were found. It can be obviously said that the prior impact damage decreases the concrete shear capacity.
R R I = Ultimate   static   load   of   impact   damaged   specimens Ultimate   static   load   of   undamaged   specimens

5. Conclusions

These experimental works were conducted to determine responses of reinforced concrete beams under sequential small impact loads with each single small impact load that could not collapse the test specimens. However, the repetition deteriorated the impact responses, e.g., the increase of strains of reinforcements and crack propagation. The studied parameters were the magnitude of the axial load and the amount of shear reinforcement. From the tests, the results can be summarized as follows.
Under the sequential small impacts in Series I, with the increase of the axial load, the higher axial load results in better impact performances. The axial load reduces the tensile strain of the longitudinal reinforcement. Hence, the flexural tensile crack propagation is limited, which is well related to the strain values in the longitudinal reinforcement. In addition, the local damage at the impact location is minimized and the shear plug induced diagonal shear crack is prevented.
For the effect of stirrup spacing, the diagonal crack formed at the impact location was more severe for the largely spaced stirrup (200 mm) specimens. However, the axial force in the members was able to diminish the adverse effect of the large spacing. Large impact load could alter the failure of a designed flexural critical reinforced concrete beam without axial load to the shear failure, as seen in specimen I00-2.
For the ultimate static test of undamaged and damaged specimens in Series II, although the axial load improves the impact response, the Residual Resistance Index (RRI) decreases with axial load. For the damaged specimens with axial load, the ultimate load is lower than the calculated concrete shear capacity. However, more severe diagonal shear cracks were found. It can be obviously said that the prior impact damage decreases the concrete shear capacity. The RRI values are slightly varied between 0.841 and 0.952. It is because the sequential impacts induce a low level of accumulated damage.
The sequential impact test in this study is two 0.35 m drops and four 0.70 m drops. The results of this research work are limited to the number of impact repetitions and the dropping height. Although the results indicate the reduction in the residual resistance index (RRI), higher dropping heights and more impact repetition are recommended for future works.

Author Contributions

C.H.: conceptualization, methodology, analysis, writing for the original draft, review, editing. S.L. and H.Z.: validation and review. T.I.: review and editing. All authors contributed to the article and approved the submitted version. All authors have read and agreed to the published version of the manuscript.

Funding

This research was funded by Chiang Mai University; TRF Research Scholar (RSA6280039); and TRF Senior Research Scholar (RTA6280012). The APC was funded by Chiang Mai University (NRCT (FF65-CMU)) and the National Research Council of Thailand (NRCT5-RSA63019-04). The authors would like to express their special gratitude to the supports from the British Council (UK-China-BRI Countries Education Partnership Initiative).

Institutional Review Board Statement

Not applicable.

Informed Consent Statement

Not applicable.

Data Availability Statement

All datasets presented in this study are included in the article.

Acknowledgments

The authors would like to acknowledge Piboon Concrete Co., Ltd. for supporting the experimental work. This project was also supported by the Capacity Enhancement and Driving Strategies for Bilateral and Multilateral Cooperation for 2021 (Thailand and United Kingdom).

Conflicts of Interest

The authors declare no conflict of interest.

References

  1. Hansapinyo, C.; Wongmatar, P.; Vimonsatit, V.; Chen, W. Pounding of Seismically Designed Low-rise Reinforced Concrete Frames. Proc. Inst. Civ. Eng. Struct. Build. 2018, 11, 172. [Google Scholar] [CrossRef]
  2. Do, T.V.; Pham, T.M.; Hao, H. Numerical Investigation of the Behavior of Precast Concrete Segmental Columns Subjected Vehicle Collision. Eng. Struct. 2018, 156, 375–393. [Google Scholar] [CrossRef] [Green Version]
  3. Jahami, A.; Temsah, Y.; Khatib, J. The efficiency of using CFRP as a strengthening technique for reinforced concrete beams subjected to blast loading. Int. J. Adv. Struct. Eng. 2019, 11, 411–420. [Google Scholar] [CrossRef] [Green Version]
  4. Jahami, A.; Temsah, Y.; Khatib, J.; Baalbaki, O.; Kenai, S. The behavior of CFRP strengthened RC beams subjected to blast loading. Mag. Civ. Eng. 2021, 103, 10309. [Google Scholar] [CrossRef]
  5. American Association of State Highway & Transportation Officials. AASHTO LRFD Bridge Design Specifications, 8th ed.; AASHTO: Washington, DC, USA, 2017. [Google Scholar]
  6. European Committee for Standardization. Eurocode 1: Actions on Structures—Part. 1-1: General Actions, Densities, Self-Weight, Imposed Loads for Buildings, (ANNEX B) BS EN 1991-1-1:2002; European Committee for Standardization: Brussels, Belgium, 2004. [Google Scholar]
  7. Wongmatar, P.; Hansapinyo, C.; Vimonsatit, V.; Chen, W. Recommendations for Designing Reinforced Concrete Beams Against Low Velocity Impact Loads. Int. J. Struct. Stab. Dyn. 2018, 18, 1850104. [Google Scholar] [CrossRef]
  8. Zhao, D.B.; Yi, W.J.; Kunnath, S.K. Shear Mechanism in Reinforced Concrete Beams under Impact Loading. J. Struct. Eng. 2017, 143, 04017089. [Google Scholar] [CrossRef]
  9. Saatci, S.; Vecchio, F.J. Effects of Shear Mechanisms on Impact Behavior of Reinforced Concrete Beams. ACI Struct. J. 2009, 106, 78–86. [Google Scholar]
  10. Kishi, N.; Mikami, H.; Matsuoka, K.G.; Ando, T. Impact Behavior of Shear-Failure-Type RC Beams Without Shear Rebars. Int. J. Impact Eng. 2002, 27, 955–968. [Google Scholar] [CrossRef]
  11. Fujikake, K.; Li, B.; Soeun, S. Impact Response of Reinforced Concrete Beam and Its Analytical Evaluation. J. Struct. Eng. 2009, 135, 938–950. [Google Scholar] [CrossRef]
  12. Tantrapongsaton, W.; Hansapinyo, C.; Wongmatar, P.; Chaisomphob, T. Flexural Reinforced Concrete Members with Minimum Reinforcement Under Low-Velocity Impact Load. Int. J. 2018, 14, 129–136. [Google Scholar] [CrossRef]
  13. Zhao, W.; Qian, J. Dynamic Response and Shear Demand of Reinforced Concrete Beams Subjected to Impact Loading. Int. J. Struct. Stab. Dyn. 2019, 19, 1950091. [Google Scholar] [CrossRef]
  14. Tantrapongsaton, W.; Hansapinyo, C. Impact Response of Reinforced Concrete Columns with Different Axial Load under Low-Velocity Impact Loading. Key Eng. Mater. 2019, 803, 322–330. [Google Scholar] [CrossRef]
  15. Chen, W.; Hao, H.; Chen, S. Numerical Analysis of Prestressed Reinforced Concrete Beam Subjected to Blast Loading. Mater. Des. 2015, 65, 662–674. [Google Scholar] [CrossRef]
  16. Li, H.; Chen, W.; Pham, T.M.; Hao, H. Analytical and Numerical Studies on Impact Force Profile of RC beam Under Drop Weight Impact. Int. J. Impact Eng. 2021, 147, 103743. [Google Scholar] [CrossRef]
  17. Lui, B.; Fan, W.; Guo, W.; Chen, B.; Liu, R. Experimental Investigation and Improved FE Modeling of Axially-Loaded Circular RC Columns Under Lateral Impact Loading. Eng. Struct. 2017, 152, 619–642. [Google Scholar] [CrossRef]
  18. Adhikary, S.D.; Li, B.; Fujikake, K. Residual Resistance of Impact Damaged Reinforced Concrete Beams. Mag. Concr. Res. 2015, 67, 364–378. [Google Scholar] [CrossRef]
  19. Huang, Z.; Chen, W.; Hao, H.; Chen, Z.; Pham, T.M.; Tran, T.T.; Elchalakani, M. Flexural Behaviour of Ambient Cured Geopolymer Concrete Beams Reinforced with BFRP Bars under Static and Impact Loads. Compos. Struct. 2020, 261, 113282. [Google Scholar] [CrossRef]
  20. Huang, Z.; Chen, W.; Tran, T.T.; Pham, T.M.; Hao, H.; Chen, Z.; Elchalakani, M. Experimental and Numerical Study on Concrete Beams Reinforced with Basalt FRP Bars under Static and Impact Loads. Compos. Struct. 2021, 263, 113648. [Google Scholar] [CrossRef]
  21. Tran, T.T.; Pham, T.M.; Huang, Z.; Chen, W.; Hao, H.; Elchalakani, M. Impact Response of Fibre Reinforced Geopolymer Concrete Beams with BFRP Bars and Stirrups. Eng. Struct. 2021, 231, 111785. [Google Scholar] [CrossRef]
  22. Tamai, H.; Sonoda, Y.; Bolander, J.E. Impact resistance of RC beams with reinforcement corrosion: Experimental observations. Constr. Build. Mater. 2020, 263, 120638. [Google Scholar] [CrossRef]
  23. ACI Committee 318. Building Code Requirements for Reinforced Concrete; American Concrete Institute: Detroit, MI, USA, 2014. [Google Scholar]
  24. Norton, R.L. Machine Design: An Integrated Approach, 4th ed.; Prentice Hall: Hoboken, NJ, USA, 2010. [Google Scholar]
  25. Comité Euro-International du Béton. Concrete Structures under Impact and Impulsive Loading; Bulletin d’Information CEB; No. 187; CEB Bulletins: Lausanne, Switzerland, 1988. [Google Scholar]
  26. Malvar, L.J.; Ross, C.A. Review of strain rate effects for concrete in tension. ACI Mater. J. 1998, 95, 735–739. [Google Scholar]
  27. Yan, D.; Lin, G. Dynamic properties of concrete in direct tension. Cem. Concr. Res. 2006, 36, 1371–1378. [Google Scholar] [CrossRef]
  28. Malvar, L.J. Review of static and dynamic properties of steel reinforcing bars. ACI Mater. J. 1998, 95, 609–616. [Google Scholar]
  29. Hao, Y.; Hao, H. Influence of the concrete DIF model on the numerical predictions of RC wall responses to blast loadings. Eng. Struct. 2014, 73, 24–38. [Google Scholar] [CrossRef]
Figure 1. Dimensions and strain gauge locations (unit: m): (a) 100 mm stirrup spacing; (b) 200 mm stirrup spacing.
Buildings 11 00518 g001
Figure 2. Cross-section and location of prestressing wires (not scaled): (a) 0.00 A g f c ; (b) 0.14 A g f c ; (c) 0.21 A g f c ; (d) 0.28 A g f c .
Buildings 11 00518 g002
Figure 3. Experimental setup.
Buildings 11 00518 g003
Figure 4. Impact load time history: (a) specimen I00-1 and (b) specimen I28-2.
Buildings 11 00518 g004
Figure 5. Midspan deflection time history: (a) specimen I00-1 and (b) specimen I28-2.
Buildings 11 00518 g005
Figure 6. Strains of longitudinal reinforcements: (a) specimens I00-1 and I00-2, (b) specimens I14-1 and I14-2, (c) specimens I21-1 and I21-2, and (d) specimens I28-1 and I28-2.
Buildings 11 00518 g006
Figure 7. Strains of stirrups: (a) specimens I00-1 and I00-2, (b) specimens I14-1 and I14-2, (c) specimens I21-1 and I21-2, and (d) specimens I28-1 and I28-2.
Buildings 11 00518 g007
Figure 8. Crack propagation of specimens.
Buildings 11 00518 g008
Figure 9. Residual Resistance Index with different axial loads.
Buildings 11 00518 g009
Figure 10. Load-midspan deflection curves from the static load tests (Series II).
Buildings 11 00518 g010
Table 1. Specimen descriptions.
Test No.Test SpecimenAxial Load
(% A g f c )
Stirrup Spacing
(s, mm)
Calculated Static Capacity (P at Midspan)
Bending Capacity, Pf (kN)Shear Capacity *, Pv (kN) Capacity Ratio (Pf/Pv)
Series I: Sequential impact load at midspan
1I00-10.0010067.86(83.13 + 64.10) 147.230.461
2I00-20.0020067.86(83.13 + 32.05) 115.180.589
3I14-10.1410089.30(112.40 + 64.10) 176.500.506
4I14-20.1420089.30(112.40 + 32.05) 144.450.618
5I21-10.2110098.84(127.03 + 64.10) 191.130.517
6I21-20.2120098.84(127.03 + 32.05) 159.080.621
7I28-10.28100107.34(141.67 + 64.10) 205.770.522
8I28-20.28200107.34(141.67 + 32.05) 173.720.618
Series II: Ultimate static load at midspan
9S00-20.0020067.86(83.13 + 32.05) 115.180.589
10S14-20.1420089.30(112.40 + 32.05) 144.450.618
11S21-20.2120098.84(127.03 + 32.05) 159.080.621
12S28-20.28200107.34(141.67 + 32.05) 173.720.618
13IS00-10.00100Damaged specimens from Series I and the calculated static capacity is not included.
14IS14-10.14100
15IS14-20.14200
16IS21-10.21100
17IS21-20.21200
18IS28-10.28100
19IS28-20.28200
Note: * The two numbers in parentheses are the concrete and shear reinforcement contributions, respectively.
Table 2. Peak impact force.
TestPeak Impact Force, kN
1st2nd3rd4th5th6th
I00-1194.8184.4373.7190.5176.1224.5
I00-2207.8174.9221.5340.3336.1247.5
I14-1276.0172.3263.4293.6314.2268.3
I14-2199.3183.7325.6219.3238.9318.0
I21-1186.4178.4303.3352.0291.0323.4
I21-2190.6211.4202.4284.3292.9316.7
I28-1232.3235.7312.3205.4279.0245.0
I28-2263.0214.9331.8344.8273.4308.5
Table 3. Ultimate static capacity and Residual Resistance Index (RRI).
SpecimenAxial LoadUltimate Static Load (kN)RRI
S00-2074.901.000
IS00-1068.170.910
S14-20.14114.101.000
IS14-10.14108.680.952
IS14-20.14103.750.909
S21-20.21121.001.000
IS21-10.21113.280.936
IS21-20.21106.070.877
S28-20.28130.001.000
IS28-10.28109.390.841
IS28-20.28119.220.917
Publisher’s Note: MDPI stays neutral with regard to jurisdictional claims in published maps and institutional affiliations.

