1. Introduction
Three-dimensional printing has recently emerged as a robust sector that is rapidly evolving to revolutionize industrial processes. In general, fused filament fabrication (FFF), also known as FDM, is one of the most traditional, affordable, and easy to use 3D printing technology. Although there are many alternative meanings for 3D printing technology, according to ISO/ASTM 52900:2015, 3D printing is defined as: “the fabrication of objects through the deposition of a material using a print head, nozzle, or another printer technology”, while additive manufacturing (AM) is “the process of joining materials to make parts from 3D model data, usually layer upon layer” [
1,
2]. Three-dimensional printing is currently used in several industries, including mechanical, electrical, biomedical, and aerospace, to boost design fabricating, reduce lead times, and minimize the tooling costs of new parts to be produced. Three-dimensional printing is distinct, when compared with techniques of traditional machines, such as grinding, milling, and spinning, which were used to build objects several decades earlier. However, these machines have not been used as much in recent years, due to certain shortcomings and restrictions, including the high cost of manufacturing processes. Despite these shortcomings and restrictions, the principle of 3D printing is considered as part of the manufacturing processes, since it is considered a significant field of prototyping that enables the creation of 3D digital models. Additive manufacturing is described as laying down a particular material layer-by-layer to form the object according to the specifications. The horizontal cross-section of the substance is made up of specific layers that are stacked one on top of the other. The consistency of an item printed using a 3D printer is determined by the type of material used, the printing process, the printer’s speed, the kind of 3D printer, and the size of the printed parts. In general, due to its significant contribution to the manufacturing industry and construction applications, 3D printing has benefited the world in a variety of ways [
3,
4]. Other fields have also benefited from this breakthrough, such as prototyping, simulations, and failure mechanisms [
5,
6]. The construction and aerospace industries are two sectors that have benefited from 3D printing technology, due to the extensive and varied applications that 3D printing can offer for both industries [
7]. In addition, 3D printing technology has begun to be adopted at various schools and universities, as well [
8,
9,
10].
In essence, there is a substantial increase in the use of plastics from the additive manufacturing sector, since several plastic products can also be utilized in AM processes, providing great flexibility in creating complex designs. Furthermore, the commercial 3D printing filament material market volume is rapidly growing, and the most popular filament materials are polylactic acid (PLA) and acrylonitrile–butadiene–styrene (ABS), holding about 47% and 29% of the market share, respectively [
11]. There are a variety of tools that 3D printers use to print objects, with the operation beginning with a 3D CAD model, converted to a format that the 3D printer can understand, and ending with the production of an actual physical component [
12]. In specific methods, the substance used to create the object layers must be liquefied or weakened. In some cases, a high-powered ultraviolet (UV) laser is used to cure photo-reactive resin and print the product; while, in other cases, a low-powered UV laser is used [
13]. There are widely used 3D printing methods [
14,
15,
16,
17,
18], such as stereolithography (SLA), digital light processing (DLP), electronic beam melting (EBM), laminated object manufacturing (LOM), fused deposition modelling (FDM), and selective laser sintering (SLS).
1.1. Potential Applications of 3D Printing
Design prototypes: models for testing and optimizing design and packaging include a three-dimensional printing concept model, practical porotypes, and presentation models [
19,
20].
Education: bring interactive ideas to life to engage students, transforming their concepts into tangible 3D color models they can keep in their hands [
21,
22].
Healthcare: reduce running time by rapidly creating 3D models; patients’ results will be improved, due to the enhancement of patient care [
23,
24].
Architecture: create design models, smooth, accurate architectural models in various materials, including rigid photopolymers, in a short amount of time [
18].
Construction: create reliable, cost-effective, non-structural, and non-load bearing construction building components, such as lightweight masonry blocks, light weight concrete face bricks, hourdi slab blocks, tiles, partition walls, and fillers [
25,
26].
1.2. Types of Infill
A 3D parts’ filling has many functions at once. Internal form, on the one hand, occupies the object’s void. On the other hand, the weight, as well as it, may be adjusted. The pattern and filament are used to determine the weight, since not all filaments are the same weight. Another advantage of infill is that it allows 3D printers to print horizontal flat edges easily and effectively along with void. Three-dimensional printers would be unstable and lack structure if this filling was not present. It is worth noting that infill strengthens structures and prevents cracking too quickly. Infills are essential aspects of three-dimensional printing that can be used in a variety of ways. Optimize the infill by choosing from a variety of designs, styles, densities, and alignments [
27,
28]. While, theoretically, there are an infinite number of infill configurations, only three standard infills are commonly used in 3D printing: solid, light, and ultra-light infill. The three types of infill configurations were demonstrated by Yap et al. [
18]. The three different infill patterns have different densities that depend on the profile of the pattern.
There is a wide range of factors, but the common parameters among all technologies are layer thickness, build orientation, infill pattern, and temperature [
28]. Other factors, such as humidity, material properties, and environment, also have effects on the printing process. Unfortunately, controlling these factors is complex and they may change the mechanical properties of final products. Besides, there are other limitations, such as staircase defects in AM, that are highly effective on surface texture [
29]. Many technologies are involved in AM and have various features, but FDM or material extrusion is one of the most common and widely used technologies [
30].
1.3. Standard Deviation and Tolerance
The standard deviation (
) is a metric that calculates the variation of a data set concerning its mean, and the square root of the variance is used to measure it. A low standard deviation means that data is clustered around the mean, while a high standard deviation indicates that data is more dispersed [
31].
The tolerance, on the other hand, is a dimensional precision. Machining tolerances refer to the amount of variation in a part’s dimension, created by the production process. Since no computer can keep dimensions properly, dimensional tolerances are added to components as constraints of the required structure, with adequate levels of dispersion set. The critical issue is what tolerance could be removed without affecting individual parameters or device outcomes. Once a component has been made with out-of-tolerance dimensions, it becomes unusable because the key features of this component were not designed with that in mind [
32].
1.4. Process Capability and Performance Indicators
A method is a set of interconnected processes, steps that absorb data and translate inputs to outputs. Any stage results in the achievement of a desired goal or outcome. Each procedure has a limited degree of variance. It is not possible to element system variability; however, we can control and regulate it by using process controllers, taking samples, and using safe and well-maintained tools. System variability may have less impact on output efficiency. The method is capable of reliably yielding a good result. We would be able to retain process capability. Process capability compares the output of an in-control process to the specification limits by using capability indices. The comparison is made by forming the ratio of the spread between the process specifications to the spread of the process values, as measured by six process standard deviation units. Any quality control process needs to quantify the machine capability in one continuous production run and the manufacturing process capability in series production [
33,
34]. Measurement process capability provides the evidence for conformity or nonconformity with specification, according to ISO 14253:2017 [
35,
36].
Process capability (Cp) is a statistical indicator of a process’s ability to manufacture components under defined limitations reliably. Based on the process state and the way of determining the values of the standard deviation value, the Cp, process capability index (Cpk), preliminary process capability (Pp), and preliminary process capability Index (Ppk) are measured to decide how the system works. The Cp and Cpk calculations use sample variance, or deviation mean in rational subgroups, while the Pp and Ppk are calculated using standard deviation, based on the data analyzed (whole population). In statistical control, the indices Cp and Cpk measure fundamental well-built-up procedures. The Pp and Ppk indices assess a novel or statistical system [
37].
Indicators of process capability Cp and Cpk assess the process’s success, regarding the tolerance range and goal value, which serve as specification constraints. Cp indicates whether your device can produce parts within limits, while Cpk indicates whether the machine measurements are within the limited tolerance. Engineers should consider the capabilities of the process when designing components. The Cp index is an essential metric for determining a mechanism’s capability. Customers define process goals for those demand levels, which are then used to determine capability. In essence, the applicable limits that customers have already considered are the upper specification limit (USL) and lower specification limit (LSL). The general equation to calculate the Cp, considering the USL, the LSL, and the standard deviation (
), is as follows [
38]:
In general, specification limit is set by the customer or the designer of engineering components and usually referred to the voice of the customer because they represent the values that the designer or customer requires; they are the limits on the product characteristics that define where the product will or will not work, and if the products falls outside theses specifications, the product will be rejected [
33,
34]. Basically, there are two types of specification limits, the upper specification limit (USL) and the lower specification limit (LSL). This specification limit should be considered at the point or level where the losses, due to variation, will result in the benefit of the product. This limit often, but not always, has been to symmetric, which depends, again, on the customer or the designer requirements. So, if the part falls between the USL and LSL, the part will meet the customer or the designer’s expectations, but if it falls outside this range, it will be rejected. Specification limits are used to determine the process capability and the sigma values [
37,
38]. So, to specify the dimensional tolerance of the measured parts, ASME Y14.5 (dimensioning and tolerancing) or ISO 1101 (geometrical product specifications) could be used to identify the part tolerances that would be reflected on the USL and LSL. Basically, in the present investigation, the tested parts’ cross-sectional area has a dimension 20 mm × 20 mm that fall within linear dimension range from 6 mm to 30 mm, where the tolerance class is considered as fine (±0.1), medium (±0.2), coarse (±0.5), and very coarse (±1). The medium tolerance class (±0.2 mm) has been chosen and is 1% of the tested part’s symmetric dimension (i.e., 20 mm). Accordingly, in this study, the upper specification limit is considered USL = 20.2 mm, and the lower specification limit is considered LSL = 19.8 mm.
Many production firms need a processing capacity (Cp) of 1.33 or higher. The Cpk index from the processing center evaluates whether the process is close to the limitation of the design when normal process variance is considered. The higher the Cpk value, the closer the data mean is to the target value. The limits of specification, standard deviation or sigma, and mean value are used to measure Cpk. Cpk should be in the range of 1 to 3, and the method must be changed if the value is less than one. The Cpk formula is represented by [
38,
39]:
where,
CpU: estimates process capability for specifications that consist of an upper limit only (assumes the process output as normally distributed).
CpL: estimates process capability for specifications that consist of a lower limit only (assumes the process output as normally distributed).
Process capability index (Cpk) is a statistical tool used to measure the ability of a process to produce output within customer’s specification limits. In simple terms, it measures a producer’s capability to produce a product within customer’s tolerance range. Cpk is used to estimate how close we are to a given target and how consistent we are to the average performance. Cpk gives the best-case scenario for the existing process. It can also estimate future process performance, assuming the performance is consistent over time.
The following three specific data assumptions are needed for accurate process capability studies [
39]:
There are no unique causes of variance in the method, and statistical regulation is in place. It is essential to identify and address these individual problems.
The results match a normal distribution, with a bell-shaped curve and a numerical approximation of more minor than, or greater than, 3 Sigma. In certain situations, the data does not conform to the typical distribution assumption.
The survey data is reflected in the population. Data from a big production run can be taken at random. In most cases, at least 25 to 50 sample measurements are ideally needed.
To survive in this competitive market, manufacturing companies should minimize waste to have a high-quality product. Therefore, process capability should be measured, and various types of waste should be produced during the process to reduce cost and optimize benefits. Therefore, reusing polymeric waste materials gives a possibility for a second life and enables effective waste utilization to obtain consumable products. Printable filaments can be made from various thermoplastic recycled materials as an alternative to the current approach of central selective collection of plastics [
40]. The possibility of recycling basic thermoplastic materials impacts processing, which will be reflected in their physical, chemical, and mechanical properties. The advantage is to offer commercial filaments, produced from recycled materials, that promote the production of filaments to 3D printing from plastic waste [
41]. Recycling facilities have developed several processes to recover and reuse plastics. The most common practice in the industry is to extrude melted plastic into small pellets (often referred to as mechanical or traditional recycling). Mechanical recycling is most efficient when working with a single type of material. The recycled pellets, which are then sold to manufacturers as raw materials, serve as a cost-effective and environmental alternative to virgin plastics. The pellet form allows the plastic to be easily distributed and used to produce new parts [
42]. Traditionally recycled pellets suffer from lowered and inconsistent mechanical properties and, therefore, recycled resin is often downcycled into cheaper products [
43].
Measuring process capability is not only estimating the Cp and Cpk values. Process capability is only one instrument in the statistical process control (SPC) implementation that requires data collection and interpretation to understand the predictive output of the operation and pinpoint the sources of uncertainty. Focusing on the capacity of the method yields essential information. System capability management allows for evaluating and adjusting the production process required to ensure that goods fulfill the design and consumer specifications. If this information is appropriately used, it will help to eliminate waste, improve production efficiency and consistency, and lower manufacturing and low-quality costs [
44]. In addition, this will help to determine the stability of the dimensions of the 3D printed components, while increasing the height.
The impact of process variables, such as layer thickness and raster angle, on the linear and radial dimensional accuracy of poly latic acid components manufactured by fused deposition modeling was investigated. The measurements of the manufactured components were smaller than the CAD model because of the shrinking that takes place during the cooling of the material after depositing layers. Because of the chopping and squaring of corners, the dimensional inaccuracy of the radial dimension (RD) was more significant than that of the linear dimension (LD). For both LD and RD, the international tolerance grade (IT-grade) was assessed as IT-grade measures any machine’s dimensional precision. The linear axis has a lower IT-grade than the radial dimension, according to the findings. With all of the experiments, IT-grade remained constant across a particular range [
45].
In a different study, mathematical analysis was used to analyze 3D printed pieces with honeycomb patterns through fused deposition modeling. The honeycomb pattern is used to produce inside samples, since it has a feature to resist applied loads. Cutting a 3D sample into slices and changing the thickness of the layer, infill portion, and temperature of the extruder was all done in 3D. The performance responses of build time, maximum failure load, elongation at break, and component weight were chosen and evaluated using the response surface tool. The layer thickness was defined as the most crucial regulated parameter for all interactions, based on the analysis of variance. Elongation at break and, therefore, extreme cracking and lesson build time, is significantly affected by the infill portion and extruder temperature [
46,
47]. It is noticed that, when comparing the mechanical properties of printed pieces, the dimensional precision of the internal structure has received little attention in the literature of recent years. As a result, research was conducted to calculate and compare the inner structure’s dimension precision using various scanning techniques. The findings revealed that the printed internal pattern in the scanning direction is more reliable, in terms of dimensional accuracy, than the vertical printing process in the scanning direction. According to the finite element analysis (FEA) data, the distribution of temperature over the scanning path is uniform in the vertical direction. As a result, it is expected that dimensional variation will occur during printing [
48].
1.5. Dimensional Accuracy
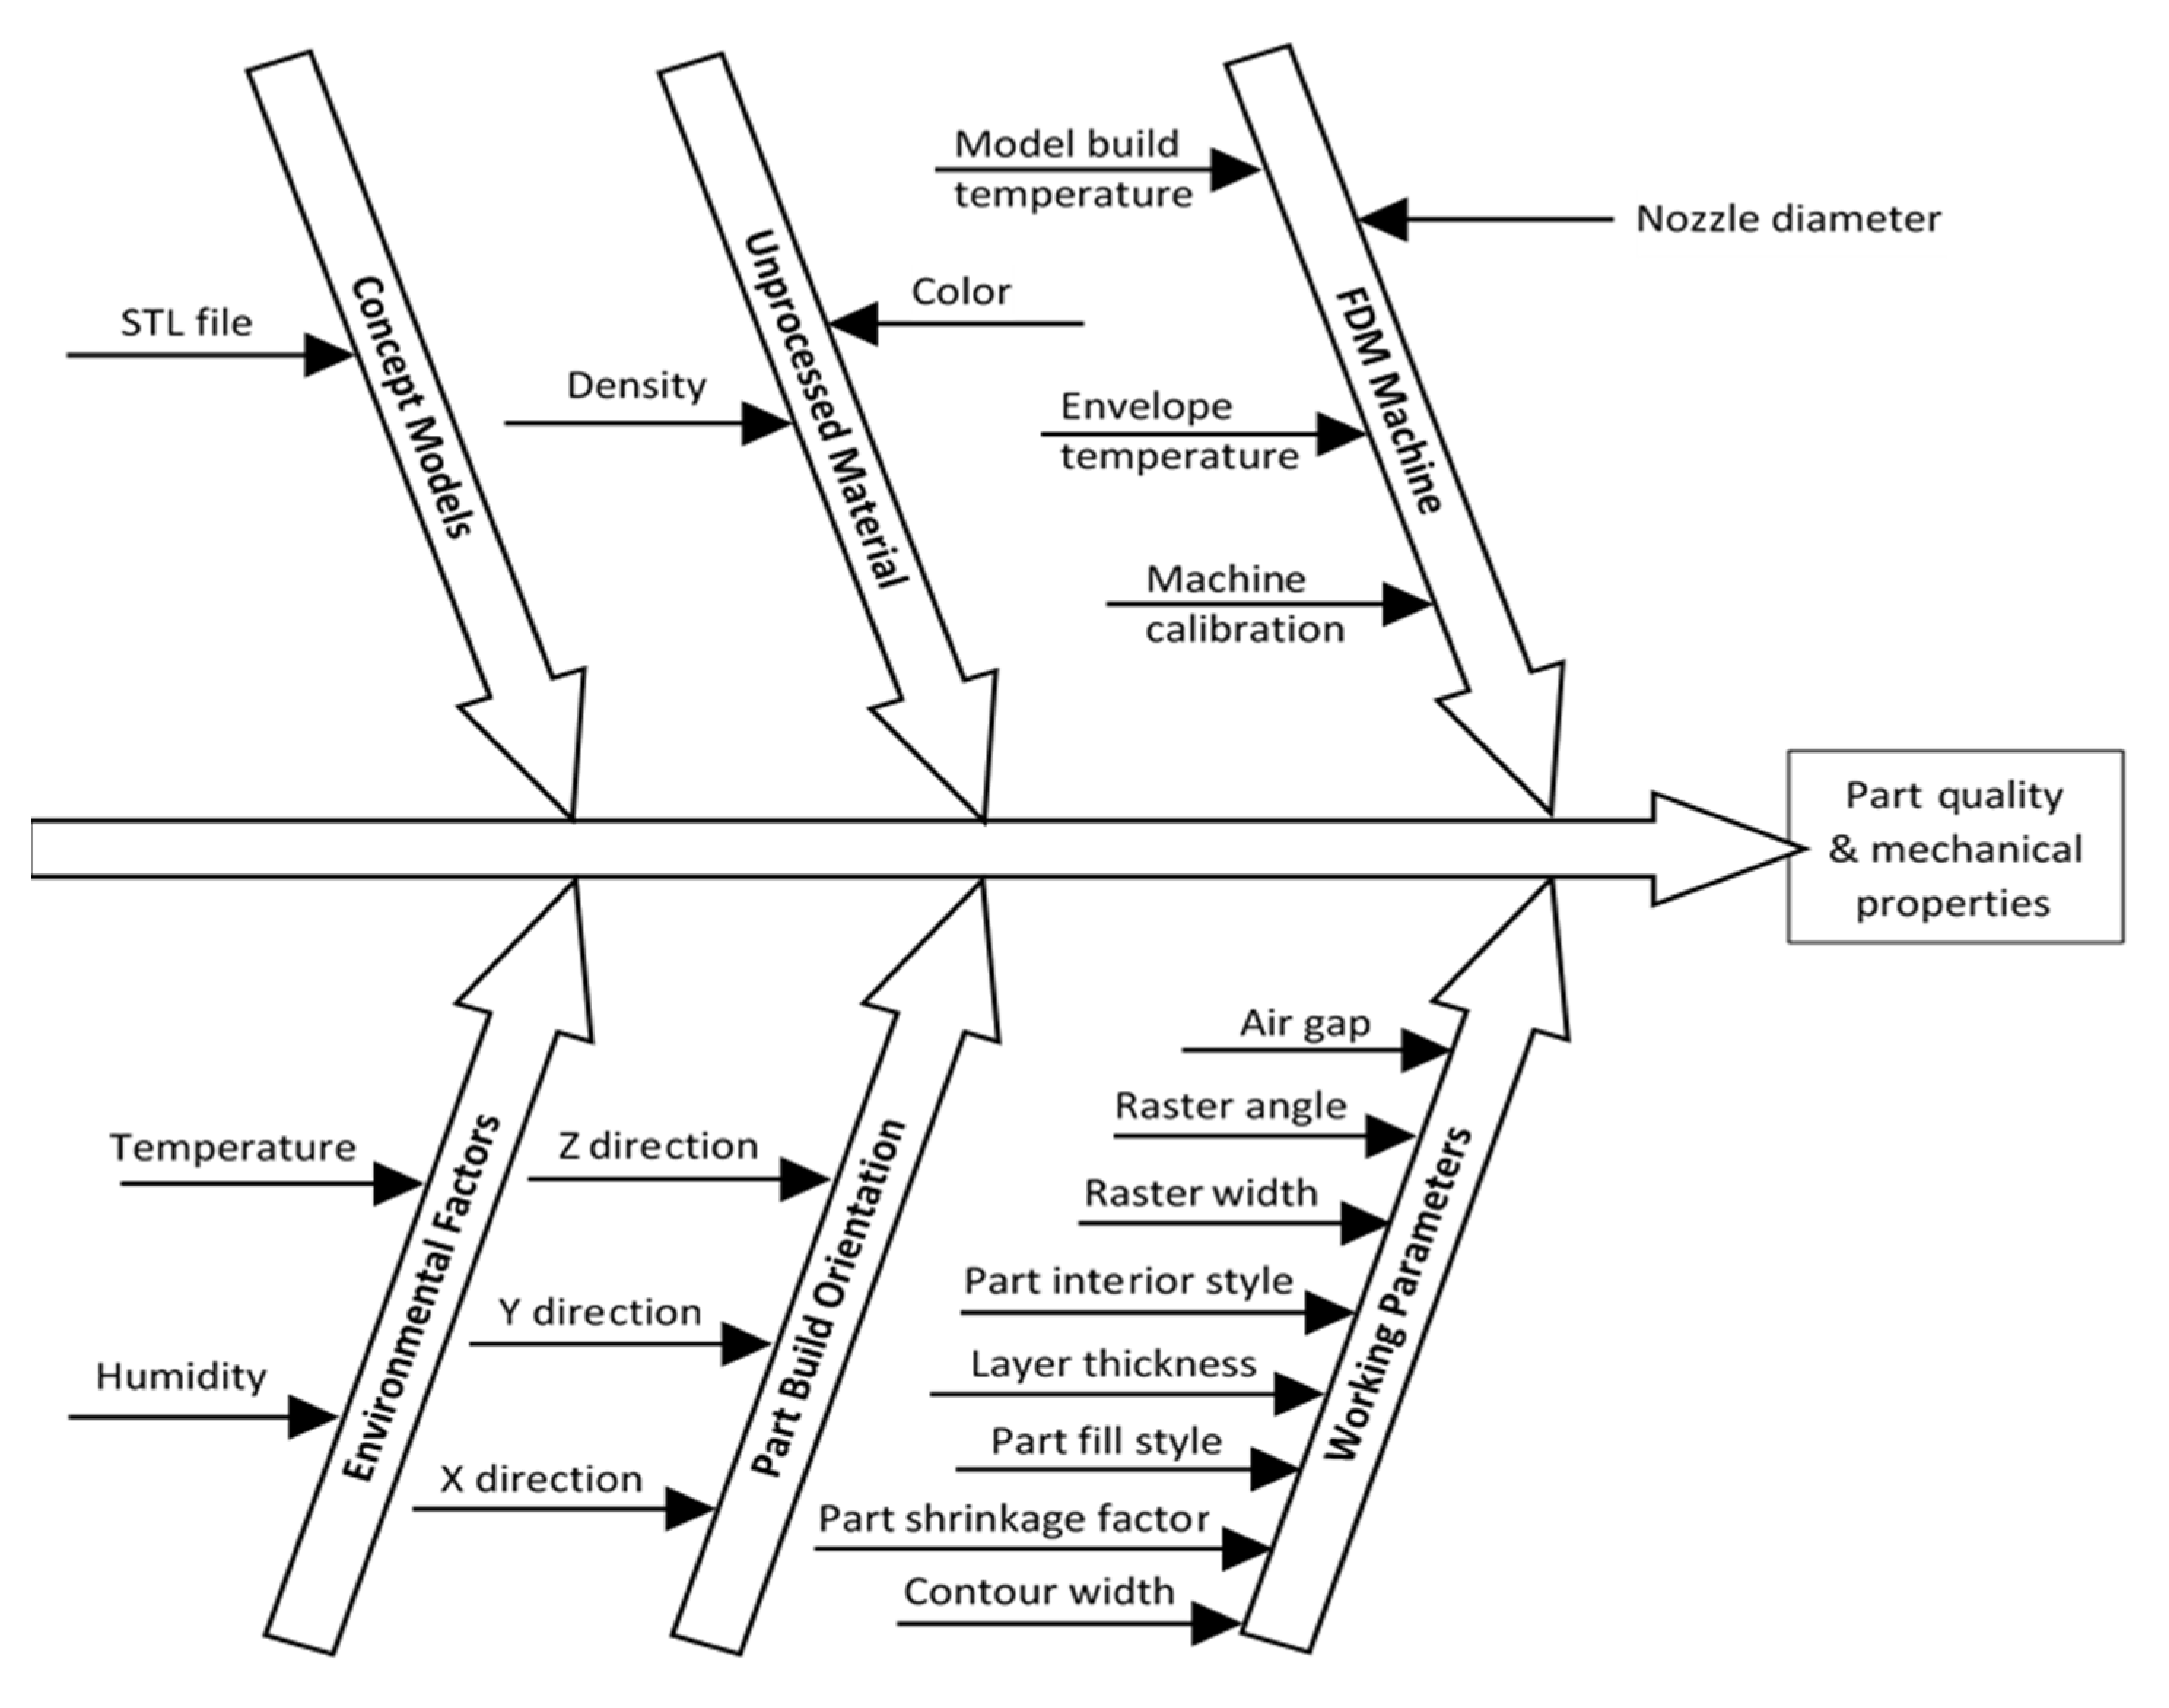
The capability of the FDM process to keep a high level of precision in the dimensional stability of the manufactured components is significant and crucial to the overall market acceptance of this method, particularly in investment casting pattern applications [
49]. The dimensional tolerances of the pattern must not exceed half of the casting’s tolerance in applications of investment casting patterns. Therefore, it is critical to achieving very low dimension tolerances between the manufactured and CAD models. The dimensional accuracy of components manufactured by FDM is affected by many conflicting parameters, as shown in
Figure 1.
Using the SLA, PolyJet, and SLS, the dimensional accuracy of components was affected by a few primary parameters. Previous research has shown that the FDM process produces fabricated parts with lower dimensional accuracy than other AM processes [
50] because there is a range of conflicting process parameters that affects dimensional accuracy, either individually or in combination with different parameters [
51]. Obtaining a high degree of dimensional precision in this method is a significant quality characteristic in many industrial applications, such as electronics, medical devices, and aerospace. Preserving dimensional accuracy, with a very low tolerance in those applications, will ensure dimensional stability and repeatability of the processed component. To obtain accurate built components, the development of mathematical models to optimize the settings and comprehend the relation between the parameters of a process and dimension accuracy are essential [
49]. The following parameters would be used to help measure the accuracy of 3D printed parts:
- i
Dimensional accuracy: quantitative values reflect the desired accuracy of parts, which machine manufacturers and material suppliers give. All tolerances are calculated based on well-designed elements operating on well-calibrated machines.
- ii
Warping or shrinkage: the probability of a component warping or shrinking during the printing process. This is highly dependent on the design, although specific techniques are required to manufacture parts that are predisposed to warping or shrinkage.
- iii
Support requirements: the amount of support used determines how precisely a surface or element is printed in certain 3D printing technologies. The disadvantage is that it reduces the part’s surface finish [
52].
1.6. Hypothesis
Process capability analysis is a scientific and systematic procedure that involves the measurement and assessment of natural variations in quality characteristics (attributes and dimensional) of a process. In statistical process control, the variations in the performance measures are due to chance causes only [
53]. Process capability analysis is applied to design a process control system or for commissioning machines/equipment to determine their deliverance, in terms of output, as per specifications [
54]. The pattern of variations of a process is detailed by the probability distribution; this hypothesized distribution is then compared with the corresponding specifications to assess its adequacy. Process capability indices attempt to summarize the process performance and, hence, are a function of the process distribution and the corresponding specifications [
55]. The process capability analysis is performed to determine the power of ability of a process or operation (hence, is responsible for the quality of any product) [
56]. The purpose is to analyze, estimate, monitor, and absorb the variance in manufacturing processes [
57]. Process capability indices are the tools that are employed to assess the quality of a process [
58]. The following are the hypothesis of this study:
Hypothesis 1. Propose to investigate the dimensional accuracy of commercial desktop 3D printers using PLA of a square cross-sectional area at different infill patterns and incremental heights. The expected result from this study is to understand and assess the impact of the infill pattern and height of 3D printed objects on the dimensional accuracy.
Hypothesis 2. Propose that the 3D printing conditions are consistent, such as material used, printing speed and temperature, extrusion nozzle size, and room temperature, while printing throughout the investigation.
Hypothesis 3. Propose that there is neither vibration on the 3D printed objects while printing, which would affect the dimensional accuracy, nor vibration of the printing bed. Besides, it is, assumed, that the 3D printed objects are firmly bonded with the printing bed and that the infill pattern will have no impact on the stability of the adhesion performance.
2. Methodology
In this research, the Ultimaker 2 extended machine was used to print different dimensions and infill structures. The Ultimaker extended machine specifications are given in
Table 1.
In general, the eruption of 3D printing technology has led to a massive new waste source of plastics, especially the polylactic acid (PLA), which is associated with the fused deposition modeling (FDM) process [
2]. The usage of polymers in three-dimensional printing technology has grown exponentially, which has increased the amount of waste produced during this process. Recycling polymeric waste is considered to be more practical and economical than other waste disposal techniques. The vision of the plastic economy requires innovative methods to develop sustainable solutions for manufacturing products that have high durability, prolonged shelf-life, and retain quality after recycling [
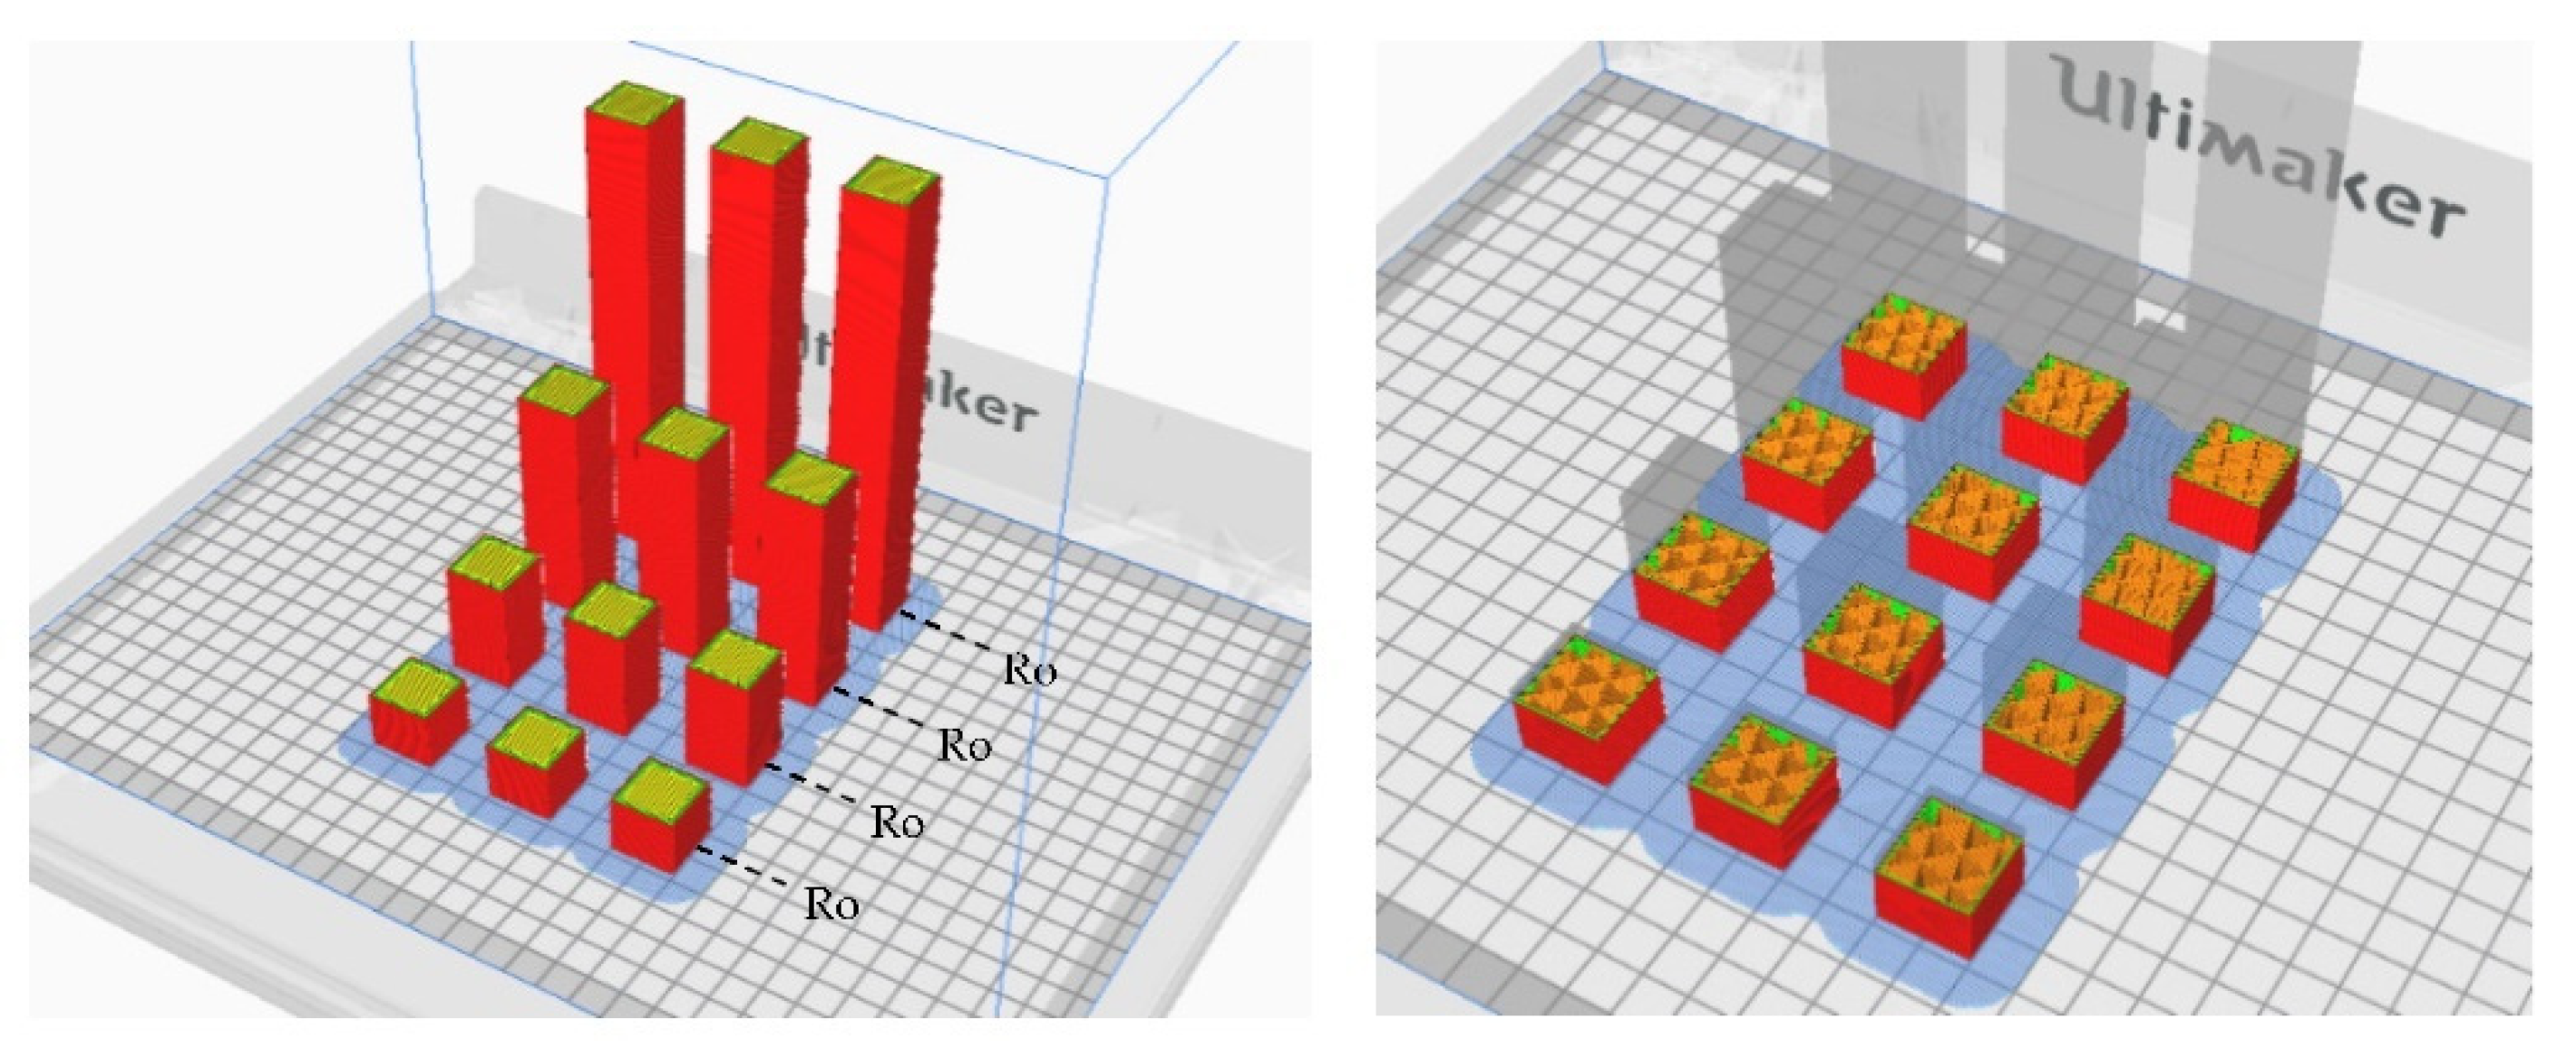
62]. In this study, all parts were printed with PLA material and were rectangular in shape. There were five sets of parts, each set had four rows, and each row had three samples. All rows had base dimensions of 20 mm × 20 mm, but the height changed across the rows. For example, the first row was 20, the second was 40, the third was 80, and the fourth row was 150 mm high. Triangular, concentric, rectilinear, gyroid, and honeycomb filling patterns were among the infill patterns available on the Ultimaker 2 printing machine. The various infill pattern structures were [
63]: rectilinear, grid, triangles, stars, cubic, line, concentric, honeycomb, 3D honeycomb, gyroid, hilbert curve, archimedean chords, and octagram spiral.
Polylactic acid (PLA) is one of the most popular filament materials among the thermoplastics, which are currently available for 3D printing. The costs of commercial filaments are up to 200 times higher than those of raw plastics [
64], though their thermo-mechanical recycling would significantly contribute to the reduction of 3D printing cost. Simplicity and low costs have contributed to the fact that it is primarily used in prototyping and small-scale productions. In recent years, the use of 3D printing has become more prevalent in various industrial sectors, with the aerospace, military, automotive, medical, and construction industries increasingly taking advantage of it [
65]. The reuse of unsuccessful prints, used parts, disposable prototypes, and waste materials was not necessarily originally used for 3D printing, as a source of materials for filament production is beneficial both economically and for the environment. This reduces material costs, CO
2 emission, and energy consumption [
66]. Recycling is the most effective way to reduce printing costs. However, research on the recycling of 3D printing waste is limited. Usually, 3D printing waste, such as PLA, is mainly treated by physical recycling methods, such as shredding and reprocessing after melting or high-temperature degradation. However, these methods are challenging for achieving efficient and green recycling.
Due to the high scrap rate of 3D printing, the reuse of waste PLA decreases the costs and reduces the waste of resources [
67]. In general, a shredder, dryer, and extruder with a puller are necessary to produce the 3D printing filament [
68]. These machines are used to produce polymeric filaments that can be used in 3D printers and, consequently, close the loop for plastic. PLA can be collected from different resources to have enough waste for the recycling process. It is necessary to classify plastics by color. After the waste is shredded (to get small granules) and dried for three hours (to eliminate moisture), the extruder with heaters is used to melt the granules and push them through a nozzle head to achieve filaments of different diameters, which depends on the nozzle size used in the extruder. Usually, a puller is used to help us coil the filament in the spools. Using the raft to make a stable model with a minimal footprint provides a solid basis for constructing the pieces’ upper layers. The thickness of the raft was 1.12 mm.
Figure 2 shows the printed parts. The recommended settings are as follows:
- -
Standard prints: triangles;
- -
Functional prints: the gyroid;
- -
Flexible prints: concentric.
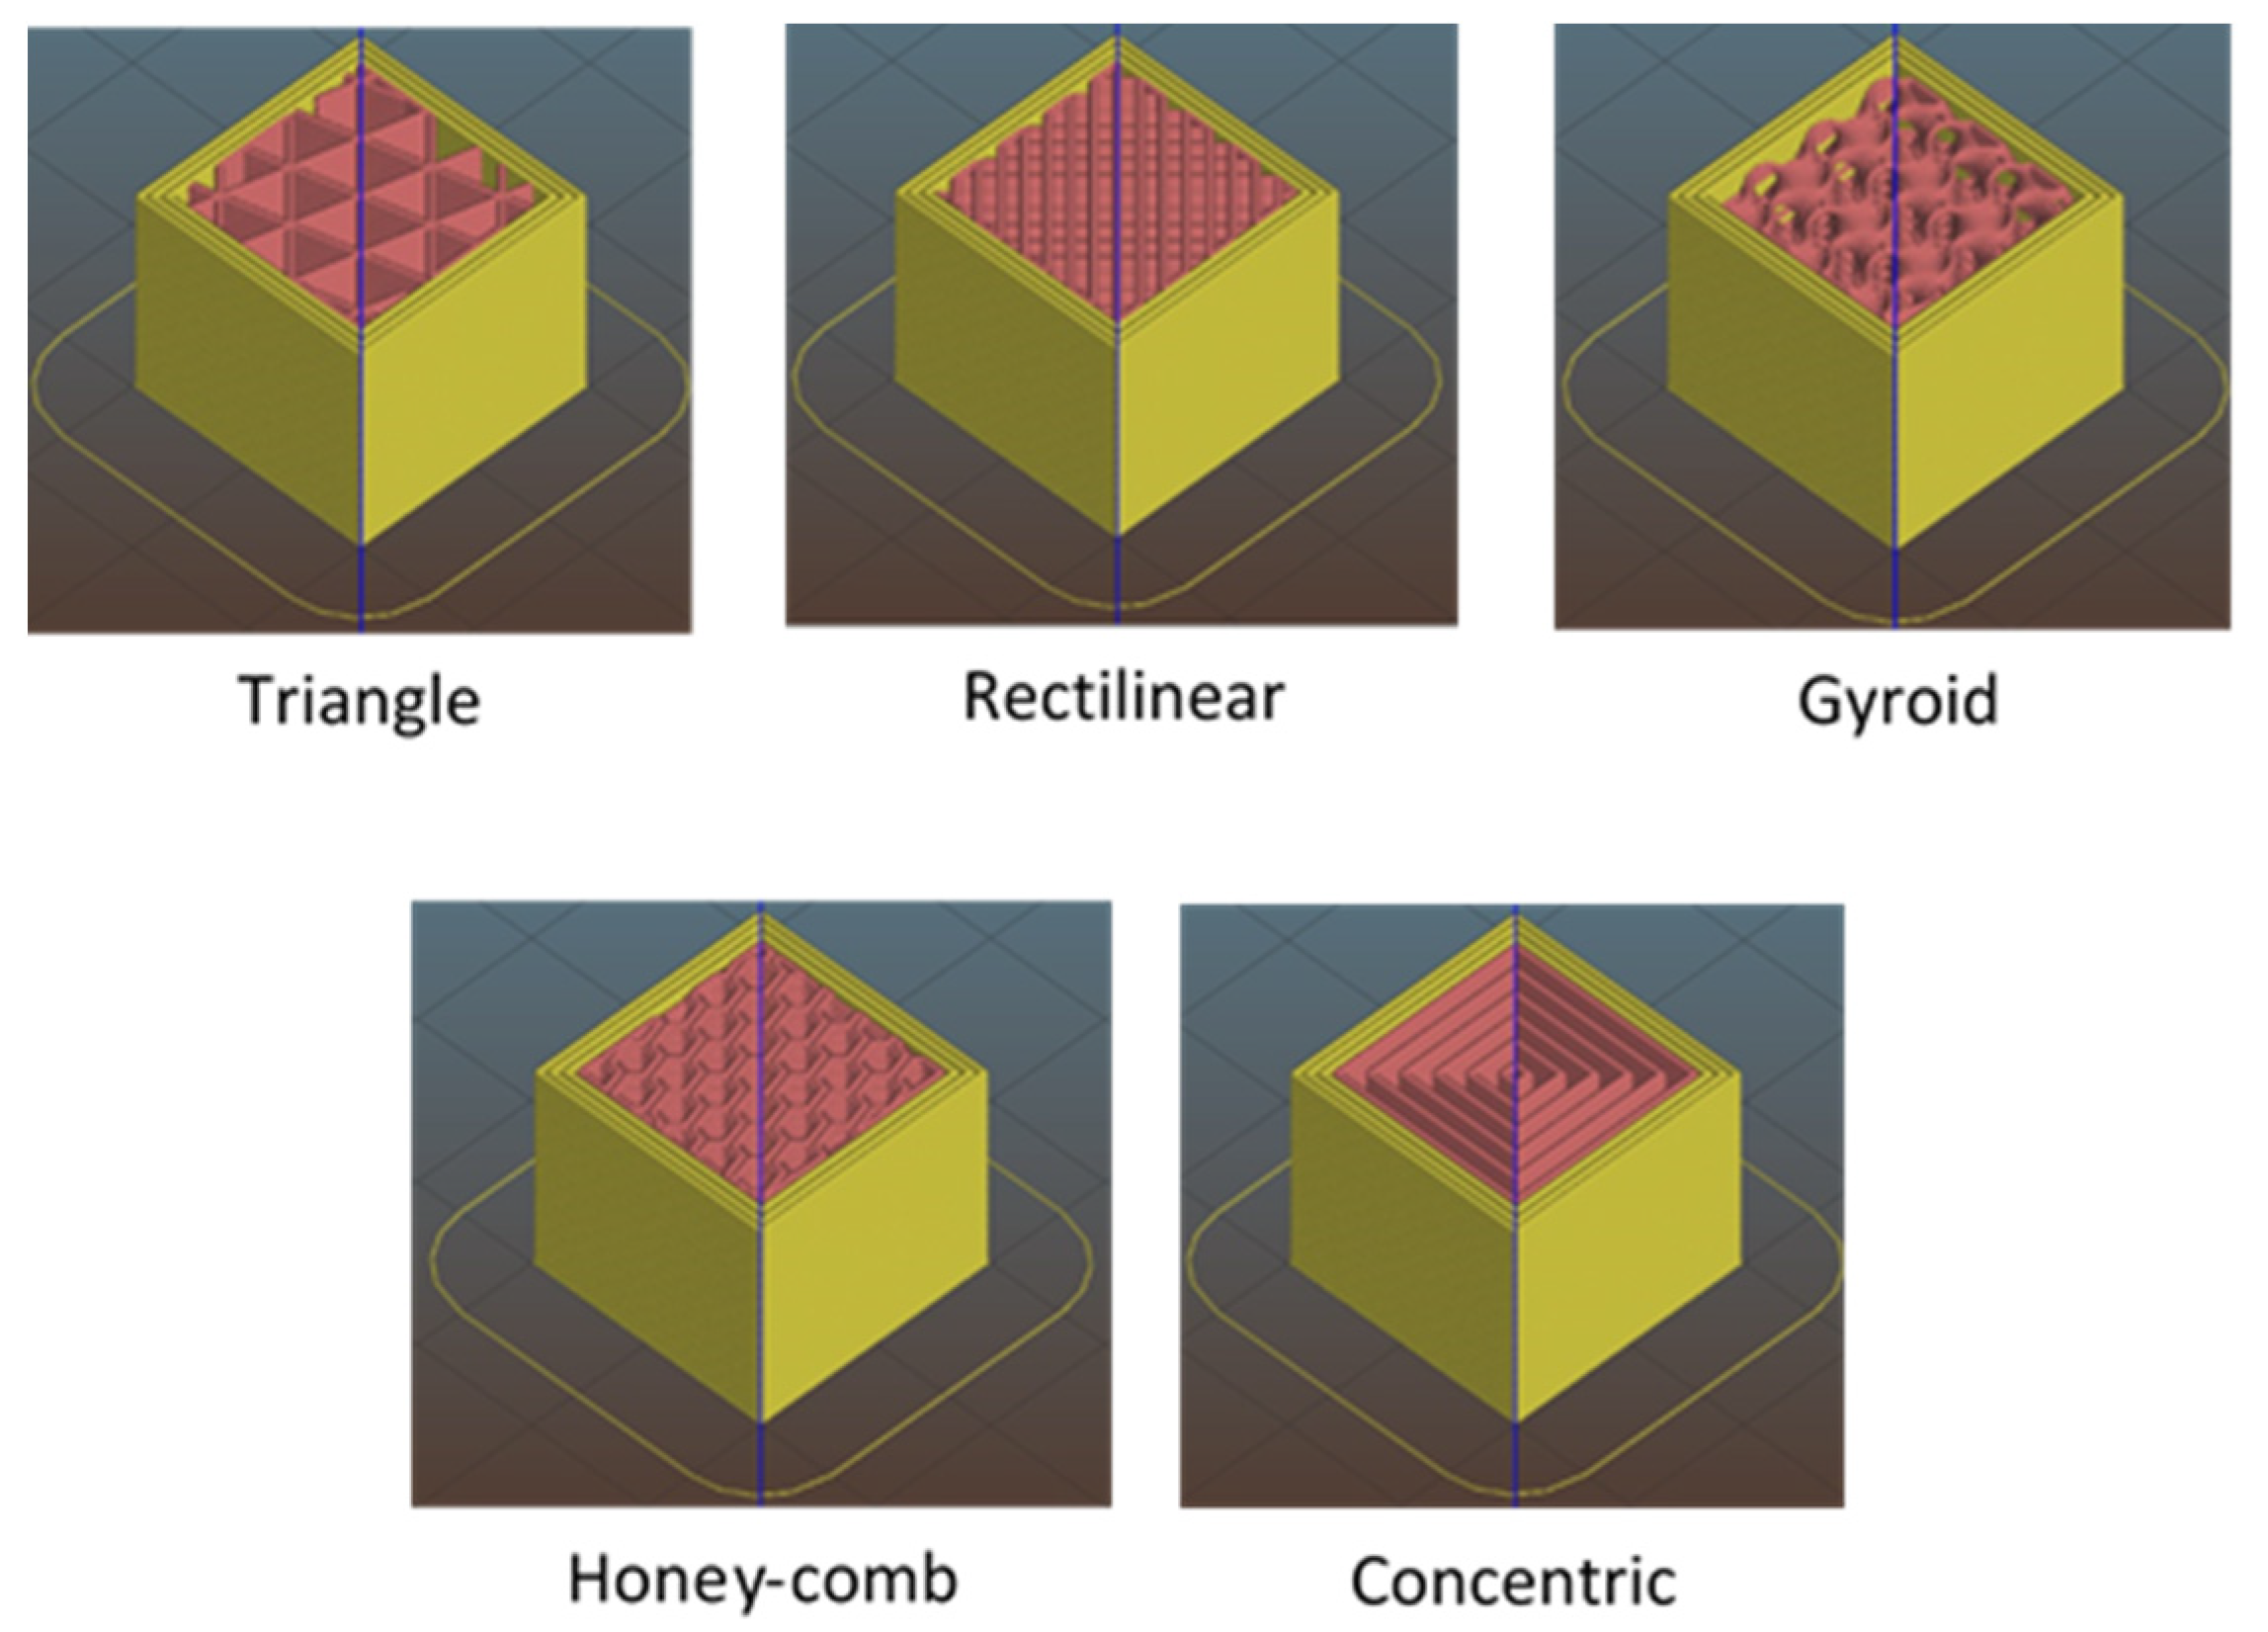
In this study, five patterns were considered, which were: triangle, rectilinear, gyroid, honeycomb, and concentric, as shown in
Figure 3:
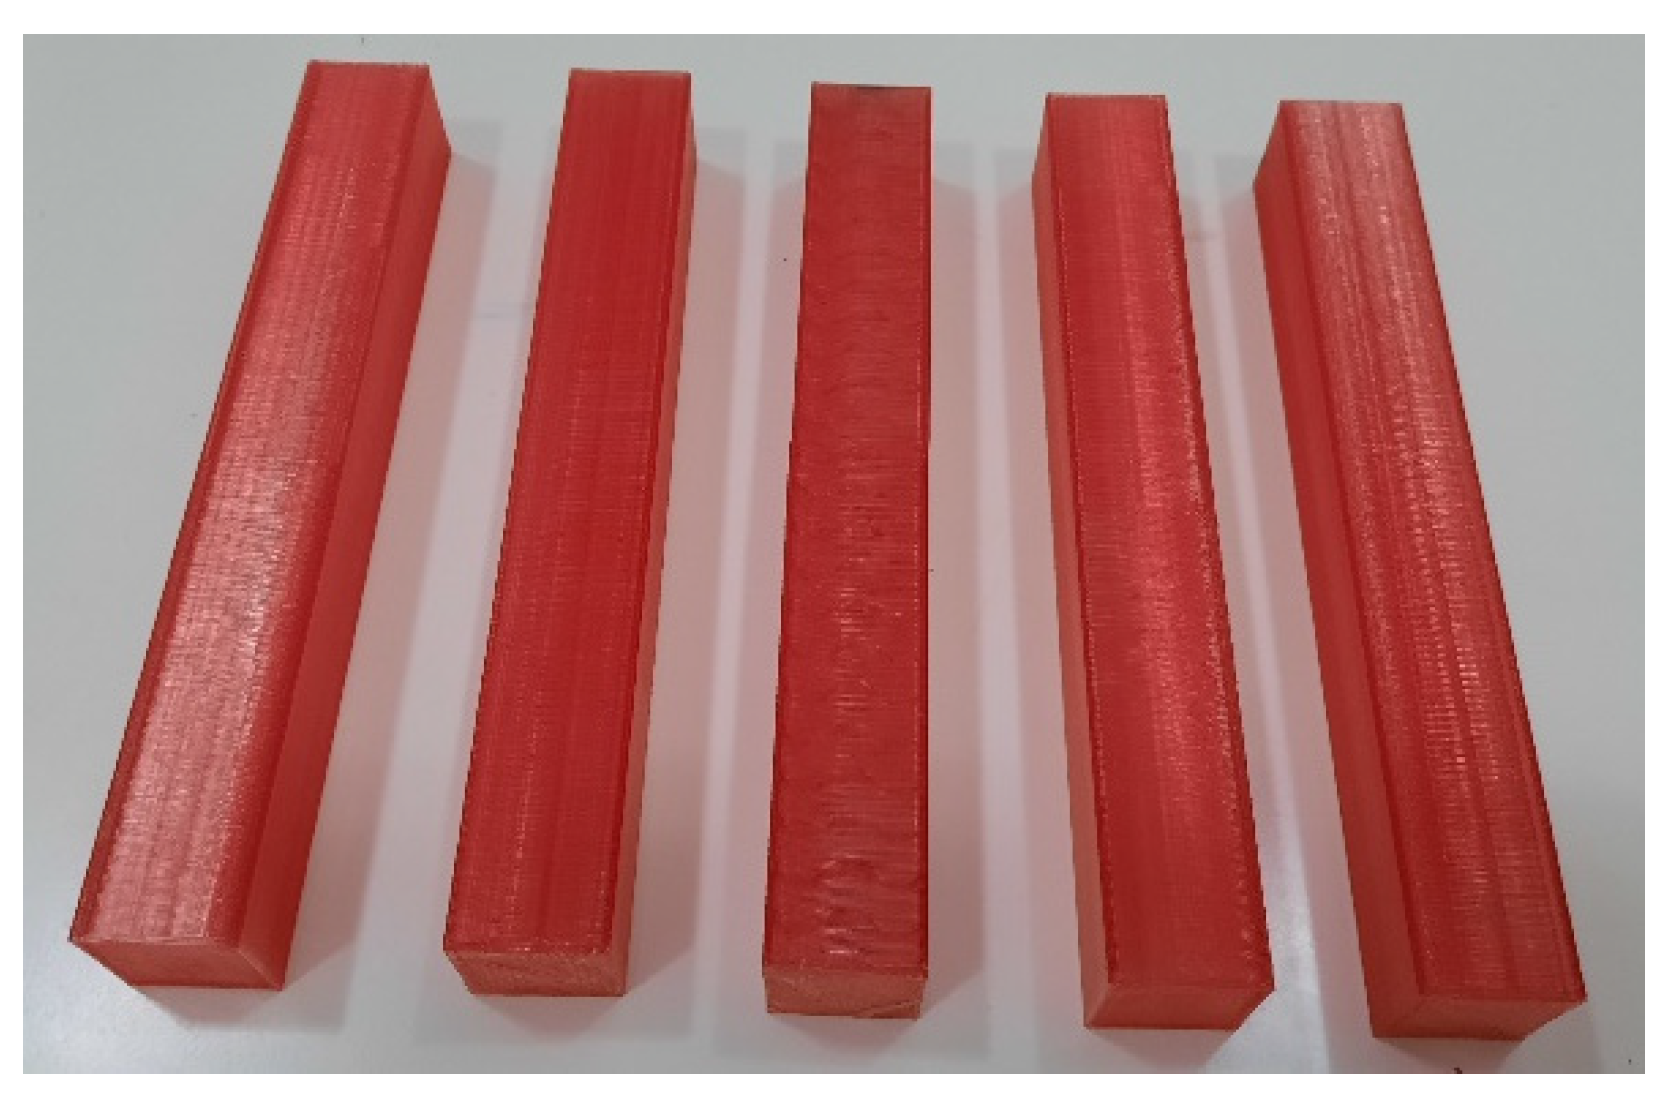
The mid-height of the 3D printed specimens that have been produced are illustrated in
Figure 4.
It is worth mentioning that in this study, the terms top, middle, and bottom, in fact, refer to the 3D printed specimen that has been removed from the printer and is no longer on the printing bed. Therefore, the measurements of the dimensions that have been taken are measured on the part directly, not when the pieces are on the printing bed. Besides, a raft is usually used below the printed parts (i.e., over the printing bed) to help with warping and bed adhesion; it can be used to assist in stabilizing printed models with small footprints, as well as to create a strong foundation, on which to build the upper layers of the printed parts. Most of the slicing software optimizes the raft layer to ensure easy separation and a high-quality surface finish on the bottom of the printed pieces. Therefore, once the print is complete, the raft layer is easily peeled away from the printed object and can be discarded.
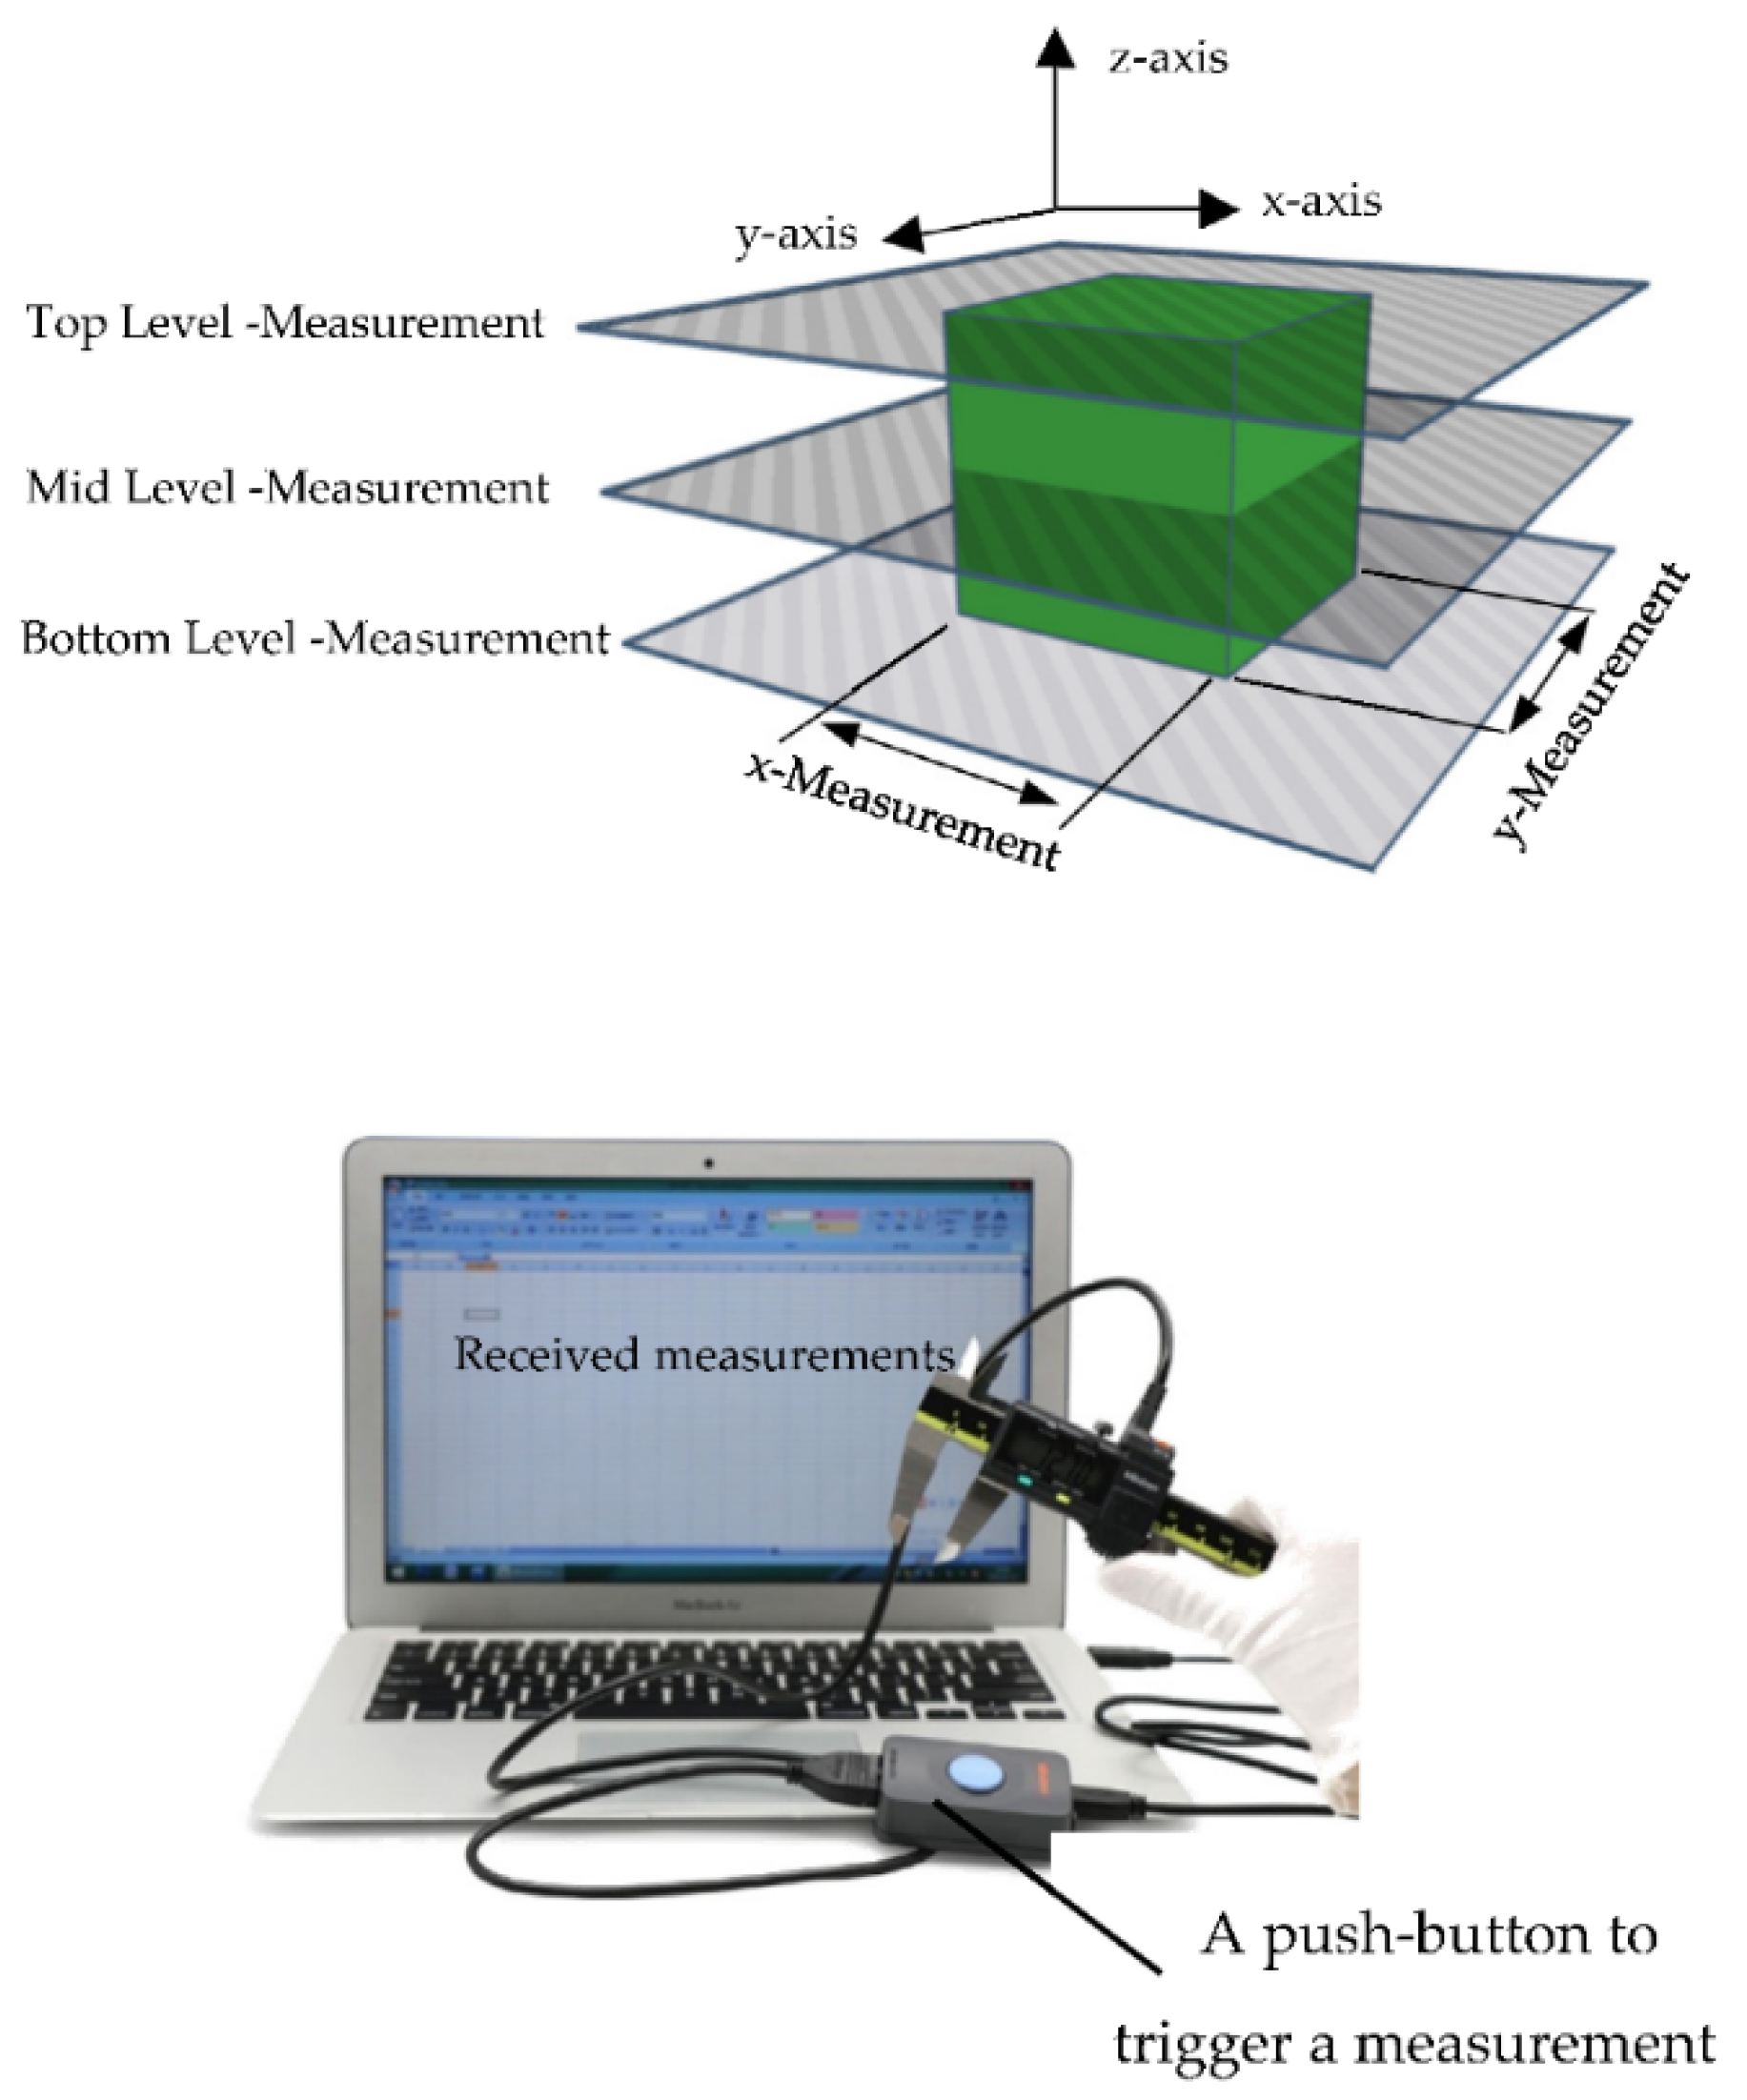
New intelligent technologies took the measurements of the printed parts. An advanced vernier caliper (Mitutoyo caliper to USB package, 6”, resolution 0.01 mm), connected to the monitor, was used to get the accurate measurements (stored in an Excel sheet). This advanced caliper measuring device provides all of the items required to measure parts accurately and then sends the measured data to a PC through a USB port. This innovative method assisted in saving time and reducing human errors. To minimize errors and evaluate the 3D printer performance at various stages, the X, Y, and Z dimensions were measured three times at the bottom, middle, and top levels, as shown in
Figure 5.
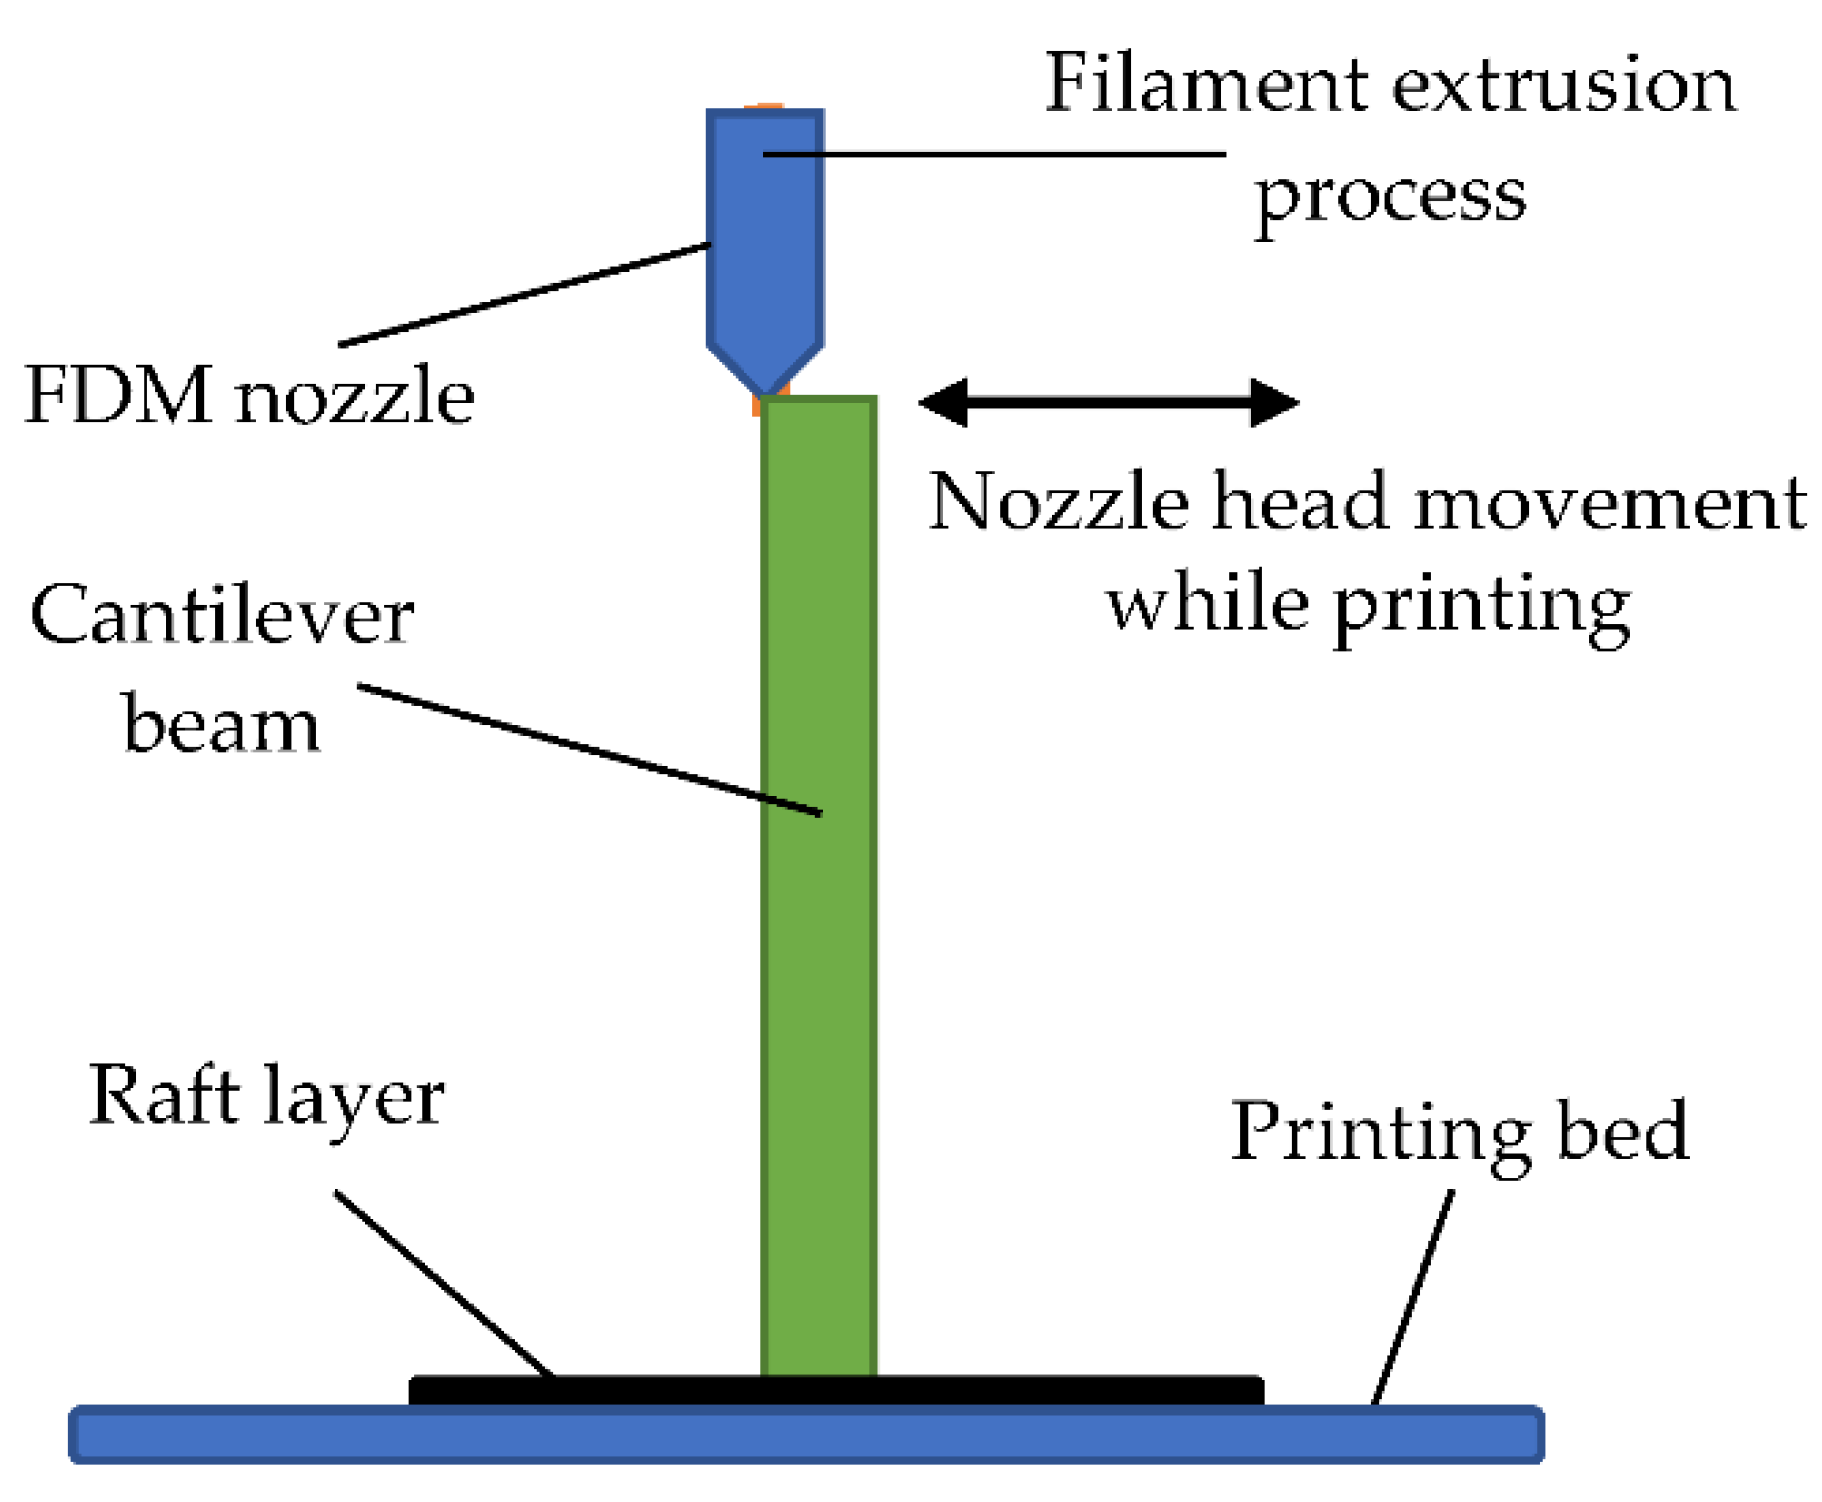
Figure 6 shows the components of the 3D printing process. The 3D printer used in this study was composed of an FDM nozzle, filament extrusion, a cantilever beam, a raft layer, and a printing bed, as illustrated in
Figure 6.
4. Discussion of Results
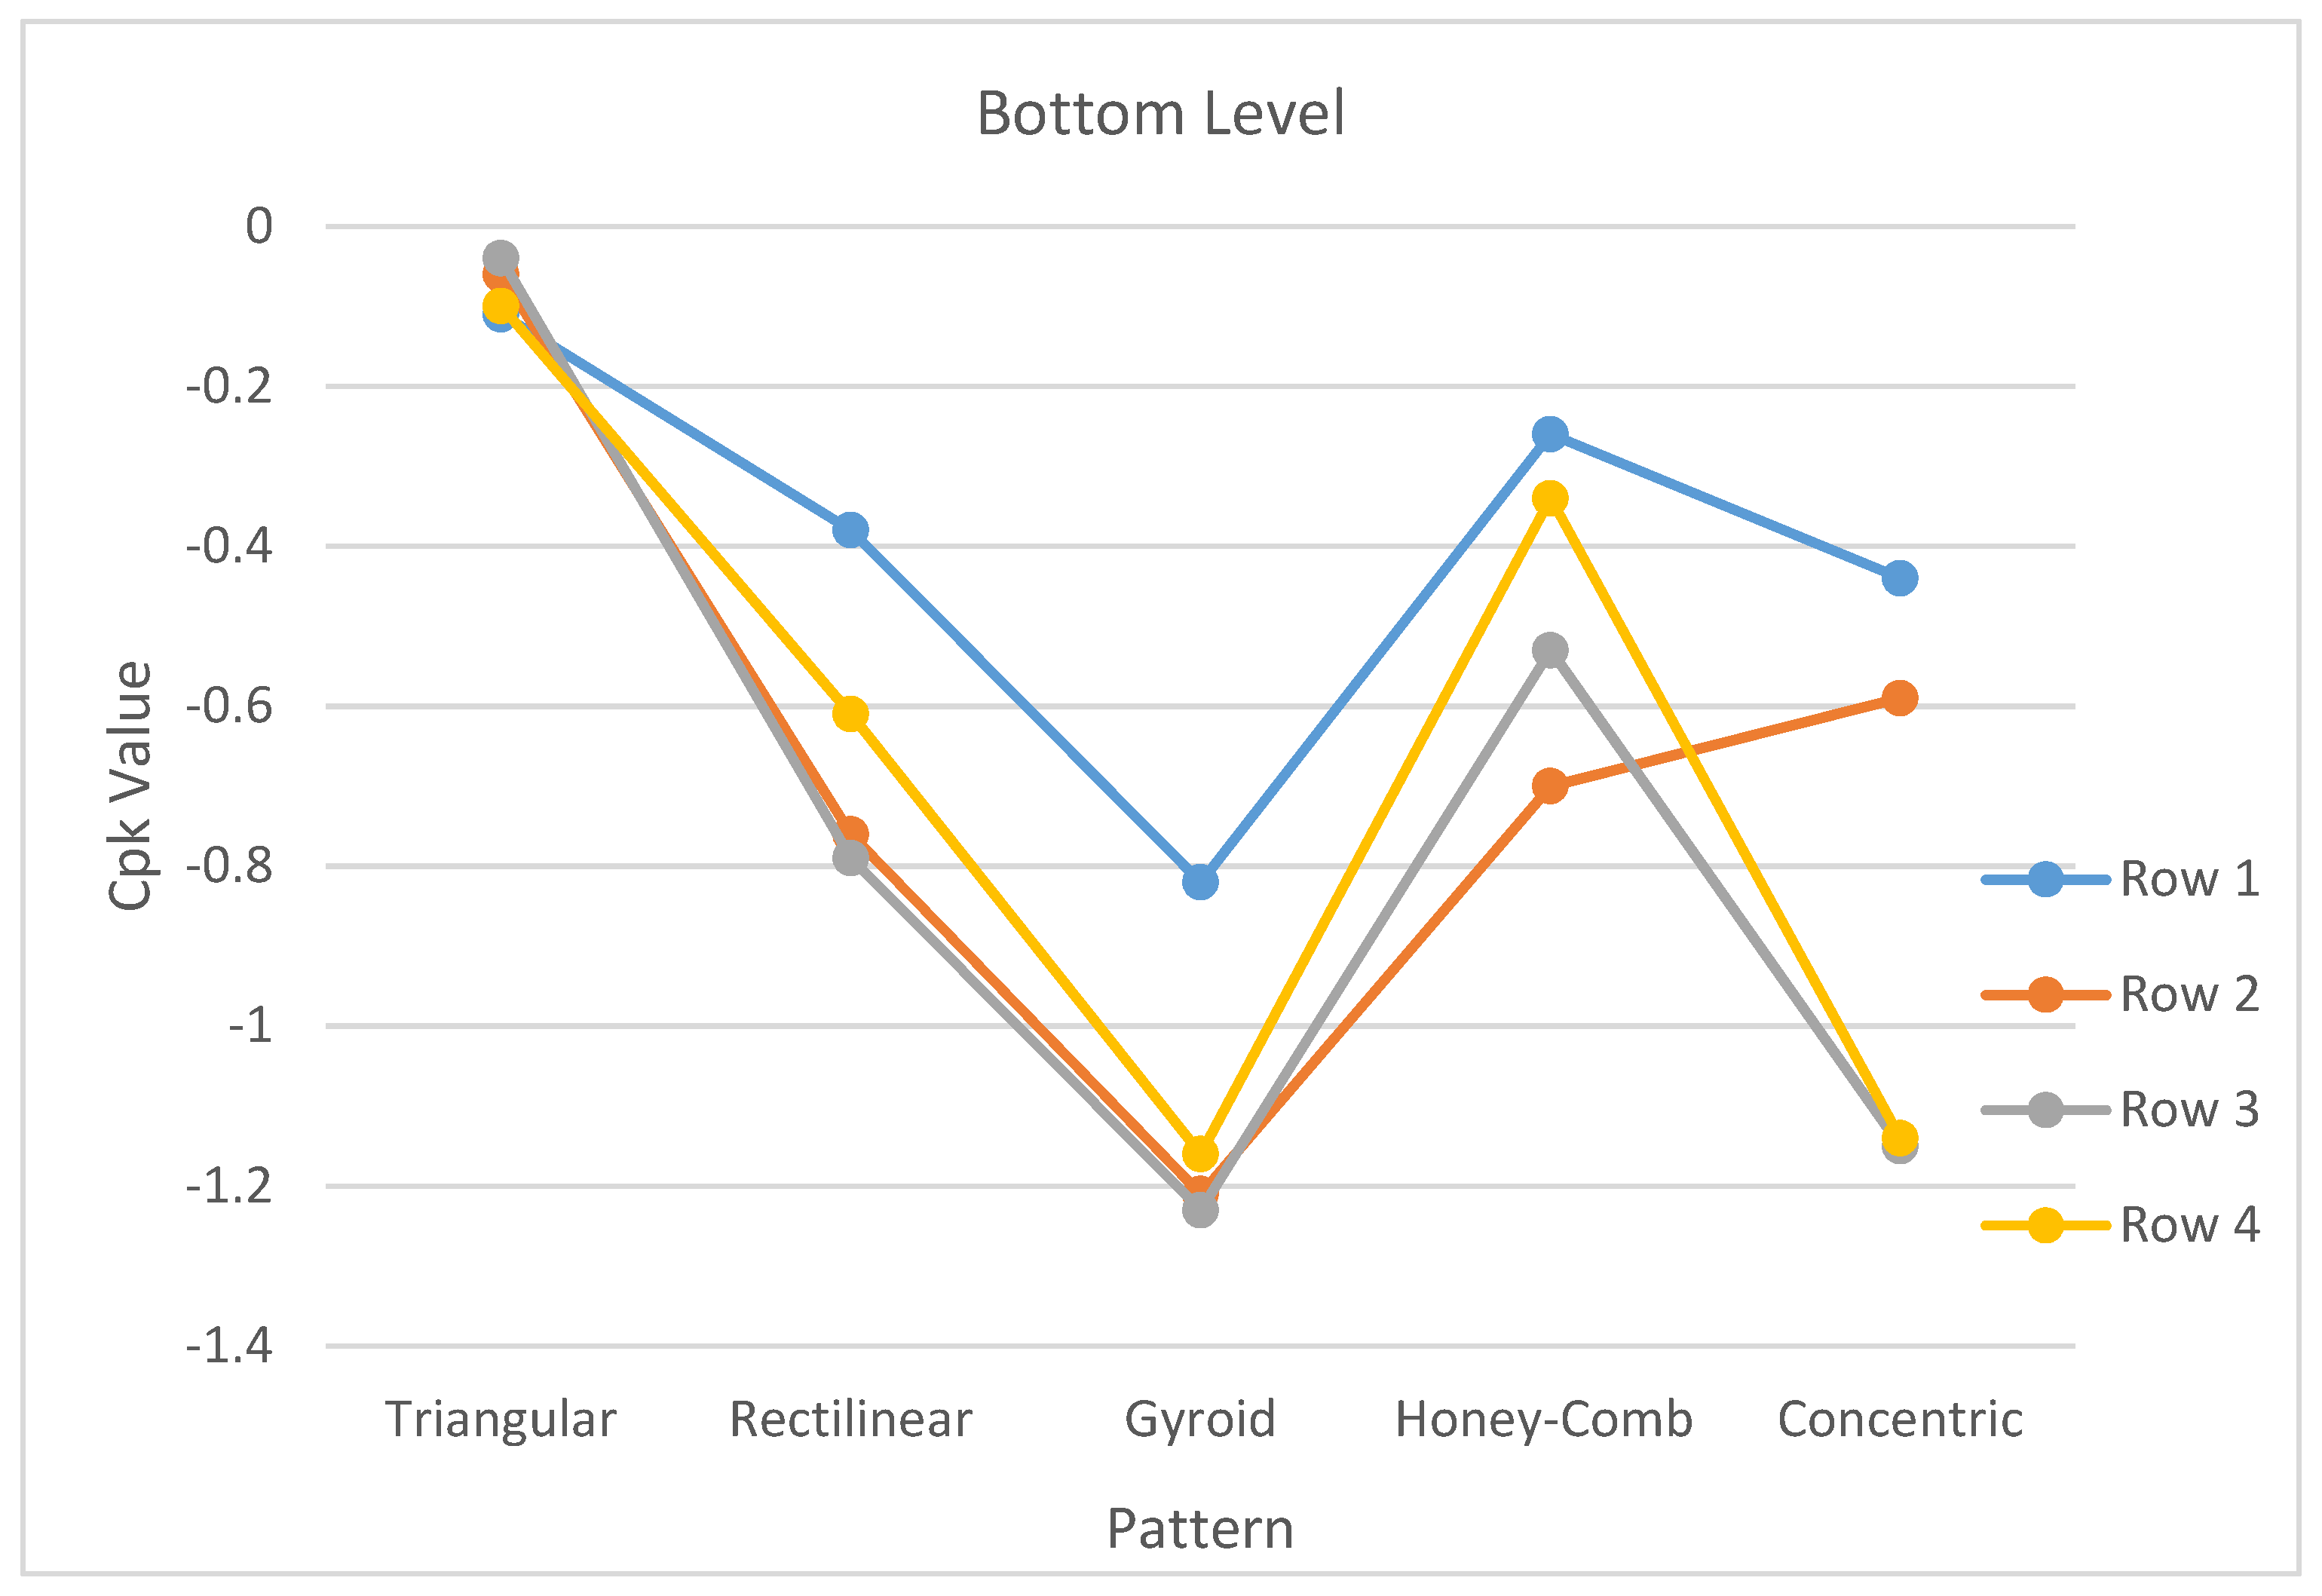
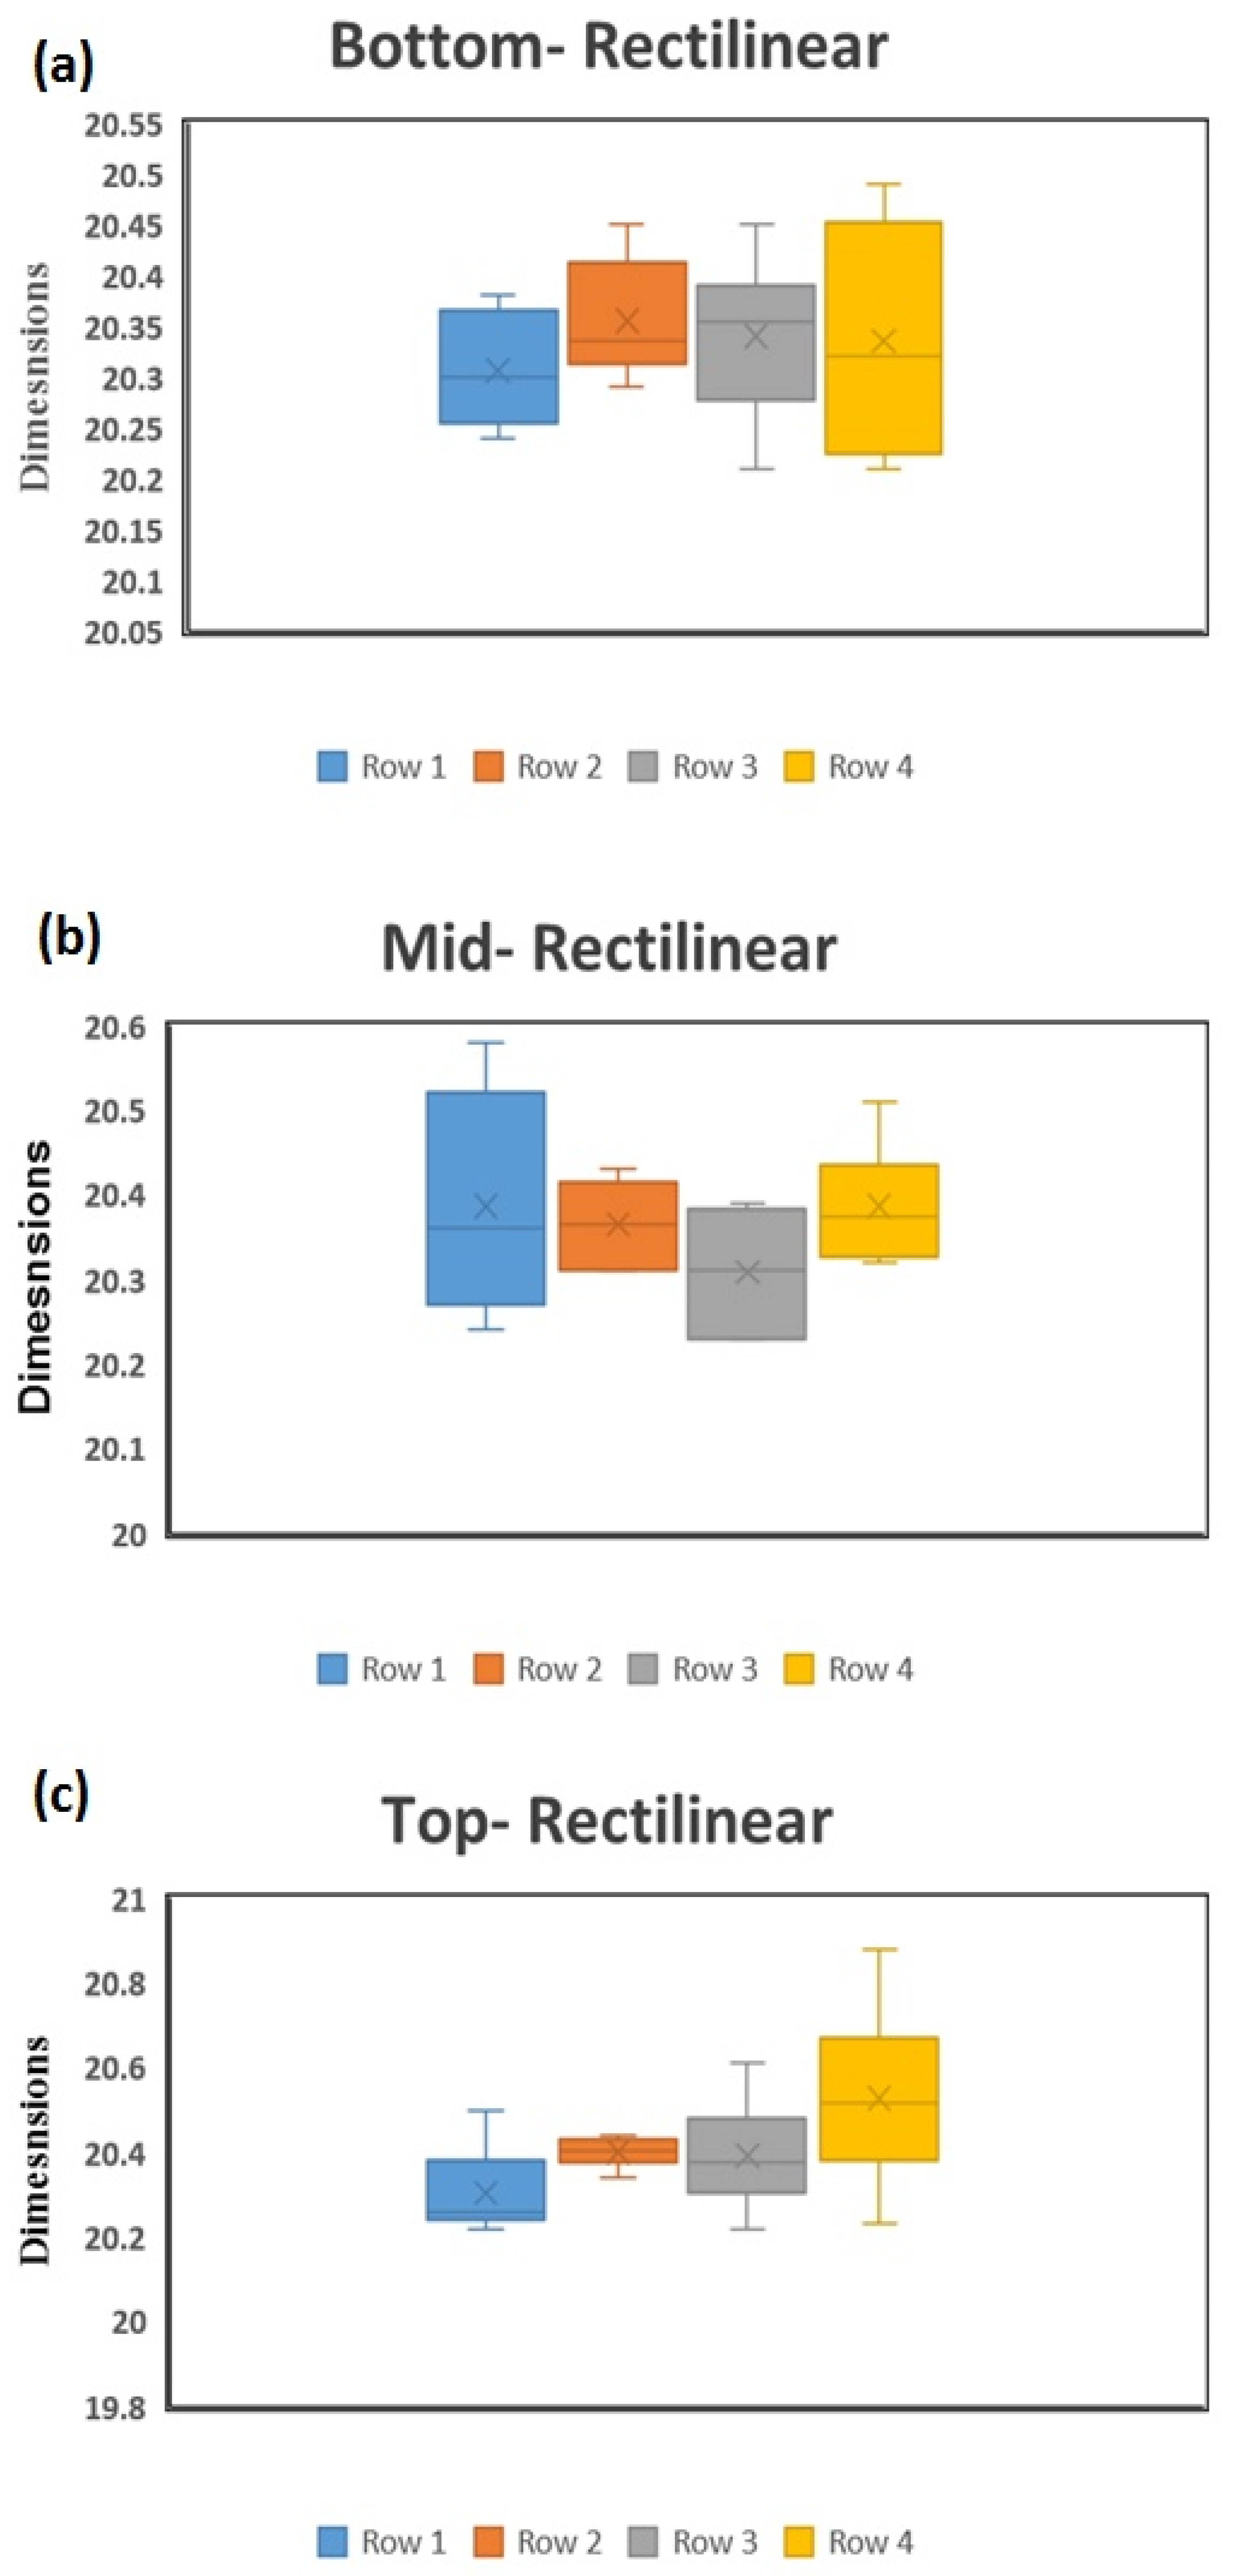
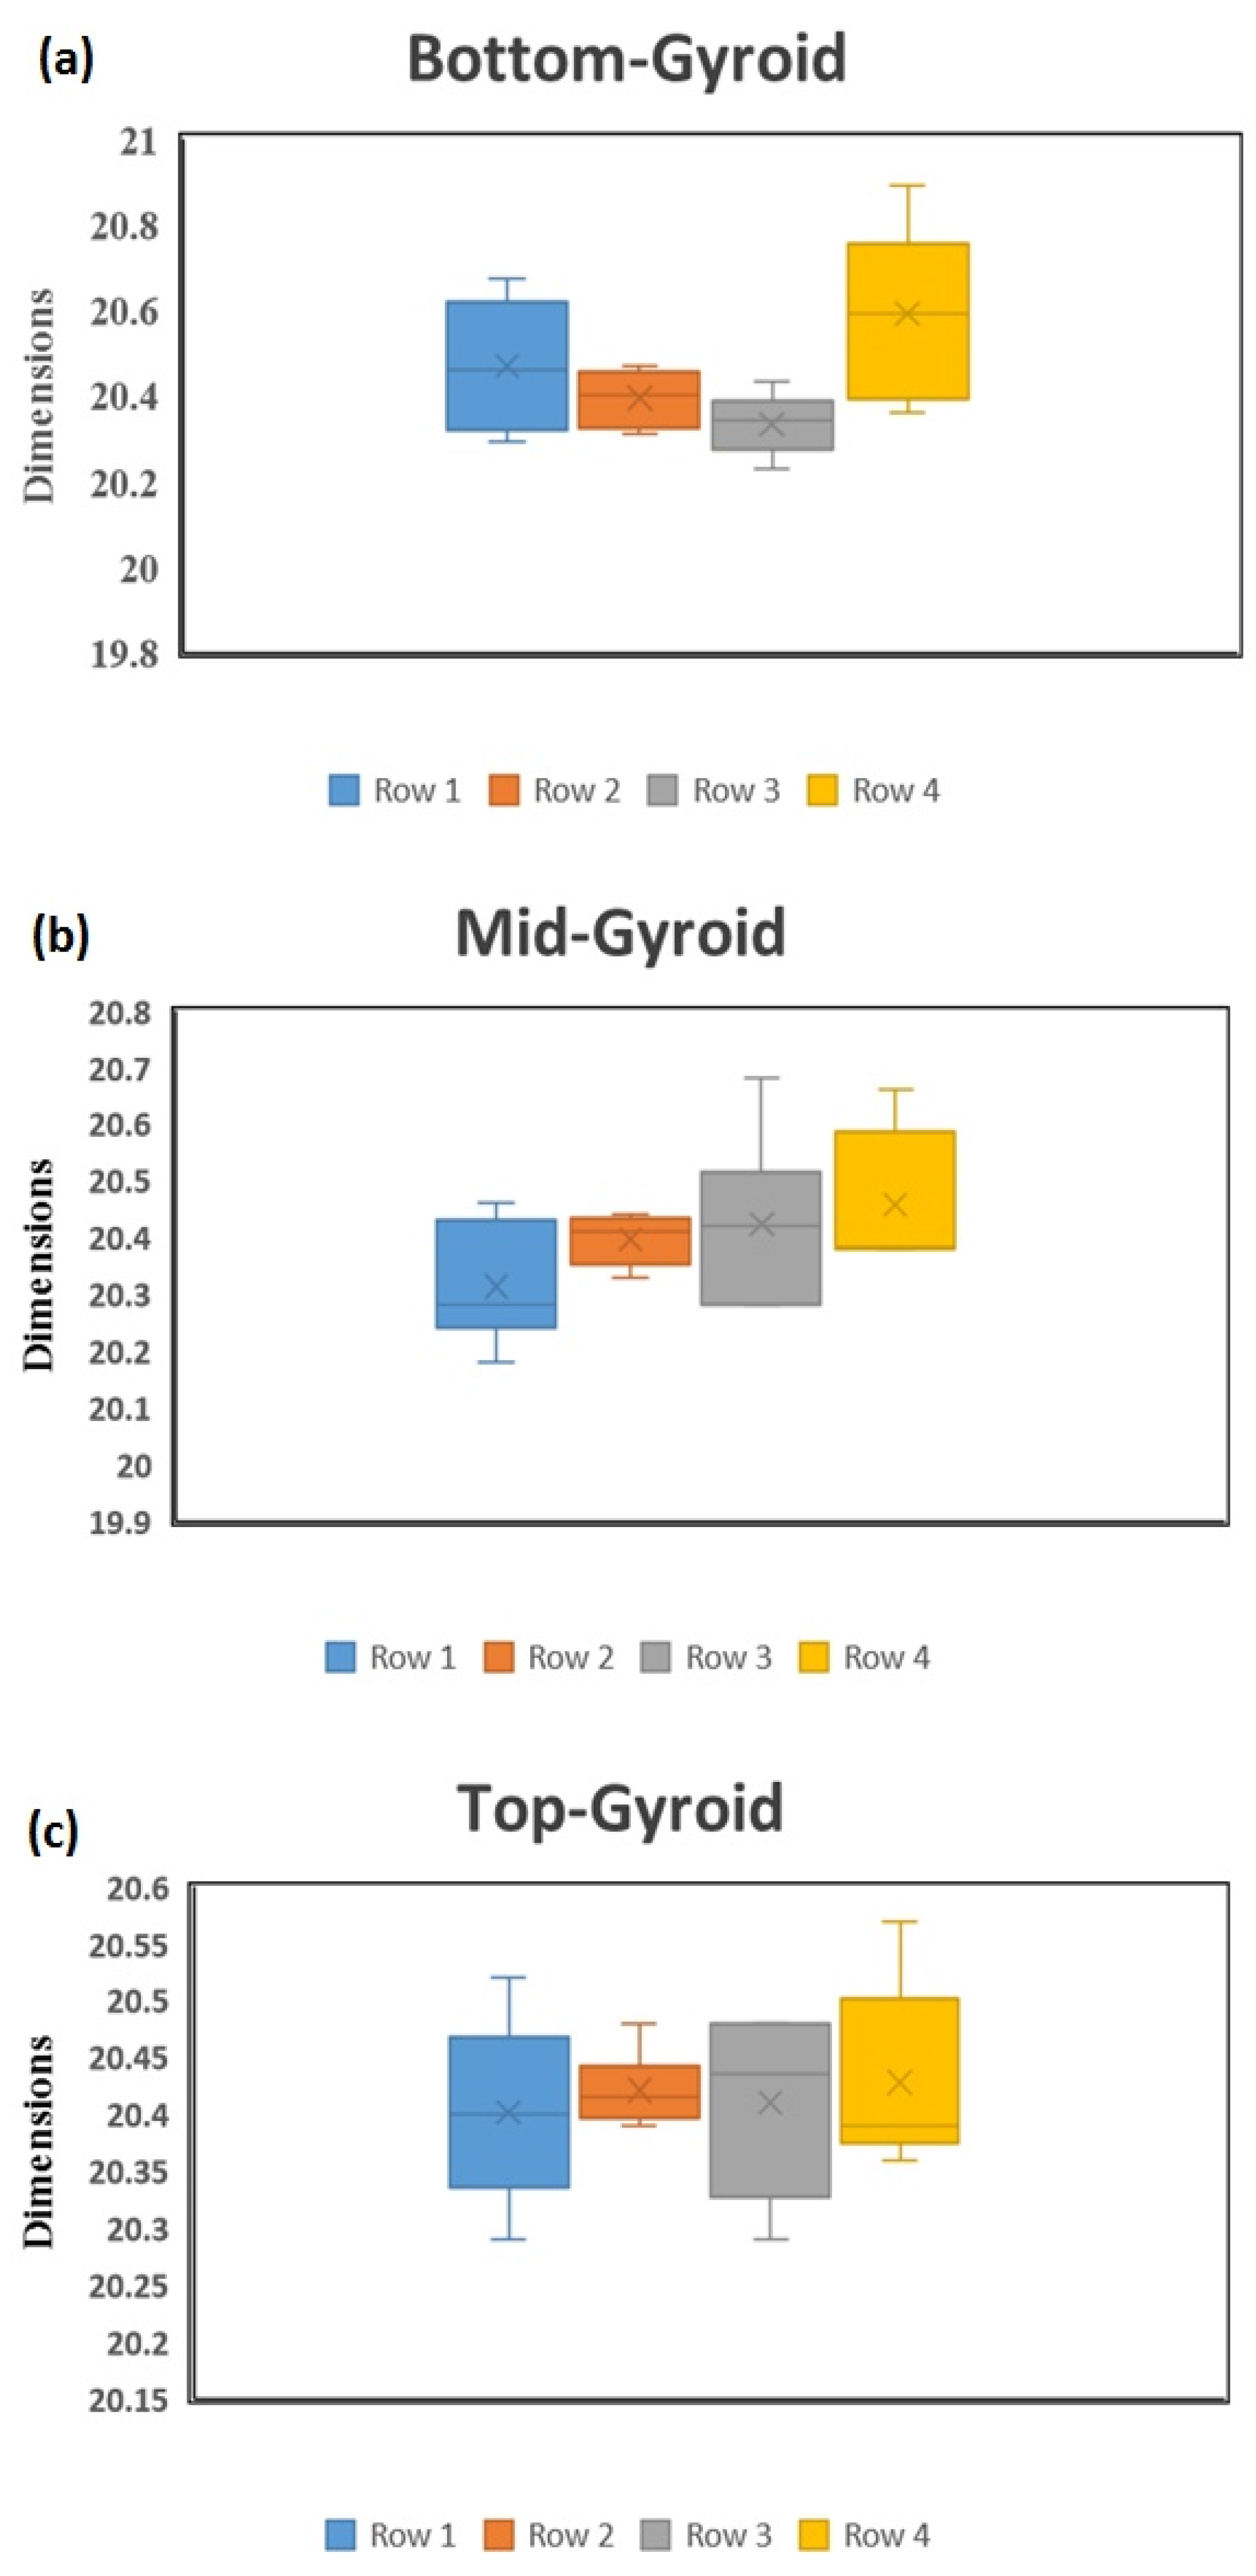
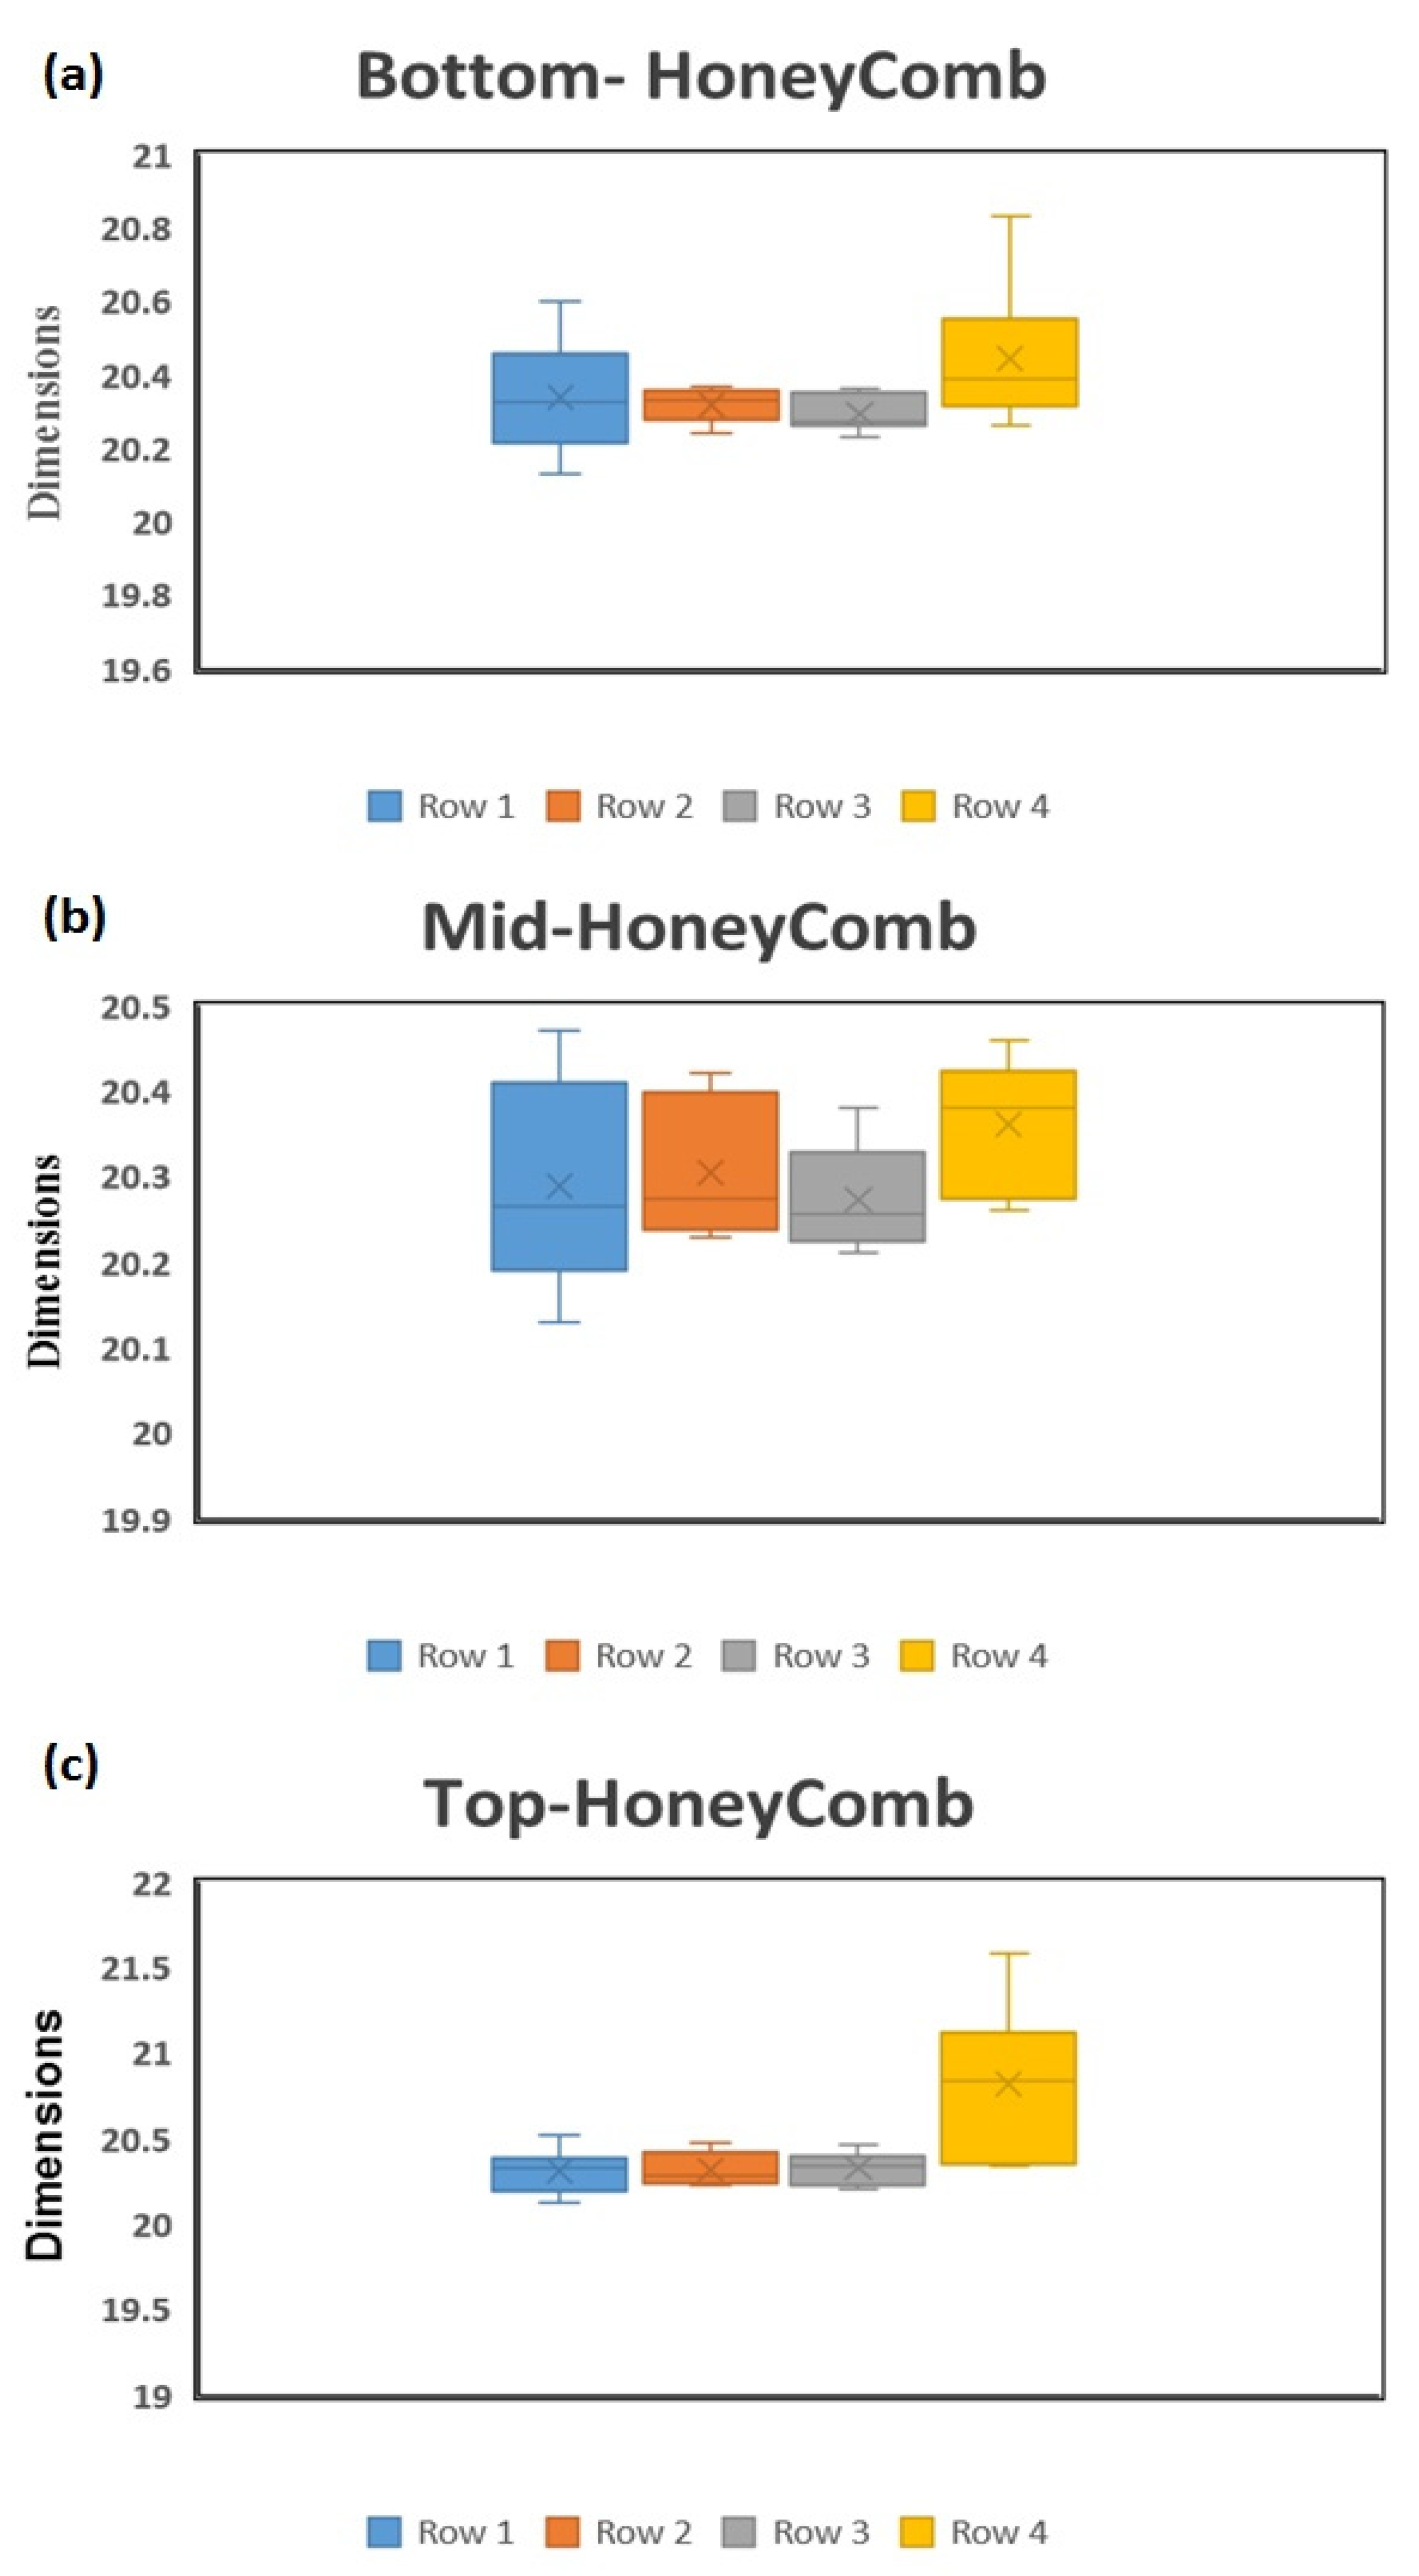
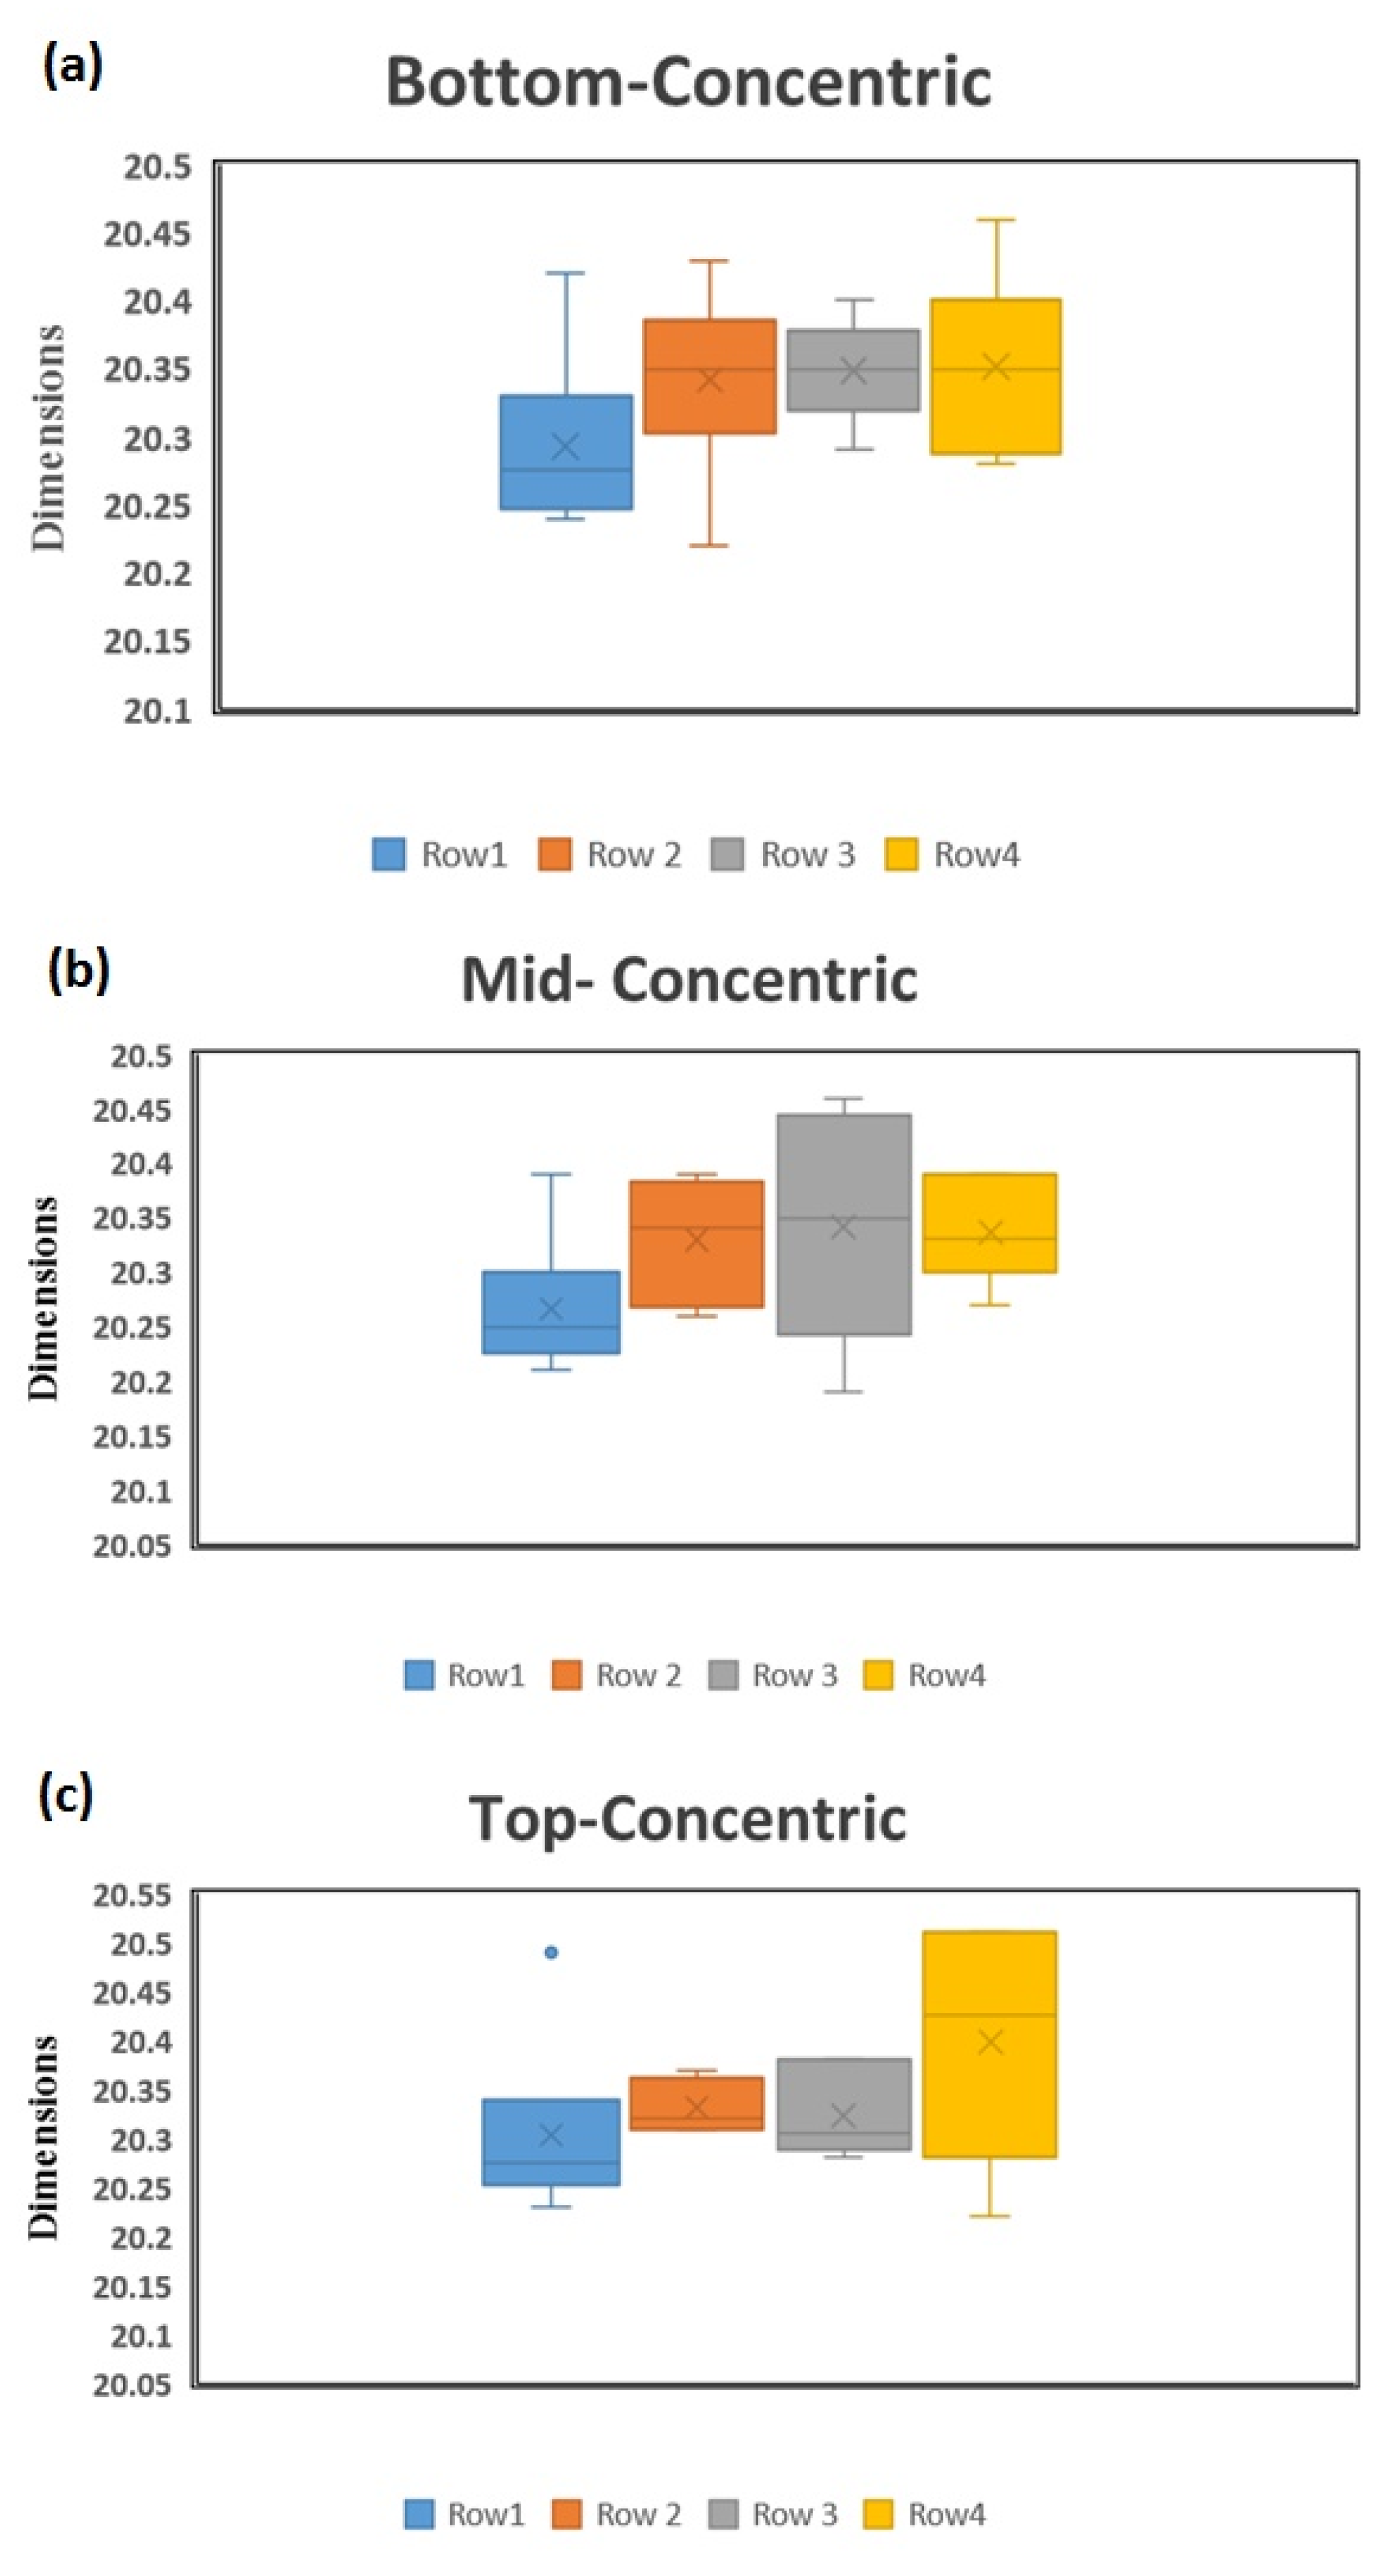
The most likely process, capable of meeting the requirement, was investigated in this study to check the highest Cpk values along the bottom, middle, and top sections of the printed samples of the different infill pattern types. The results revealed that the highest Cpk values at the bottom level, among all rows, are at set 1 (triangular pattern), which is in agreement with the findings of [
75,
76]. It has also been observed that the honeycomb dominates the increase of the process capability, whereas the other patterns suffered from a considerable drop in the Cpk, which is attributed to the fact that the honeycomb pattern is of one of the most stable shapes in nature, since this honeycomb structure has attractive properties, such as ample space area, good structural stability, high mechanical strength, low density, buffering humidity fluctuations, and thermal and acoustic insulation [
77]. Besides, the hexagonal honeycomb is widely known and intensively studied, owing to its space-filling capacity and structural stability [
78]. On the other hand, enhancing the dimensional accuracy of 3D printed products is related to many 3D printer parameters and the geometry of 3D printed components. The efficiency of 3D printers increases when the layer thicknesses are growing, and printing efficiency is high when the layer thickness is high. However, the printed product’s quality or dimensional accuracy is deficient, compared with those printed with small layer thicknesses [
79]. Moreover, the dimensional precision is affected by a variety of factors, many of which are within the user’s control. In contrast, insight was provided into specific trends in printer performance [
80]. Besides, the influence of infill design, printer selection, and part orientation will be reflected on the mechanical properties, production, and cost of parts (fabricated using material extrusion additive manufacturing systems) [
81].
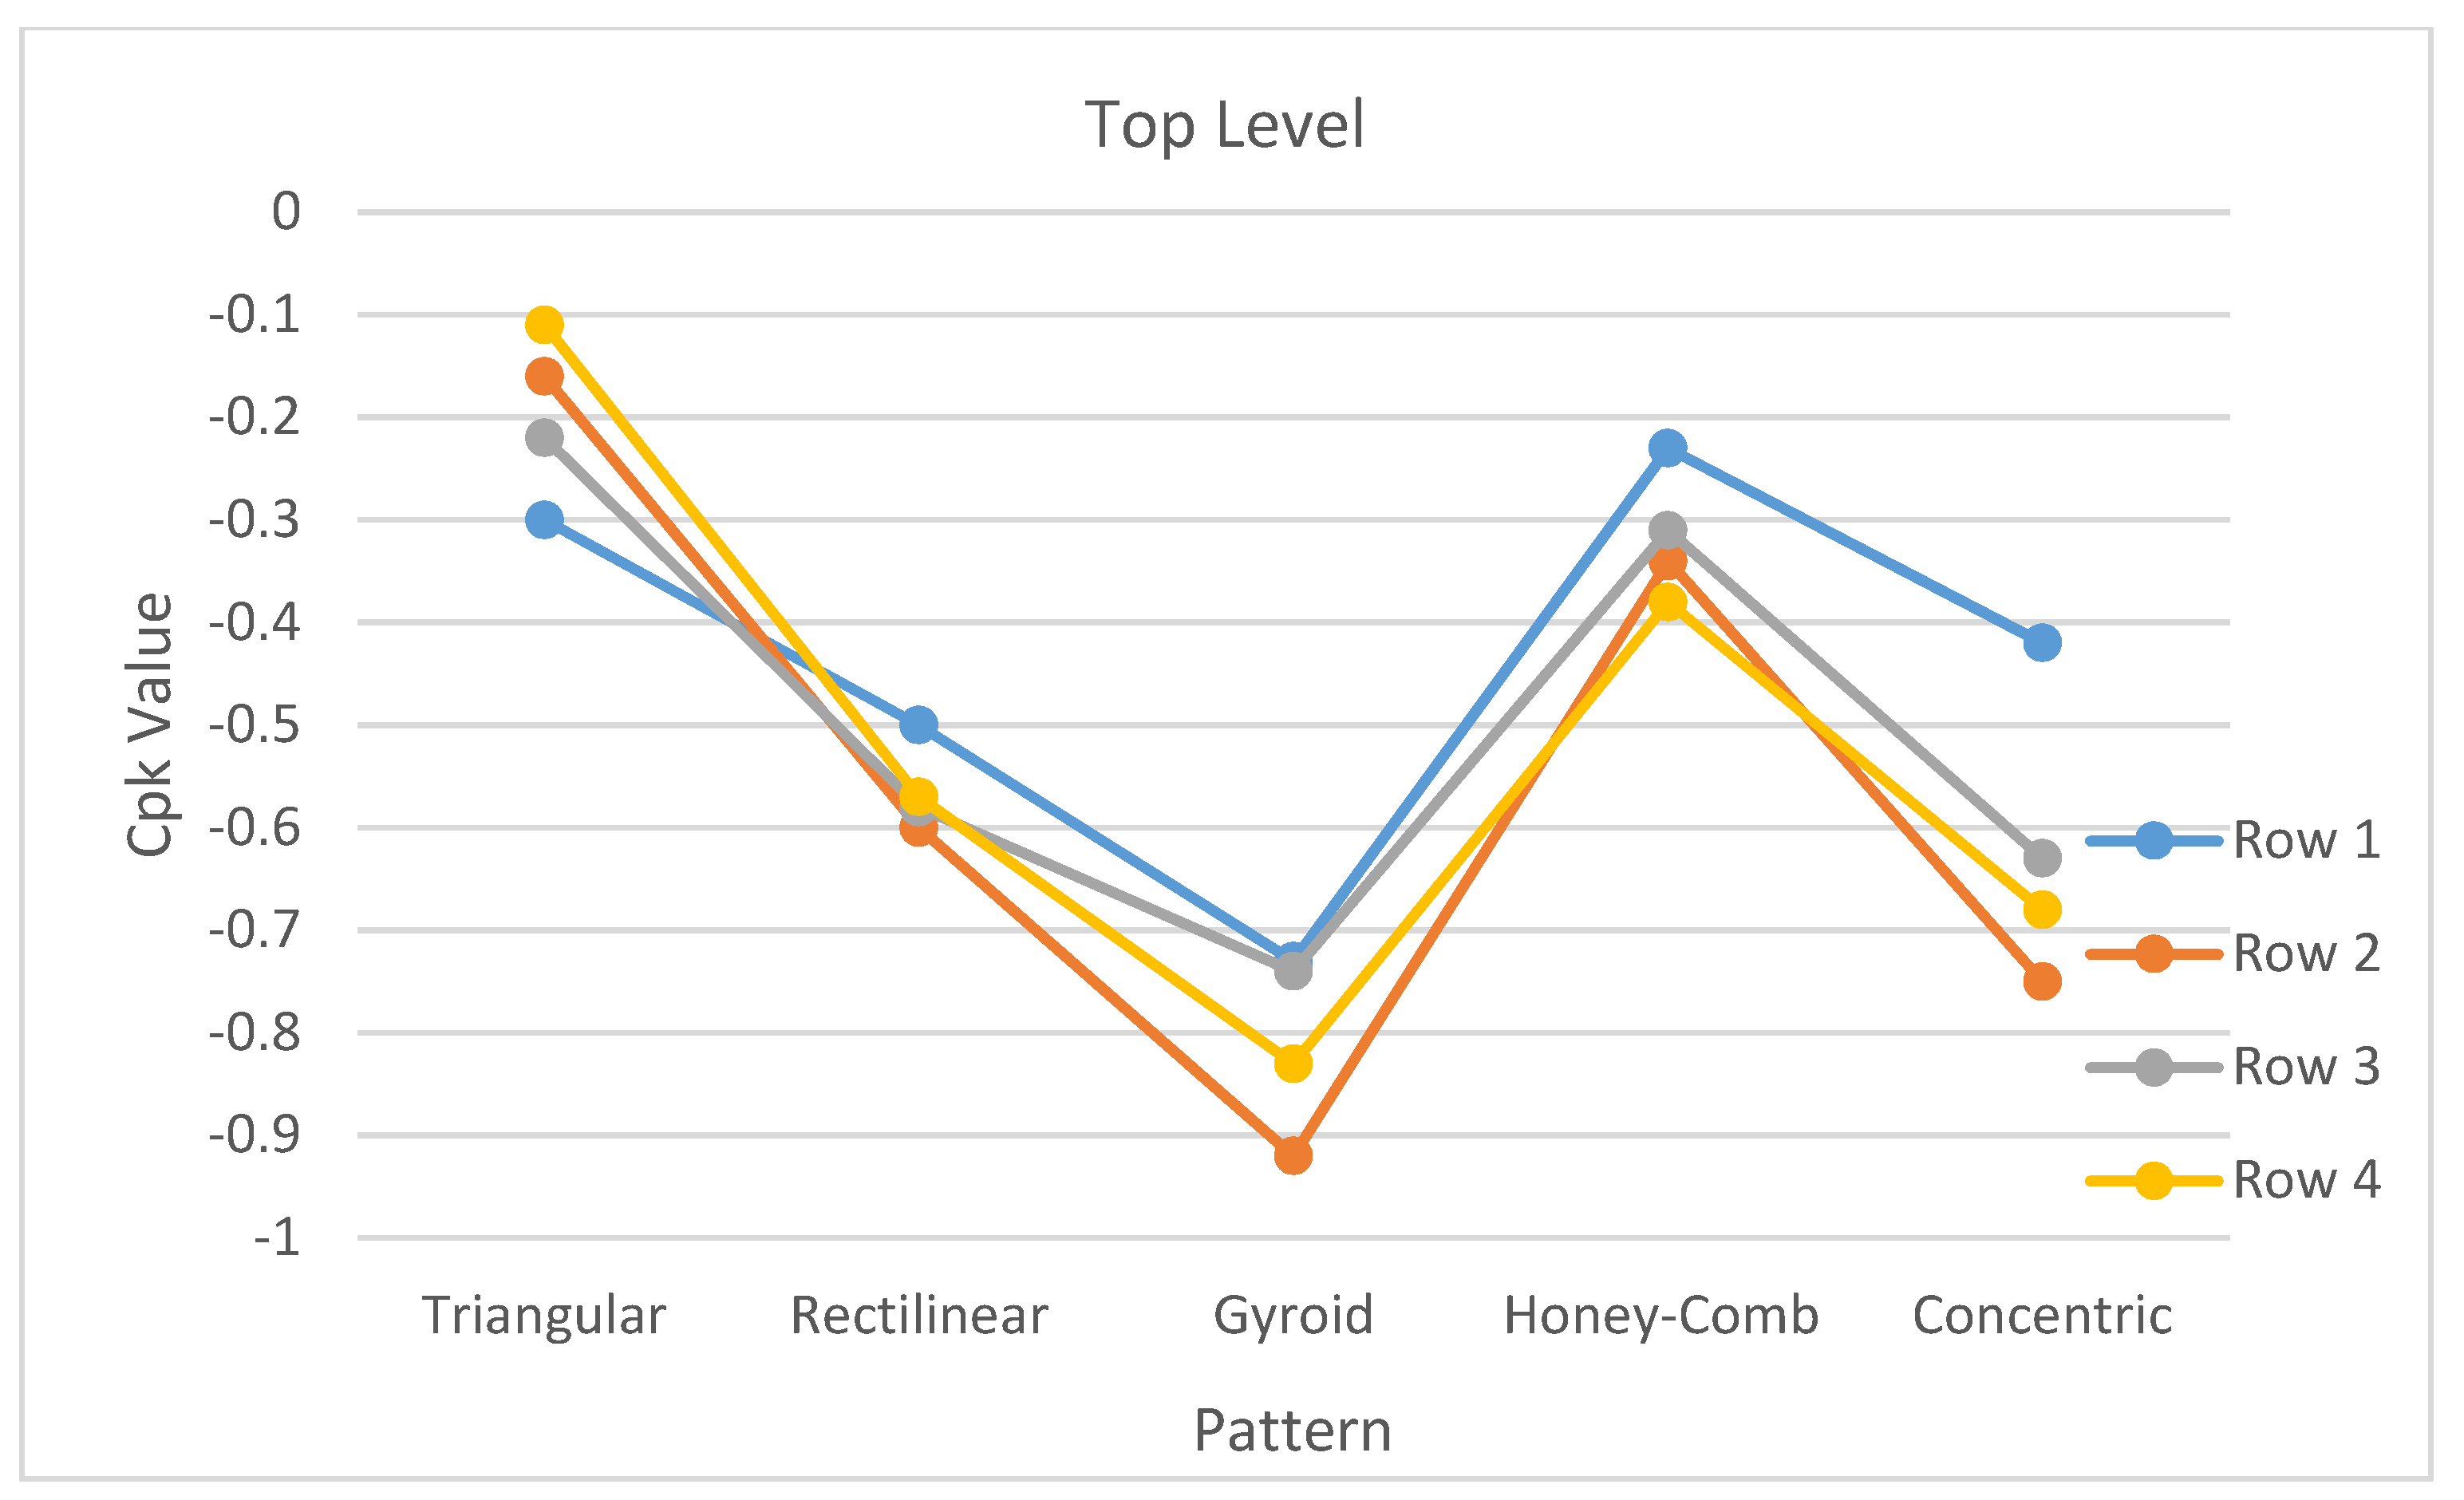
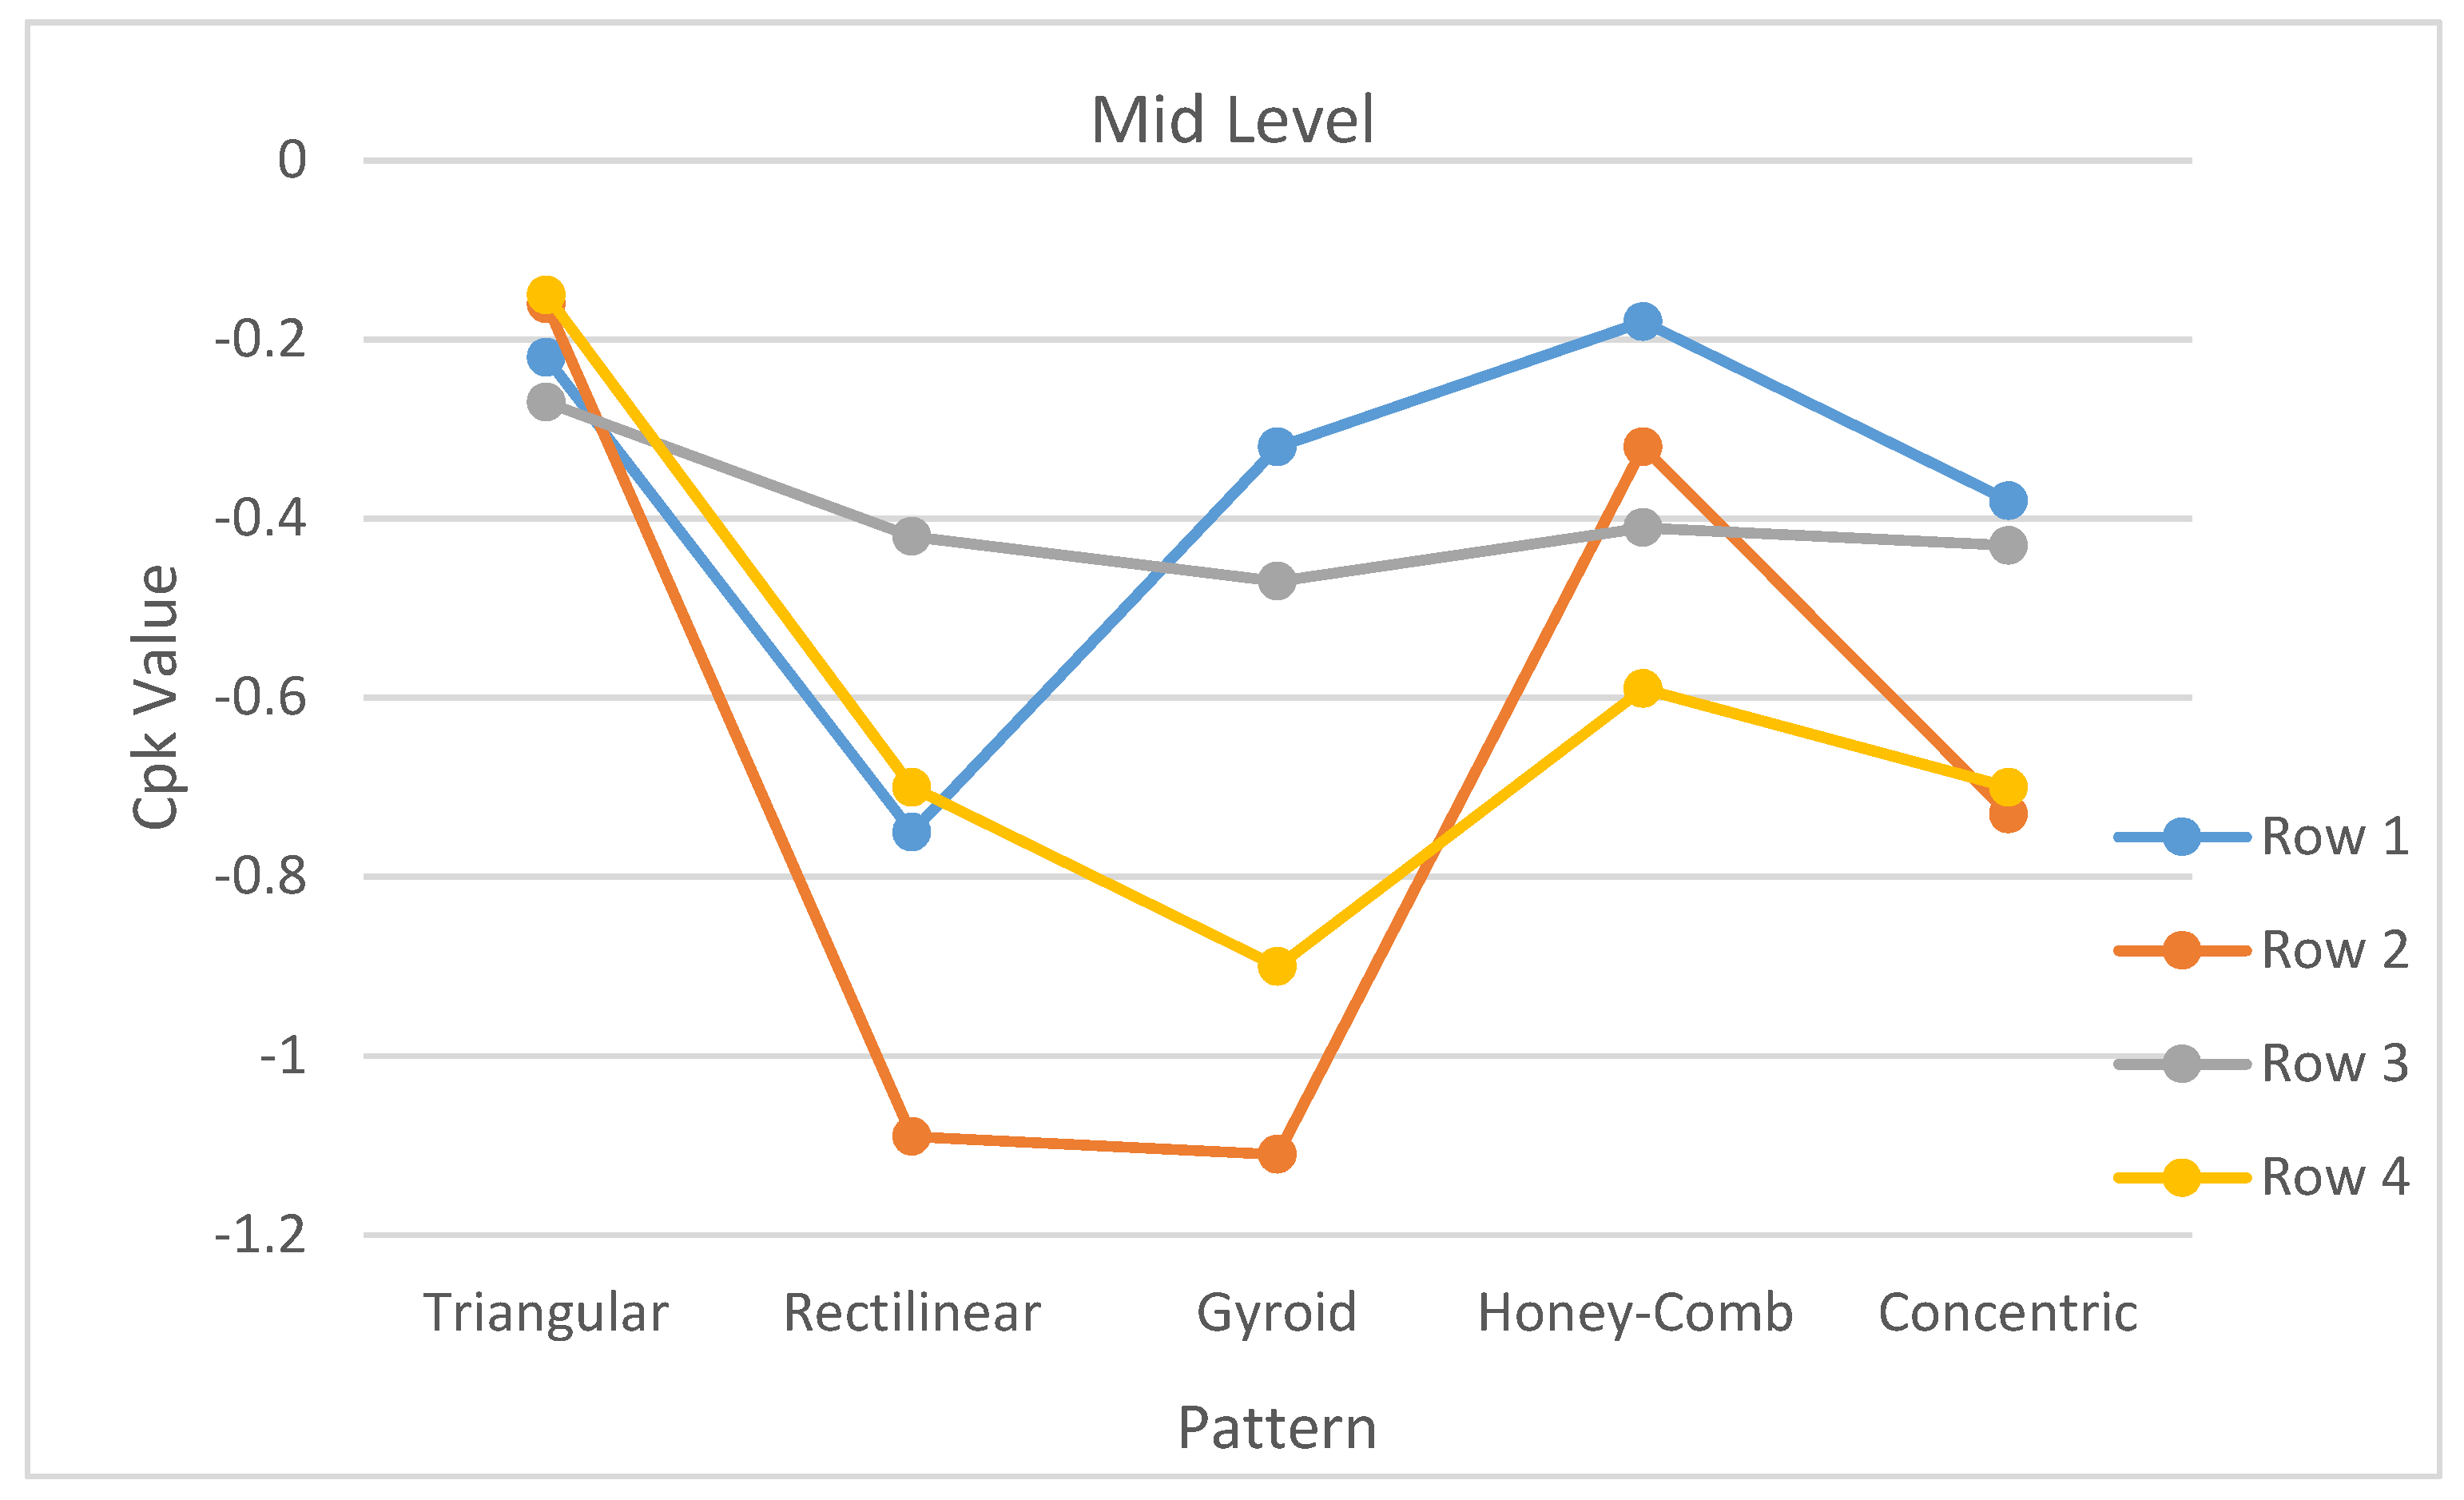
Looking at the different rows, across all the sets in the mid and top levels, it was found that the highest Cpk values were obtained by the fourth set (honeycomb pattern), which was expected at this height, caused by the transverse force applied by the nozzle while printing, since the parts are considered a cantilever beam with end applied load, as shown in
Figure 6, while the first set (triangular pattern) achieved the highest Cpk values in rows 2, 3, and 4. For the various infill structures investigated in the study, the apparent disparity in the capabilities of the 3D printing process parts is a reality. Furthermore, it is highly recommended that, when designing 3D printed products, the 3D printer’s process capability should be considered, in terms of the structure of the 3D printed samples to prevent all issues with the product [
69,
82].
In general, the assumed Cpk values were used for the standard deviations needed to establish the specification limits, whenever the existing specification is developed. One of the critical elements in creating a new specification is the establishment of appropriate specification limits for the various quality characteristics that are part of the acceptance dimensions [
83]. Process capabilities could be performed, concerning the defined tolerance limits, and the results must be analyzed based on the requirements from the statistical process control [
84]. Generally, if Cp = Cpk, the process is centered at the midpoint of the specifications, and when Cpk < Cp, the process is off-center. The magnitude of Cpk, relative to Cp, directly measures how off-center the process is operating [
85]. The use of capability indices is just one of the critical techniques, where Cpk is probably the most commonly used, as it presents the overall process capability index. Most of the Cpk values deal with specific technical abuses. However, the concept is sometimes over-applied to attributes; it is primarily effective for variable data [
86]. Moreover, the dimensional accuracy represents the degree of agreement between the manufactured dimension and its designed specification. It is the most critical aspect for ensuring dimensional repeatability of manufactured parts [
87]. According to the dimensioning and tolerancing standards [
88,
89], the dimensional accuracy of a piece is evaluated through its size (size tolerance), and shape (geometric tolerance, including form, orientation, and location).
It has been found that 3D printing can reduce a significant number of labors, which can solve the labor shortage problem [
90]. Also, selecting the appropriate material is an essential factor to reduce the 3D printing cost, especially using biodegradable material, such as FLAM (fungal-like adhesive material), where the price is in the range of commodity plastics and 10 times lower than the cost of common filaments for 3D printing, such as PLA and ABS, making it not only more sustainable but also more cost-effective [
91]. However, it is clear that the dimensional stability of the 3D printed objects is affected by the elevation of the printed parts that are attributed to the height-to-width ratio, which could be higher than two and approaching the maximum investigated height more than eight times, which will cause dimensional variation, due to the instability condition of the 3D printed objects. Shape stability of the printed part is defined as the stability of the printed layers against settlement and deformation caused by the printing of the subsequent layers [
12]. It is observed that the worst dimensional accuracy for specimens with elevated standard deviation error bars was observed, due to tilted layers positioning when models are constructed, as the influence of gravity increases distortion [
92]. It is also observed that the height dimension of the FDM test pieces displayed the worst shape error, which reached almost a maximum percentage [
93]. Besides, 3D printing technology (especially the fused deposition modeling) subjects the material to rapid heating and cooling; therefore, some degree of undesirable warpage occurs post-fabrication. Thus, four process parameters (the infill shape, infill density, number of perimeters created per layer, and layer height) attribute to the total dimensional error of a representative 3D printed part [
94]. Although changing the 3D printing layer thickness does not affect the product’s repeatability or surface roughness, changes to the layer thickness and storage time influence the dimensional stability of 3D printed parts [
95].
In essence, the influence of 3D printing process parameters on the dimensional accuracy of specimens manufactured using different polymeric materials is attributed to many factors, especially when dealing with recycled material. The nominal values are considered to determine the accuracy percentage for each specimen, in order to estimate the ability of commercial 3D printers [
96]. The 3D printed parts accuracy is not very high using commercial, low-cost printers, considering the usual types of equipment used for pieces with no special requirements. Hence, it is of technological interest to have information concerning the accuracy achievable by 3D printing processes. From a practical point of view, differences could appear between the desired part dimensions and the actual part dimensions. These differences could be generated by the behavior of the melted material, as it gradually advanced through the nozzle and deposited, layer by layer, on the 3D printing equipment plate.
5. Potential Applications in Construction
Building materials contribute to around 50% of the total cost of projects in the construction industry [
97,
98]. Undoubtedly, this high percentage contributes to the escalating costs of construction project. Contractors, therefore, should find other means and alternatives for materials that are durable, reliable, and more cost effective, in order to survive in the current competitive market and cope with the tight budgets of owners. Three-dimensional (3D) printing technologies are transforming the design and manufacture of components and products across many disciplines, but their application in the construction industry is still limited. Material deposition processes can achieve infinite geometries. They have advanced from rapid prototyping and model-scale markets to applications in the fabrication of functional products, large objects, and the construction of full-scale buildings [
99]. Studying the durability of materials and structures, including 3D printed structures, is now a critical step in better meeting sustainable development challenges and integrating technical and economic aspects from the design phase into the execution phase [
100]. In general, the current study on material printability focused on a yield stress-based mixture design approach or numerical approach for 3D printable mortars, in order to evaluate the performance of the material of different printing trials [
101]. The construction industry has embraced digitization and industrialization, in response to the need to increase productivity, optimize material consumption, and improve workmanship. Additive manufacturing (AM), more widely known as 3D printing, has driven substantial progress in these respects in other industries. A number of national and international projects have helped introduce the technique to the construction industry [
102]. It has been investigated that some of the components printed, such as walls, are oriented with single or double filaments with interior voids, even can integrate reinforcements and openings, where the geometry of the 3D printed constructions varies between the orthogonal layouts that replicate existing buildings and spherical shapes that reflect printing capabilities [
103].
In fact, 3D printed objects made by FDM can be used in several construction applications, as an alternative for masonry wall blocks, bricks, hourdi hollow blocks for slabs, interlock tiles, partition walls, and fillers. To be able to decide whether the 3D printed parts made from the plastic waste produced by FDM printers can be used as a construction material, it is necessary to conduct some measurements and tests and compare the results with those of some materials currently used in the construction of building projects, specially customized multi-layered sandwich panels [
104]. There are some concerns regarding the failure of the FDM 3D printed parts [
105], but it is promising, especially for customized underground infrastructures [
106]. The masses of all specimens were first measured by Mettler PE1600 analytical balance, and the density of each specimen was then calculated using the measured mass and the volume of the specimens. The average density was found to be 368 kg/m
3, with a standard deviation (
) of 14.5 kg/m
3. Compression tests were also performed for the five specimens. It was noticed that specimens with concentric infill patterns sustained a higher maximum applied load, with an average value of 5.058 KN. For the five printed FDM samples, the average compressive strength was calculated to be 11.24 MPa. As shown in
Table 7, concentric pattern FDM had the highest average compressive strength value of 12.67 MPa and a standard deviation (
) of 0.987 MPa. However, the gyroid pattern FDM has the lowest average compressive strength value of 9.63 MPa and a standard deviation (
of 0.15. The calculated density and compressive strength values for the five printed patterns are listed in
Table 7.
For comparison purposes, some selected non-structural (non-load bearing) elements used in the traditional construction of building projects have been used in this study and compared with the five three-dimensional printed FDM samples. As a matter of fact, the main purpose in this study was to investigate the possibility of using these 3D printed FDM elements as an alternative to traditional non-load bearing construction elements, if it is found feasible. Since 3D printing technology is now booming and becoming a contemporary issue in the country and worldwide, this study suggests the use of 3D printing to produce construction elements from waste plastics and compare it with the traditional elements used for building construction, in terms of their mechanical properties and cost. Several research efforts have used a similar approach to investigate the feasibility of 3D printed elements, as compared to traditional ones. Ortega et al., 2020 [
102], for example, investigated the use of 3D printed concrete construction objects and discussed whether the performance of the materials produced using 3D printing could be superior to traditional ones. When conducting this comparison, the authors relied on the data obtained from the industry for these traditional non-load bearing construction elements. Other efforts, along this line, can be found in [
107,
108,
109,
110].
The selected traditional construction elements include lightweight concrete hollow blocks, ultra-lightweight concrete hollow blocks, lightweight hourdi hollow blocks, lightweight concrete bricks, interlock cement tiles, and regular gypsum board drywalls. Since these selected, non-structural elements are traditionally produced by many manufacturers in the country, the mechanical properties of such elements with the same physical dimensions are almost the same. The average density and compressive strength values for these selected traditional construction elements, as received from the vendors, are shown in
Table 7.
Table 7 also shows the costs of the 3D printed objects, as well as the costs of the selected traditional construction elements suggested in this study. These costs are shown in United Arab Emirates Dirham (AED) per square meter for each of these elements, where one US
$ equals 3.68 AED. The dimensions associated with the different types of the selected traditional elements are as follows:
- -
Type A: 20 mm × 20 mm × 40 mm;
- -
B: 190 mm × 190 mm × 390 mm;
- -
C: 200 mm × 200 mm × 400 mm;
- -
D: 200 mm × 200 mm × 410 mm;
- -
E: 100 mm × 200 mm × 400 mm;
- -
F: 80 mm × 100 mm × 200 mm;
- -
F: 60 mm × 100 mm × 200 mm;
- -
H: 9.5 mm thick;
- -
I: 12.5 mm thick;
- -
J: 15 mm thick.
In this study, the cost per square meter of producing the 3D printed objects made from plastic waste (considering the dimensions of these objects) includes the cost of the 3D printer itself (initial investment cost), direct cost of materials, cost of power consumption, direct labor cost, and overheads costs. The cost of these items are the standards costs that includes all cost components for any manufacturing process, including all 3D printed materials [
111]. The densities, compressive strengths, and costs for the traditional construction elements considered in this study and listed in
Table 7 were obtained from several local vendors. These local vendors provided similar data for the same component with some small differences and the average values of the density, compressive strength, and cost were considered and listed in
Table 7. Examples of these local vendors are Ducon Industries [
112], Emcon [
113], Phoenix Concrete Products [
114], Bucomac Block Factory [
115], and Emirates Blocks Factory [
116]. The cost per square meter used in this study provides an initial cost indication for the purpose of comparison only, while the cost of erecting these elements onsite is not considered in this study.
It was noticed that using 3D objects made from plastic waste using FDM is less costly than traditional lightweight concrete hollow blocks and ultra-lightweight concrete hollow blocks and has higher compressive strengths. Also, printed 3D with gyroid pattern plastic waste has less cost per square meter, as compared with that of lightweight hourdi hollow blocks with a much higher compressive strength. Although the cost per square meter of other patterns of 3D printed objects are slightly higher than those of the lightweight hourdi hollow blocks, this extra cost is offset with their much higher values of compressive strength. It is also noticed that the cost per square meter of 3D printed objects was around 41% less than that of the traditional lightweight concrete bricks, with a higher compressive strength (more than twice). It is worth mentioning that, although the 3D printed objects used in this study are much more expensive than traditional gypsum board drywall, project managers may consider them, since they have much higher compressive strength. However, it is not feasible to use 3D printed objects using plastic waste as an alternative for interlock cement tiles, since they are more expensive and have less compressive strength.
Despite the limited applications of 3D printed objects in the construction industry, the experimental results of this study explored new horizons in using polymeric waste material, in general, to shape construction elements using 3D printing. As a case study, waste was used to produce 3D construction objects; however, any other plastic waste can be used. Also, the experimental test results can be applied to other industries, as well. For a more comprehensive and precise comparison, the authors suggest conducting further studies in the future to investigate the acoustics properties, fire resistance, durability, heat insulation, water absorption, thermal properties, and labor productivity related to 3D printed elements using plastic waste, as compared to the traditional construction elements considered in this study and other traditional construction components. As a future extension to the present study, the authors are currently consulting other experts in areas related to acoustics, fire resistance, and thermal properties of 3D printed elements to get their feedback and help in conducting such studies and provide their recommendations in this regard. Since the infill pattern of the 3D printed objects will affect the acoustic and thermal properties of these objects, the infill pattern and compressive strengths of 3D printed objects can be manipulated and customized based on the actual requirements and applications in construction. This customization cannot be achieved by the traditional commercial production of construction elements.
6. Conclusions
The 3D printing technology has developed rapidly in recent years [
117], due to its significant manufacturing and industrials capabilities, which opened new horizons in different sectors [
118,
119]. However, the technology is no longer as widely used as it used to be, due to certain drawbacks and restrictions, such as the high cost associated with the manufacturing operations. In this study, the process capability of 3D printed samples, with various structures and pattern designs, was considered to reduce unforeseen expenses. It was noticed that Cpk values behaved inconsistently, when comparing the five infill patterns discussed in this study. For example, the Cpk value declined with the
Z-axis of the triangular pattern printed sample in the first row only, while it increased in the third row only in the honeycomb pattern. However, it was noticed that the triangular pattern set has the highest Cpk values, as compared with other sets, which means that it has more stability among all other infill structures. In general, the study revealed that for the section of small dimensions with large heights, there is a possibility of having discrepancy in the cross-sectional dimensions of the printed parts due to the deflection of the parts that is reflected in the mean values of the measured dimensions, as well as in the process capability values. This is attributed to the additional vibration that the printed part was subjected to due to its unique design, making the parts subjected to the dynamic excitation of the printer nozzle movement while printing. This could also be a consequence that cannot be avoided in the FDM process, and increasing the printing speed will make the problem even worse. Moreover, it is important to mention that the design must optimize the spaces between the printed samples to the minimum. This is important to reduce the possibility of the long travel of the printing head while moving from one part to another, resulting in the application of an additional force of the printed part.
The study also concluded that 3D printed material from plastic waste is considered a feasible alternative for several traditional construction elements, such as lightweight concrete hollow blocks, ultra-lightweight concrete hollow blocks, and lightweight concrete bricks, since they are less expensive and have higher compressive strength. The cost per square meter of 3D printed objects is around 41% less than that of the traditional lightweight concrete bricks with a higher compressive strength. It was also noticed that, although the 3D printed objects used in this study are more expensive than traditional gypsum board drywalls, they may be considered as they have much higher compressive strength. It was also observed that using 3D printed object with plastic waste is not feasible as an alternative for interlock cement tiles, since they are more expensive and have less compressive strength. However, it might be considered as an alternative for gypsum board partition walls, since it provides a much higher compressive strength (more than three times).


