1. Introduction
There is growing evidence that the projected climate change has the potential to significantly affect public health [
1,
2]. Exposure to extremely high or low temperatures caused by climate change can increase the risk of mortality and emergency visits for cardiovascular diseases [
3,
4,
5,
6].
Studies have shown that climate change may have a series of direct and indirect impacts on residential buildings [
7]. People spend about 90% of their time in indoor environments, with 69% of the time spent in the home [
8]. In addition, the elderly spend up to 95% of their time between the bedroom and the living room [
9]. These results indicate that the indoor temperature may be a more crucial factor influencing human health compared with the outdoor temperature and the elderly will experience the effects of indoor climate change.
Aging is associated with a decreased compliance of the central arteries due to age-related changes in the components in the artery, which will lead to the occurrence of cardiovascular disease [
10,
11]. Studies have demonstrated that the elderly have a higher risk of disease and lower ability to respond to temperature change than younger people [
12,
13]. This phenomenon indicates that the elderly will face more serious chronic disease health risks, which increase with not only climate change but also global aging [
14].
According to a United Nations report, the global population older than 65 years was 703 million in 2019, and East Asia and Southeast Asia are the regions with the largest elderly population in the world (260 million) [
15]. In Taiwan, the population older than 65 years was 14.6% in 2018, which reached the standard of an aged society, and it is estimated that it will become a super-aged society in 2025 [
16]. This report shows that the problem of Taiwan’s population aging is serious. Therefore, under the predicament of climate change and aging, an elderly risk assessment with respect to the indoor environment under climate change is important.
Statistical data show that, in Taiwan, about 47.7% of residential buildings are between 20 and 40 years old, and 28.9% are more than 40 years old [
17]. In the past 30 years, the rate of temperature increase in Taiwan has been more pronounced than the average worldwide [
18]. As the climate changes, the obsolescence of buildings, which increases susceptibly to adverse weather conditions, increases the vulnerability and health risk of the occupants [
19]. Many current buildings consider form and function in their design, but the influence of the climatic environment during the life cycle of buildings is ignored. However, the building envelope should have an adaptive ability to address climatic conditions and to adjust to unpredictable situations. In this context, building renovation plays a key role in ensuring occupants’ safety.
Adverse temperature events certainly cause discomfort and disease in the elderly. The adaptive behavior of occupants is essential because it can activate adaptive systems, such as ventilation. In subtropical climate zones, natural ventilation is regarded as an ideal adaptive strategy [
20,
21]. Natural ventilation induces and exhausts air into the indoor and outdoor environment through natural wind and thermal buoyancy, which demonstrates great potential in regulating indoor temperature [
22,
23]. Tu et al. (2004) conducted a questionnaire to investigate the habit of ventilation in the three major metropolitan areas of Taiwan. Nearly 38% of the respondents kept their windows open all day long, and 65% left their windows open when they were at home [
24]. Only 10% closed their windows often. The results showed that Taiwanese individuals tend to maintain indoor ventilation. However, long-term natural ventilation means that high-level outdoor pollutants may be transported indoors [
25,
26].
Around 91% of the world’s population lives in places where air quality levels exceed the WHO limits, and 35% of global premature deaths from air pollution occur in East Asia [
27,
28]. Additionally, due to seasonal dust storms and industry emissions, the outdoor air pollution in Taiwan is an obvious problem.
The high pollution levels are transported into the indoor environment by ventilation and infiltration airflows. Indoor exposures accounted for 66–87% of total exposure to PM
2.5 of outdoor origin [
29,
30]. Exposure to high levels of PM
2.5 can increase the risk of disease, such as cardiovascular disease and respiratory diseases [
31,
32], and even premature death [
30,
33]. In ventilation adjustment behavior, the conflict between temperature and PM
2.5 is predictable. Therefore, comprehensive consideration of temperature and PM
2.5 must be conducted for ventilation strategies.
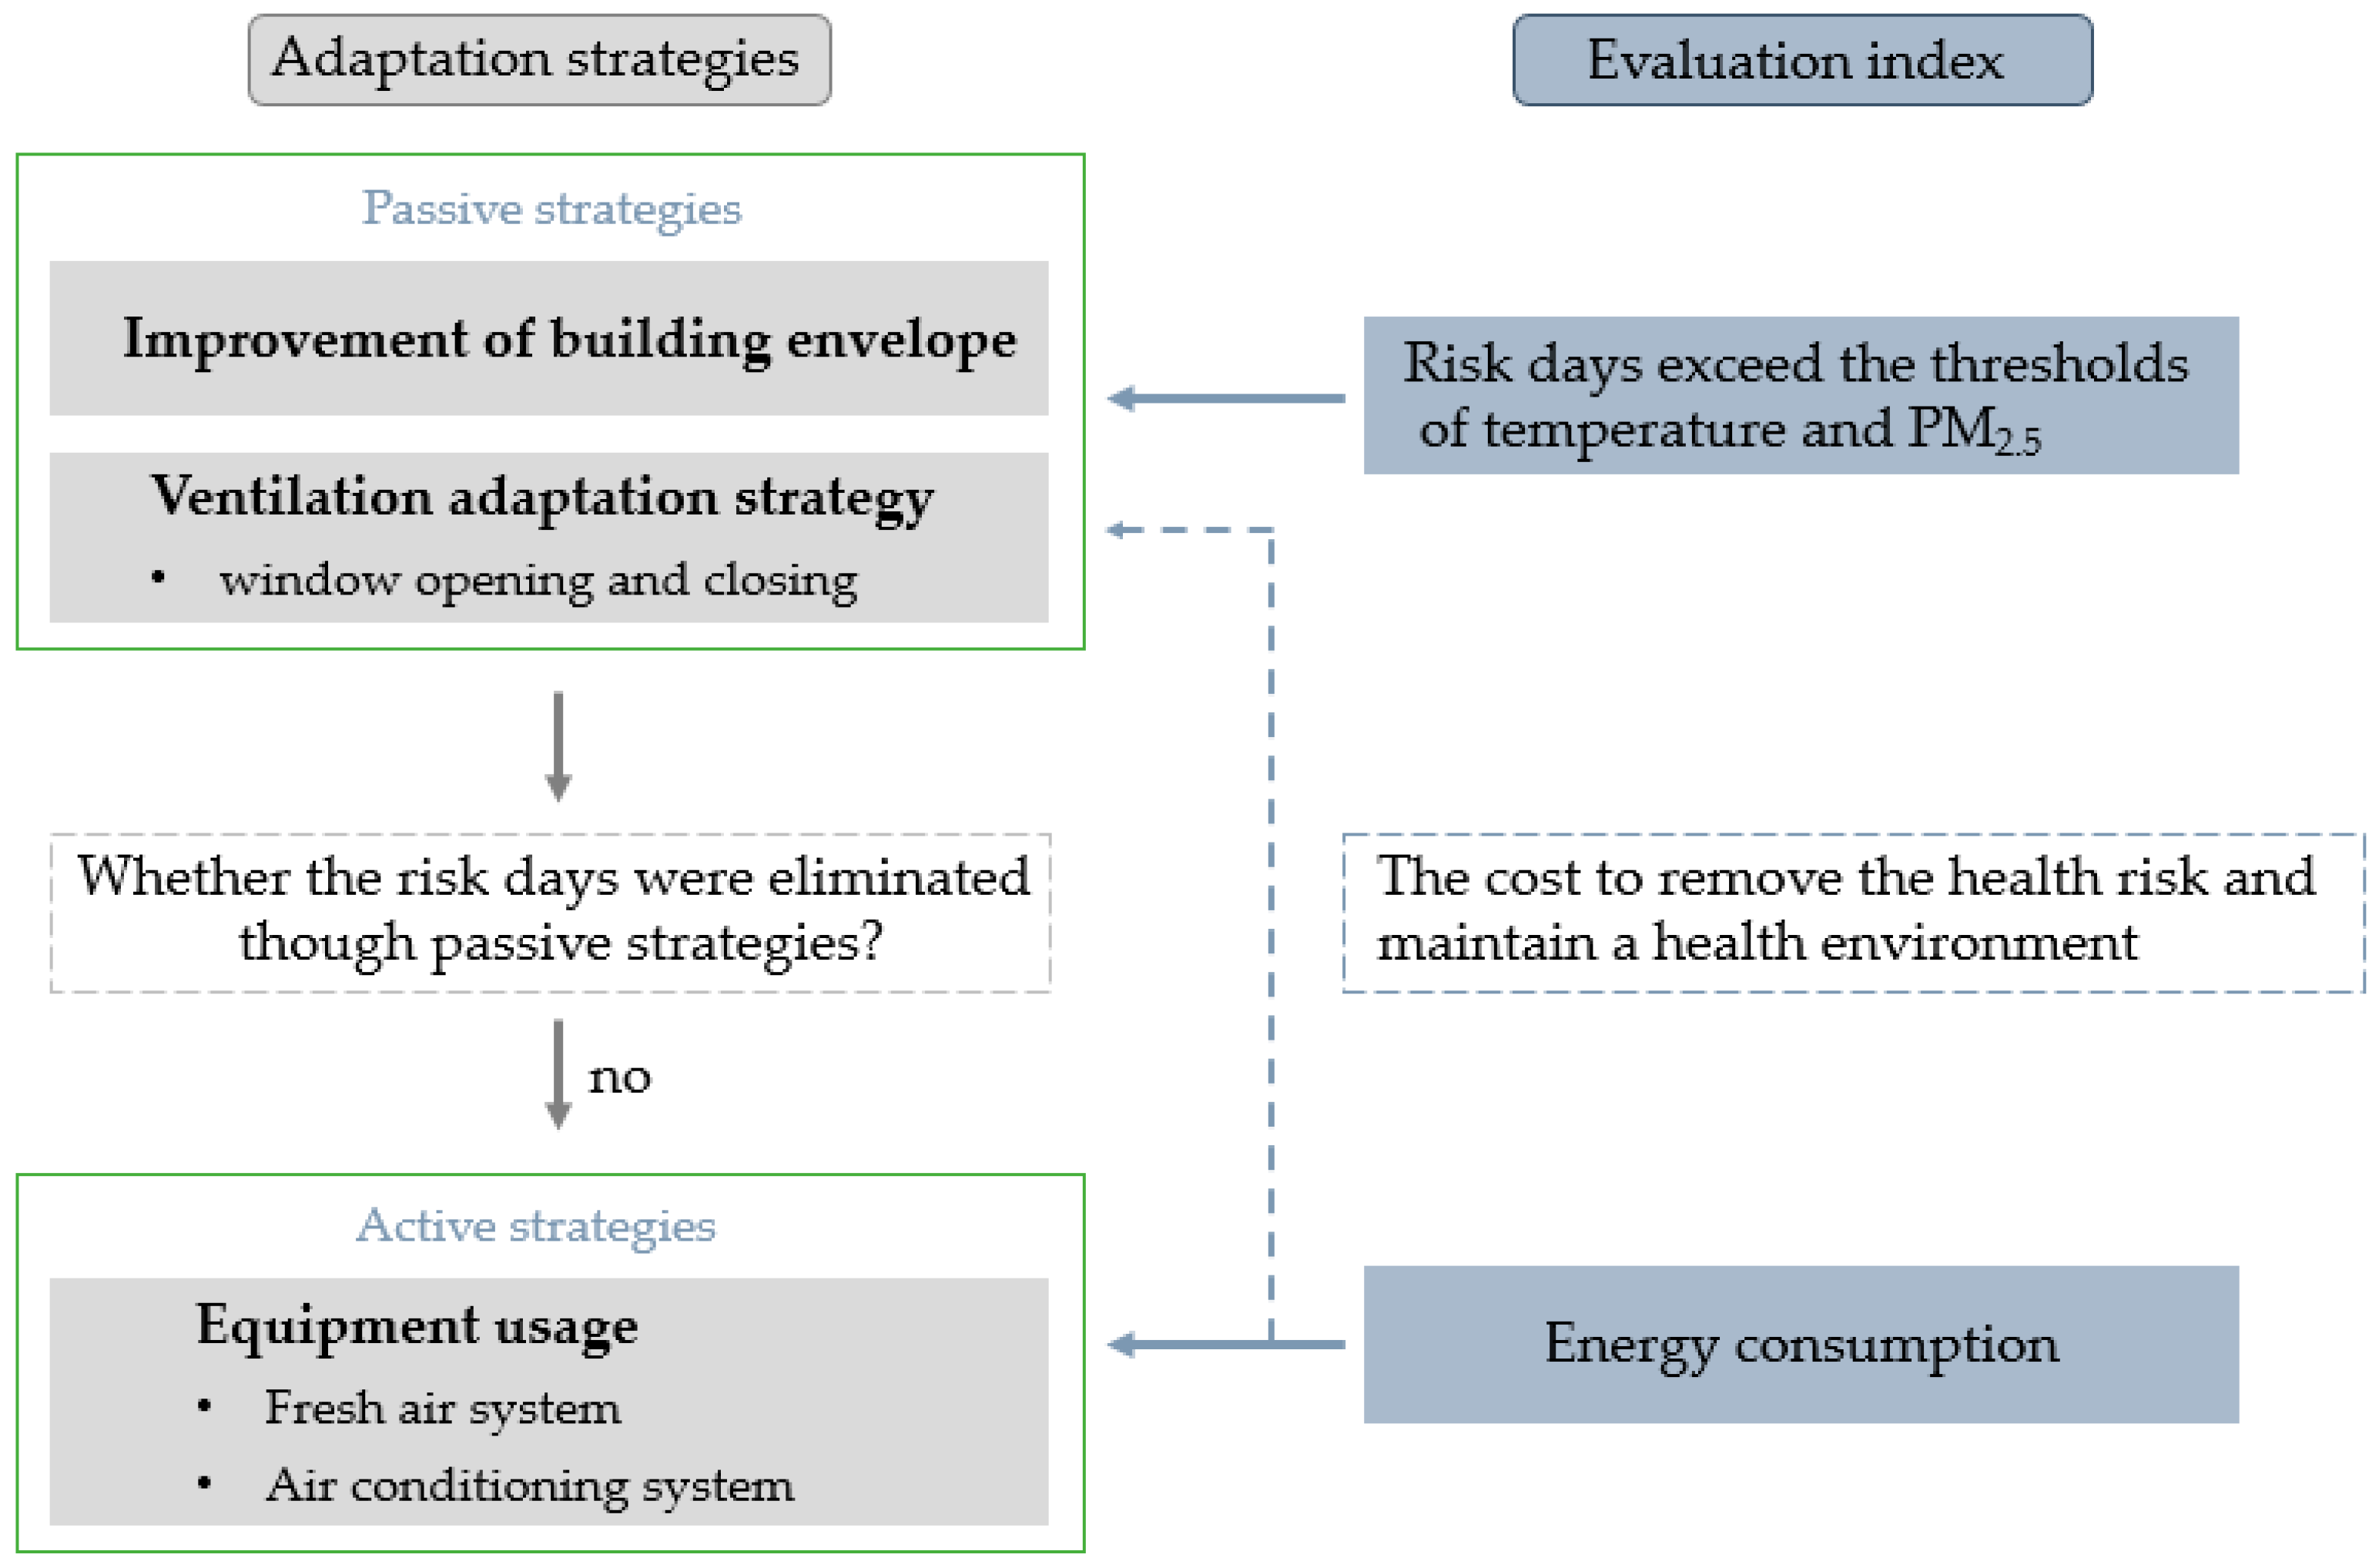
The objective of this research is to propose adaptive suggestions for residential buildings in Taiwan according to the health risk of the elderly who stays indoors for a long time. According to the current situation in Taiwan, two main directions were focused (
Figure 1). First, in response to climate change, the obsolescence-building envelope must be improved to resist adverse weather conditions. Additionally, residential buildings rely on natural ventilation. Under an environment with high indoor temperature and high levels of outdoor PM
2.5, the impact of natural ventilation on indoor temperature and PM
2.5 will be more complicated. Therefore, we propose a suggested window-opening scenario to minimize the health risk as the second goal of this research. Risk days, i.e., the number of days that exceed the threshold of health risk, were used to evaluate the improvement effect of renovation of the building envelope and adjustment of the natural ventilation habit. Considering that the use of equipment increases global warming, passive adaptive strategies are given priority. If the passive adaptive strategies cannot fully control the indoor health risks, the usage of equipment is the last resort, but simultaneously, the evaluation of energy consumption, which can be seen as the cost to maintain the health environment, is necessary.
2. Materials and Methods
2.1. Simulation Software of Indoor Environmental Analysis
To evaluate the health risk of the living environment, this study simulated the indoor temperature and PM
2.5 using EnergyPlus version 8.7.0 and CONTAM version 3.2.0.2, respectively, both of which are commonly used building performance simulation software programs. CONTAM is used to simulate airflow and pollutant diffusion but lacks a multi-zone temperature calculation module. Therefore, users need to input the indoor temperature to drive the calculation of thermal buoyancy when simulating pollutant transmission [
19]. EnergyPlus is building energy simulation software that can perform accurate heat transfer calculations but lacks the ability to simulate particulate pollutants, such as PM
10 and PM
2.5. Therefore, to conduct a comprehensive evaluation of temperature and PM
2.5, a coupled EnergyPlus and CONTAM simulation must be performed (
Figure 2), including an energy balance and HVAC system airflow by EnergyPlus and pollutant distribution between zones by CONTAM [
34].
The indoor temperature triggers users to adjust the window opening and closing, affecting the PM2.5 that enters the room from outside. Then, to reduce the health risk caused by PM2.5, the adjustment behavior of the window opening and closing must be carried out again. The behavior further affects the indoor temperature, thus forming a loop.
Therefore, the EnergyPlus and CONTAM couple simulation in this study first used the indoor temperature simulated by EnergyPlus to CONTAM to analyze the indoor PM2.5 distribution caused by the ventilation behavior of the window opening and closing, which is triggered by temperature. To avoid the health risks of ventilation-related PM2.5 pollutants, the PM2.5 health risk was checked, and then the ventilation behavior was triggered again. This time, the behavior of opening and closing windows considered the indoor PM2.5 concentrations. Then, the latest window-opening schedule was returned to EnergyPlus to perform the indoor temperature simulation again. The simulation went back and forth until the health risk was considered constant and could not be affected by the change of the window-opening schedule.
2.2. Boundary Condition of the Simulation
The boundary conditions required for simulation include weather data, model information, physical parameters of the building envelope, and the window-opening schedule. We describe the latter two in detail in the following chapters.
The simulation was located in Tainan, Taiwan, where the longitude is 120°20′ E and latitude is 23°00′ N. TMY3 was used as the weather data in EnergyPlus. In CONTAM, the temperature was input by EnergyPlus, and the monitoring data of the Environmental Protection Administration of Taiwan were used for the background concentration of PM2.5.
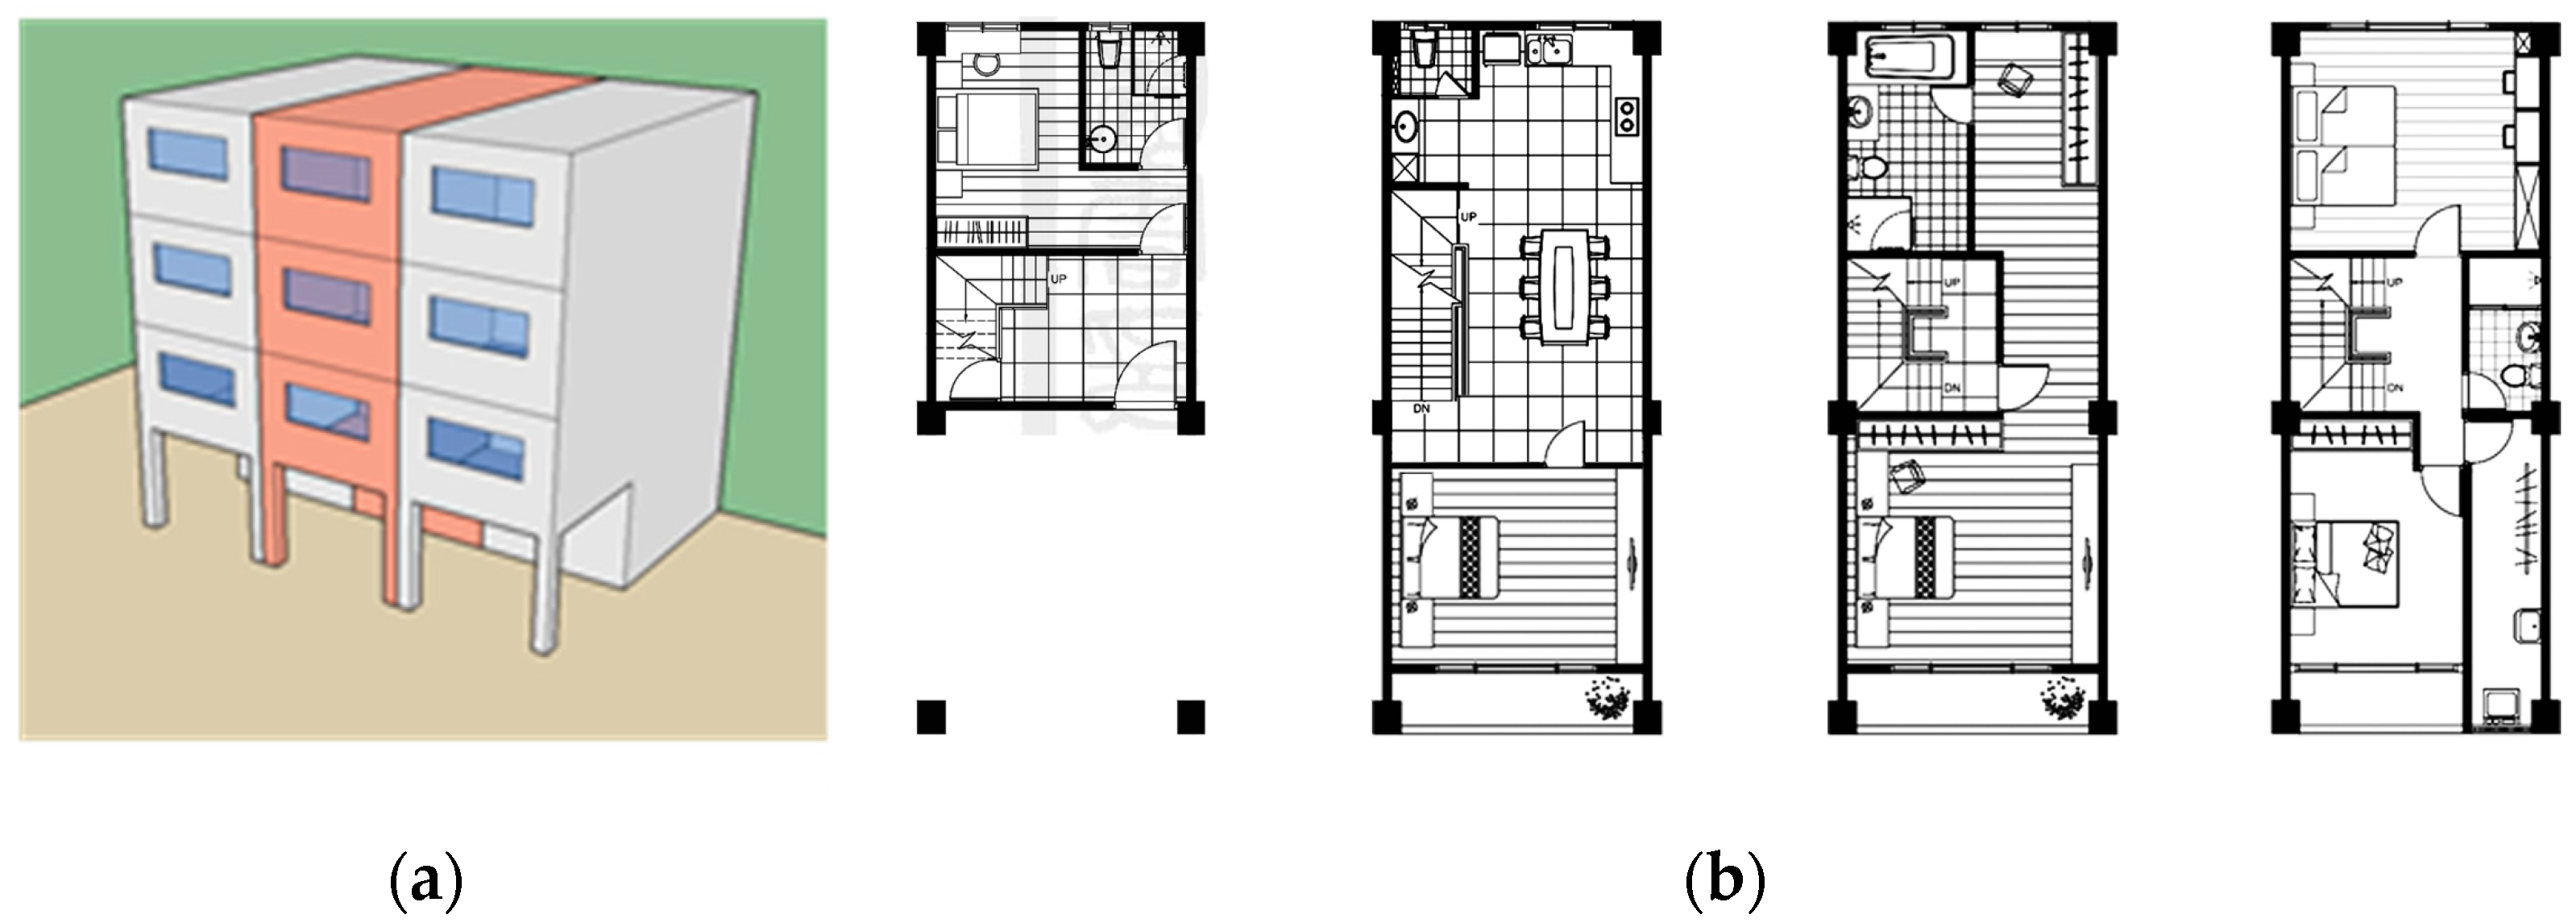
As shown in
Figure 3, the simulation was based on a classic 4-story townhouse in Taiwan, which is the most common type of residential building in Taiwan (about 49.2%) [
35]. The single-story plan size was 5 m × 12 m × 3.5 m. The front and back walls had a high window–wall ratio on each floor. Side walls were connected to the neighboring house, which were identified as adiabatic. The basic case of this research assumed the performance of the general building envelope in Taiwan. The U value of the roof and exterior wall was set to 0.79 and 3.18, respectively, in accordance with the structures in the Directions of Design and Technical Specifications for Buildings Energy Conservation. We referenced the 2001 ASHRAE Handbook of Fundamentals [
36] for the air permeability of the envelope, and the air tightness of windows was set at 30 with reference to CNS-11527 for general buildings [
37]. We assumed that sliding windows had 3 mm clear glass, whose U value was 5.9, SHGC was 0.87, and the discharge coefficient was 0.6.
2.3. Evaluation Index of Temperature and PM2.5
Susceptible populations vulnerable to environmental exposure are most likely to be harmed by the impact of climate change. We took seniors with cardiovascular disease as the evaluation objects in this study, and the evaluation items were divided into indoor temperature and PM2.5.
The temperature was evaluated by the number of days when the risk degree hours exceeded the standard. The temperature risk standard was taken from Hsia et al. [
38], who studied the cumulative effects of indoor temperature on health. The research process of a temperature risk standard was as follows: the outdoor temperature, which is easily available, was used to estimate the indoor temperature using a predictive formula [
39]. The predicted indoor temperature was then used to link hospital emergency visits to the National Health Insurance Research Database to carry out statistical assessment of indoor temperature and emergency visit risks of cardiovascular disease.
Our risk assessment included two aspects: the intensity of the suffering and the duration of exposure. For example, the CO2 reference value in the Indoor Air Quality Act regulates the concentration value (1000 ppm) and the exposure time (8 h) at the same time. In other words, even if the instantaneous exposure intensity does not meet the risk standard, it may still result in health risks if the cumulative time is prolonged.
Daily maximum/minimum and average temperatures have been used as thresholds in previous studies. However, such indicators cannot evaluate the cumulative effect of exposure, only its intensity.
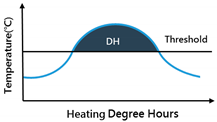
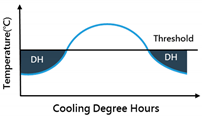
A cumulative unit of time and intensity, that is, degree hour, which is commonly used in energy assessment, is introduced to evaluate health risks in this study. It is defined by:
where
HDH is the heating risk degree hours (°C-h),
CDH is the cooling risk degree hours (°C-h),
Ti is the indoor temperature (°C),
Tb is the indoor temperature threshold (°C),
N is the hours in a day (1–24 h), and + means that only positive values are calculated.
The temperature threshold is shown in
Table 1, which indicates the relative risk of emergency visits for individuals older than 65 years with cardiovascular disease under adverse temperatures events.
In the hot season (May to October), the emergency visit risk of cardiovascular disease increases by 10.4% when the temperature exceeds 27 °C and accumulates to 59 °C-h. If the temperature is lower than 22 °C and accumulates to 27 °C-h, the risk increases by 8.9% during the cold season (November to April).
Therefore, a risk day is recorded when daily temperature exceeds 27 degrees and accumulates 59 degrees or falls below 22 degrees and accumulates 27 degrees.
Regarding PM2.5 evaluation, we recorded a daily average concentration that exceeds the recommended value of 35 μg/m3 as a risk day in this study, using the threshold stipulated in the Taiwan Air Quality Index. The regulation indicates that if the standard is exceeded, susceptible populations with cardiovascular diseases may experience health risks.
3. Simulation Process and Results
This study was divided into three stages for simulation analysis. First, we proposed renovation strategies for the building envelope that could reduce indoor health risks. Next, we analyzed the impact of occupancy’s behavior of opening/closing windows on indoor health risks. Finally, the energy consumption resulting from equipment use was evaluated to reflect the cost of reducing health risks without improving the current situation.
3.1. Adaptation Strategies of the Building Envelope
Adaptation strategies of the building envelope can be divided into adjusting the building shape and envelope performance parameters. In this study, we focused on improving existing buildings, so only the impact of envelope performance parameters is discussed. The building shape and window wall ratio were excluded. Indoor thermal load and occupant behavior were excluded in the settings at this stage.
We simulated a classical townhouse in Taiwan and evaluated the risk days on which the temperature exceeded the risk degree hour and PM2.5 exceeded 35 μg/m3. Such envelope performance factors as the U value of the roof and external walls, the solar heat gain coefficient (SHGC) of the windows, and the airtightness of the windows are discussed to improve the ability to withstand climate change. The second to fourth floors of the townhouse are the living space, and the risk days of these spaces were summed in order to assess the entire building. 1F was not evaluated because it is usually a non-living space such as a storeroom or guest room.
The different scenarios are shown in
Table 2, where E-0 is the basic case. The improvement of the thermal insulation performance of the roof and external walls was based on the original basic structure and addition of an air layer and thermal insulation layer. According to the Directions of Design and Technical Specifications for Buildings Energy Conservation in Taiwan, glass was replaced with off-line R insulating glass from the 3 mm clear glass. Airtightness was improved to 2 m
3/hm
2 according to the CNS-11527 standard [
36]. Of those four parameters, only the airtightness of the windows was effective in blocking PM
2.5 and was thus listed as a necessary improvement item.
3.2. Results of Building Envelope Adaptation Strategies
Combining favorable factors can help us understand the benefits of improving the envelope performance to reduce health risks and also understand the possible additive or conflicting effects.
Table 3 summarizes the analysis results of the health risk days of each scenario. The values in
Table 3 are the sums of the six rooms, and the improvement ratio is the ratio of the health risk reduction days of each scenario to the basic case.
As seen in the basic case (E-0), the total number of cold and hot risk days is 633 days, with 207 cold risk days and 426 hot risk days. This result indicates that, in Taiwan, not only is the relative risk of overheating higher than overcooling, but the number of hot risk days is also higher.
From the simulation results of each case, we found that the strategies have the opposite impact on the health risks of cold and hot days. The improvement of thermal insulation performance and reduction of solar heat gain through the glass can reduce the heat introduced into the room from outside in the hot season, which also reduces heat entering the room in the cold season and increases the risk of overcooling.
Improving the thermal insulation performance, such as in E-3 and E-5, can effectively reduce the risk of overcooling but has an adverse effect on the risk of overheating. To resolve the high risk of overheating in Taiwan, reducing glass SHGC is a necessary strategy. The effect of reducing SHGC on the total temperature risk days is positive, which is reduced by about 8% to 18%.
The airtightness of the windows significantly improved PM2.5 and reduced the risk days by 51.8% when compared with E-0. The other scenarios had greater PM2.5 improvement effects due to the increase in window-closing time, resulting from the low indoor temperature.
According to the total health risk of temperature and PM2.5, E-8 had the best effect on reducing health risks. We suggest that the priority of the four strategies should be in the following order: air tightness, SHGC, U value of exterior wall, and finally the U value of the roof.
3.2.1. The Occupant Adjustment Behavior of Opening and Closing Windows
In addition to the physical performance of the building, the exposure to health risk can be changed by occupants’ adjustment behavior.
Since the influence of occupant adjustment behavior is discussed at this stage, we considered the life trajectory of the occupants and the internal thermal load. The adjustment behavior was simulated using the building envelope of the basic case (E-0). The internal thermal load settings are shown in
Table 4, assuming the thermal level of two occupants and lighting and appliances under the boundary conditions. We set the life trajectory of occupants based on previous research of the elderly in Taiwan [
40].
In addition to PM
2.5 infiltration from the outside, cooking behavior causes indoor PM
2.5 production. Therefore, the setting of PM
2.5 in CONTAM was divided into indoor and outdoor. The background concentration of PM
2.5 was input from the monitoring data of the Environmental Protection Administration of Taiwan. The pollution source of cooking behavior was set at the location of the gas cooktop in the kitchen. We assumed the PM
2.5 amount generated by cooking was 1.56 μg/min, the deposition rate was 0.19 h-1, and the emission time was 11:30~12:00 [
41].
The window-opening behavior scenarios are shown in
Table 5, which were divided into two parts: according to habits and according to indicators. The scenarios B-1 to B-4 represent the window-opening mode to which Taiwanese people are accustomed [
24], and B-5~B-7 represent the automatically controlled mode based on the threshold used in this study.
3.2.2. Results of Occupant Adjustment Behavior of Opening and Closing Windows
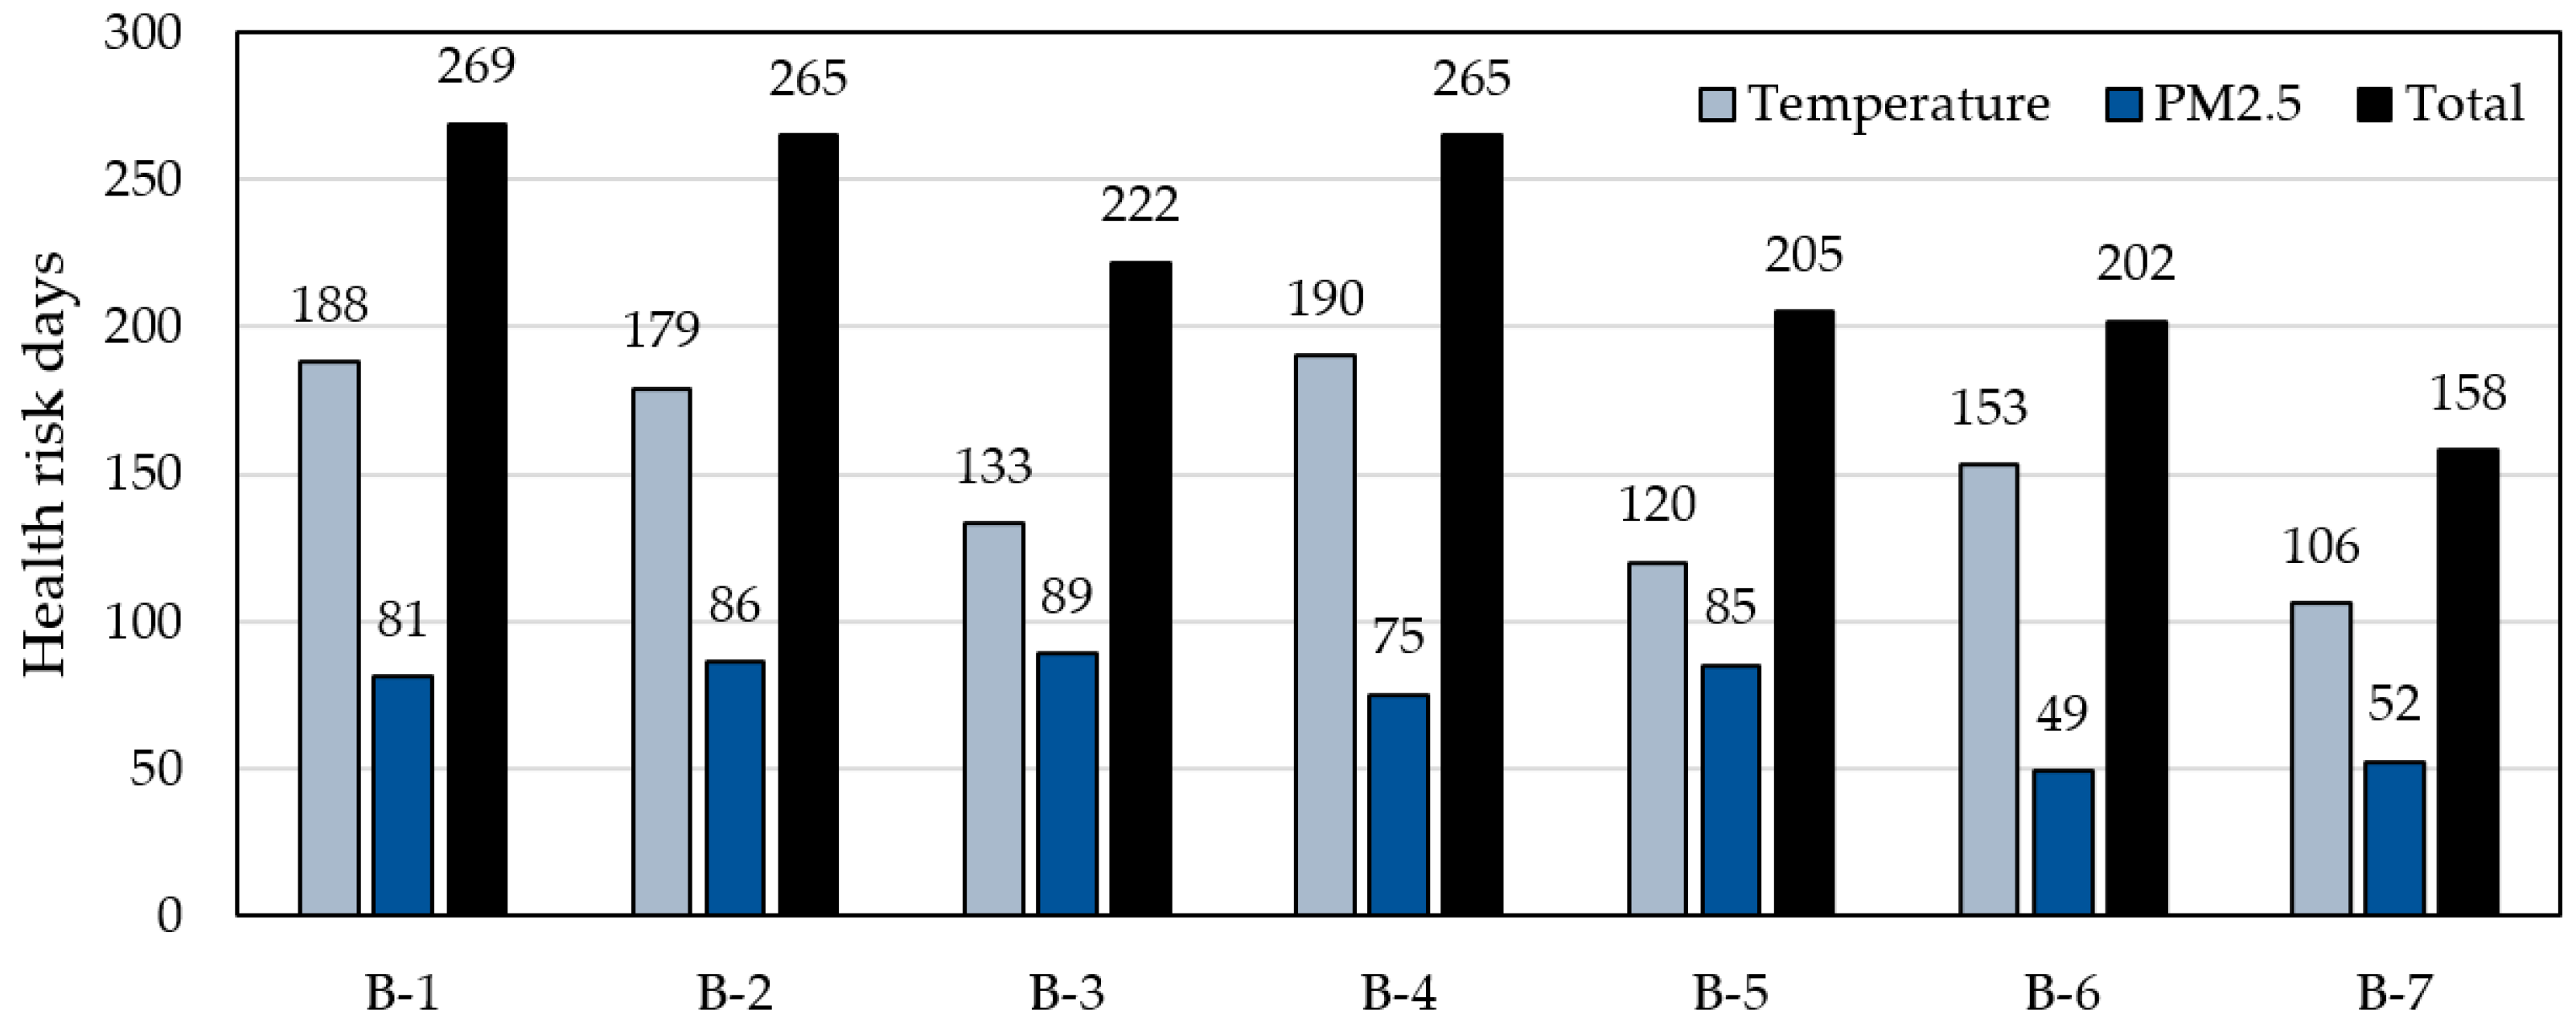
The simulation results of occupant adjustment behavior are shown in
Figure 4. B-3, B-5, and B-7 are effective for reducing the temperature risk days, while PM
2.5 can only be reduced through threshold control.
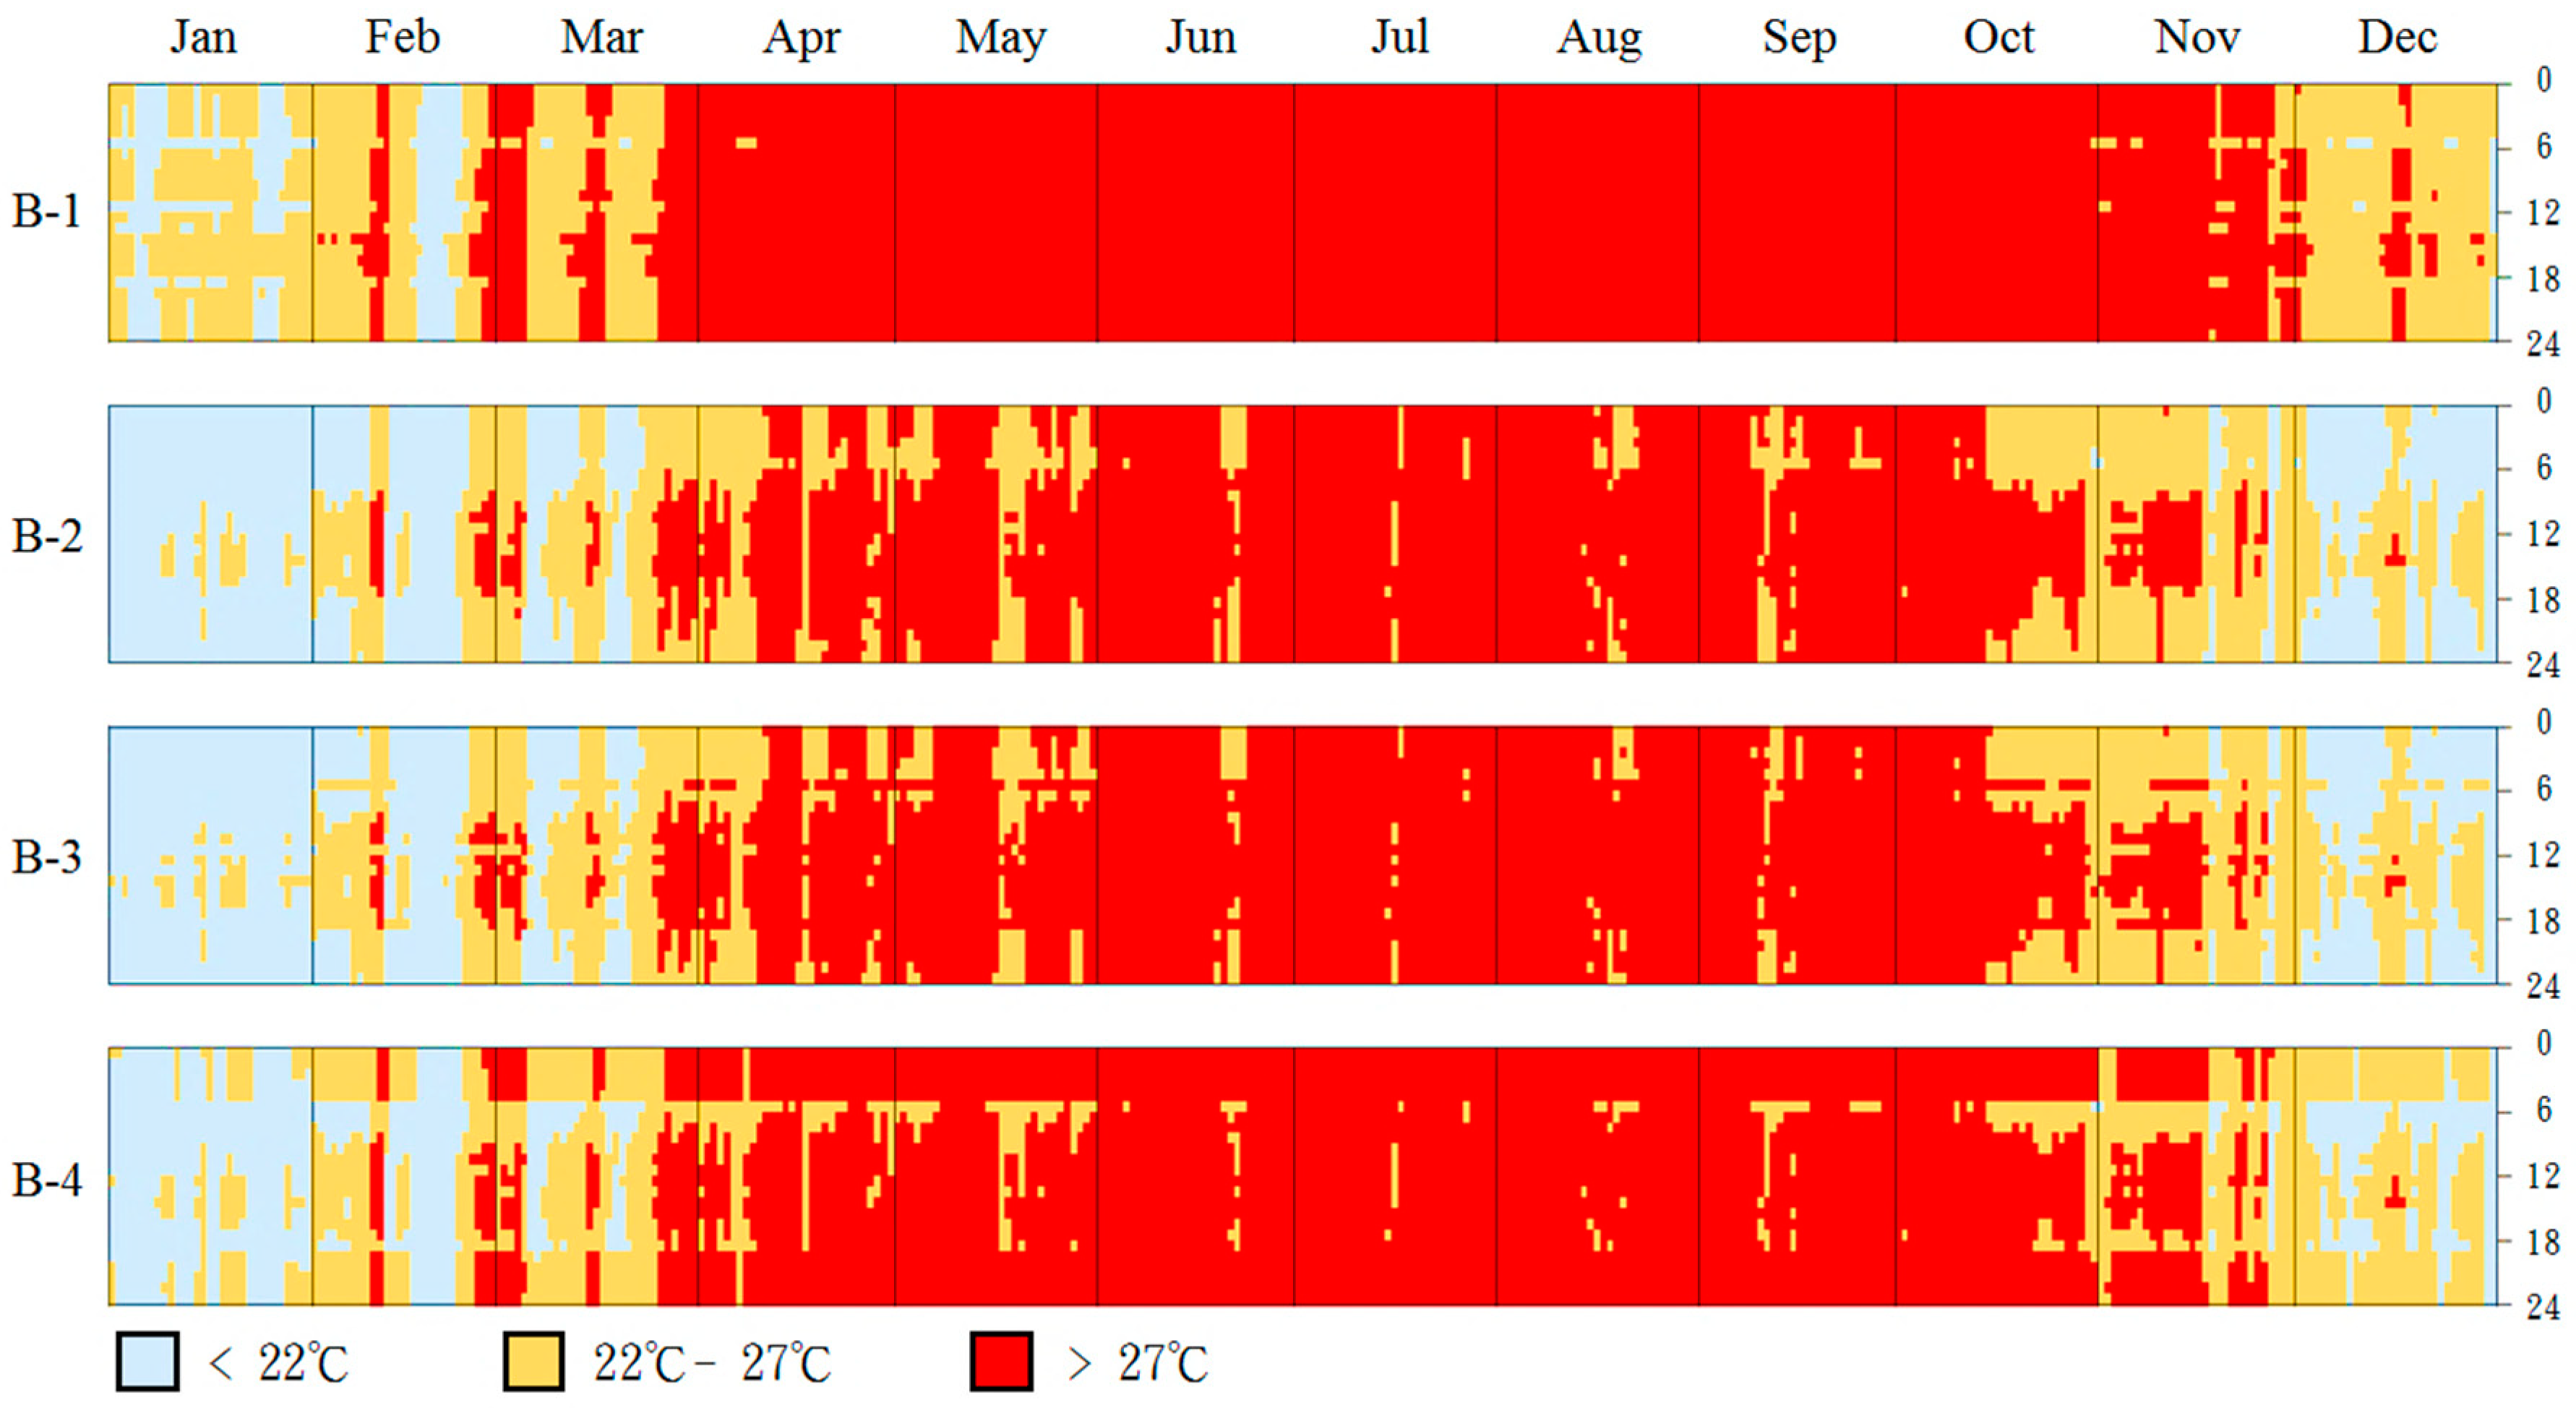
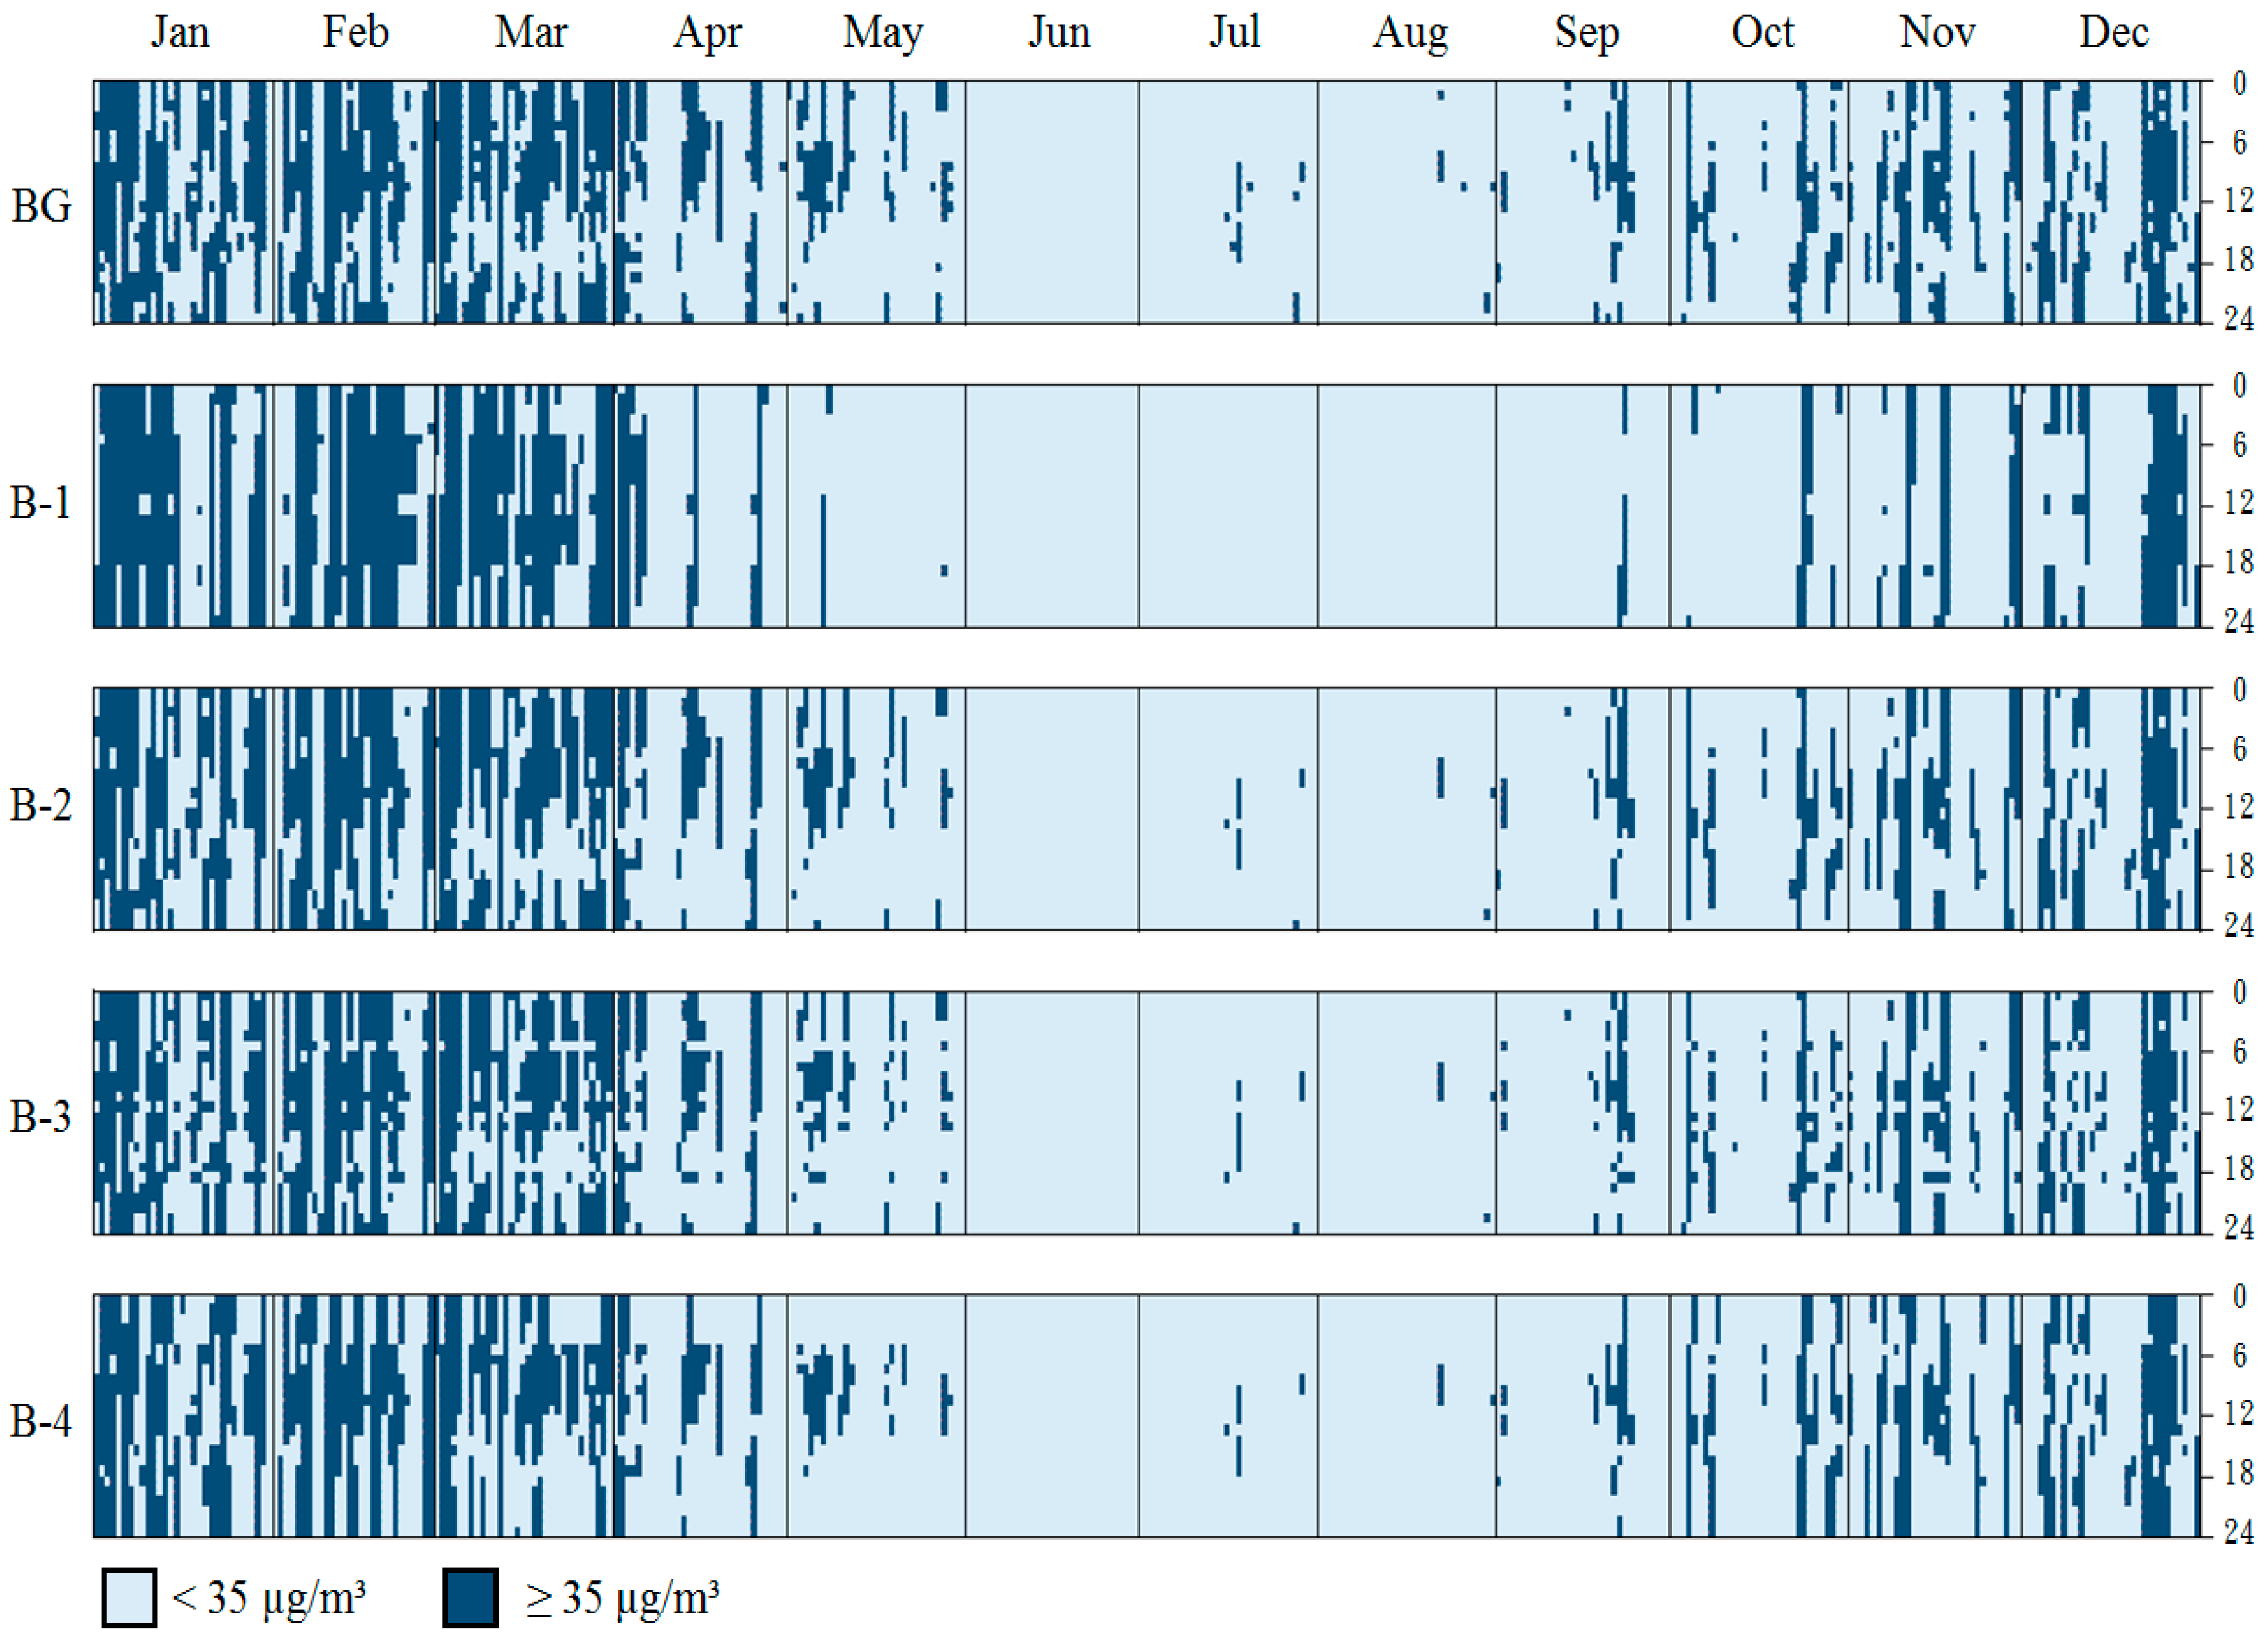
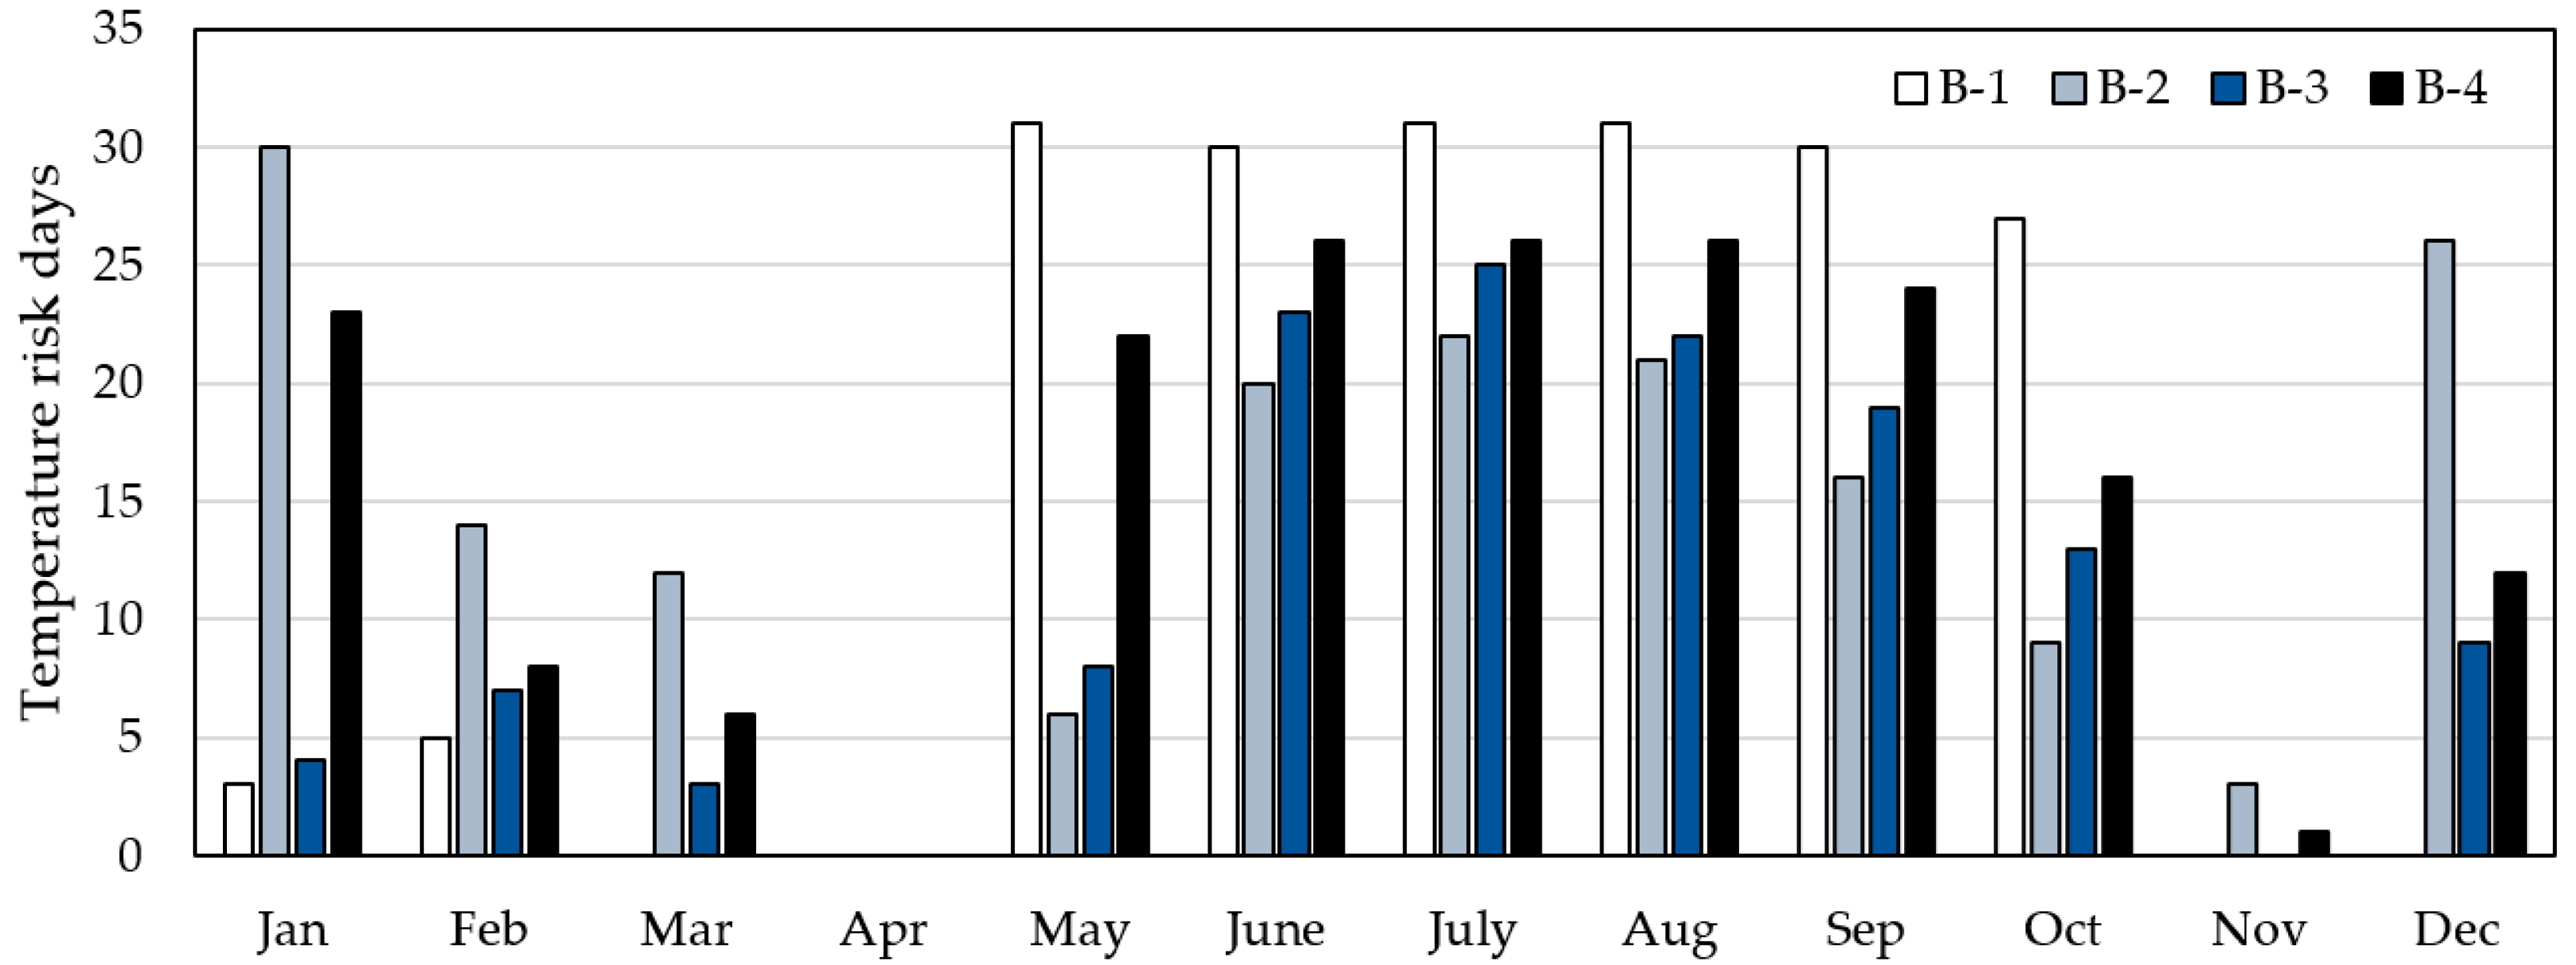
Figure 5 shows the habitual modes of B-1~B-4. With regard to the temperature risk days, B-3 had the least, and B-4 had the most. Always closing the window (B-1) and always opening the window (B-2) increases the frequency of risk days in the hot and cold seasons, respectively. Closing the window at night (B-4) results in the inability to dissipate heat due to the high heat capacity of the RC structure, which increases the risk of overheating at night during the hot season. The results can be seen in the temperature risk distribution chart in
Figure 6.
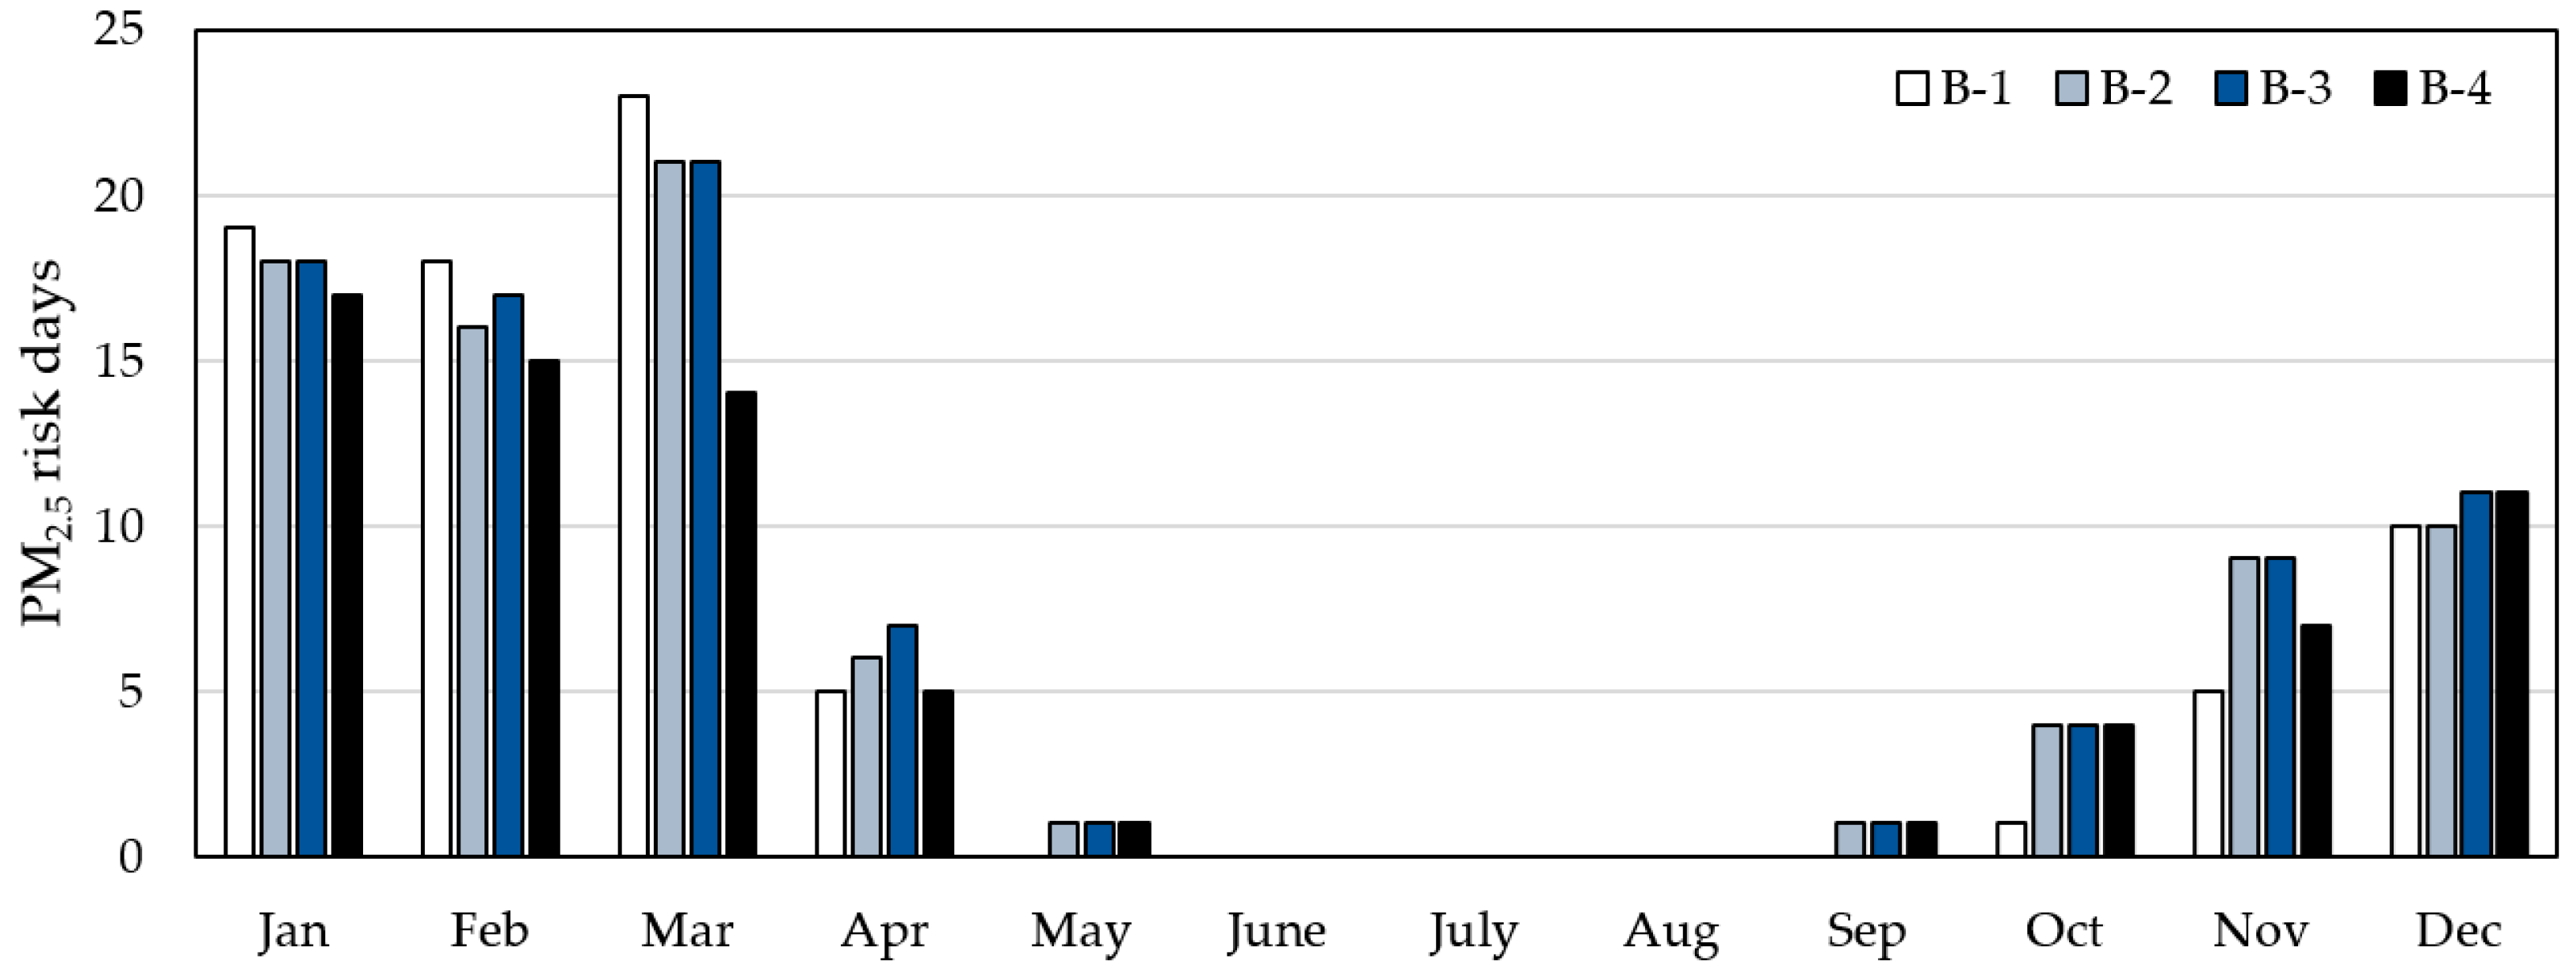
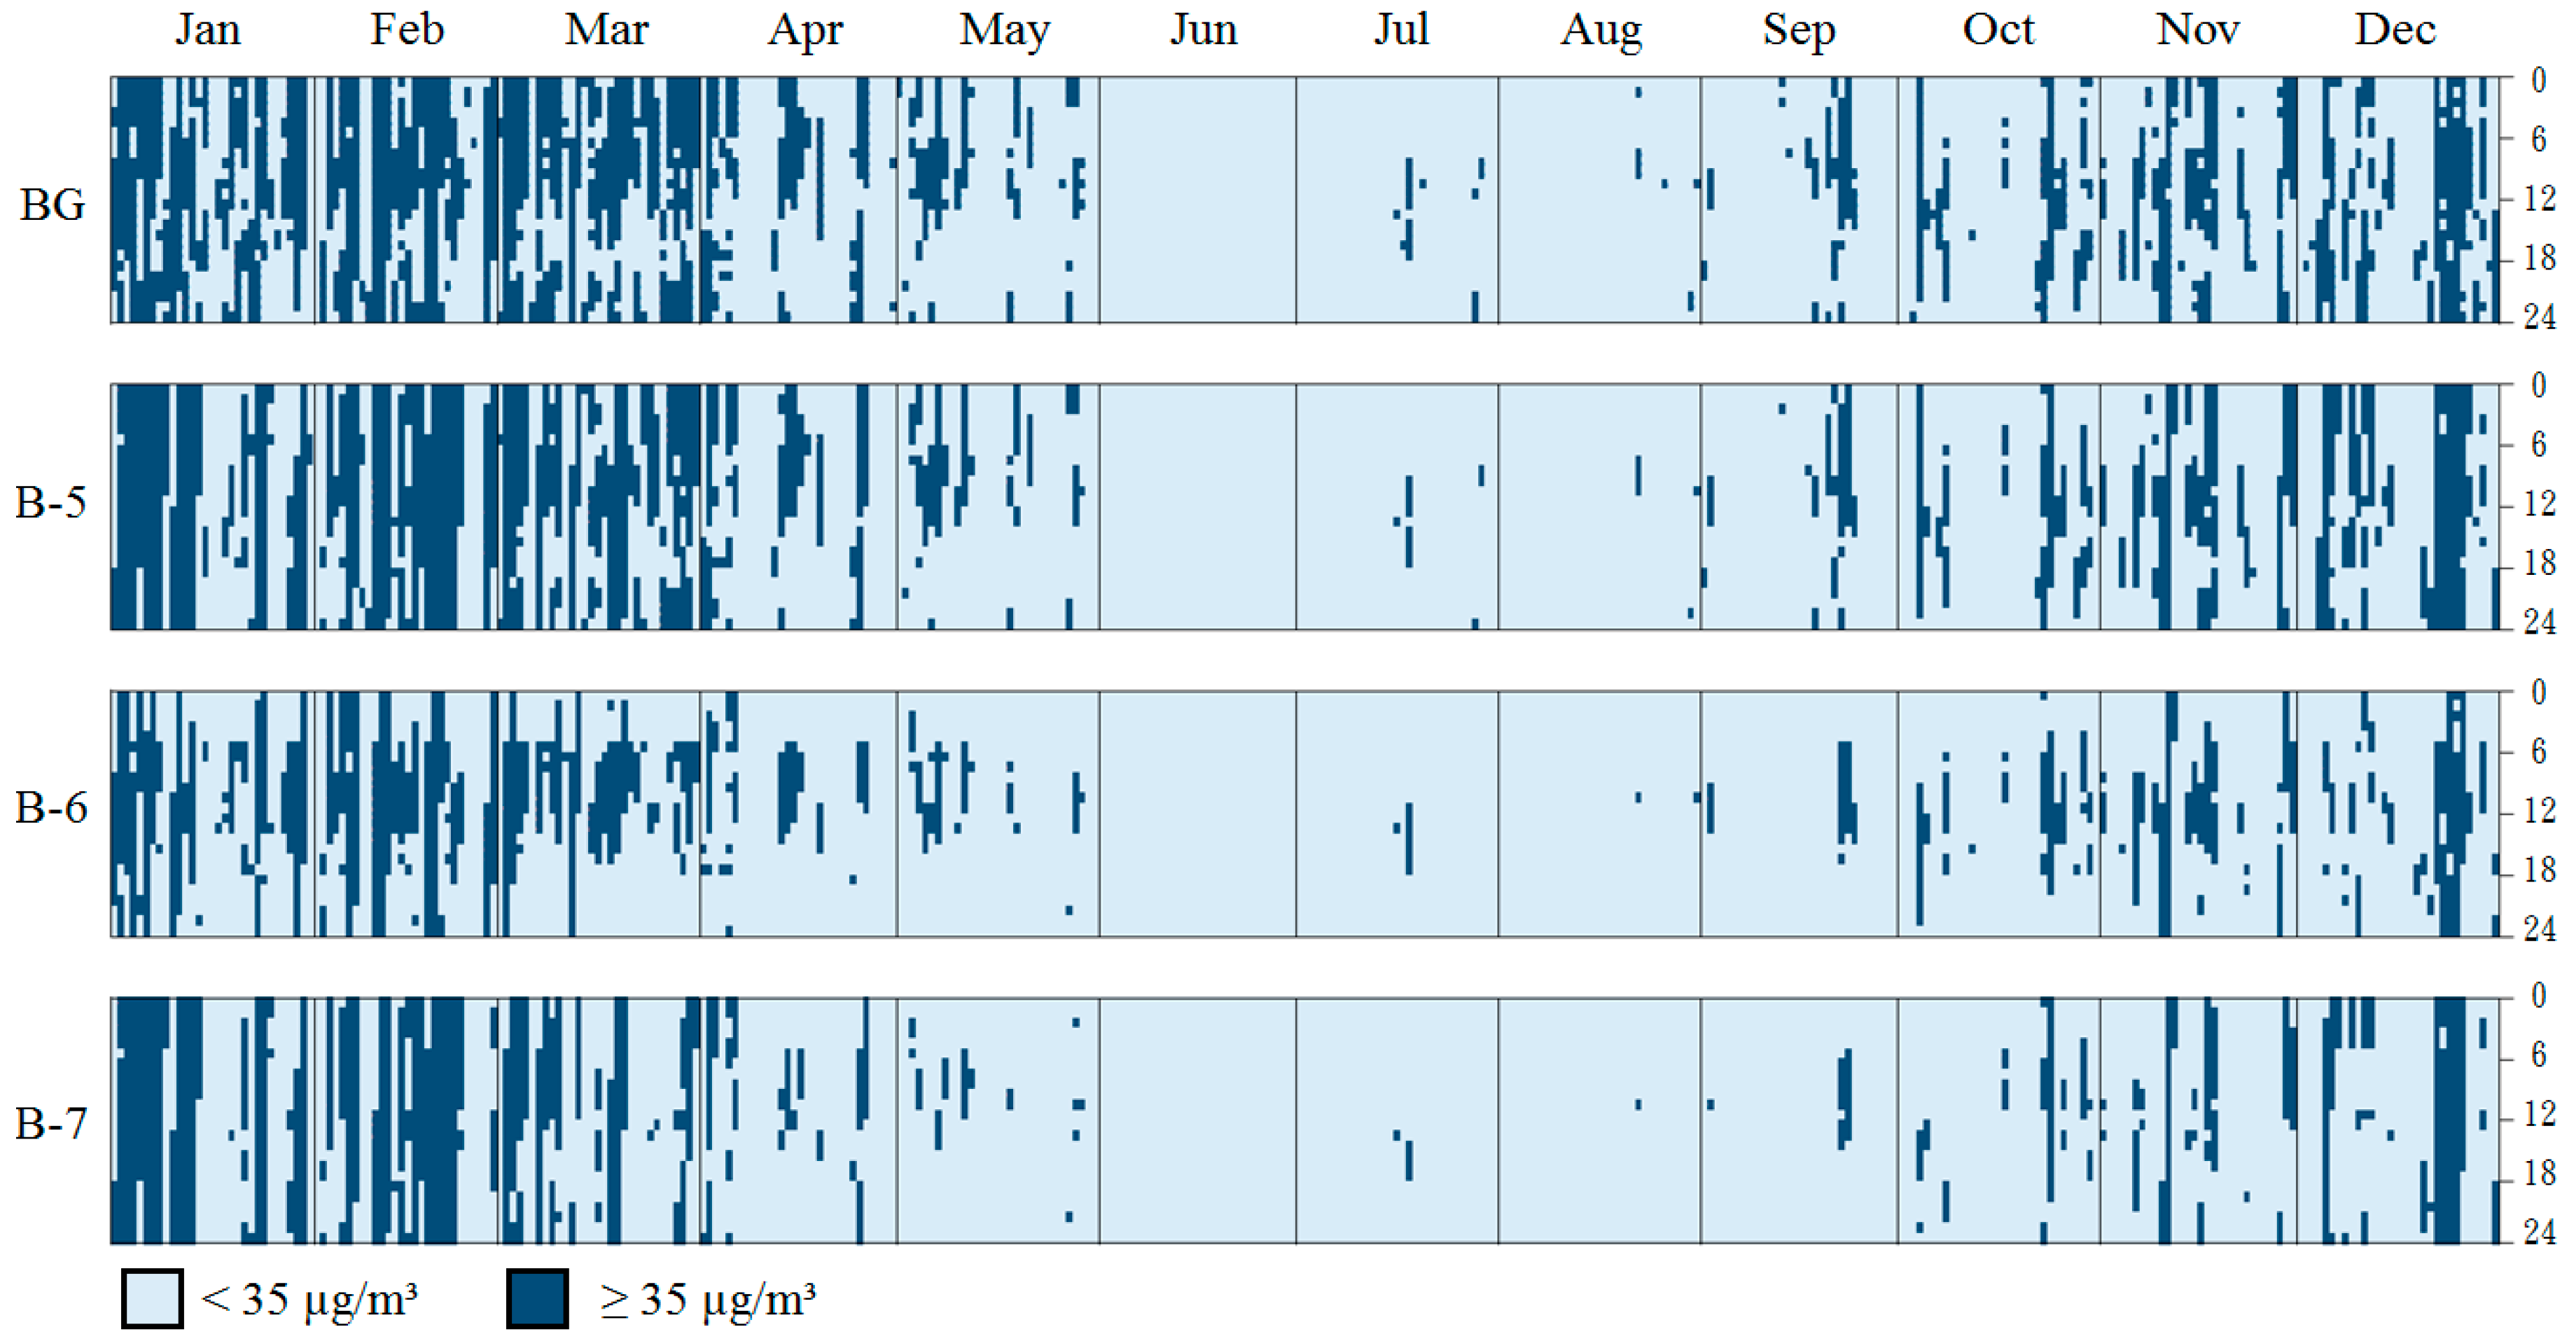
According to
Figure 7 and
Figure 8, the PM
2.5 background concentration is highest in January–March, while it hardly exceeds the threshold in June–August. In January–March, due to insufficient airtightness, the infiltration of outdoor PM
2.5 cannot be blocked, even when the window is always closed. Likewise, the always closed mode results in the accumulation of indoor pollutants that cannot be effectively discharged. Therefore, the number of PM
2.5 risk days of B-1 in January to March is significantly higher than that in other months. The PM
2.5 risk distribution in B-2~B-4 is similar throughout the year. Closing the window at night can block the infiltration of PM
2.5 at night, so B-4 has the lowest number of risk days.
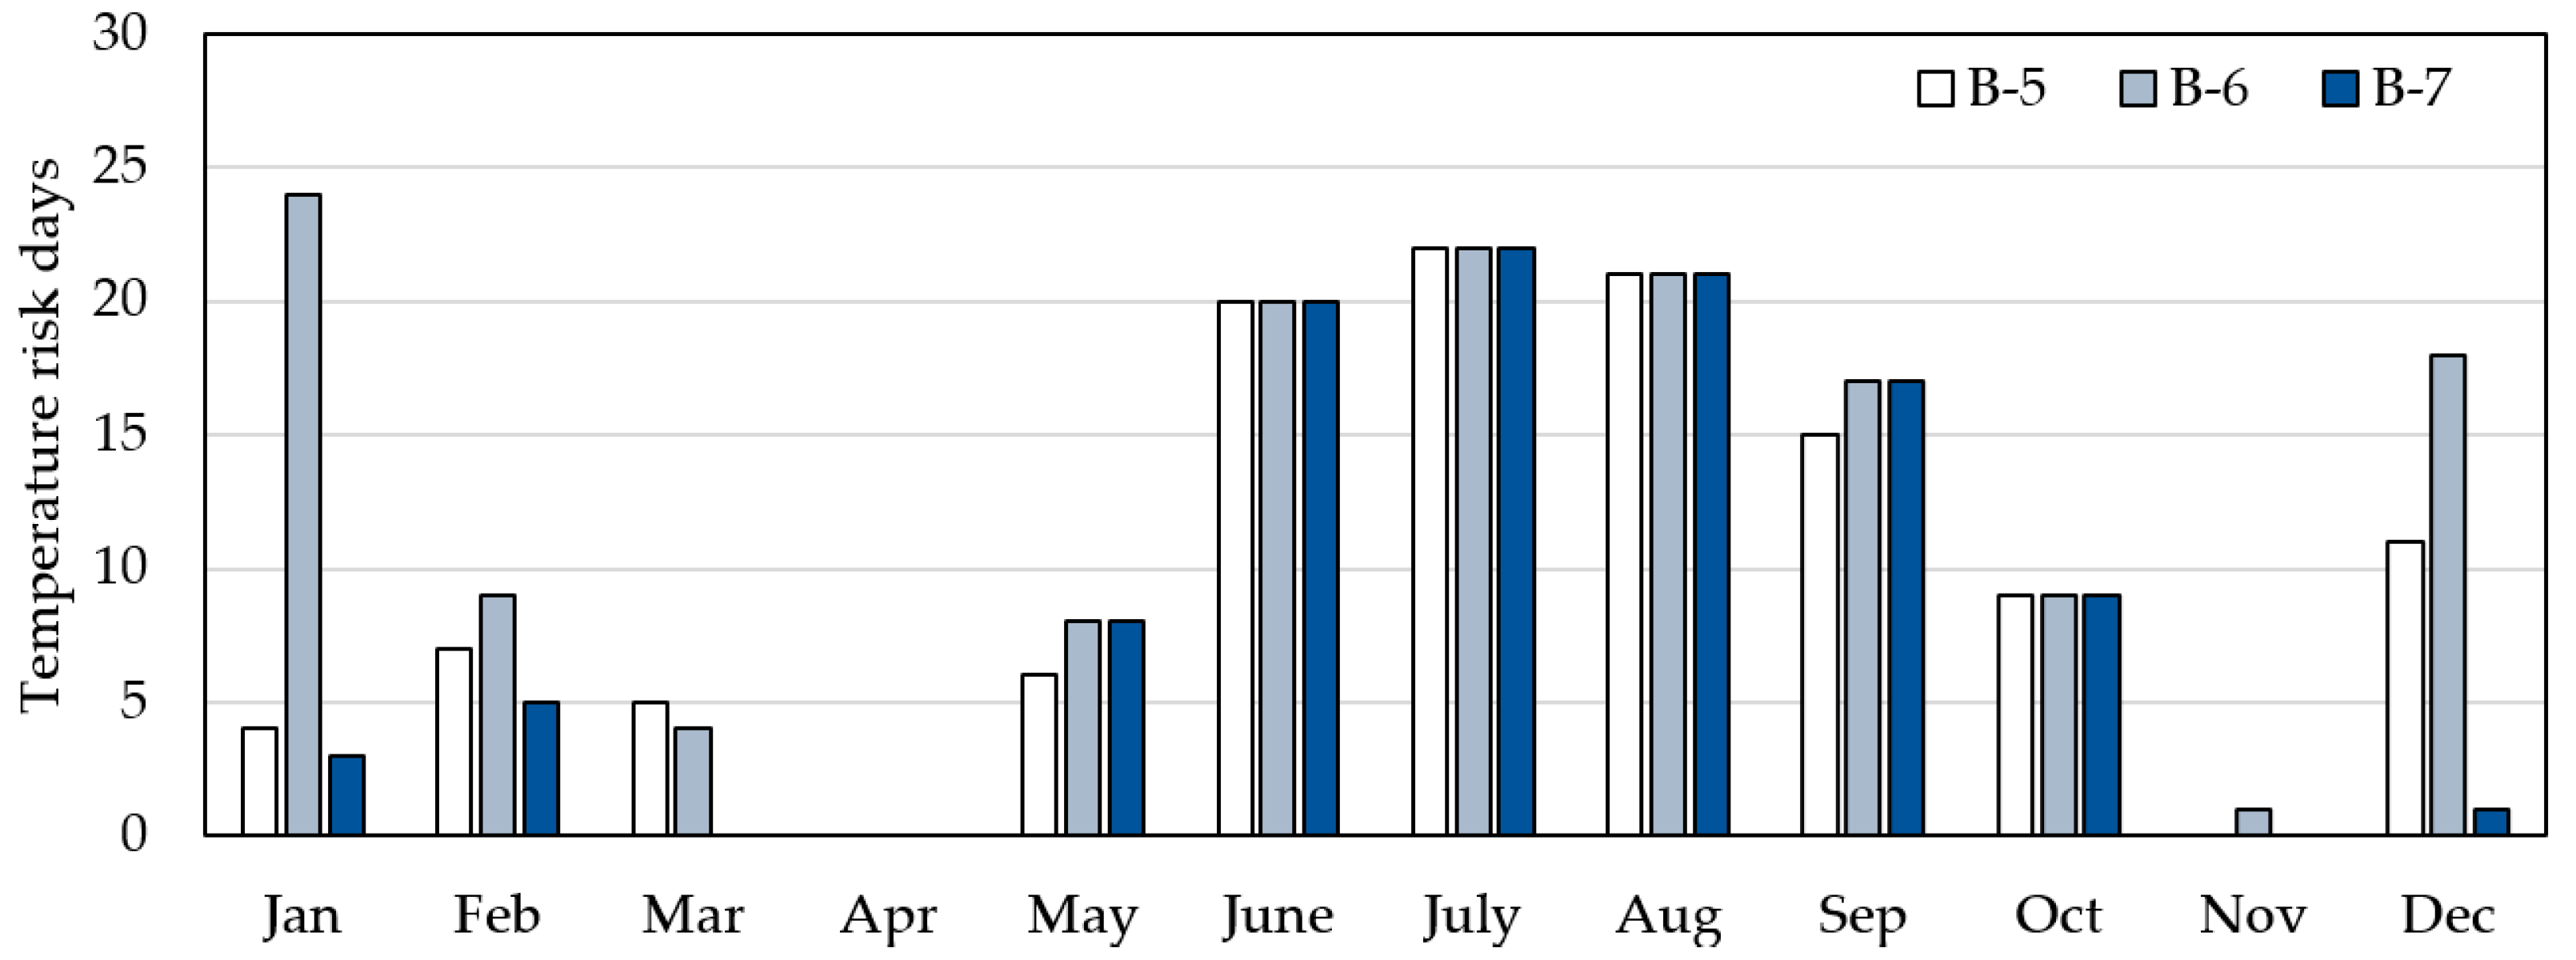
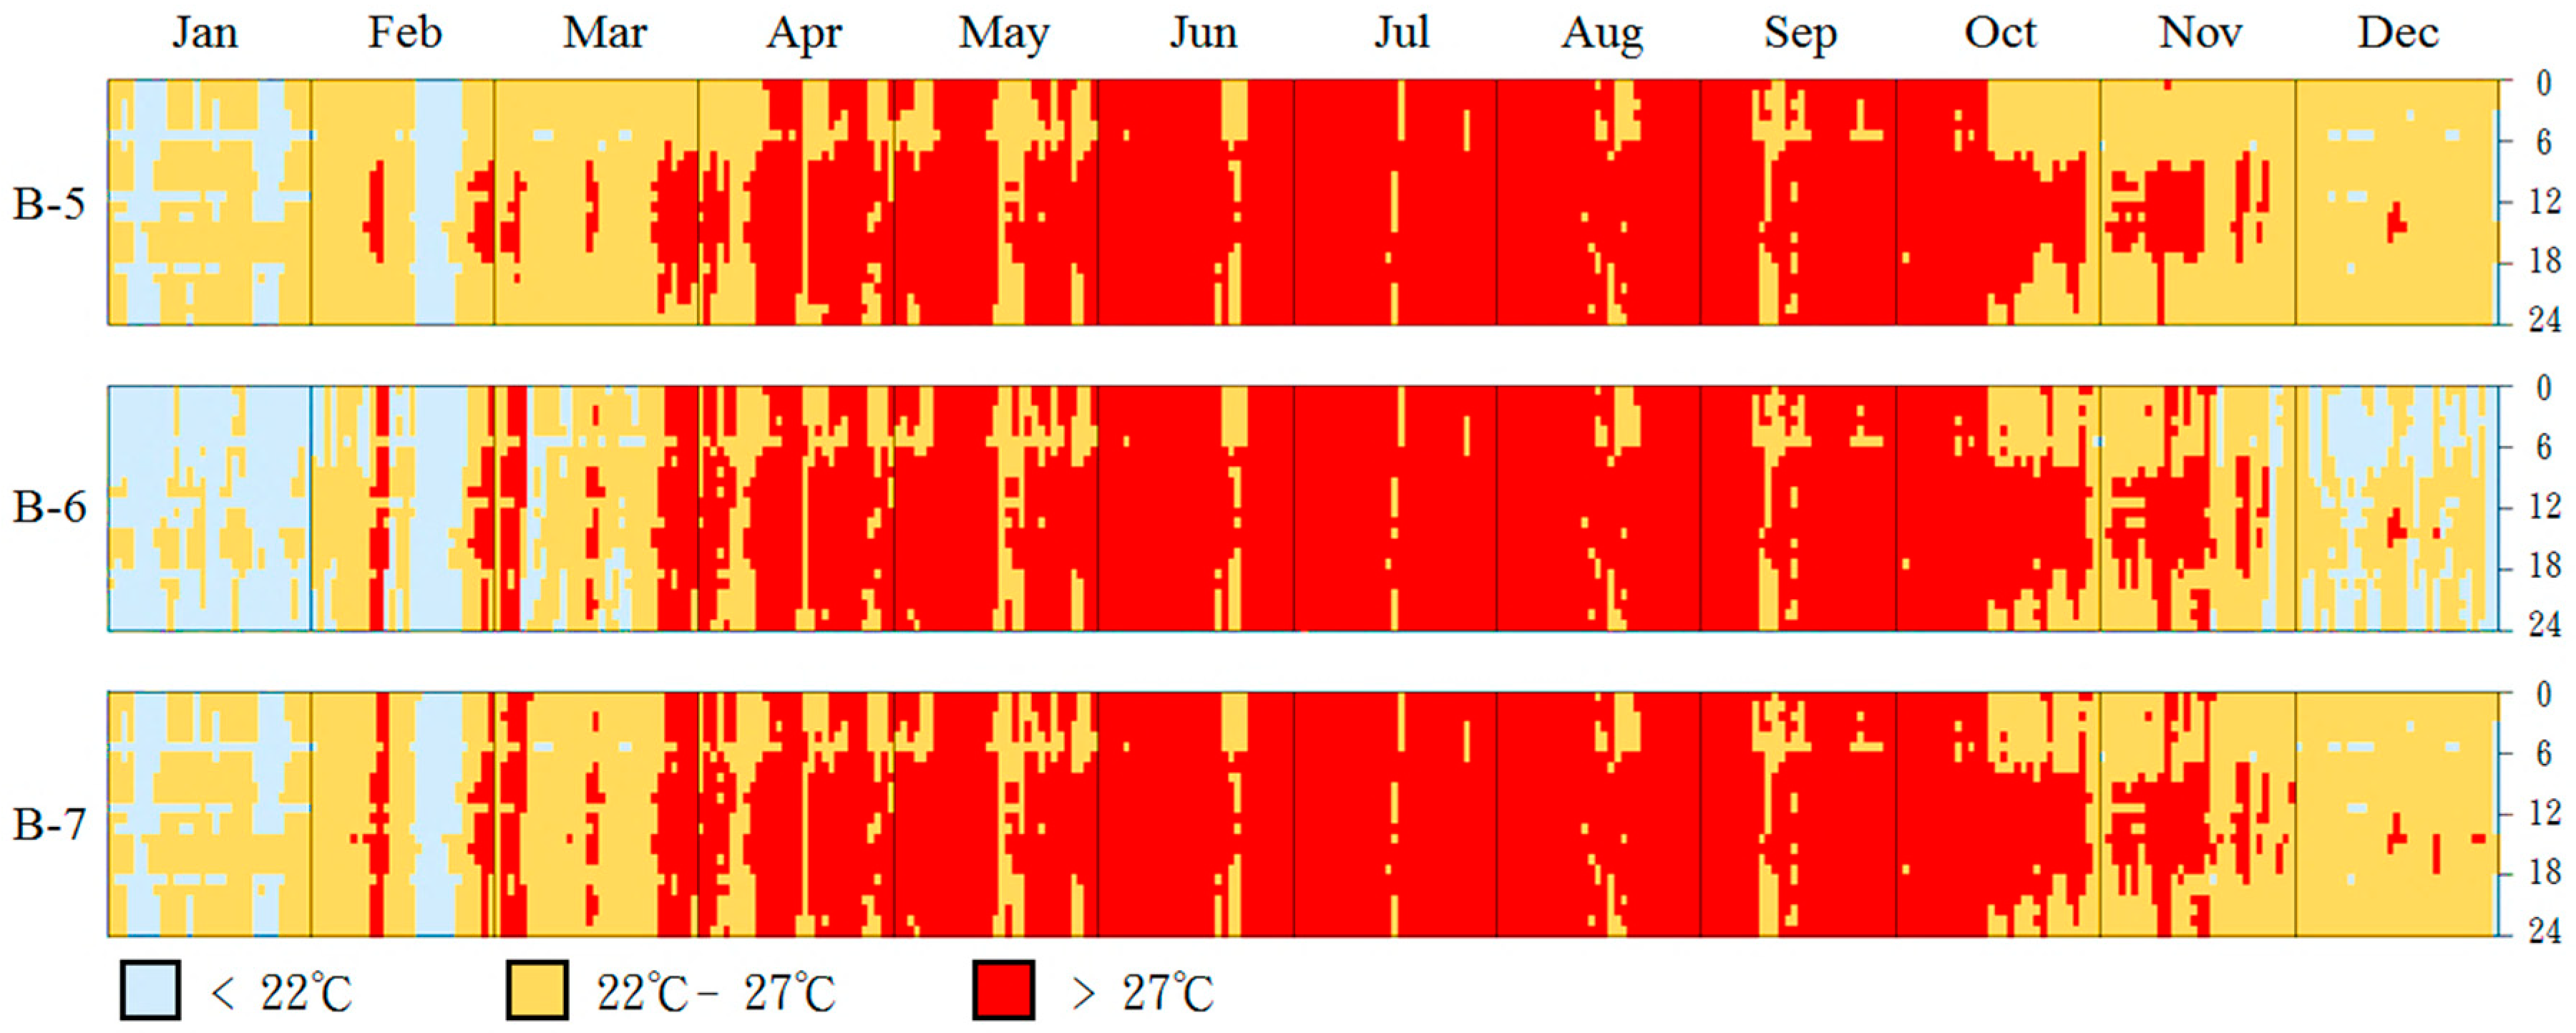
In terms of temperature risk days (
Figure 9 and
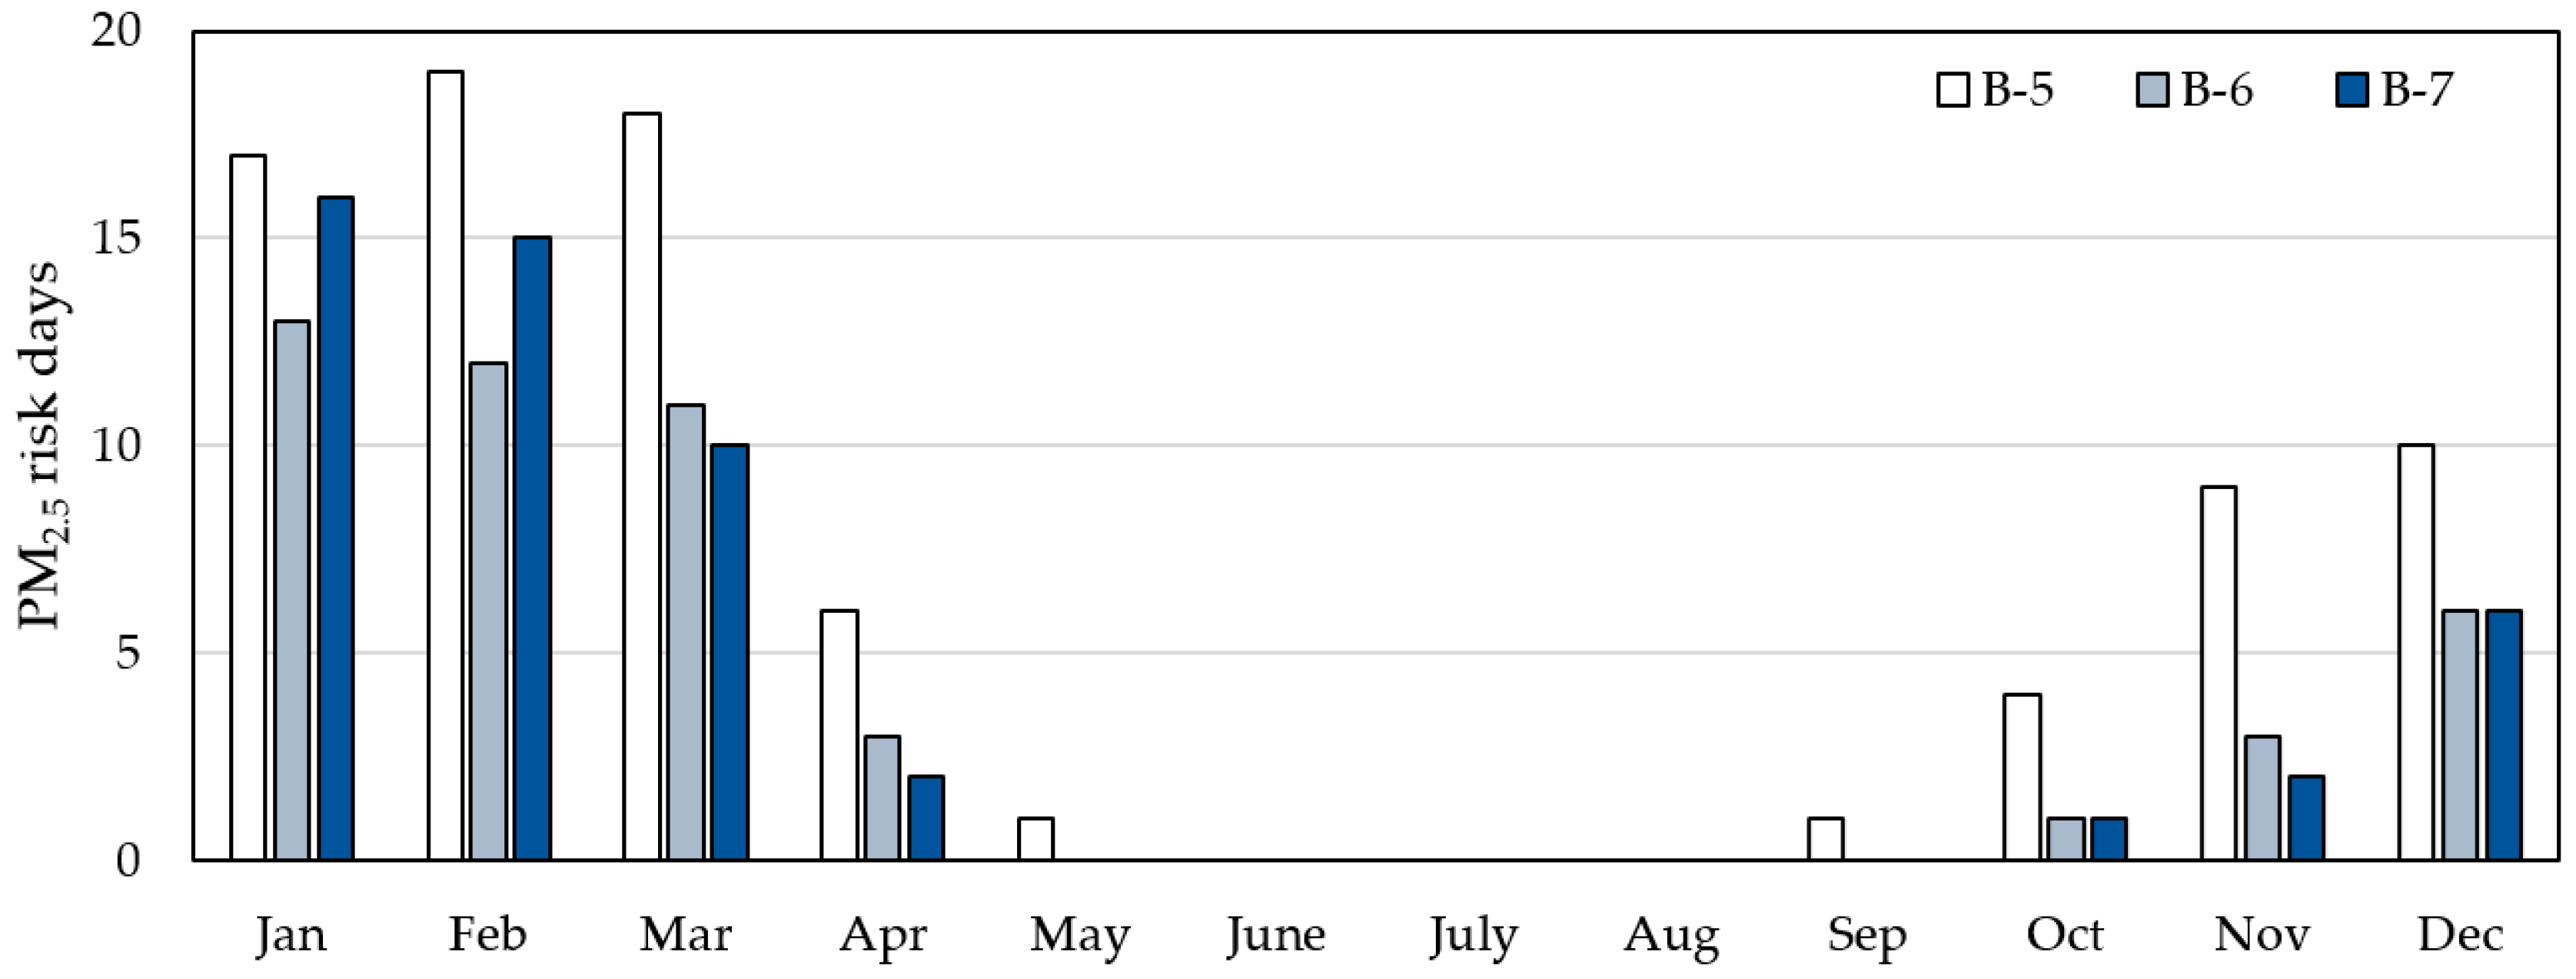
Figure 10), B-6 is significantly higher than B-5 and B-7, while B-5 has the highest PM
2.5 risk days (
Figure 11 and
Figure 12). This result indicates that the threshold control of window opening is effective. Compared with B-1, the most effective B-7 can reduce the PM
2.5 risk days by about 35.8%, from 81 days to 52 days and decrease the temperature risk days by 43.6%, from 188 days to 106 days.
3.3. Adaptation Strategies of Building Equipment
Considering that adaptation strategies, such as enhancing the performance of the building envelope and opening and closing windows, cannot immediately and effectively reduce indoor health risks when the external climate environment is extreme, the use of equipment is inevitable. However, equipment usage means the consumption of energy and emission of greenhouse gases, further intensifying climate change. Therefore, in this study, we regarded equipment usage as the last resort for maintaining the health of occupants.
The simulated scenarios are shown in
Table 6. For the building envelope, we adopted the basic case (E-0) and the recommended scenario E-8, which had the lowest health risk days. The basic case (E-0) and the recommended scenario E-8 were adopted to represent the extreme situation of the building envelope, and the window-opening behavior applies to B-1 and B-7.
The adjustment strategies for building equipment use are discussed with three programs: the fresh air system combining an exhaust fan and a high-efficiency particulate air filter (HEPA), air-conditioning system, and both a fresh air system and air-conditioning system.
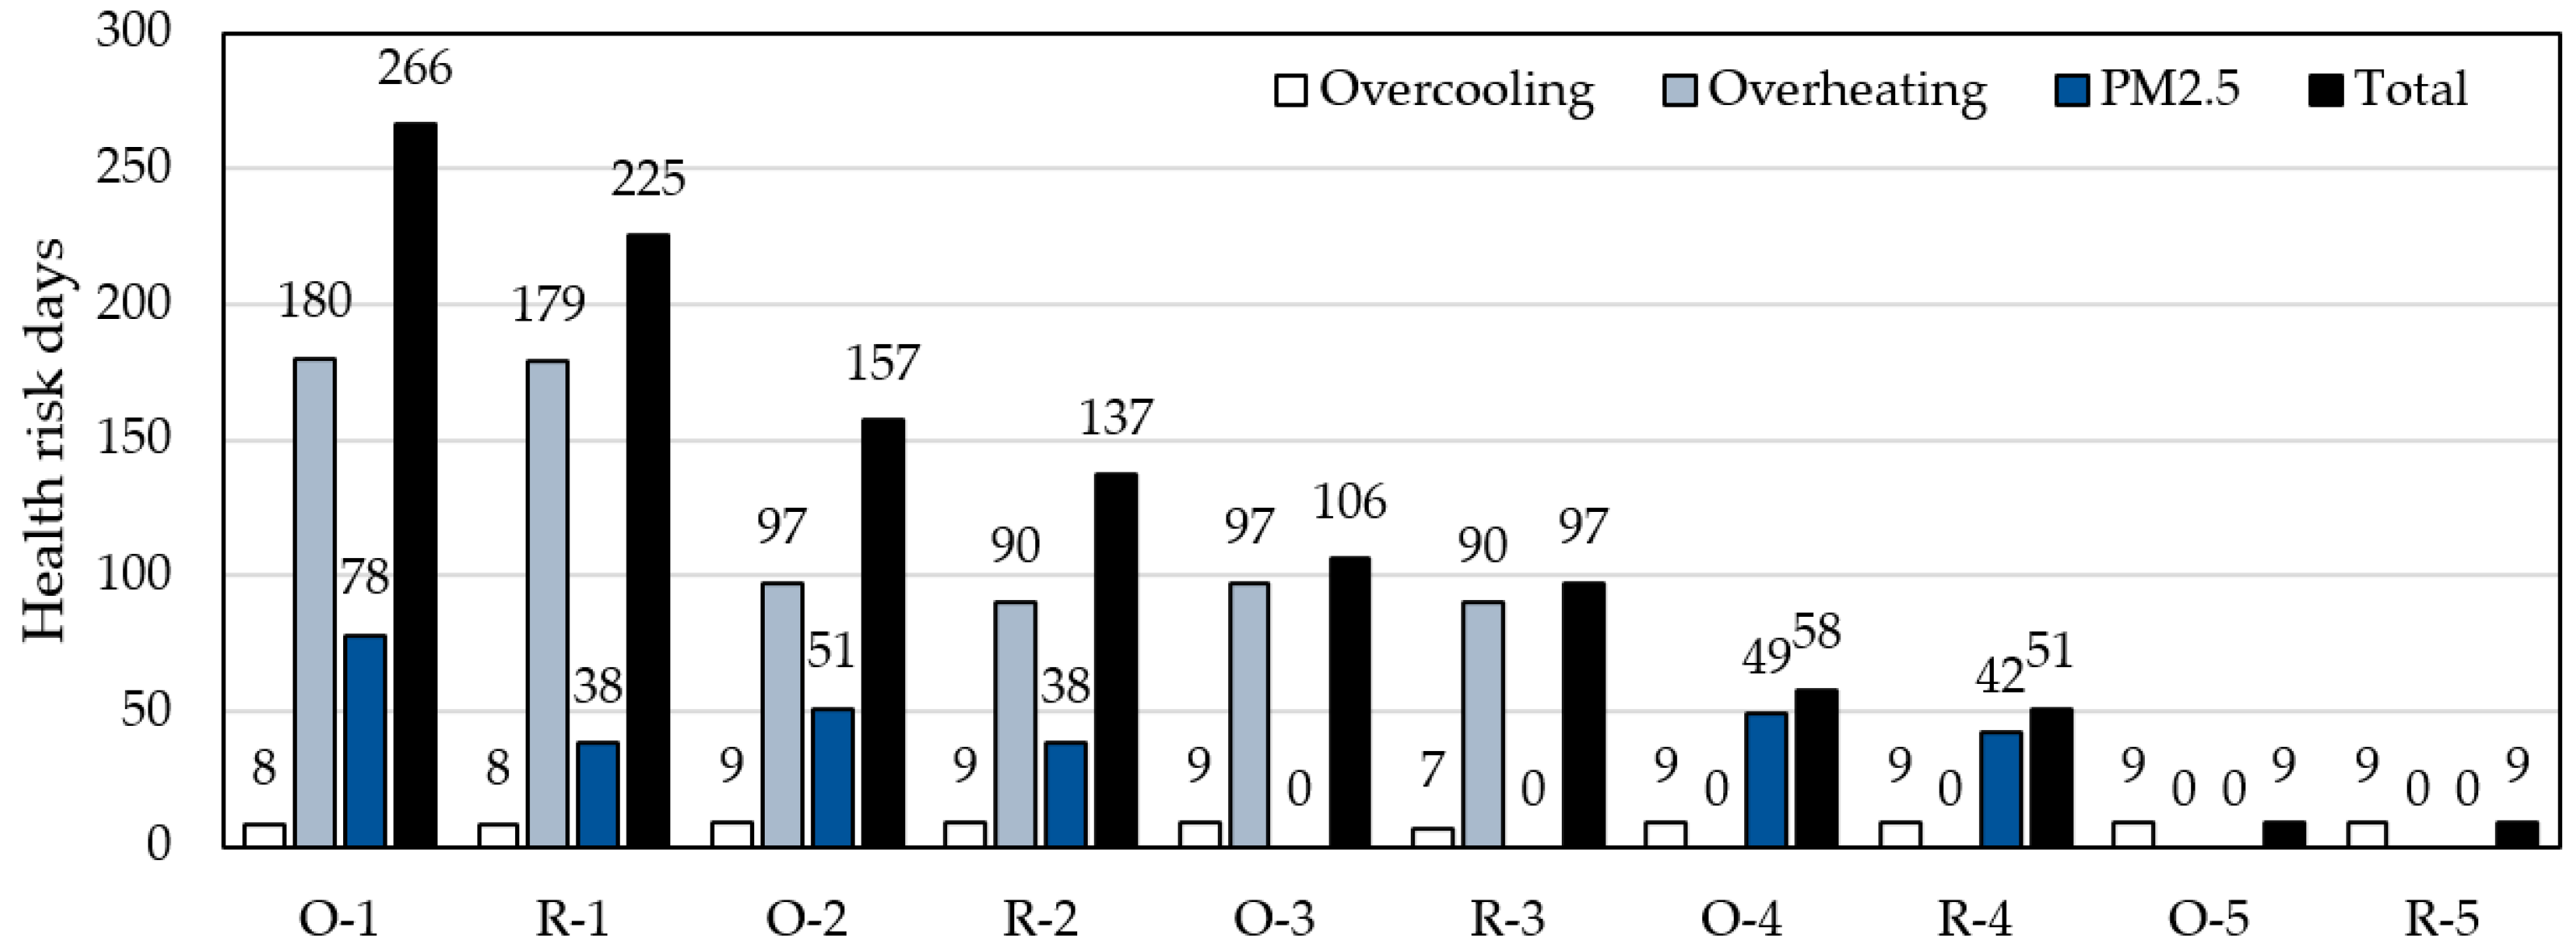
3.4. Results of Adopting Building Equipment
Figure 13 shows the analysis results of health risk days for adaptation strategies. O-1, R-1, O-2, and R-2 are scenarios in which only the adaptation of the building envelope and natural ventilation are conducted and equipment is not used. The passive adaptation strategies already reduce temperature risk days by 43.6% and PM
2.5 risk days by 34.6%, but even the best scenario R-2 has a total of 137 risk days. This finding shows that the intervention of equipment, such as a filter system and HVAC system, is necessary to eliminate health risks.
The results of O-3 and R-3 show that the use of the fresh air system can effectively remove the risk days of PM2.5, but the temperature barely decreases. Furthermore, O-4 and R-4 show that the use of the HVAC system can remove the risk of overheating, but nine risk days of overcooling still remain because ordinary houses in Taiwan are not equipped with heating, and heating is not simulated in this study.
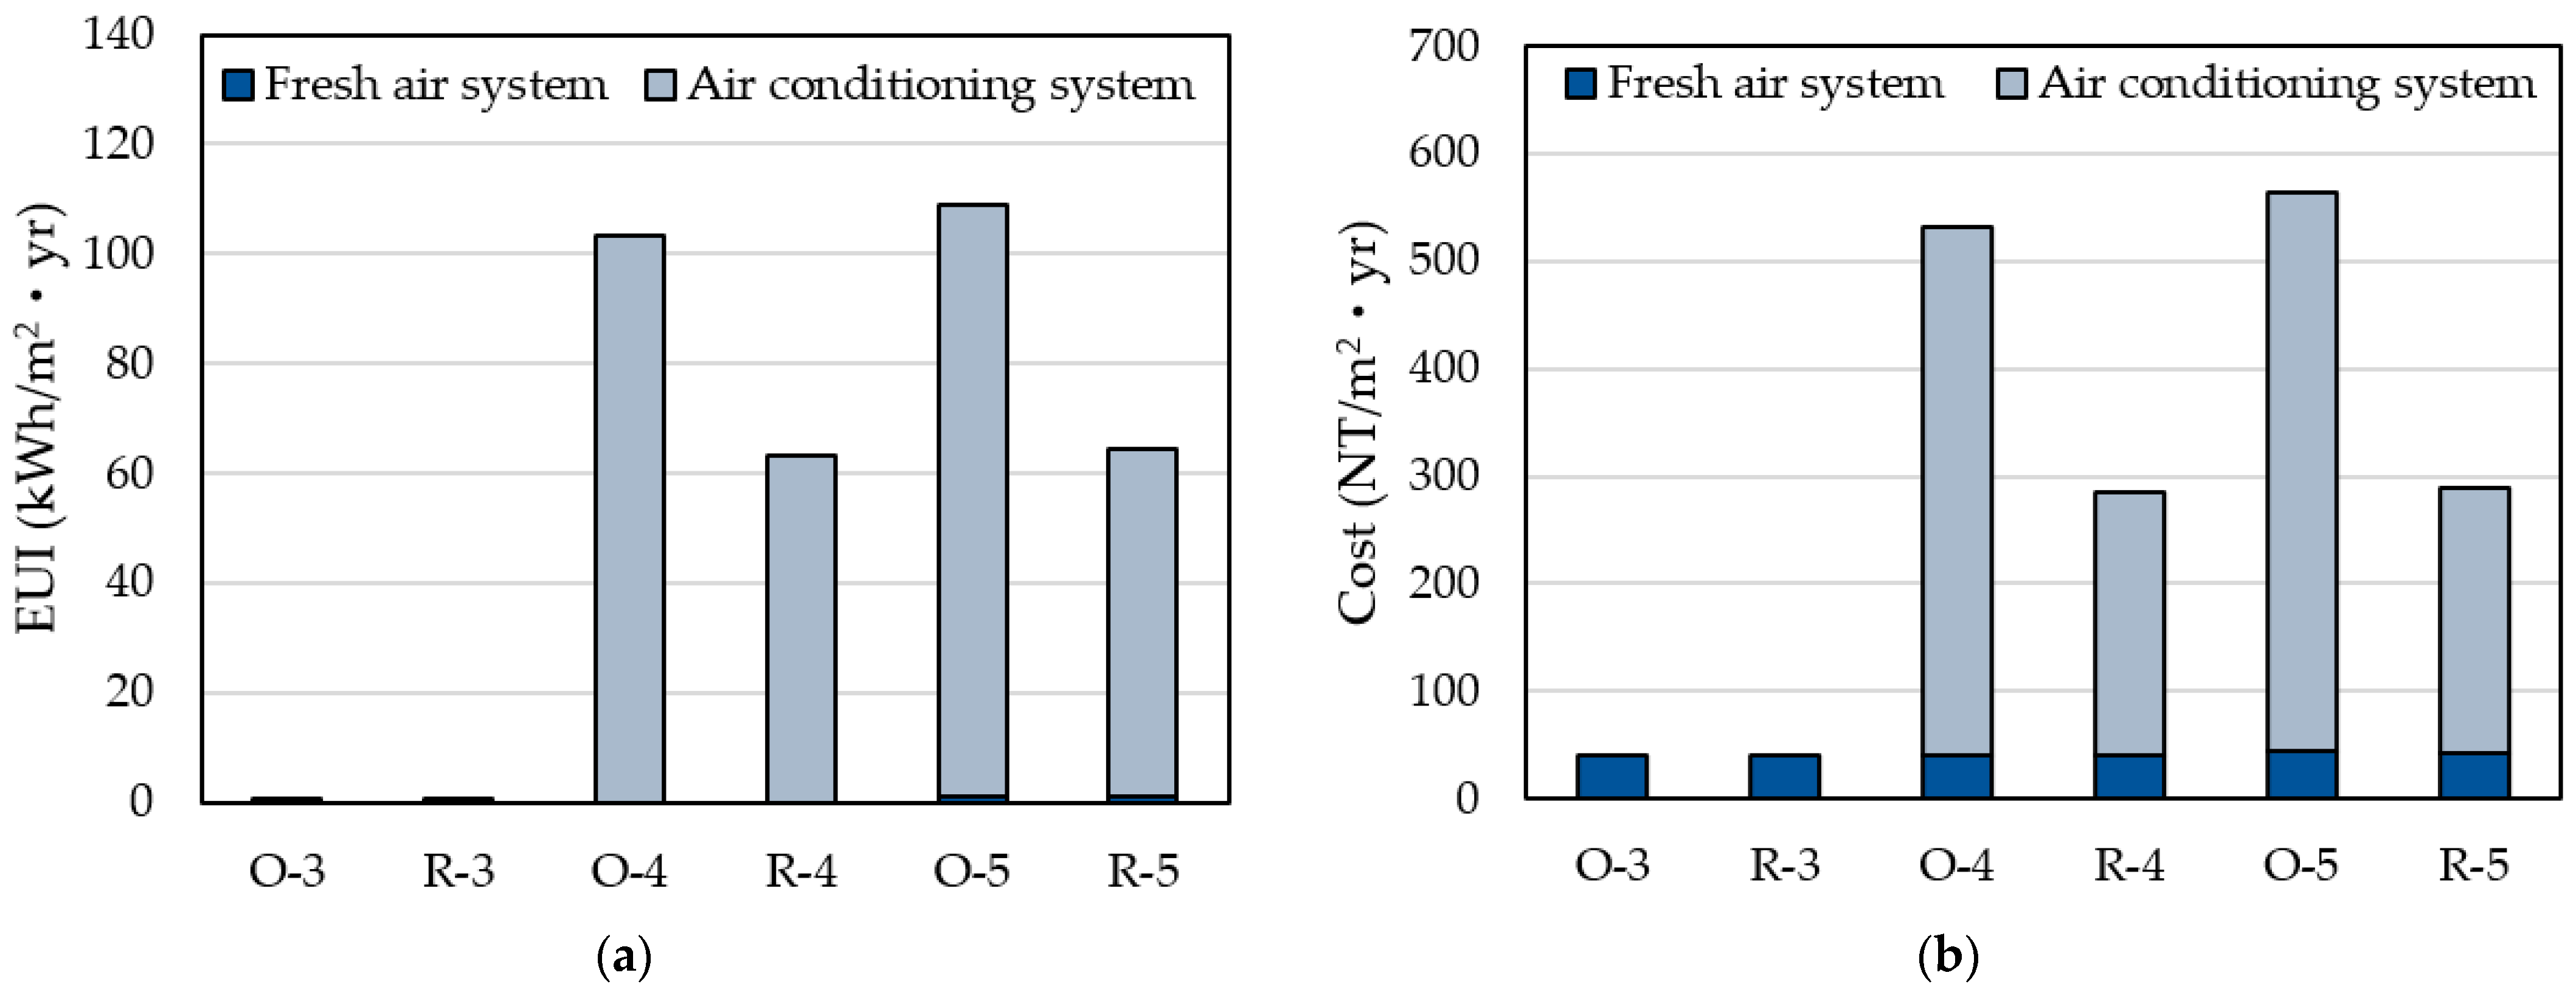
Figure 14 show the annual energy consumption and cost when active adaptation equipment is used to eliminate health risks. Energy consumption is calculated only for fresh air and HVAC systems, with lighting and plug loads excluded. The cost figure presents the electricity bill and the replacement cost of HEPA filters during the operation period, but the cost of purchasing equipment is not included.
The improvement of the building envelope clearly has a significant effect on building energy conservation. O-5 shows that if the building envelope is not improved and occupants rely only on the adaptation of automatically controlled opening and closing of windows and equipment usage to remove health risks, the energy required is about 108.3 kWh/m2yr. Compared to O-5, R-5 reduces energy consumption by approximately 41.3% and cost by 52.7%, simply by improving the performance of the building envelope.
4. Conclusions
In the building sector, issues on thermal comfort and carbon reduction have been widely discussed in response to climate change, but few studies have aimed at reducing the health risks of the elderly. Therefore, this research aims to propose an improvement strategy of residential buildings with low temperature and PM2.5 health risk for the elderly.
Under the existing building conditions in Taiwan, to create a healthy indoor environment has two main obstacles: the performance of the old building envelope must be improved under climate change, and the natural ventilation habits of long-term window opening may introduce PM2.5 from the outdoor and cause a health risk.
To achieve the objective of this study, we simulated the change in indoor temperature and PM2.5 under adaptive strategies of the building envelope and the occupancy’s natural ventilation behavior of opening/closing windows. Then, risk days, which exceed the health risk threshold, were used to evaluate the effect of adaptation strategies on reducing the number of days in which the elderly are exposed to health risks.
In terms of health risk threshold, this study used the threshold based on emergency visit data for the elderly with cardiovascular disease as the evaluation standard of the indoor temperature. Traditional threshold indicators such as daily maximum/minimum and average temperature, which only consider exposure intensity and ignore the exposure time, were replaced by the risk degree hours in this study, which could more effectively assess the risk caused by the cumulative effect. Since the threshold was set only for the elderly suffering from cardiovascular disease, the applicable index of different groups (such as children, pregnant women) or patients with different diseases may be different. Therefore, the thresholds should be adjusted according to the conditions of the occupants. Additionally, the daily average concentration was used as the threshold of PM2.5 because Taiwan has no evaluation index of risk degree hours, which considers the cumulative effect of PM2.5 on cardiovascular disease.
According to the results of the improved building envelope performance, the recommended order of building renovation is airtightness, SHGC, the U value of the exterior wall, and the U value of the roof. Airtightness and SHGC are necessary parameters for renovation because only airtightness is effective for PM2.5 concentration control. As for temperature control, since Taiwan is located in a subtropical zone, not only is the relative risk of overheating higher, but the frequency of overheating is twice that of overcooling. Reducing SHGC is the most effective strategy for controlling the risk of overheating.
The results of the assessment of occupants’ window-opening behavior showed that if the control can be conducted based on an indoor temperature and PM2.5 concentration threshold, the risk days of PM2.5 could decrease by 35.8% and temperature by 43.6%.
According to the overall improvement effect of the passive adaptation strategies, health risks cannot be fully controlled, so the use of equipment is necessary. The fresh air system and air-conditioning can remove the health risks of PM2.5 and overheating, respectively, but the corresponding price is energy consumption. The fresh air system is not only effective for PM2.5 control but also for low energy consumption and cost. Therefore, if the automatic control system for window-opening cannot be implemented at home, we recommend improving the airtightness of the window and closing the windows from November to March or installing a fresh air system.
In general, the risk day assessment of the indoor environment allows the adjustment strategies to be considered with the health of the occupants who bear the brunt. Additionally, the results showed that if the current situation is maintained without any adjustment strategy improvement, an additional 41.3% of energy consumption must be paid every year to control health risks. These strategies can thus create not only a healthier but also a more energy-efficient residential building.


