Article

Comparing Team Interactions in Traditional and BIM-Lean Design Management

by
Rodrigo F. Herrera
1,2,3,*,
Claudio Mourgues
2,
Luis F. Alarcón
2 and
Eugenio Pellicer
3
1
School of Civil Engineering, Pontificia Universidad Católica de Valparaíso, Av. Brasil 2147, Valparaíso 2340000, Chile
2
Department of Construction and Engineering Management, Pontificia Universidad Católica de Chile, Vicuña Mackena 4860, Casilla 306 Correo 2, Santiago 8320000, Chile
3
School of Civil Engineering, Universitat Politècnica de València, Camino de Vera s/n, 46022 Valencia, Spain
*
Author to whom correspondence should be addressed.
Buildings 2021, 11(10), 447; https://doi.org/10.3390/buildings11100447
Submission received: 30 August 2021 / Revised: 24 September 2021 / Accepted: 28 September 2021 / Published: 30 September 2021

Abstract

:
There is qualitative evidence showing that design teams that use BIM-lean management have a higher level of interaction than design teams that do not use this management approach. However, there is no quantitative empirical evidence of this higher level of interaction. Therefore, the objective of this paper is to present quantitative empirical evidence of the differences among the various types of interactions of a design team. Two case studies were analyzed, and their design management was assessed from a lean BIM perspective while their team interactions were assessed using social network analysis (SNA). To achieve the aim of this paper, four steps were performed: (1) case study selection; (2) description of the design management of the projects from the lean design management and BIM perspectives; (3) assessment of design team interaction; and (4) comparison using SNA. The results show that the project that applied BIM-lean management exhibited higher levels of interactions among its design team members than the traditional team; transparent, orderly, and standardized information flows; a collaborative, trusting, and learning environment; and commitment management. None of these interaction elements were visible in the project that did not apply BIM-lean management. It is suggested that an analysis be performed on a representative sample of projects in the future so that conclusive statistical inferences could be made.

1. Introduction

The architecture, engineering, and construction (AEC) industry has been criticized for its fragmented approach to project delivery and its failure to form effective teams [1]. Additionally, the AEC industry has an adversarial nature, which has resulted in poor project performance and a lack of innovation [2]. This fragmentation, caused by the isolation of professionals and a lack of coordination between the individuals involved in design and those involved in building, has impacted construction performance, leading to a lack of integration, waste, low productivity, and low efficiency [3]. Additionally, certain barriers to improved integration seem to stem from the historical fragmentation of project delivery systems and the contractual and adversarial nature of construction project relationships [4].
Addressing this high degree of fragmentation requires better interaction between the specialties of the industry [5]; the interaction of a work team is generated through communication, coordination, and collaboration among the participants [6]. According to Webster’s dictionary, interaction means the action on each other, “mutual or reciprocal action or influence” [7]; in sociology, interaction is a dynamic sequence of social actions between people (or groups) who modify their actions and reactions due to actions by their interaction partner(s); therefore, an interaction is a social exchange between two or more individuals [8]. This interaction can be represented as the information flow between the right people at the right time [9,10]. Integration occurs best when individual team members view themselves as equals in the process and when the initial collaboration among them is focused on exploring and defining the problem [11]. Hence, the building process cannot be optimized without full collaboration and, ultimately, integration among all its project members [11]. Therefore, team integration is critical to developing projects and achieving value for the clients and stakeholders involved in these projects [12]. There are many ways to understand interaction in design teams; the key dimensions of interaction can be divided into traditional interaction and commitment management. Traditional interaction includes social interaction, role knowledge, collaboration, and learning, among others [13]; while commitment management is associated with each of the speech acts (i.e., requirements, negotiation, declaration of completion, and declaration of acceptance) [14].
Poor interaction among specialists, clients, and other team members can have negative consequences such as an inappropriate synthesis of the needs analysis of the project, which results in a lack of value generation for the client and the end-users [12]. Consequently, poor interactions among work teams can lead to poor performance, both in the implementation of each phase (namely, the phases of design, construction, maintenance, operation, and deconstruction) and in the overall life cycle of the infrastructure [1]. Within the infrastructure life cycle, the design phase allows the client, engineers, architects, and other specialists to establish the layout and definition of the overall project as well as its different parts. Therefore, the design phase is particularly important because decisions made during this phase can significantly affect the following phases, and the cost of making changes during this phase is insignificant compared with the cost of implementing changes during future phases [15].
As the interdependence and complexity of design tasks increase, the need for synchronous communication becomes vital; therefore, the efficacy and challenge of design management is rooted in the appropriate management of its workflow [16]. It is critical to consider the interactions within design teams and those between the design teams of different disciplines due to the interdependent nature of the design phase [10]. Therefore, managing the design workflow includes managing the people involved in the design process as well as the flow of information between them to enable the progression of design solutions [16]. The interactions among the professionals involved in the design team of a construction project is fundamental to the performance of the project [17]. To analyze the interactions of work teams, different tools can be used such as a survey, a frequency analysis [18], an n × n matrix [19], a social network analysis (SNA) [20], and a design structure matrix [21]. SNA has attracted attention in the AEC industry because it can be used to examine the role of informal structures in their coexistence with formal structures; an interaction can be formal information exchange such as approvals and monthly reports, or informal exchange of opinions, request for information, report of a problem, sharing of an improvement idea, etc. [22].
One of the challenges faced in this study is the determination of the methodologies used to achieve this higher level of interaction. Many studies have recommended building information modeling (BIM) as a workable option to address this issue [1], and lean has also been applied to the design phase [23]. Additionally, lean practices and BIM functionalities can enable a better design workflow through their focus on teamwork and information integration and sharing [16]. One of the theoretical benefits of BIM and lean is that errors in design can be better addressed in a way that reduces both their incidence and their dissemination [10]. Additionally, BIM and lean principles improve the exchange of information and create a more cohesive social network with increased collaboration and connections within teams and between different teams [10].
There is qualitative evidence showing that design teams that use BIM and lean have higher levels of interaction than design teams that do not use these management and technology support methodologies [11,24]; for instance, the application of BIM and lean could improve the commitment management, team communication, the solution of interoperability issues [11], trust between design team members, creativity though the adoption of more perspective and new solution suggestion [25], make better decisions and make reliable commitments [26], among others. Therefore, these studies show the increase in interaction from the global perception of the members of the design teams. However, there does not seem to be any quantitative empirical evidence of this higher level of interaction; thus, it is interesting to use SNA to have quantitative evidence of the different levels of interaction of the design teams. Quantitative evidence of an increase in interaction when applying BIM and lean methodologies, evaluated through SNA, would allow consultants and design teams to analyze the organizational performance of their projects through interaction metrics and sociograms that would provide concrete evidence that could be used as input to apply continuous improvement actions and evaluate the impact of these actions on the design team interactions. A recent study used SNA and simulation to compare traditional and BIM-lean practices for design error management [10]; however, this study provided theoretical and not empirical evidence of design team interaction, in addition, it only measured the information flows. Additionally, the interaction has not been studied in depth to examine the dimensions of interaction in which this theoretical increase exists, since there are multiple types of interaction within the design process such as work information flows, planning and solving problems, collaboration, and learning [13]. Therefore, the aim of this paper is to present quantitative empirical evidence of the differences that exist among the various types of interactions of a design team through a comparative analysis of two case studies involving high-rise building construction projects in Chile. To assess the interactions among the design teams of these projects, the researchers involved in this study used social network analysis (SNA), since it allows for the extraction of qualitative and quantitative information from each type of interaction through sociograms and graph theory metrics that explain the behavior of the design team [27].

2. Background

2.1. Design Management

The design phase of any construction project involves several designers who exchange information with each other, most often in an unstructured manner, throughout the design phase [28]. Like any project, the design management process involves planning, organizing, and managing people, knowledge, and flows of information to achieve specific project goals and objectives [16]. Additionally, design management is fundamentally concerned with value generation for the customer or client, which involves the integration of various specialist knowledge and the accurate timing of critical decisions. These objectives are achieved through an integrated team approach to the design, construction, implementation, and management of a project [29].
Traditionally, the design phase of a project is characterized by a high level of uncertainty due to the ill-defined nature of its requirements, solutions, or outputs. The design requirements of a project can be well understood, whereas the solutions and resulting outputs cannot be defined in advance and are generally vague at the beginning of a project [30]. Recent research has proposed that the design process should be studied through an evaluation of its performance [31,32], an implementation of integrated management systems and visual management tools [33], and its optimization [16]. Nevertheless, there are still several challenges in the design management of construction projects, for instance, the challenges posed by the collaborative methodologies of various specialties and the use of technology [34]. Thus, it is important to facilitate the application of collaborative technologies and methodologies to design management, considering that the extensive interdependence of design information and the tasks of many trades that are involved in design increases the complexity of this process. Furthermore, the design environment is built upon interaction and communication among various multidisciplinary teams whose processes and information are constantly dependent on one another [30].

2.2. Lean Design Management

Two decades ago, lean philosophy was proposed as a solution to improve the design process by applying each of the principles of this philosophy in the design of construction projects [35,36]. Lean design introduces several elements of the lean philosophy that are fundamental to the design phase, for example, the active and systematic involvement of clients during the early stages of a project, the maximization of the value generated, the identification of the needs and objectives of all interested parties, the simultaneous design of the product and the process, and the postponement of the decision-making step until the last responsible moment to reduce reworks and unnecessary tasks [37]. The principles of lean management and some of its tools have been applied in the design process. For example, Fosse and Ballard [38] presented a case study that showed the change between traditional planning and planning using the Last Planner® System (LPS) in a design phase. Lean could be applied though lean tools and/or lean practices. A lean tool can be defined as a structured technique or instrument that facilitates the implementation of the lean principles [39] such as, the last planner system, 5S, big rooms, and collaborative process mapping, among others. On the other hand, a management practice refers to concrete actions associated with increasing productivity [40].
Herrera et al. [41] summarized 19 lean design management (LDM) practices for the design phase of construction projects, namely, the early involvement of specialist designers and builders [42,43], the exhaustive definition of all the requirements of stakeholders and systematic client participation [44,45], the simultaneous design of the product and the process [46,47], the implementation of design planning activities [38,48], the collection of data for planning [49], collaborative and systematic planning, gradual planning, constraint management [21,50], coordination among specialist designers [42,51], collaborative problem-solving, the causal analysis of problems, monitoring problem solving processes [38,46], multiple option decision making, the examination of all available information for decision making, the collection of data for decision making [47,48], collaborative decision making [52], and monitoring decision-making processes [53,54]. Problem solving always requires decision making to solve the challenge, so in these cases, decision making is reactive; however, there may be instances of proactive design decision-making in the management requirements, programming, and design development process [55]. The summary developed by Herrera et al. [41] proposed a questionnaire that assessed the degree of the implementation of each of these practices and defined a taxonomy of LDM practices. In this way, the authors carried out an evaluation of the 19 lean design management practices to 64 construction projects at the design phase where a high variability in the levels of lean implementations could be observed. The most developed practices were requirement management and active participation of the client, and the least developed were “builders in early stages”, “decision-making until the last responsible moment”, and “multicriteria decision-making” [41]. Table 1 presents a definition of these 19 LDM practices.

2.3. BIM Uses in the Design and Plan Phases

BIM has positioned itself as a technology-supported methodology that promotes the integration of and collaboration among work teams through its multiple uses [56]. Building information modeling is a project life cycle process using the provided model and parametric building information to simulate virtually the physical, functional, and task-related attributes of a project; it helps stakeholders make educated decisions and execute the project with reduced costs, schedules, rework, and better quality [10]. The use of a BIM is defined as a method of applying building information modeling during a facility’s life cycle to achieve one or more specific objectives. Some examples of BIM uses that are relevant for the planning and design phases of construction projects include cost phase planning, site analysis, design review and authoring, and 3D coordination [57]. Rojas et al. [58] designed a BIM use assessment (BUA) tool to diagnose the application of BIM uses; this tool allows companies and clients to identify the status of the BIM uses of the project (i.e., the ways in which BIM uses are being implemented), and the design team’s opportunities for improvement. The BUA tool has been used to evaluate the level of BIM implementation in building projects in pre-construction phases (design and planning) in countries such as Chile, Colombia, Spain [59], and Ecuador [60]. Thus, the high level of execution of these BIM uses is aligned with the first BIM implementation efforts in the AEC industry [61]. Table 2 presents a definition of the ten BIM uses for the planning and design of construction projects considered in this study.

2.4. Dimensions of Design Team Interaction

The interactions among work teams have been studied from the perspectives of several dimensions such as information flows, planning, coordination, collaboration, innovative ideas, and learning. For instance, Herrera et al. [13] identified two perspectives of interaction dimensions: traditional interaction and commitment management. On one hand, the traditional interaction perspective includes the concepts of social interaction, information flow, problem-solving interaction, planning interaction, collaboration, innovative idea interaction, trust, and learning. On the other hand, the commitment management perspective is critical to the design phase because this approach facilitates shared understanding in multidisciplinary teams, thus supporting the discussion and negotiation that are common during the design process [62] (Table 3).
Measuring the interaction of work teams is a challenge that has no single solution [65]. Valentine et al. [67] presented a literature review from 2012, where they found 39 instruments for assessing teamwork through surveys. Most of these instruments include dimensions such as communication, coordination, and mutual respect. To analyze the interactions of work teams, different tools can be used such as surveys frequency analysis, n × n matrix, a social network analysis (SNA) [20], and a design structure matrix [21]. SNA has attracted attention in the AEC industry because it can be used to examine the role of nonformal structures in their coexistence with formal structures [22]. The types of interactions presented in Table 1 can be measured and evaluated through social network analysis (SNA) [13].
SNA is the product of collaboration between mathematicians, anthropologists, and sociologists. This tool involves the representation of organizational relationships as a system of nodes or actors linked by precisely defined connections (networks) [27]. Each network can be represented graphically with a sociogram and mathematical metrics such as density, length, and diameter [19]. There are directed and undirected networks. In directed networks, the relationship between two actors can be unidirectional or bidirectional. In contrast, the relationships in an undirected network must be bidirectional [27]. Some of the types of interaction that can be evaluated through SNA are explained below.
Global interaction refers to any type of interaction between two people, for example, telephone conversations, mail exchanges, social conversations, or business meetings [22]; therefore, the use of a bidirectional link (i.e., an undirected network) is necessary. Relevant work information flows from person A to person B. This information is necessary to the project and adds value to it, but is not freely available [63]; therefore, it is not necessarily a reciprocal link (i.e., a directed network). Collaboration refers to work jointly accomplished by two or more people [13]; therefore, it is a necessary reciprocal link (i.e., an undirected network). In the same way, planning and problem-solving is an undirected network that refers to two or more people jointly defining and redefining tasks, schedules, and resources, among other tasks [63]. Additionally, when a person trusts in the work of another person, a one-way link of trust is created [64] (i.e., a directed network). In the same way, when a person learns something new from another person, a one-way link is created [65]. Originally the trust network, it was intended to measure the trust in personal relationships within the organization [22]; however, in this research, it was adapted to measure the trust in work relationships in terms of quality and schedule requirements [68].
The commitment network approach emphasizes the actions that people take while communicating, how language is used to create a common reality, and how activities are coordinated through language [66]. The basic elements of this perspective are speech acts, which comprise a set of rules for systematizing commitment management [69]. The commitment cycle has four phases: (1) the request and proposal; (2) the negotiation and agreement; (3) the declaration of compliance and performance; and (4) the declaration of acceptance and satisfaction [70] (last four rows in Table 3). The request for requirements, the declaration of compliance and performance, and the declaration of acceptance and satisfaction can be depicted as directed networks, as they do not represent obligatory links between two people. However, the negotiation and agreement phase should be considered as a undirected network since at least two people must always be included [13].

2.5. Impact of BIM and Lean on the Performance

There is a strong synergy between lean construction and BIM [71], which has been documented in many case studies where it is possible to visualize the interaction between both methodologies [72]. BIM with its technology capability and lean with its theoretical foundation can complement each other for better project efficiency [10]. Sacks et al. [72] presented 56 distinct interactions between lean construction principles and BIM functionalities, which were grouped in a lean/BIM matrix. BIM will become increasingly essential and an inextricably linked component to a lean construction process, especially within the context of abundant geometric and semantic project information [73]. For example, Schimanski et al. [73] described three practical case studies through BIM-based objectives and outcomes and mapped these outcomes to the taxonomy of interactions described by Sacks et al. [72]. Based on the synergies of BIM and lean, specific tool applications have been developed such as the Digital Obeya Room framework [74]; “VisiLean”, which uses BIM as the visual platform and enables pull flow scheduling on the construction site [75]; “BeaM!”, which allows a joint application of BIM and the Last Planner® System (LPS) [73]; and “KanBIM”, which mixes Kanban and BIM [76].
Based on data from 64 projects, Herrera et al. [59] performed an association analysis between each pair of variables (i.e., 10 BIM uses and 19 LDM practices). The analysis of the relationship between LDM practices and BIM uses allows for empirical evidence of the LDM practices that are present in each BIM use in the design phase of construction projects to be obtained. Additionally, if a project applies a higher proportion of BIM uses, it will tend to apply a higher proportion of LDM practices; however, this relationship is not as clear the other way around [59]. By understanding the benefits of BIM and lean interactions, the design errors can be handled better in an attempt to reduce both their incidence and their dissemination [77]. Some of the benefits of using an integrated BIM and lean approach in the design stage of construction were summarized by Dave et al. [78] and included reducing the design development life cycle, reducing rework, increasing the number of iterations for value improvement, improving the predictability of investment and life cycle costs (4D scheduling), and enhancing the ability to engage with stakeholders. To realize the full potential benefit of BIM and lean methods, both need to be used collaboratively in a project [11]. Theoretically, it has been demonstrated that the use of BIM and lean management would allow a reduction in design errors through more effective interaction between design team members [10]

3. Materials and Methods

To achieve the main aim of this research, a comparative analysis of two case studies was conducted involving high-rise building construction projects in Chile. In this research, we analyzed how the application of a methodology based on BIM and lean impacts on several interactions that can be generated in a design team. The case study research method was used in this paper, following the recommendations of Yin [79]. Two case studies were analyzed, and their design management was assessed from a lean BIM perspective while their team interactions were assessed using SNA. To achieve the objective of this paper, four steps were performed: (1) case study selection; (2) description of the design management of the projects from the LDM and BIM perspectives; (3) assessment of design team interaction; and (4) comparison of design team interaction using SNA.

3.1. Case Study Selection

The selection of projects was intentional and aimed to facilitate literal and theoretical replication. The authors defined a list of 10 comparative criteria to select the two case studies (Table 4). To facilitate literal replication, cases were selected to predict similar results [80], therefore, two projects with similar features in relation to the first nine criteria in Table 4 were chosen. To facilitate theoretical replication, cases were selected to predict contrasting results, but for theoretical replication [80], the research team ensured that the two selected projects exhibited opposing characteristics in relation to at least one characteristic criterion [79]. First, according to the project coordinator, the use of BIM was the opposite characteristic between both projects (see criterion 10 in Table 4). Additionally, according to the project coordinators, neither applied lean tools, but they did not know if they applied any LDM practices. Nevertheless, the project that uses a higher proportion of BIM uses at the same time is likely to be applying a higher proportion of LDM practices [59]. Therefore, during the research process, the researchers characterized the actual application of LDM practices and BIM uses in both projects to validate the project manager’s reporting regarding lean BIM management. Project A was chosen due to its use of traditional, informal design management without the methodological and technological support of BIM, while project B was chosen because of its use of BIM methodology. Both projects had the following design team members: client representative (CR), project manager (PM), architect (A), geotechnical engineer (GE), structural designer (SD), electrical specialist (E), plumbing specialist (P), gas specialist (G), irrigation designer (ID), and landscape designer (LD). Additionally, project B included a BIM manager (BM) and a construction company representative (CO); therefore, there are ten and twelve design team members in projects A and B, respectively.
The number of projects studied is related to the complexity of the expected results [79]. Yin’s approach shows that for a descriptive theory such as the theory used in this research, two cases can suffice [79]. Based on the projects studied, the domains to which the research results could be generalized are: (1) the design phase of the infrastructure life-cycle; (2) building construction; (3) large and medium-sized companies; (4) small temporary organization of less than 50 people [81]; and (5) varying degrees of application of LDM practices and BIM uses.

3.2. Description of Design Management

To describe the design management of each project, the researchers conducted two interviews with the client representative (CR) and the project manager (PM) in each project, and a third interview with the BIM manager, but only in project B. The instruments used for these interviews were the LDM practices questionnaire [41] and the BIM uses assessment (BUA) tool for design and planning [58]. Both instruments were subjected to a construct validation, a reliability validation, and a concordance analysis of the responses [41,58].
These tools were applied using recorded interviews (audio was recorded with the consent of the interviewee) with the CR, PM, and BIM manager, covering all the topics addressed in each questionnaire and following the criteria established by Woodside [82]. Then, the researchers listened to these recorded interviews and rated each item on each questionnaire for both projects using a 5-point Likert scale. Each LDM practice and BIM use was qualified with a five-level assessment rubric. The qualification could have a certain degree of subjectivity by the evaluator; therefore, to mitigate this subjectivity, the following procedure was conducted: (1) two researchers listened to the recorded interviews and individually qualified; and (2) in a collaborative session, the two researchers discussed the final qualification of each LDM practice and BIM use.
The LDM practices questionnaire uses a five-point scale to measure the 19 practices (Table 1) [41]. Each LDM practice followed the method of Bloom and Van Reenen [83]; namely, a description is provided for scores 1, 3, and 5, while scores 2 and 4 are defined as intermediate points between scores 1 and 3 and 3 and 5, respectively. The general descriptions for each score are (1) traditional management practice; (3) initial lean design management practice; and (5) developed lean design management practice [41]. The BUA questionnaire also rates each use on a scale from one to five, where the first level (1) denotes a traditional method with a 2D model (i.e., no use of BIM); the second level (2) denotes a low use of BIM and includes little BIM-related information in the model; and the third level (3) denotes a medium use of BIM and sufficient information for its implementation; the fourth level (4) denotes a high use of BIM; and the fifth level (5) denotes a full use of BIM (i.e., the best methods and tools are utilized). The above is a general description of each BUA level; however, different features and levels of automation were evaluated for each BIM use in the planning and design of the projects [58]. Finally, a benchmark was established for projects A and B using other projects evaluated with the same instruments.
The projects used for the benchmark in this study were derived from the studies of Rojas et al. (2019) (who assessed the BIM uses in 25 projects) and Herrera et al. (2020b) (who assessed the LDM practices in 64 projects). The benchmark will allow a relative assessment of the case studies in comparison to projects with similar characteristics, allowing us to identify whether the LDM practices and BIM uses of the two case studies were in the lower or higher percentiles of application with respect to the studied sample; in this way, it will also be possible to visualize some BIM uses and LDM practices that could not apply at the highest level according to the theory. However, the case studies could be in the highest percentile of application with respect to similar projects

3.3. Interaction Assessment and Case Study Comparison

An interaction assessment was conducted, although the method for understanding the interaction of the members of design teams on construction projects proposed by Herrera et al. [13]. This method recommends the use of SNA to analyze the data obtained via surveys conducted with all the members of the design team. The perceptions of interactions evaluated in this study were knowledge of the roles and responsibilities, global interaction, flow of relevant information, planning and problem solving, collaboration, trust, learning, and commitment management (request for requirement, requirement negotiation, declaration of compliance, and declaration of satisfaction). The method consisted of four main stages: (1) definition of the initial conditions; (2) information capture, (3) data processing; and (4) information analysis. The survey used in this study was subjected to a construct validation and coherence analysis before being applied in the two projects studied [13]. Additionally, SNA has been carried out in design teams with participants from different companies using information obtained from BIM log files that are registered in collaborative design software and emails [84]; however, this methodology can only be used in BIM design environments, and can only measure the information flow type of interactions, hence it cannot assess other dimensions of the interactions such as collaboration, learning, planning, among others.
During the stage involving the definition of the initial conditions, the researchers detailed the assessment procedure. First, a 12-week interaction evaluation period was defined including representatives from both projects; this period was consistent with the detailed design stages of both projects, in other words, all questions asked about interactions during the last 12 weeks (information was captured only once per project, and the question asked for interaction during the last 12 weeks). The evaluation of both projects was prior to the coronavirus pandemic outbreak. Then, for both projects, the use of online surveys was chosen as the method to be used for collecting data, given the non-collocated nature of the various members of the design team. Third, the participants of the study were defined; as previously mentioned, projects A and B had 10 and 12 members in their design teams, respectively. Fourth, because data capture was conducted through a survey of project team members, there will always be some amount of subjectivity of the input data; therefore, an analysis of the coherence of the input data must be performed before the SNA [68]. This coherence analysis can be performed in undirected networks in which, theoretically, there is a correspondence between the responses of the people involved, so that if person A wishes to interact with person B, then person B must indicate the same [68]. Therefore, it is possible to calculate a percentage of valid connections (PVC) as the proportion between the valid connections and the total connections (valid and invalid) [13]. In these cases, the minimum percentage of valid connections (PVC) to consider the responses valid was set at 80%, given that this is a typical confidence level used in risk analyses involving the construction industry [85,86]. Finally, it is necessary to select a software to process the data, graph the sociograms, and calculate the SNA metrics. In this study, Gephi was selected as the software to be used for the calculation of metrics and the realization of sociograms, given the precedence set by prior researchers regarding the use of this tool. Gephi is an open-source software for graph and network analysis. With this software, traditional SNA metrics can be computed such as input and output degree, closeness and betweenness of each node, mean degree, number of connected components, density, and diameter of the network, among others [87]. Table 5 shows the definition of some traditional SNA metrics.
The second stage (information capture) consisted of two activities: the design of the survey and the actual data collection. Certain types of interactions, namely, knowledge of roles and responsibilities, global interaction, trust, learning, and request for requirements allowed for yes or no responses. Other types of interaction, namely, relevant information flow, planning and problem-solving, and collaboration were answered using the following frequencies: never, monthly, weekly, and daily. The remaining types of interaction, namely, requirements negotiation, declaration of compliance and performance, and declaration of acceptance and satisfaction were answered using the following frequencies: never, sometimes, frequently, and always. Each participant in the study responded according to the type of interaction they had experienced with all the other design team members. Finally, the survey was required to have a 100% response rate to be used for the analysis.
In the third stage of data processing, the first step is to verify that the PVC exceeds the minimum of 80% and the response rate is 100%. Then, the metrics are calculated (Table 6), and the sociograms for each type of network are created. Some metrics are directly extracted after processing in Gephi software, whereas others are calculated from the metrics obtained from this software. Table 6 indicates which network is directed or undirected. A directed network could be unidirectional or bidirectional links; in contrast undirected networks must be bidirectional interactions; therefore, the number of input and output links will always be equal in an undirected network (degree), while in a directed network they could be different, hence there is a difference between the input degree (in-degree) and the output degree (out-degree) [89]. Finally, in the fourth stage, a comparative analysis of both projects is carried out.
In summary, Table 7 presents the overall structure of the research, where it presents the sources of information, the data collection instruments, the number of responses for each instrument, and the analysis tools.

4. Results and Discussion

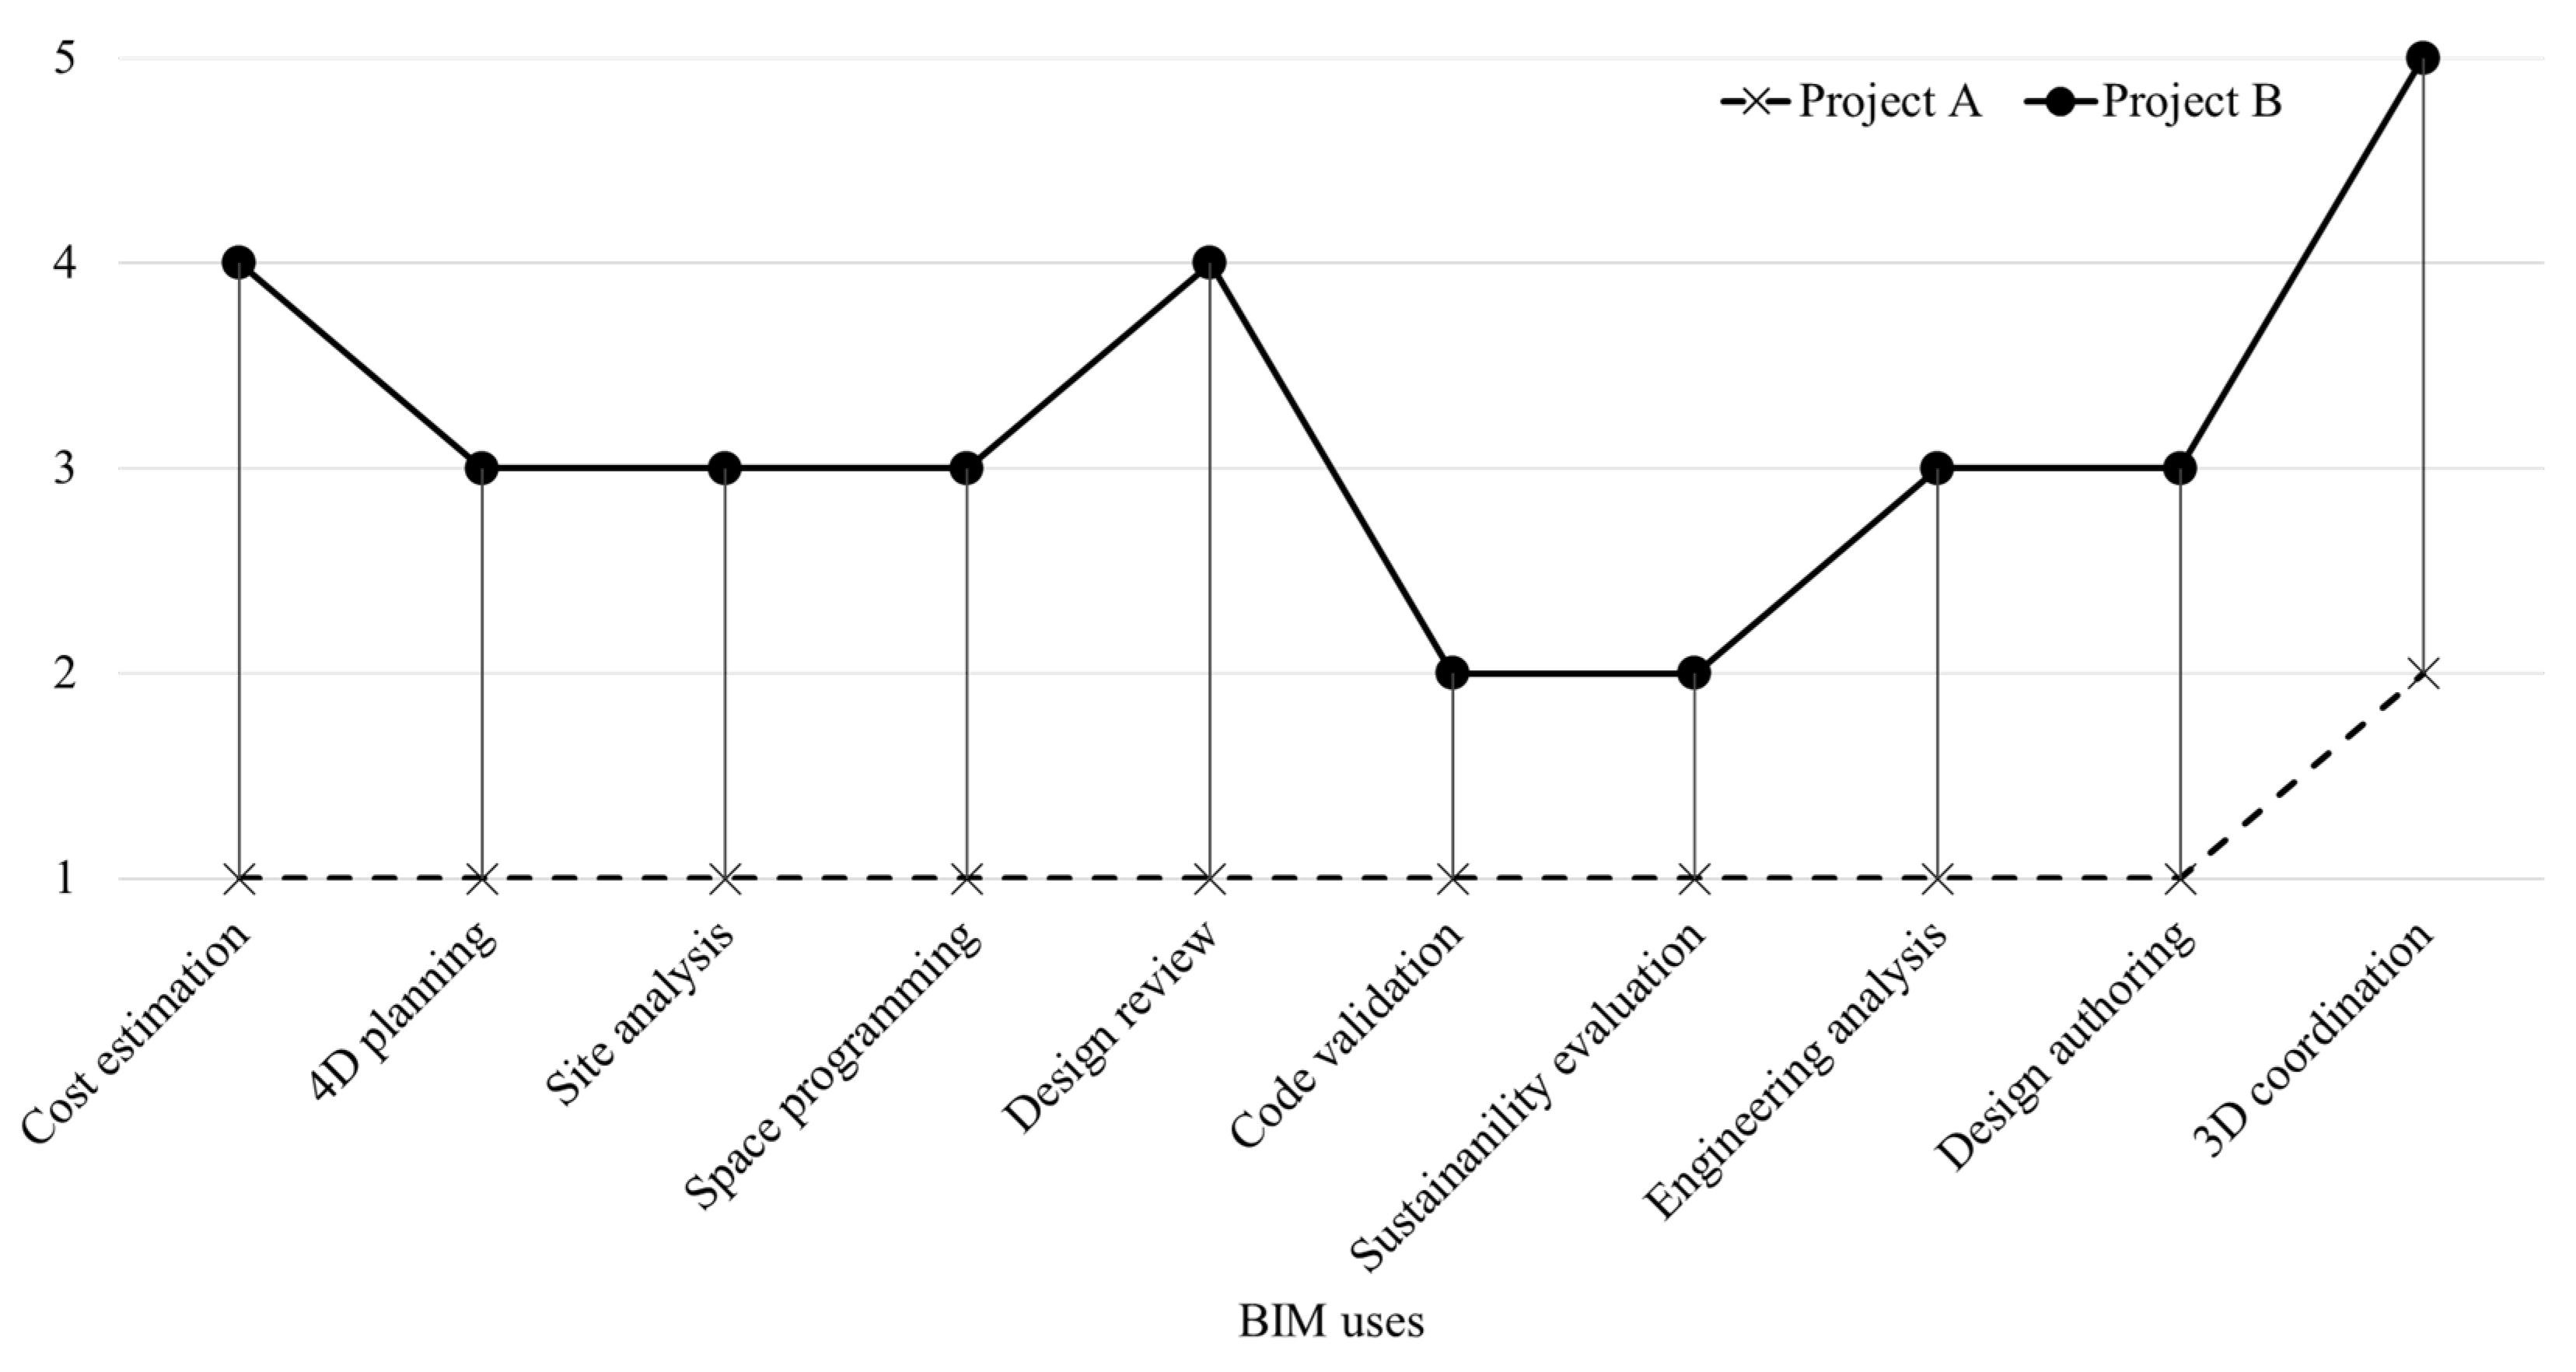
4.1. BIM Uses Assessment

Figure 1 shows the results of the BUA application in both projects. The evaluation of project A shows that BIM uses were not applied in this project, as mentioned by the project manager during the project description. The unique application of BIM at the initial level corresponds to a 3D coordination between the architecture and the structural model. Therefore, project A was entirely designed using traditional methodologies (i.e., the use of CAD and non-BIM technologies). On the other hand, project B showed some level of BIM application for each of the BIM uses considered in this study, as mentioned by the project manager and the client representative during the project description. All the BIM uses in the planning and design phases were applied at the initial level, five out of 10 were applied at an intermediate level, two out of 10 were applied at a high level, and one was applied at a comprehensive level.
Projects A and B can be contrasted with the results of a study regarding 25 projects in Chile, Colombia, and Spain [58]. Project A consistently corresponded to the minimum application of BIM exhibited by the projects in the aforementioned study. However, project B in the maximum values of application in the BIM uses: “4D planning” and “3D coordination”; it was in the 75th percentile in the uses of “cost estimation”, “site analysis”, “space programming”, “design review”, and “engineering analysis”; and it was in the 50th percentile in the uses of “code validation”, “sustainability evaluation”, and “design authoring”. Therefore, the results of the BIM use assessment demonstrate that project A did not use BIM methodology in its planning and design; however, project B used BIM methodology and stood out in its use of these methods even among similar projects.

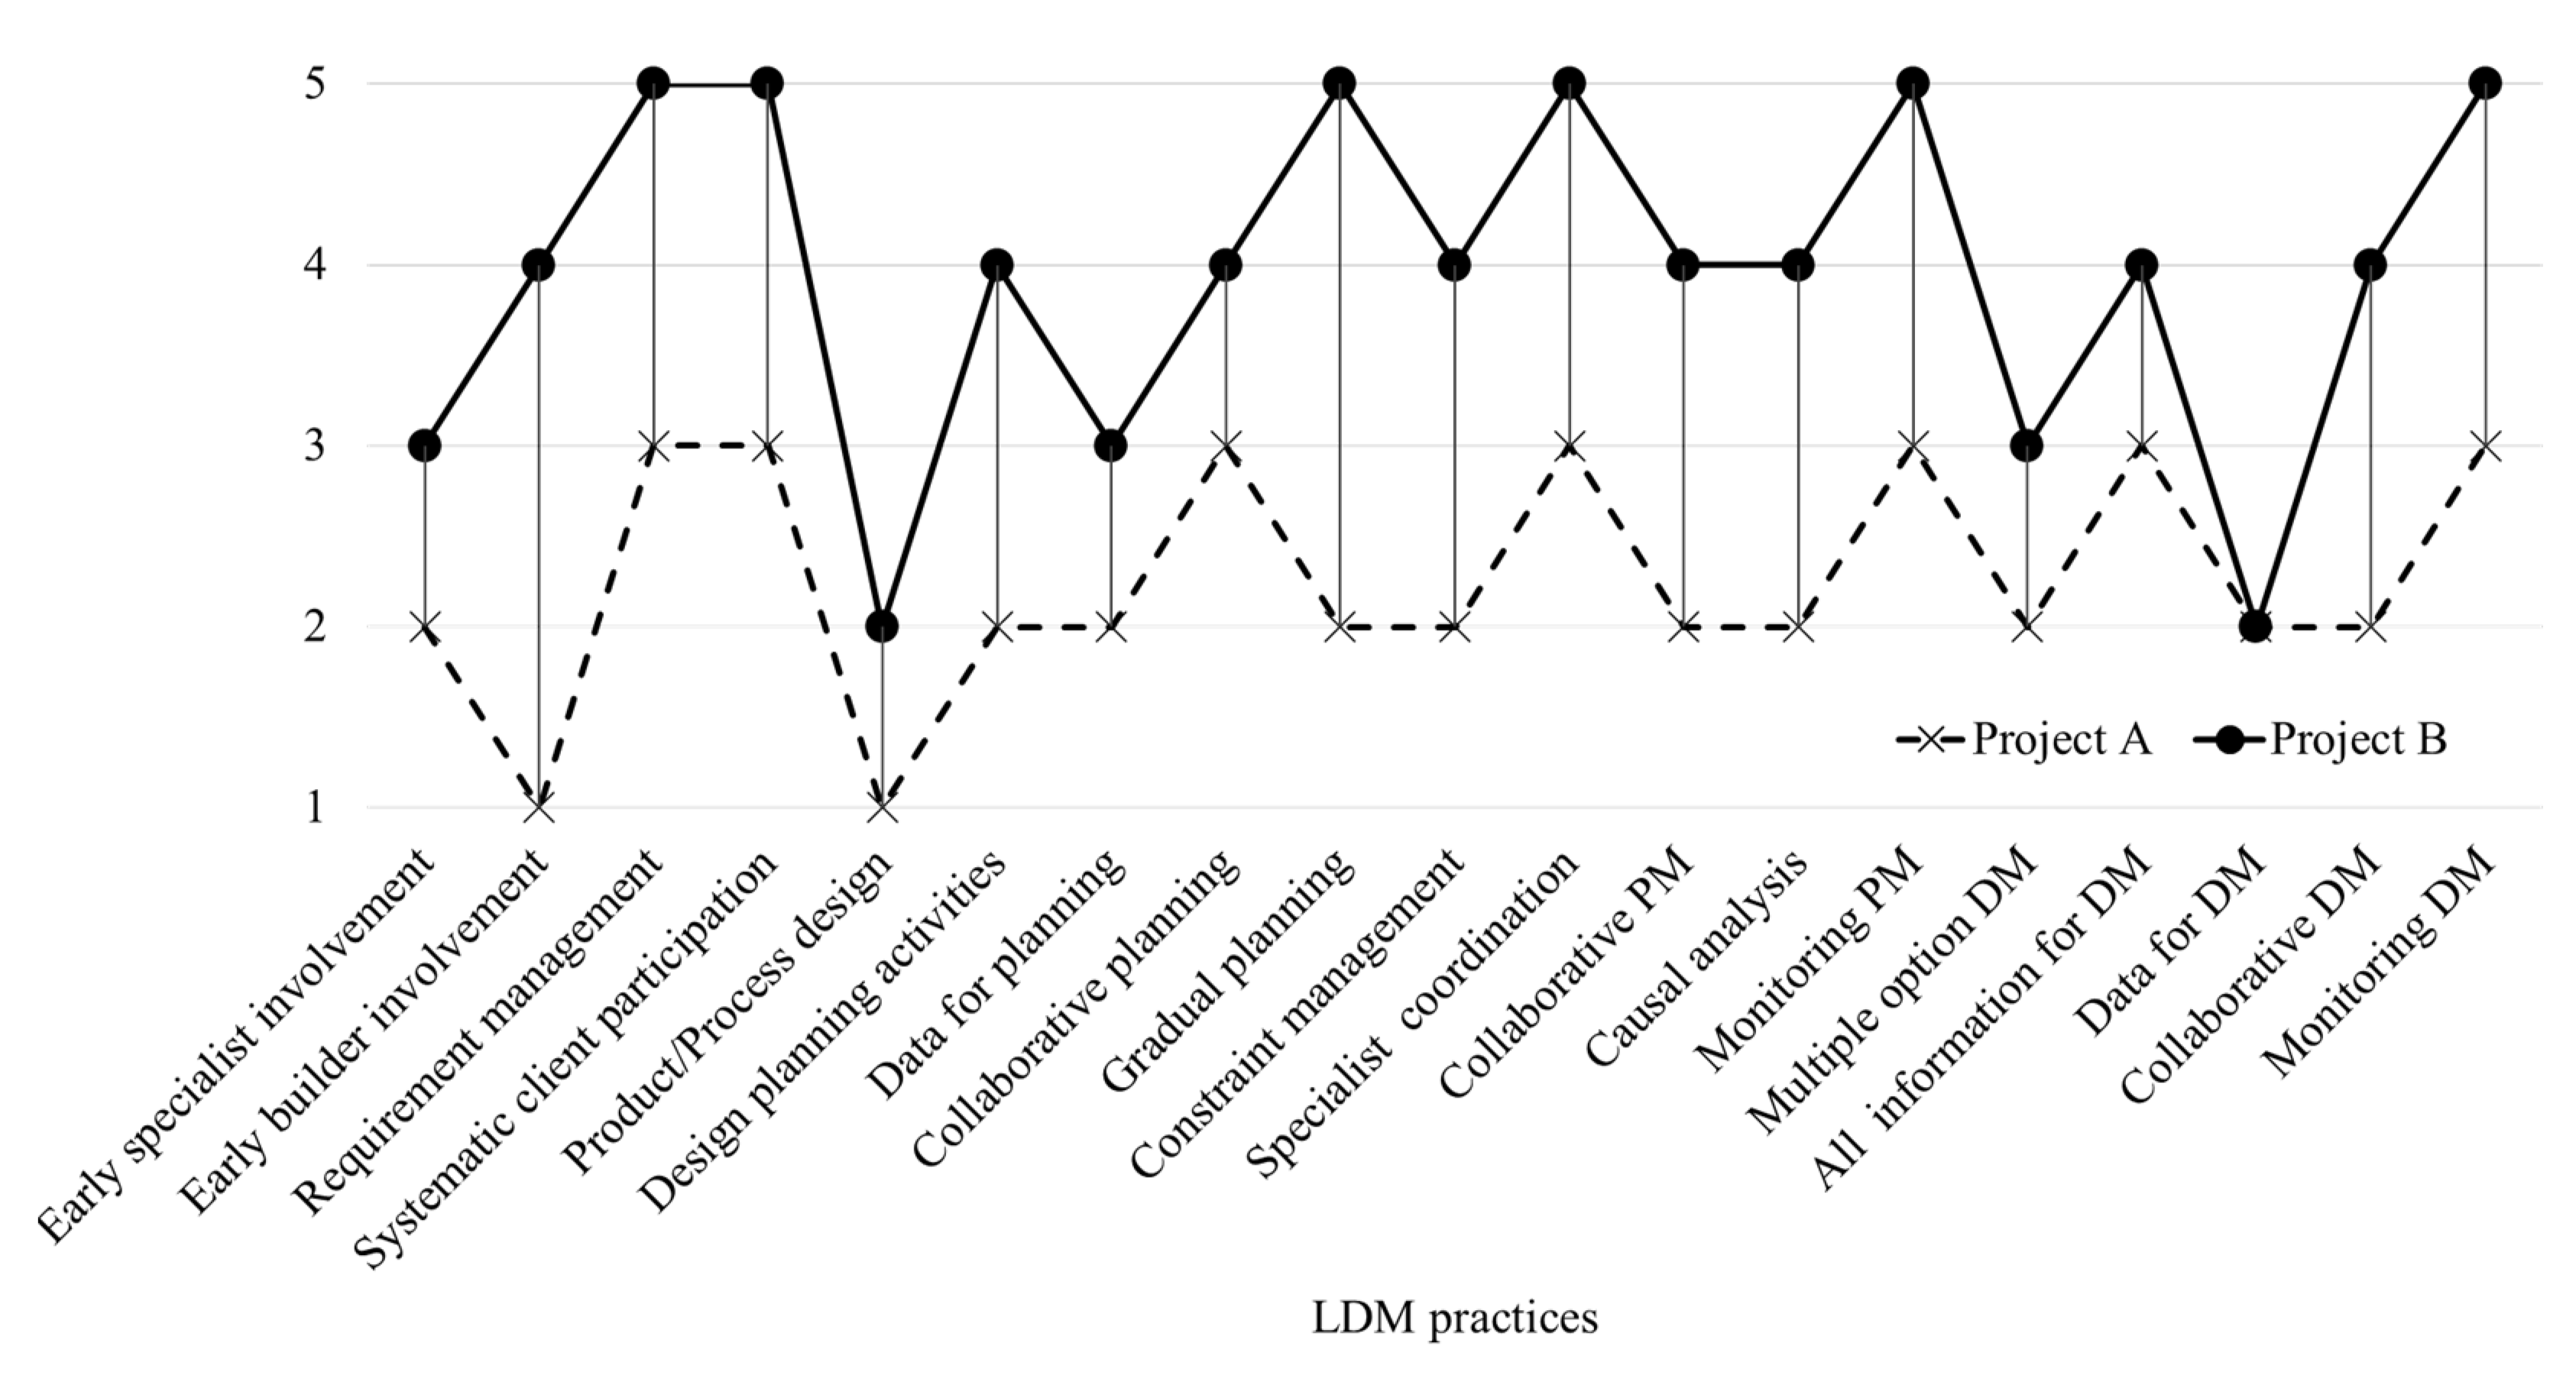
4.2. LDM Practices Assessment

Neither project explicitly applied lean design tools to manage the project during the design stage. However, the researchers assessed the LDM practices in both projects since BIM methodology indirectly involves the application of certain lean principles [11]; thus, projects that apply BIM methods could also be expected to apply some lean practices [59]. Figure 2 presents the results obtained from the assessment of the LDM practices in projects A and B. Project B had a higher level of implementation of all the LDM practices than project A, confirming, in this project, that the application of BIM methodology also entailed the application of some lean principles.
Project A did not apply the practices of the early involvement of builders and the simultaneous design of the product (building) and the production (construction) process. Considering that the client’s company and the construction company belonged to the same corporate group and were even physically located in the same place, both of these lean practices could have been applied to project A without significant complications. The LDM practices of the exhaustive collection of requirements from all stakeholders and the client’s systematic participation were implemented at the initial level of lean application; given the company’s experience with this type of project and their closeness to the client, they could have used both of these conditions to improve the design process in addition to implementing other LDM practices. Project A did not exhibit any LDM practices at the 4th and 5th application levels, and only seven of the 19 LDM practices were implemented at the initial level of lean application. The project manager and the client representative responded that their company did not have standardized practices that facilitated the management of their projects in the design phases, and each project manager managed according to their level of experience. In addition, they were not familiar with the concept of lean design, although they were familiar with lean construction due to their application of the Last Planner System during the construction phase of other projects.
The project manager of project B did not know if he was applying lean practices in his management; however, this project applied several lean practices at a high level of implementation. Six out of the 19 LDM practices were fully implemented including exhaustive management requirements, systematic client participation, gradual planning, coordination of specialists, and monitoring problem solving and decision-making processes. At the beginning of project B, the design team, which was led by the project manager and the BIM manager, defined the workflow using the participation times of each designer and/or specialist, and they scheduled weekly meetings for planning and problem solving. Additionally, a BIM common virtual data environment was used in project B, in which all the team members could make notes and propose changes to the project. All of these factors allowed the team to exhibit high levels of implementation of lean practices. However, two LDM practices were implemented at low levels: the simultaneous design of the product and the construction process and the use of a database to record the lessons learned regarding planning and decision making. This project was the first in the company to have involved the builders in the early stages of the project. According to the client and construction company representatives, this project provided a useful experience that they planned to standardize for use in other projects. In addition, they stated that the next project would implement the simultaneous design of the product and the construction process as a pilot test. However, the company did not have an organized database of lessons learned regarding project planning and decision making yet, so both of these practices were assessed at the initial levels of implementation.
Projects A and B can be compared with the results of a study regarding 64 projects in Chile, Colombia, and Spain [41]. The levels of LDM practice application in project A were all practice applications in the 25th percentile or lower when compared to the projects in the aforementioned study. Additionally, nine of the 19 LDM practices in project B exhibited the best performance among the aforementioned projects, another five were ranked in the 75th percentile, three were ranked in the 50th percentile, and only two were ranked in the 25th percentile among these 64 projects. The practices in the last category mentioned consisted of practices related to the simultaneous design of the product and the construction process and the use of databases for decision making. Therefore, the results of the LDM practices assessment demonstrate that project A did not apply LDM practices, while project B applied LDM practices and stood out in its use of these methods even among similar projects. The above exemplifies that a project that has a high percentage of BIM uses, will at the same time be applying a high percentage of LDM practices [59], even if it is not applying any lean tool explicitly.

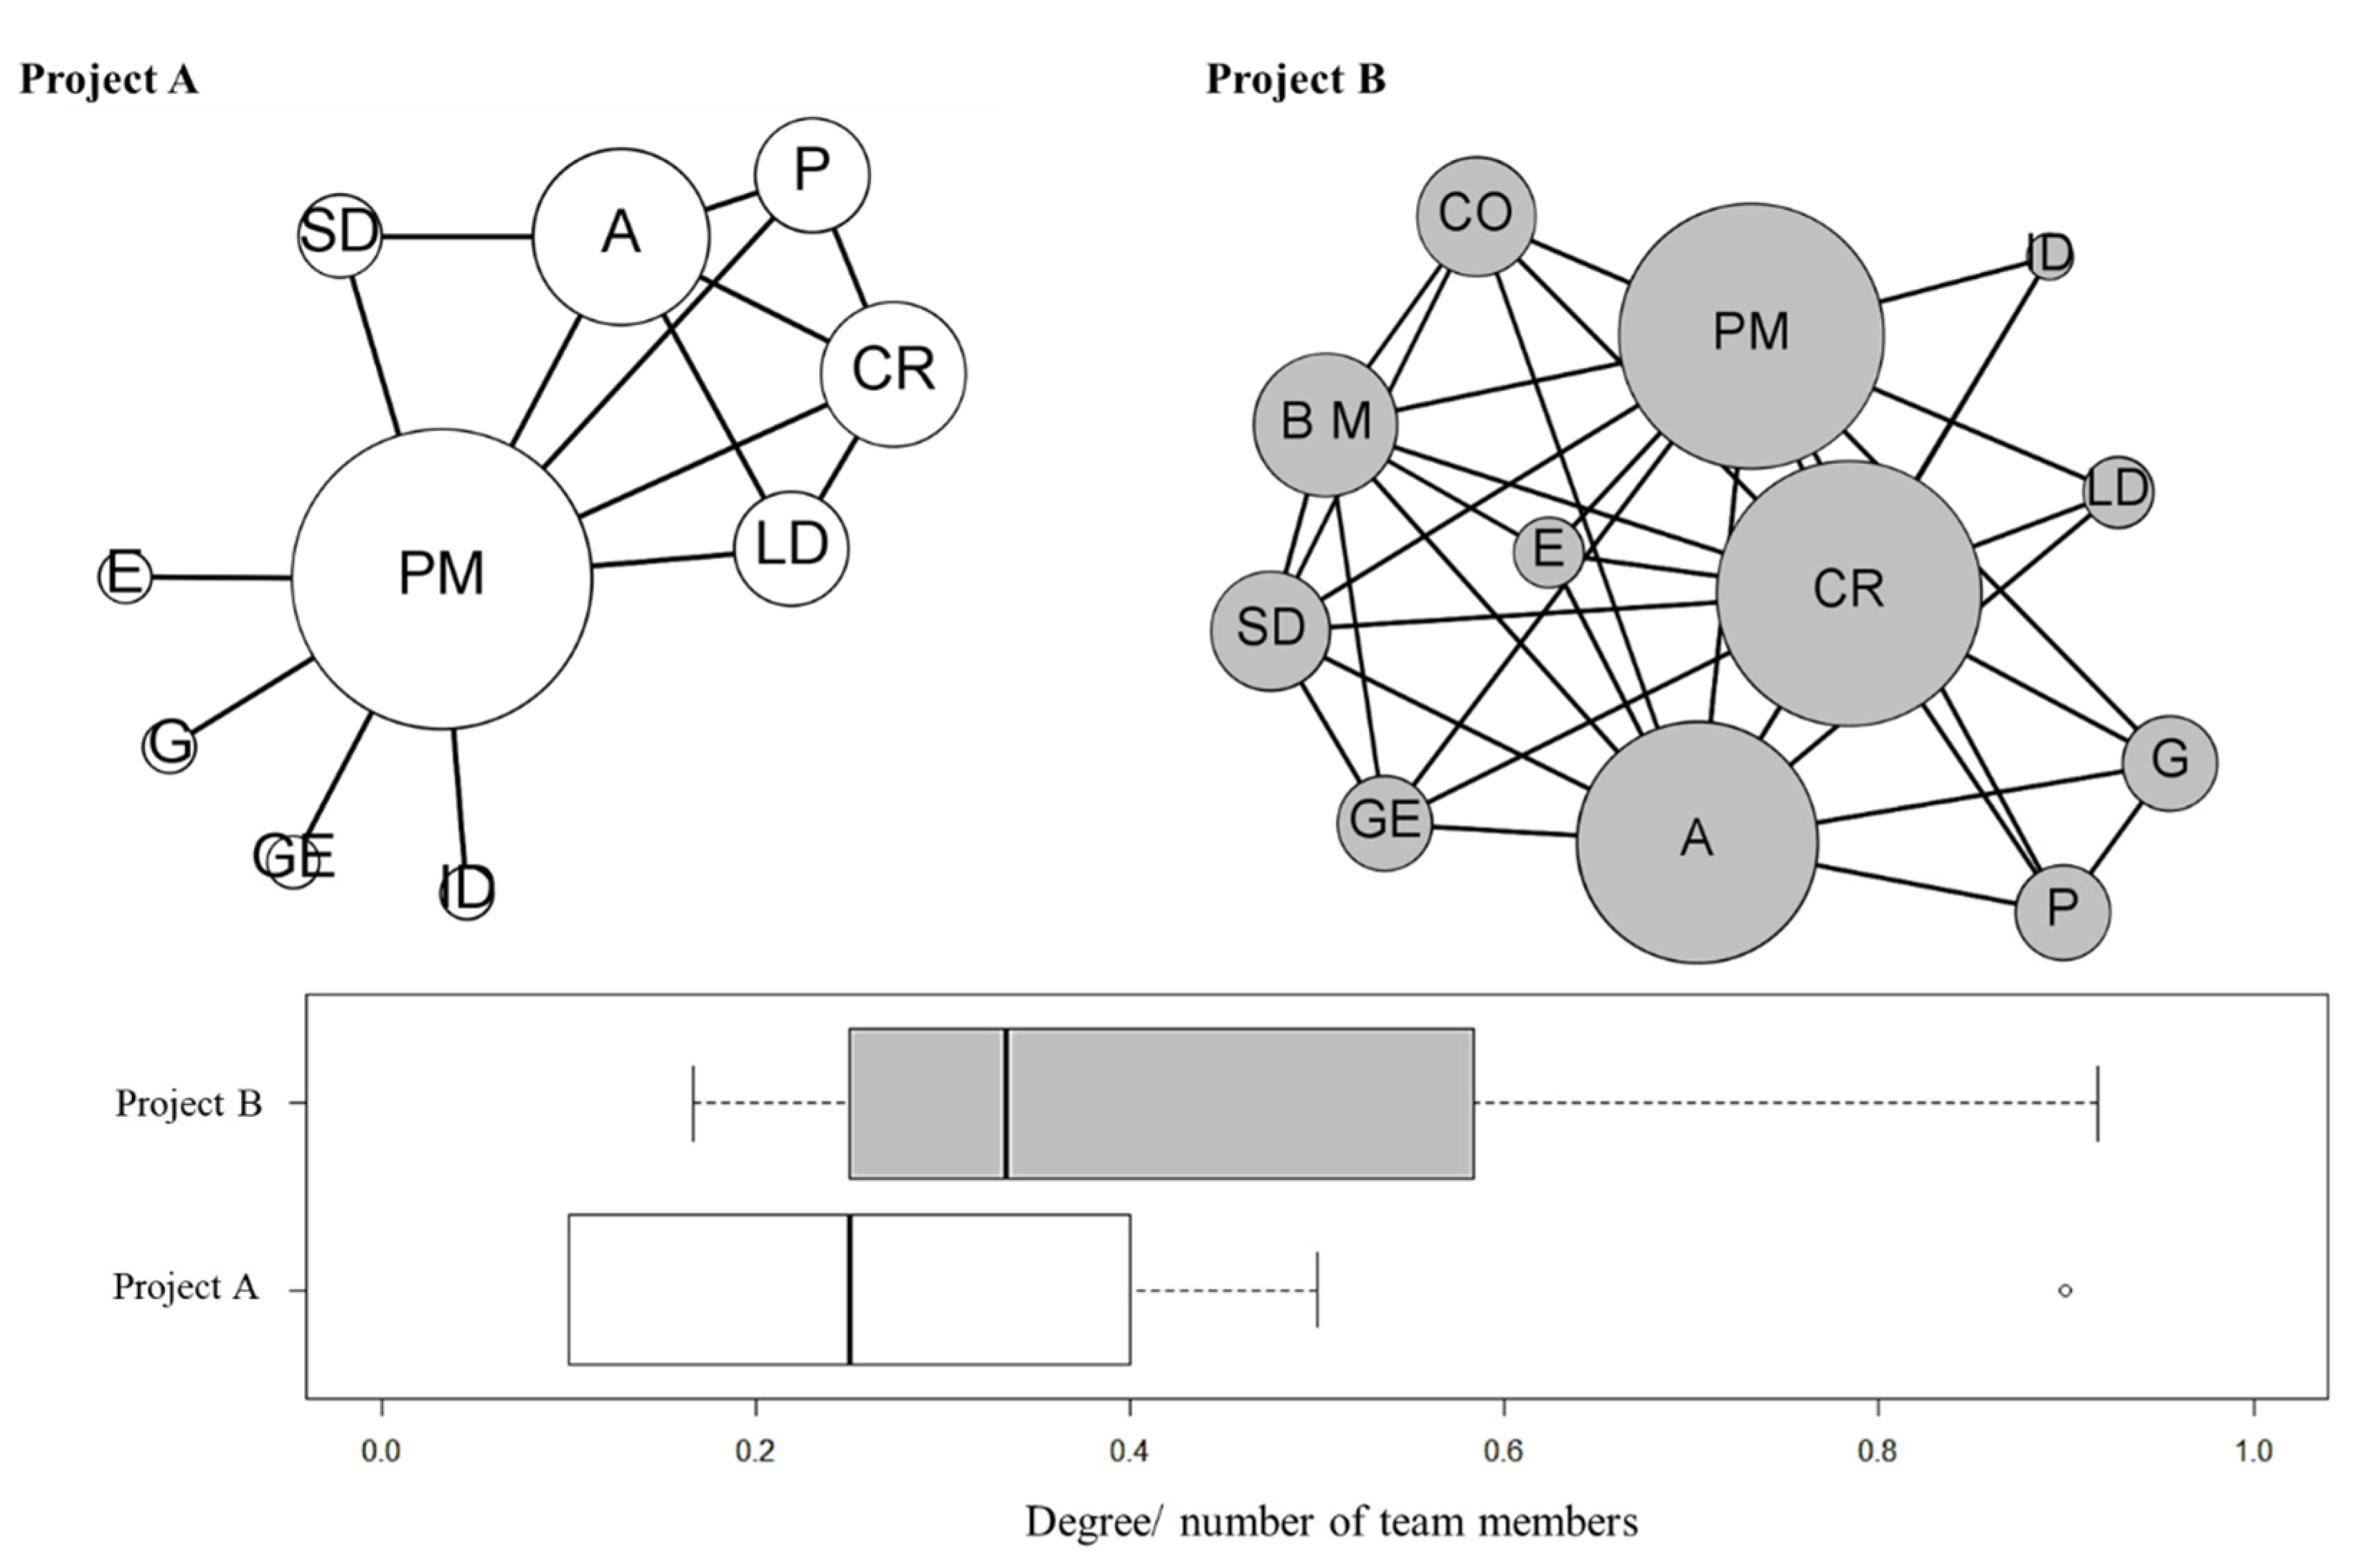
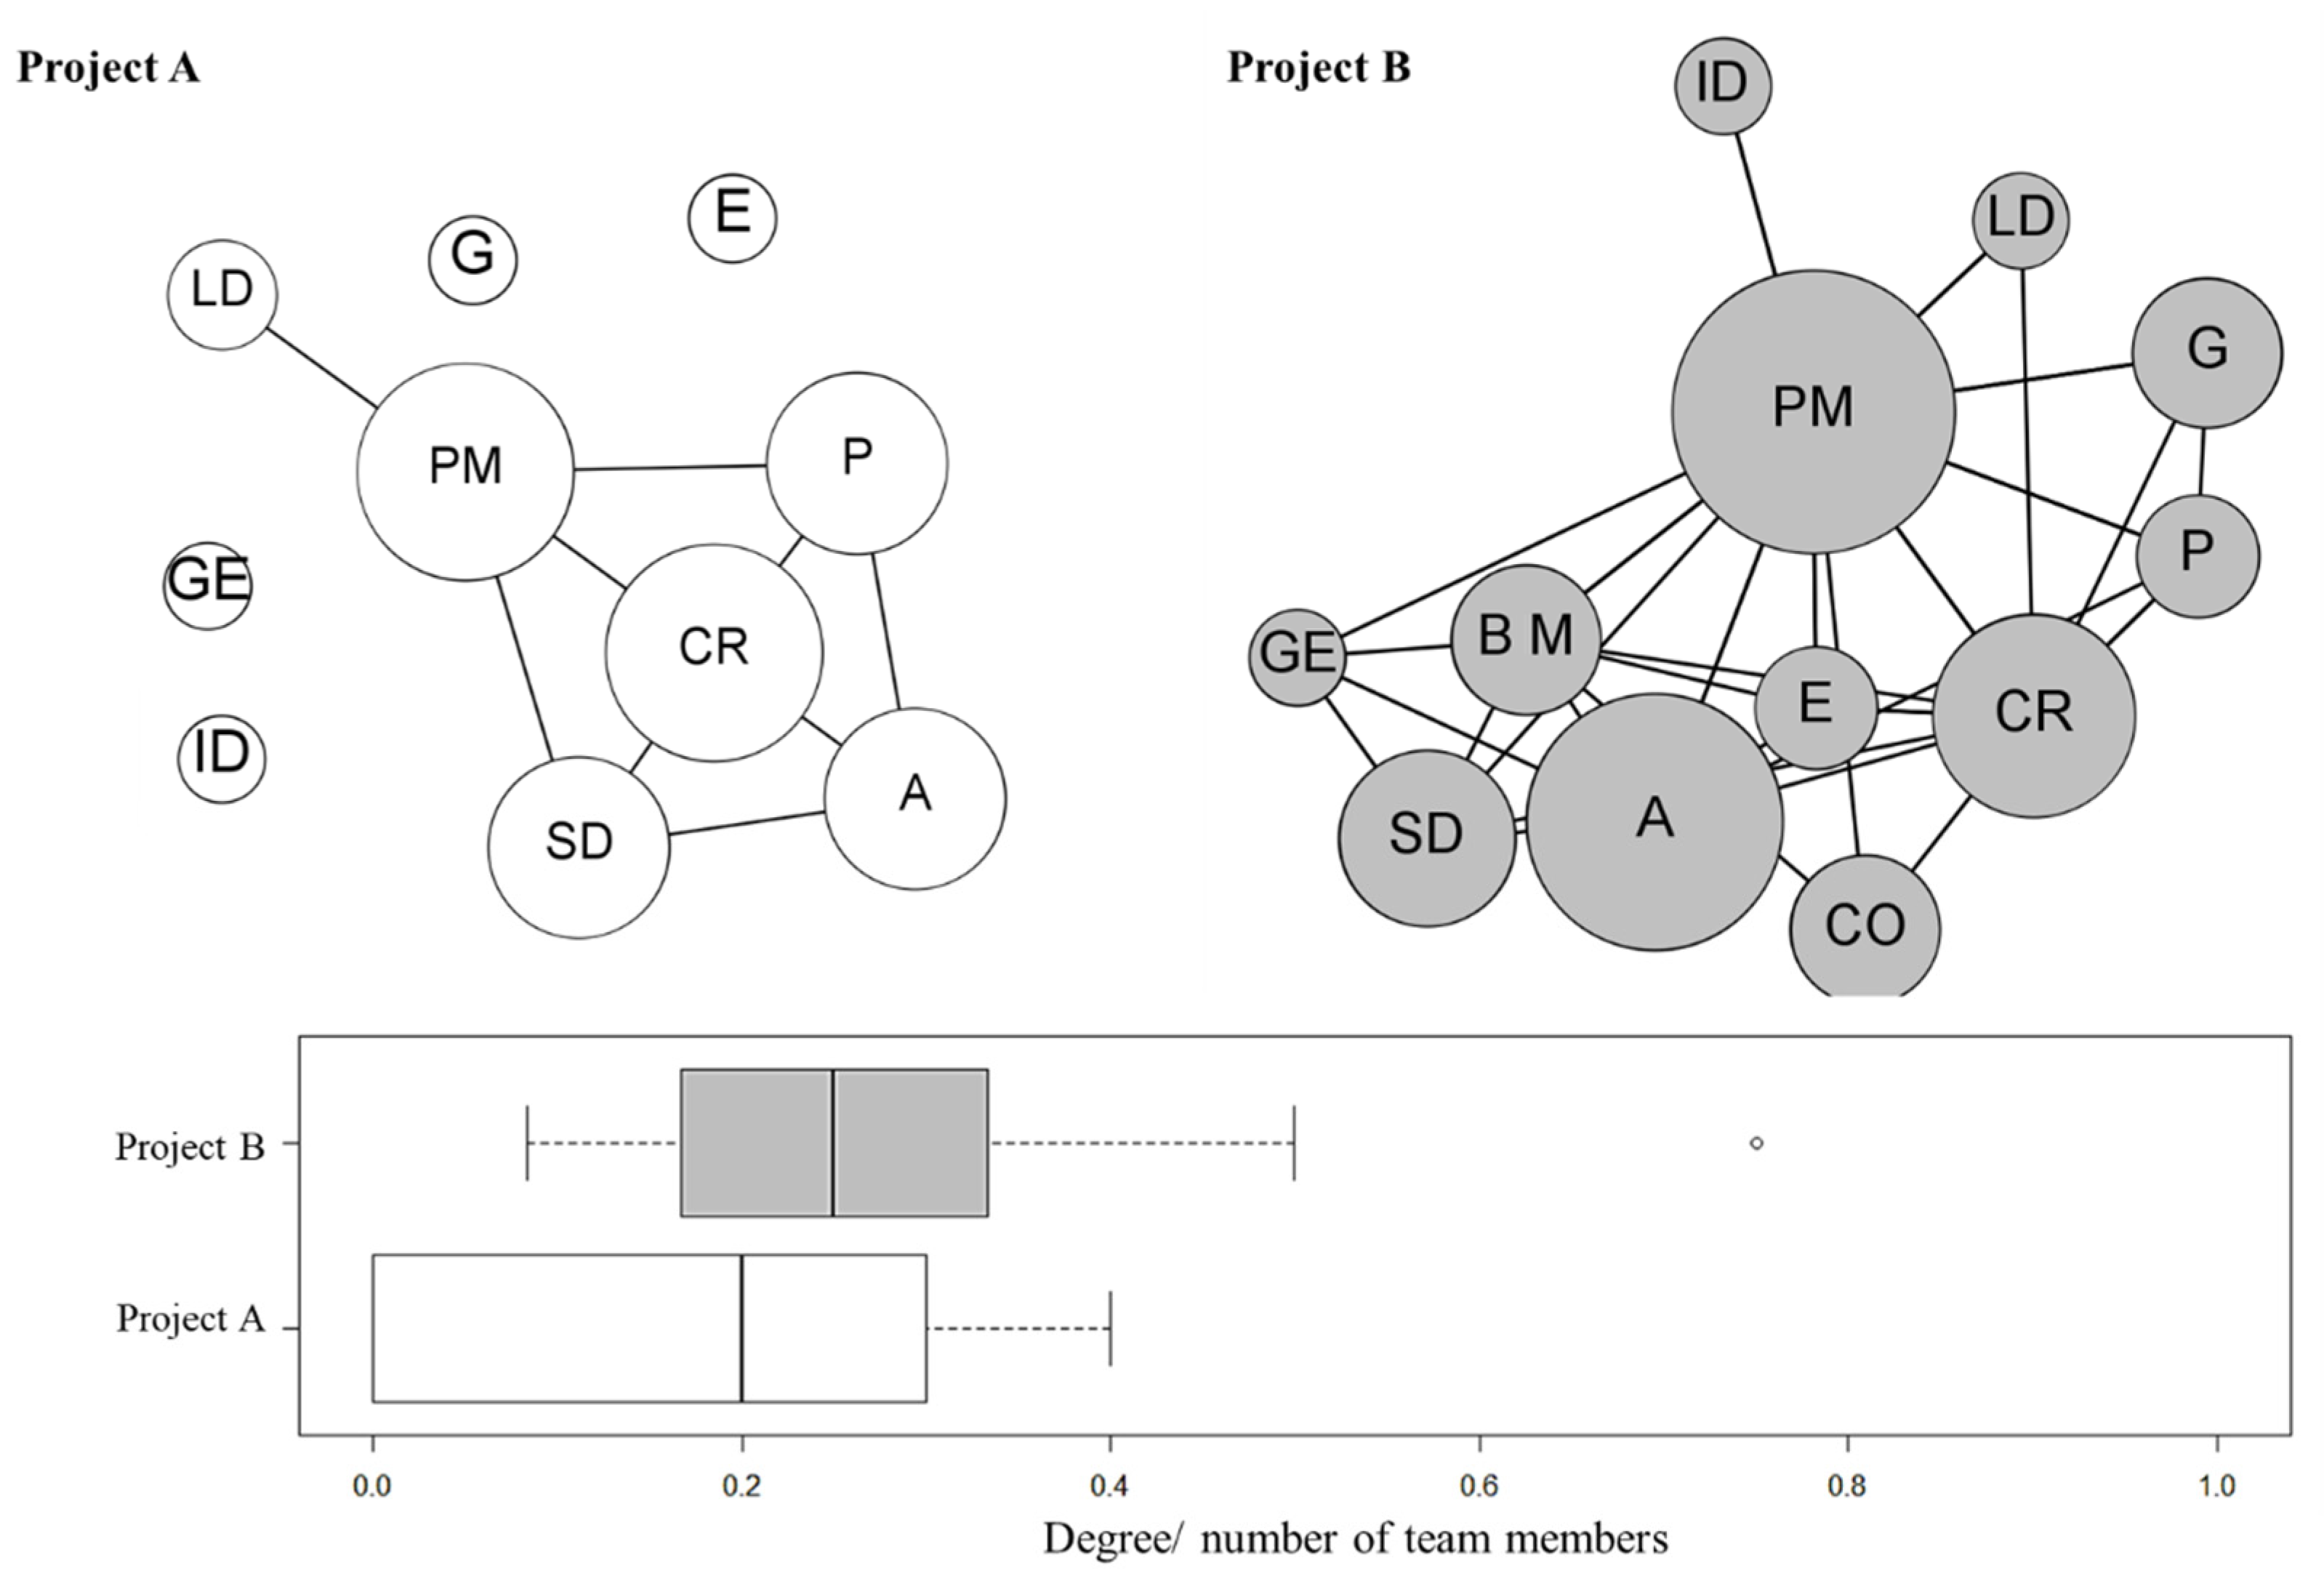
4.3. Interaction’s Assessment and Comparative Analysis of Two Case Studies

An interaction analysis was conducted with the survey responses from all the members of the project design teams of projects A and B (10 and 12 members, respectively); thus, the degree of the node metrics is proportional to the total number of the members of each team. The consistency analysis of the responses using the global interaction network showed that 90.32% of the interaction in project A was valid, as was 91.18% of the interaction in project B; therefore, the input data were reliable for performing SNA according to the 80% limit proposed in this research. This percentage was even higher than the 85% obtained in the pilot study where the evaluation methodology is explained [13]. To analyze the global interaction network, the collaboration network, the planning and problem-solving network, and the requirement negotiation network, all the nonreciprocal links must first be eliminated because these interactions are undirected networks. Additionally, all links were maintained in the relevant information flow network, the learning network, the trust network, and requirement networks because these interactions could occur in only one direction (i.e., directed networks) (Table 6).
The global interaction networks in both projects exhibited connected teams (Figure 3) (i.e., no person or team was isolated from the others). However, this network showed that the project manager of project A was a bottleneck (i.e., if the project manager was absent or did not engage in an interaction, four specialists of the project team would be isolated (namely, 40% of the design team)). Additionally, project B was a rounded network in which the interactions among the design team members were homogeneous; therefore, if any team member failed to engage in any interaction, other bridges existed that allowed the team to remain cohesive. Figure 3 also shows the distribution of the degree of connection among the team members in proportion to the total number of team members. The boxplots illustrate that project B had a higher level of global interaction than project A. Although the median number of connections of both projects was not very different, the minimum values of connection in project B were higher, and there was also a more significant number of members with high levels of interaction in project B than in project A. This higher interaction level exhibited by project B was initially due to the weekly work sessions and the permanent involvement of the construction company representative and the specialists required for each part of the project. The above reinforces what is stated in the study of Priven and Sacks [64], where it is mentioned that the weekly work planning meetings appear to be the main catalyst for strengthening the networks.
Similar to the global interaction network, the relevant information flow network (Figure 4) presents the connections among the teams of both projects; however, in both cases, the management of information remains centralized in the hands of certain stakeholders (PM in project A; and PM, CR, and A in project B). Nevertheless, the number of connections among the teams of project B was higher than those in project A; this phenomenon is mainly caused by the coordination of specialists via an advanced BIM common data environment where all team members can visualize the building model; add comments, annotations, and improvement proposals; and record each information exchange. Additionally, project A used emails and phone calls as a means of transferring information to resolve questions or to make comments, leaving no evidence of these communications and failing to clearly manage the supporting documentation. The in-degree of both projects was similar; however, the out-degree exhibited major differences. In project A, a small number of participants did not provide any relevant information during the 12 weeks of the study, demonstrating that the participation of specialists and designers in this project was occasional and not sustained over time. However, in project B, each member provided information to another team member during these 12 weeks, whether it was to support their work, to comment on an aspect of the project, or to communicate some revision of the coordinated model. This phenomenon is mainly caused by the coordination of specialists via an advanced BIM common data environment where all team members can visualize the building model; add comments, annotations, and improvement proposals; and record each information exchange, as also mentioned in the study by Shafiq et al. [90]. Additionally, project A used emails and phone calls as a means of transferring information to resolve questions or to make comments, leaving no evidence of these communications and failing to manage the supporting documentation.
The collaboration network is similar to the planning and problem-solving network of a design team; hence, only collaborative networks will be presented (Figure 5). In contrast to the previous networks, this network showed that 40% of the project A team was disconnected, meaning that this isolated portion of the team did not participate in any collaborative or work-planning spaces. However, the network showed that the team of project B was connected; in other words, all of its stakeholders collaborated with its team members. Project A performed a single, centralized stage of initial planning while project B engaged in gradual and systematic planning. The project manager of project B conducted a kick-off meeting for the team to become acquainted, and the use of the BIM common data environment was explained during this meeting; thus, this event became the first instance of interactions among the design team. The kick-off meeting generated additional role-knowledge links for this project (not shown in the paper); project B had twice as many role-knowledge links as project A. This is a major difference, considering that project A only had two fewer members than project B. Additionally, in project B, weekly collaborative meetings were organized with a permanent team (namely, PM, CR, CO, and BM), and certain designers were invited depending on the topics to be addressed in the meeting. During these meetings, the attendants reviewed the progress of the project, monitored the changes that had been previously made, solved the conflicts between specialties, and replanned the project (not necessarily all in one meeting).
The boxplot in Figure 5 shows that project B, which was the project that applied LDM practices and BIM uses, had more collaboration links among its design team members than project A. Project B showed more collaboration and lower variability than project A; therefore, project B had a less centralized and denser collaboration network (this analysis also applies to the planning and problem-solving network). In conclusion, project B had a greater number of all types of interactions than project A.
Moreover, in addition to the number of interactions, it is interesting to study how these interactions are distributed with respect to their frequencies. Figure 6 presents the frequency of the interactions that occurred in each design team including the relevant information flows, collaboration, and the planning and problem-solving networks. Although the differences were not large, project A exhibited a greater frequency of daily interactions than project B. This high frequency was limited to a closed group of three members (namely, the PM, CR, and, to a minor degree, A), demonstrating the level of the centralization of the information flow in this project; this phenomenon led to an intensely concentrated interaction due to the lack of bridges among the other team members to decongest the interaction. On the other hand, project B exhibited a low frequency of daily interactions since the project team forced these interactions to occur during the weekly meetings with the appropriate specialists. The Last Planner® System advises that projects should apply daily huddles as part of the planning process; however, in project teams that are not co-located, daily practice could be complex to implement. Project A had daily informal meetings involving a limited number of design team members, while project B had a smaller percentage of daily interactions, forcing interactions to occur weekly when the design team was co-located.
Another important result of this team analysis was the confidence indicator [91] (network not shown). The trust network indicator (i.e., the number of trust links/the number of role-knowledge links) of project B was 76.74% and project A was 69.05%. Because project B exhibited twice the role-knowledge links of project A, the trust level of project B was more than double that of project A. In other words, the effort that this team put toward knowing the work team, organizing and standardizing information flows through a BIM common data environment, and collaborating with the team in a formal work environment (weekly meetings) generated greater trust among the team members. Establishing trust among team members is a necessary prerequisite to learning from others in a design team [13]. Additionally, the application of lean practices can facilitate learning among team members [92]. Figure 7 shows the learning network of projects A and B. The learning network of project B was significantly more compact and denser than that of project A. This can be seen by simply comparing the sociograms and quantitatively examining the boxplots and the in- and out-degrees of both projects. The fact that the minimum in-degree value of project B was similar to the maximum value of project A is an indication of this important difference. In addition, in contrast to the previous networks, the nodes that exhibited the greatest interaction were not those representing the administrative roles but rather the technical roles, especially those of the architect, the structural engineer, the BIM manager, and the construction company’s representative. Therefore, this comparison between both projects shows that the application of LDM practices and the implementation of BIM uses promotes organizational learning in design teams, even when they are non-collocated. This is particularly important, given that there are studies that associate the lean philosophy with organizational learning, since the lean culture can have a positive impact on the transfer and categorization of information among specialists [92], which can be strengthened when the BIM methodology is applied complementarily [93].
Project B had better indicators than project A in all the traditional interaction dimensions. This effect was similar to the effects observed in the types of interactions related to commitment management. During the 12-week evaluation period, project B had 40 links regarding requests for requirements, while project A had 22. This could be attributed to the centralization of these requests for requirements and the information available to all stakeholders. The centralization of requirements produces congestion among the key members of an organization, making them indispensable (i.e., project A), while the creation of additional links among other team members produces a more collaborative, effective, and unmediated flow of information (project B). The information available to all the participants of a BIM common data environment allows problems to be visualized, detected, and solved during the early phases of a project.
The indicators of the requirements of negotiation, declaration of compliance, and declaration of satisfaction were calculated by considering the frequencies of these interactions (Figure 8). The requirements of negotiation interaction (i.e., the scope, quality, schedule, and resources of a project) occurred least frequently in both projects, confirming that this was the least-executed interaction in the commitment management cycle of the AEC industry [94]; this behavior is not recommended for the development of a network of reliable commitments among the members of the project team. The declaration of compliance with requirements exhibited the most significant difference between the projects; specifically, this difference occurred between the never and always options of the questionnaire, since the results indicated that more than half of the requirements of project A were not complied with. In project B, this percentage was only 10%. The weekly planning meetings and the BIM common data environment are both spaces in which the compliance with requirements is reported and evidence of this compliance is generated. The interaction of declarations of acceptance and satisfaction was also higher in project B; however, a quarter of the requirements did not exhibit this action, even though it is fundamental to completing the commitment cycle. Therefore, by applying LDM practices and using BIM methodology, project B achieved many interactions among the members of its design team; transparent, orderly, and standardized information flows; a collaborative, trusting, and learning environment; and commitment management. None of these interaction elements were visible in project A, where BIM-lean methodologies for design management were not applied.

5. Conclusions

This study presented quantitative evidence of increased team interaction by applying BIM-lean design management. To achieve this, the authors first evaluated the level of implementation of BIM and lean principles in two high-rise building projects using the BUA tool and the LDM practices questionnaire, respectively. Then, the different types of interaction produced in both projects were evaluated using social network analysis (SNA) (sociograms and metrics). The results of the BIM-lean management evaluation showed that one of the projects had a low implementation level of lean practices and had no application of BIM uses during its design and planning phases (project A). The second project had a high implementation level of lean practices, and a high application of BIM uses during its design and planning phases (project B). Project B mainly applied the following practices related to BIM-Lean management: early and systematic involvement of the designers and the representatives of the client and the construction company; gradual, systematic, and collaborative planning during weekly meetings; collaborative and continuously monitored problem-solving and decision making; design reviews and development in a BIM common data environment; and coordination of specialties with the participation of designers in a single federated model.
This study showed that clients, designers, and builders of infrastructure projects with a BIM-lean management approach generated higher interaction among the members of the design teams. Therefore, the different tools presented in this study can be used for the self-analysis of the projects of these professionals and for the assessment of the organizational impact of the management practices, methodologies, and technologies applied in their projects. These concepts apply to any team involved in a construction project; specifically, it applies to project teams that are temporary organizations and not necessarily collocated (although it could also be used in the context of collocated projects).
The first limitation of this research is that a comparative study of two projects was conducted; thus, for future research, it is recommended that a similar analysis is performed on a representative sample of projects so that conclusive statistical inferences can be drawn about the impact of BIM-lean management on the interaction of design teams. The second limitation of this research is that project performance and productivity indicators were not measured; therefore, it is not possible to empirically analyze the impact of a higher level of interaction on a project’s productivity throughout its life cycle. This type of analysis is particularly complex for two reasons: there is no precedent of measuring indicators during the design phase, and a long period of time is required to evaluate a project’s performance throughout its life cycle. However, for future research, it is recommended that performance indicators are evaluated during the design and construction phases so these indicators can be contrasted with the organizational performance of the project during its early phases. Additionally, the interactions’ assessment only included the number and the frequency of the interactions; however, the metrics do not measure the quality of the interactions; therefore, for future research, we recommend studying the metrics of quality of small social networks.

Author Contributions

Conceptualization, R.F.H., C.M., L.F.A. and E.P.; methodology, R.F.H.; software, R.F.H.; validation, C.M., L.F.A. and E.P.; formal analysis, R.F.H.; writing—original draft preparation, R.F.H.; writing—review and editing, C.M., L.F.A. and E.P.; visualization, R.F.H.; supervision, C.M., L.F.A. and E.P. All authors have read and agreed to the published version of the manuscript.

Funding

This research was funded by Fondecyt Regular, grant number 1210769 and ANID, grant number CONICYT-PCHA/National Doctorate/2018-21180884. The APC was paid by the Pontificia Universidad Católica de Valparaíso.

Institutional Review Board Statement

The study was conducted according to the guidelines of Declaration of Helsinki and approved by the Institutional Ethics Committee of Pontificia Universidad Católica de Chile (Project ID 180130002).

Informed Consent Statement

Informed consent was obtained from all subjects involved in the study.

Data Availability Statement

The data presented in this study are available on request from the corresponding author.

Acknowledgments

The writers would like to acknowledge the help and support provided by GEPUC, which provided access to data collection for this study.

Conflicts of Interest

The authors declare no conflict of interest.

References

  1. Baiden, B.; Price, A.; Dainty, A. The extent of team integration within construction projects. Int. J. Proj. Manag. 2006, 24, 13–23. [Google Scholar] [CrossRef]
  2. Love, P.E.; Irani, Z.; Cheng, E.; Li, H. A model for supporting inter-organizational relations in the supply chain. Eng. Constr. Arch. Manag. 2002, 9, 2–15. [Google Scholar] [CrossRef]
  3. Othman, M.Z.; Nawi, M.N.M.; Nifa, F.A.A.; Yaakob, M.; Rofie, K.; Zan, Z.M.; Pozin, M.A.A. Atrategy Towards Team Integration Practice for Improving the Design and Construction Process in the Malaysian Industrialized Building Projects. Int. Rev. Manag. Mark. 2016, 6, 226–229. [Google Scholar]
  4. Dainty, A.R.J.; Briscoe, G.H.; Millett, S.J. Subcontractor perspectives on supply chain alliances. Constr. Manag. Econ. 2001, 19, 841–848. [Google Scholar] [CrossRef]
  5. Ng, S.T.; Tang, Z. Labour-intensive construction sub-contractors: Their critical success factors. Int. J. Proj. Manag. 2010, 28, 732–740. [Google Scholar] [CrossRef]
  6. Schöttle, A.; Haghsheno, S.; Gehbauer, F. Defining Cooperation and Collaboration in the Context of Lean Construction. In Proceedings of the 22nd Annual Conference of the International Group for Lean Construction, Oslo, Norway, 25–27 June 2014; Volume 49, pp. 1269–1280. [Google Scholar]
  7. Merriam-Webster Interaction. Available online: https://www.merriam-webster.com/dictionary/interactions#other-words (accessed on 16 June 2021).
  8. Socialsci Understanding Social Interactions. Available online: https://socialsci.libretexts.org/@go/page/8023 (accessed on 10 June 2021).
  9. Dave, B.; Kubler, S.; Främling, K.; Koskela, L. Addressing Information Flow in Lean Production Management and Control in Construction. In Proceedings of the 22nd Annual Conference of the International Group for Lean Construction, Oslo, Norway, 25–27 June 2014; pp. 581–592. [Google Scholar]
  10. Al Hattab, M.; Hamzeh, F.R. Using social network theory and simulation to compare traditional versus BIM–lean practice for design error management. Autom. Constr. 2015, 52, 59–69. [Google Scholar] [CrossRef]
  11. Fakhimi, A.H.; Majrouhi Sardroud, J.; Azhar, S. How Can Lean, IPD and BIM Work Together? In Proceedings of the 33rd International Symposium on Automation and Robotics in Construction (ISARC), Auburn, AL, USA, 18–21 July 2016; pp. 1–8. [Google Scholar]
  12. Kestle, L.; London, K. Towards the Development of a Conceptual Design Management Model for Remote Sites. In Proceedings of the 10th Annual Conference of the International Group for Lean Construction 2002, IGLC 2002, Gramado, Brazil, 6–8 August 2002; pp. 1–14. [Google Scholar]
  13. Herrera, R.F.; Mourgues, C.; Alarcon, L.; Pellicer, E. Understanding Interactions between Design Team Members of Construction Projects Using Social Network Analysis. J. Constr. Eng. Manag. 2020, 146, 04020053. [Google Scholar] [CrossRef]
  14. Long, D.; Arroyo, P. Language, Moods, and Improving Project Performance. In Proceedings of the 26th Annual Conference of the International Group for Lean Construction 2018, IGLC 2018, Chennai, India, 16–22 July 2018; pp. 495–504. [Google Scholar]
  15. AIA. Integrated Project Delivery: A Guide; The American Institute of Architects: California, CA, USA, 2007; Volume 1. [Google Scholar]
  16. Knotten, V.; Lædre, O.; Hansen, G.K. Building design management—Key success factors. Arch. Eng. Des. Manag. 2017, 13, 479–493. [Google Scholar] [CrossRef]
  17. Svalestuen, F.; Frøystad, K.; Drevland, F.; Ahmad, S.; Lohne, J.; Lædre, O. Key Elements to an Effective Building Design Team. In Proceedings of the International Conference on Project Management, Vilamoura, Portugal, 7–9 October 2015; Elsevier Masson SAS: Sapporo, Japan, 2015; Volume 64, pp. 838–843. [Google Scholar]
  18. Scott, J. Social Network Analysis, 3rd ed.; SAGE Publications Inc.: Thousand Oaks, CA, USA, 2013; ISBN 978-1446209042. [Google Scholar]
  19. Marin, A.; Wellman, B. Social Network Analysis: An Introduction. In The SAGE Handbook of Social Network Analysis; Scott, J., Carrington, P.J., Eds.; SAGE research methods; SAGE: Thousand Oaks, CA, USA, 2011; pp. 11–25. [Google Scholar]
  20. Yang, H.-L.; Tang, J.-H. Team structure and team performance in IS development: A social network perspective. Inf. Manag. 2004, 41, 335–349. [Google Scholar] [CrossRef]
  21. Rosas, E. Integrating the Design Structure Matrix and the Last Planner System into Building Design. In Proceedings of the 21st Annual Conference of the International Group for Lean Construction, Fortaleza, Brazil, 29 July–2 August 2013; pp. 389–398. [Google Scholar]
  22. Alarcón, D.M.; Alarcón, I.M.; Alarcón, L.F. Social Network Analysis: A Diagnostic Tool for Information Flow in the Aec Industry. In Proceedings of the 21st Annual Conference of the International Group for Lean Construction, Fortaleza, Brazil, 29 July–2 August 2013; pp. 947–956. [Google Scholar]
  23. Ko, C.-H.; Chung, N.-F. Making Design Process Lean. In Proceedings of the 22nd Annual Conference of the International Group for Lean Construction, Oslo, Norway, 25–27 June 2014; Volume 886, pp. 463–474. [Google Scholar]
  24. Becerik-Gerber, A.B.; Ku, K.; Jazizadeh, F. BIM-Enabled Virtual and Collaborative Construction Engineering and Management. J. Prof. Issues Eng. Educ. Pr. 2012, 138, 234–245. [Google Scholar] [CrossRef]
  25. Savolainen, J.M.; Saari, A.; Männistö, A.; Kähkonen, K. Indicators of collaborative design management in construction projects. J. Eng. Des. Technol. 2018, 16, 674–691. [Google Scholar] [CrossRef]
  26. Khan, S.; Tzortzopoulos, P. Effects of the Interactions Between LPS and BIM on Workflow in Two Building Design Projects. In Proceedings of the 22nd Annual Conference of the International Group for Lean Construction, Oslo, Norway, 25–27 June 2014; pp. 933–944. [Google Scholar]
  27. Pryke, S. Social Network Analysis in Construction; Wiley-Blackwell: Hoboken, NJ, USA, 2012; ISBN 1118343913. [Google Scholar]
  28. Mujumdar, P.; Maheswari, J.U. Design iteration in construction projects—Review and directions. Alex. Eng. J. 2018, 57, 321–329. [Google Scholar] [CrossRef]
  29. Kestle, L.; Potangaroa, R.; Storey, B. Integration of Lean Design and Design Management and its Influence on the Development of a Multidisciplinary Design Management Model for Remote Site Projects. Arch. Eng. Des. Manag. 2011, 7, 139–153. [Google Scholar] [CrossRef]
  30. Al Hattab, M.; Hamzeh, F. A Process-Social Perspective for Understanding Design Information Flow. Lean Constr. J. 2017, 11, 1–11. [Google Scholar]
  31. Herrera, R.F.; Mourgues, C.; Alarcon, L.F.; Pellicer, E. Assessing Design Process Performance of Construction Projects. In Proceedings of the CIB World Building Congress 2019, Hong Kong, China, 17–21 June 2019; pp. 1–10. [Google Scholar]
  32. Salvatierra, J.L.; Gálvez, M.A.; Bastías, F.; Castillo, T.; Herrera, R.F.; Alarcon, L. Developing a benchmarking system for architecture design firms. Eng. Constr. Arch. Manag. 2019, 26, 139–152. [Google Scholar] [CrossRef] [Green Version]
  33. Abou-Ibrahim, H.; Hamze, F. Design Management: Metrics and Visual Tools. In Proceedings of the 25th Annual Conference of the International Group for Lean Construction, Heraklion, Greece, 2–12 July 2017; pp. 465–473. [Google Scholar]
  34. Whyte, J.; Tombesi, P. Challenges of Design Management in Construction. In The Handbook of Design Management; Cooper, R., Junginger, S., Lockwood, T., Eds.; Bloomsbury Academic: London, UK, 2013; pp. 202–2013. [Google Scholar]
  35. Formoso, C.T.; Tzotzopoulos, P.; Jobim, M.S.; Liedtke, R. Developing a Protocol for Managing the Design Process in the Building Industry. In Proceedings of the 6th Annual Conference of the International Group for Lean Construction 1998, Guarujá, Brazil, 13–15 August 1998. [Google Scholar]
  36. Koskela, L.; Ballard, G.; Tanhuanpää, V.-P. Towards Lean Design Management. In Proceedings of the 5th Annual Conference of the International Group for Lean Construction 1997, Gold Coast, Australia, 16–17 July 1997; pp. 1–13. [Google Scholar]
  37. Gambatese, M.J.A.; Pestana, C.; Lee, M.H.W. Alignment between Lean Principles and Practices and Worker Safety Behavior. J. Constr. Eng. Manag. 2017, 143, 04016083. [Google Scholar] [CrossRef]
  38. Fosse, R.; Ballard, G. Lean Design Management in Practice. In Proceedings of the 24th Annual Conference of the International Group for Lean Construction 2016, Boston, MA, USA, 20–22 July 2016; pp. 33–42. [Google Scholar]
  39. O’Connor, R.; Swain, B. Implementing Lean in Construction: Lean Tools and Techniques—An Introduction; CIRIA: London, UK, 2013. [Google Scholar]
  40. Bloom, N.; Van Reenen, J. Measuring and Explaining Management Practices Across Firms and Countries. Q. J. Econ. 2006, 122, 1351–1408. [Google Scholar] [CrossRef]
  41. Herrera, R.F.; Mourgues, C.; Alarcón, L.F.; Pellicer, E. An Assessment of Lean Design Management Practices in Construction Projects. Sustainability 2019, 12, 19. [Google Scholar] [CrossRef] [Green Version]
  42. Reifi, M.H.E.; Emmitt, S. Perceptions of lean design management. Arch. Eng. Des. Manag. 2013, 9, 195–208. [Google Scholar] [CrossRef]
  43. Knotten, V.; Svalestuen, F.; Hansen, G. Improving Design Management. In Proceedings of the 24th Annual Conference of the International Group for Lean Construction 2016, Boston, MA, USA, 20–22 July 2016; pp. 173–182. [Google Scholar]
  44. Alves, T.D.C.L.; Lichtig, W.; Rybkowski, Z.K. Implementing target value design: Tools and techniques to manage the process. Health Environ. Res. Des. J. 2017, 10, 18–29. [Google Scholar] [CrossRef]
  45. Ko, C.; Chung, N. Lean Design Process. J. Constr. Eng. Manag. 2014, 140, 04014011. [Google Scholar] [CrossRef]
  46. Ballard, G.; Tommelein, I.D.; Koskela, L.; Howell, G. Lean Construction Tools and Techniques. In Design and Construction: Bulding in Value; Best, R., de Valence, G., Eds.; Butterworth-Heinemann; Elsevier Ltd.: Oxford, UK, 2002; pp. 227–255. [Google Scholar]
  47. Franco, V.; Picchi, A. Lean Design in Building Projects: Guiding Principles and Exploratoyry. In Proceedings of the 24th Annual Conference of the International Group for Lean Construction 2016, Boston, MA, USA, 20–22 July 2016; pp. 113–122. [Google Scholar]
  48. Ballard, G.; Howell, G. Lean project management. Build. Res. Inf. 2003, 31, 119–133. [Google Scholar] [CrossRef]
  49. UUsitalo, P.; Olivieri, H.; Seppänen, O.; Pikas, E.; Peltokorpi, A. Review of Lean Design Management: Processes, Methods and Technologies. In Proceedings of the 25th Annual Conference of the International Group for Lean Construction 2017, Heraklion, Gerrce, 9–12 July 2017; pp. 571–578. [Google Scholar]
  50. Hamzeh, F.R.; Ballard, G.; Tommelein, I.D. Is the Last Planner System applicable to design? A case study. In Proceedings of the 17th Annual Conference of the International Group for Lean Construction 2009, Taipei, Taiwan, 15–17 July 2009; pp. 407–416. [Google Scholar]
  51. Tilley, P.A. Lean design management—A New Paradigm for Managing the Design and Documentation Process to Improve Quality? In Proceedings of the 13th Annual Conference of the International Group for Lean Construction 2005, Sydney, Australia, 19–21 July 2005; pp. 283–295. [Google Scholar]
  52. Arroyo, P.; Fuenzalida, C.; Albert, A.; Hallowell, M.R. Collaborating in decision making of sustainable building design: An experimental study comparing CBA and WRC methods. Energy Build. 2016, 128, 132–142. [Google Scholar] [CrossRef]
  53. Salgin, B.; Arroyo, P.; Ballard, G. Exploring the Relationship between Lean Design Methods and C&D Waste Reduction: Three Case Studies of Hospital Projects in California. Rev. Ing. Constr. 2016, 31, 191–200. [Google Scholar] [CrossRef] [Green Version]
  54. Munthe-kaas, T.S.; Hjelmbrekke, H.; Lohne, J. Lean Design versus Traditional Design Approach. In Proceedings of the 23rd Annual Conference of the International Group for Lean Construction 2015, IGLC 2015, Perth, Australia, 29–31 July 2015; pp. 578–588. [Google Scholar]
  55. Taylor, D.W. Decision Making and Problem Solving. In Handbook of Organizations; March, J.G., Ed.; Routledge: New York, NY, USA, 2013; pp. 48–86. [Google Scholar]
  56. Kapogiannis, G.; Sherratt, F. Impact of integrated collaborative technologies to form a collaborative culture in construction projects. Built Environ. Proj. Asset Manag. 2018, 8, 24–38. [Google Scholar] [CrossRef]
  57. Kreider, R.G.; Messner, J.I. The Uses of BIM: Classifying and Selecting BIM Uses; The Pennsylvania State University: Centre County, PA, USA, 2013. [Google Scholar]
  58. Rojas, M.J.; Herrera, R.F.; Mourgues, C.; Ponz-Tienda, J.L.; Alarcon, L.; Pellicer, E. BIM Use Assessment (BUA) Tool for Characterizing the Application Levels of BIM Uses for the Planning and Design of Construction Projects. Adv. Civ. Eng. 2019, 2019, 9094254. [Google Scholar] [CrossRef]
  59. Herrera, R.F.; Mourgues, C.; Alarcón, L.F.; Pellicer, E. Analyzing the Association between Lean Design Management Practices and BIM Uses in the Design of Construction Projects. J. Constr. Eng. Manag. 2021, 147, 04021010. [Google Scholar] [CrossRef]
  60. Arellano, K. Assesment of the Level of Use of BIM in the Planning and Design Phases in the AEC Industry in Ecuador; National University of Chimborazo: Riobamba, Ecuador, 2020. [Google Scholar]
  61. Gu, N.; London, K. Understanding and facilitating BIM adoption in the AEC industry. Autom. Constr. 2010, 19, 988–999. [Google Scholar] [CrossRef]
  62. Kleinsmann, M.; Deken, F.; Dong, A.; Lauche, K. Development of design collaboration skills. J. Eng. Des. 2012, 23, 485–506. [Google Scholar] [CrossRef]
  63. Castillo, T.; Alarcón, L.F.; Salvatierra, J.L. Effects of Last Planner System Practices on Social Networks and the Performance of Construction Projects. J. Constr. Eng. Manag. 2018, 144, 04017120. [Google Scholar] [CrossRef]
  64. Priven, V.; Sacks, R. Social Network Development in Last Planner System Implementations. In Proceedings of the 21st Annual Conference of the International Group for Lean Construction, Fortaleza, Brazil, 29 July–2 August 2013; pp. 474–485. [Google Scholar]
  65. Herrera, R.F.; Mourgues, C.; Alarcón, L.F. Assessment of Lean Practices, Performance and Social Networks in Chilean Airport Projects. In Proceedings of the 26th Annual Conference of the International Group for Lean Construction 2018, IGLC 2018, Chennai, India, 16–22 July 2018; pp. 603–613. [Google Scholar]
  66. Viana, D.D.; Formoso, C.T.; Isatto, E.L. Modelling the Network of Commitments in the Last Planner System. Lean Constr. J. 2011, 7, 55–67. [Google Scholar]
  67. Valentine, M.A.; Nembhard, I.M.; Edmondson, A.C. Measuring Teamwork in Health Care Settings: A Review of Survey Instruments. Med. Care 2015, 53, e16–e30. [Google Scholar] [CrossRef] [PubMed]
  68. Cisterna, D.A. Application of Social Network Analysis in Lean Infraestructure Projects; Universität Stuttgart: Stuttgart, Germany, 2017. [Google Scholar]
  69. Searle, J.R. Speech Acts: An Essay in the Philosophy of Language; Cambridge University Press: Cambridge, UK, 1969; ISBN 978-0521096263. [Google Scholar]
  70. Medina-Mora, R.; Winograd, T.; Flores, R.; Flores, F. The action workflow approach to workflow management technology. In Proceedings of the CSCW 92, Toronto, ON, Canada, 1–4 November 1992; pp. 281–288. [Google Scholar] [CrossRef]
  71. Eastman, C.M.; Teicholz, P.; Sacks, R.; Liston, K. BIM Handbook: A Guide to Building Information Modeling for Owners, Managers, Designers, Engineers and Contractors, 2nd ed.; John Wiley & Sons Ltd.: New Jersey, NJ, USA, 2011. [Google Scholar]
  72. Sacks, R.; Koskela, L.; Dave, B.A.; Owen, R. Interaction of Lean and Building Information Modeling in Construction. J. Constr. Eng. Manag. 2010, 136, 968–980. [Google Scholar] [CrossRef] [Green Version]
  73. Schimanski, C.P.; Monizza, G.P.; Marcher, C.; Matt, D.T. Conceptual Foundations for a New Lean BIM-Based Production System in Construction. In Proceedings of the 27th Annual Conference of the International Group for Lean Construction, Dublin, Ireland, 3–5 July 2019; pp. 877–888. [Google Scholar]
  74. Nascimento, D.L.D.M.; Caiado, R.; Tortorella, G.; Ivson, P.; Meiriño, M. Digital Obeya Room: Exploring the synergies between BIM and lean for visual construction management. Innov. Infrastruct. Solut. 2018, 3, 19. [Google Scholar] [CrossRef]
  75. Dave, B.A. Developing a Construction Management System Based on Lean Construction and Building Information Modelling; University of Salford: Salford, UK, 2013. [Google Scholar]
  76. Sacks, R.; Barak, R.; Belaciano, B.; Gurevich, U. Field Tests of the KanbimTM Lean Production Management System. In Proceedings of the 19th Annual Conference of the International Group for Lean Construction, Lima, Perú, 13–15 July 2011; pp. 1–12. [Google Scholar]
  77. Mahalingam, A.; Yadav, A.K.; Varaprasad, J. Investigating the Role of Lean Practices in Enabling BIM Adoption: Evidence from Two Indian Cases. J. Constr. Eng. Manag. 2015, 141, 05015006. [Google Scholar] [CrossRef]
  78. Dave, B.; Koskela, L.; Kiviniemi, A.; Owen, R.; Tzortzopoulos, P. Implementing Lean in Construction; CIRIA: London, UK, 2013; ISBN 9780860177272. [Google Scholar]
  79. Yin, R.K. Case Study Research: Design and Methods; SAGE Publications: New York, NY, USA, 2009. [Google Scholar]
  80. Ridder, H.-G. The theory contribution of case study research designs. Bus. Res. 2017, 10, 281–305. [Google Scholar] [CrossRef] [Green Version]
  81. European Comission. Commission recommendation concerning the definition of micro, small and medium-sized enterprises. Off. J. Eur. Union 2003, 361, 1–6. [Google Scholar] [CrossRef]
  82. Woodside, A.G. Case Study Research. Theory, Methods and Practice; Emerald: Bingley, UK, 2010. [Google Scholar]
  83. Bloom, N.; Van Reenen, J. New Approaches to Surveying Organizations. Am. Econ. Rev. 2010, 100, 105–109. [Google Scholar] [CrossRef] [Green Version]
  84. Zhang, L.; Ashuri, B. BIM log mining: Discovering social networks. Autom. Constr. 2018, 91, 31–43. [Google Scholar] [CrossRef]
  85. Craft, R.C.; Leake, C. The Pareto principle in organizational decision making. Manag. Decis. 2002, 40, 729–733. [Google Scholar] [CrossRef]
  86. Alarcón, L.F.; Ashley, D.B.; De Hanily, A.S.; Molenaar, K.R.; Ungo, R. Risk Planning and Management for the Panama Canal Expansion Program. J. Constr. Eng. Manag. 2011, 137, 762–771. [Google Scholar] [CrossRef]
  87. Bastian, M.; Heymann, S.; Jacomy, M. Gephi: An Open Source Software for Exploring and Manipulating Networks. In Proceedings of the Third International AAAI Conference on Weblogs and Social Media, San Jose, CA, USA, 17–20 May 2009. [Google Scholar]
  88. Hickethier, G.; Tommelein, I.D.; Lostuvali, B. Social Network Analysis of Information Flow in an IPD-Project Design Organization. In Proceedings of the 21st Annual Conference of the International Group for Lean Construction, Fortaleza, Brazil, 29 July–2 August 2013; pp. 319–328. [Google Scholar]
  89. Hoppe, B.; Reinelt, C. Social network analysis and the evaluation of leadership networks. Leadersh. Q. 2010, 21, 600–619. [Google Scholar] [CrossRef]
  90. Shafiq, M.T.; Matthews, J.; Lockley, S. A study of BIM collaboration requirements and available features in existing model collaboration systems. J. Inf. Technol. Constr. 2013, 18, 148–161. [Google Scholar]
  91. Anvuur, A.M.; Kumaraswamy, M.M. Effects of Teamwork Climate on Cooperation in Crossfunctional Temporary Multi-Organization Workgroups. J. Constr. Eng. Manag. 2016, 142, 04015054. [Google Scholar] [CrossRef] [Green Version]
  92. Hu, Q.; Found, P.; Williams, S.; Mason, R. Lean Thinking and Organisational Learning: How Can They Facilitate Each Other? In Understanding the Lean Enterprise. Measuring Operations Performance; Chiriani, A., Found, P., Rich, N., Eds.; Springer: Cham, Switzerland, 2016; pp. 61–77. ISBN 978-3319199955. [Google Scholar]
  93. Oraee, M.; Hosseini, M.R.; Papadonikolaki, E.; Palliyaguru, R.; Arashpour, M. Collaboration in BIM-based construction networks: A bibliometric-qualitative literature review. Int. J. Proj. Manag. 2017, 35, 1288–1301. [Google Scholar] [CrossRef]
  94. Salazar, L.A.; Retamal, F.; Ballard, G.; Arroyo, P.; Alarcón, L.F. Results of Indicators from the Linguistic Action Perspective in the Last Planner® System. In Proceedings of the 27th Annual Conference of the International Group for Lean Construction, Dublin, Ireland, 1–7 July 2019; pp. 1241–1250. [Google Scholar]
Figure 1. BIM uses assessment: Project A and project B.
Buildings 11 00447 g001
Figure 2. LDM practices assessment: Project A and project B.
Buildings 11 00447 g002
Figure 3. Global interaction network and degree: Project A and project B.
Buildings 11 00447 g003
Figure 4. Relevant information flow network and degrees: Project A and project B.
Buildings 11 00447 g004
Figure 5. Collaboration network and degree: Project A and project B.
Buildings 11 00447 g005
Figure 6. Density according to interaction frequency: Project A and project B.
Buildings 11 00447 g006
Figure 7. Learning network and degrees: Project A and project B.
Buildings 11 00447 g007
Figure 8. Commitment management metrics according to their interaction frequencies: Project A and project B.
Buildings 11 00447 g008
Table 1. Lean design management (LDM) practices. Adapted from [41].
CategoryIdDefinition
Stakeholder managementSM1Specialist designers are involved during early stages of the project.
SM2Builders are involved during early stages of the project.
SM3The identification of requirements of the stakeholders is exhaustive, where requirements, constraints, technical specifications and special requirements are defined.
SM4The participation of clients in the design phase involves the systematic participation and support during meetings concerning decision making and resolution of problems.
SM5The design of the product and the construction process are carried out simultaneously.
Planning and controlPC1Project planning considers delivery dates, phases, milestones, task subdivision programs and control instances. All of the above, immersed in a scheme in which gaps, buffers and points are clarified, can be used to perform pull/push actions within the program.
PC2With regard to project planning, this is considered information of internal and/or external projects of the organization, generated through a benchmarking exercise.
PC3Project planning is conducted collaboratively among various stakeholders.
PC4Project planning is carried out at different levels (global, phase, intermediate and weekly).
PC5The constraints in the design process are identified and registered collaboratively and released by a responsible person. Then, the constraints are followed.
PC6The coordination of project information between the different stakeholders is performed through a single platform, which allows systematic updates and continuous communication between stakeholders.
Decision makingDM1There exists a protocol to solve problems collaboratively.
DM2The last planner identifies the problem and performs a causal analysis (e.g., the 5 why’s method).
DM3The solution to the problem is implemented, monitored and documented, to verify that the problem was solved.
DM4In the decision-making process, options are evaluated, designed, and tested, and the results validated and applied.
DM5The moment to make decisions is the last responsible moment, and all the information that could be gathered at that moment is used.
DM6To make decisions, information of internal and/or external projects of the organization is used, generated through a benchmarking exercise.
DM7The decision-making mechanism is a meeting with all stakeholders involved, where a specific technique is used, for example, Choosing By Advantages (CBA) or others.
DM8After making the decision, specific actions are taken to verify whether satisfactory results were obtained. In addition, the lessons learned are identified and documented.
Table 2. BIM uses for the planning and design of construction project. Adapted from [58].
IdUseDefinition
U1Cost EstimationA BIM model is used to generate accurate quantity take-offs and cost estimates.
U24D PlanningA 4D BIM model is utilized to effectively plan, especially spatial planning, including spatial clashes and paths.
U3Site AnalysisBIM/GIS is used to select and evaluate a site location and to select a building position on the site.
U4Space ProgrammingA BIM model is used to design and analyze the project spaces and rooms and to assign to each space a use and its measurements.
U5Design ReviewA process in which stakeholders interact with a BIM model and provide their feedback to validate multiple design aspects
U6Code ValidationA process in which code validation software is utilized to check the model parameters against project-specific design or construction codes or norms.
U7Sustainability EvaluationA process in which the sustainability of a facility is evaluated and tracked using a sustainability metric system.
U8Engineering AnalysisA BIM model and specialized software are used to conduct an engineering analysis to identify the most efficient method or design.
U9Design AuthoringA process in which 3D software is used to develop a building information model. A project is designed in a BIM model, where the typical iterations of a project are made, and everything is built directly in the BIM software.
U103D CoordinationA process in which 3D coordination software is used to identify 3D geometric conflicts by comparing 3D models of building systems.
Table 3. Description of type of interaction.
TypeMetrics
Knowledge of roles and responsibilitiesWhen person A knows the role and responsibility of person B, a one-way link is created between the two people. This network is fundamental, since if the link does not exist, it is difficult to make another type of interaction [13]
Global interactionRefers to any type of interaction between two people, these include telephone conversations, mail exchanges, conversations or business meetings [22]
Relevant work informationRelevant work information is that flow where person A sends necessary information to person B that adds value to the project but is not openly available [63]
CollaborationCollaboration refers to the act of joint work between two or more people. It is considered that working together implies working with another person on the same task and at the same time, either in person or virtually [13]
Planning and problem solvingCollaborative planning and problem solving refer to the joint act of two or more people to define and redefine tasks, schedules, resources, costs, risks, etc. [63]
TrustWhen a person A trusts the work of a person B, a one-way bond of trust between A-B is created [64]
LearningWhen a person A learns something new from a person B, a learning link between A-B is created. What is learned can be something technical related to knowledge, some skill or competence, or even an attitude at work [65]
Request for requirementThe speaker (customer) is asking a potential performer for action around a requirement [14]
Requirement negotiationThe customer and the performer clarify the requirement and define conditions of satisfaction, based on time, cost and performance [66]
Declaration of complianceThe performer reports facts and is prepared to offer evidence about the compliance of the requirement [14].
Declaration of satisfactionThe customer reports a level of satisfaction and feedback about the compliance of the requirement [14]
Table 4. Characteristics of projects A and B according to the selection criteria.
Selection CriteriaProject AProject B
1. Type of project: high-rise building
2. Delivery method: design-bid-build
3. Client and constructor are the same corporative group
4. Size of client: large [81]
5. All specialists and designers are from different organizations
6. All design team members are located in Santiago, Chile
7. Project location: Santiago, Chile
8. Project size: numbers of floors (m2)22 (14,200)24 (15,000)
9. Explicit Lean tool application (as reported by the client company)xx
10. Explicit BIM application (as reported by the client company)x
Table 5. SNA metrics.
TypeMetricDefinition
NodeDegreeHow many other nodes a node is connected to [22].
BetweennessHow many pairs of individuals are connected through a node with the least number of steps: brokerage role [88].
ClosenessHow close a node is to other nodes; depends on the shortest average length [10].
NetworkDensityHow many actual links exist between nodes divided by the number of total possible links in the network [22].
Mean degreeHow many other nodes a node is connected to, on average [22].
ClusteringHow clustered groups of people are compared with the rest of the network; the existence of closed triads and small communities [88].
Average path lengthHow many steps on average nodes require to reach each other [10].
DiameterHow many steps nodes require to reach each other (maximum) [10].
ModularityHow dense are the connections between nodes within groups compared with nodes with another group [88].
Table 6. Metrics for each network. Adapted from [13].
TypeMetrics
Knowledge of roles and responsibilities (directed)In-degree of each node (total number of other nodes that have links directed towards it); mean in-degree of the network
Global interaction (undirected)Degree of each node (total number of other nodes that are incident to the node); mean and range degree of the network; # of connected components
Relevant work information (directed)Percentage of bidirectional links; in-degree and out-degree of each node (total number of other nodes to which it directs links); mean and range degree of the network; # of weakly connected and of strongly connected components
Learning (directed)
Planning and problem solving (undirected)Percentage of bidirectional links; degree of each node; mean and range degree of the network; # of connected components
Collaboration (undirected)
Trust (directed)# of links in the trust network/# of links in the knowledge of roles network
Request for requirement (directed)Requirement links
Requirement negotiation (undirected)Negotiated links/requirement links
Declaration of compliance (directed)Compliance declaration links/requirement links
Declaration of satisfaction (directed)Satisfaction declaration links/requirement links
Table 7. Overall research design.
ActivityToolSource of Information
Assessment of 10 BIM uses (Table 2) and Benchmark with 25 projects.BUA toolProject A: 1 interview with project manager and client representative
Project B: 2 interviews with project manager, client representative and BIM manager
Data from [58].
Assessment of 19 LDM practices (Table 1) and benchmark with 64 projectsLDM practices questionnaireProject A: 1 interview with project manager and client representative
Project B: 1 interview with project manager and client representative
Data from [41].
SNA: information capture of 11 types of interactions (Table 3)Survey of types of interactions [13]Project A: 10 responses (all design team members)
Project B: 12 responses (all design team members)
SNA: data processing. Calculate of PVC, software processing, create sociograms and calculate metrics (Table 6)Gephi
Recommendations from [13]
Project A: 10 responses (all design team members)
Project B: 12 responses (all design team members)
Interactions’ assessment and comparative analysis of two case studiesGephi
Comparative analysis
BUA tool responses
LDM practices questionnaire responses
SNA metrics and sociograms
Publisher’s Note: MDPI stays neutral with regard to jurisdictional claims in published maps and institutional affiliations.

