Article

3D Indoor Environment Abstraction for Crowd Simulations in Complex Buildings

1
School of Built Environment, The University of New South Wales, Sydney, NSW 2052, Australia
2
School of Public Health and Community Medicine, The University of New South Wales, Sydney, NSW 2052, Australia
*
Author to whom correspondence should be addressed.
Buildings 2021, 11(10), 445; https://doi.org/10.3390/buildings11100445
Submission received: 29 July 2021 / Revised: 19 September 2021 / Accepted: 24 September 2021 / Published: 29 September 2021
(This article belongs to the Section Architectural Design, Urban Science, and Real Estate)

Abstract

:
This paper presents an approach for the automatic abstraction of built environments needed for pedestrian dynamics from any building configuration. The approach assesses the usability of navigation mesh to perform realistically pedestrian simulation considering the physical structure and pedestrian abilities for it. Several steps are examined including the creation of a navigation mesh, space subdivision, border extraction, height map identification, stairs classification and parametrisation, as well as pedestrian simulation. A social-force model is utilised to simulate the interactions between pedestrians and an environment. To perform quickly different 2D/3D geometrical queries various spatial indexing techniques are used, allowing fast identification of navigable spaces and proximity checks related to avoidance of people and obstacles in built environments. For example, for a moderate size building having eight floors and a net area of 13,000 m2, it takes only 104 s to extract the required building information to run a simulation. This approach can be used for any building configuration extracting automatically needed features to run pedestrian simulations. In this way, architects, urban planners, fire safety engineers, transport modellers and many other users without the need to manually interact with a building model can perform immediately crowd simulations.

1. Introduction

Crowd simulation has become a research field for many scientists in areas of computer graphics, emergency management, transport and urban planning, etc. Researchers studied exit preferences [1], choice modelling [2], kinematic architecture and collective evacuee behaviour [3] to improve buildings in their safety and use. A realistic simulation of crowds requires the integration of many aspects such as people behaviour, population modelling, structure refinement and model validation [4]. In this paper, we concentrate on the structure representation, where the primary focus is on a quick automatic extraction and subdivision of navigable spaces for simulation of people dynamics in 3D indoor environments. The structure refinement shows the level of detail that is captured for agents to interact with it. There are three commonly used models including coarse, fine (i.e., grid-based) and continuous ones [5]. Recently, voxel-based [6,7] and hybrid models [8] are also suggested. Although continuous models are computationally the most demanding, the recent advancement in the processing power of computers allows their use without much difficulty. The main challenge that persists is the inability to use any building model coming from different sources, but rather simple models with well-defined geometrical and property-rich structures [9,10]. Regarding crowd simulation models, seven methodological approaches including cellular automata, social force, lattice gas, fluid dynamics, agent-based, game theories and approaches based on experiments with animals are identified [11]. Although some of these models such as cellular automata and lattice gas require discrete space, others are continuous such as social force and fluid dynamics suiting more the proposed method. Thus, we concentrate on the automatic abstraction of any 3D environment to support continuous models and pedestrian dynamics allowing people to move and interact freely with any environment.
Recent advances in technology enable a quick acquisition of 3D data and the generation of indoor navigable spaces [12]. These come in addition to detailed BIM models, which are becoming increasingly available, enabling efficient indoor path planning considering the environment and obstacles [13,14]. Thus, a more accurate finding of free navigable spaces is possible for different agents, which allows the investigation of crowd dynamics in more realistic indoor environments. However, the main issue with current approaches is the complexity of indoor spaces having too many objects which can be considered as obstacles. Thus, one of the main problems with current pedestrian and evacuation simulators is how to carry out the transition from highly complex 3D models into computer-readable models to perform crowd simulations. The use of navigation mesh is suggested as a possible solution [15], where an agent’s size is considered to determine the accessible space [16]. To showcase how to utilise any 3D environment for agents’ navigation and simulation the Unity game engine and different simulators are relying on the creation of a navigable mesh [17,18]. However, navigation meshes are used primary for games and their suitability is not accessed for pedestrian simulations. For example, aspects including border edge extraction, stairs parametrisation and space representation can be improved to support the requirements of modern pedestrian simulations.
In this paper, we propose an approach of space subdivision and abstraction of 3D indoor environments based on a navigation mesh. The paper is organised as follows. Section 2 covers the related research on this topic. In Section 3, several aspects are explored starting from the usability assessment of the navigation mesh, the space subdivision and border extraction, the height map identification process as well as stairs classification and parametrisation, and the crowd simulation process. Section 4 showcases some results relevant to the presented approach based on different 3D building environments. Section 5 highlights the main conclusions and future work suggestions.

2. Related Research

In this section, we briefly review the current relevant approaches supporting crowd simulation in 2D and 3D indoor environments. As suggested before the current pedestrian and evacuation simulators struggle to extract the geometrical information needed to perform crowd simulations, forcing users to redraw their 3D models as well as supply additional needed information (e.g., stairs riser and tread dimensions), making the whole process not so trivial [4]. 3D indoor information can come from different sources, and in different file formats such as CAD, IFC, CityGML, Sketch-Up, etc. This usually results in a spatial data harmonisation problem, where the data integration in one 3D environment becomes an impossible issue to address [19].
All this is in line with various conducted research, in which case researchers considered modelling built environment within their software environment, so as to calculate the repulsive forces from walls and other obstacles [20,21,22]. On the other hand, a navigation mesh identifies walkable regions to support crowd navigation. The creation of navigation mesh is usually associated with Constrained Delaunay Triangulation (CDT) suiting the needs of path planning and obstacle avoidance [23]. To address the issue of agents passing through narrow passages Local Clearance Triangulation (LCT) was proposed [24]. To consider more precisely abilities and size of an agent in the creation of navigation mesh the use of a voxel-based approach was proposed in the Unity game engine [17]. In this way, a walkable area for a specific pedestrian is identified, but it is not fully utilised to support modern pedestrian simulations considering precisely walking on stairs and multiple obstacle avoidance.
In terms of people simulations considering more realistic built environments, an approach using collision-free convex cells based on the Voronoi diagram is proposed creating a navigation graph for crowd simulations [25]. The main issue indicated is related to the simulation scalability to perform different navigation queries. A grid-based approach is presented simulating crowds in complex environments [26], where it is pointing out that the number of grid cells impacts computations, and it cannot consider large scenes due to the number of cells that should be kept in the memory. Using a social force model for 3D evacuation of buildings was investigated, testing relatively simple building layouts coming from CityGML LOD4 models [10]. A method performing crowd simulations in large public spaces is suggested modelling interactions between thousands of agents [9]. However, the inability to consider small objects and multi-floor environments are suggested limitations of the study. The combination of navigation mesh generated by Unity software and a social force model is tested for 2D navigation [27], but its mutual integration with crowd dynamics for 3D purposes is not fully explored. Therefore, we try to assess the usability of a navigation mesh and identify which additional space features are needed for the automatic abstraction of 3D built environments and pedestrian simulations. At the same time, we reduce the number of abstracted features through space subdivision and border edge simplification to create a more scalable solution, allowing users to simulate pedestrian dynamics in large building environments without keeping a lot of information in the memory. For example, triangles representing the navigation mesh which are usually used for vertical placement are not needed in our case as result of the subdivision between horizontal and vertical spaces.

3. Conceptual Model

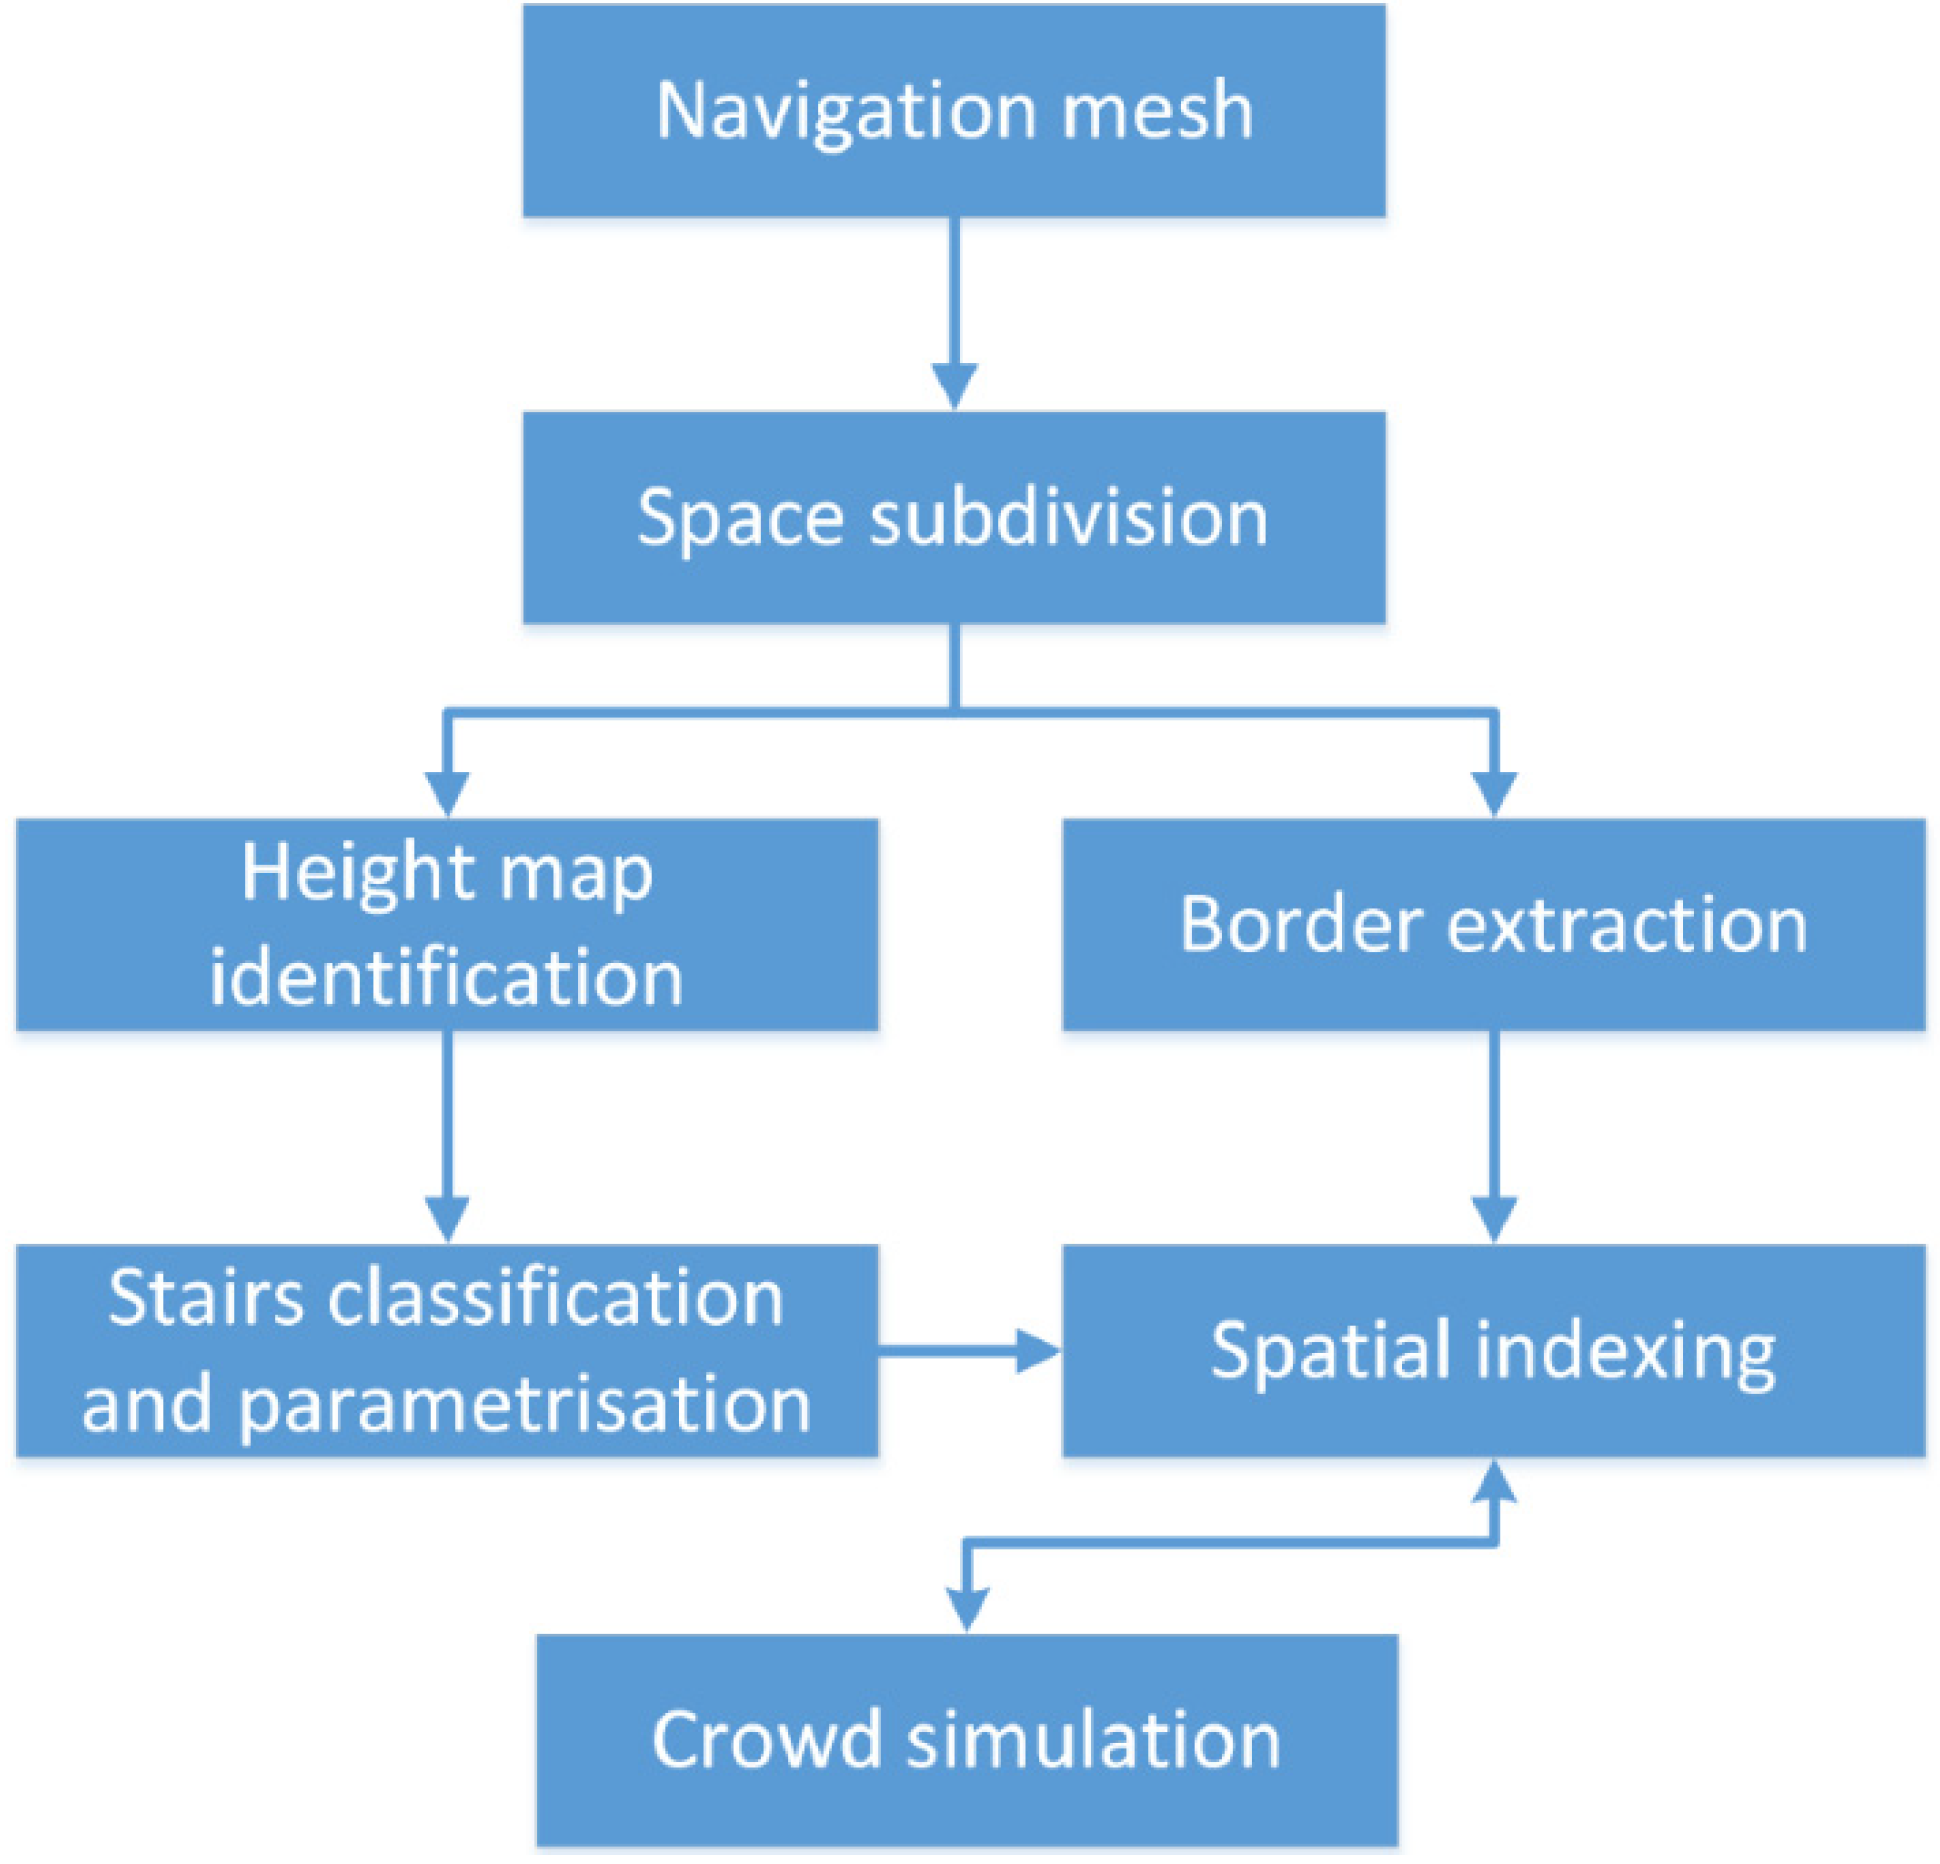
Performing a crowd simulation in a 3D space is not a trivial task. Many components should be known to perform simultaneous navigation in indoor and outdoor space, calculate impacts from other pedestrians and obstacles. The conceptual model is presented in Figure 1 showing the main needed components. As a base of the model, navigation mesh is considered, which is used for space abstraction and subdivision. Using a navigation mesh, subdivision between horizontal and vertical spaces is performed, followed by heightmap identification and border extraction for accurate vertical placement and calculation of repulsive forces from obstacles, respectively. Using the information of vertical spaces, stairs classification and parametrisation are performed enabling us to calculate their effects on pedestrian’s speed. The next step involves the use of spatial indexes allowing a quick execution of different spatial queries. In the end, a crowd simulation approach is presented to highlight the way of using the extracted building information. In the following subsections, we will cover each of these components to understand the role they play in the whole process.

3.1. Navigation Mesh

In this subsection, we describe the way of generating a navigation mesh and its properties in the Unity game engine. The software considers by default several parameters in the construction of a navigation mesh such as agent radius, height, jumping step and maximum climbing slope. At the same time, parameters such as voxel and tile size can be adjusted (
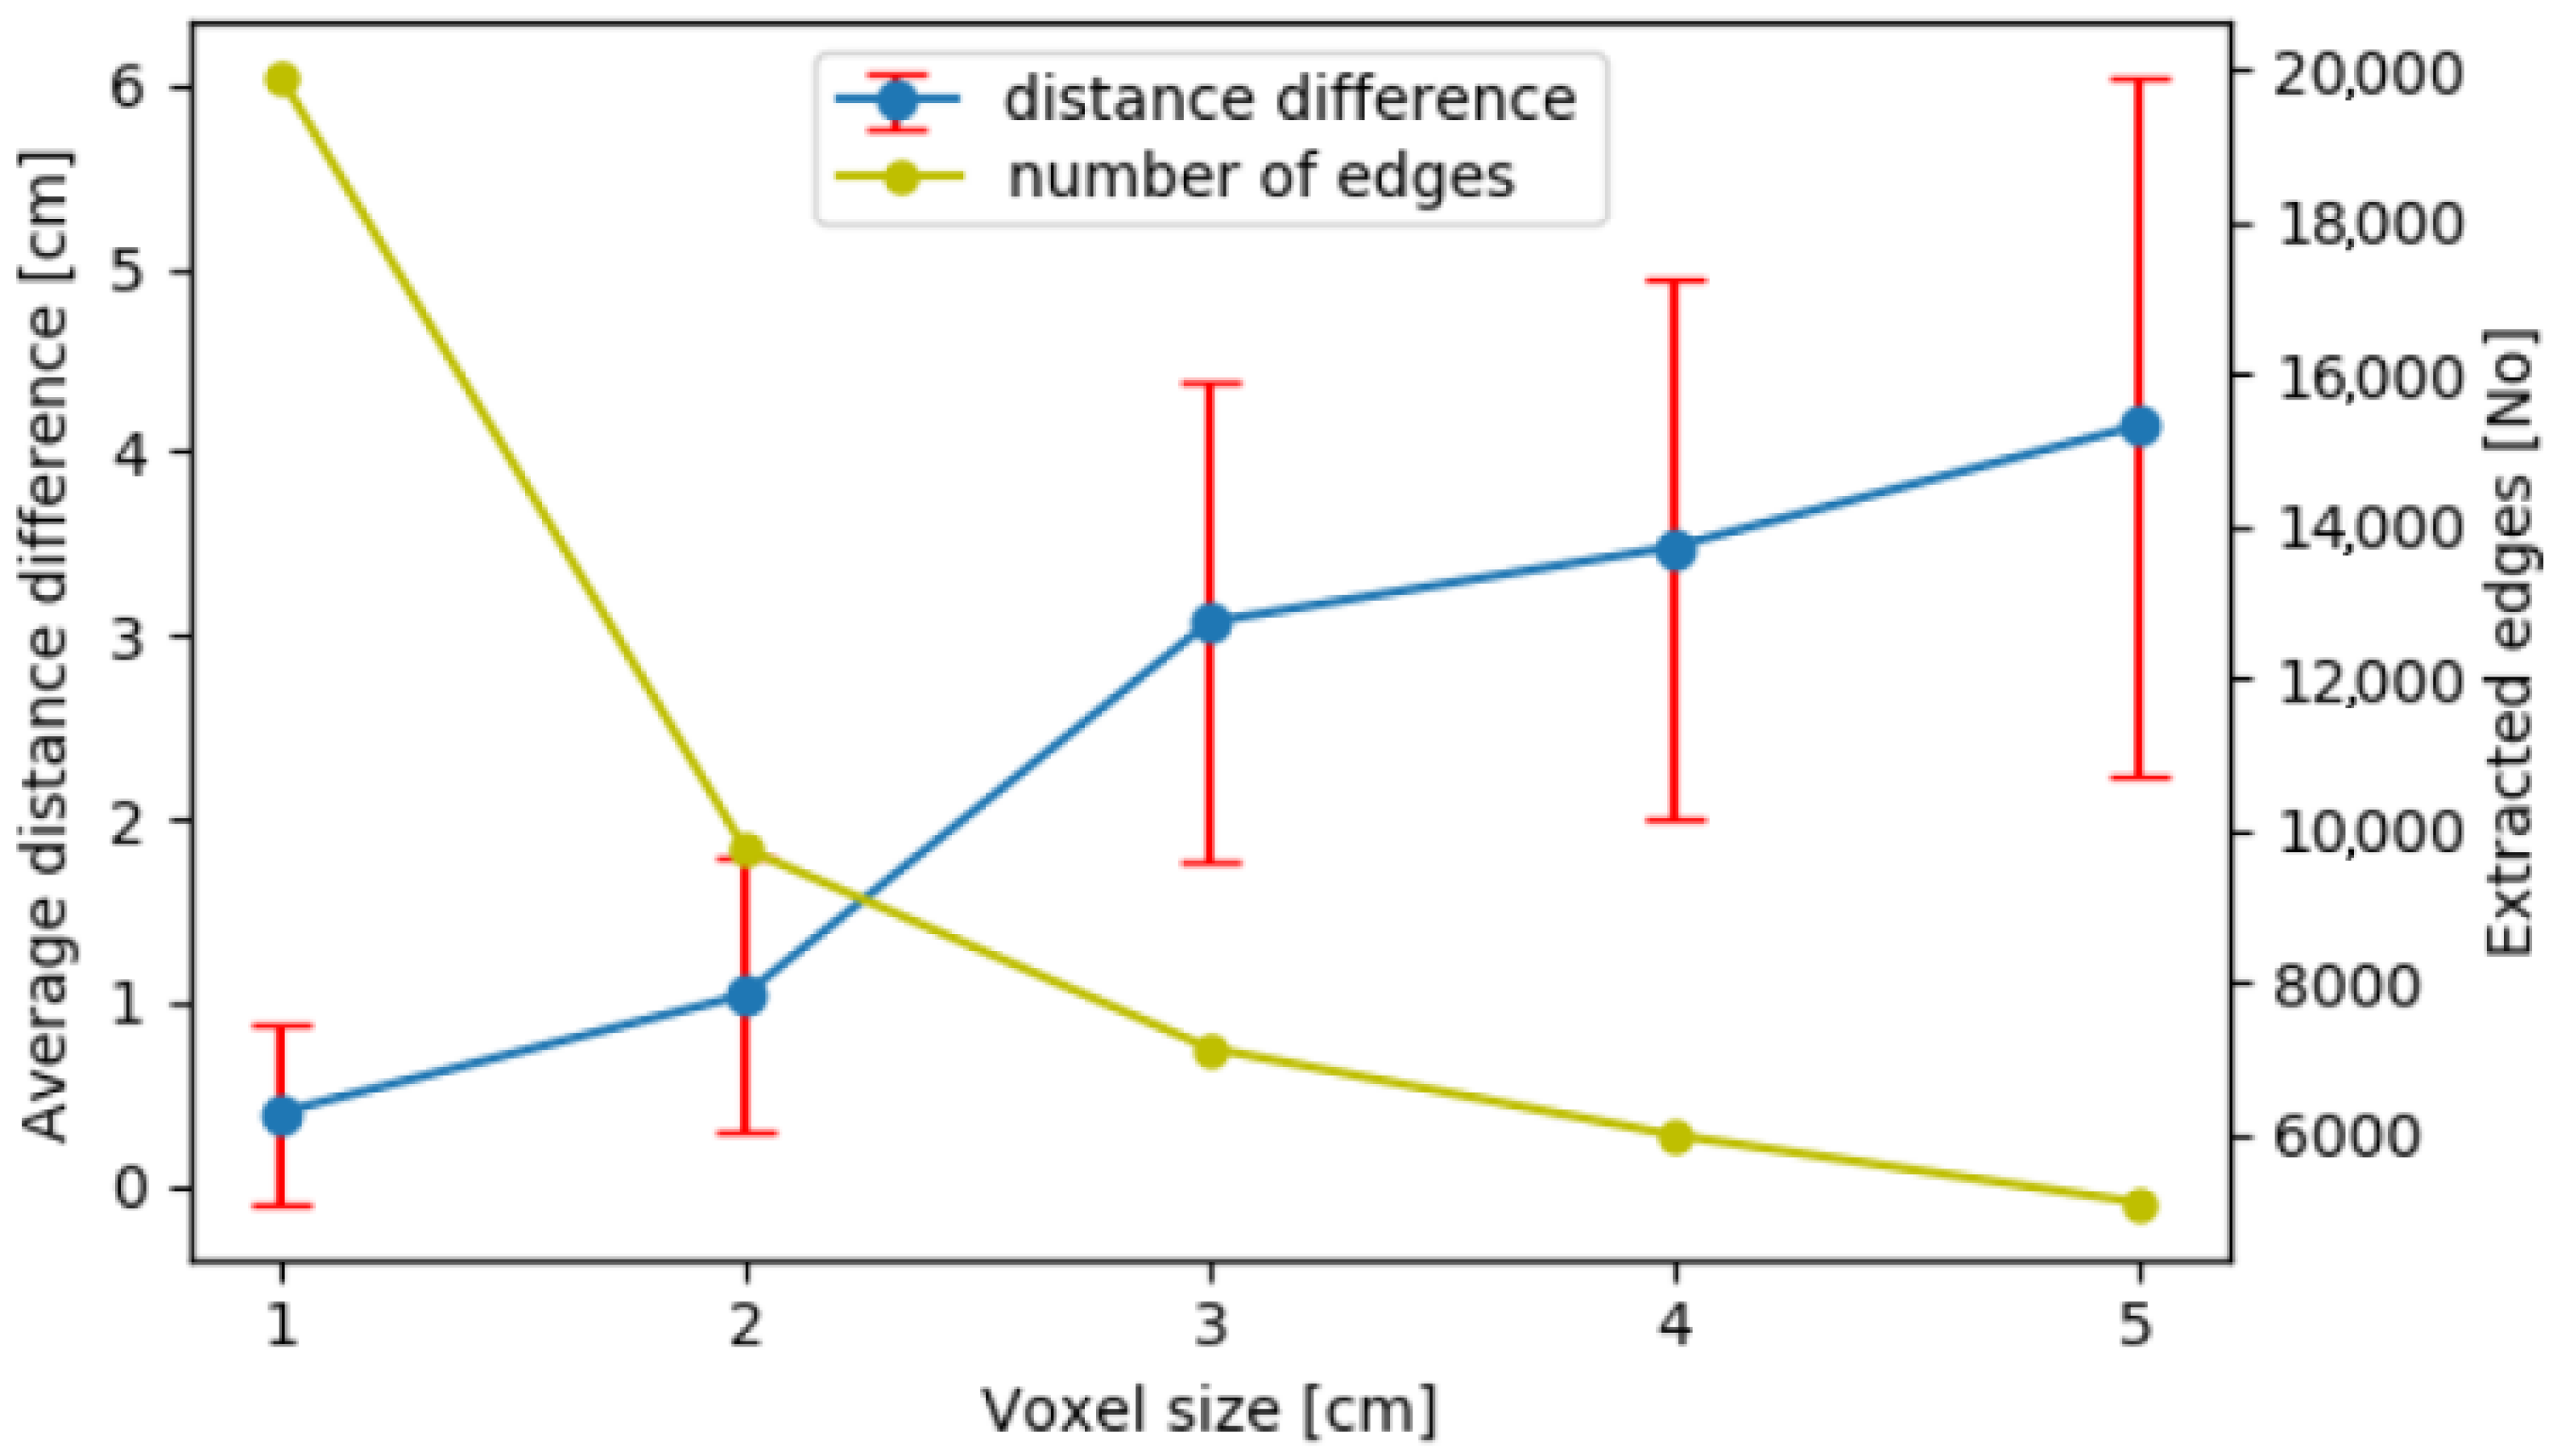
https://docs.unity3d.com/Manual/class-NavMeshSurface.html, accessed on 29 July 2021). Although the default ones are self-explanatory the latter ones need an explanation. The voxel size plays an important role in the precision of navigation mesh, and it is used to represent the agent’s body size, which is afterwards considered to identify walkable voxels and regions. We will evaluate later on in the text the number of border edges that are being generated as a result of using different voxel sizes in Section 4. To compute the navigation mesh quickly for large areas, space is tessellated into smaller areas, called tiles or chunks, allowing the execution of many calculations in parallel.
In terms of the classification of objects (e.g., stairs, doors, furniture) they should be separated into static and dynamic. The static ones are considered for the navigation mesh generation. Doors are recommended to be regarded as dynamic features to identify one continuous navigable space (Figure 2). However, once the navigation mesh is generated not just one navigable region can be identified. Having many navigable areas is suitable for game developments, as agents can be programmed to jump long distances or teleport somewhere else. However, for pedestrian simulations and built environments, this is not the case, and only the largest navigable area should be considered which is usually much bigger than the rest. In our case, smaller navigable areas are taken as non-walkable as pedestrians cannot reach them from the main navigation area by walking.
When a navigable mesh is constructed in the Unity there is an offset from walls which roughly represents the pedestrian’s radius. In this way, a pedestrian will not collide with any wall during a simulation. The radius size should be set up based on the maximum width that a crowd simulation model allows in order not to get stuck in some positions due to repulsive forces coming from the model.
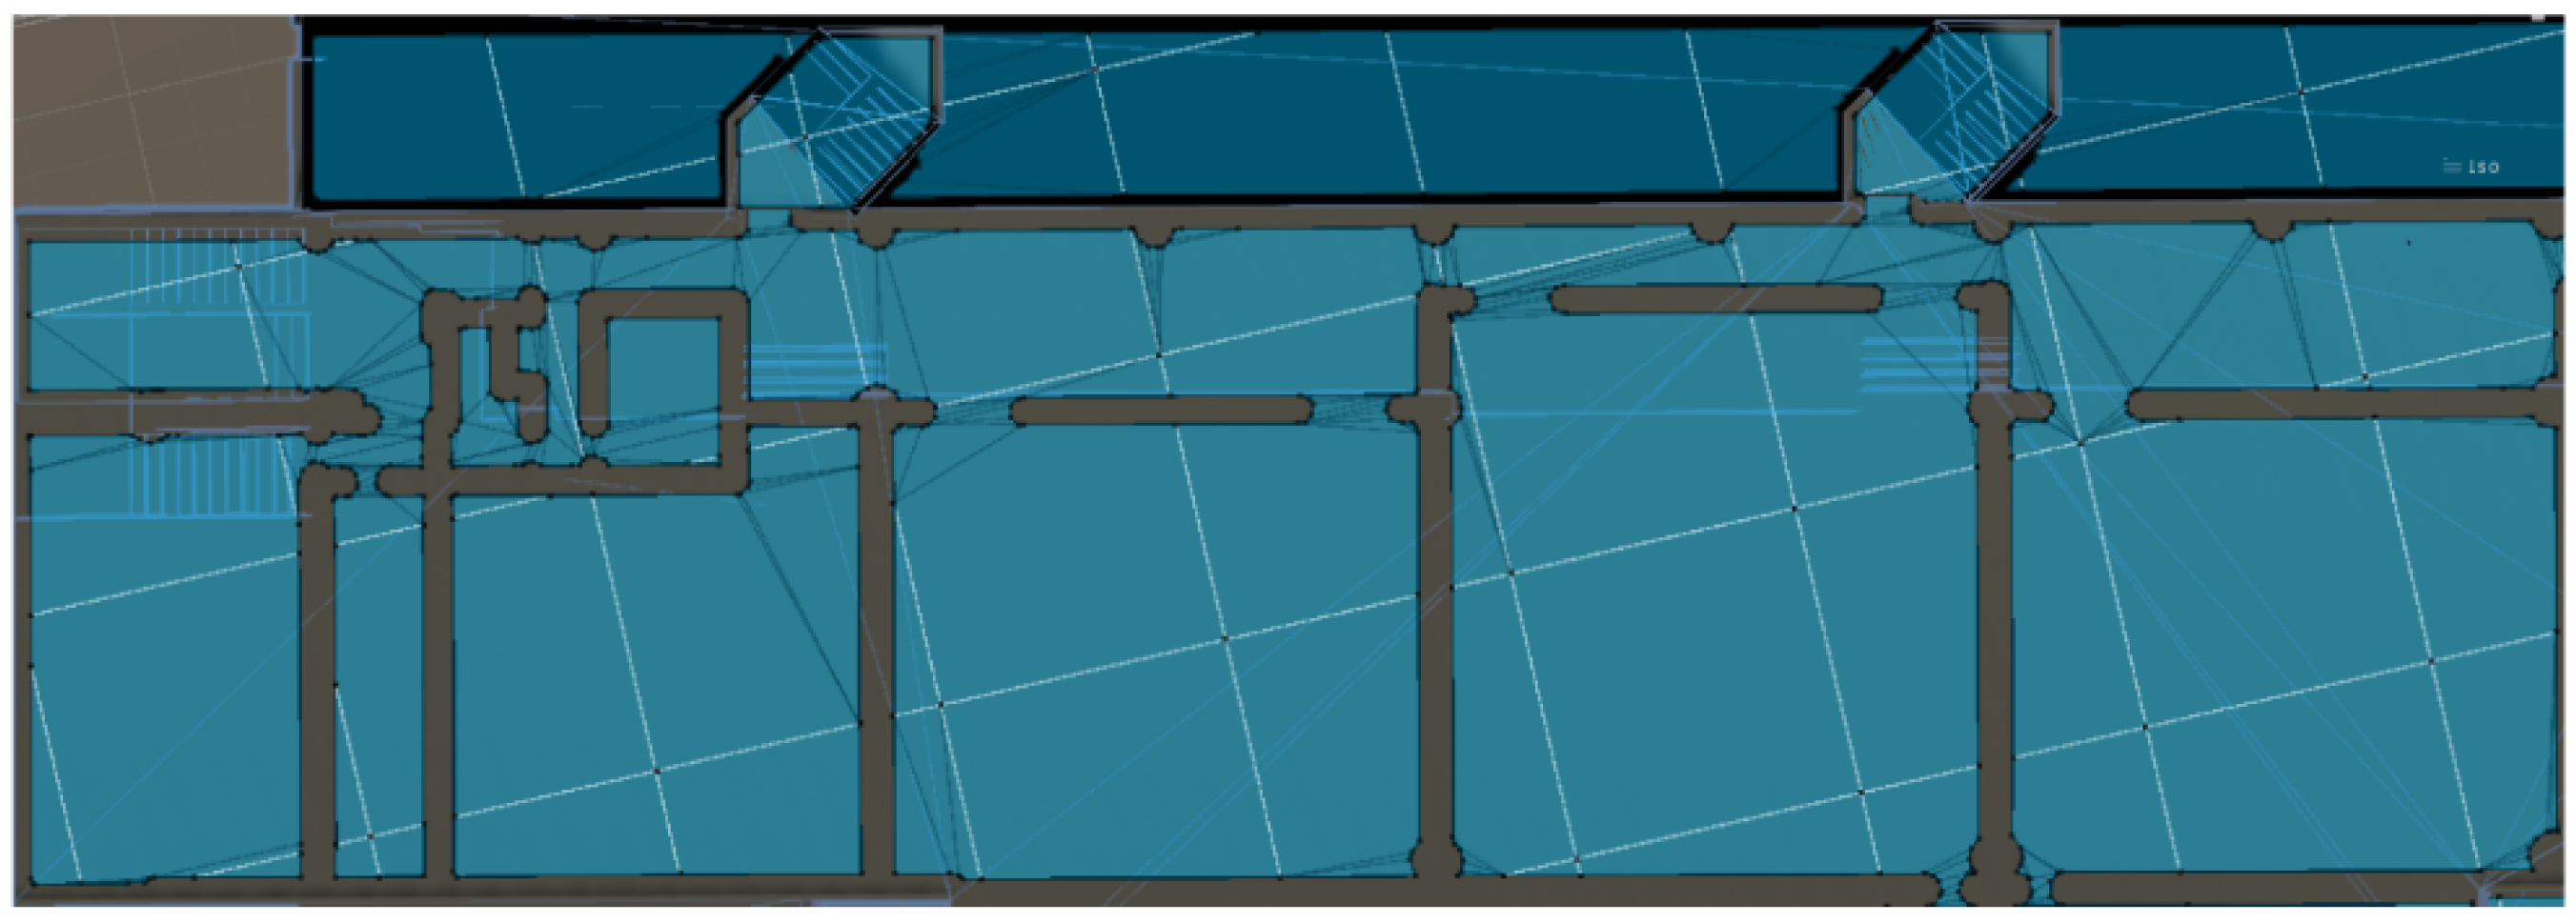
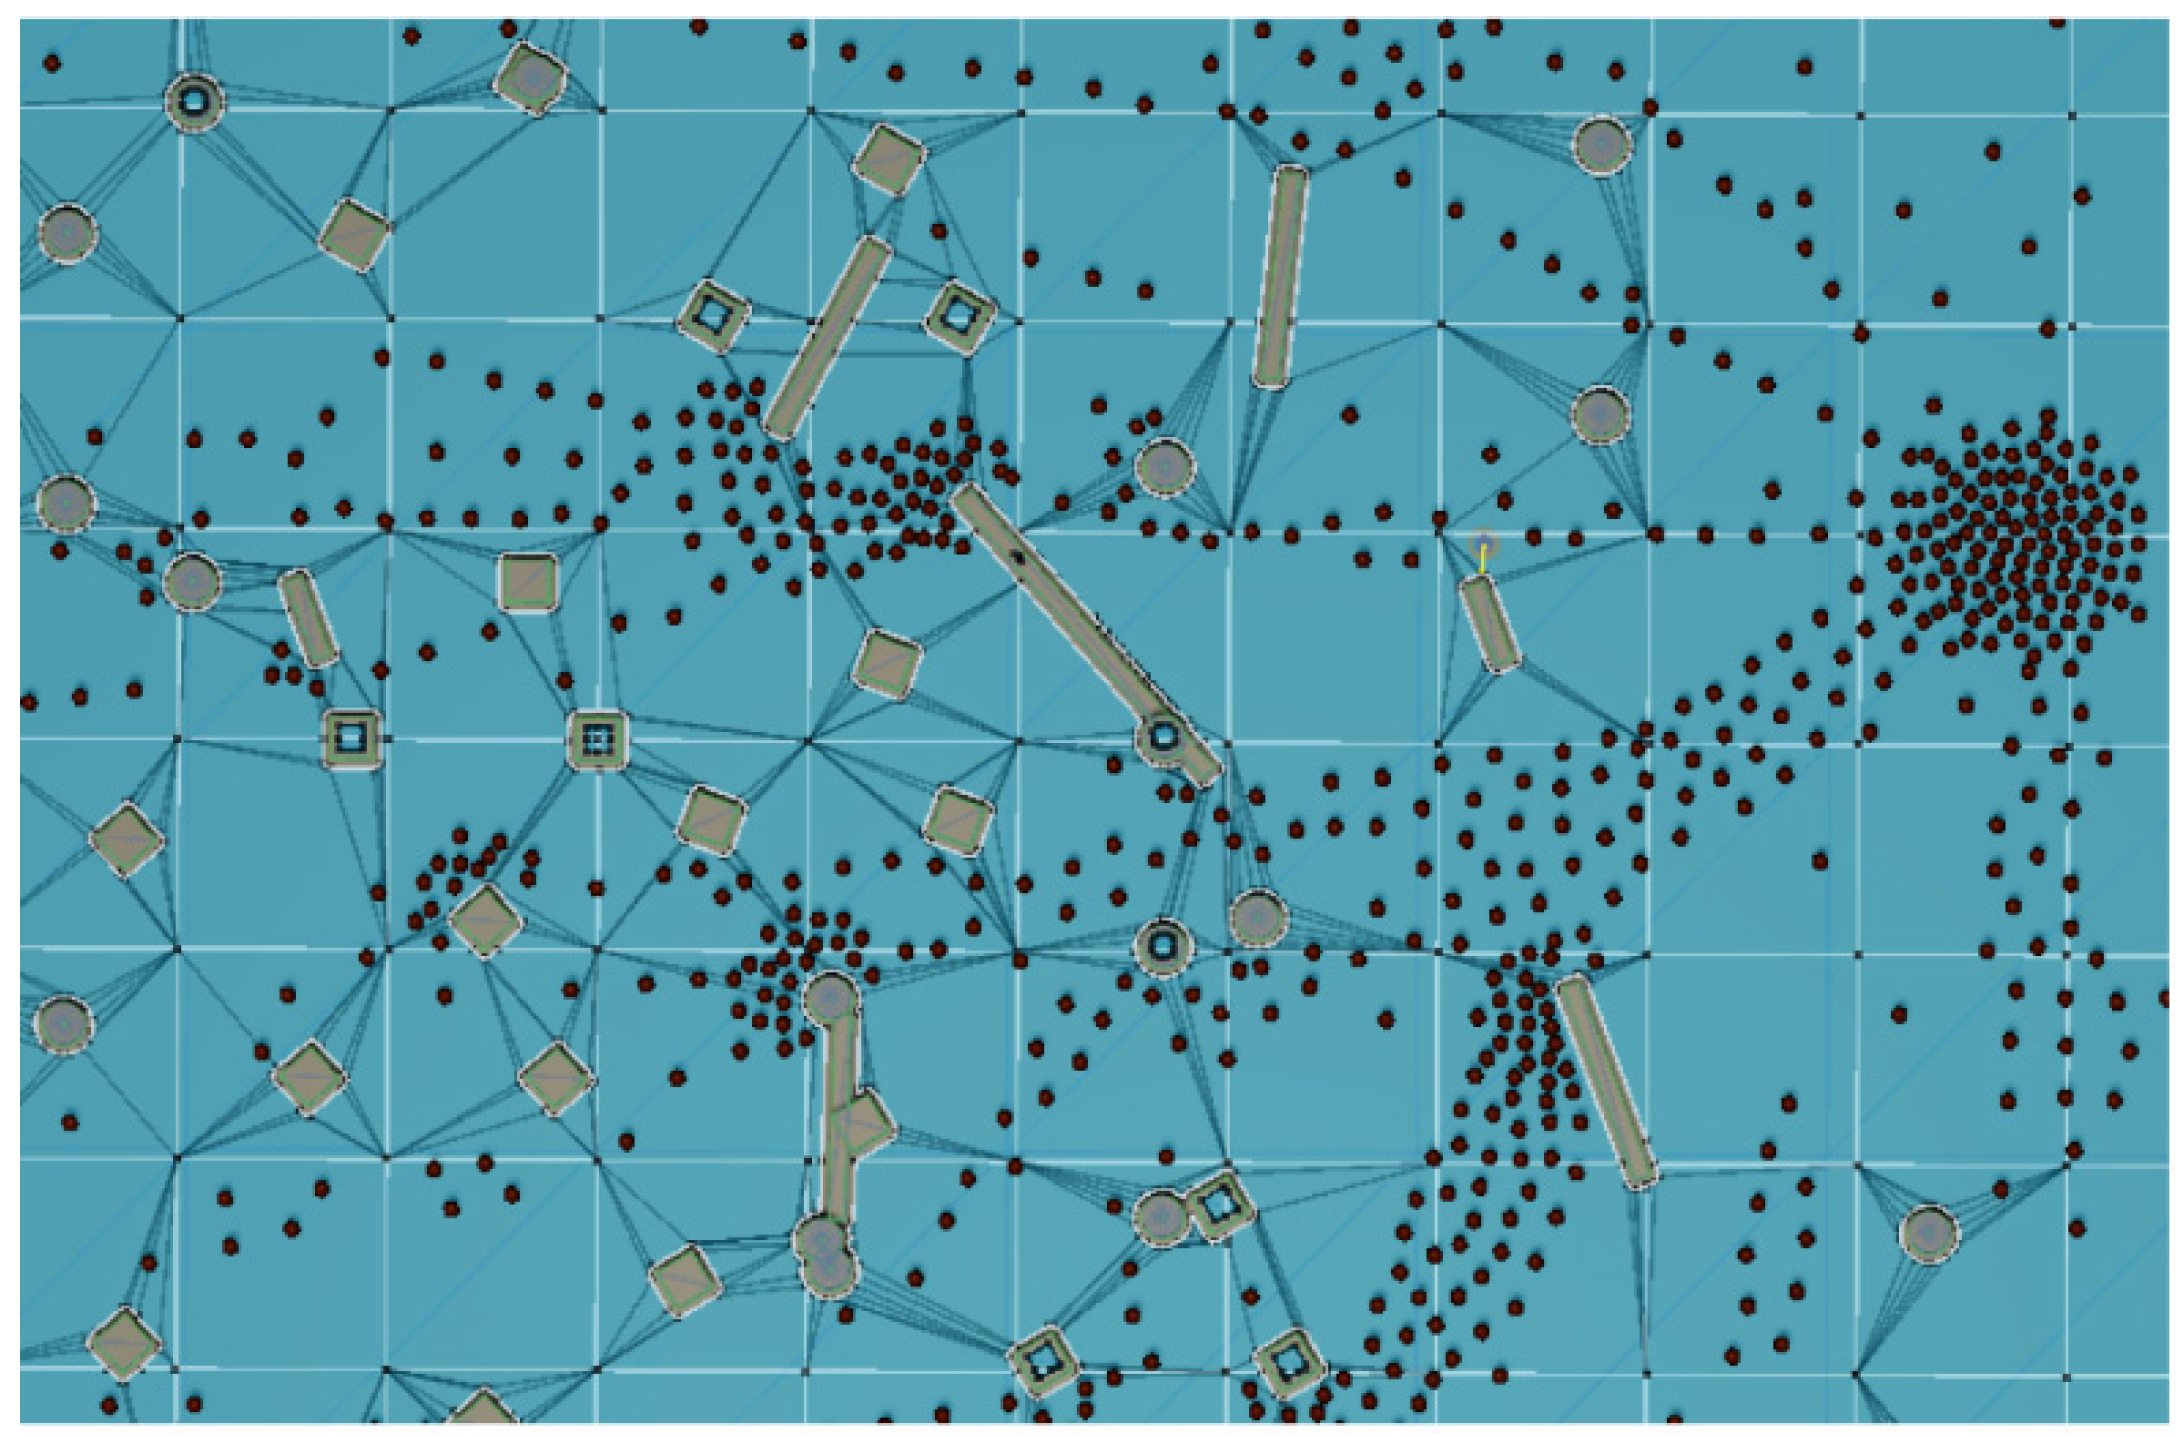
To start working with the navigation mesh Unity provides triangles used for pathfinding which match to a good extent the actual navigation mesh except on locations with curved surfaces (
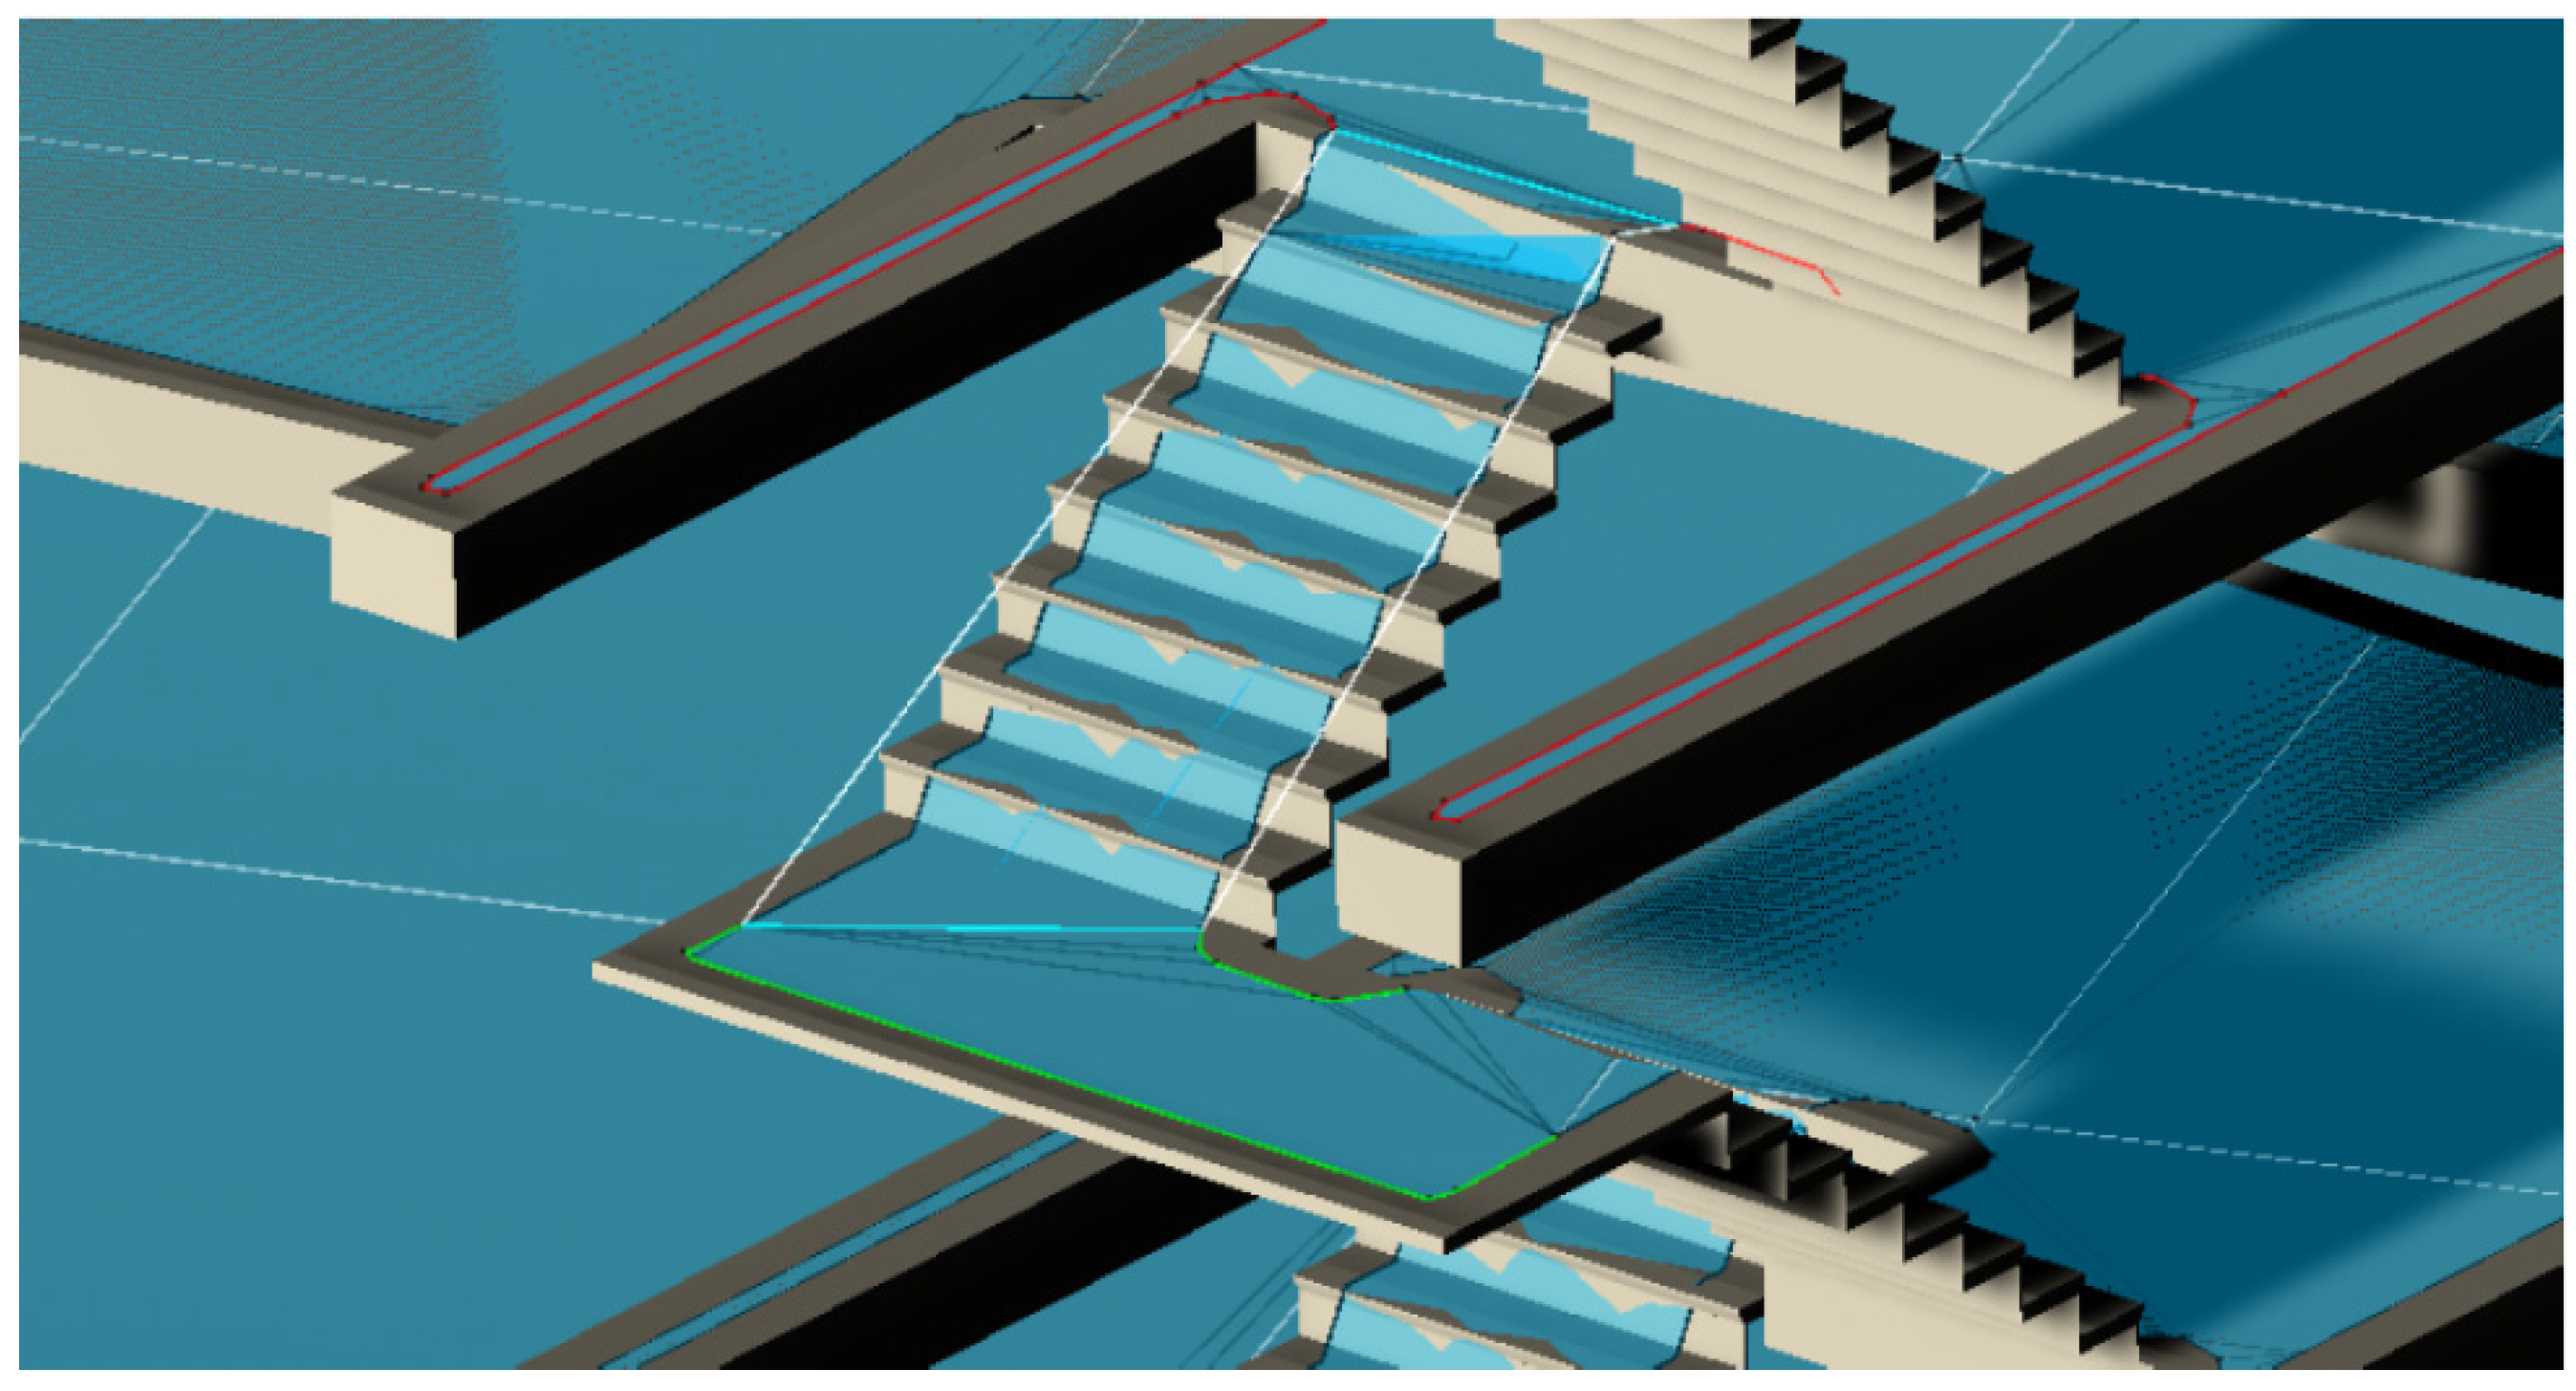
https://docs.unity3d.com/540/Documentation/ScriptReference/NavMesh.CalculateTriangulation.html, accessed on 29 July 2021). This particularly is not representing any problem, as the triangles can be used to find border edges and perform the subdivision. Additionally, a navigation mesh is not capturing anyway accurately such areas for pedestrian dynamics (Figure 5). For example, slope of stairs cannot be reliably identified from it, and it should be replaced with a more reliable solution.

3.2. Space Subdivision

Space subdivision is an important aspect of any navigation process. They are artificial representations supporting different agents’ activities. The subdivision can be performed on 2D and 3D levels depending on the application [28,29]. There are a few pros and cons of performing 2D and 3D subdivisions. The main advantages of the 2D subdivision are the execution of all or most calculations in 2D, the user can keep in memory only spaces that are occupied by pedestrians, and triangles are not needed for vertical placement of pedestrians. On the other hand, if everything is considered as one 3D space or chunks of 3D spaces simulated pedestrians can freely travel in an environment without the need to check if they travelled to another space for pedestrian dynamics purposes. However, it would be required to keep more information in memory of the whole space including heightmap or triangles, the slope of stairs and other properties. Therefore, a 2D space subdivision will be performed splitting a navigable area into horizontal and vertical areas.
Using the previously mentioned triangles we can identify border edges to calculate obstacles’ impact during a simulation and connecting edges to perform the transition between two subdivided spaces. The main issue with the provided triangles is the connection between them, as they do not represent exactly CDT due to the tessellation process. As a result, on locations where tiles share borders, additional edges and nodes can emerge.
Algorithm 1 shows all the functions needed to subdivide spaces and classify border edges. As a first step, we replace vertices that are in the proximity of 1 mm of each other. Based on the vertices and their edges all triangles are initialised. A slope of 0 is used to classify them into flat and tilted triangles. To find out the connection between the same triangles we use Depth First Search (DFS) algorithm. To identify the main navigation surface out of the identified ones we simply selected the one with the largest number of vertices. For each edge, a corresponding surface is identified. Flat surfaces with an area smaller than 0.5 m2 are merged with the closest sloped surface. If a sloped surface has some overlapping parts, it should be separated into two or more parts. For example, this can happen in the case of having circular stairs and some other similar scenarios.
Algorithm 1 Space Subdivision of a Navigation Mesh
Input: Edges and vertices representing triangles of a navigation mesh
Output: Subdivided spaces and border edges
R e p l a c e D u p l i c a t e s ( v e r t i c e s )
t r i a n g l e s = I n i t i a l i s e T r i a n g l e s ( v e r t i c e s ,   e d g e s )
e d g e s = T i n T o E d g e s ( t r i a n g l e s )
s u r f a c e s = I d e n t i f y S u r f a c e s ( e d g e s )
m a i n S u r f a c e = I d e n t i f y M a i n S u r f a c e ( s u r f a c e s ) [ 0 ]
t i n = S p l i t T r i a n g l e s ( m a i n S u r f a c e )
s l o p e d S u r f a c e s = I d e n t i f y S u r f a c e ( T i n T o E d g e s ( t i n [ 0 ] ) )
f l a t S u r f a c e s = I d e n t i f y S u r f a c e ( T i n T o E d g e s ( t i n [ 1 ] ) )
M e r g e S u r f a c e s ( s l o p e d S u r f a c e s ,   f l a t S u r f a c e s )
S p l i t S u r f a c e s ( s l o p e d S u r f a c e s )
f o r   e a c h   s u r f a c e   i n   [ s l o p e d S u r f a c e s ;   f l a t S u r f a c e s ]   d o
I d e n t i f y B o r d e r s ( s u r f a c e )
M e r g e E d g e s ( s u r f a c e )
The functions used in the algorithm are the following:
R e p l a c e D u p l i c a t e s ( v e r t i c e s ) : replacing vertices that are close to other ones.
I n i t i a l i s e T r i a n g l e s ( v e r t i c e s ,   e d g e s ) : initialising triangles based on vertices and edges.
T i n T o E d g e s ( t r i a n g l e s ) : identifying all edges.
I d e n t i f y S u r f a c e s ( e d g e s ) : identifying all connected triangles forming one connected surface.
I d e n t i f y M a i n S u r f a c e ( e d g e s ) : finding the surface based on the largest number of vertices.
S p l i t T r i a n g l e s ( e d g e s ) : splitting triangles of the main navigation surface based on the slope classification.
M e r g e S u r f a c e s ( s l o p e d S u r f a c e s ,   f l a t S u r f a c e s ) : merging small flat surfaces with neighbouring sloped ones.
S p l i t S u r f a c e s ( s l o p e d S u r f a c e s ) : splitting a surface into several smaller surfaces until the edges do not intersect in 2D space.
I d e n t i f y B o r d e r s ( s u r f a c e ) : identifying border edges of a surface and connecting edges between them.
M e r g e E d g e s ( s u r f a c e ) : merging connected and inlined border edges.

3.3. Border Edges Extraction

To detect border edges, we first identify all the edges that are appearing once, which usually leaves the edges that are at the border. As an exact CDT is not constructed in the first place some edges are also appearing in the middle of walking areas. Thus, we have vertices that are connected to more than two edges. For each of those edges, we test if their vertices and a point representing the middle part of the edge (e.g., there are situations when both vertices are on the border, but the edge still goes through the navigable area) are on the border of the navigation mesh using Unity function that identifies the closest edge (https://docs.unity3d.com/ScriptReference/AI.NavMesh.FindClosestEdge.html, accessed on 29 July 2021) (Figure 3). We should justify that we do not want to use this Unity function to check how far away is a pedestrian from the closest border edge in simulations, as it is performed in 3D, while in our case it will be 2D. However, the main reason is related to obstacle avoidance where Unity can only identify the closest edge, whereas for the social force model that we selected in the further text it is required to calculate the impact from all obstacles in a pedestrian’s proximity.
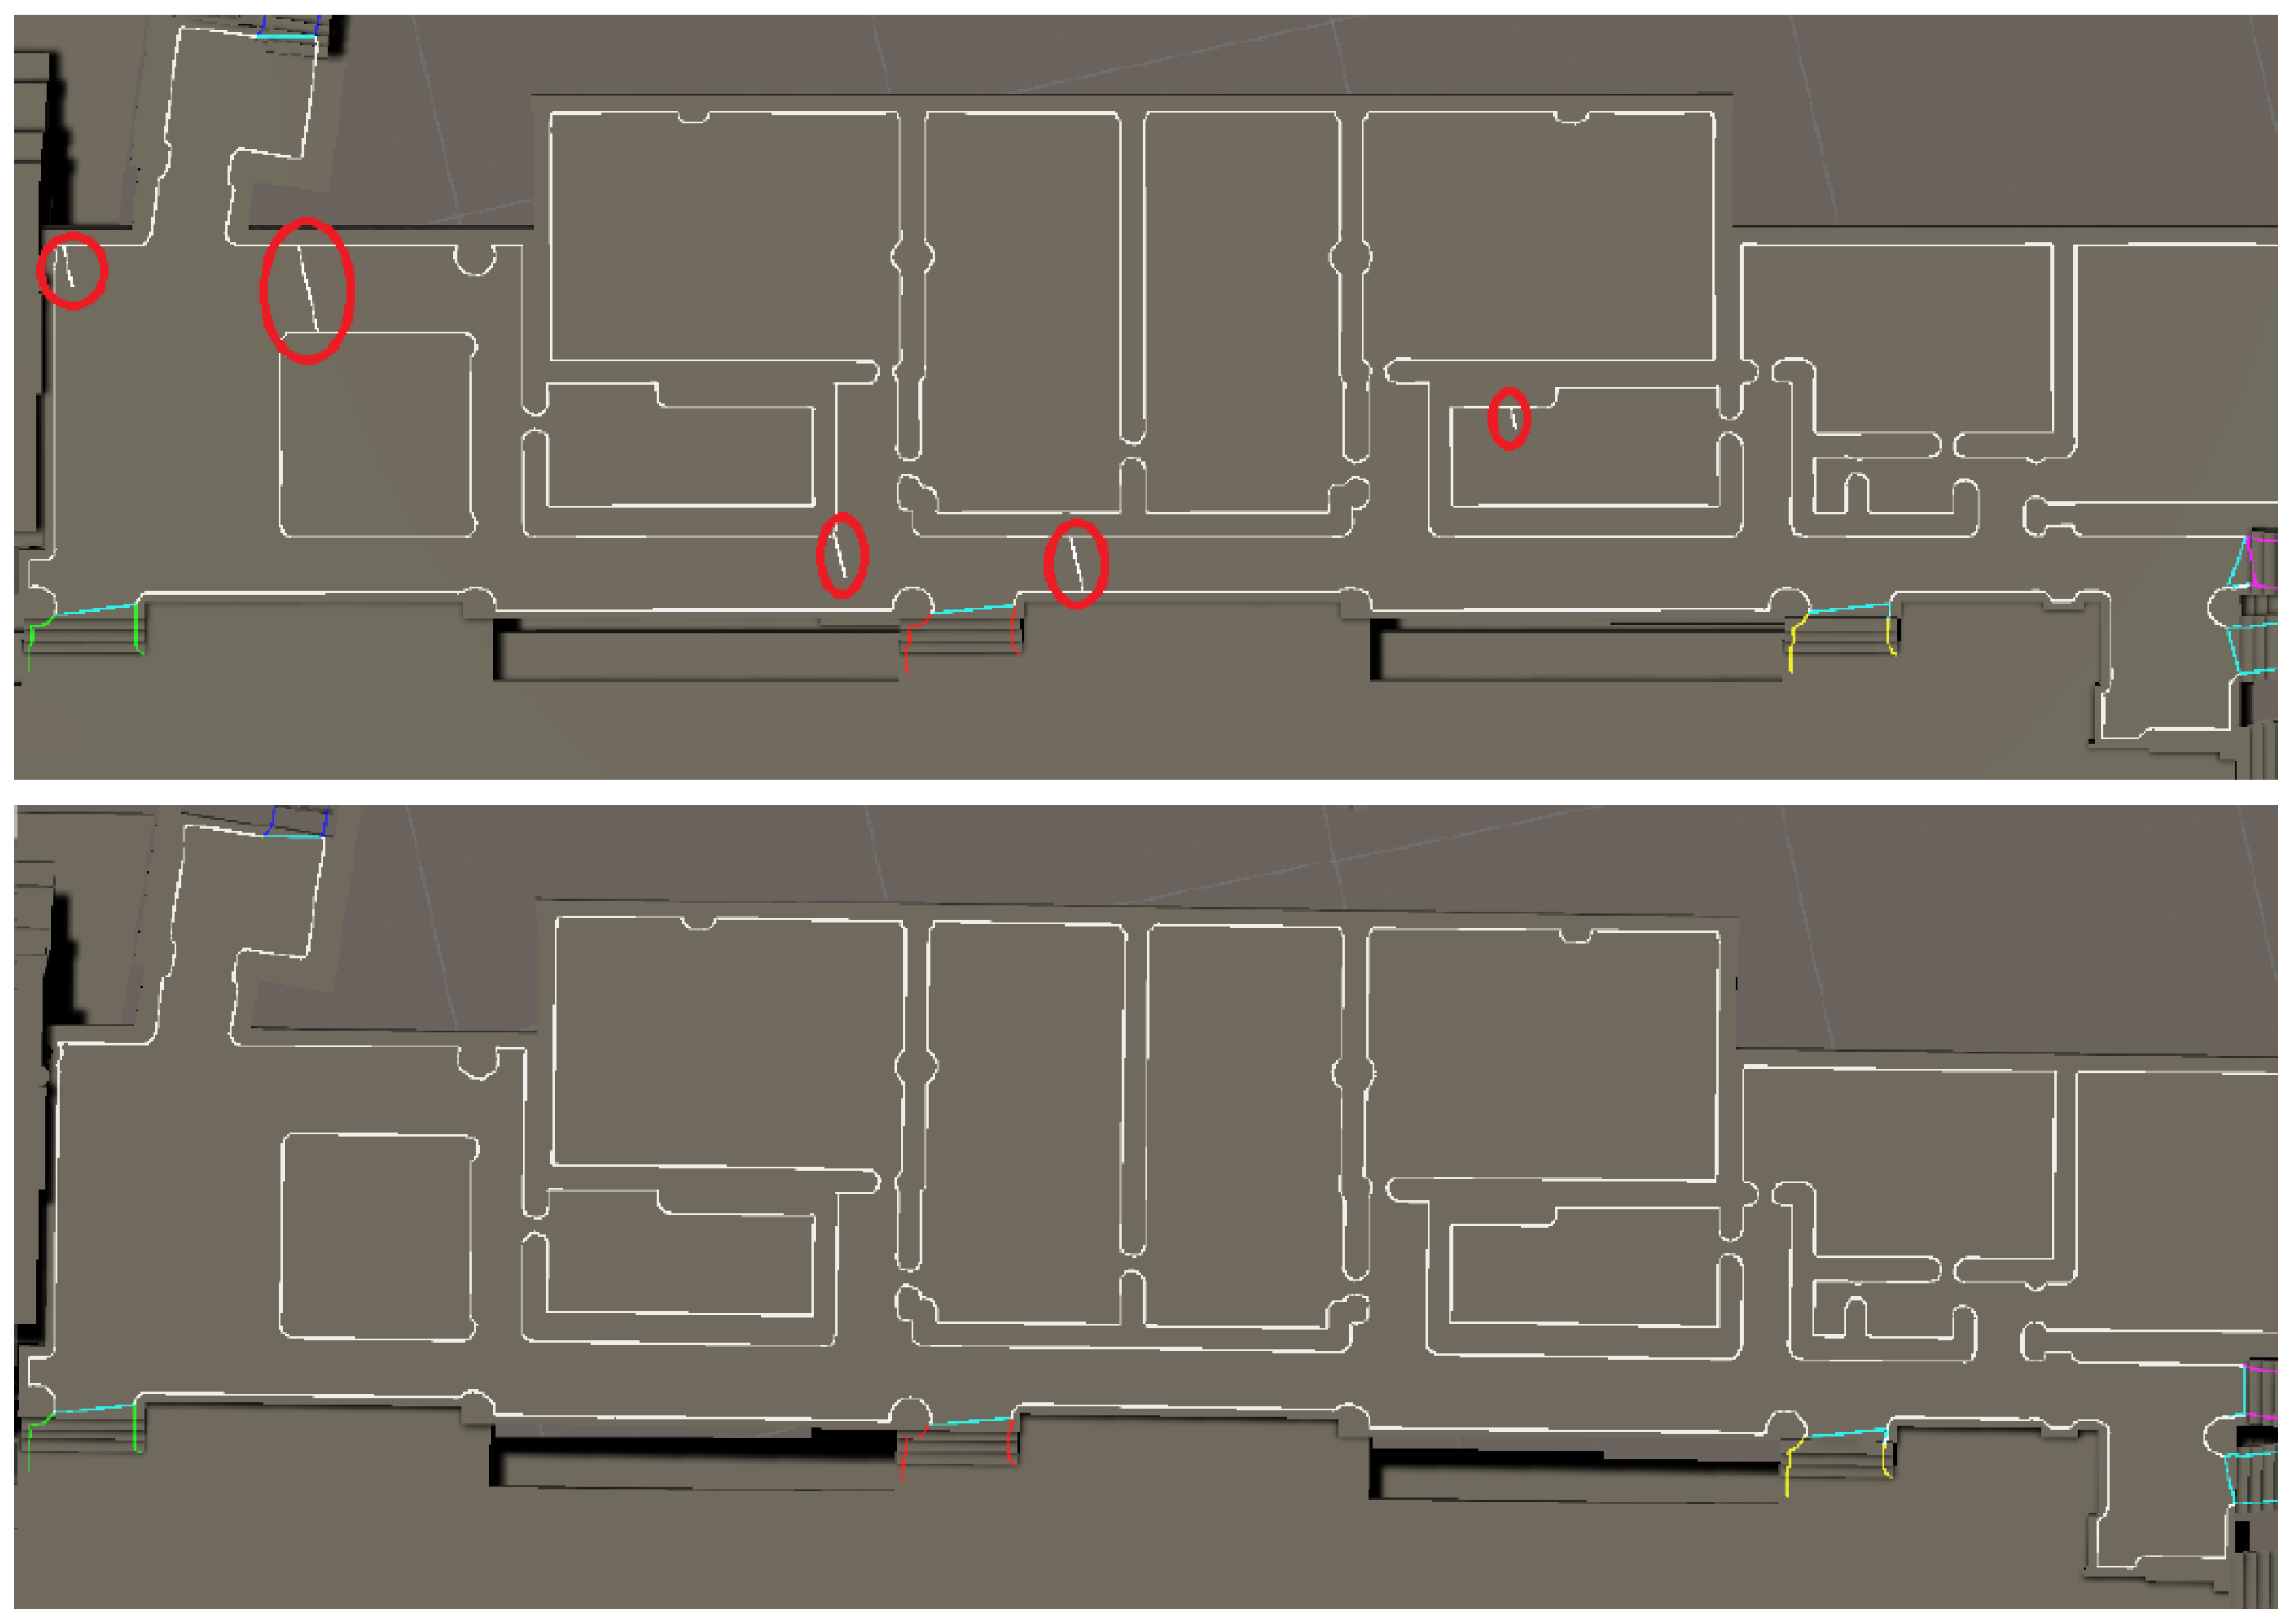
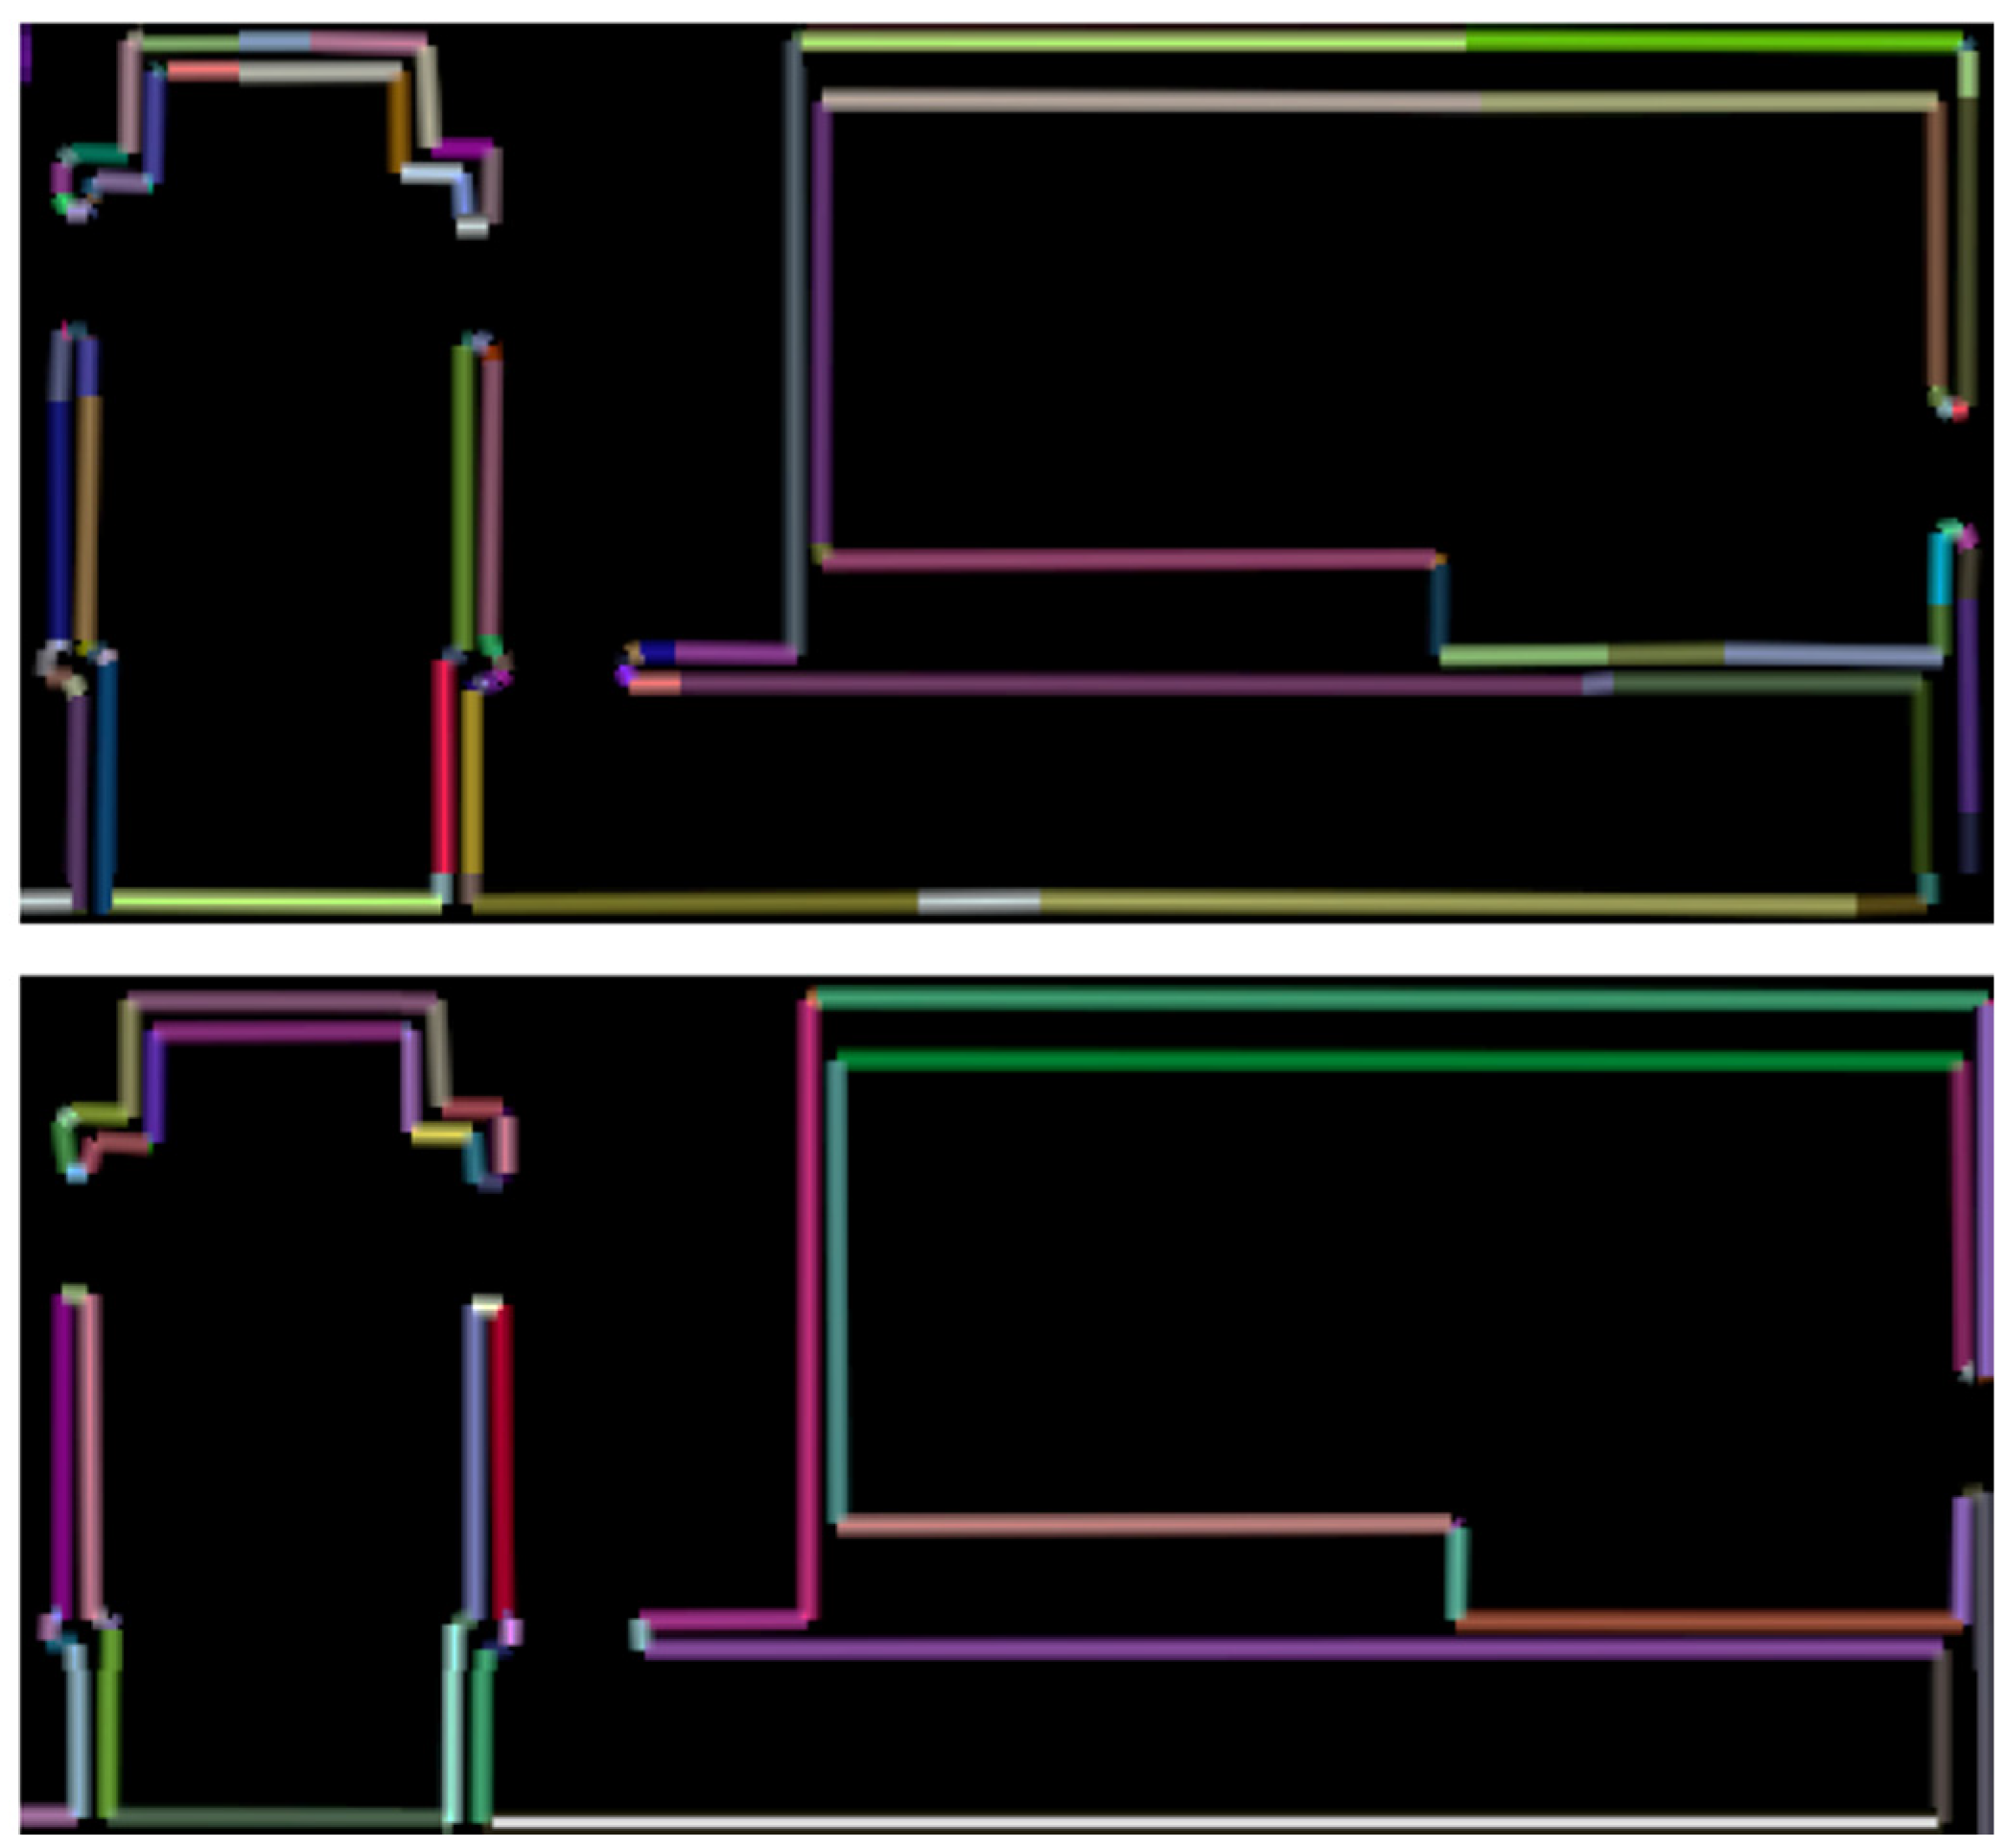
Once border edges are detected, connected and inlined edges can be merged (
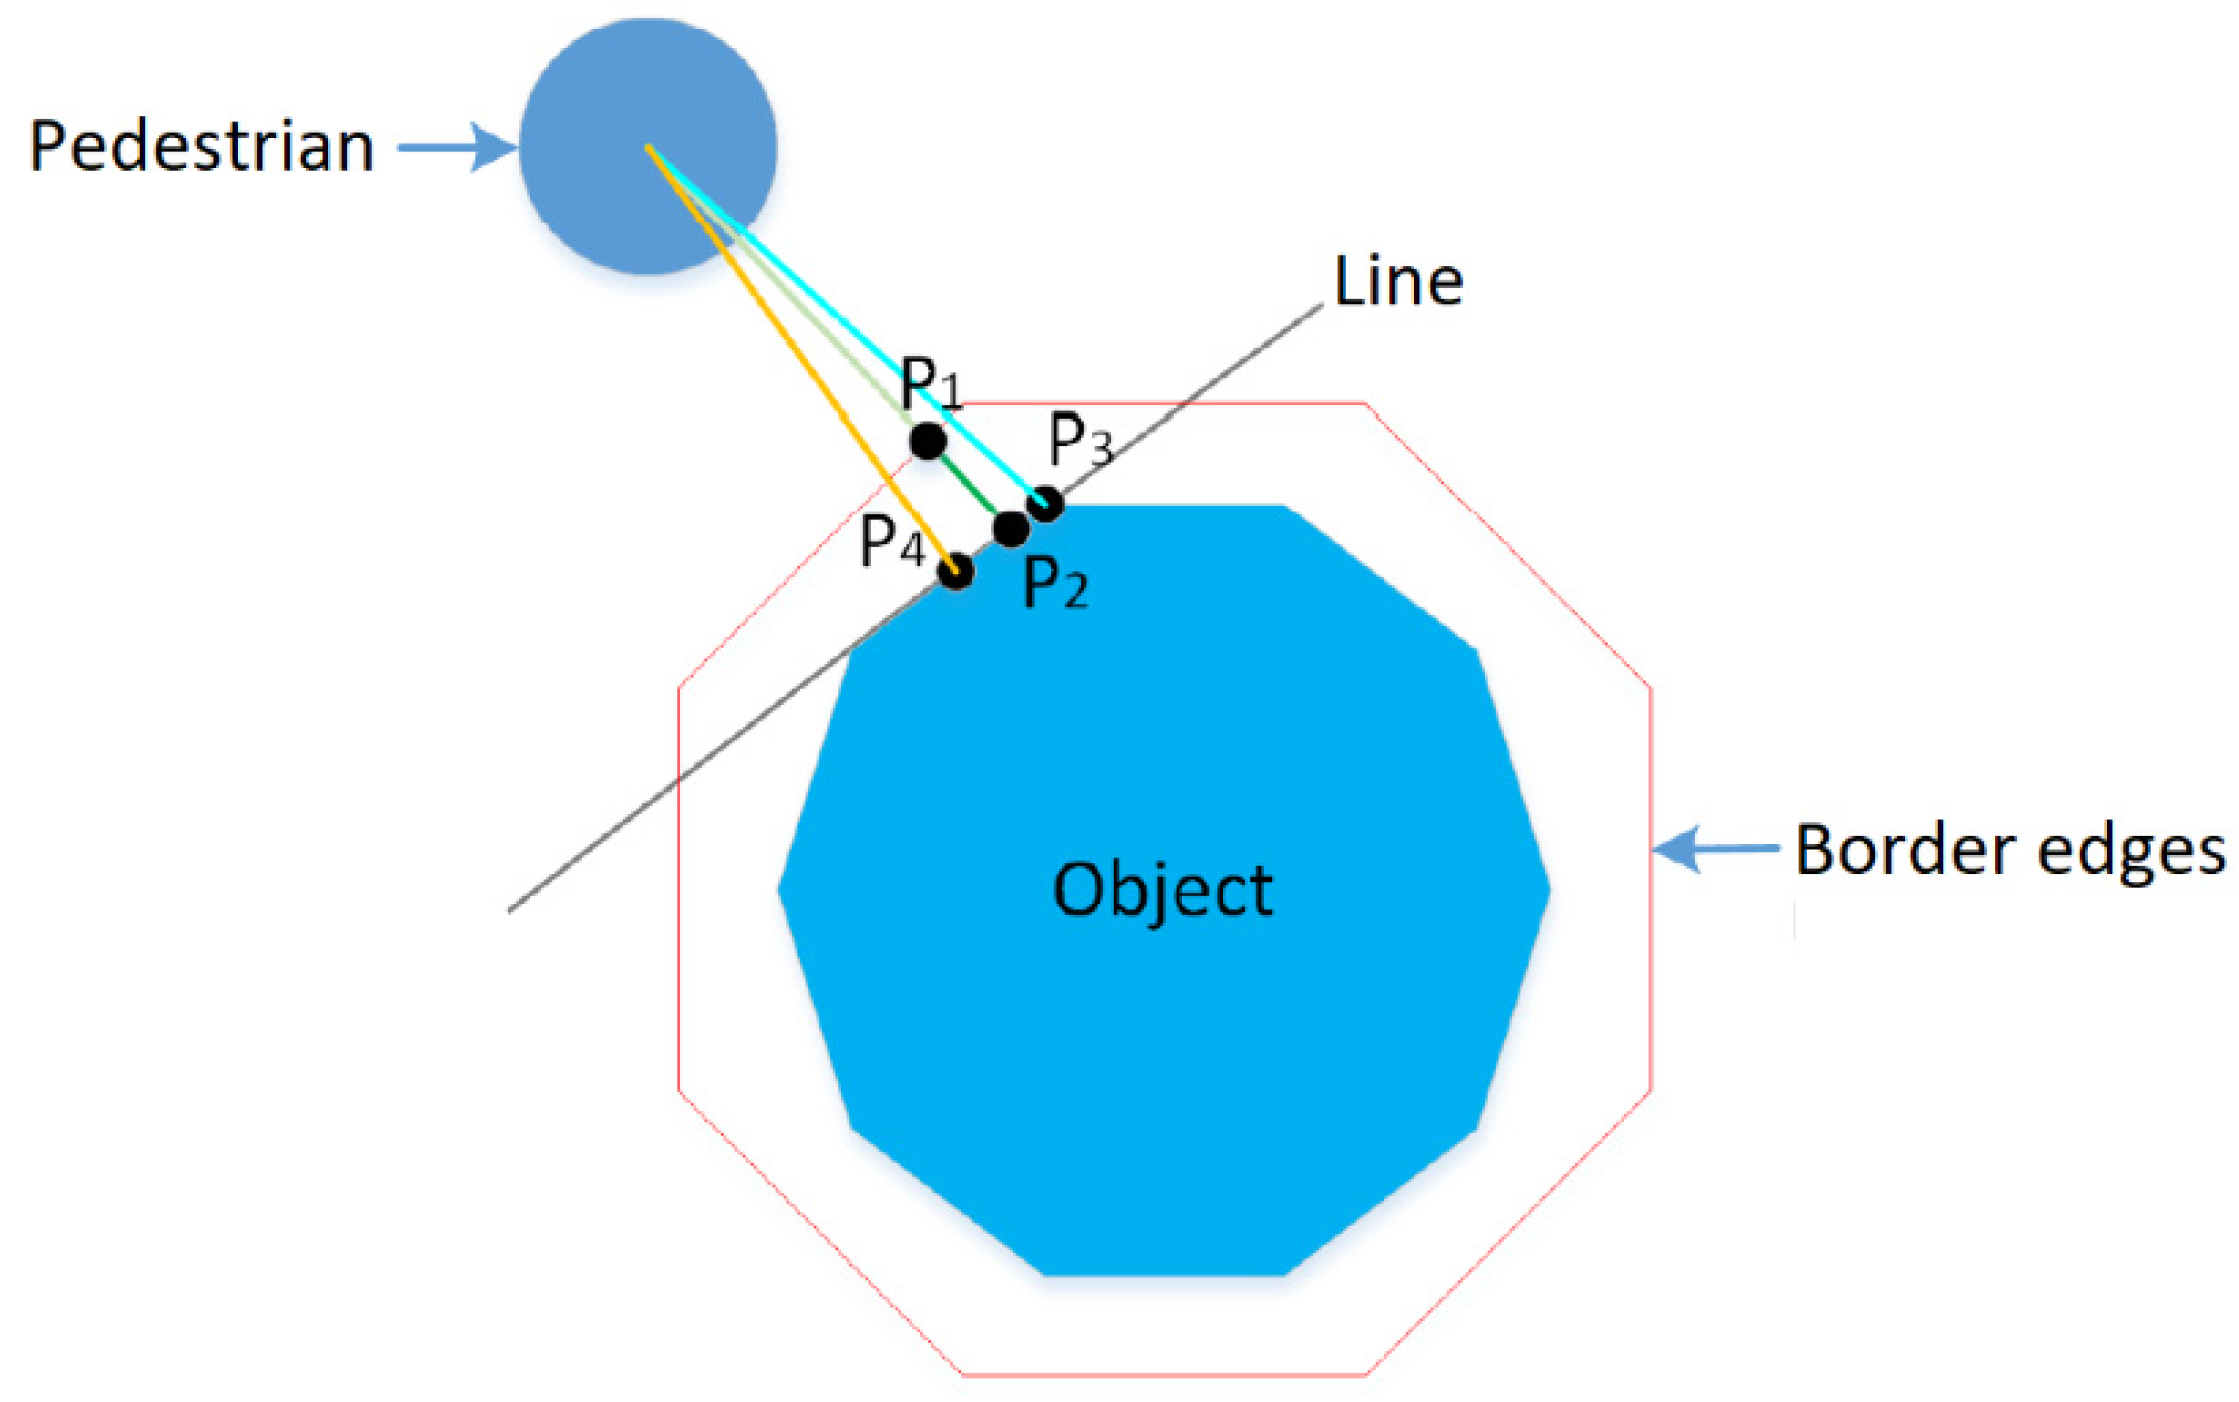
Figure 4). Such edges are partitioned because of triangles that we use as input. The main reason for connecting those edges is to have fewer edges, which will allow quicker calculation of obstacles impact during simulations. This is done in two steps. The first step requires associating each edge to its closest object surface. To achieve this, we cast rays from five points equally distributed on the edges in the direction normal to the edge. Considering normals of the points that hit a surface and the object that is hit, we detect to which object’s surface each edge belongs. As a result, all edges that correspond to one surface of a wall are merged into one line. The second step involves connecting boundary edges that belong to two connected and approximately inlined surfaces. For this, we consider an azimuthal angle difference between such edges of 3°. In the end, we obtain border edges which more rationally represent obstacles. In the experiments section, we further assess the accuracy of identified border edges compared to actual walls and other obstacles.

3.4. Height Map Identification and Stairs Classification

Heightmap identification plays an important role during a crowd simulation for the vertical placement of agents. Unity provides a function to place an agent on a navigation mesh and determine the current vertical position of agents (https://docs.unity3d.com/ScriptReference/AI.NavMesh.SamplePosition.html, accessed on 29 July 2021). However, the function casts rays which can be very expensive if you have hundreds or thousands of agents for which vertical position should be determined each time. Moreover, the navigation mesh and triangles representing it do not reflect correctly the actual stairs, which can result in the wrong calculation of agents’ speed (Figure 5). Therefore, we identify a heightmap for each surface with tilted edge boundaries.
The height of flat spaces is calculated as an average value considering all vertices belonging to that mesh. Regarding sloped surfaces, we use its Minimum Bounding Box (MBB) to create a horizontal grid, where we identify corresponding heights on the ground for each cell. This is done to substitute casting always rays to a ground surface during simulations for vertical placement. Ray casting can be costly; thus, we store the information as a matrix of values covering the whole sloped area. In this way, based on one pivot point of a space (e.g., one point of MBB) and a pedestrian’s horizontal position we can easily determine the pedestrian’s vertical position. To determine a heightmap for sloped surfaces we cast rays from the top using the vertical extension of MBB. If the rays are hitting more than one object in its path, we check if the distance between the intersecting point and the triangles belonging to the sloped space is smaller than 0.5 m.
Apart from the identification of heights for accurate placement of pedestrians, parameters representing stairs should be identified to calculate the speed of pedestrians correctly. Stairs are usually represented via slope or riser height and tread depth, width, and steps count [30]. The main problem related to stairs are configurations that they can take, making the identification of these parameters more difficult. Using BIM models these parameters can be found, but even then, they can be wrong and affect the simulation. For example, in Figure 6 treads overlap by looking from the top, which can result in using a wrong value as a tread depth. This and many other stair configuration examples (e.g., spiral stairs, stairs without risers or stairs which are inconsistent on some parts) make the process of calculating correct agents’ speed more challenging.
In the further text, we will concentrate only on more regular stair configurations such as in 
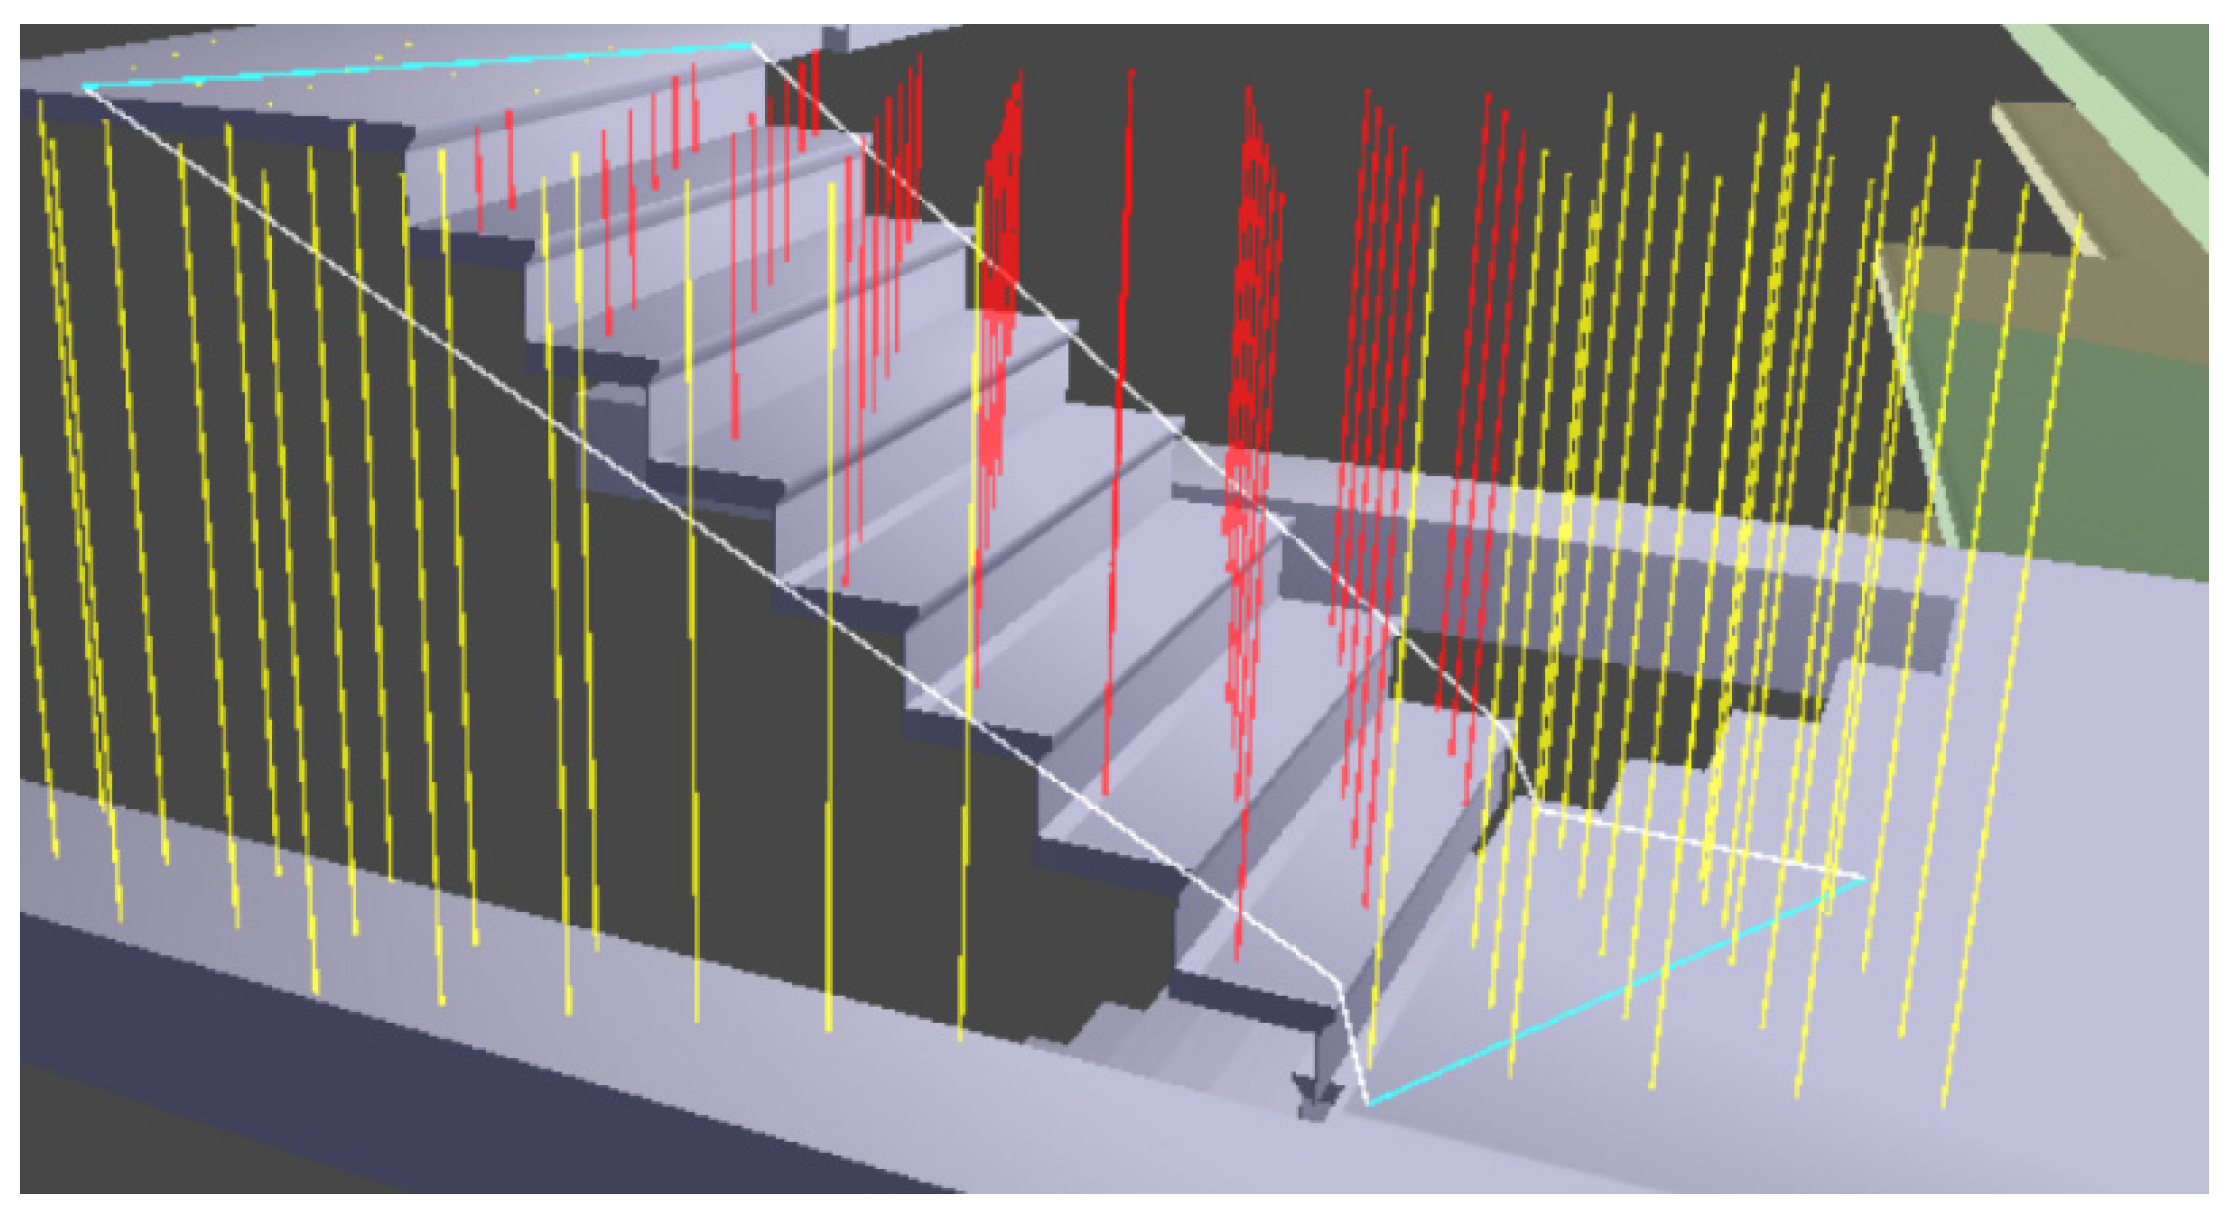
Figure 6, where both treads and risers are present. The goal is to determine their dimensions and use them afterwards in agents’ speed determination. To do so, we classify the hitting points that we detected for the heightmap. The grid resolution to perform the ray casting is 24 cm (i.e., minimum tread depth size), which is also in line with other researchers using 25 cm [26]. We use the centroid of cells to shoot the rays (Figure 7).
If 3D objects representing stairs do not have this information, we need to first classify points belonging to stairs. When casting the rays, we can group points based on objects that are hit. Thus, for each step, we can know all hit points. From each point (i.e., cell’s centroid) a horizontal filter with a size of 5 × 5 is considered to check the surrounding heights and cover an area that can identify even stairs with larger tread depths (e.g., maximum recorded tread depth in buildings is 33 cm). Considering all points obtained through the filter and the central point, we can identify height differences between them. If there are two or more height differences from the central point that are between 10 and 20 cm (i.e., minimum and maximum riser size) and ±2 cm from each other, we can say that the central point is belonging to stairs and height differences are riser heights from that point (Figure 7). The presented thresholds for treads and risers are based on many stair configurations available in practice and standards [30,31]. In the case of having the metadata for stairs (e.g., data coming from BIM models), we can immediately know all points belonging to stairs.
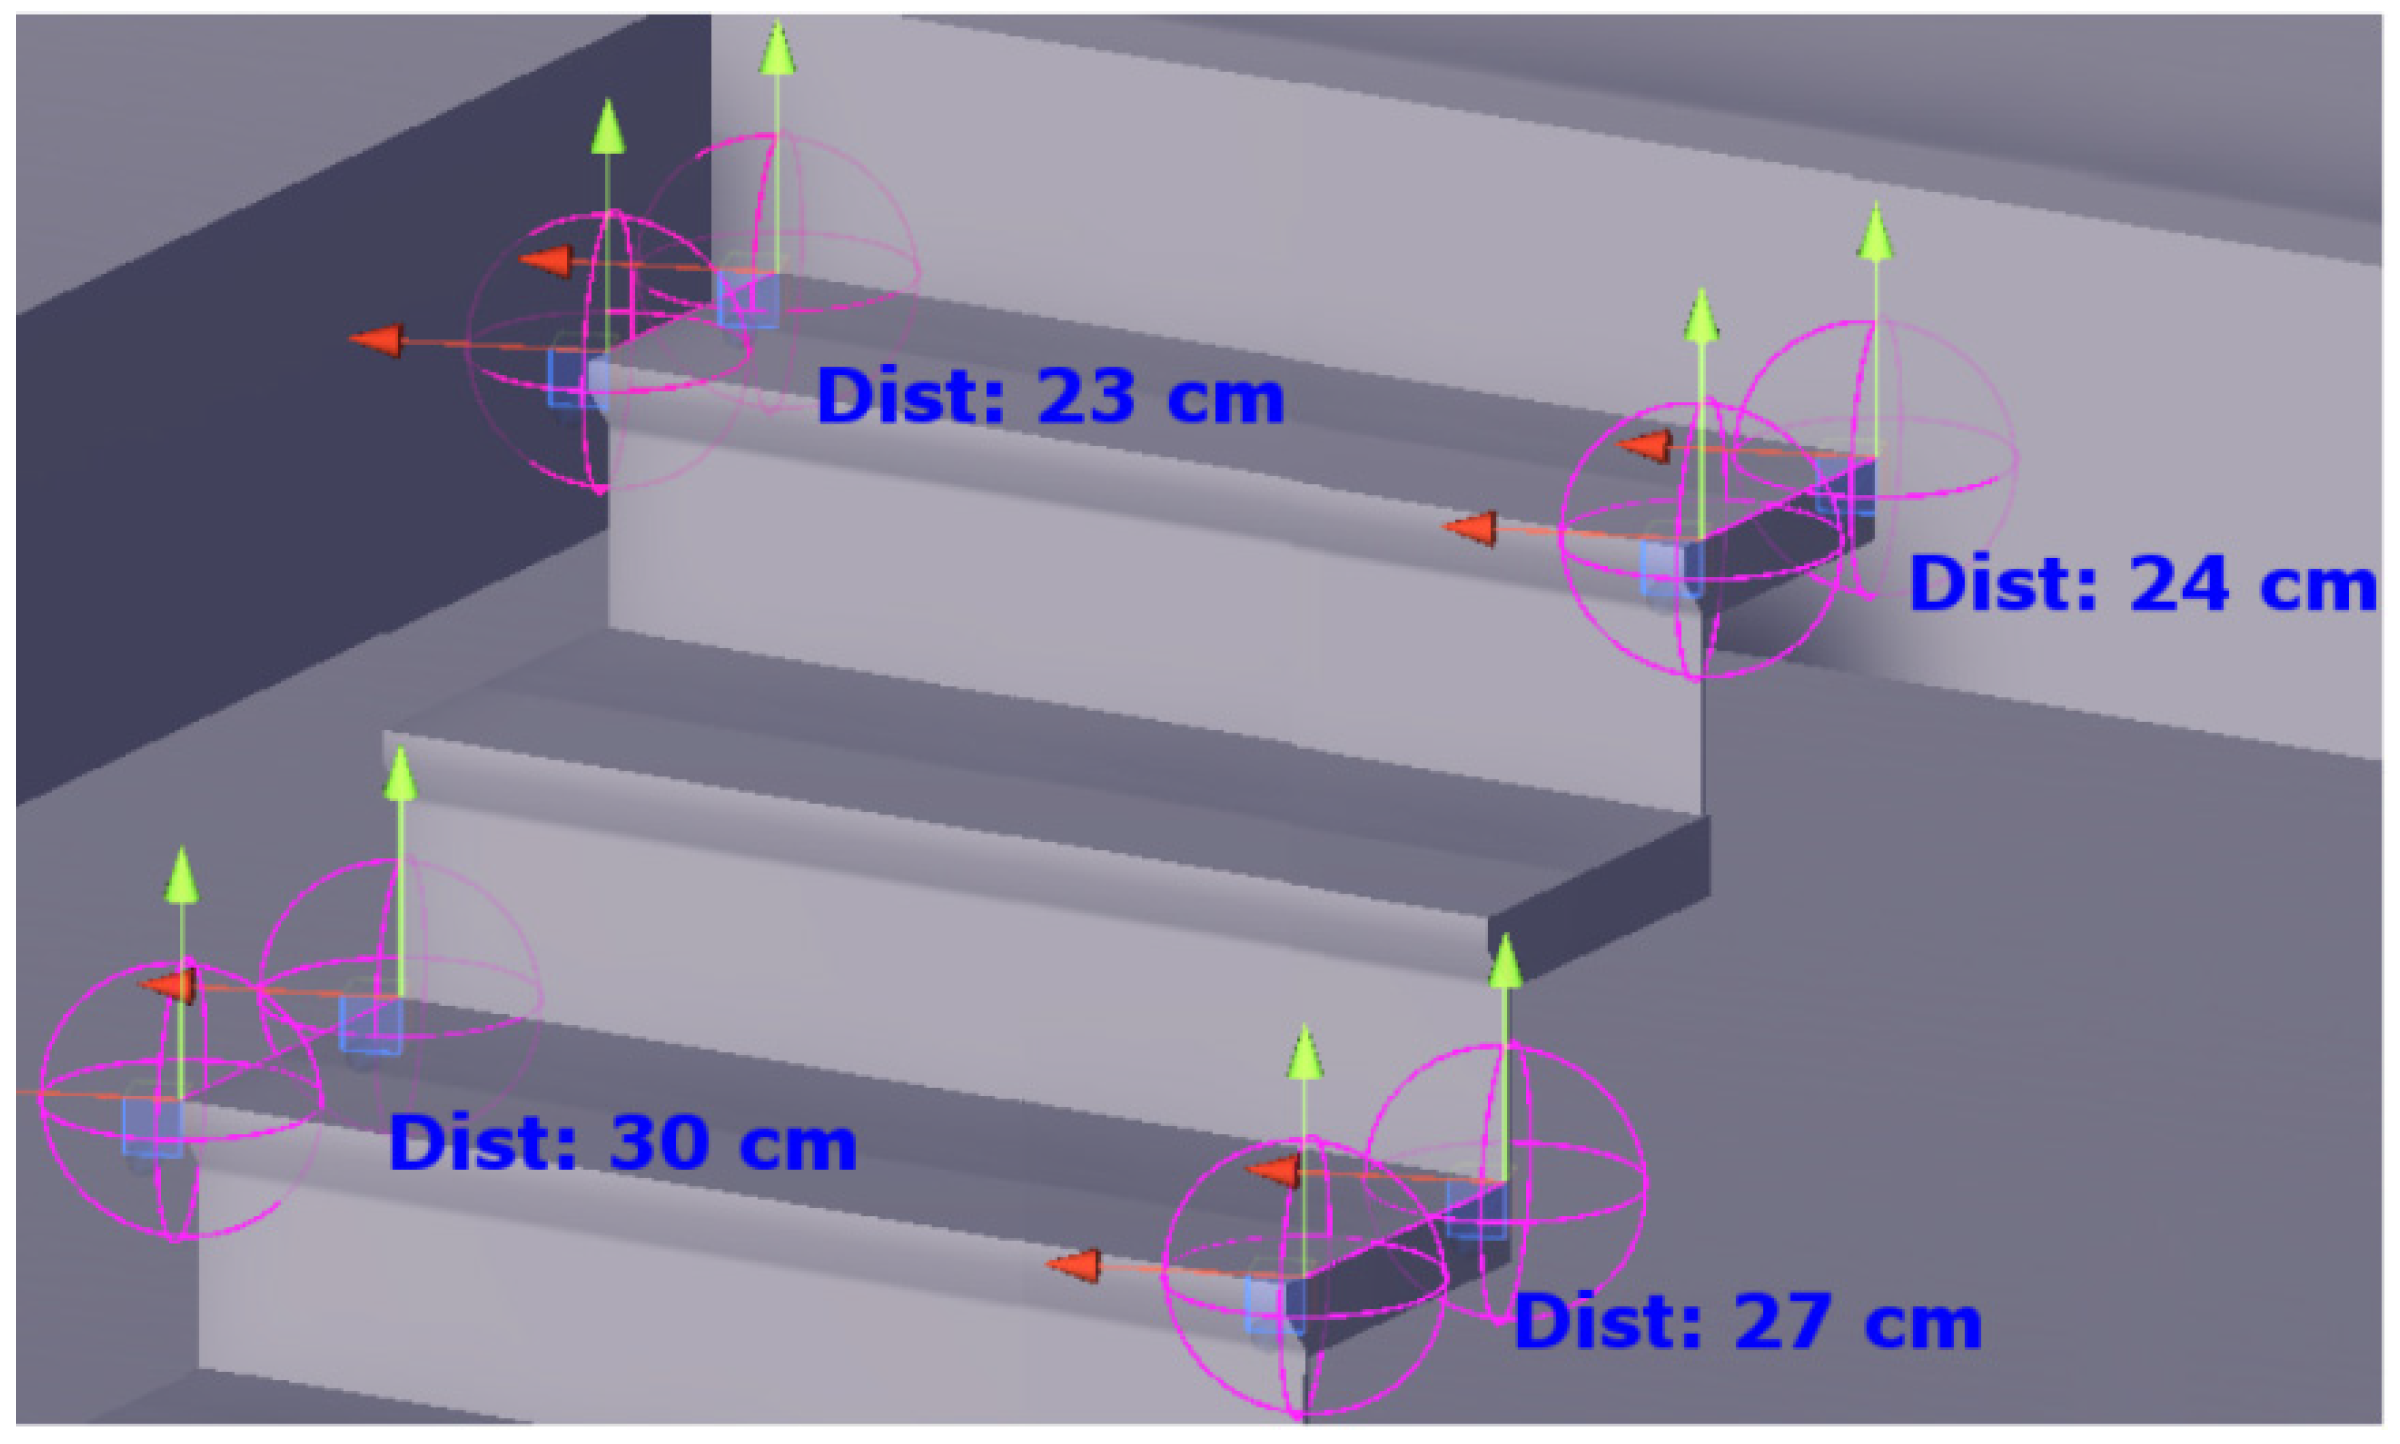
Based on the classification, we can accurately determine the riser height for each point, but the tread depth is still unknown. To identify it, we send horizontally two rays one from a point on a step below to the considered point, and one from the considered point to a point on a step above (Figure 8). As a result, we get two points hitting the risers P1, P2 as well as their normals N1, N2 based on the surface that is hit. By using the opposite direction of these normals the process is repeated and new points P3, P4 are determined. Considering P1-P3 and P2-P4 pairs we can create L1 and L2 lines, respectively. Now, we can calculate the minimal distance to the stair risers. To determine the rest of the distances we identify the closest points P5 and P6 to line segments L1 and L2 formed by the two points that hit each riser. This allows us to calculate tread depth for each classified point. For example, we can use the same approach if we have circular or some irregular stairs, but the tread depth will depend on a pedestrian’s walking direction. The width of stairs can be calculated based on the intersection of L1 and L2 with border edges.

3.5. Spatial Indexing

A spatial index is a data structure that enables the quick execution of spatial queries. This technique is commonly used in spatial databases, but it is required too for crowd simulations [
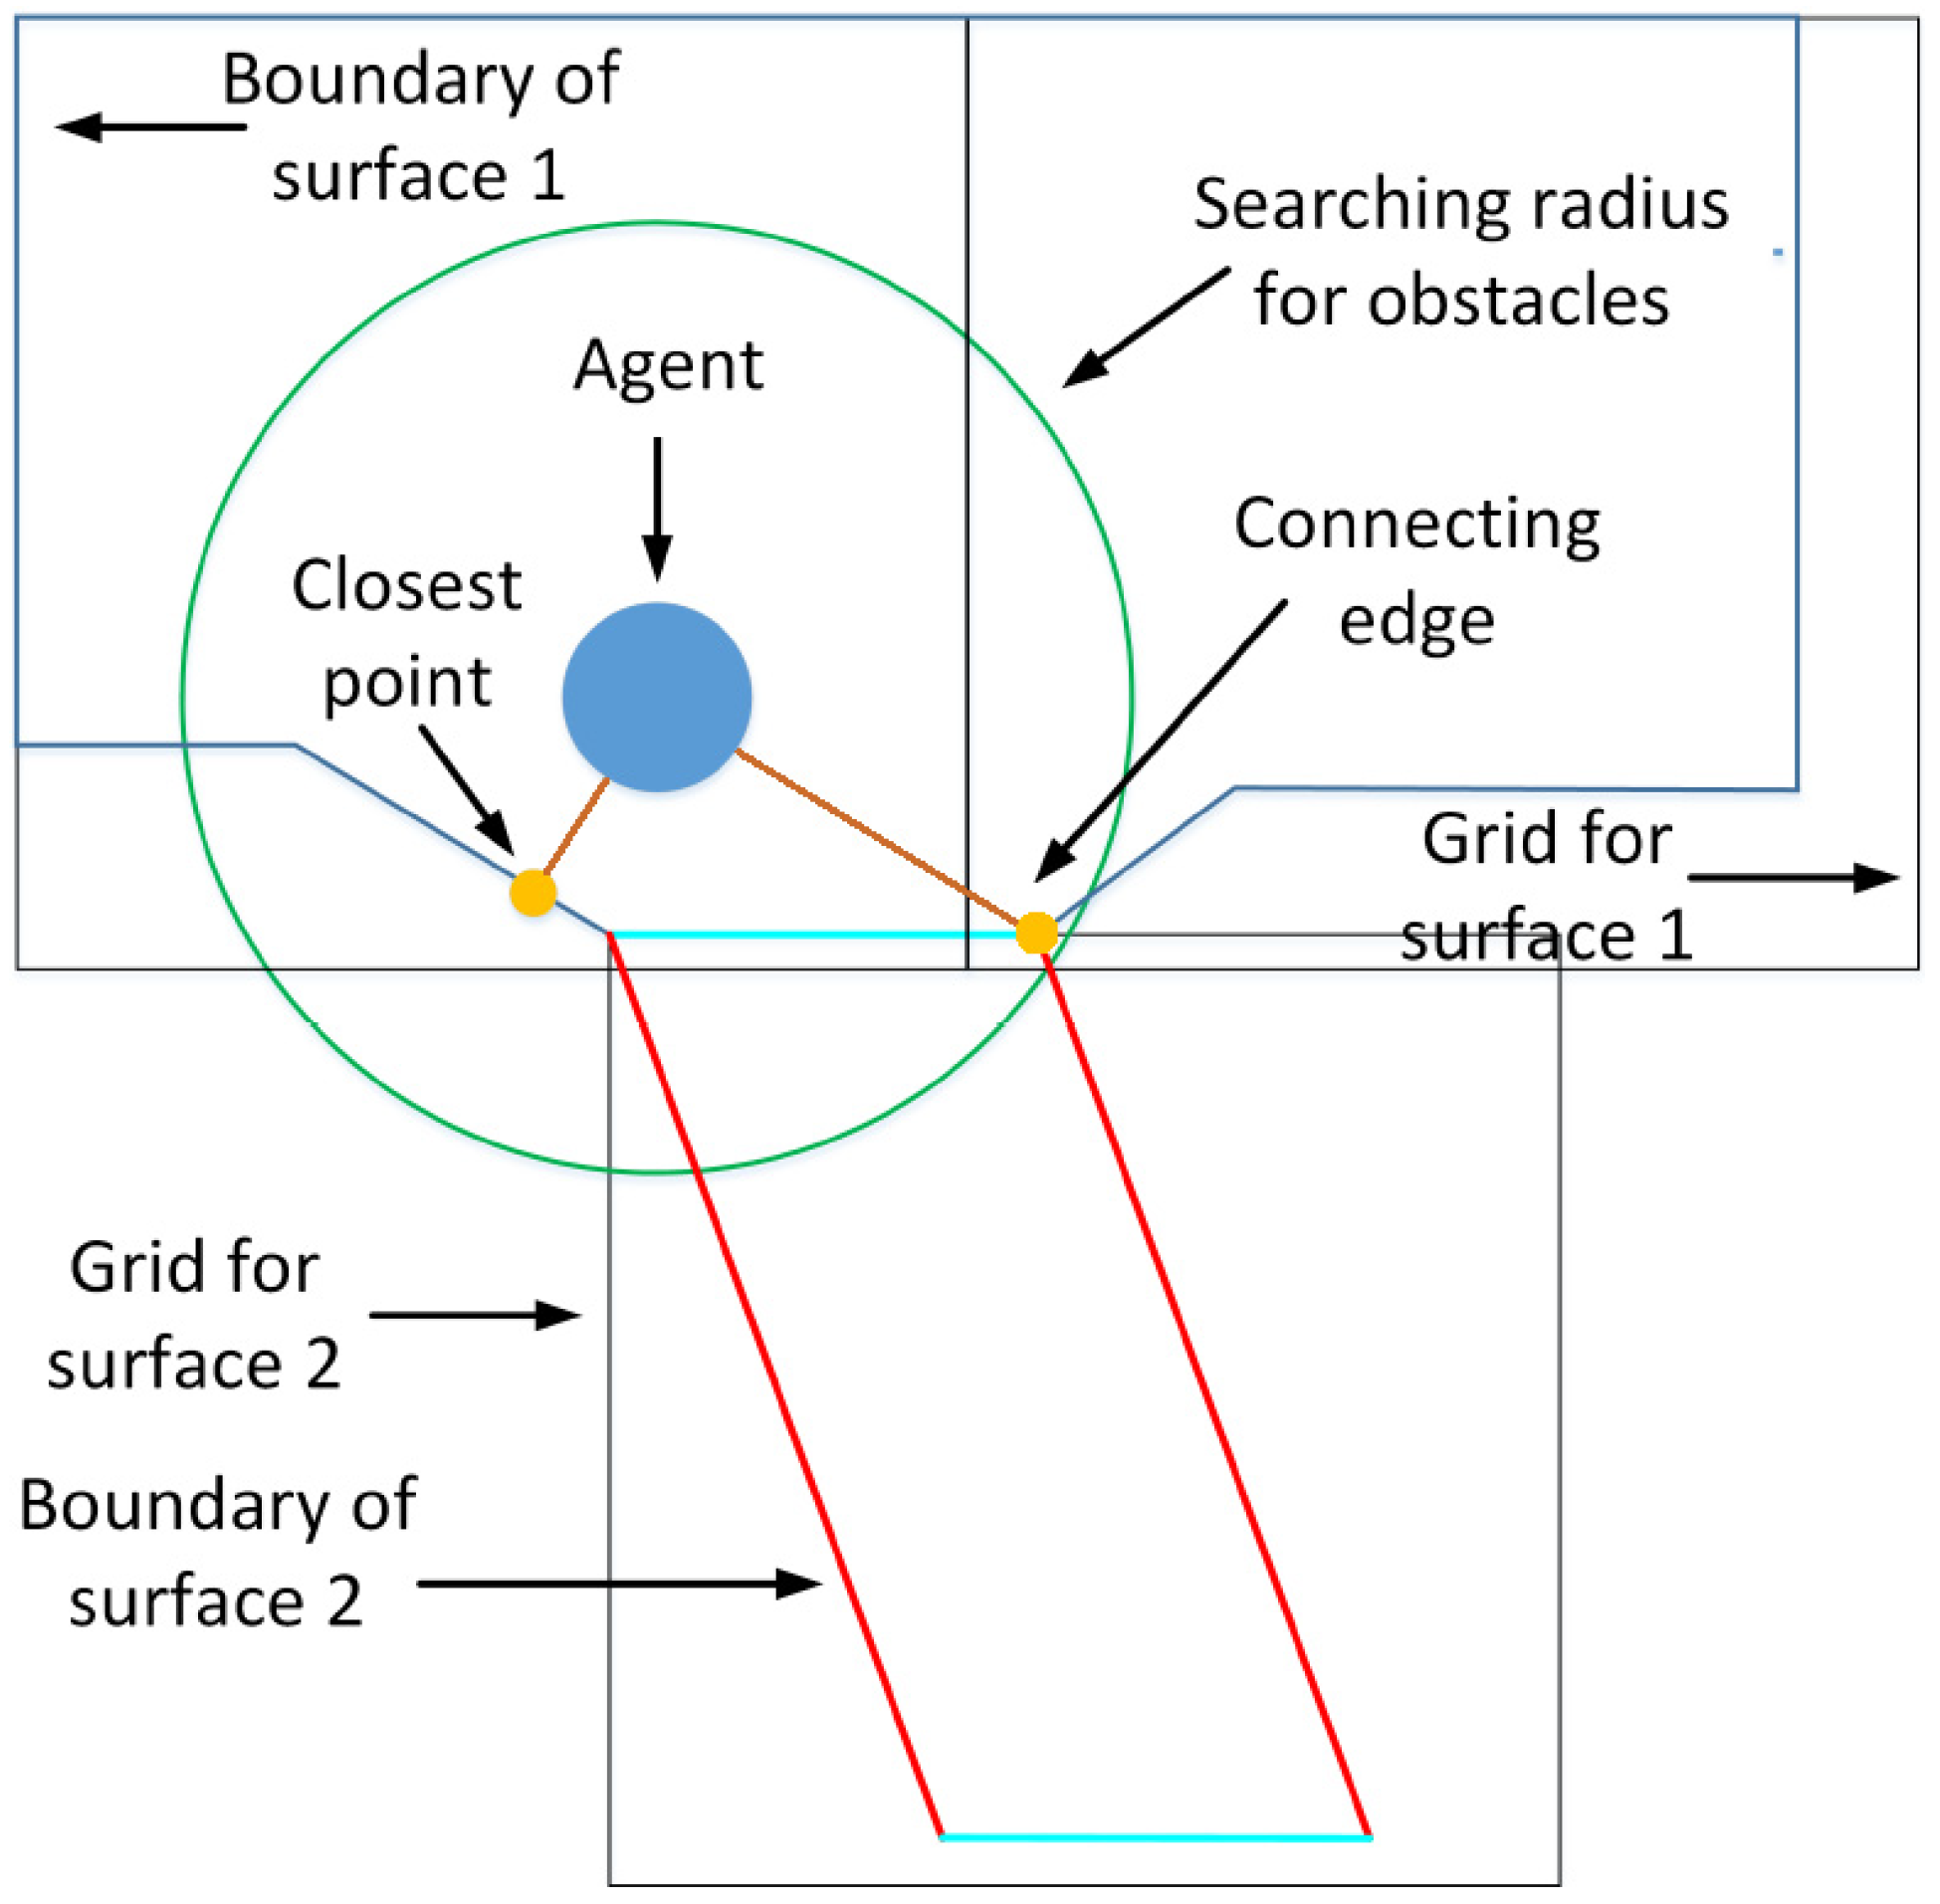
32]. The main goal of using spatial indexing is to bypass a sequential scan of all objects (e.g., border edges and agents) and only check objects in pedestrian’s proximity to calculate the impact. There are many types of indexing, which support using partitioned search trees such as quad-trees, k-d trees, radix trees, R-trees, and so on. For pedestrian dynamics, searching radiuses are consistent which can indicate that uniform size partitioning should be more performant. As a result, we utilise grid-based spatial indexing (https://github.com/bartofzo/SuperGrid2D, accessed on 29 July 2021) allowing us to optimise spatial queries such as finding the closest point on a line segment and identifying agents within a searching radius. The optimal grid size should be two times the size of a searching radius to inspect objects only from a maximum of four cells (Figure 9). At the same time, we can perform queries such as the visibility of the next route point, check if an agent is within a space (i.e., using point in polygon techniques) and check intersections between lines. Objects can also be divided into static (e.g., boundary edges) and dynamic (e.g., pedestrians’ position), enabling quicker execution of queries related to static objects due to using arrays instead of lists. If objects are organised in 3D space, octrees can be used (https://github.com/Nition/UnityOctree, accessed on 29 July 2021). For example, the user can decide to use an octree to keep the positions of pedestrians, while spaces are still stored in 2D.

3.6. Crow Simulation

The most known pedestrian models are based on social forces [33,34] which can recreate certain phenomena such as queue formation and arching, shock waves and bottleneck effect [35,36]. The model integrates into pedestrians’ movements the self-driven force f i , the forces by other pedestrians f i j , and f i o that represents the force by obstacles such as walls, pillars, furniture, etc. The total force f i applied on a pedestrian can be formulated as Equation (1).
f i = v i d e s v i τ + i j f i j + i o f o
Based on this social force model we need to identify several parameters that we will use during simulations. Thus, parameters that correspond to the largest searching radius for other pedestrians in pedestrian’s proximity, maximum distance to obstacles that have a meaningful impact on pedestrians, and minimal width between obstacles that pedestrians can go through. For the first two parameters, we consider Equation (2) which checks whether the position would change significantly (i.e., we use the significance of 95%) within one frame if all pedestrians and obstacles or a limited number of them are considered based on specific searching radiuses. For a delta time of 0.05 s, we identified that we should use 1.25 and 1.05 m to search for pedestrians and obstacles, respectively. To identify the minimal width that pedestrians can pass through, we used two objects and change the gap between them identifying a distance of 1.1 m that is possible. This value is used to create the second navigation mesh that is considered as a network to find a path between points and make sure that an agent will not get stuck somewhere. For evacuation purposes, this aspect was investigated and a social force model for narrow exits was proposed [37].
A b s ( p o s D e v . a l l p o s D e v . l i m i t e d ) > c . d T i m e × 0 : 025
Regarding stairs, an equation capturing the relationship between the walking speed on stairs and the stairs’ characteristics was suggested [38]. Equation (3) takes into account tread-depth T and riser-height R, in centimetres, to calculate the vertical speed of pedestrians v v in meters per minute. The horizontal speed can be simply determined by dividing the vertical speed by the tangent between riser and tread. In this way, the impact of walking on stairs is determined and applied to pedestrians’ horizontal speed.
v v = 0.253 R 0.305 T + 23.57
To perform a pedestrian simulation all discussed aspects should be integrated. Algorithm 2 shows all the steps performed in a fixed time frame for all pedestrians in the Unity game engine. We present the algorithm as having 8 components for easier explanation. The first part is to calculate the forces that impact the speed of pedestrians, where pedestrians and border edges from other connected surfaces are considered if a pedestrian is nearby those surfaces. After that, the impact of waking on stairs is calculated. The identification of a new pedestrian position is determined. Based on the previous and next position, we check if a connecting edge is intersected to change the pedestrian’s surface. If walking on a sloped surface, the vertical position is updated. The identification of a visible goal ahead on the path is determined, and direction towards it is calculated. For the path following we use the approach suggested by Reynolds [39]. Last but not least, the next direction of a pedestrian is determined and all parameters are updated for the next iteration.
Algorithm 2 Pedestrian Simulation
Input: Pedestrians, surfaces, gridPed, gridBorders, constants (c)
Output: Update pedestrian parameters
f o r   e a c h   p e d   i n   p e d e s t r i a n s   l o o p
Calculate impact force
f s d = S e l f D r i v e n F o r c e ( p e d )
f i j = P e d I m p a c t ( p e d ,   P e d e s t r i a n s N e a r b y ( p e d . p o s ,   g r i d P e d ,   c . p e d R a d i u s ) )
f i o = O b s I m p a c t ( p e d ,   E d g e s N e a r b y ( p e d . p o s , g r i d B o r d e r s ,   c . o b s R a d i u s ) )
f i = f s d + f i j + f o
v e l D e v = p e d . v e l D e v + f i c . d T i m e
v h = L i m i t i n g S p e e d ( v e l D e v ,   p e d . m a x S p e e d )
Stairs surface impact
i f   p e d . s u r f . t y p e = = s l o p e d   t h e n
   i f   p e d . c e l l . t y p e = = s t a i r   t h e n
    v h = S t a i r I m p a c t ( p e d . c e l l )
Identify new pedestrian horizontal position
p o s D e v = v h c . d T i m e
p e d N e w P o s . x = p e d . p o s . x + p o s D e v . x
p e d N e w P o s . y = p e d . p o s . y + p o s D e v . y
Update pedestrian surface
c o n n e c t i n g E d g e = I n t e r s e c t C o n n e c t i n g E d g e ( p e d , p e d N e w P o s )
i f   c o n n e c t i n g E d g e   ! = n u l l   t h e n
   p e d . s u r f = G e t S u r f a c e ( p e d . s u r f I d ,   c o n n e c t i n g E d g e )  
p e d . p o s = p e d N e w P o s
s u r f = s u r f a c e s [ p e d . s u r f I d ]
Update pedestrian vertical position
i f   p e d . s u r f . t y p e = = s l o p e d   t h e n
   p e d . c e l l = G e t C e l l ( s u r f ,   p e d . p o s )
   p e d . p o s . z = c e l l . z
Follow path
p e d . g o a l = G e t N e x t G o a l ( p e d . p o s ,   p e d . g o a l )
p e d . d i r = G e t D i r e c t i o n ( p e d . g o a l ,   p e d . p o s )
e n d   l o o p
Update pedestrians’ positions
U p d a t e P a r a m e t e r s ( g r i d P e d ,   p e d e s t r i a n s )
S e l f D r i v e n F o r c e ( p e d ) : calculating the self-driven force of a pedestrian.
P e d I m p a c t ( p e d ,   p e d e s t r i a n s ) : calculating the impact of other pedestrians on the pedestrian under consideration.
O b s I m p a c t ( p e d ,   e d g e s ) : calculating the impact of an obstacle on a pedestrian.
L i m i t S p e e d ( v e l D e v ,   m a x S p e e d ) : limiting pedestrian’s velocity to its maximum speed.
S t a i r I m p a c t ( c e l l ) : calculating stair’s impact.
I n t e r s e c t C o n n e c t i n g E d g e ( s u r f I d , p e d N e w P o s ): check if a connecting edge is intersected to change a surface.
G e t S u r f a c e ( s u r f I d ,   e d g e ) : changing surface of a pedestrian.
G e t C e l l ( s u r f ,   p e d . p o s ) :   identifying a cell where a pedestrian is positioned, and its properties such as elevation and slope.
G e t N e x t G o a l ( p o s ,   g o a l ) : identifying the next visible goal to move towards.
G e t D i r e c t i o n ( g o a l ,   p o s ) : get normalised direction for a pedestrian.
U p d a t e P a r a m e t e r s ( p e d e s t r i a n s ) :   updating pedestrian positions in the grid for a new iteration.

4. Experiments

As we mentioned earlier, we would like to perform some further analysis over the extracted border edges assessing their accuracy. Additionally, we will use the surface subdivision algorithm to identify flat and sloped surfaces as well as other features that we have explored so far.
To test the accuracy of the extracted border edges the closest distance to walls is determined. This process is not straightforward, as their no way to identify the closest distance to an object without casting many rays. Instead of doing this a simplified way is proposed. Thus, the closest point P1 from a pedestrian to the identified border edges is determined. A ray is after that cast from the pedestrian towards the closest point hitting a wall. The ray casting result is a point P2 and a normal of the surface that is hit. Considering the perpendicular direction to that normal, which should match with the wall’s surface in case of being flat, a new point P3 with 1cm offset is created and used as a direction for a new ray casting. The idea is to find a new point on the wall’s surface with the same normal in order to create a line. Considering the distance to the line the closest actual point P4 is determined, which is also confirmed by casting an additional ray towards it (Figure 10). In case of a mismatch, the solution is not taken into account.
After setting up the method for the identification of the actual distance to a wall. A simulation with 1000 agents is performed in an environment of 100 × 100 m. The setup is presented in Figure 11, where all pedestrians are walking towards one goal and simultaneously distances to walls are being calculated.
To assess the accuracy of border edges we also change the voxel size that is required to create a navigable mesh, which we explained in Section 3.1. The tested range is between 1 and 5 cm for the voxel size, in which case 1 cm is the minimum possible value that the system allows us to set up. For the pedestrian’s radius, we use 20 cm. Figure 12 shows an average difference between the actual distance to walls and one that we can calculate from the identified border edges enlarged by the pedestrian’s radius. As expected with the use of smaller voxel sizes, we have more accurate border edges. However, the difference takes always a positive value, which means that the navigation mesh and border edges that we identified are shifted outbound for around 1/2 voxel size. Moreover, the average distance difference increases by using larger voxels. Therefore, this should be considered in the calculation of the distance to obstacles. Another parameter investigated is the number of border edges that we obtain, as expected, it increases with smaller voxel sizes. Therefore, the voxel size used for the generation of navigation mesh is 2 cm, as it gives a reasonable balance between accuracy and the number of edges.
As a case study area, we use two 3D models representing complex built environments located at the UNSW campus (Figure 13). To start a simulation the first step is to extract space boundaries and subdivide the built environment into spaces. Table 1 shows some of the characteristics identified for each building. Thus, we measured the time needed to generate navigation mesh and extract the boundaries for each space. We can conclude that both times are very small to run a simulation. In terms of spaces, flat spaces were fewer compared to spaces with sloped surfaces. Boundaries were reduced significantly after merging the ones that belong to the same wall surface and being inline. Regarding stairs, we identified all stairs correctly. The slope varied for each stair within the buildings.
After extracting all necessary spatial information, we can run a simulation (Figure 14). We can successfully run a simulation of 500 agents considering 30 frames per second, which is enough to perceive the simulation as continuous. The simulation is run on a single thread using a computer with Intel Core i7-6600 CPU @ 2.6 GHz. Simulations in 2D and 3D can be seen as a short video on the internet (https://www.youtube.com/watch?v=_exBdySKwYI, accessed on 29 July 2021).

5. Conclusions and Future Work

In this paper, we examine the use of navigation mesh provided by the Unity game engine for crowd dynamics. The investigated approach goes through several steps including the creation of a navigation mesh, space subdivision, border edges extraction, heightmap identification, stairs classification and parametrisation, spatial indexing and pedestrian simulation. The approach allows to instantly use 3D models to run pedestrian simulations without the need for any manual work related to geometries and semantics. Additional advantages of the proposed approach are the accurate capturing of people walkable areas as well as the time needed for its environmental abstraction to run a simulation. A social force model is utilised to test the approach and simulate the interactions between pedestrians and an environment. As the solution is able to extract all the required geometry information, it can be used in any crowd simulator.
Our experiments clearly reveal that the abstraction of needed spatial information from 3D models is very quick. This indicates that the process to bring a 3D model into a simulator can be fully automated and reduce the pre-processing time significantly. As the initially extracted border edges are segmented, we merge those that are inline and belonging to the same object’s surface. In this way, the solution is adjusted to the need of the social force model and obstacles avoidance. By reducing the number of edges we can guarantee that the time needed to calculate repulsive forces should be smaller than using the initial navigation mesh. Additionally, our approach does not require keeping triangles representing the navigation mesh due to the subdivision that we perform.
Few aspects should be further investigated to fully utilise the proposed solution such as parametrisation of more complex types of stairs as well as different space subdivisions to respond to a wide range of navigation requirements.

Author Contributions

Conceptualization, M.A.; Formal analysis, S.Z.; Investigation, D.J.H.; Methodology, M.A. and S.Z.; Software, M.A.; Supervision, S.Z.; Visualization, M.A.; Writing–review & editing, D.J.H. All authors have read and agreed to the published version of the manuscript.

Funding

This research was funded by Leidos, Australia and the University of New South Wales (UNSW Sydney), School of Built Environment.

Data Availability Statement

The data presented in this study are available on request from the corresponding author.

Conflicts of Interest

The authors declare no conflict of interest.

References

  1. Sagun, A.; Anumba, C.J.; Bouchlaghem, D. Designing buildings to cope with emergencies: Findings from case studies on exit preferences. Buildings 2013, 3, 442–461. [Google Scholar] [CrossRef] [Green Version]
  2. Aleksandrov, M.; Rajabifard, A.; Kalantari, M.; Lovreglio, R.; González, V.A. People Choice Modelling for Evacuation of Tall Buildings. Fire Technol. 2018, 54, 1171–1193. [Google Scholar] [CrossRef]
  3. Johnson, A.; Zheng, S.; Nakano, A.; Schierle, G.; Choi, J.-H. Adaptive kinetic architecture and collective behavior: A dynamic analysis for emergency evacuation. Buildings 2019, 9, 44. [Google Scholar] [CrossRef] [Green Version]
  4. Kuligowski, E.D. Computer evacuation models for buildings. In SFPE Handbook of Fire Protection Engineering; Springer: Berlin, Germany, 2016; pp. 2152–2180. [Google Scholar]
  5. Ronchi, E.; Nilsson, D. Fire evacuation in high-rise buildings: A review of human behaviour and modelling research. Fire Sci. Rev. 2013, 2, 1–21. [Google Scholar] [CrossRef] [Green Version]
  6. Gorte, B.; Aleksandrov, M.; Zlatanova, S. Towards egress modelling in voxel building models. ISPRS Ann. Photogramm. Remote Sens. Spat. Inf. Sci. 2019, 4, 43–47. [Google Scholar] [CrossRef] [Green Version]
  7. Li, F.; Zlatanova, S.; Koopman, M.; Bai, X.; Diakité, A. Universal path planning for an indoor drone. Autom. Constr. 2018, 95, 275–283. [Google Scholar] [CrossRef]
  8. Chooramun, N.; Lawrence, P.J.; Galea, E.R. An agent based evacuation model utilising hybrid space discretisation. Saf. Sci. 2012, 50, 1685–1694. [Google Scholar] [CrossRef]
  9. Liu, Y.; Lyu, L. Diversified Crowd Evacuation Method in Large Public Places. IEEE Access 2019, 7, 144874–144884. [Google Scholar] [CrossRef]
  10. Zhang, L.; Wang, Y.; Shi, H.; Zhang, L. Modeling and analyzing 3D complex building interiors for effective evacuation simulations. Fire Saf. J. 2012, 53, 1–12. [Google Scholar] [CrossRef]
  11. Zheng, X.; Zhong, T.; Liu, M. Modeling crowd evacuation of a building based on seven methodological approaches. Build. Environ. 2009, 44, 437–445. [Google Scholar] [CrossRef]
  12. Staats, B.R.; Diakité, A.A.; Voûte, R.L.; Zlatanova, S. Automatic generation of indoor navigable space using a point cloud and its scanner trajectory. ISPRS Ann. Photogramm. Remote Sens. Spat. Inf. Sci. 2017, 4, 393–400. [Google Scholar] [CrossRef] [Green Version]
  13. Liu, L.; Li, B.; Zlatanova, S.; van Oosterom, P. Indoor navigation supported by the Industry Foundation Classes (IFC): A survey. Autom. Constr. 2021, 121, 103436. [Google Scholar] [CrossRef]
  14. Xu, M.; Wei, S.; Zlatanova, S.; Zhang, R. Bim-based indoor path planning considering obstacles. ISPRS Ann. Photogramm. Remote Sens. Spat. Inf. Sci. 2017, 4. [Google Scholar] [CrossRef] [Green Version]
  15. Snook, G. Simplified 3D movement and pathfinding using navigation meshes. Game Programm. Gems 2000, 1, 288–304. [Google Scholar]
  16. Kallmann, M. Navigation queries from triangular meshes. In Proceedings of the Third International Conference on Motion in Games, Zeist, The Netherlands, 14–16 November 2010; pp. 230–241. [Google Scholar]
  17. Barrera, R.; Kyaw, A.S.; Peters, C.; Swe, T.N. Unity AI Game Programming; Packt Publishing Ltd.: Birmingham, UK, 2015. [Google Scholar]
  18. Kountouriotis, V.I.; Paterakis, M.; Thomopoulos, S.C.A. iCrowd: Agent-based behavior modeling and crowd simulator. In Proceedings of the Signal Processing, Sensor/Information Fusion, and Target Recognition XXV, Baltimore, MD, USA, 18–20 April 2016; SPIE: Bellingham, WA, USA, 2016; Volume 9842. [Google Scholar]
  19. Zlatanova, S.; Stoter, J.; Isikdag, U. Standards for exchange and storage of 3D information: Challenges and opportunities for emergency response. In Proceedings of the 4th International Conference on Cartography & GIS, Albena, Bulgaria, 18–22 June 2012; Volume 2, pp. 17–28. [Google Scholar]
  20. Gayle, R.; Sud, A.; Andersen, E.; Guy, S.J.; Lin, M.C.; Manocha, D. Interactive navigation of heterogeneous agents using adaptive roadmaps. IEEE Trans. Vis. Comput. Graph. 2008, 15, 34–48. [Google Scholar] [CrossRef]
  21. Geraerts, R.; Overmars, M.H. The corridor map method: A general framework for real-time high-quality path planning. Comput. Animat. Virtual Worlds 2007, 18, 107–119. [Google Scholar] [CrossRef] [Green Version]
  22. Rabin, S. AI Game Programming Wisdom; Charles River Media, Inc.: Needham Heights, MA, USA, 2014; Volume 4. [Google Scholar]
  23. Kallmann, M.; Bieri, H.; Thalmann, D. Fully dynamic constrained delaunay triangulations. In Geometric Modeling for Scientific Visualization; Springer: Berlin/Heidelberg, Germany, 2004; pp. 241–257. [Google Scholar]
  24. Kallmann, M. Shortest Paths with Arbitrary Clearance from Navigation Meshes. In Proceedings of the 2010 Eurographics/ACM SIGGRAPH Symposium on Computer Animation, Madrid, Spain, 2–4 July 2010; pp. 159–168. [Google Scholar]
  25. Pettre, J.; Laumond, J.-P.; Thalmann, D. A navigation graph for real-time crowd animation on multilayered and uneven terrain. In Proceedings of the First International Workshop on Crowd Simulation (V-CROWDS ’05), Lausanne, Switzerland, 24–25 November 2005; p. 194. [Google Scholar]
  26. Jiang, H.; Xu, W.; Mao, T.; Li, C.; Xia, S.; Wang, Z. Continuum crowd simulation in complex environments. Comput. Graph. 2010, 34, 537–544. [Google Scholar] [CrossRef]
  27. Kristinsson, K.V. Social Navigation in Unity 3D. Master’s Thesis, Reykjavik University, Reykjavik, Iceland, 2015. [Google Scholar]
  28. Diakité, A.A.; Zlatanova, S. Spatial subdivision of complex indoor environments for 3D indoor navigation. Int. J. Geogr. Inf. Sci. 2018, 32, 213–235. [Google Scholar] [CrossRef] [Green Version]
  29. Zlatanova, S.; Liu, L.; Sithole, G.; Zhao, J.; Mortari, F. Space Subdivision for Indoor Applications; GISt Report No. 66; Delft University of Technology: Delft, The Netherlands, 2014. [Google Scholar]
  30. Kuligowski, E.D.; Peacock, R.D.; Reneke, P.A.; Wiess, E.; Hagwood, C.R.; Overholt, K.J.; Elkin, R.P.; Averill, J.D.; Ronchi, E.; Hoskins, B.L. Movement on Stairs during Building Evacuations; NIST Technical Note; NIST: Gaithersburg, MD, USA, 2015; Volume 122. [Google Scholar]
  31. Qu, Y.; Gao, Z.; Xiao, Y.; Li, X. Modeling the pedestrian’s movement and simulating evacuation dynamics on stairs. Saf. Sci. 2014, 70, 189–201. [Google Scholar] [CrossRef]
  32. Othman, N.B.; Luo, L.; Cai, W.; Lees, M. Spatial indexing in agent-based crowd simulation. In Proceedings of the 6th International ICST Conference on Simulation Tools and Techniques, Cannes, France, 5–7 March 2013; pp. 92–100. [Google Scholar]
  33. Helbing, D.; Farkas, I.; Vicsek, T. Simulating dynamical features of escape panic. Nature 2000, 407, 487–490. [Google Scholar] [CrossRef] [Green Version]
  34. Helbing, D.; Molnar, P. Social force model for pedestrian dynamics. Phys. Rev. E 1995, 51, 4282. [Google Scholar] [CrossRef] [PubMed] [Green Version]
  35. Helbing, D.; Buzna, L.; Johansson, A.; Werner, T. Self-organized pedestrian crowd dynamics: Experiments, simulations, and design solutions. Transport. Sci. 2005, 39, 1–24. [Google Scholar] [CrossRef] [Green Version]
  36. Moussaïd, M.; Helbing, D.; Theraulaz, G. How simple rules determine pedestrian behavior and crowd disasters. Proc. Natl. Acad. Sci. USA 2011, 108, 6884–6888. [Google Scholar] [CrossRef] [PubMed] [Green Version]
  37. Haghani, M.; Sarvi, M. Simulating pedestrian flow through narrow exits. Phys. Lett. A 2019, 383, 110–120. [Google Scholar] [CrossRef]
  38. Templer, J. The Staircase: Studies of Hazards, Falls, and Safer Design; MIT Press: Cambridge, MA, USA, 1995; Volume 2. [Google Scholar]
  39. Reynolds, C.W. Steering behaviors for autonomous characters. In Proceedings of the Game Developers Conference, San Jose, CA, USA, 17 March 1999; pp. 763–782. [Google Scholar]
Figure 1. A conceptual model for 3D space abstraction supporting crowd simulations.
Buildings 11 00445 g001
Figure 2. An example of a navigation mesh considering all physical objects in its calculation showed in blue. The grid is showing imaginary lines in white that represent the tessellated chunks.
Buildings 11 00445 g002
Figure 3. Extraction of border and connecting edges. The upper image shows the results after identifying non-repeating line segments. The lower image is showing edges after filtering the wrong line segments circled in red. In cyan connecting edges between spaces are represented, while the rest of the colours are highlighting the other adjacent subdivided spaces.
Buildings 11 00445 g003
Figure 4. Merging inlined border edges. The upper image shows edges coming from triangles that represent spaces’ borders, while the lower image highlights borders after merging the inlined edges.
Buildings 11 00445 g004
Figure 5. Misalignment between navigation mesh, identified spaces and actual stairs at sloped areas.
Buildings 11 00445 g005
Figure 6. Tread depths of several steps using a BIM model. Tread object size is 30 cm, but the actual one can vary in different locations.
Buildings 11 00445 g006
Figure 7. Uniform ray casting and classification of points belonging to stairs. The red colour highlights ray casts that hit stairs, while in yellow ray casts which hit other objects are presented.
Buildings 11 00445 g007
Figure 8. Tread depth identification using a filter shown in black. In white the central point is presented. Two randomly selected points are shown in red. Ray sent to these points are highlighted in yellow identifying P1 and P2 points and their normals N1 and N2. Additional rays sent to risers based on the normals are identifying P3 and P4 points. In pink L1 and L2 lines are presented, which are identified based on 2 points detected for each riser. The shortest distances to P3 and P4, and P5 and P6 points are shown in dark and light green, respectively.
Buildings 11 00445 g008
Figure 9. Using spatial indexing to detect closest boundaries and connecting edges between spaces to an agent.
Buildings 11 00445 g009
Figure 10. Finding the actual distance to a wall.
Buildings 11 00445 g010
Figure 11. Assessing the accuracy of the identified border edges.
Buildings 11 00445 g011
Figure 12. The average difference between the actual and estimated distance to walls, as well as the number of border edges identified for each voxel size.
Buildings 11 00445 g012
Figure 13. Case study buildings.
Buildings 11 00445 g013
Figure 14. Pedestrians randomly assigned to different surfaces.
Buildings 11 00445 g014
Table 1. Characteristics determined for each building.
BuildingGeneration of Navigation Mesh (s)Extraction of Surfaces (s)Flat/Sloped Surfaces (No)Border Edges (No)Merged Border Edges (No)Stairs Slope (°)
1426243/7810,912649131.5 ± 0.53
2211917/605736471534.1 ± 1.47
Publisher’s Note: MDPI stays neutral with regard to jurisdictional claims in published maps and institutional affiliations.

