Article

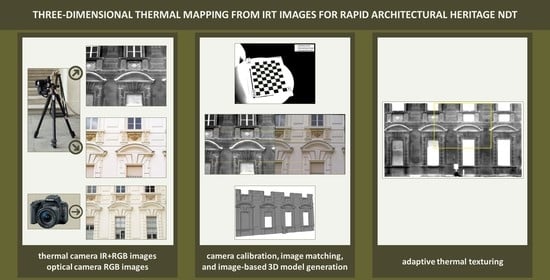
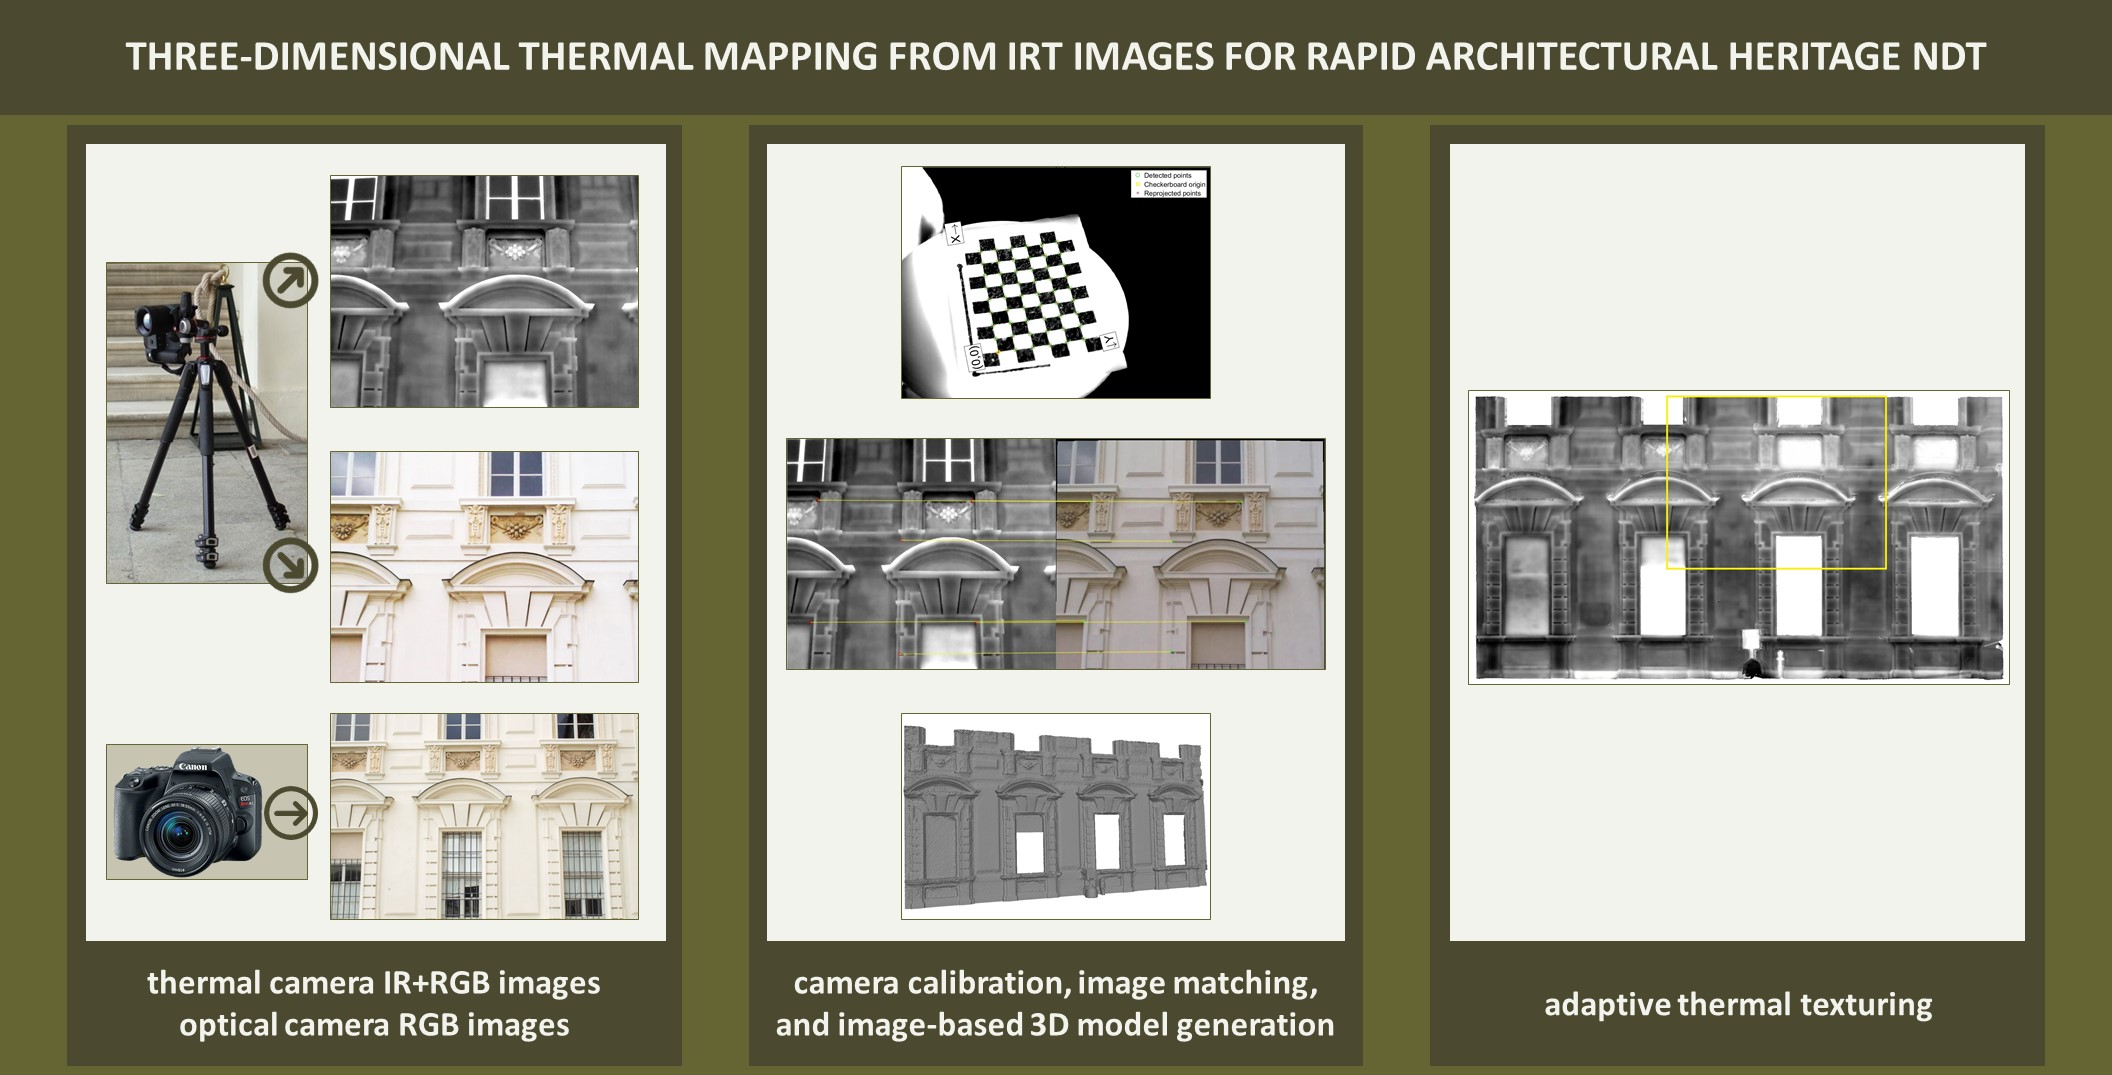
Three-Dimensional Thermal Mapping from IRT Images for Rapid Architectural Heritage NDT

1
Dipartimento di Informatica, Università degli Studi di Torino, Corso Svizzera 185, 10149 Torino, Italy
2
Dipartimento di Architettura e Design, Politecnico di Torino, Viale P.A. Mattioli 39, 10125 Torino, Italy
*
Author to whom correspondence should be addressed.
Buildings 2020, 10(10), 187; https://doi.org/10.3390/buildings10100187
Submission received: 3 October 2020 / Revised: 16 October 2020 / Accepted: 18 October 2020 / Published: 21 October 2020
(This article belongs to the Special Issue Energy Efficiency of Historical Buildings)

Abstract

:
Thermal infrared imaging is fundamental to architectural heritage non-destructive diagnostics. However, thermal sensors’ low spatial resolution allows capturing only very localized phenomena. At the same time, thermal images are commonly collected with independence of geometry, meaning that no measurements can be performed on them. Occasionally, these issues have been solved with various approaches integrating multi-sensor instrumentation, resulting in high costs and computational times. The presented work aims at tackling these problems by proposing a workflow for cost-effective three-dimensional thermographic modeling using a thermal camera and a consumer-grade RGB camera. The discussed approach exploits the RGB spectrum images captured with the optical sensor of the thermal camera and image-based multi-view stereo techniques to reconstruct architectural features’ geometry. The thermal and optical sensors are calibrated employing custom-made low-cost targets. Subsequently, the necessary geometric transformations between undistorted thermal infrared and optical images are calculated to replace them in the photogrammetric scene and map the models with thermal texture. The method’s metric accuracy is evaluated by conducting comparisons with different sensors and the efficiency by assessing how the results can assist the better interpretation of the present thermal phenomena. The conducted application demonstrates the metric and radiometric performance of the proposed approach and the straightforward implementability for thermographic surveys, as well as its usefulness for cost-effective historical building assessments.

Graphical Abstract

1. Introduction and Background

Infrared thermography (IRT) is a well-established close-range sensing technique for historical building diagnostics. IRT is an imaging approach that records the emitted thermal radiation from a surface and enables the analysis of surface temperature patterns, revealing existing anomalies. In other terms, IRT aims to identify surface and subsurface areas of interest—through the observation of local temperature differences—using thermal sensors. Passive IRT is often applied when the measurement of temperature differences is a parameter for evaluating an existing structure’s state of preservation or energy efficiency. The documentation of abnormal temperature distributions on a surface may help detect potential problems or damages by evaluating the surficial temperature changes compared with assigned reference values [1,2]. Recent critical developments in thermal sensor technology, together with the fact that IRT consists a non-invasive and non-distractive testing (NDT) technique, have led to its extensive application on structural surveys of traditional and historical architecture [3,4,5]. Some applications of IRT regarding the investigation of historic buildings include the identification of the distribution of original and replacement materials [6,7,8], the study of the plaster conditions [9,10], the assessment of cracks [11,12], the evaluation of the extent of detachments, material loss-induced features on architectural surfaces, discolorations and deposits [8,13,14], the documentation of moisture [15,16], the identification of hidden defects and subsurface construction [17,18], as well as the evaluation of restoration and consolidation interventions [19]. The thermal data can be integrated with other information concerning the historical materials and their decay inside a heritage geographic information system (HGIS) or heritage building information modeling (HBIM) environment [20,21,22,23,24].
Built heritage thermographic applications are commonly implemented with the independence of geometry in such a way that only the qualitative localization of the thermal phenomena is possible, using two-dimensional (2D) thermograms. However, the importance of geometry in the field of diagnostics of historical structures is high when an accurate quantification of the investigated thermal anomalies is required. In thermographic surveys, the geometric, and subsequently, the topological information is generally neglected for two main reasons: the low spatial resolution and the complexity of required calibration procedures. Thermal infrared three-dimensional (3D) modeling of historic structures has been explored with vastly different approaches during the last two decades of research.

1.1. Related Work

The most frequently applied 3D thermal mapping approach for historical architecture has been the integration of thermal imagery and metric products, collected with separate sensing techniques. This often refers to the co-registration of point clouds (or derivative 3D products) captured by terrestrial laser scanning (TLS)—which contain metric spatial information—and thermograms, and has been considered as the most cost-effective approach, especially when the thermal mapping of a complete façade or historic structure is needed. The estimation of the geometric relation between the metric data and an IRT image (relative position and orientation matrix) is realized through the definition of common features, which allows for the accurate projection of the IRT values on the point cloud to create a thermal texture. The first approaches for thermal texturing were developed on a manual basis, through the visual identification and matching of common points. This method has been implemented by Lerma et al. [16] to assess the state of preservation of a sandstone tomb at the Petra Archaeological Park in Jordan, Spanò et al. [25] to study the surfaces of the Church of the Beata Vergine dei dolori in Villastellone (Italy), Costanzo et al. [26], to detect thermal anomalies and to improve the knowledge on the health state of a masonry building at the St. Augustine Monumental Compound in Cosenza (Italy), Zalama et al. [27] to perform analysis of humidity, microorganisms, and stained-glass window breaks for the Church of Santa Maria in Palencia (Spain), and Mileto et al. [28], to localize stone degradation and humidity at the Castle of Monzón in Huesca (Spain). Manual product registration has the significant drawback that enough feature correspondences may not be visible on the thermal imagery to perform the necessary matching. More advanced approaches have been devised to perform automatic registration by identifying correspondences between features on the 2D IRT images and features on 3D metric products. Lagüela et al. [29] performed line segment detection on IRT images and then classified and intersected the detected horizontal and vertical lines to compute intersection points, corresponding mostly to corners. They used curvature analysis to extract 3D features from a TLS point cloud and computed each image’s orientation with respect to the point cloud through an iterative process using RANdom Sample Consensus (RANSAC) and the collinearity equations. González-Aguilera et al. [30] generated and radiometrically improved range images from a TLS point cloud. Using the Harris operator for feature extraction, and subsequently hierarchical image matching between IRT and range images with constraints based on epipolar geometry, they performed the spatial resection of the thermographic cameras, supported by statistical tests. After the thermographic images’ robust orientation, they obtained a thermographic dense surface model by a pair-wise matching process supported by the semi-global matching technique and applying a projective equation.
Methodologies for simultaneous measurement of thermal and 3D metric data have also been recently developed to facilitate massive and more agile thermographic modeling. Commercial integrated or custom-made multi-sensor instrumentation has been employed in this direction, requiring co-registration between different sensors used during the acquisition. Sensor co-registration parameters consist of the vector of differences in the sensors’ position and the rotation angles between them and are necessary to transform and integrate measurements into the same coordinate system. Alba et al. [31] set up a bi-camera system coupling an AVIO IRT camera and a Nikon RGB camera and used the latter imaging sensor to create a photogrammetric network for multi-view image-based 3D recording, strengthened with additional camera stations. Then the photogrammetric and TLS-produced point clouds were registered, and the thermal intensities were mapped on building models. Borrmann et al. [32] used a pre-calibrated robotic moving system combining an Optris PI 160 IRT camera, a Riegl VZ-400 laser scanner, and a Logitech QuickCam Pro 9000 webcam mounted on a modified VolksBot RT 3 platform to perform simultaneous metric and thermal acquisition. Merchán et al. [33] developed a hybrid scanning system employing a Riegl VZ-400 scanner, a Nikon D90 RGB camera, and a FLIR AX5 thermal camera. The hybrid sensor was calibrated with the help of targets incorporating both optical and thermal reflectance discriminants, distributed over a wide area of the scene. Yang et al. [34] used two iPhone SE smartphones and a FLIR ONE camera for iOS sturdily placed on a tripod. They utilized the Normalized Cross-Correlation (NCC) technique to register the optical images of the IRT camera attached on one smartphone, with the optical images captured with the other smartphone camera, in order to project the thermal images on the 3D model produced with a multi-view stereo-based approach. In general, sensor co-registration that includes thermal cameras is not common due to IRT measurements’ requirements regarding the angle and distance of acquisition [35].
Workflows that make use of a single IRT instrument have been recently considered for the thermographic 3D modeling. González-Aguilera et al. [36] and Dlesk et al. [37] performed image-based modeling directly using thermal images, captured with NEC TH9260 and FLIR E95 IRT cameras respectively, to reconstruct digitally and to inspect architectural surfaces. Other approaches have taken advantage of both the optical and thermal sensors integrated into the IRT cameras. Macher et al. [38] used the RGB images from an IRT instrument to create a point cloud of an internal space and superimposed the thermal images on the RGB images for the purpose of coloring the point cloud with thermal data. Then they used the thermal product to transfer the information of the thermal intensities to a laser-scanned point cloud with BIM enrichment purposes. Previtalli et al. [39] developed a hybrid approach to compute photogrammetrically the orientation of both thermal and RGB images together in a combined bundle adjustment, improving the reconstruction accuracies and mapped the infrared images on 3D models of building façades. More complex thermal modeling methodologies have included the reconstruction of 3D point clouds from RGB images and precise registration of the thermal image sequences using geometric constraints and feature matching. Hoegner and Stilla [40] included a priori knowledge of the existing mesh into the estimation of the camera orientations and then extracted the thermal 3D point cloud directly from the TIR images. Dino et al. [41] used a cascade method to identify potential matches between TIR and RGB images and removed those incorrect using a RANSAC version. After a multi-view image-based reconstruction, they performed plane fitting to define the reconstructed walls’ geometry to apply the thermal texture. Finally, Lin et al. [42] used independent datasets of RGB and TIR images to generate point clouds. They utilized the Fast Point Feature Histogram feature as initial correspondence between the point clouds, reciprocity test to find the mutual nearest correspondences, tuple test to verify the compatibility of the correspondences to remove the outliers from the correspondence set, and Fast Global Registration (FGR) and RANSAC to estimate the coarse alignment. After having determined the best IRT-RGB image pairs based on the lowest Euclidean distance, they used radiation-invariant feature transform (RIFT), normalized barycentric coordinate system (NBCS), and RANSAC to extract reliable matches. Afterward, they performed a fine registration by mono-plotting of the RGB images, followed by image resection of the thermal images. Finally, they proposed a global image pose refinement approach to minimize temperature disagreements from different images of the same points eliminating blur effects [42].

1.2. Research Aims and Paper Structure

The research presented in this paper takes into consideration the advantages and disadvantages of the approaches described in Section 1.1 to design and implement a cost-effective workflow for 3D temperature mapping, easily replicable for various case studies of heritage value that can assist rapid non-destructive assessments. The proposed workflow aims to tackle the problems induced to 3D temperature mapping by the technical characteristics of thermal sensors and the restrictions of thermographic acquisition, employing: (a) acquisition of datasets appropriate for photogrammetric digitization purposes, (b) calibration of thermal and optical sensors, (c) image-based recording techniques, and (d) adaptive texture mapping. The methodology is metrically evaluated using different sensors and strategies. Furthermore, the authors are qualitatively accessing the workflow’s capacity to produce accurate records of the thermal anomalies towards rapid non-destructive testing of architectural heritage stock.
The structure for the rest of the paper is as follows. In Section 2, the methodology is illustrated. Afterward, the experimental results are presented in Section 3 and validated in Section 4. Section 5 is left for conclusions and outlook.

2. Materials and Methods
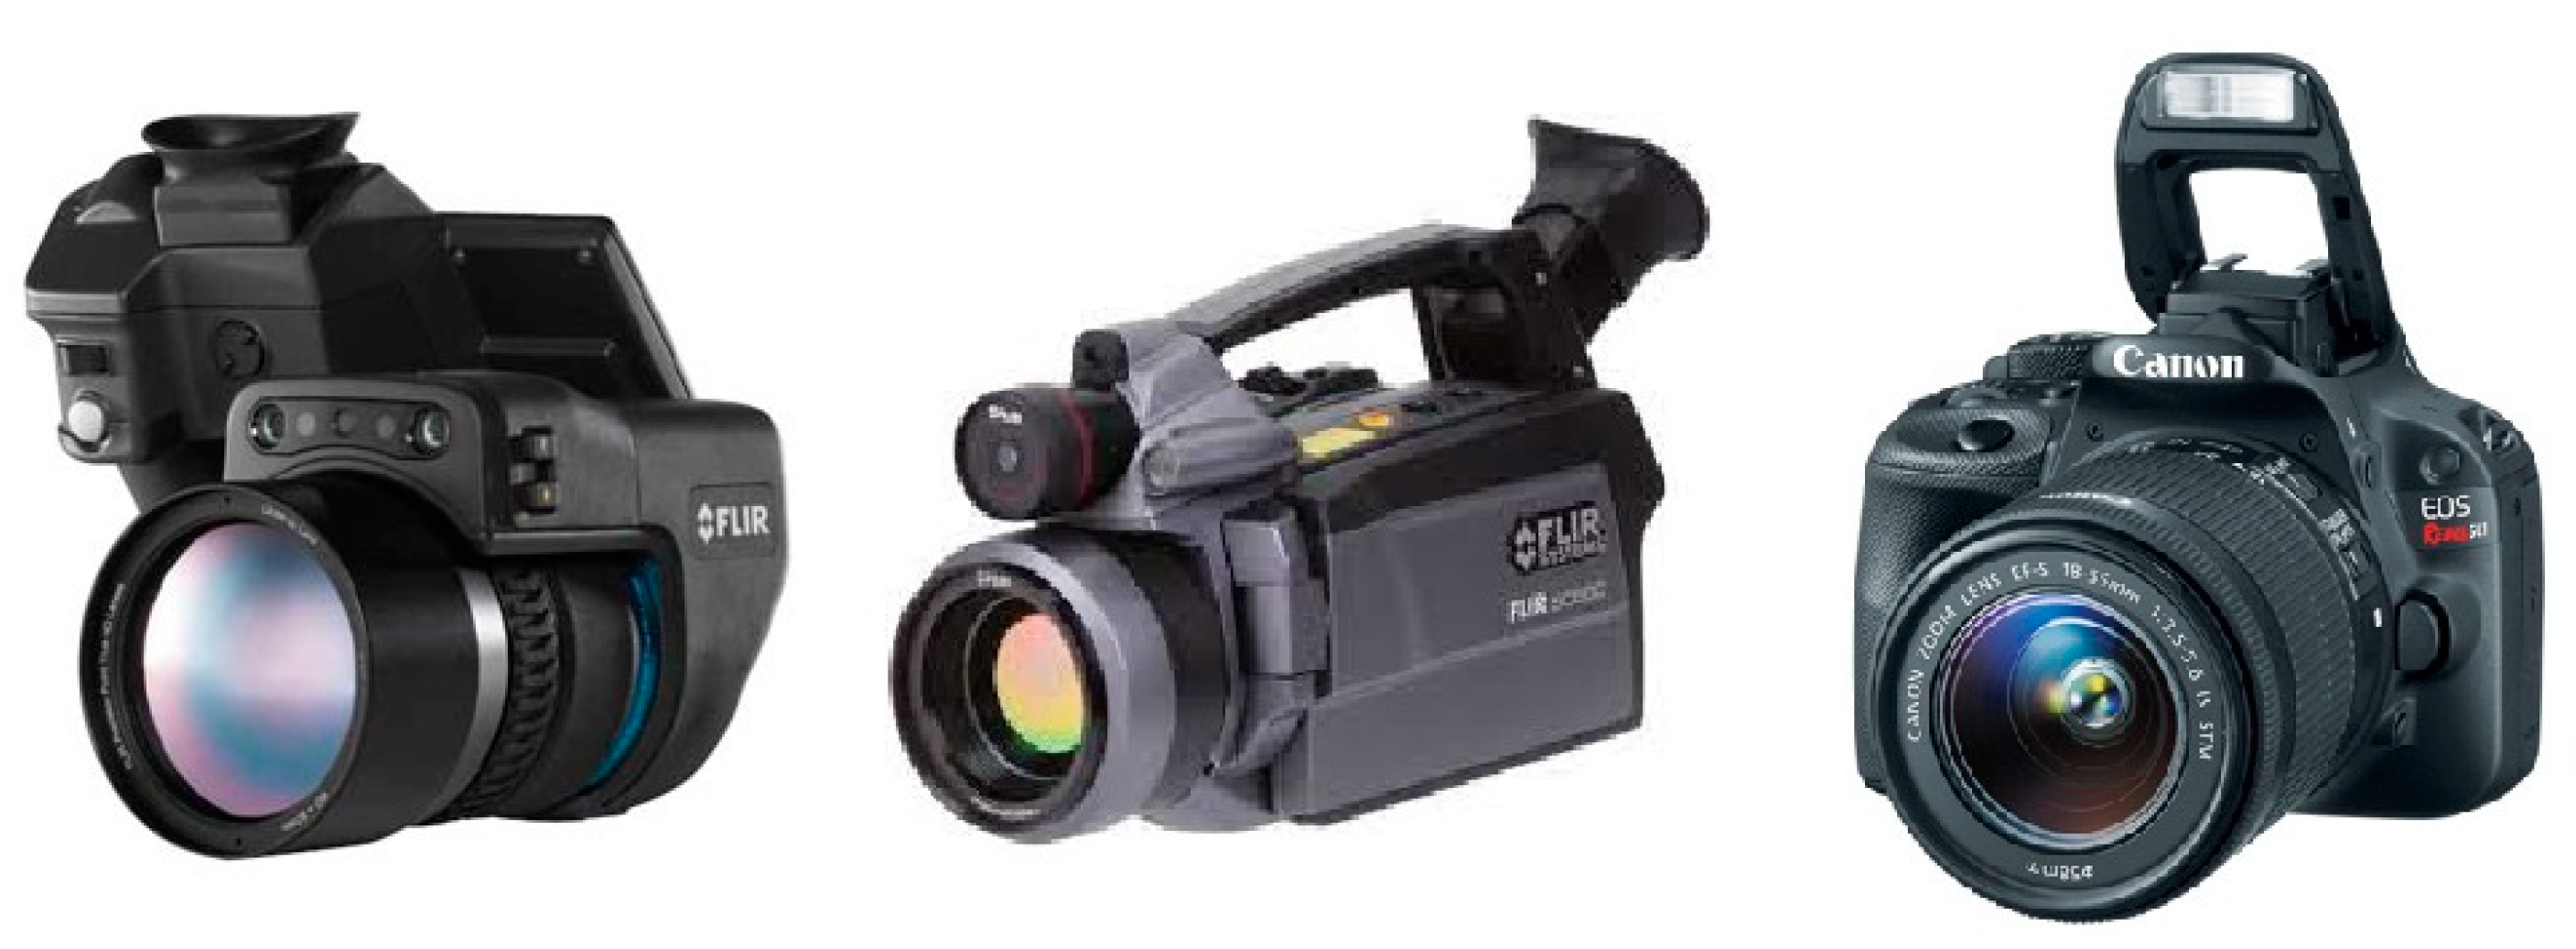
This section presents the methodology followed to overcome the significant limitations that occur from the photogrammetric processing of IRT imagery and registration of metric and thermal products. The implemented thermographic modeling workflow is briefly sketched in Figure 1.

2.1. Materials

The principal instrument used in this paper was a FLIR (FLIR Systems Inc., Wilsonville, OR, USA) T1030sc high-definition thermographic camera with an uncooled 1024 × 768 Long-Wavelength Infrared (LWIR) detector array, focal length 36 mm (28° × 21° FOV), pixel size 17 μm, spatial resolution 1024 × 768 pixels, measurement accuracy was ±1 °C, thermal sensitivity/noise equivalent temperature difference (NETD) was 20 mK at +30 °C, and the spectral range was 7.5–14 μm (Figure 2). Additionally, an uncooled FLIR SC660 camera was used for further testing with focal length 40 mm (24° × 21° FOV), pixel size 17 μm, spatial resolution 640 × 480 pixels, measurement accuracy ±1 °C, NETD 45 mK at +30 °C, and spectral range 7.5–13 μm. Both cameras are purposed for building diagnostics and have built-in optical sensors, 1.2 and 3.2 MPixels, respectively. The thermal-infrared images were edited with the ThermaCAM Researcher to apply the same temperature scales. IRT and RGB images were with exported FLIR Tools+ 5.X at the same 1024 × 768-pixel resolution (JPEG format).
A consumer-grade digital single-lens reflex (DSLR) camera Canon (Canon Inc., Tokyo, Japan) Rebel-SL1 was used for the 3D geometry generation and to enhance the geometric strength of the optical imagery dataset acquired with the thermal camera. The focal length was 35 mm, pixel size was 4.4 μm, spatial resolution was 3456 × 5184 pixels, and a UV/NIR-cut filter was used for RGB imaging. Pre-signalized control and check points were measured with a total station theodolite (TST) GeoMax (GeoMax AG is a part of Hexagon AB, Stockholm, Sweden) Zoom30 with 3″ angular accuracy and 3 mm ± 2 ppm reflectorless distance measurement accuracy.
Camera calibrations and image undistortion were realized with MATLAB R2020b’s Camera Calibrator App. The manual identification of the matching features between IRT and RGB images, the calculation of the necessary transformation parameters (and their errors), and the subsequent geometrical registration of the IRT images were implemented in the HyperCube freeware (Version 11.52). SfM/MVS-approach based model generation—including the orientation of the images from the T1030sc camera—and texturing were performed in Agisoft Metashape Pro 1.5.1. However, given how standard is the employed type of multi-view image-based 3D reconstruction, the workflow presented here can be applied with any other free, open, or commercial software available, which employs similar algorithmic implementations. The export of optical and thermal images at the same resolution simplifies the process after data collection, as it makes them interchangeable for the texturing phase when the appropriate geometric corrections have been introduced.
The workflow proposed here was implemented using as a case study the west façade of the Castle of Valentino, a historic building in the north-west Italian city of Turin. Valentino Castle is located in Parco del Valentino. It was one of the Royal House of Savoy residences and has been included in the UNESCO World Heritage Sites list since 1997. The first structure on the present castle site was a four-story palace built around the middle of the 16th century. Since then, it has been subject to numerous interventions, extensions, and transformations. The building reached its present size under Vittorio Amadeo of Savoy in the 17th century, becoming the royal family’s country seat. Two new wings, the French Pavilions, were added in this period, forming a large internal courtyard. In the late 19th century, the whole building underwent a radical transformation, both external and internal. Numerous interventions involving strengthening work and partial restoration, including replacement of some of the plasterwork, were carried out.

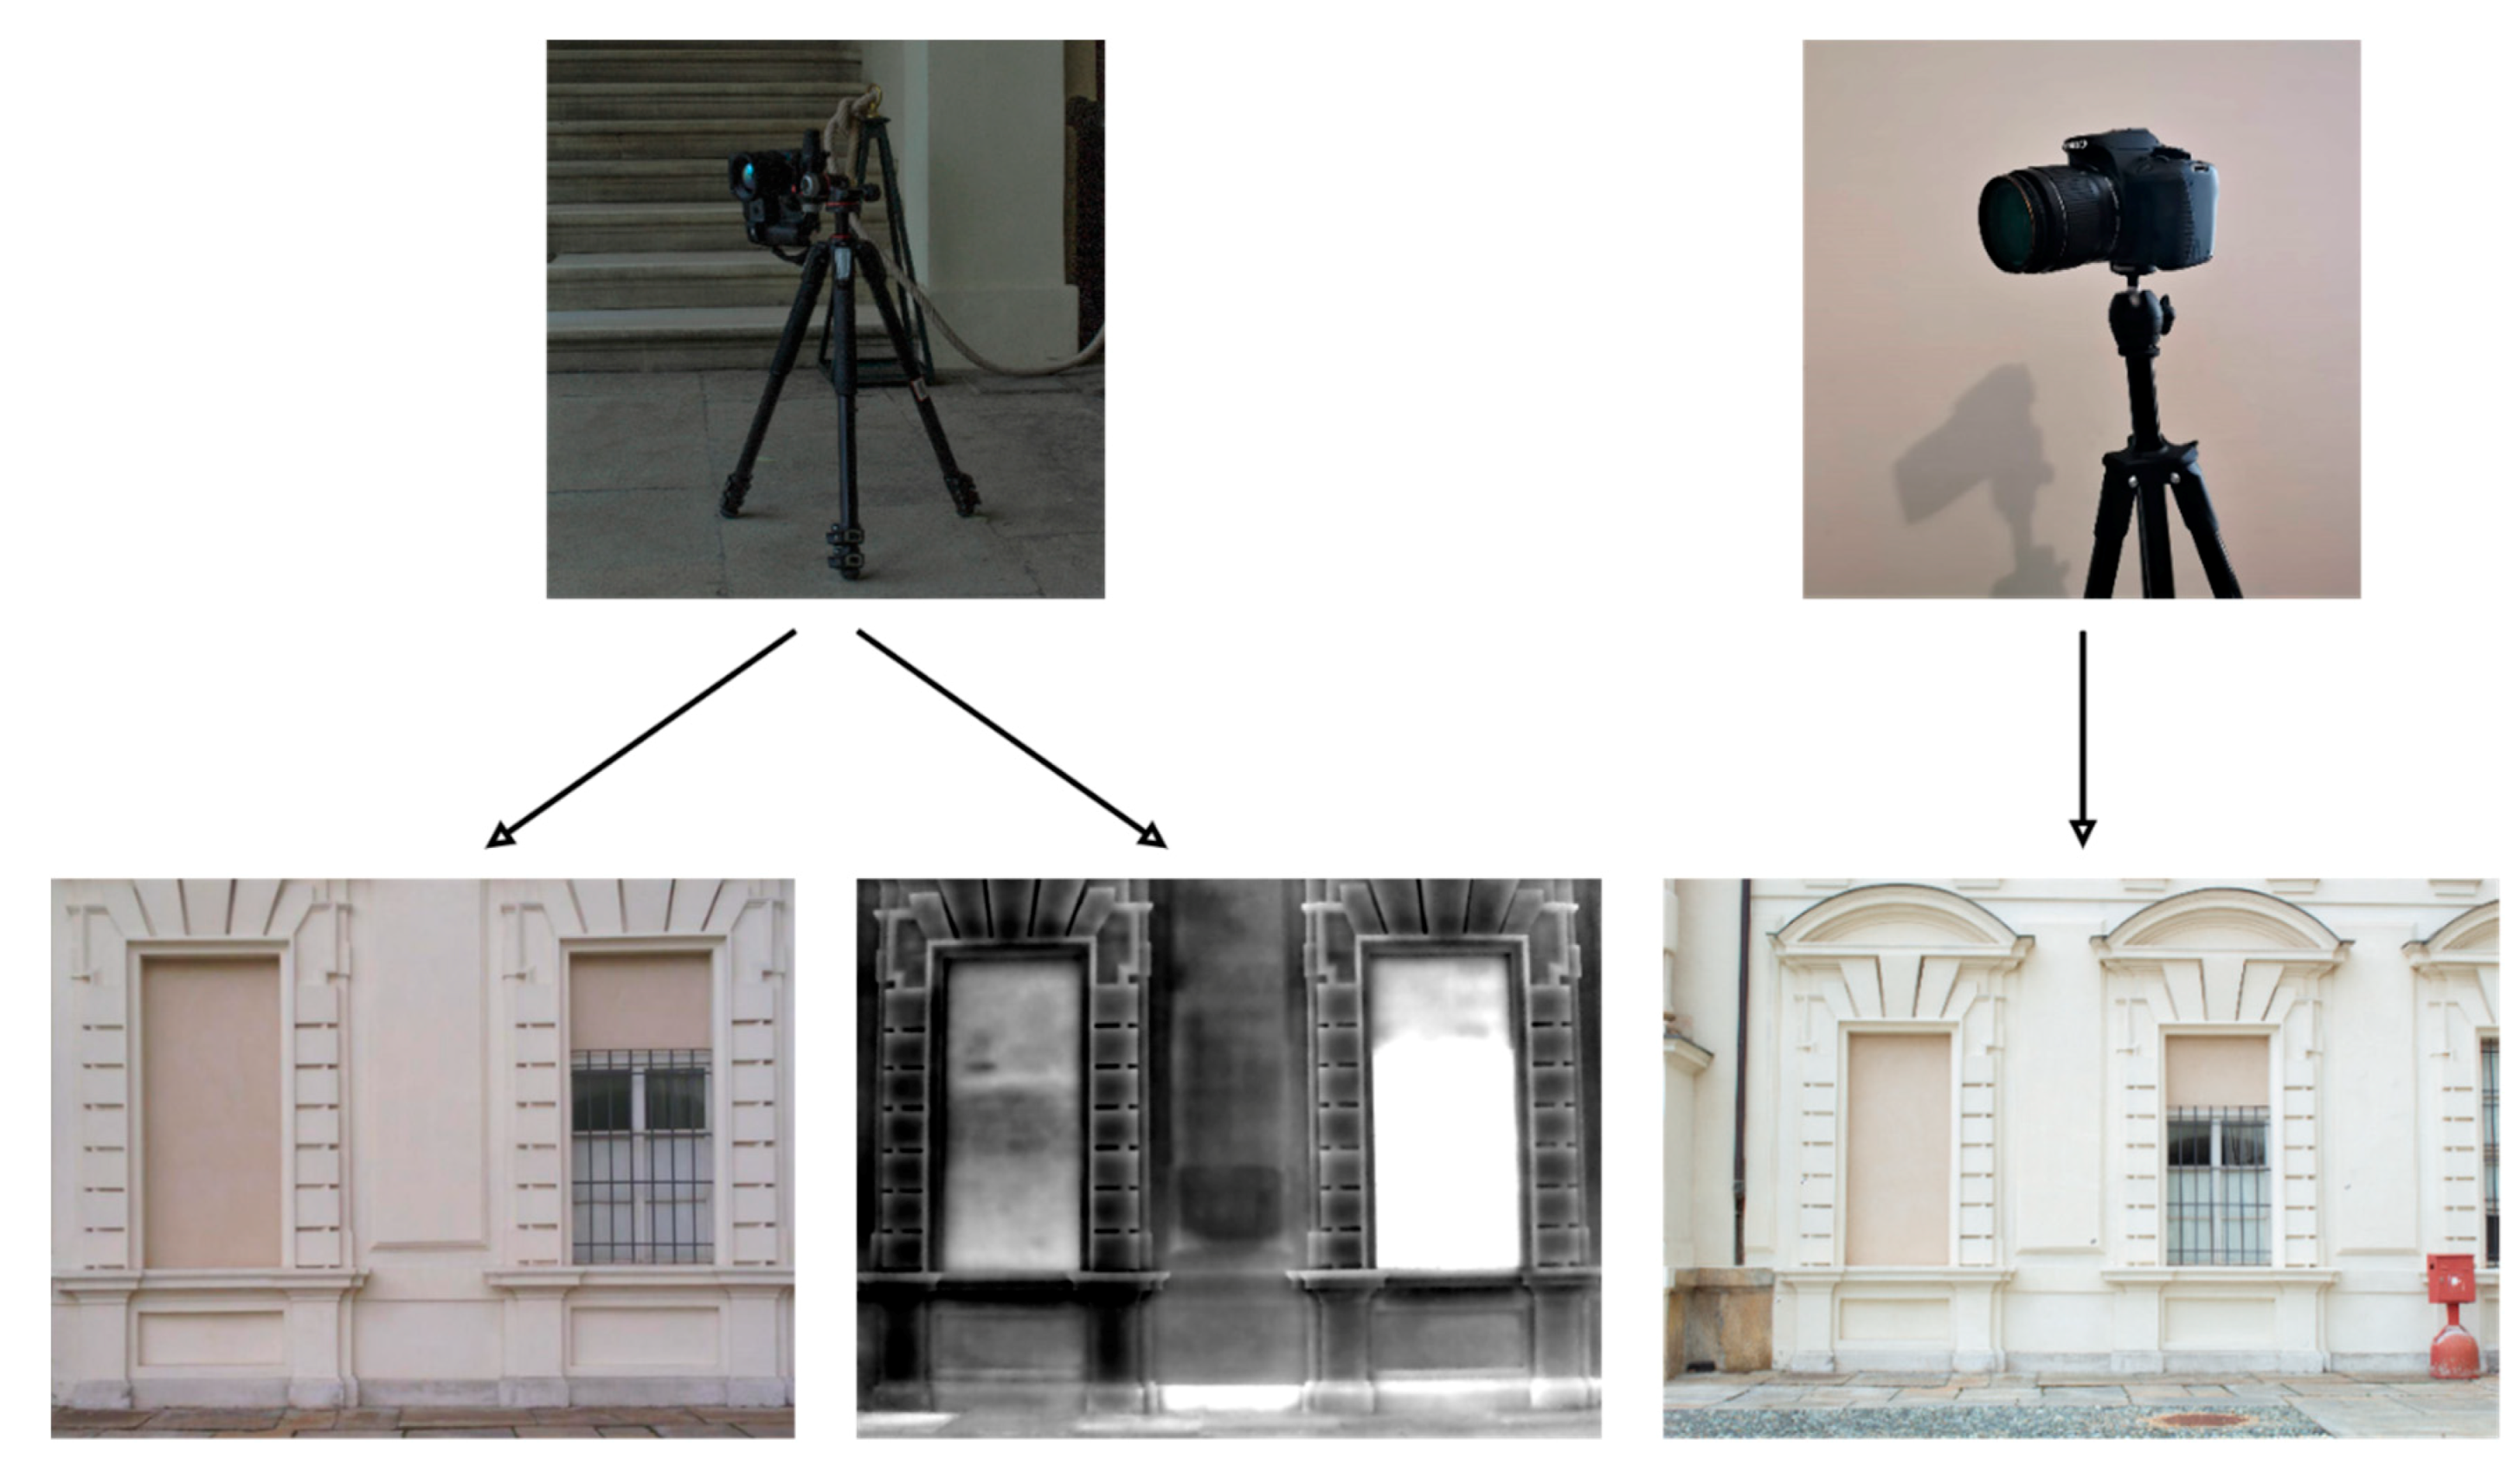
2.2. Image Acquisition

The method described here employs two instruments (Figure 3). The acquisition employs a high-definition IRT camera and takes advantage of the integral optoelectronic RGB and thermal sensors. As the RGB sensor images are purposed for photogrammetric processing, and with the intention of acquiring high-resolution thermal textured products, a dense and robust geometry with proper overlaps is maintained during the image acquisition phase. Imagery is acquired in (overlapping) strips, which consist of images captured from the same distance of the object, with a similar angle between the camera’s optical axis and the plane of the object. However, the dataset’s geometry still depends largely on the planarity of the façade, architectural component, or structure. Capturing additional oblique images assists the accurate implementation of the photogrammetric principles. Optical images are also acquired with a high-resolution RGB camera to improve the geometry of the photogrammetric sequences and acquire more accurate orientation results for the thermo-camera poses. Low-cost targets identifiable both in the visible and thermal infrared spectra are placed in the scene to be used as control points with known coordinates during photogrammetric reconstruction and facilitate RGB and IRT image registration. Imagery acquired with optoelectronic (RGB) and thermal sensors of the thermal-camera is exported at the same resolution, to simplify the image registration and texturing phases on a later stage.

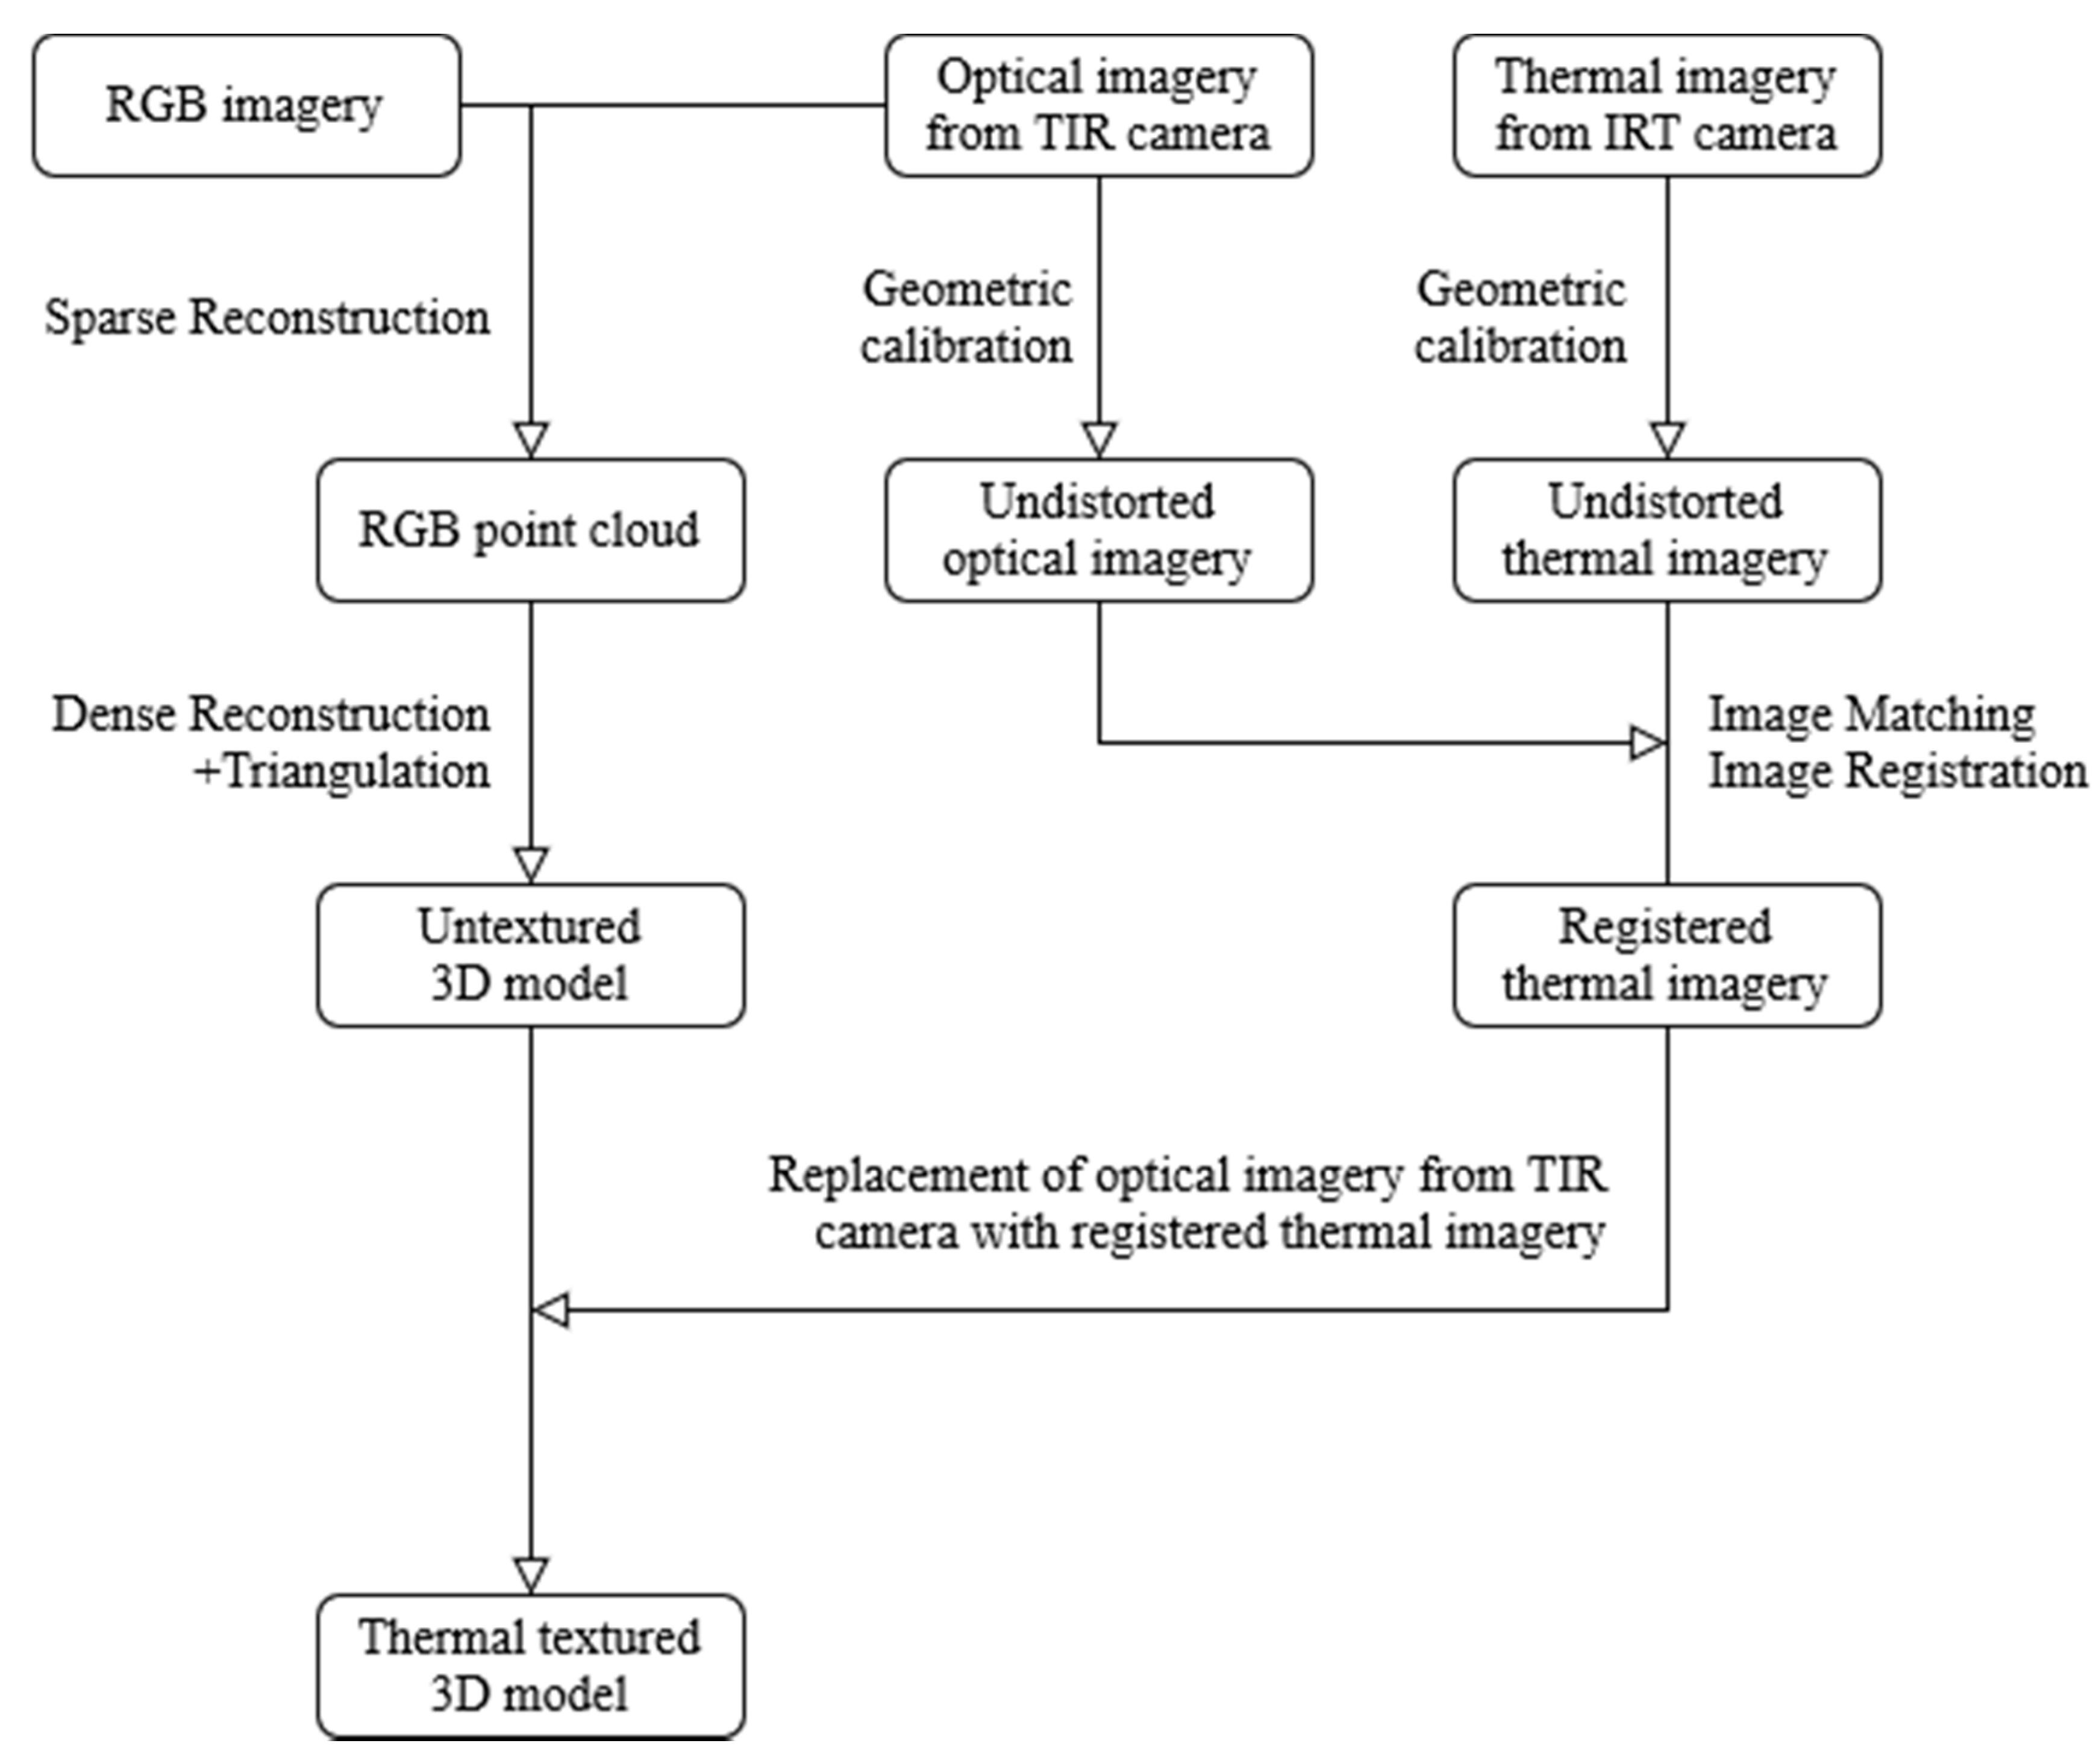
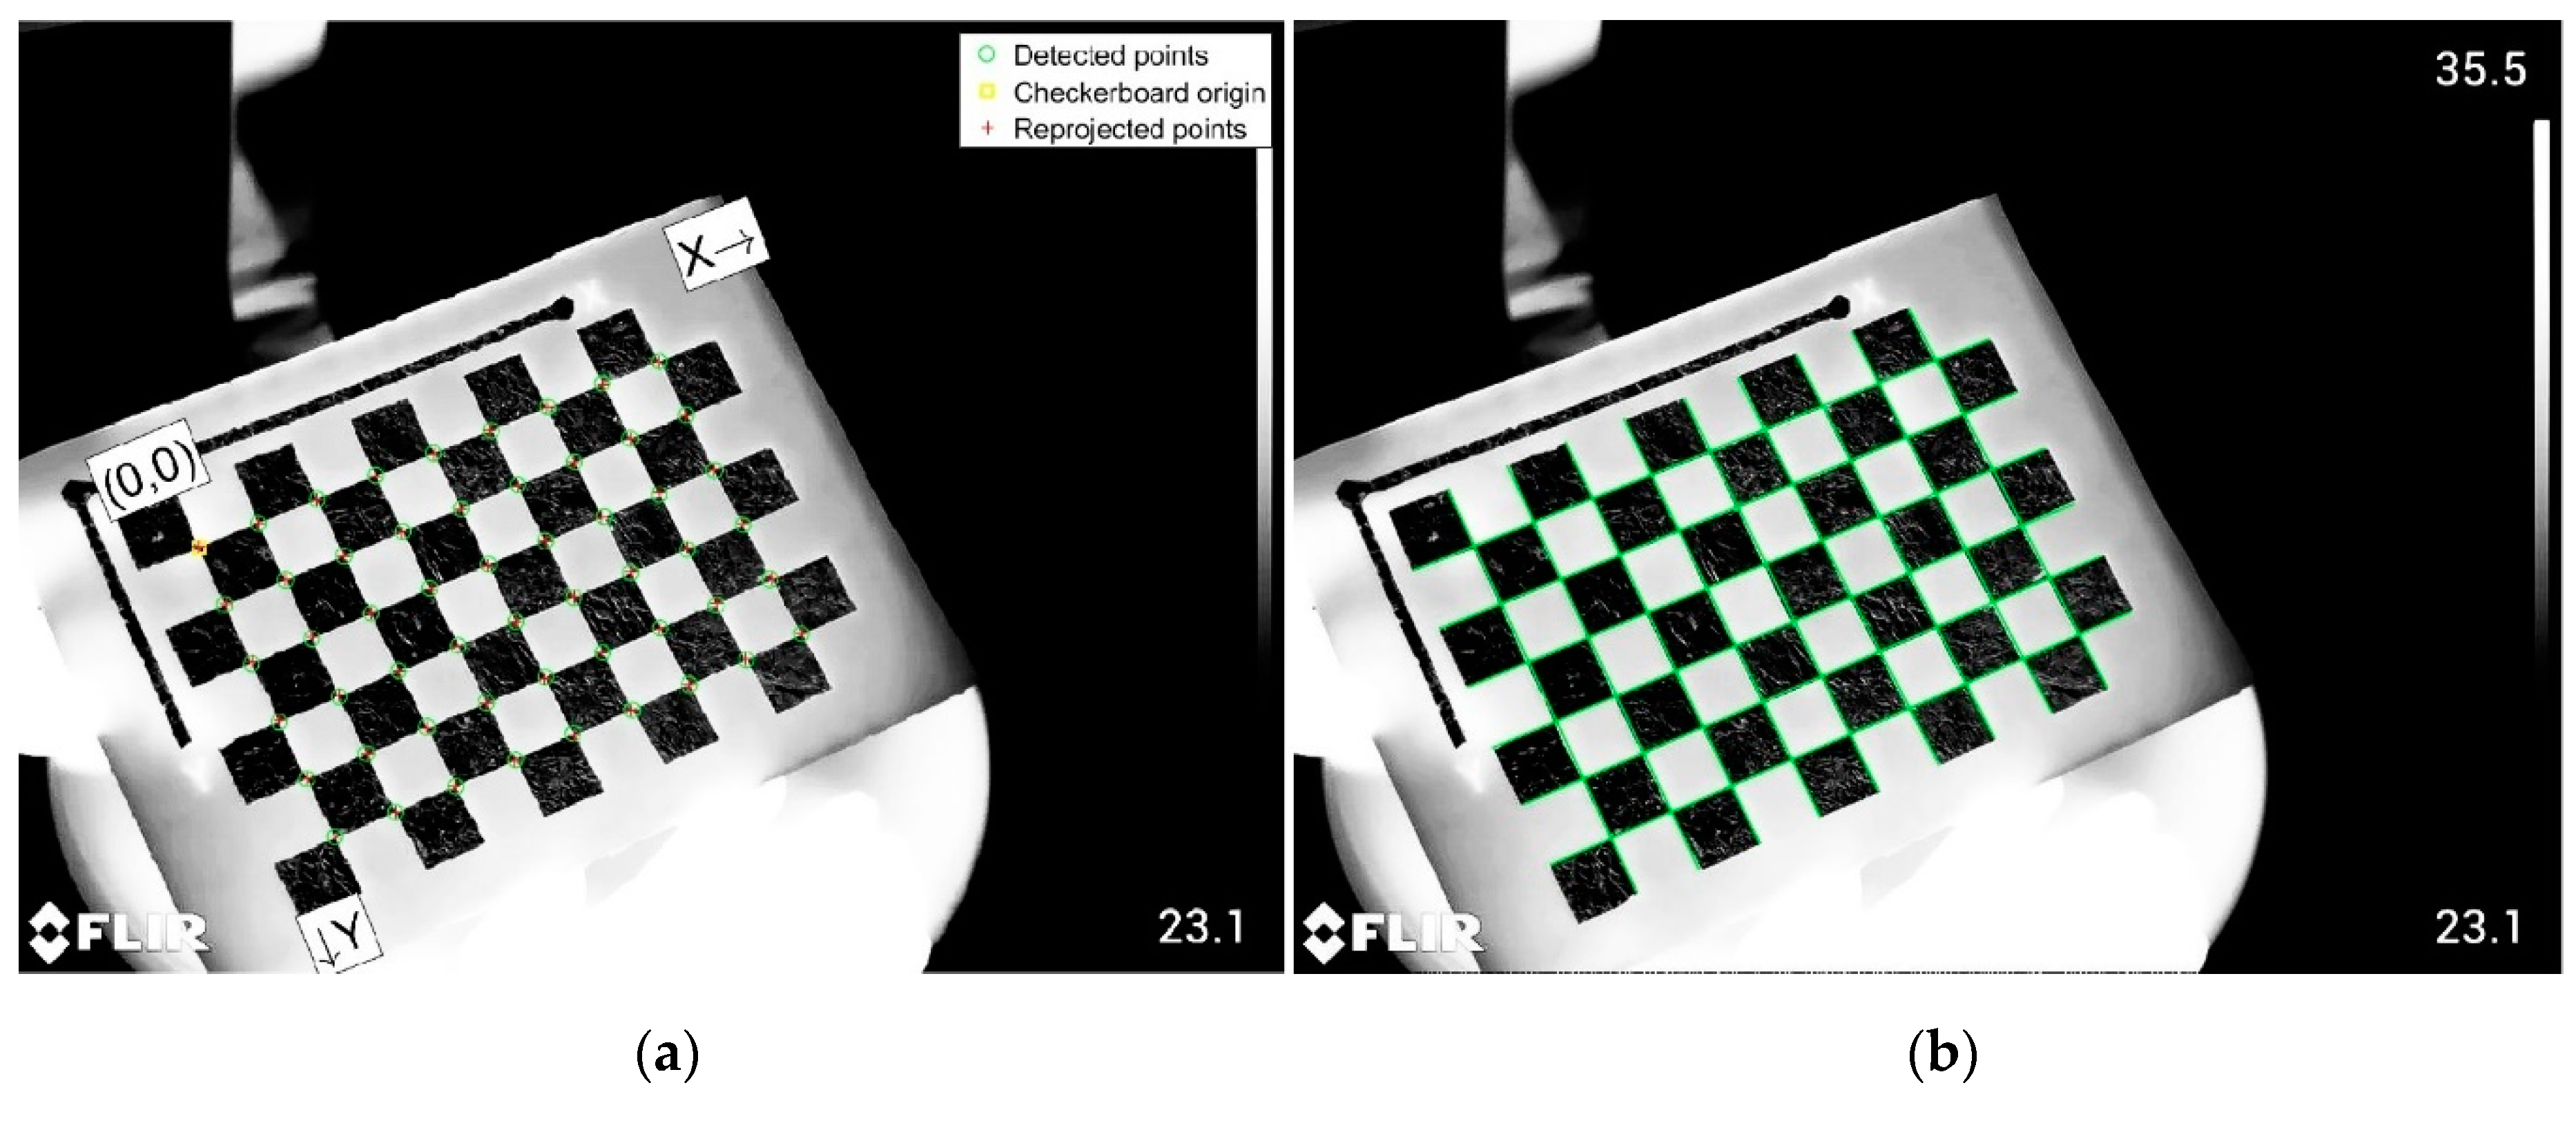
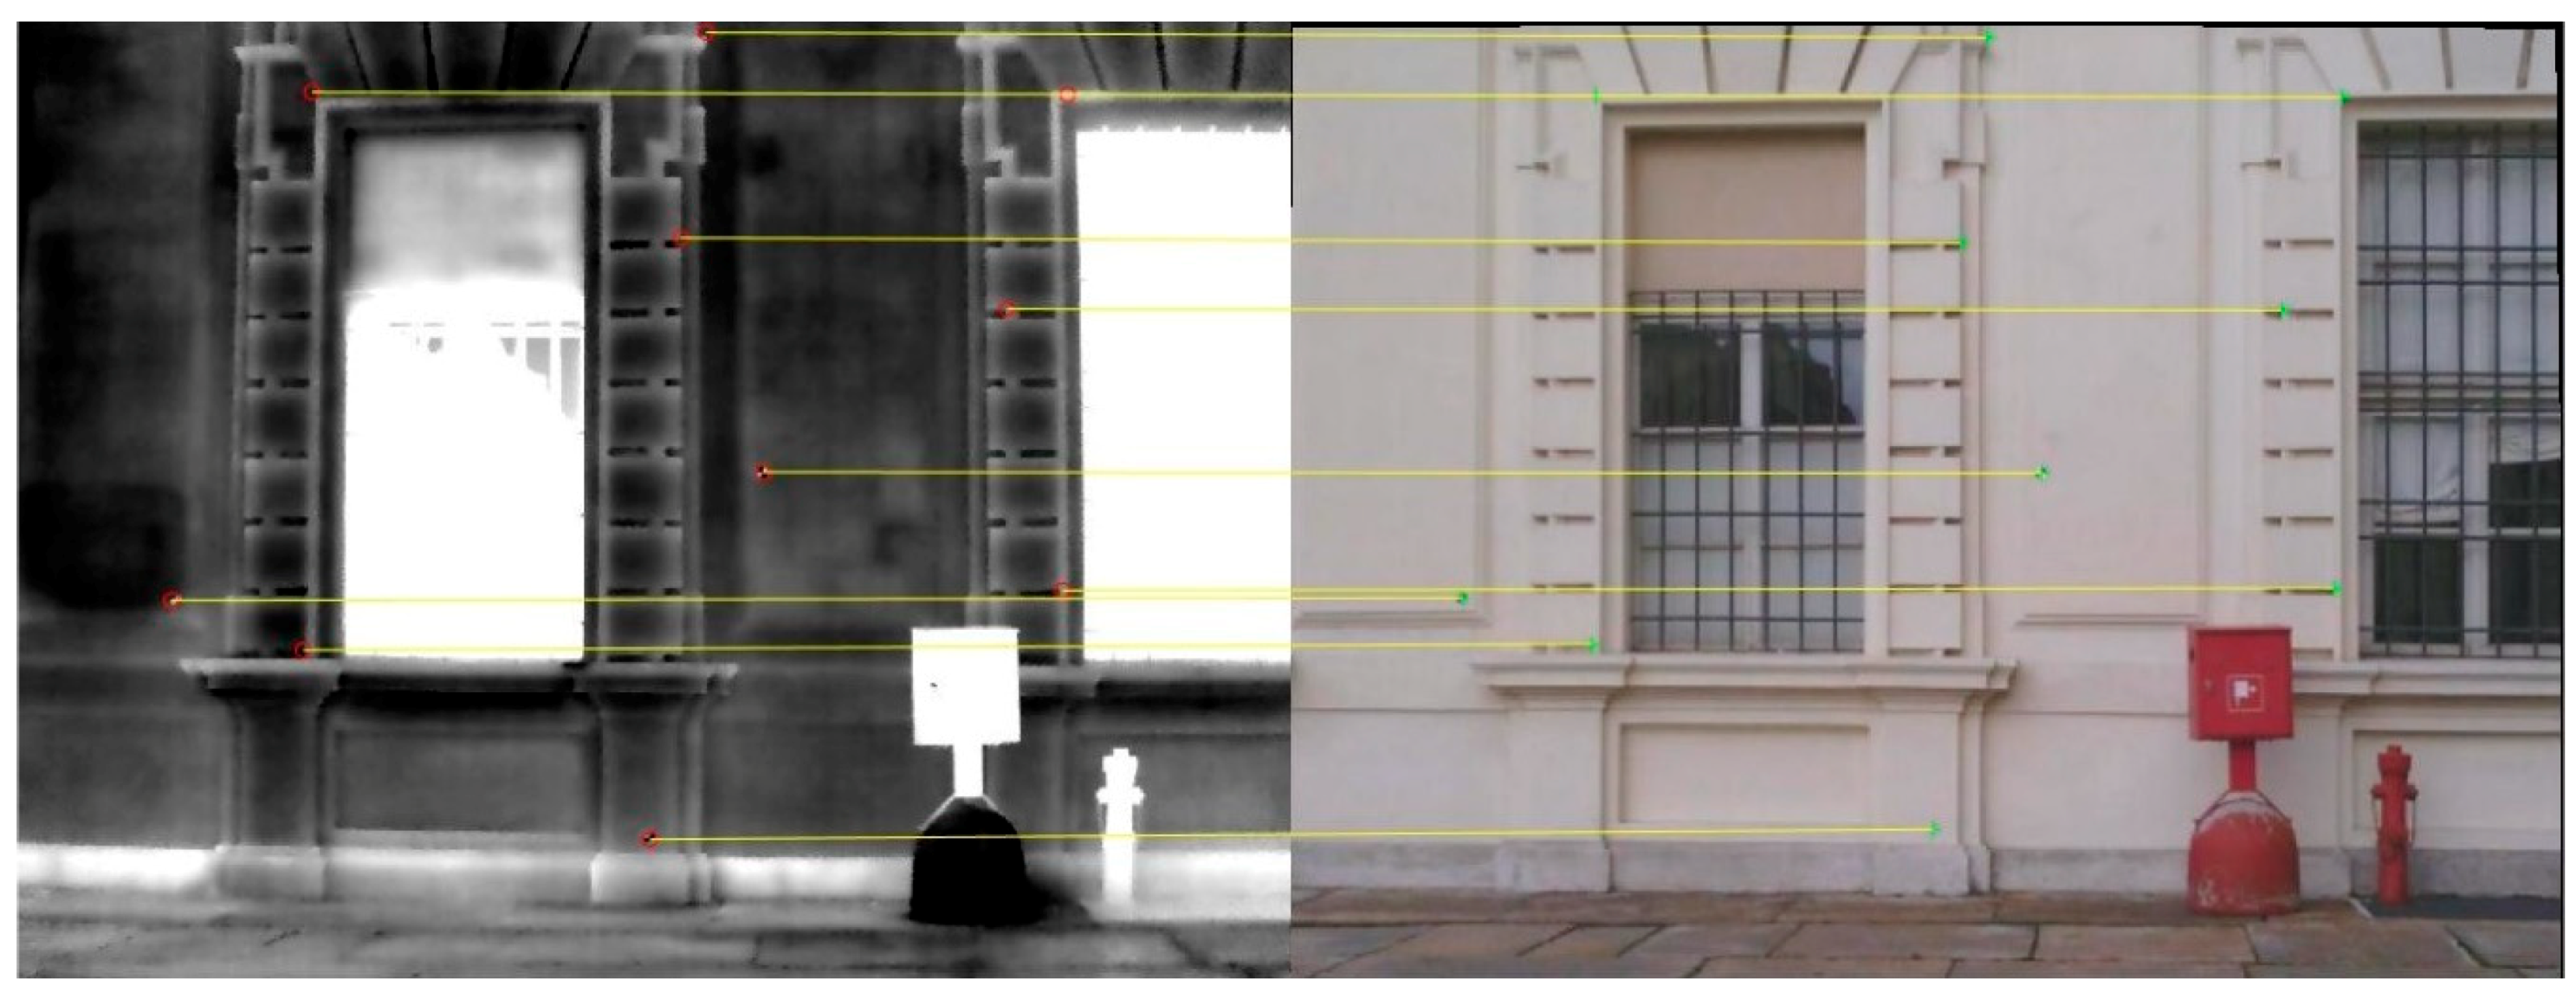
2.3. Camera Calibration and Image Registration

The thermal sensor of the thermo-camera is calibrated using a custom-made low-cost target from cardboard and aluminum foil. The calibration, which estimates the values of intrinsic parameters, extrinsic parameters, and distortion coefficients, is computed in a two-step process: (1) solving for the parameters in a closed form, assuming lens distortion as zero, and (2) using the closed-form solution as the initial estimate of the intrinsic and extrinsic to estimate all parameters—including the distortion coefficients—with nonlinear least-squares minimization (Levenberg–Marquardt algorithm) [43,44]. The camera parameters are then used to undistort the thermal images, which are exported with the same resolution as the original ones, as shown in Figure 4. The calibration takes place before any other processing of the images, as many photogrammetric software cannot estimate the intrinsic camera parameters (self-calibrate) of the thermal sensors. The optical sensor of the IRT camera is also calibrated with the same approach, then RGB images are undistorted and exported with the original resolution.
The two sets of estimated parameters about the cameras’ internal geometry are used to undistort both RGB and IRT images, collected with the integrated sensors of the IRT camera. For each acquisition strip, one pair of undistorted RGB and IRT images is used to calculate the geometric relation between them, as the acquisition geometry remains unchanged throughout every strip. By manually identifying at least four common points on both images, a projective transformation can be calculated to warp the thermal image to match the system of the RGB image (Figure 5). This enables the accurate thermal texture mapping of the metric products by replacing the oriented optical images from the thermo-camera with the corresponding corrected thermal ones. The selected points should be on the flatter area of the object, and if possible, on the same plane to avoid inaccuracies on the transformation. The use of more than four points allows for the calculation of errors for the projective transform. The existence of targets easily detectable on the thermal images facilitates the manual matching in case common features cannot be identified. Each thermal image of the strip is transformed using the same projection parameters, and the same procedure is repeated for all acquired image-strips.

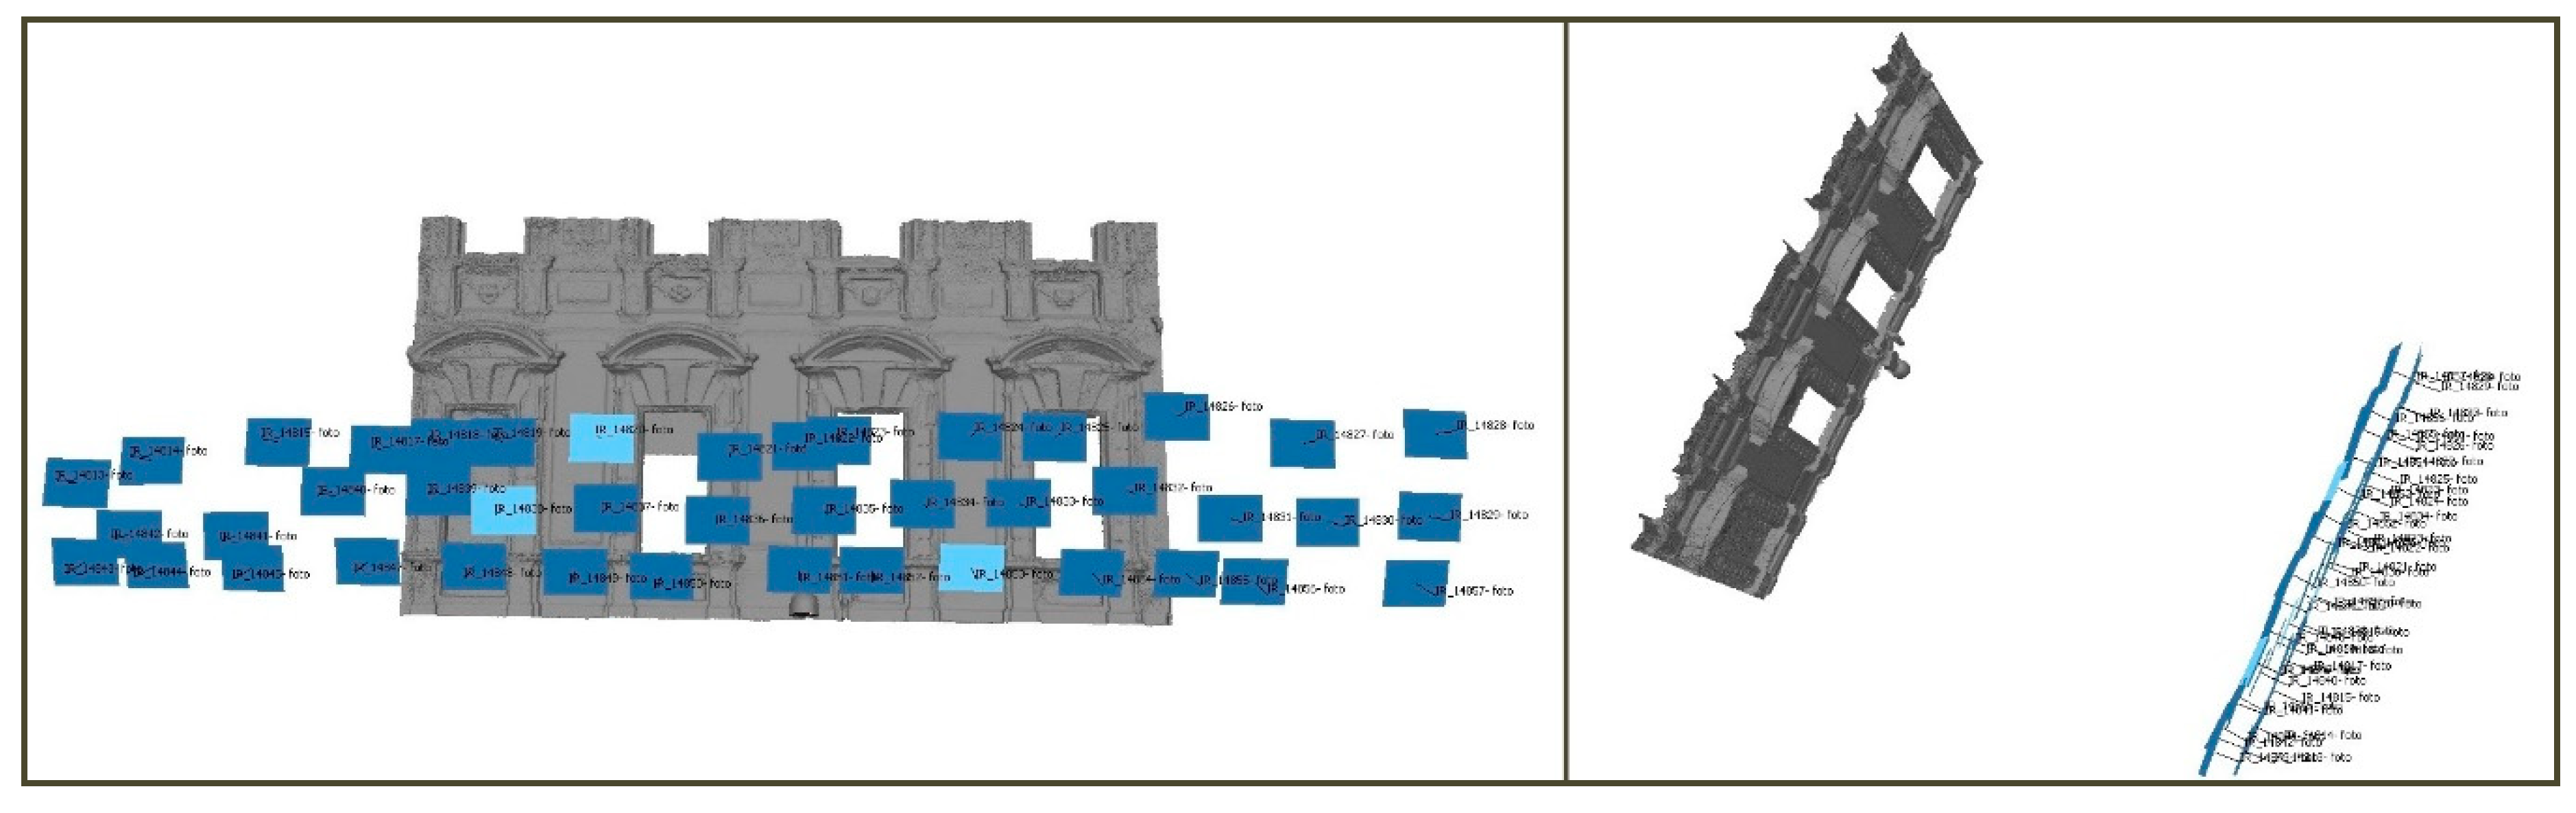
2.4. Image Pose Computation and Model Generation

A standard multi-view reconstruction pipeline [45,46] is followed. The geometry of the acquisition is reconstructed with a Structure-from-Motion (SfM) algorithmic implementation, using the dataset containing RGB images from the two optical cameras. In this way, both accurate external orientation information is obtained for the RGB sensor of the thermo-camera, and a sparse reconstruction of the scene is created. The geometry and the orientation parameters of the cameras are then optimized using points with measured coordinates. The produced 3D point cloud is then densified on a Multiple View Stereo (MVS) procedure, excluding the low-resolution images from the IRT instrument’s optoelectronic sensor to reduce noise. Finally, the dense point cloud is meshed into a 3D model, using Delaunay triangulation. If necessary, the surface is smoothed or otherwise optimized with denoising techniques.

2.5. Thermal Texture Mapping

For the final step of the 3D temperature mapping workflow, the high-resolution RGB images previously used to generate the dense geometry are not used. Instead, during the process of texture mapping, the RGB images from the thermo-camera are replaced with the same-resolution undistorted and geometrically corrected IRT images—maintaining the estimated orientation from the SfM phase—to apply thermal texture accurately. The texture is applied with an ortho-photo adaptive algorithm so that for each part of the model’s surface, only the most parallel images are used for texturing, avoiding the inclination and convergence effects. When pixel values from multiple overlapping pixels are used to texture a single triangle of the model, these values are averaged to improve the visual result of the textured product.

3. Experimental Results

3.1. Data Collection

The thermal imagery was densely captured with the T1030sc camera (Figure 6), as described in detail in Section 2.1, maintaining approximately a 90% side overlap and a 70% overlap between the image-strips, over a part of the main façade measuring 14 × 7.5 m2. All thermal imagery captured for this work’s purposes was recorded passively, without artificial heating, and thus captures long-infrared signatures derived from the predominating environmental conditions. RGB images were also captured from the same positions through the optoelectronic sensor of the FLIR instrument. Forty-two RGB and IRT image-pairs were collected from an average distance of 11.6 m. An additional 72 RGB image dataset was captured with the SL1, resulting in a combined optical dataset of 144 images. Twenty pre-signalized and feature points were measured with the TST, scattered over the study area, with a resulting accuracy of half a centimeter at the x and y-axis, and at the z-axis.

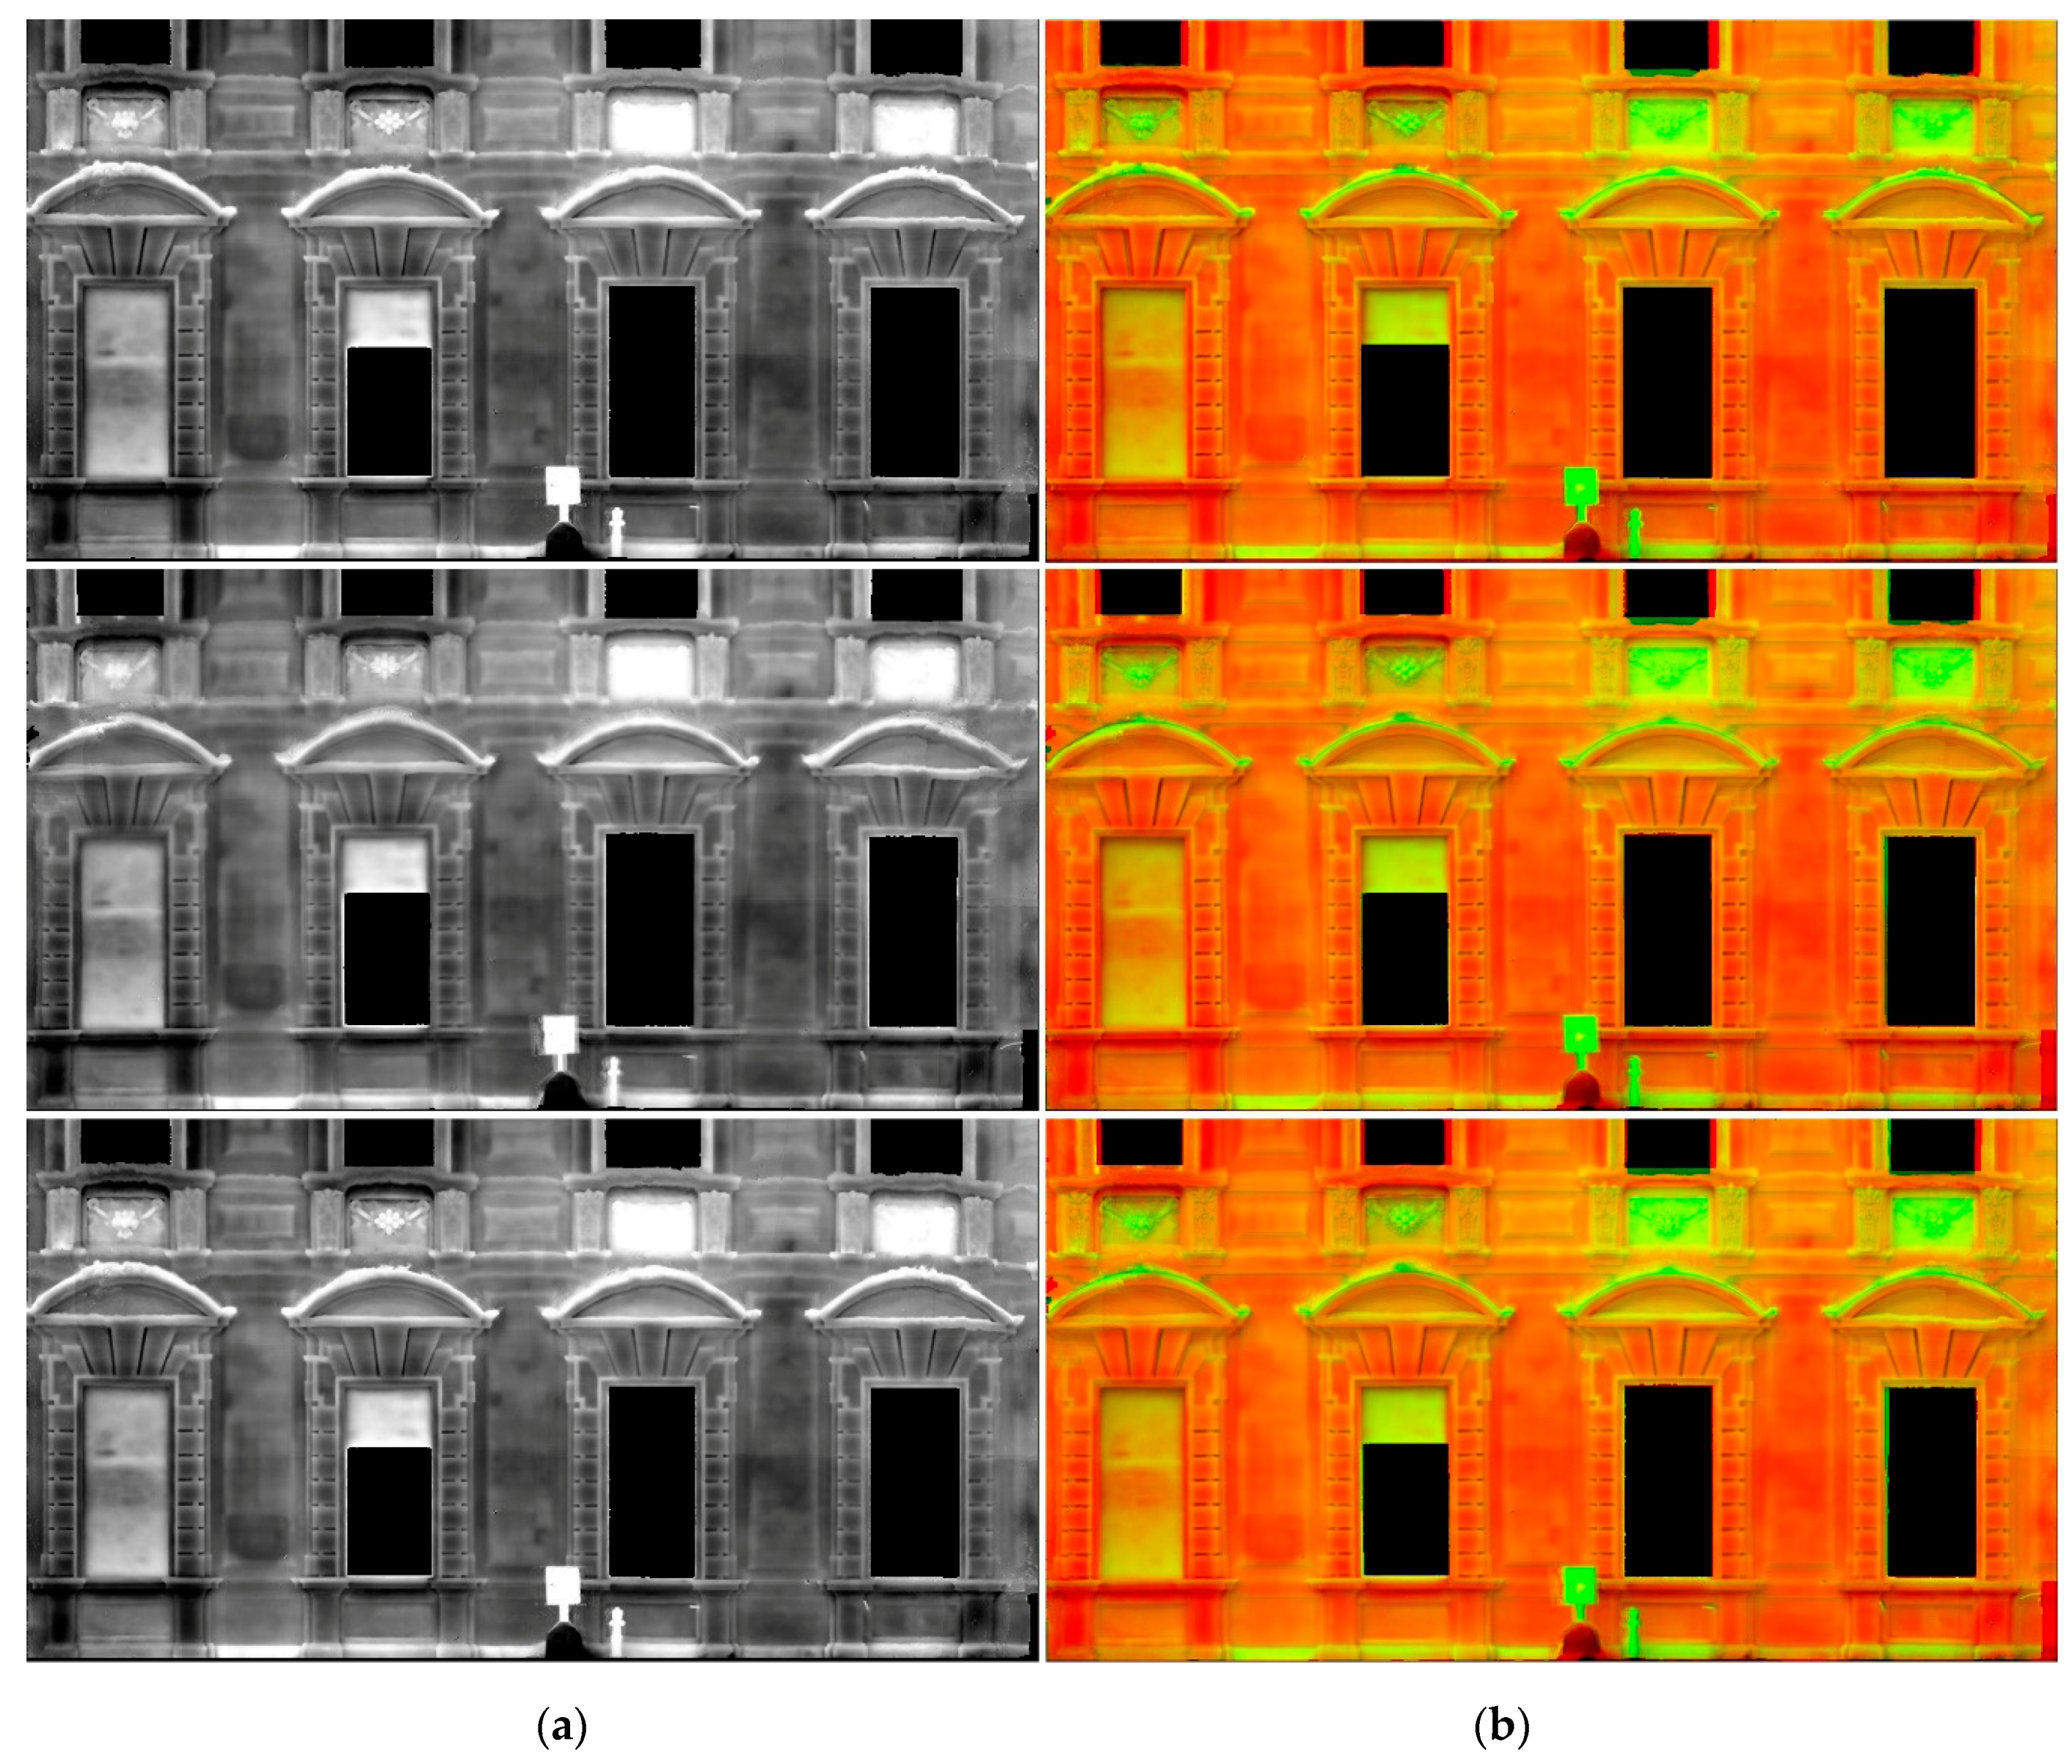
3.2. Thermographic 3D Mapping Results

The resulting total Root-Mean-Square Error (RMSE) for the control points on the reconstructed façade was 9 mm, and for the check points 7 mm. A high-resolution 3D model was produced (Figure 7), consisting of approximately 10 million triangles with average edge size 2 mm, while the spatial resolution of the thermal data was approximately 6 mm. Thus, the model was reduced to have a dense cloud grid of 10 mm so that metric and thermal data would have compatible resolutions.
No significant problems were observed on the stitching of the thermal texture, apart from the small arches’ occluded cornices above the large windows and the floral decorative sculptures with the irregular geometry (Figure 8). The model was used for visual inspection, and it was further processed to create a 1 cm resolution thermal orthophoto-mosaic, a product easily exploitable for quantitative thermal analyses and other visual analytics. Although no significant degradation was observed, due to frequent restoration interventions, the plaster integration could be observed in many areas, along with the underlying structure and at specific areas remaining moisture.

4. Validation and Discussion

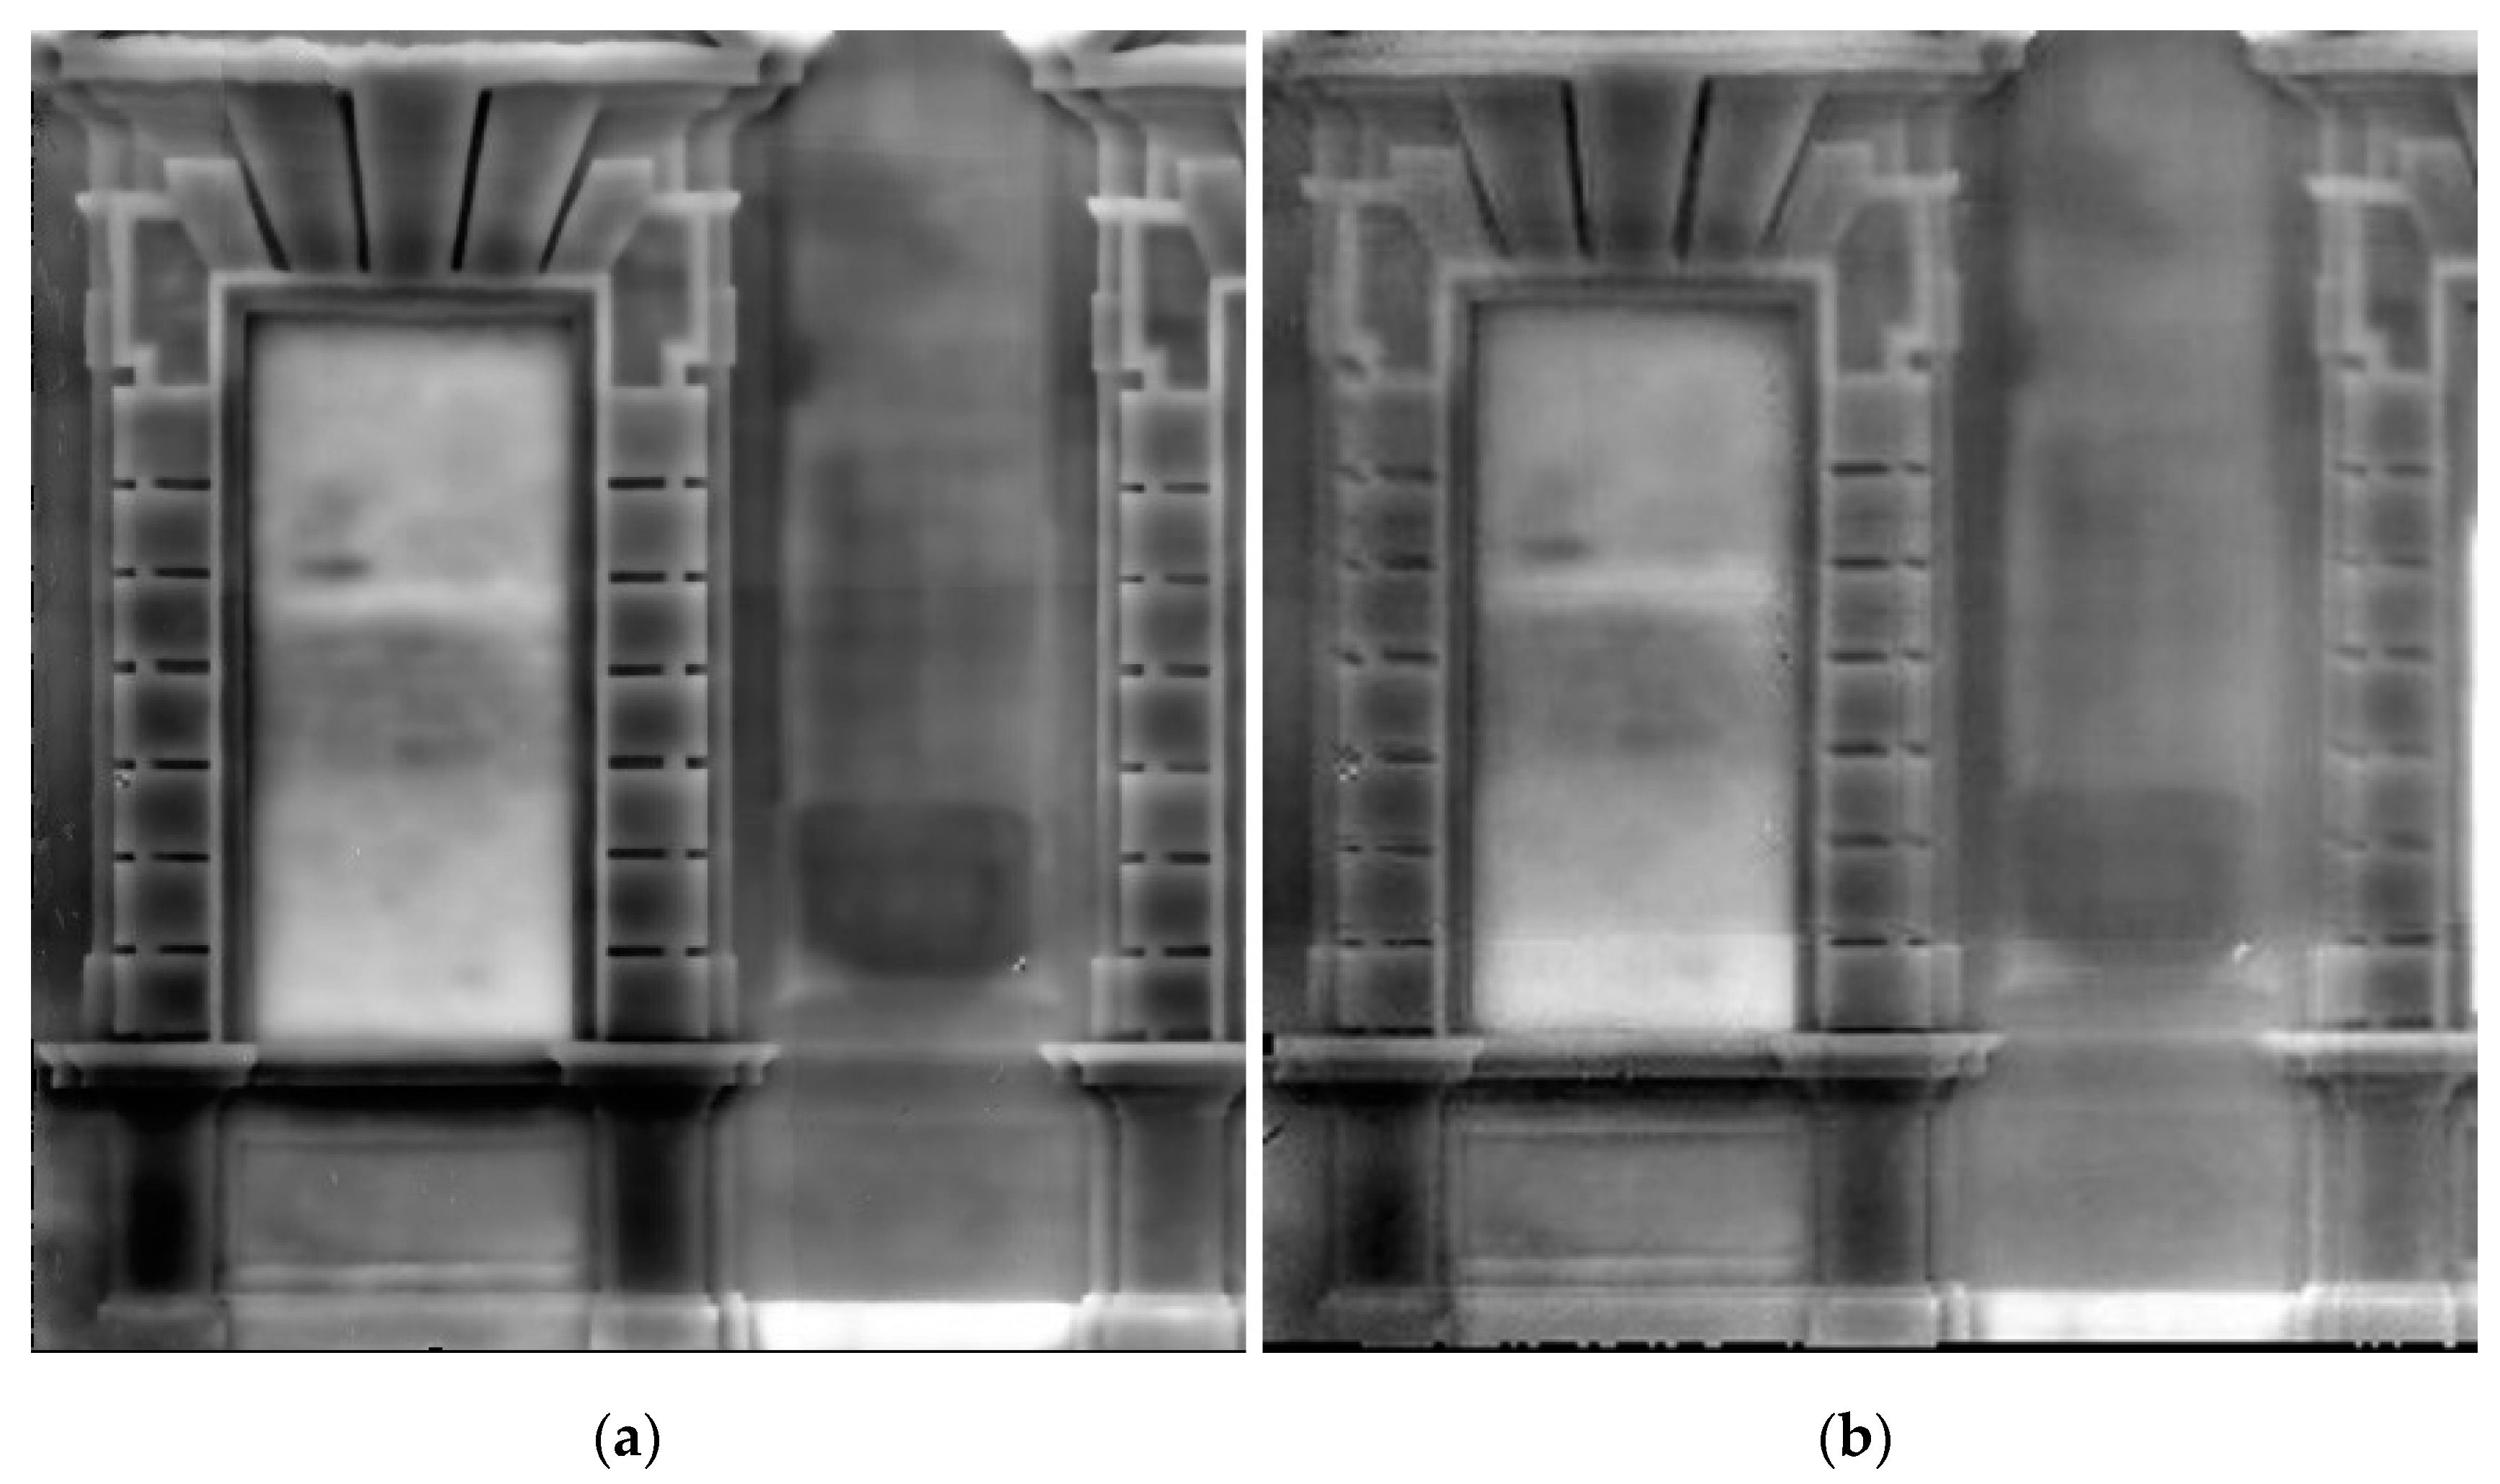
4.1. Evaluation and Comparison with Other Methods

The workflow applied in Section 3 was assessed during the IRT image-correction, geometry reconstruction, and texture mapping phases in the interest of providing a detailed metric and visual validation for the complete methodology. A comparative analysis between the methods described in Section 2 and other cost-effective techniques, which have also been adopted for thermal 3D mapping (see Section 1), is also carried out.
As previously discussed, during the matching phase, between RGB and IRT images, the selection of at least four corresponding features are required to estimate the transformation parameters in order to project the thermal data into the optical imagery correctly. By including more than four features, an error of the transform was calculated, which was approximately equal to 1.5 pixels on the image plane (for all strips), meaning less than 9 mm RMSE in the transformation of the IRT images, on the surface of the architectural façade. More tests applied by measuring the difference of corresponding points in RGB–IRT image-pairs, which were not included in the initial calculations of the transform, showed similar errors.
Aiming to perform metric comparisons about the façade’s reconstructed geometry, the surface was additionally reconstructed according to two different scenarios. In the first scenario, the uncalibrated thermal images were used directly for the point cloud and 3D model generation inside the photogrammetric software. The second scenario concerned the use of the low-resolution RGB images, derived from the optical sensor of the FLIR T1030sc thermo-camera, as the photogrammetric block to generate the metric 3D products. As presented in Table 1, the investigated methodology significantly improved the reconstruction density, accuracy, and surface quality. Results from the reconstruction using only the SL1 images are also presented in the same table as reference values. Figure 9 and Figure 10 further showcase how the lower-resolution RGB images and the IRT have affected the reconstruction. The mean distance between the model produced from the SL1 images and the T1030sc RGB images was 3.2 cm, and the standard deviation 3.3 cm. The same values regarding the distance between the model produced from the SL1 images and the T1030sc RGB images were 5.8 cm and 5.4 cm, respectively, meaning observable geometric errors on the model. The 3D model produced by thermal imagery had significant discrepancies within the areas lacking photogrammetric control points and at the edges of the façade.
In order to obtain comparative results for the thermal textures of the created 3D models, the model generated by the FLIR T1030sc optical imagery was textured by replacing the RGB images with the corresponding IRT images, thus maintaining the position, orientation, and calibration parameters of the original images, without applying any additional correction. In addition to that, the 3D model generated by the FLIR T1030sc thermal imagery was textured without any intervention, applying the self-calibration and orientation parameters estimated during the sparse reconstruction phase in the photogrammetric software. The results are shown in Figure 11, where overlays of the thermal orthophoto-mosaics on the RGB orthophoto-mosaics are provided to visualize any spatial error between the two types of textured products. As is evident, the implementation of the integrated workflow was extraordinarily successful in this aspect. The ortho-product of directly involving the thermal imagery in the photogrammetric process resulted in remarkably similar results, visually, despite the geometric inaccuracies described above. However, the mapping result involving 3D reconstruction from the FLIR T1030sc camera’s RGB sensor has evident flaws.

4.2. Application with a Medium-Resolution Thermal Camera

The whole procedure described in Section 2 was also implemented employing the FLIR SC660 IRT camera (640 × 480 spatial resolution), with the intention of testing its applicability with lower-cost sensors. In this instance, the matching errors on the RGB-IRT image-pairs were approximately 2 pixels (2 cm), the image-based reconstruction RMSEs combining optical imagery from the REBELl-SL1 camera were 4 mm for the control pints and 4 mm for the check points, and similarly to the previous case, there were no visible texturing problems. The apparent difference was the spatial resolution of thermal texture (1 cm), which meant that at least 2–3 cm per pixel should be shown in the final thermal orthophoto-mosaic, considering the metric accuracy. A comparison between partial thermal orthophoto-mosaics is presented with Figure 12, while Figure 13 shows the full thermal-orthophoto-mosaic produced with imagery from the FLIR T1030sc. Although similar radiometric differences could be observed, the mapping result from the lower-resolution FLIR appears more blurred, and faint traces of the texture-stitching procedure can be observed. However, the results of employing a medium-resolution camera, more common for general building inspections, showcase an essential potential of involving low-cost IRT sensors for thermographic 3D modeling [47].

4.3. Application for Complex Geometries

An essential advantage of the presented workflow is that it can easily be adapted for the thermal evaluating of façades and flat architectural elements and for geometrically more complex building elements. As an example, Figure 14 shows the results of applying the workflow for a part of a column on the main façade of the Castle of Valentino, which assisted the 3D localization of the previous restoration interventions.

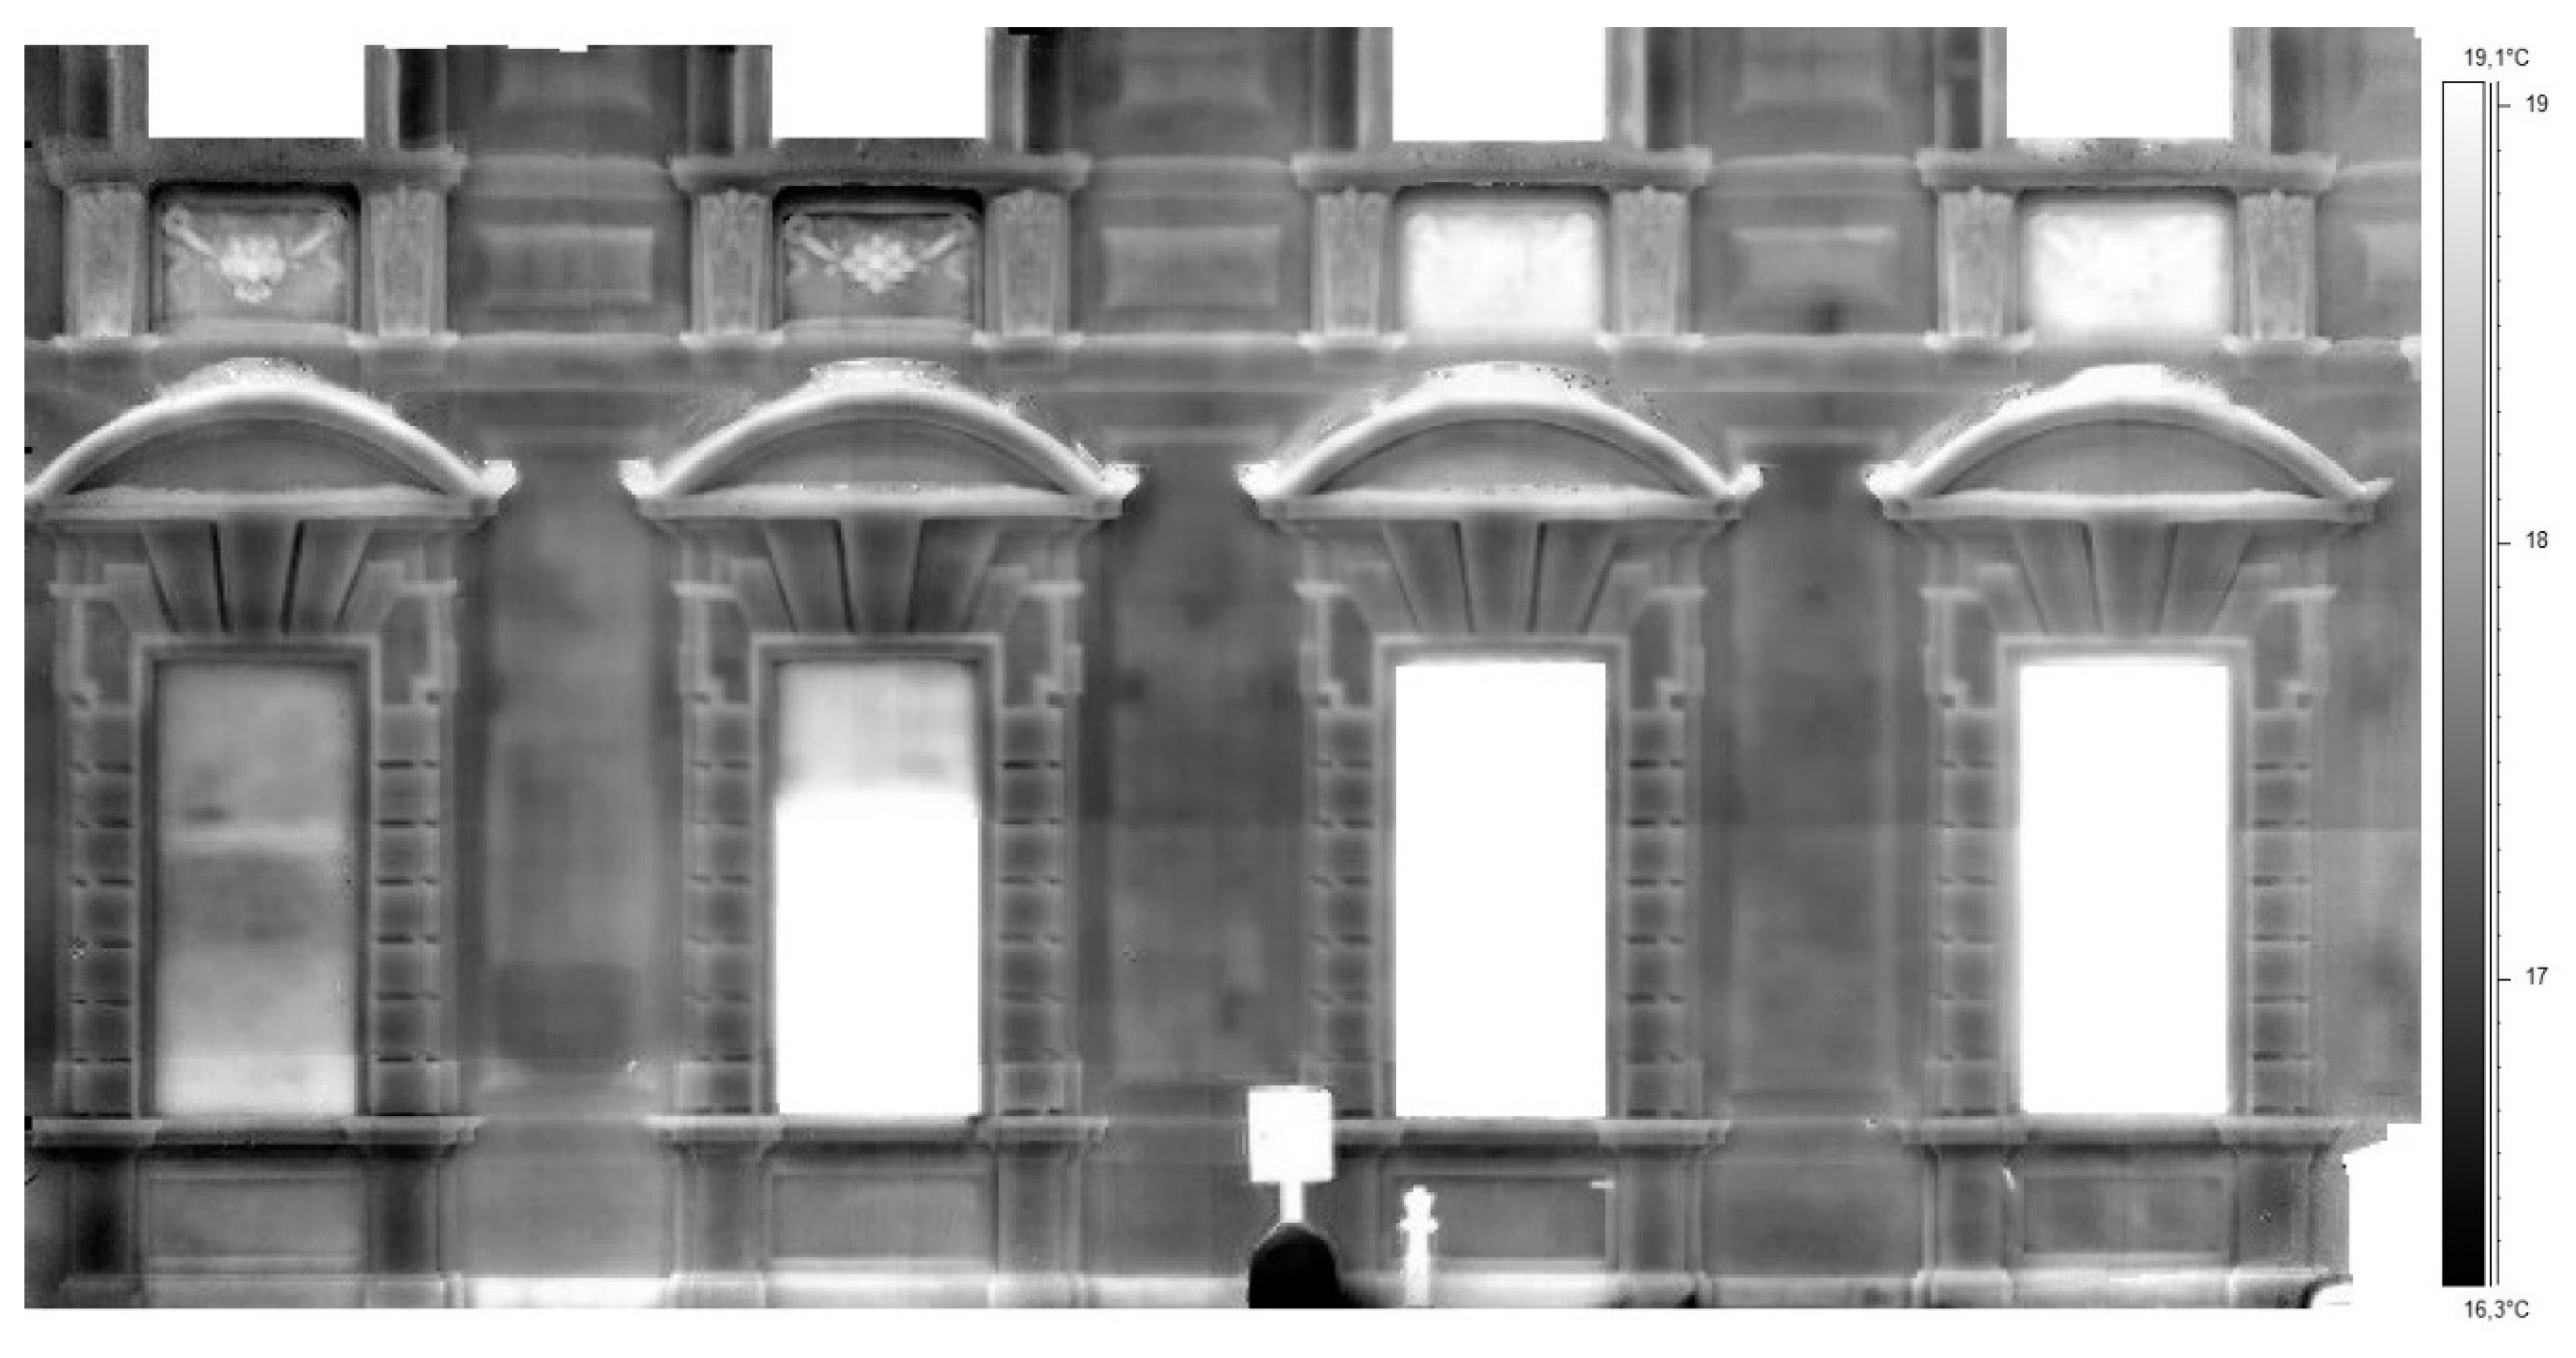
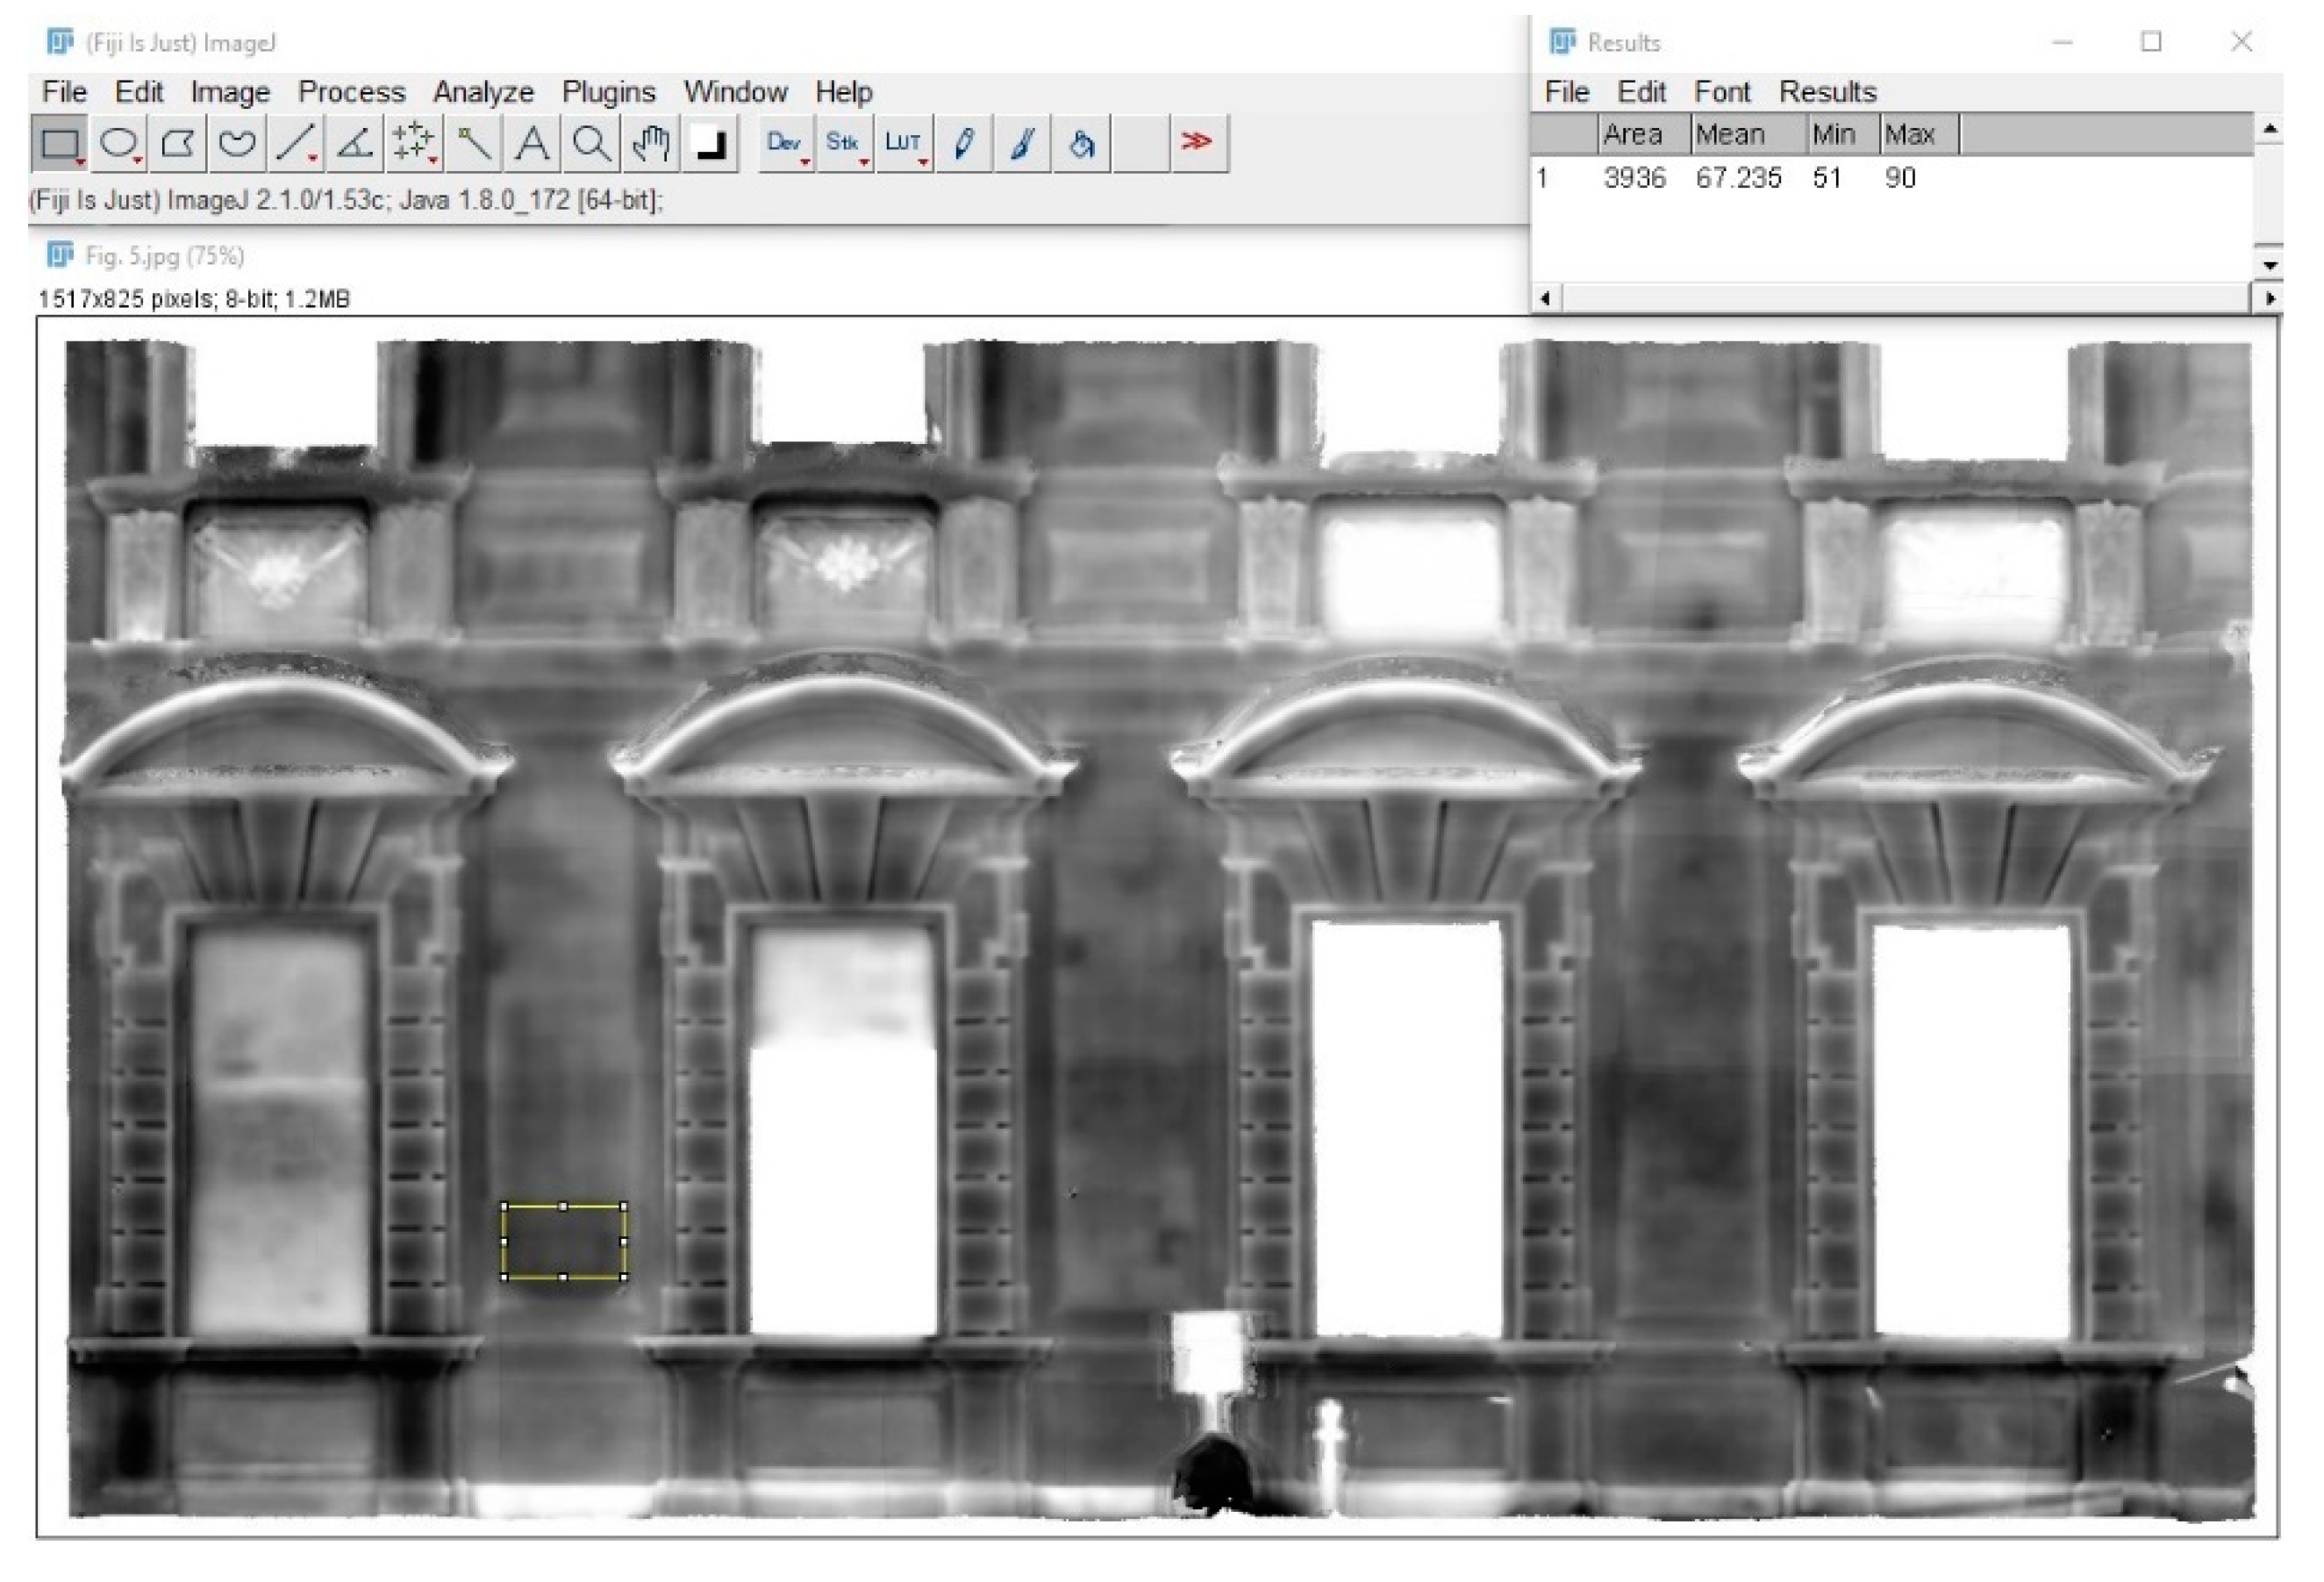
4.4. Extraction of Temperature Measurements

Since original temperature values are maintained when mapping the 3D model or when generating the thermal orthophoto-mosaics, temperature can be easily measured at specific points on the final textured products (on the surface of a material). By identifying the gray-intensity values and adjusting them according to the minimum and maximum temperature of the reference thermal scale, temperature values and local differences can be easily estimated (the same applies when other color palettes have been used for the thermal textures instead of grayscale). The gray-intensities can be measured in any image processing software. Some image processing software (for example, ImageJ) also allows for selecting an area about which statistics can be presented regarding the color values—minimum, maximum, mean, standard deviation—which can also be translated to temperature values following the same correction procedure. Figure 15 illustrates the measurement of gray values, which, when corrected according to the temperature range, show a local mean temperature of 17.0 °C, local minimum temperature of 16.9 °C, and maximum temperature of 17.3 °C.

5. Conclusions

The presented workflow operates as a cost-effective approach purposed for the assessment of architectural heritage assets. The evaluated methodology, based on semi-manual image matching, SfM/MVS digitization, and adaptive orthophoto-mapping, not only successfully adds a spatial dimension to the thermographic results but also metric qualities. The accuracy of the thermal-textured 3D models is not affected by the quality of the IRT images. In fact, it depends primarily on the RGB imagery collected with the high-resolution camera, the geometry of the photogrammetric dataset, and the algorithms involved in the process. Disadvantages induced by thermal sensors’ technical characteristics are overcome, producing high-resolution 3D thermographic models where direct measurements can be performed. Additionally, the generation of derivative high-quality thermal orthophoto-mosaics with spatial reference can serve as the starting point for further experimentation—through qualitative analyses [48], visual analytics [13], integration with high-resolution orthophoto-results at the near-infrared spectrum [49] that assists the classification of materials and decay [50]—and to identify areas of interest for further non-invasive and invasive diagnostical testing. The produced methodology is easily reproducible, accurate, and adaptable for various geometries of historic structures. As proven, it can be even implemented by only involving the integral sensors of a thermal camera (with lower accuracy) when additional imagery cannot be collected. The proposed approach can compete with multi-sensor registration techniques described in recent bibliography and can serve as a lower-cost alternative to the recently available TLS instrumentation with integrated thermographic sensors. Finally, it should be mentioned that for practical and rapid applications, the acquisition step described in Section 2.2 can be partially avoided, as only a few thermograms may be acquired to cover a heritage structure or architectural element completely, with spatial resolution sufficient for qualitative evaluation, making the process much faster. The few corresponding RGB images of the thermal camera can be inserted in a pre-existing photogrammetric project to obtain their orientation, and then the rest of the processing steps can follow, as proposed, to generate the thermal texture.

Author Contributions

Conceptualization, E.A.; Methodology, E.A.; Validation, E.A. and F.R.; Formal analysis, E.A., M.V. and M.G.; Investigation, E.A., M.V. and M.G.; Resources, E.A., M.V., M.G. and F.R.; Data Curation, E.A.; Writing—Original draft, E.A.; Visualization, E.A. and M.V.; Supervision, F.R. and M.V.; Project administration, M.V. and F.R.; Funding acquisition, F.R.; Writing—review and editing, M.V., M.G. and F.R. All authors have read and agreed to the published version of the manuscript.

Funding

This project has received funding from the European Union’s Framework Program for Research and Innovation Horizon 2020 (2014–2020) under the Marie-Skłodowska Curie Grant Agreement 754511 and the Compagnia di San Paolo.

Conflicts of Interest

The authors declare no conflict of interest. The funders had no role in the design of the study; in the collection, analyses, or interpretation of data; in the writing of the manuscript, or in the decision to publish the results.

References

  1. Maldague, X. Theory and Practice of Infrared Technology for Non-Destructive Testing. In Wiley Series in Microwave and Optical Engineering; Wiley: New York, NY, USA, 2001; ISBN 978-0-471-18190-3. [Google Scholar]
  2. Avdelidis, N.P.; Moropoulou, A. Emissivity considerations in building thermography. Energy Build. 2003, 35, 663–667. [Google Scholar] [CrossRef]
  3. Grinzato, E.; Bison, P.G.; Marinetti, S. Monitoring of ancient buildings by the thermal method. J. Cult. Herit. 2002, 3, 21–29. [Google Scholar] [CrossRef]
  4. Kylili, A.; Fokaides, P.A.; Christou, P.; Kalogirou, S.A. Infrared thermography (IRT) applications for building diagnostics: A review. Appl. Energy 2014, 134, 531–549. [Google Scholar] [CrossRef]
  5. Brooke, C. Thermal Imaging for the Archaeological Investigation of Historic Buildings. Remote Sens. 2018, 10, 1401. [Google Scholar] [CrossRef] [Green Version]
  6. Moropoulou, A.; Labropoulos, K.C.; Delegou, E.T.; Karoglou, M.; Bakolas, A. Non-destructive techniques as a tool for the protection of built cultural heritage. Constr. Build. Mater. 2013, 48, 1222–1239. [Google Scholar] [CrossRef]
  7. Lerma, C.; Mas, Á.; Gil, E.; Vercher, J.; Torner, M.E. Quantitative Analysis Procedure for Building Materials in Historic Buildings by Applying Infrared Thermography. Russ. J. Nondestruct. Test. 2018, 54, 601–609. [Google Scholar] [CrossRef]
  8. Delegou, E.T.; Mourgi, G.; Tsilimantou, E.; Ioannidis, C.; Moropoulou, A. A Multidisciplinary Approach for Historic Buildings Diagnosis: The Case Study of the Kaisariani Monastery. Heritage 2019, 2, 1211–1232. [Google Scholar] [CrossRef] [Green Version]
  9. Volinia, M. Integration of Qualitative and Quantitative Infrared Surveys to Study the Plaster Conditions of Valentino Castle. In SPIE Proceedings Volume 4020, Thermosense XXII, Proceedings of the AeroSense 2000, Orlando, FL, USA, 25–27 April 2000; Dinwiddie, R.B., LeMieux, D.H., Eds.; SPIE: Bellingham, WA, USA, 2000; pp. 324–334. [Google Scholar]
  10. de Freitas, S.S.; de Freitas, V.P.; Barreira, E. Detection of façade plaster detachments using infrared thermography—A non-destructive technique. Constr. Build. Mater. 2014, 70, 80–87. [Google Scholar] [CrossRef]
  11. Tavukçuoğlu, A.; Akevren, S.; Grinzato, E. In situ examination of structural cracks at historic masonry structures by quantitative infrared thermography and ultrasonic testing. J. Mod. Opt. 2010, 57, 1779–1789. [Google Scholar] [CrossRef]
  12. Zhang, R.; Li, H.; Duan, K.; You, S.; Liu, K.; Wang, F.; Hu, Y. Automatic Detection of Earthquake-Damaged Buildings by Integrating UAV Oblique Photography and Infrared Thermal Imaging. Remote Sens. 2020, 12, 2621. [Google Scholar] [CrossRef]
  13. Danese, M.; Demšar, U.; Masini, N.; Charlton, M. Investigating material decay of historic buildings using visual analytics with multi-temporal infrared thermographic data: Investigating material decay of historic buildings. Archaeometry 2009, 52, 482–501. [Google Scholar] [CrossRef] [Green Version]
  14. İnce, İ.; Bozdağ, A.; Tosunlar, M.B.; Hatır, M.E.; Korkanç, M. Determination of deterioration of the main facade of the Ferit Paşa Cistern by non-destructive techniques (Konya, Turkey). Environ. Earth Sci. 2018, 77, 420. [Google Scholar] [CrossRef]
  15. Moropoulou, A.; Avdelidis, N.P.; Theoulakis, P.; Koui, M. Thermography as an evaluation tool for studying the movement of water through various porous materials: Capillary rise and evaporation. In Proceedings of the SPIE Aerospace/Defense Sensing, Simulation, and Controls, Orlando, FL, USA, 16–20 April 2001; Rozlosnik, A.E., Dinwiddie, R.B., Eds.; International Society for Optics and Photonics: Bellingham, WA, USA; pp. 229–235.
  16. Lerma, J.L.; Cabrelles, M.; Portalés, C. Multitemporal thermal analysis to detect moisture on a building façade. Constr. Build. Mater. 2011, 25, 2190–2197. [Google Scholar] [CrossRef]
  17. Spodek, J.; Rosina, E. Application of Infrared Thermography to Historic Building Investigation. J. Archit. Conserv. 2009, 15, 65–81. [Google Scholar] [CrossRef]
  18. Ibarra-Castanedo, C.; Sfarra, S.; Klein, M.; Maldague, X. Solar loading thermography: Time-lapsed thermographic survey and advanced thermographic signal processing for the inspection of civil engineering and cultural heritage structures. Infrared Phys. Technol. 2017, 82, 56–74. [Google Scholar] [CrossRef]
  19. Moropoulou, A.; Avdelidis, N.P.; Koui, M.; Delegou, E.T.; Tsiourva, T. Infrared thermographic assessment of materials and techniques for the protection of cultural heritage. In Proceedings of the Multispectral Image Processing and Pattern Recognition, Wuhan, China, 22–24 October 2001; Tong, Q., Zhu, Y., Zhu, Z., Eds.; International Society for Optics and Photonics: Bellingham, WA, USA; p. 313.
  20. Adamopoulos, E.; Tsilimantou, E.; Keramidas, V.; Apostolopoulou, M.; Karoglou, M.; Tapinaki, S.; Ioannidis, C.; Georgopoulos, A.; Moropoulou, A. Multi-Sensor Documentation of Metric and Qualitative Information of Historic Stone Structures. ISPRS Ann. Photogramm. Remote Sens. Spatial Inf. Sci. 2017, IV-2/W2, 1–8. [Google Scholar] [CrossRef] [Green Version]
  21. Biscarini, C.; Catapano, I.; Cavalagli, N.; Ludeno, G.; Pepe, F.A.; Ubertini, F. UAV photogrammetry, infrared thermography and GPR for enhancing structural and material degradation evaluation of the Roman masonry bridge of Ponte Lucano in Italy. NDT E Int. 2020, 115, 102287. [Google Scholar] [CrossRef]
  22. Etxepare, L.; Leon, I.; Sagarna, M.; Lizundia, I.; Uranga, E.J. Advanced Intervention Protocol in the Energy Rehabilitation of Heritage Buildings: A Miñones Barracks Case Study. Sustainability 2020, 12, 6270. [Google Scholar] [CrossRef]
  23. Gomes-Heras, M.; López-González, L.; García-Morales, S.; Fort, R.; Álvarez de Buergo, M. Integrating Non-Destructive Techniques with Photogrammetry 3D Models for the Development of Geographic Information Systems in Heritage Structures. In Science, Technology and Cultural Heritage, Proceedings of the Second International Congress on Science and Technology for the Conservation of Cultural Heritage, Sevilla, Spain, 24–27 June 2014; Rogerio-Candelera, M.A., Ed.; Taylor & Francis Group: London, UK, 2014; pp. 429–434. ISBN 978-1-138-02744-2. [Google Scholar]
  24. Soile, S.; Tsilimantou, E.; Keramidas, V.; Karoglou, M.; Bourexis, F.; Adamopoulos, E.; Delegou, T.E.; Lampropoulos, K.; Ioannidis, C.; Moropoulou, A.; et al. Multidisciplinary Documentation Using Non-destructive Testing Techniques for the Diagnostic Study of an Ancient Temple. In Nondestructive Evaluation and Monitoring Technologies, Documentation, Diagnosis and Preservation of Cultural Heritage; Osman, A., Moropoulou, A., Eds.; Springer Proceedings in Materials; Springer International Publishing: Cham, Switzerland, 2019; pp. 17–36. ISBN 978-3-030-25762-0. [Google Scholar]
  25. Spanò, A.; Volinia, M.; Girotto, M. Spatial Data and Temperature: Relationship to Deepen. Integrated Methods for Advanced Architectural Diagnosis and Metric Documentation. In Proceedings of the art ‘05. Eightth Internation Conference on Non’Destructive Investigations and Microanalysis for the Diagnostics and Conservation of the Cultural and Environmental Heritage, Lecce, Italy, 15–19 May 2005; Marabelli, M., Parisi, C., Buzzanca, G., Paradisi, A., Eds.; Italian Society of Non-Destructive Testing Monitoring Diagnostics AIPnD: Brescia, Italy, 2005. [Google Scholar]
  26. Costanzo, A.; Minasi, M.; Casula, G.; Musacchio, M.; Buongiorno, M. Combined Use of Terrestrial Laser Scanning and IR Thermography Applied to a Historical Building. Sensors 2015, 15, 194–213. [Google Scholar] [CrossRef] [PubMed] [Green Version]
  27. Zalama, E.; Gómez-García-Bermejo, J.; Llamas, J.; Medina, R. An Effective Texture Mapping Approach for 3D Models Obtained from Laser Scanner Data to Building Documentation: An effective texture mapping approach. Comput. Aided Civ. Infrastruct. Eng. 2011, 26, 381–392. [Google Scholar] [CrossRef]
  28. Mileto, C.; Vegas, F.; Lerma, J.L. Multidisciplinary Studies, Crossreading and Transversal Use of Thermography: The Castle of Monzón (Huesca) as a case study. In Proceedings of the Modern Age Fortifications of the Mediterranean Coast—Defensive architecture of the Mediterranean (FORTMED2015), 15–17 October 2015; Editorial Universitat Politècnica de València, Ed.; Editorial Universitat Politècnica de València: Valencia, Spain, 2015. [Google Scholar]
  29. Lagüela, S.; Díaz-Vilariño, L.; Martínez, J.; Armesto, J. Automatic thermographic and RGB texture of as-built BIM for energy rehabilitation purposes. Autom. Constr. 2013, 31, 230–240. [Google Scholar] [CrossRef]
  30. González-Aguilera, D.; Rodriguez-Gonzalvez, P.; Armesto, J.; Lagüela, S. Novel approach to 3D thermography and energy efficiency evaluation. Energy Build. 2012, 54, 436–443. [Google Scholar] [CrossRef]
  31. Alba, M.I.; Barazzetti, L.; Scaioni, M.; Rosina, E.; Previtali, M. Mapping Infrared Data on Terrestrial Laser Scanning 3D Models of Buildings. Remote Sens. 2011, 3, 1847–1870. [Google Scholar] [CrossRef] [Green Version]
  32. Borrmann, D.; Elseberg, J.; Nüchter, A. Thermal 3D Mapping of Building Façades. In Intelligent Autonomous Systems 12; Advances in Intelligent Systems and Computing; Sukhan, L., Hyungsuck, C., Kwang-Joon, Y., Jangmyung, L., Eds.; Springer: Berlin/Heidelberg, Germany, 2013; Volume 193, pp. 173–182. ISBN 978-3-642-33926-4. [Google Scholar]
  33. Merchán, P.; Merchán, M.J.; Salamanca, S.; Adán, A. Application of Multisensory Technology for Resolution of Problems in the Field of Research and Preservation of Cultural Heritage. In Advances in Digital Cultural Heritage; Lecture Notes in Computer Science; Ioannides, M., Martins, J., Žarnić, R., Lim, V., Eds.; Springer International Publishing: Cham, Switzerland, 2018; Volume 10754, pp. 32–47. ISBN 978-3-319-75788-9. [Google Scholar]
  34. Yang, M.-D.; Su, T.-C.; Lin, H.-Y. Fusion of Infrared Thermal Image and Visible Image for 3D Thermal Model Reconstruction Using Smartphone Sensors. Sensors 2018, 18, 2003. [Google Scholar] [CrossRef] [Green Version]
  35. Coret, L.; Briottet, X.; Kerr, Y.H.; Chehbouni, A. Simulation Study of View Angle Effects on Thermal Infrared Measurements Over Heterogeneous Surfaces. IEEE Trans. Geosci. Remote Sens. 2004, 42, 664–672. [Google Scholar] [CrossRef]
  36. González-Aguilera, D.; Lagüela, S.; Rodríguez-Gonzálvez, P.; Hernández-López, D. Image-based thermographic modeling for assessing energy efficiency of buildings façades. Energy Build. 2013, 65, 29–36. [Google Scholar] [CrossRef]
  37. Dlesk, A.; Vach, K.; Holubec, P. Usage of Photogrammetric Processing of Thermal Images for Civil Engineers. Int. Arch. Photogramm. Remote Sens. Spat. Inf. Sci. 2018, XLII–5, 99–103. [Google Scholar] [CrossRef] [Green Version]
  38. Macher, H.; Boudhaim, M.; Grussenmeyer, P.; Siroux, M.; Landes, T. Comaination of thermal and Geometric Information for BIM enrichment. Int. Arch. Photogramm. Remote Sens. Spat. Inf. Sci. 2019, XLII-2/W15, 719–725. [Google Scholar] [CrossRef] [Green Version]
  39. Previtali, M.; Barazzetti, L.; Redaelli, V.; Scaioni, M.; Rosina, E. Rigorous procedure for mapping thermal infrared images on three-dimensional models of building façades. J. Appl. Remote Sens. 2013, 7, 073503. [Google Scholar] [CrossRef] [Green Version]
  40. Hoegner, L.; Stilla, U. Mobile thermal mapping for matching of infrared images with 3D building models and 3D point clouds. Quant. InfraRed Thermogr. J. 2018, 15, 252–270. [Google Scholar] [CrossRef]
  41. Dino, I.G.; Sari, A.E.; Iseri, O.K.; Akin, S.; Kalfaoglu, E.; Erdogan, B.; Kalkan, S.; Alatan, A.A. Image-based construction of building energy models using computer vision. Autom. Constr. 2020, 116, 103231. [Google Scholar] [CrossRef]
  42. Lin, D.; Jarzabek-Rychard, M.; Tong, X.; Maas, H.-G. Fusion of thermal imagery with point clouds for building façade thermal attribute mapping. ISPRS J. Photogramm. Remote Sens. 2019, 151, 162–175. [Google Scholar] [CrossRef]
  43. Heikkila, J.; Silven, O. A Four-Step Camera Calibration Procedure with Implicit Image Correction. In Proceedings of the IEEE Computer Society Conference on Computer Vision and Pattern Recognition, San Juan, PR, USA, 17–19 June 1997; pp. 1106–1112. [Google Scholar]
  44. Zhang, Z. A flexible new technique for camera calibration. IEEE Trans. Pattern Anal. Mach. Intell. 2000, 22, 1330–1334. [Google Scholar] [CrossRef] [Green Version]
  45. Chiabrando, F.; Donadio, E.; Rinaudo, F. SfM for Orthophoto to Generation: A Winning Approach for Cultural Heritage Knowledge. Int. Arch. Photogramm. Remote Sens. Spat. Inf. Sci. 2015, XL-5/W7, 91–98. [Google Scholar] [CrossRef] [Green Version]
  46. Peña-Villasenín, S.; Gil-Docampo, M.; Ortiz-Sanz, J. 3-D Modeling of Historic Façades Using SFM Photogrammetry Metric Documentation of Different Building Types of a Historic Center. Int. J. Archit. Herit. 2017, 11, 871–890. [Google Scholar] [CrossRef]
  47. Adamopoulos, E.; Rinaudo, F.; Bovero, A. First Assessments on Heritage Science Oriented Image-Based Modeling Using Low-Cost and Mobile Cameras. Int. Arch. Photogramm. Remote Sens. Spat. Inf. Sci. 2019, XLII-2/W17, 23–30. [Google Scholar] [CrossRef] [Green Version]
  48. Bisegna, F.; Ambrosini, D.; Paoletti, D.; Sfarra, S.; Gugliermetti, F. A qualitative method for combining thermal imprints to emerging weak points of ancient wall structures by passive infrared thermography—A case study. J. Cult. Herit. 2014, 15, 199–202. [Google Scholar] [CrossRef]
  49. Adamopoulos, E.; Rinaudo, F. Enhancing Image-Based Multiscale Heritage Recording with Near-Infrared Data. IJGI 2020, 9, 269. [Google Scholar] [CrossRef] [Green Version]
  50. Sánchez, J.; Quirós, E. Semiautomatic detection and classification of materials in historic buildings with low-cost photogrammetric equipment. J. Cult. Herit. 2017, 25, 21–30. [Google Scholar] [CrossRef]
Figure 1. Three-dimensional temperature mapping workflow.
Buildings 10 00187 g001
Figure 2. Instrumentation used (from left to right): FLIR T1030sc, FLIR SC660, and Canon Rebel-SL1.
Buildings 10 00187 g002
Figure 3. Schematic representation of the acquisition which employs two cameras; RGB and thermal-infrared (TIR) images are captured with the integrated sensors of a thermal camera, and high-resolution RGB images are captured with a high-resolution optical camera.
Buildings 10 00187 g003
Figure 4. (a) Original thermal image with detected the checkerboard points and (b) undistorted thermal image.
Buildings 10 00187 g004
Figure 5. Matched features on RGB and thermal image-pair.
Buildings 10 00187 g005
Figure 6. Visualization of the thermal image acquisition geometry.
Buildings 10 00187 g006
Figure 7. View of the façade’s model with thermal texture.
Buildings 10 00187 g007
Figure 8. Close-up view of occluded areas with blurred thermal texture.
Buildings 10 00187 g008
Figure 9. Façade models produced by Canon Rebel-SL1 and FLIR T1030sc optical imagery (a), FLIR T1030sc optical imagery (b), and FLIR T1030sc thermal-infrared imagery (c).
Buildings 10 00187 g009
Figure 10. Absolute distances between reference model produced by Canon Rebel-SL1 optical imagery and FLIR T1030sc optical imagery (a), and FLIR T1030sc thermal-infrared imagery (b).
Buildings 10 00187 g010
Figure 11. Thermal orthophoto-mosaics of the façade (a) and overlay on RGB mosaic (b)—produced with the proposed workflow (top), produced using imagery from both thermal and optical sensors of the thermo-camera (middle), and using only thermal imagery (bottom).
Buildings 10 00187 g011
Figure 12. Comparison between orthophoto-mosaic for part of the façade produced with the discussed workflow using the sc1030 camera (a) and the 660SC camera (b).
Buildings 10 00187 g012
Figure 13. Thermal orthophoto-mosaic produced with FLIR 660SC imagery.
Buildings 10 00187 g013
Figure 14. View of final 3D thermal model of a column’s base, where the position of restoration materials can be observed.
Buildings 10 00187 g014
Figure 15. Measurement of thermal intensity values in ImageJ.
Buildings 10 00187 g015
Table 1. Comparison between photogrammetric reconstructions from different datasets.
Imagery DatasetRMSE *-Control Points (cm)RMSE *-Check Points (cm)Point Cloud Density (Millions of Points)
thermal images-FLIR T1030sc1.01.81
optical images-FLIR T1030sc1.82.81
optical images-FLIR T1030sc and Canon Rebel-SL10.90.711
optical images Canon Rebel-SL10.40.410
Note—*: Root-Mean-Square Error.
Publisher’s Note: MDPI stays neutral with regard to jurisdictional claims in published maps and institutional affiliations.

