Article

Electropolishing of Stainless Steel in Laboratory and Industrial Scale

by
Paweł Lochyński
1,*,
Sylwia Charazińska
1,
Edyta Łyczkowska-Widłak
1 and
Andrzej Sikora
2
1
Institute of Environmental Engineering, Wrocław University of Environmental and Life Sciences, Pl. Grunwaldzki 24a, 50-365 Wrocław, Poland
2
Division of Electrotechnology and Materials Science, Research Network Łukasiewicz -Electrotechnical Institute, M. Skłodowskiej-Curie 55/61, 50-369 Wrocław, Poland
*
Author to whom correspondence should be addressed.
Metals 2019, 9(8), 854; https://doi.org/10.3390/met9080854
Submission received: 2 July 2019 / Revised: 24 July 2019 / Accepted: 2 August 2019 / Published: 5 August 2019
(This article belongs to the Special Issue Surface Treatment Technology of Metals and Alloys)

Abstract

:
Transposing the process scale from laboratory to industrial conditions is a difficult issue that applies to many sectors of the industry. As far as electropolishing of stainless steel is concerned, the limitations connected with a significant increase in the area of electropolished surface should be considered, along with the possibility of defects that may emerge. This paper compares the results of electropolishing of stainless steel in the laboratory and in industrial conditions. For the analyzed conditions, it was determined that the best results, both in laboratory and industrial conditions, were obtained at temperature of 35 °C and current density of 8 A·dm−2. High temperatures resulted in the emergence of defects on the surface, in particular for industrial samples. The defects were visualized by metallographic images with Nomarski contrast and atomic force microscopy. X-ray photoelectron spectroscopy tests were used to analyze the composition of the passive layer on the electropolished surfaces.

1. Introduction

The electropolishing process (EP) is a widely used method of stainless steel processing, which improves its aesthetic values through smoothening and glossing the surface [1,2] and improving its corrosion resistance at the same time [3,4]. This approach has numerous applications, including the food processing industry and medicine [5,6,7].
Subject literature discusses the attempts to upscale the process from laboratory to industrial conditions in various sectors of industry, including chemical industry [8,9], metallurgical industry [10,11], construction materials [12] or industrial wastewater treatment [13]. This is an extremely difficult and complex issue. The differences that result from upscaling often require modifying specific elements of the process. However, as far as electropolishing is concerned, it is difficult to find any publications that would compare the results of laboratory and industrial tests.
The selection of such process parameters as the applied temperature and current density is of key importance for the obtained results. Pendyala et al. [14] focused on monitoring surface roughness during the electropolishing process. The selection of the optimum parameters of the electropolishing process was described by Maciąg et al. [15]. These authors compared various methods of preparation of sample surface before the process as well as the duration of the electropolishing process and the current density used. The authors also presented the influence of the analyzed parameters on roughness results Ra and Sa and on the appearance of the final surfaces visualized with use of optical profilometry. On the other hand, Jin et al. [16] examined the influence of changeable values of temperature and rotation rate of the mixer on the polishing rate, surface roughness, surface topography and chemical composition after the process. This enabled the selection of the optimum parameters for the analyzed process.
The aspect that requires broader verification is the influence of the changing contamination of process baths on the results of the electropolishing process that may be obtained [17,18]. It is essential to determine the threshold level of process bath contamination, up to which the bath may be used, so as to reconcile the satisfying results of electropolishing, the viability of the process and the lowest possible negative environmental impact. The contamination of process bath increases with exploitation time as a result of the dissolution of the surface of electropolished details. Exploited baths are characterized by very high concentrations of metal ions, mainly iron, chromium and nickel ions, which may cause problems with the neutralization of wastewater that is generated in the process. The higher the concentration of contaminants in the bath, the more its density increases. As a result, more concentrated solutions are taken out on the surface of details, which, in turn, results in their penetration to the wastewater that is generated while rinsing higher loads of contaminants between processes.
Maintaining a high quality of the electropolished surfaces, mainly high gloss and low roughness, is the key element of the process conducted in an industrial scale. Because of this, as the exploitation time and contamination of the electrolyte increase, a longer duration of the process or applying higher current density values is required. Extending the duration of electropolishing leads to increasing costs caused by lower performance, including higher demand for electric energy. The increasing contamination of process bath may also lead to the emergence of such defects as shadows, smudges or “orange peel effect” on the surface of electropolished elements [19]. Such defects may result from improper composition or manufacturing process of the material as well as from the course of the process in itself, e.g., the use of improper current density or temperature. Increased electrolyte density may lead to local overheating and, as a result, to the intensification of the emerging defects. The authors attempted to visualize the surface with defects with use of confocal microscopy [20], scanning electron microscopy [21] as well as atomic force microscopy [17]. Unfortunately, as the measurement field of the above techniques is very limited, defects visible with the bare eye are not always possible to be visualized at lower scales, and so it is not always possible to compare them.
The initial verification of the course of the process and of the results that could be obtained in laboratory conditions has been presented in several publications [22,23]. The selection of optimum process parameters in laboratory conditions involves much lower costs of the material used and much less effort. However, the values that are considered best in laboratory conditions cannot always be applied directly in an industrial scale. As for the process of electropolishing chromium-nickel steel, literature quite often suggests applying high current densities [24] and conducting the process at the oxygen evolution potential [25]. In industrial conditions, using high current densities during the electropolishing of large-size details results in excessive emission of gaseous oxygen and overheating of the electrolyte, which may lead to the emergence of defects.
In order to determine the interrelations and to select the most beneficial parameters of the process, the roughness and gloss of samples electropolished both in laboratory and industrial conditions were analyzed. The ranges of temperature and current density selected for the purposes of the research were justified from the point of view of the possibility to conduct the process both in laboratory and industrial conditions. The defects that emerged on the surface of the electropolished samples were visualized with use of metallographic imaging and the AFM technique. Additionally, the composition of the passive layer on the obtained surfaces was visualized with XPS.

2. Materials and Methods

Experimental system of electropolishing process in industrial and laboratory conditions is presented in form of block scheme (Figure 1).

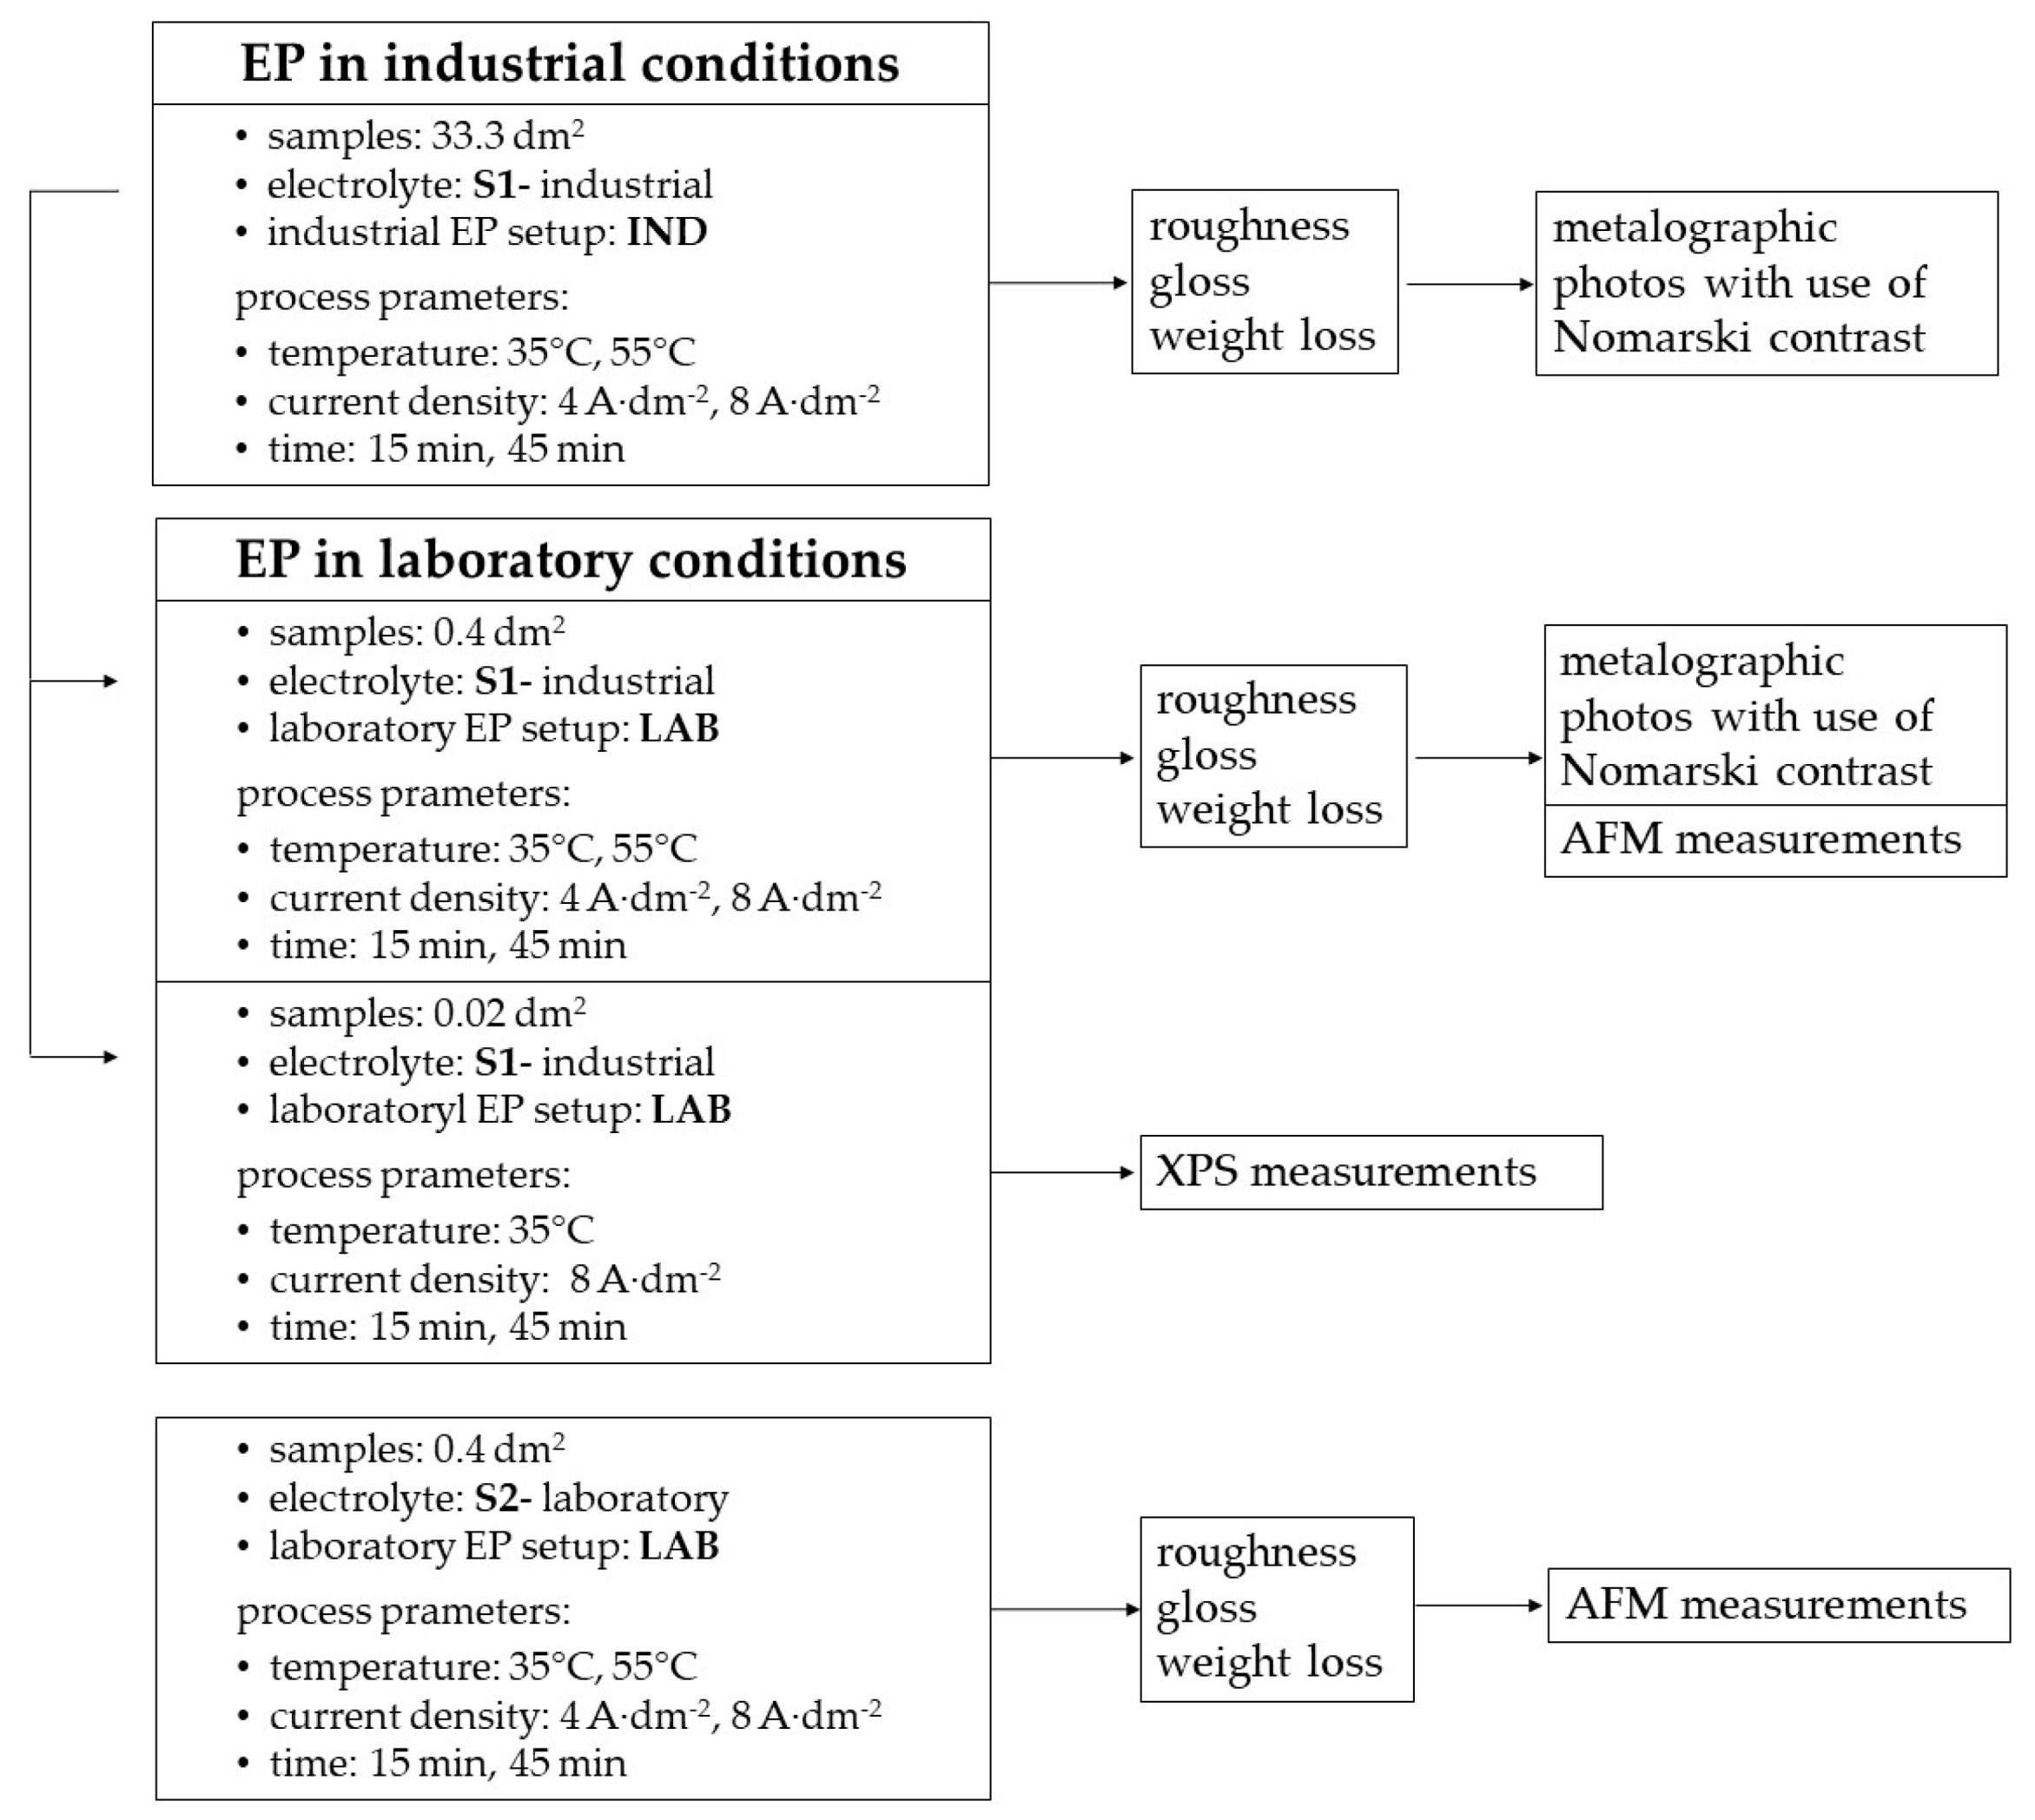
2.1. Experimental Setup

The electropolishing laboratory setup—LAB—contained the following elements: Laboratory power supply unit KP-131 (KP-Elektronika, Dzierżoniów, Poland), electric charge counter (KP-Elektronika), water bath (Pilot ONE Huber CC-K12, Offenburg, Germany), EUROSTAR 60 control mechanical mixer (IKA POL, Warszawa, Poland). During the electropolishing process, the polished samples (anodes) were placed centrally, while stainless steel cathodes were located on the external sides of the anodes, at 20 mm distance.
Tests in the industrial scale (industrial setup—IND) were conducted in a processing bath of a working capacity up to 8 m3. It was equipped with copper busbar connected to ETG 15/3000 rectifier (ELEKTRO-TECH, Dzierżoniów, Poland). During the electropolishing process, the polished samples (anodes) were placed centrally, while stainless steel cathodes were located on the external sides of the anodes, at 200 mm distance. The distances between electrodes were as small as possible, but maintaining a safe distance was necessary due to the fixing method that minimized the risk of contact between rails and electrodes. Current parameters, time and temperature were controlled with use of the control panel KP-Elektronika that enables galvanostatic mode of operation.

2.2. Materials

Tests were conducted on AISI 304 stainless steel. Samples were cut out from cold-rolled 1.5 mm thick stainless steel sheets.
Electropolishing in an industrial conditions was conducted on samples of a length of 1250 mm and a width of approx. 132 mm, of a surface area of approx. 33.3 dm2. Before the process, samples were degreased by immersion in a diluted processing bath solution, and after electropolishing they were subjected to multi-step rinsing.
Electropolishing in laboratory conditions was conducted on samples 30 mm wide and 90 mm long, with a hole of a diameter of 12 mm located 5 mm away from the upper edge. The upper part of the samples was protected with the polytetrafluoroethylenetape, and the resulting exposure surface was 0.4 dm2. Before the electropolishing process, samples were degreased with acetone and then rinsed in distilled water. Each of these processes lasted 20 min, and they were performed in an Emmi 60 HC (EMAG AG, Mörfelden-Walldorf, Germany) ultrasonic bath. After drying, samples were weighed on XS 204 Analytical Balance (Mettler Toledo, Greifensee, Switzerland). After the electropolishing process, samples were subjected to multi-stage rinsing in distilled water. The final stage was rinsing in ultrasonic bath for 20 min, followed by drying and repeated weighing.
XPS tests were conducted on round samples of a diameter of 16.7 mm, with a hole of a diameter of 1 mm located 1 mm away from the edge of sample. Before the electropolishing process, samples were degreased with acetone and then rinsed in distilled water for 20 min in ultrasonic bath. After the electropolishing process, samples were subjected to multi-stage rinsing in distilled water. Additionally, immediately after the electropolishing and rinsing process, some of the samples were passivated by immersing them in HNO3 solution (250 cm3 HNO3 65%, 750 cm3 DI) of a temperature of 25 °C for 30 min. Then, after passivation, samples were rinsed in an ultrasonic bath for 20 min and dried, in the same way as the remaining samples.

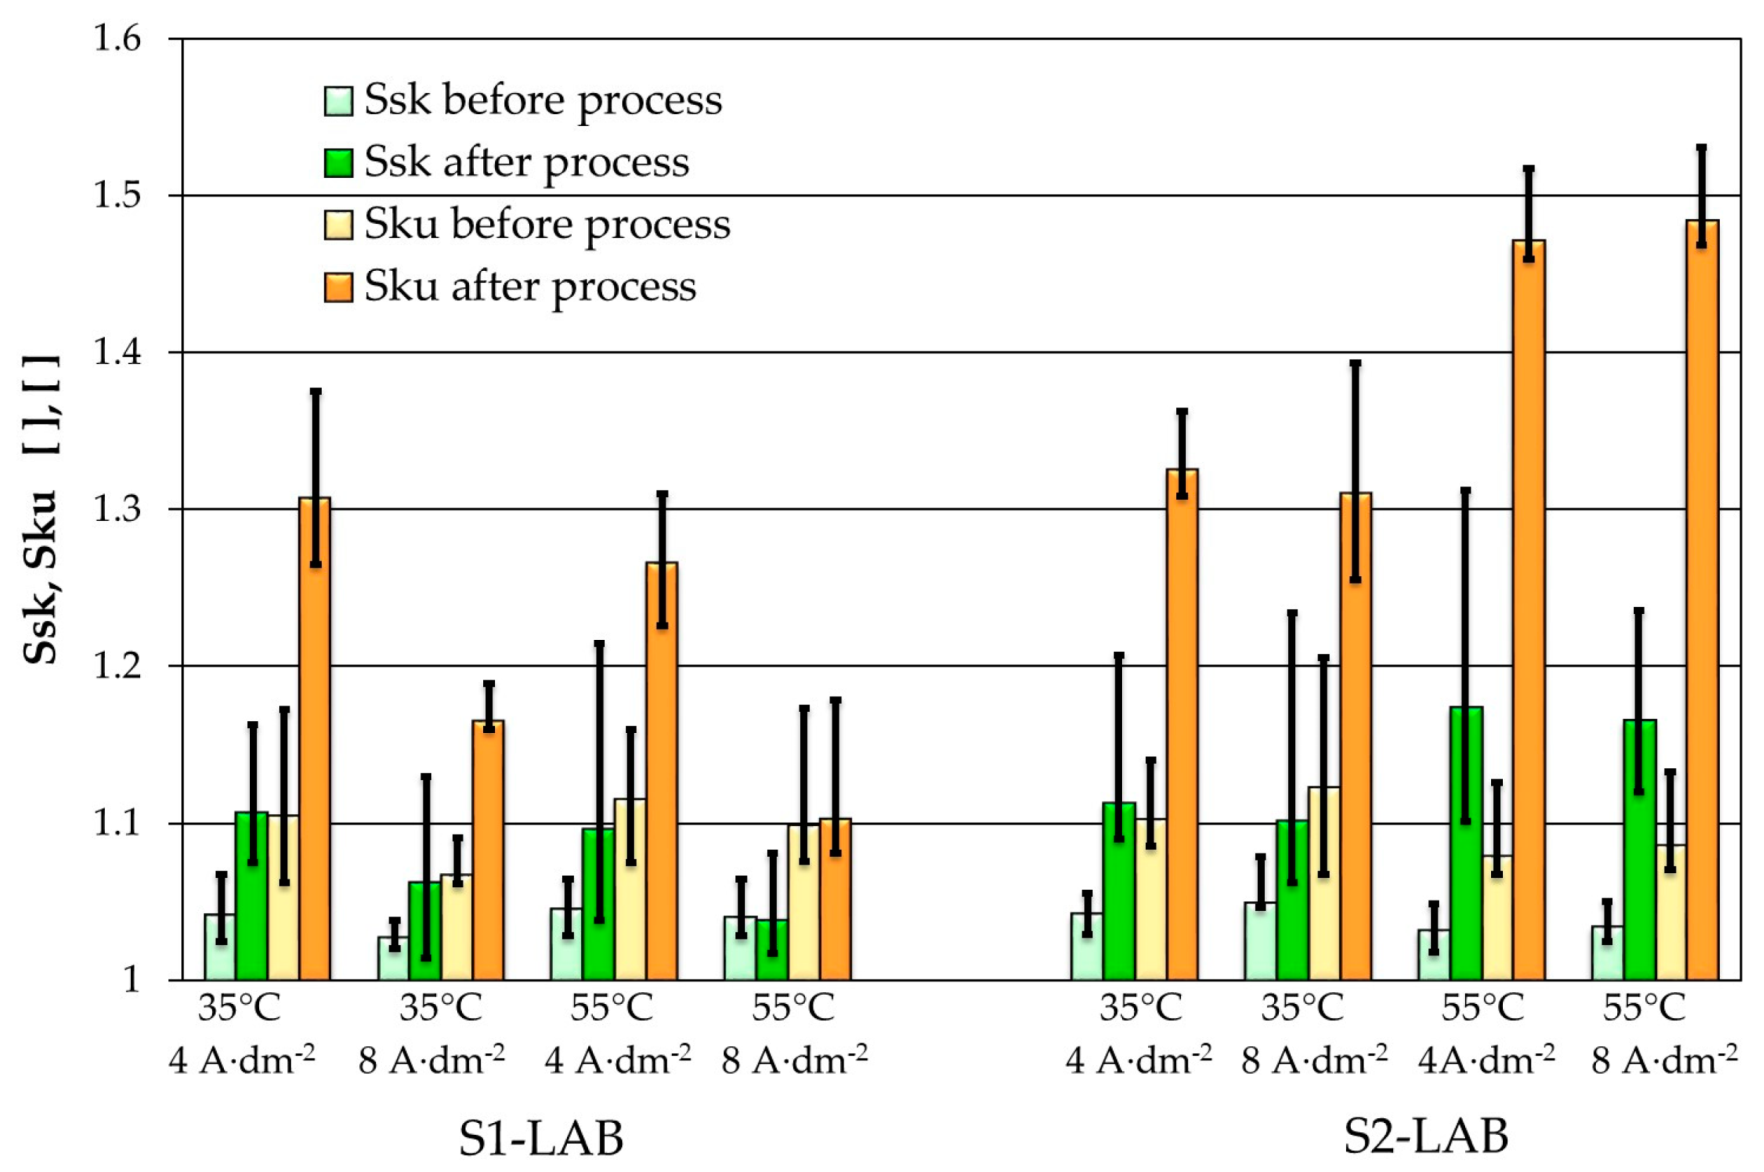
2.3. Roughness Tests

Sample roughness was measured with use of the Surftest SJ-301 (Mitutoyo, Japan) roughness measuring instrument. Measurements were taken at the central axis, parallel to the upper edge of the sample, at equal distances. Six measurements were taken for each laboratory sample and 10 for each industrial sample.

2.4. Gloss Tests

The gloss of samples was measured with use of the Rhopoint IQ goniophotometer, (Rhopoint Instruments, Hastings, UK). The option of the instrument selected for further comparison was the measurement of gloss at the angle of 20°, which, according to the recommendations of the manufacturer [26], should be used for measuring high-gloss coatings and polished metals, as it allows obtaining enhanced accuracy and resolution. As it was in the case of roughness tests, 6 measurements were taken for each laboratory sample and 10 for each industrial sample.

2.5. Atomic Force Microscopy

Atomic force microscopy is one of the ultimate diagnostic devices that allows measuring the surface topography with nanometer resolution. Therefore, its potential in the observation of the impact of a certain process or medium on the morphological properties of the material is widely utilized [27,28,29]. The measurements were carried out with DI3000 atomic force microscope (manufactured by Digital Instruments company, Santa Barbara, CA, USA), equipped with 100 µm × 100 µm scanner. TappingMode (intermittent mode) was used in order to minimize the risk of surface damage by the scanning tip and to reduce the tip wear. The measurements were performed in air, at room temperature 22 °C, and 37% RH (relative humidity). The Nanosensors Pointprobes (Neuchâtel, Switzerland) were used (nominal tip radius rtip = 10 nm, resonance frequency fres = 306–353 kHz, and spring constant range k = 43–68 N∙m−1). The scanning resolution was 512 × 512 points. In order to perform the data analysis and imaging, SPIP software (version 5.1.7) from Image Metrology company was used [30].

2.6. X-Ray Photoelectron Spectroscopy

X-ray photoelectron spectroscopic (XPS) measurements were performed using the PHI 5000 VersaProbe (ULVAC-PHI, Enzo Chigasaki, Japan) spectrometer with monochromatic Al Kα radiation (h = 1486.6 eV) X-ray source. The X-ray source was operating at 100 µm spot size, 25 W and 15 kV. The hemispherical analyzer at the pass energy of 117.4 and the energy step size of 0.1 eV was used to collect the high-resolution (HR) XPS spectra. The X-ray beam was incident at the sample surface at the angle of 45° with respect to the surface normal, and the analyzer axis was located at 45° with respect to the surface.
The Thermo Avantage software (version 5.9906) was used to evaluate the XPS data. Deconvolutions of all HR XPS spectra were analyzed using a Shirley background and a Gaussian peak shape with 30% Lorentzian character. Characteristic sensitivity factors for monochromatic X-ray source were used to estimate the quantitative chemical composition of the investigated samples (MultiPak or Thermo database).
The depth profiles of chemical composition were prepared by bombardment of the surface of samples with argon ions (beam energy 500 V, duration 0.5 min, argon ion sputtering rate 1.29 nm/min with respect to the SiO2 pattern).

3. Results

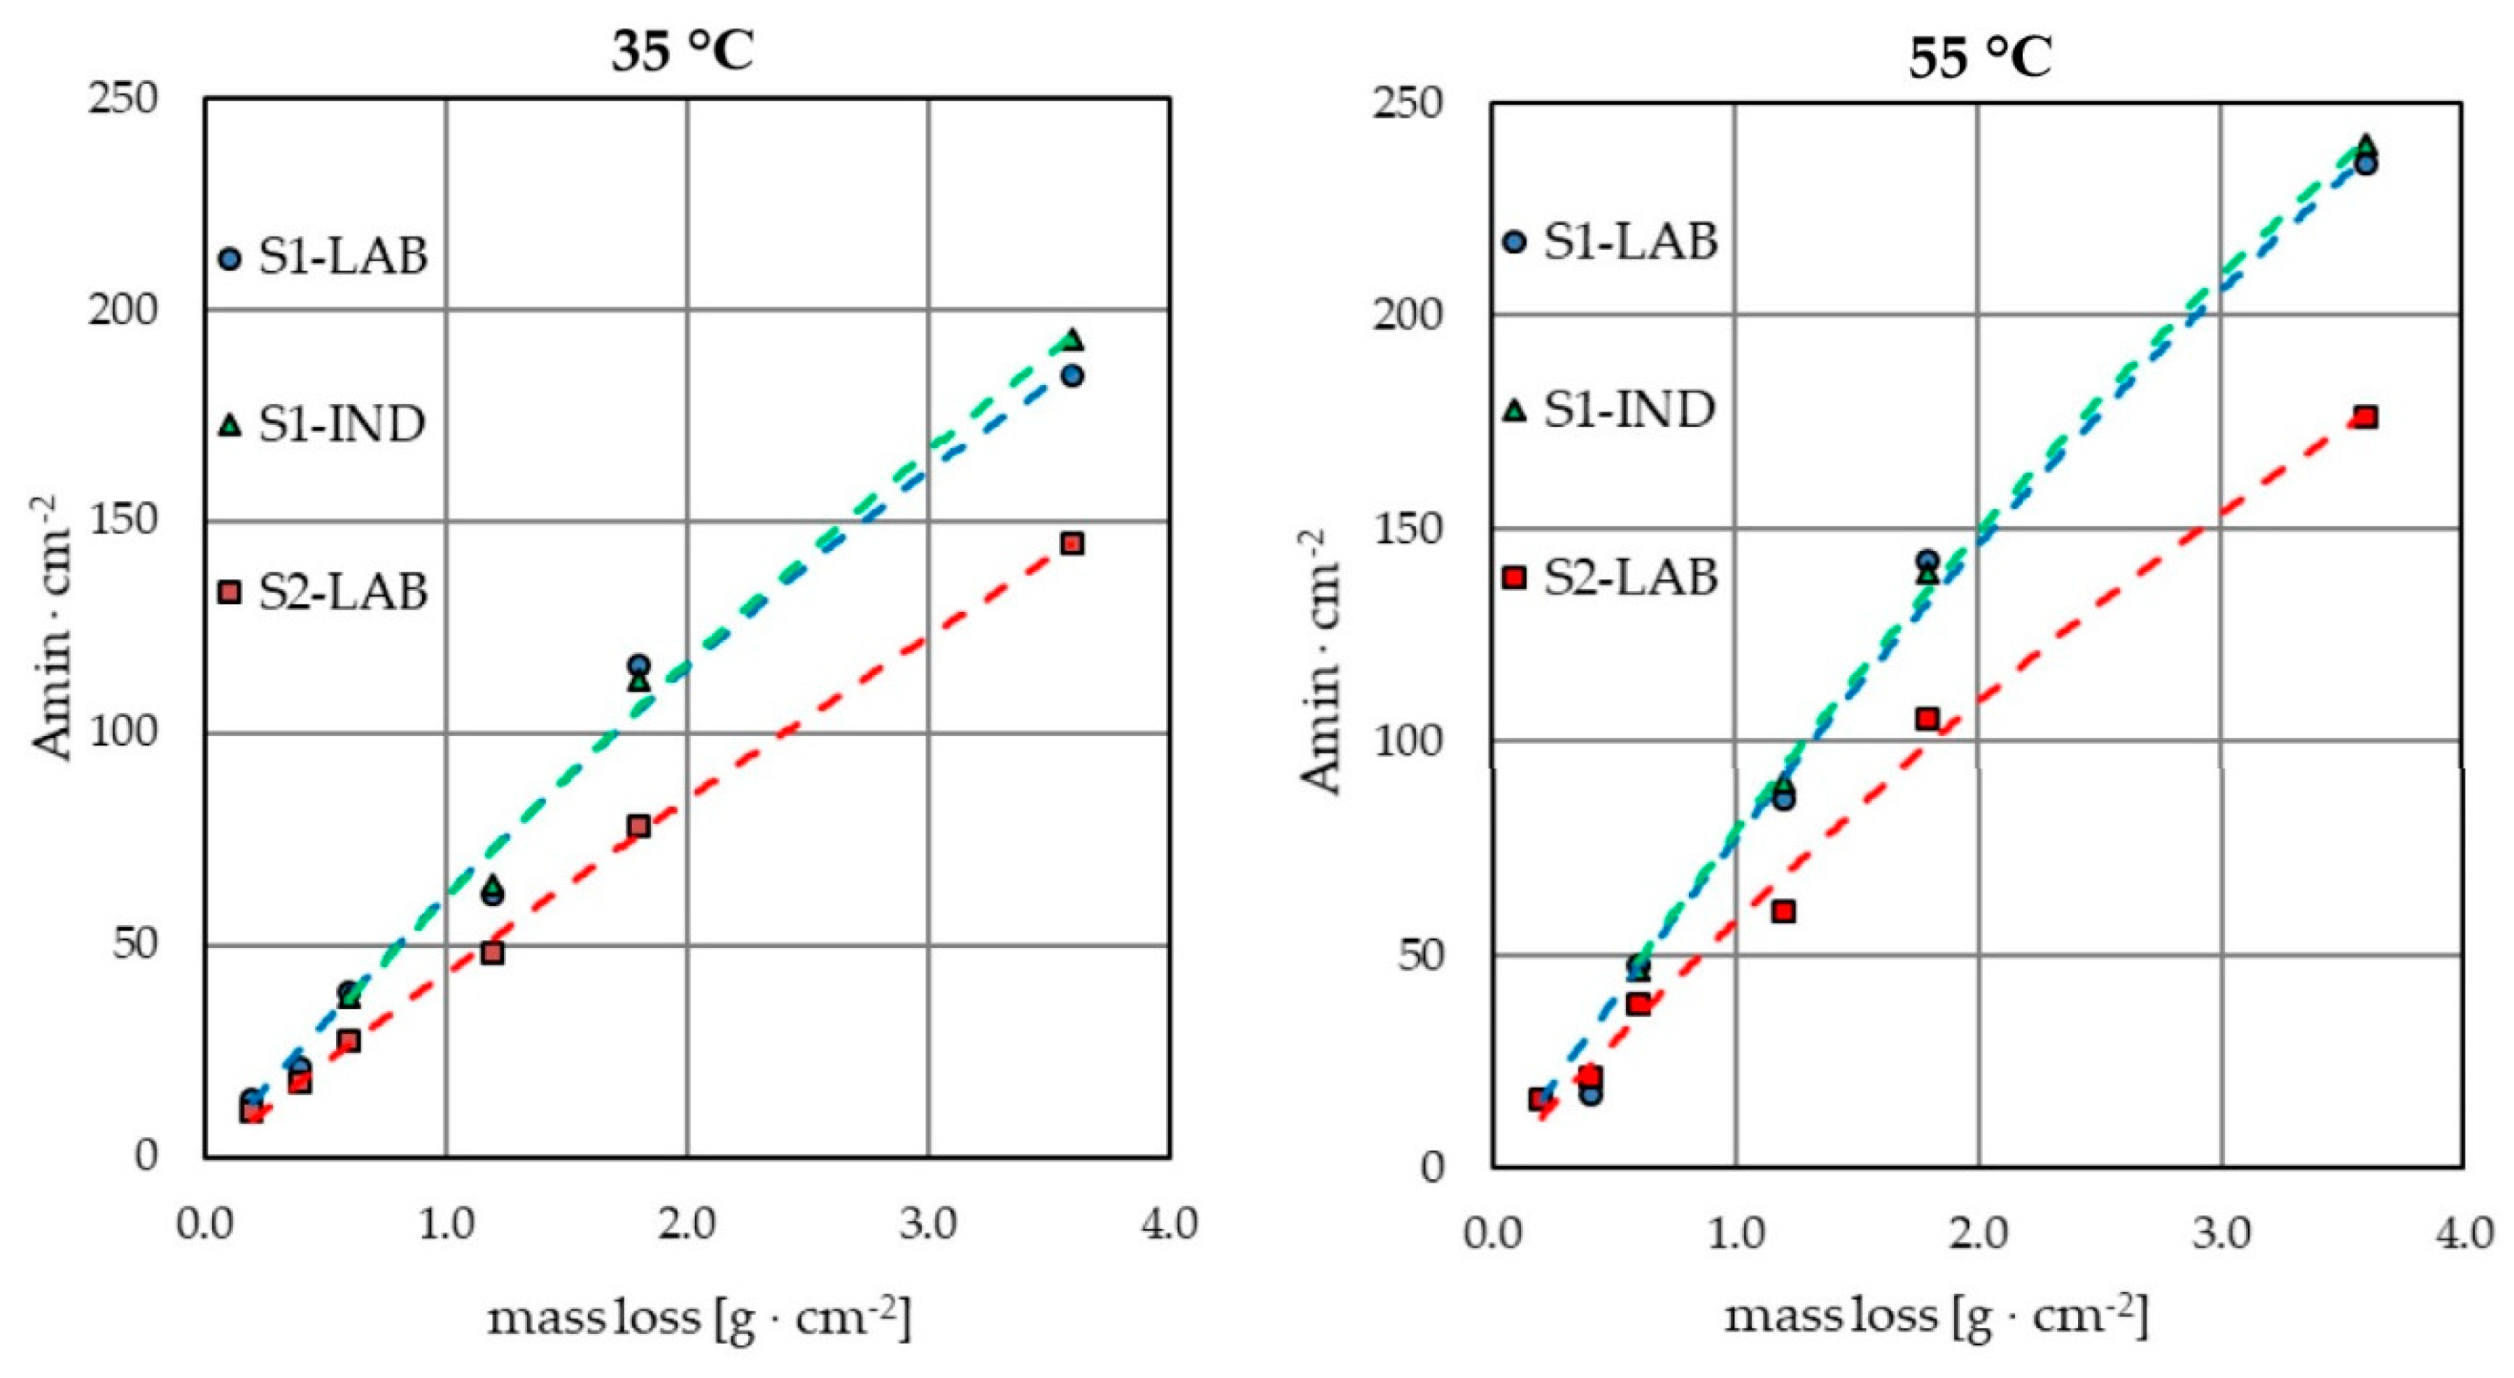
3.1. Electropolishing in Laboratory and Industrial Scale

The conducted research consisted of the electropolishing of samples in industrial (IND) and laboratory (LAB) conditions. In the industrial scale, the electropolishing process (IND) was conducted on samples from 304 steel, of a surface of exposure of 33.3 dm2, which was a much larger surface area than the laboratory samples. Their surface was similar to the surfaces of real elements electropolished in industrial conditions. The use of small laboratory samples in industrial conditions would not give reliable results because of the need for the use of very low current, which is not used in industry. The electrolyte was an industrial processing bath (S1) being a mixture of orthophosphoric acid, sulfuric acid and an organic additive—triethanolamine—which accounted for 3% by mass of the whole solution. Series of samples were processed with use of the bath on the initial stage of exploitation—approx. 0% iron content—and exploited bath—iron content approx. 3% by mass.
In order to recreate the industrial process in laboratory conditions (LAB), the same bath was used (S1), also on 2 stages of industrial exploitation, and the same values of temperature, current density and duration were applied. The samples electropolished in laboratory tests had an area of exposure of approx. 0.4 dm2.
In order to further compare the results, laboratory tests (LAB) were conducted with use of laboratory bath (S2). The initial composition of the prepared bath was the same as that of the industrial bath.
Table 1 presents the results of roughness average Ra and gloss of samples from three measurement series after the electropolishing process at various parameters of duration, temperature, current density and level of contamination of the electrolyte. The range of parameters was chosen based on the values used in the process of electropolishing in industrial conditions. Based on industrial data, a temperature range of 35–55 °C has been chosen, which is used in industry as well as current densities of 4 A·dm−2 and 8 A·dm−2 resulting from technical limitations. In the case of large-size parts electropolished in industrial conditions, the given parameters were passible to obtain. The best roughness results for all analyzed measurement series were obtained for the application of high current density 8 A·dm−2, low temperature 35 °C and the duration of 45 min. For process baths on the initial stage of use, gloss exceeding 1000 GU (1105 ± 76 GU) and roughness of 0.10 µm was obtained for the process conducted in laboratory scale and roughness of 0.08 µm for industrial scale. Process baths on advanced stage of use allowed us to obtain slightly worse, yet similar results of gloss: 978 ± 79 GU, and roughness: 0.10 ± 0.03 µm. The conducted tests that took into consideration a wide range of analyzed parameters may constitute a basis for the determination of the optimum process conditions for all analyzed series (Table 1, values in bold). The conducted laboratory tests allowed us to select the recommended parameters for the process conducted in an industrial scale. The use of recommended parameters enabled us to obtain differences between roughness of the S1-LAB and S1-IND series of approx. 20% for baths on the initial stage of use and 25% for baths on advanced stage of use. The other variants of temperature and current density applied in industrial conditions led to the emergence of defects on the surface of the electropolished samples, which was reflected both in high roughness results, exceeding 0.24 µm and even reaching 0.55 µm, and low gloss values, below 500 GU. In laboratory conditions, defects were noted only in some cases so that the differences between samples electropolished in laboratory and industrial conditions were several times higher.
The weight loss of samples caused by the electropolishing process was compared. The same trend was noted for all analyzed measurement series—weight loss increased with the increase in process temperature and the applied current density (Figure 2). Additionally, if different durations were applied, the weight loss increased proportionally to the extension of process duration. A comparison of the influence of the applied electrolyte on weight loss was also conducted. The weight loss results per exposure surface were very similar for the measurement series S1-IND and S1-LAB, where the same electrolyte was used as industrial processing bath. One should bear in mind that the tests for the S1-IND series were conducted on samples of a significantly larger surface area than for the S1-LAB series. Although the difference in the size of the electropolished surfaces was over 80-fold, the obtained results expressed in g·cm−2 differed only by 2–5% for all the applied variants of temperature, current density and process duration. In a similar comparison of series of tests conducted on laboratory samples with use of the S1-LAB industrial bath and S2-LAB laboratory bath, the differences in weight loss reached even up to approx. 30%, although the samples used were identical.
The conducted laboratory tests may constitute a basis for estimating the expected weight loss in industrial conditions if the same processing bath is used. Knowledge of the estimated weight loss values is essential, especially when planning the process in a technical scale. It allows conducting the process at parameters that limit material losses and thus slow down the process of processing bath contamination that results from the dissolution of the surface of electropolished metals. As a result, it reduces the concentration of metal ions in the generated wastewater. However, upscaling entails the need to consider certain factors that are absent in laboratory conditions. When planning technological processes, one should remember that not all parameters may be achieved in an industrial scale and take into account the capacity of the equipment used. Sometimes, apparently small changes in one of such parameters as temperature or current density may require replacing the equipment with devices that are capable of ensuring the appropriate values of these parameters, which generates much higher costs in industrial conditions.

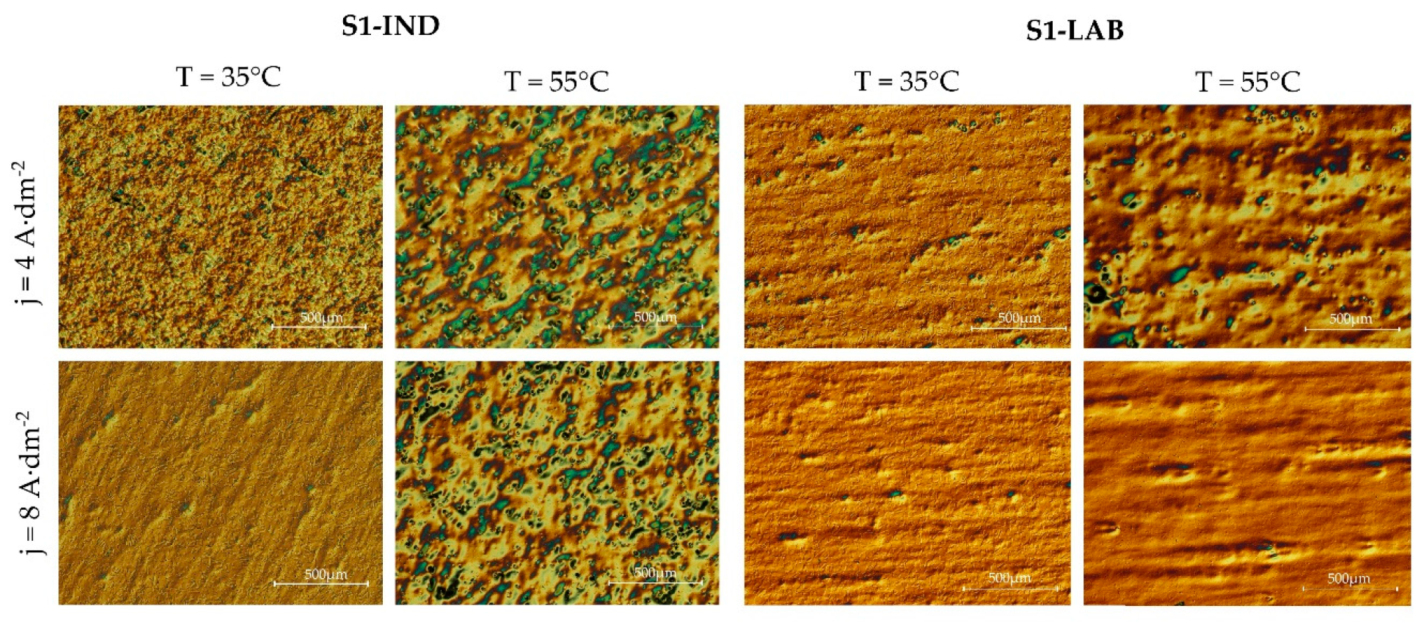
3.2. Selected Metallographic Images

The series of samples tested in the S1-IND industrial conditions was characterized by defects of a varied degree of intensity, depending on the applied variants of temperature and current density (Figure 3). These defects were manifested partly as a deterioration of roughness and gloss results, and in the most intensive cases the emerging irregularities could also be observed with the bare eye. This means that the defects have a major influence on the aesthetical values of the surface created in the electropolishing process.
It was noted that the best results were obtained at low temperature of 35 °C and high current density 8 A·dm−2. The emerging irregularities became more intensive with the temperature increase and current density decrease. It was analyzed whether similar results would be obtained when using the same processing bath in S1-LAB laboratory conditions. In this case, certain defects also emerged, but they were not as intensive as in the case of industrial samples. In industrial conditions, high temperature of the process as well as the increase in density resulting from bath contamination may cause local overheating of the electrolyte. This, in turn, may make it more likely for defects to emerge on the electropolished surface.
In order to visualize the obtained surfaces, metallographic photos of samples conducted in an industrial scale S1-IND and laboratory scale S1-LAB at varied process parameters with Nomarski contrast were taken. The phosphate and sulphate processing bath with an addition of triethanolamine contained 3 mass.% iron ions. The analysis of the resulting images reveals that, although the intensity of the emerging irregularities was lower, their visibility still increased with the increase in temperature and decrease in current density.

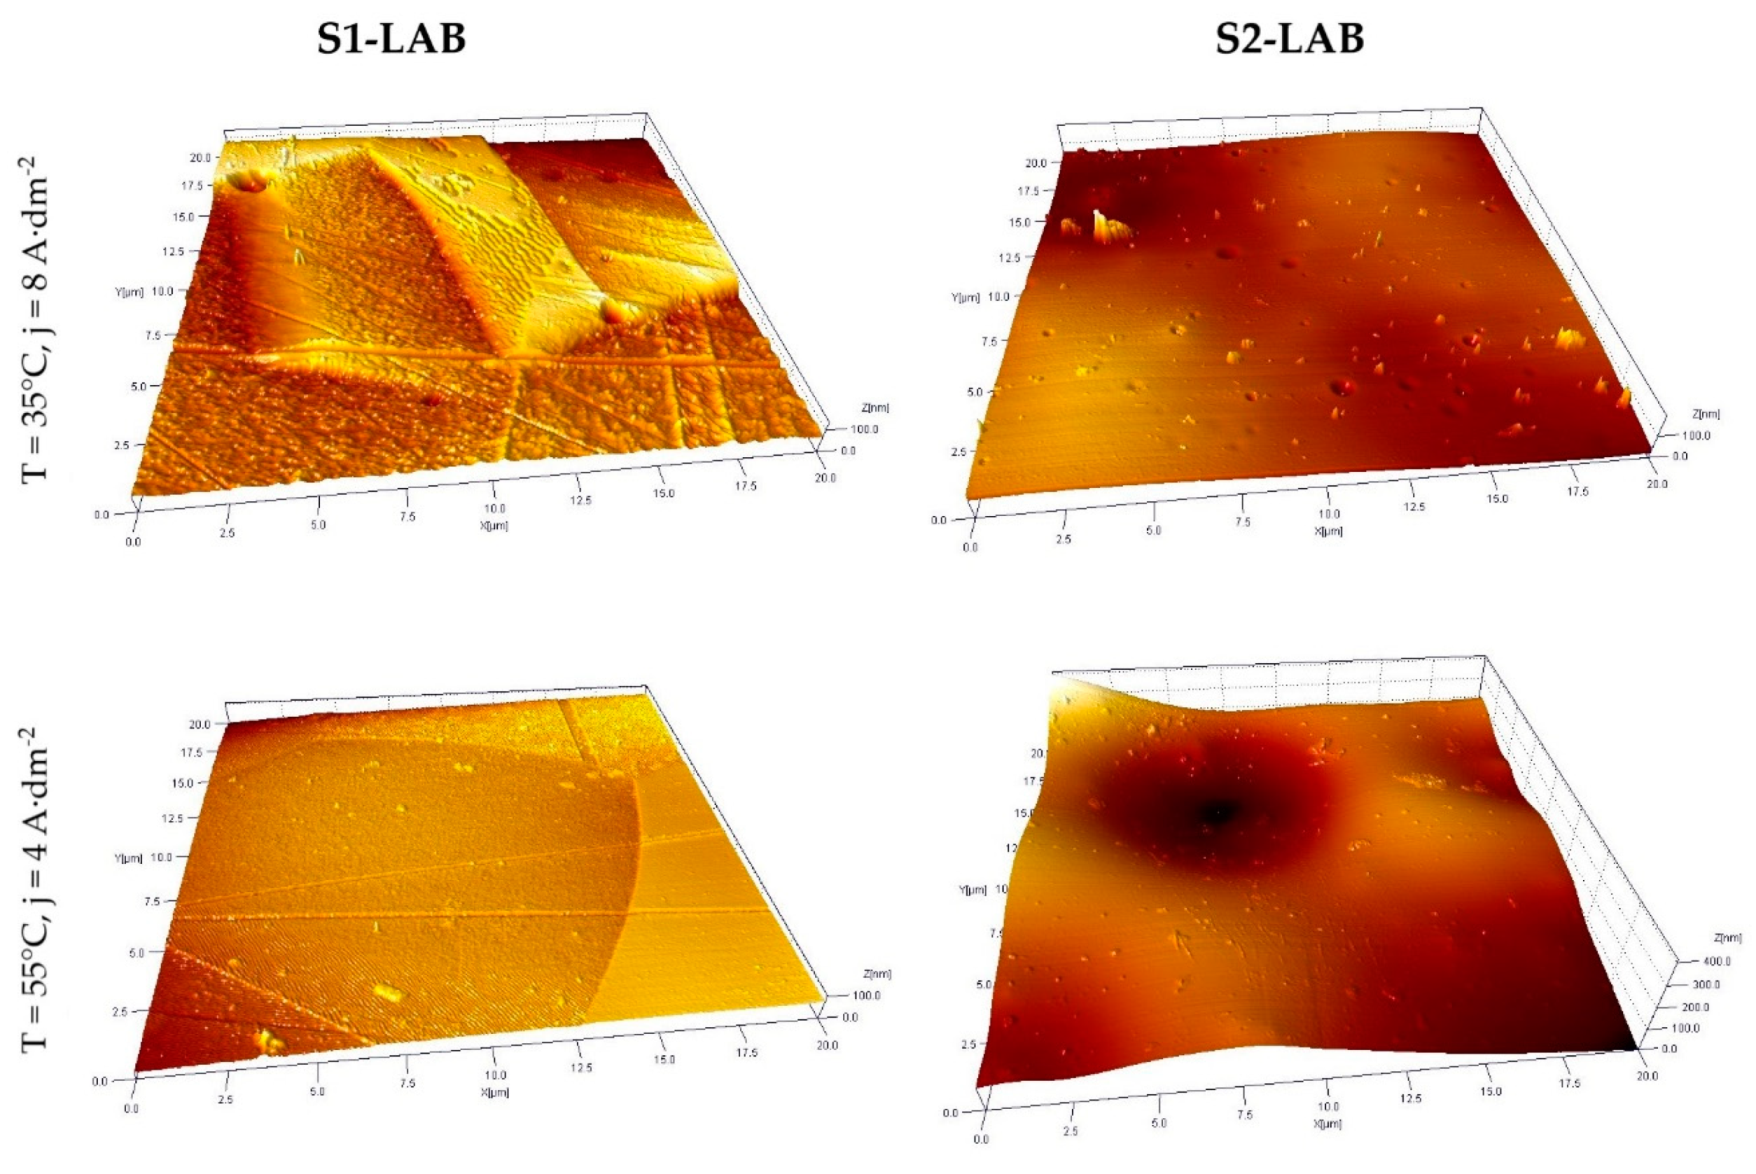
3.3. Selected AFM Images

The data acquired with atomic force microscope allowed us to notice significant differences between the surface properties of S1-LAB and S2-LAB in micron and submicron scale (Figure 4). The Z-scale (height) was increased referring to the X and Y scales in order to improve the visibility of the morphological details. As far as S1-LAB is concerned, the presence of grains is clearly visible, as well as the fine structures within grains. Scratches developed during the fabrication, storage or preparation process can also be seen. On the other hand, the surfaces of S2-LAB samples are characterized by very smooth morphology containing micrometer-size hills and holes, probably revealing the presence of the grains. In addition, the submicron-size round holes are present. One can argue whether they were developed during the electropolishing process in the spots containing some material defects. Finally, some submicron, sharp-edge hills can be found as the traces of the etching solution contamination, which stuck to the surface. It has to be emphasized that the surface features revealed by AFM and optical profilometry and the roughness statistics calculated using the acquired data deliver information in different spatial scales, therefore the mismatch between presented information is related to the complementary character of the data, not its inconsistency.
The analysis was aimed at determining the following parameters: Surface average roughness Sa and root mean square height Sq quantify roughness, while Sku describes the degree of accumulation of height distribution values, Ssk provides the information about the dominant structures: Holes or hills, Sdr expresses the increment of the interfacial surface area relative to the area of the projected and, finally, Sdq is the RMS-value of the surface slope within the sampling area, therefore it provides the information about the steepness of the feature’s edges.
The analysis of quantitative roughness data acquired on the samples processed in lab conditions allowed us to notice a significant improvement of the surface in terms of Sa, Sq (Figure 5), Sdq and Sdr parameters by approx. one order of magnitude. In addition, the Ssk and Sku parameters (Figure 6) reveal improved surface quality in terms of the polishing process—narrower height distribution and smaller contribution of the holes-like features. One should keep in mind that Ssq maintains 0 value for fully symmetric surfaces. On the other hand, the Sku factor typically is in the 1 to 3 range, while 3 means very narrow height distribution. The decrease in the Sdq parameter provides information that the edges of the structures are smoother and less vertical. It plays an important role in situations when the surface shouldn’t be easily contaminated. In analyzed data, one could notice the decrease in the Sdq parameter between approximately 0.5 to 0.1. Therefore, this parameter shows that the surface may stay clean longer and that the amount of the contamination on the surface may be lower in similar conditions. The behavior of the Sdr parameter indicates a similar tendency, yet the electropolishing process caused the reduction of this factor in the range from 0.1 to 0.01. One can conclude that the active surface that can be involved in chemical reaction is smaller. Still, one has to be aware that the millimeter-scale analysis acquired with the optical microscopy is complementary and to some extent coherent to micrometer-scale analysis obtained using AFM. However, due to the presence of some specific features at certain scale, like the millimeter-length waviness, the results of those two analyses may differ. Nevertheless, the positive results of electropolishing can be identified clearly using both methods.

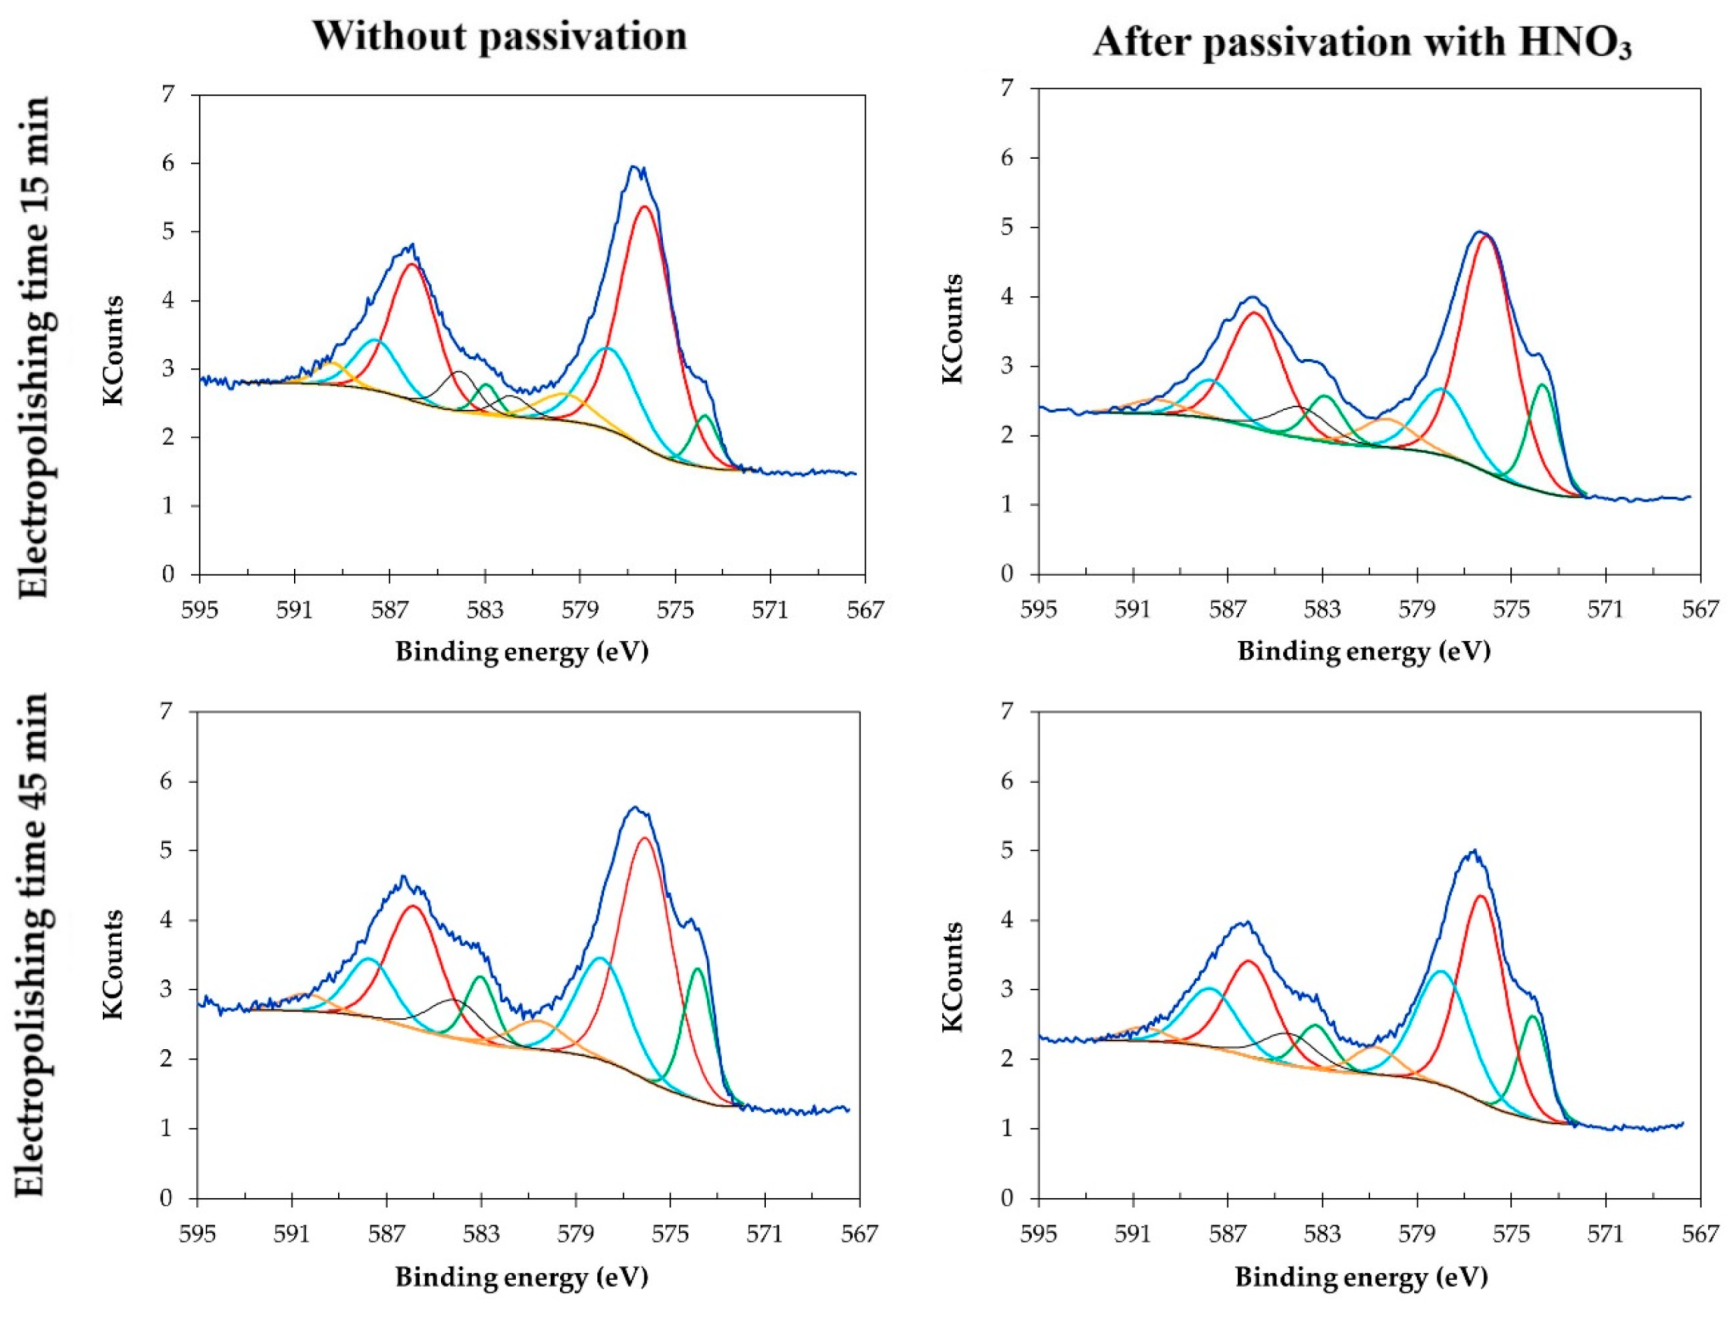
3.4. XPS for Samples Electropolished in the Industrial Bath

The results of roughness and gloss measurements and the analyses of AFM images were the basis for selecting parameters to prepare samples for XPS measurements. Samples were subjected to the electropolishing process in the S1-LAB bath on advanced stage of use (3 mass.% Fe), at parameters that were considered optimal: T = 35 °C, j = 8 A·dm−2 and in two variants of duration: 15 min and 45 min.
The depth profiles (Figure 7) of the analyzed samples allow us to state that surfaces subjected to the electropolishing and passivation process were characterized by a thinner layer of contaminants on the surface than samples that were only electropolished without passivation. The maximum atomic percentage for chromium, etch depth ranging from 0.65 nm to 1.95 nm, was obtained for samples passivated, while the maximum for samples without passivation was at etch depth 2–4 nm.
Based on the chemical composition after the process of Ar ions bombardment (Table 2) for samples without passivation, and for depth of, respectively, 4.5 nm for sample electropolished for 15 min and 2.6 nm for samples electropolished for 45 min, the final Cr/Fe ratios were, respectively, 1.06 and 1.23. For samples subjected to passivation after electropolishing, and for the depth of 1.3 nm, both for samples polished for 15 and 45 min, the obtained Cr/Fe ratios were, respectively, 1.26 and 1.15.
In Figure 8, which presents deconvolution for Cr2p chromium, for electropolished samples and electropolished and passivated samples, the shape of the spectrum is similar for all analyzed samples, regardless of the electropolishing duration. The chromium component is characterized by two 2p peaks—Cr2p1/2 at and 2p3/2. Chromium is present in the passive film as Cr3+ (Cr2O3) at 576.0–576.7 eV, for Cr6+ (CrO3) at 578.6–578.9 eV. The intense peaks at lower binding energies were related to metallic chromium. Cr0 is located under passive film as reported by Marcus [31] and should not be taken into account. Other studies suggest 576.0–576.8 eV for Cr3+ oxide (Cr2O3) [32,33], hydroxide (Cr(OH)3) at 577.1–577.3 eV [34,35] and 578–578.3 eV for Cr6+ (CrO3 and/or CrO42-) [36].

4. Conclusions

The presented paper compares the results of electropolishing of chromium-nickel steel in industrial and laboratory conditions. The obtained results enabled a partial prediction of the process in industrial scale based on laboratory tests. Thus, analyses conducted in the laboratory may provide guidance on the conditions for conducting technological processes as well as some suggestions concerning the expected results. Another important aspect is estimating weight loss, and thus also the contaminants that emerge during the process. Both financial aspects and the best possible effects should be taken into account when planning technological processes, but environmental protection is equally important. Due to that, in order to optimize the process, one should seek solutions that will ensure satisfactory results of the electropolishing process, while at the same time, minimizing its negative environmental impact. In the discussed case, reducing the environmental impact requires minimizing the weight loss of details during the electropolishing process and limiting the amount of heavy metals that penetrate into process baths and wastewater.
The main conclusions are as follows.
  • Knowledge of the weight loss of samples as a result of electropolishing in laboratory conditions enables us to determine the estimated weight loss of elements in industrial conditions with an accuracy of even below 5%. This offers a possibility to estimate the rate of contamination of the industrial bath. It is also the basis for calculating the approximate load of contaminants that are generated during the process as a result of dissolution of the electropolished elements.
  • The results of electropolishing in laboratory conditions with use of an industrial bath allow for initial selection of parameters that enable us to obtain satisfactory results of the process conducted in industrial conditions.
  • The use of metallographic imaging with Nomarski contrast allows for the visual assessment of defects that emerge on electropolished surfaces, even for defects whose nature is difficult to be described by the gloss and roughness parameters.
  • The time of electropolishing of the analyzed samples had only a slight influence on the composition of the passive layer. Passivation in nitric acid solution enables us to reduce the layer of contaminants on the surface of the sample.
  • Improved morphological properties of sample surface were confirmed both with use of optical microscopy and atomic force microscopy. Data obtained with use of these techniques are complementary and, to a certain extent, mutually confirming.
  • Having the abovementioned in mind, one can optimize the electropolishing process parameters in order to obtain expected morphological parameters of the surface in respect to the application of the specific product.
  • The laboratory experiments must be performed in the way allowing to take into account the large-scale non-homogeneities of the process, typical for industrial production.

Author Contributions

Conceptualization, P.L.; Methodology, P.L.; Investigation, S.C., P.L. and A.S.; Writing—original draft preparation S.C. and P.L.; Writing—review and editing E.Ł.-W. and A.S.

Funding

This research was funded by the National Centre for Research and Development (NCBR) within the project IonsMonit (LIDER/22/0187/L-7/15/NCBR/2016).

Acknowledgments

The authors acknowledge support by Wojciech Lisowski and Marcin Pisarek from Polish Academy of Sciences who carried out XPS experiments on PHI 5000 VersaProbe (ULVAC-PHI) spectrometer.

Conflicts of Interest

The authors declare no conflict of interest.

References

  1. Chatterjee, B. Science and industry of electropolishing (part 1). Galvanotechnik 2019, 110, 49–58. [Google Scholar]
  2. Han, W.; Fang, F. Fundamental aspects and recent developments in electropolishing. Int. J. Mach. Tools Manuf. 2019, 139, 1–23. [Google Scholar] [CrossRef]
  3. Rokosz, K. SEM/EDX, XPS, corrosion and surface roughness characterization of AISI 316L SS after electrochemical treatment in concentrated HNO3. Teh. Vjesn. Tech. Gaz. 2015, 22, 125–131. [Google Scholar] [CrossRef] [Green Version]
  4. Rotty, C.; Doche, M.L.; Mandroyan, A.; Hihn, J.Y.; Montavon, G.; Moutarlier, V. Comparison of electropolishing behaviours of TSC, ALM and cast 316L stainless steel in H3PO4/H2SO4. Surf. Interfaces 2017, 6, 170–176. [Google Scholar] [CrossRef]
  5. Rokicki, R.; Hryniewicz, T.; Pulletikurthi, C.; Rokosz, K.; Munroe, N. Towards a better corrosion resistance and biocompatibility improvement of nitinol medical devices. J. Mater. Eng. Perform. 2015, 24, 1634–1640. [Google Scholar] [CrossRef]
  6. Marciniak, J.; Szewczenko, J.; Kajzer, W. Surface modification of implants for bone surgery. Arch. Metall. Mater. 2015, 60, 2123–2129. [Google Scholar] [CrossRef]
  7. Bohinc, K.; Dražić, G.; Abram, A.; Jevšnik, M.; Jeršek, B.; Nipič, D.; Kurinčič, M.; Raspor, P. Metal surface characteristics dictate bacterial adhesion capacity. Int. J. Adhes. Adhes. 2016, 68, 39–46. [Google Scholar] [CrossRef]
  8. Wolf, A.; Michele, V.; Schlüter, O.F.K.; Herbstritt, F.; Heck, J.; Mleczko, L. Precipitation in a micromixer—From laboratory to industrial scale. Chem. Eng. Technol. 2015, 38, 2017–2024. [Google Scholar] [CrossRef]
  9. Obalová, L.; Jirátová, K.; Karásková, K.; Chromčáková, Ž. N2O catalytic decomposition—From laboratory experiment to industry reactor. Catal. Today 2012, 191, 116–120. [Google Scholar] [CrossRef]
  10. Ziatdinov, M.K. Metallurgical SHS processes as a route to industrial-scale implementation: An autoreview. Int. J. Self Propag. High Temp. Synth. 2018, 27, 1–13. [Google Scholar] [CrossRef]
  11. Krymsky, V.; Shaburova, N. Applying of pulsed electromagnetic processing of melts in laboratory and industrial conditions. Materials 2018, 11, 954. [Google Scholar] [CrossRef] [PubMed]
  12. Assaad, J.J. Industrial versus laboratory clinker processing using grinding aids (scale effect). Adv. Mater. Sci. Eng. 2015, 2015, 1–12. [Google Scholar] [CrossRef]
  13. Thomas, M.; Zdebik, D.; Białecka, B. Using sodium trithiocarbonate to precipitate heavy metals from industrial wastewater—From the laboratory to industrial scale. Polish J. Environ. Stud. 2018, 27, 1753–1763. [Google Scholar] [CrossRef]
  14. Pendyala, P.; Bobji, M.S.; Madras, G. Evolution of surface roughness during electropolishing. Tribol. Lett. 2014, 55, 93–101. [Google Scholar] [CrossRef]
  15. Maciąg, T.; Wieczorek, J.; Wȩcki, B. Parameters selection for electropolishing process of products made of copper and its alloys. Arch. Metall. Mater. 2017, 62, 1443–1447. [Google Scholar] [CrossRef]
  16. Jin, S.; Lu, X.; Lin, L.; Wu, A.T.; Zhao, K. Buffered electropolishing parameters on niobium sheet. Phys. Rev. Spec. Top. Accel. Beams 2010, 13, 061001. [Google Scholar] [CrossRef]
  17. Lochynski, P.; Łyczkowska, E.; Pawełczyk, A.; Szczygieł, B. Effect of bath exploitation on steel electropolishing process efficiency. Przem. Chem. 2012, 5, 846–848. [Google Scholar]
  18. Lochyński, P.; Charazińska, S.; Łyczkowska-Widłak, E.; Sikora, A.; Karczewski, M. Electrochemical reduction of industrial baths used for electropolishing of stainless steel. Adv. Mater. Sci. Eng. 2018, 2018, 1–11. [Google Scholar] [CrossRef]
  19. Gadalińska, E.; Wronicz, W. Electropolishing procedure dedicated to in-depth stress measurements with x-ray diffractometry. Fatigue Aircr. Struct. 2016, 2016, 65–72. [Google Scholar] [CrossRef]
  20. Urlea, V.; Brailovski, V. Electropolishing and electropolishing-related allowances for powder bed selectively laser-melted Ti-6Al-4V alloy components. J. Mater. Process. Technol. 2017, 242, 1–11. [Google Scholar] [CrossRef]
  21. Huang, C.A.; Chang, J.H.; Zhao, W.J.; Huang, S.Y. Examination of the electropolishing behaviour of 73 brass in a 70% H3PO4 solution using a rotating disc electrode. Mater. Chem. Phys. 2014, 146, 230–239. [Google Scholar] [CrossRef]
  22. Kim, S.H.; Choi, S.G.; Choi, W.K.; Lee, E.S. A study of the improvement surface roughness and optimum machining characteristic of L-shaped tube STS 316L by electropolishing. Int. J. Adv. Manuf. Technol. 2016, 85, 2313–2324. [Google Scholar] [CrossRef]
  23. Lin, C.C.; Hu, C.C. Electropolishing of 304 stainless steel: Surface roughness control using experimental design strategies and a summarized electropolishing model. Electrochim. Acta 2008, 53, 3356–3363. [Google Scholar] [CrossRef]
  24. Rokosz, K.; Lahtinen, J.; Hryniewicz, T.; Rzadkiewicz, S. XPS depth profiling analysis of passive surface layers formed on austenitic AISI 304L and AISI 316L SS after high-current-density electropolishing. Surf. Coatings Technol. 2015, 276, 516–520. [Google Scholar] [CrossRef]
  25. Ur Rahman, Z.; Deen, K.M.; Cano, L.; Haider, W. The effects of parametric changes in electropolishing process on surface properties of 316L stainless steel. Appl. Surf. Sci. 2017, 410, 432–444. [Google Scholar] [CrossRef]
  26. Konica Minolta. Available online: https://sensing.konicaminolta.us/products/rhopoint-iq-s-20-60-85/ (accessed on 20 June 2019).
  27. Sikora, A.; Janus, P.; Sierakowski, A. The impact of the light exposure on the morphological properties of selected photoresists. Opt. Appl. 2019, 49, 177–185. [Google Scholar]
  28. Sikora, A. The new approach to the investigation of the roughness changes of the non-uniform materials irradiated with UV light and imaged by means of atomic force microscopy supported with precise repetitive scanning area positioning. Meas. Sci. Technol. 2017, 28, 034016. [Google Scholar] [CrossRef]
  29. Sikora, A.; Tomczuk, K. Impact of the LED-based light source working regime on the degradation of polymethyl methacrylate. Light. Res. Technol. 2019, 1–12. [Google Scholar] [CrossRef]
  30. Image Metrology. Available online: https://www.imagemet.com/ (accessed on 20 June 2019).
  31. De Vito, E.; Marcus, P. XPS study of passive films formed on molybdenum-implanted austenitic stainless steels. Surf. Interface Anal. 1992, 19, 403–408. [Google Scholar] [CrossRef]
  32. Latifi, A.; Imani, M.; Khorasani, M.T.; Joupari, M.D. Electrochemical and chemical methods for improving surface characteristics of 316L stainless steel for biomedical applications. Surf. Coatings Technol. 2013, 221, 1–12. [Google Scholar] [CrossRef]
  33. Zhang, Z.; Wang, J.; Han, E.H.; Ke, W. Influence of dissolved oxygen on oxide films of Alloy 690TT with different surface status in simulated primary water. Corros. Sci. 2011, 53, 3623–3635. [Google Scholar] [CrossRef]
  34. Guo, S.; Xu, L.; Zhang, L.; Chang, W.; Lu, M. Characterization of corrosion scale formed on 3Cr steel in CO2-saturated formation water. Corros. Sci. 2016, 110, 123–133. [Google Scholar] [CrossRef]
  35. Han, Y.; Mei, J.; Peng, Q.; Han, E.H.; Ke, W. Effect of electropolishing on corrosion of nuclear grade 316L stainless steel in deaerated high temperature water. Corros. Sci. 2016, 112, 625–634. [Google Scholar] [CrossRef]
  36. Machet, A.; Galtayries, A.; Zanna, S.; Klein, L.; Maurice, V.; Jolivet, P.; Foucault, M.; Combrade, P.; Scott, P.; Marcus, P. XPS and STM study of the growth and structure of passive films in high temperature water on a nickel-base alloy. Electrochim. Acta 2004, 49, 3957–3964. [Google Scholar] [CrossRef]
Figure 1. Experimental system.
Metals 09 00854 g001
Figure 2. Electric load per unit as a function of sample weight loss per unit after electropolishing in baths containing 3% mass Fe.
Metals 09 00854 g002
Figure 3. Metallographic photos taken with use of Nomarski contrast of the surface of chromium-nickel steel after the electropolishing.
Metals 09 00854 g003
Figure 4. 3D images of the sample’s surface after the electropolishing acquired using AFM.
Metals 09 00854 g004
Figure 5. Sa and Sq parameters of samples surfaces before and after electropolishing in various parameters of temperature and current density.
Metals 09 00854 g005
Figure 6. Ssk and Sku parameters of samples surfaces before and after electropolishing in various parameters of temperature and current density.
Metals 09 00854 g006
Figure 7. XPS depth profiles for chromium-nickel steel surface after electropolishing, samples prepared in laboratory scale S1-LAB.
Metals 09 00854 g007
Figure 8. Cr2p deconvolutions for chromium-nickel steel surface samples electropolished in laboratory scale S1-LAB.
Metals 09 00854 g008
Table 1. Roughness average Ra and gloss results for samples after electropolishing.
Electropolishing Bath SetuptTjS1-INDS1-LABS2-LABS1-INDS1-LABS2-LAB
RaGloss
(min)(°C)(A·dm−2)(µm)(µm)(µm)(GU)(GU)(GU)
the initial stage of use 0 mass.% Fe153540.240.240.18139335400
153580.150.120.13378623703
155540.460.320.40223631470
155580.430.230.20276695821
453540.310.150.16305930907
453580.080.100.10102911521181
455540.550.220.25326950806
455580.440.140.1235911911218
advanced stage of use 3 mass.% Fe153540.280.150.17150493240
153580.130.150.13442717575
155540.360.240.28269613320
155580.260.130.20479998299
453540.240.120.16420950582
453580.070.100.1210221056899
455540.520.420.22258589364
455580.490.120.163041196388
Table 2. Atomic percentages as a function of sputter depth for the passive films on a 304 stainless steel samples.
Electropolishing Time (min)Sputter Time (min)Etch Depth (nm)COFeNiCrPSNSumaCr/Fe
153.54.54.648.919.20.920.32.40.63.11001.06
15 + pass *1.01.32.839.722.33.628.11.00.52.11001.26
452.02.63.144.820.02.524.52.10.02.01001.23
45 + pass *1.01.35.835.923.13.826.70.11.03.51001.15
* after electropolishing process samples were passivated in HNO3 solution.

