Article

Quasi-Symmetric Transfer Behavior in an Asymmetric Two-Strand Tundish with Different Turbulence Inhibitor

1
Key Laboratory of Electromagnetic Processing of Materials, Ministry of Education, Northeastern University, Shenyang 110004, China
2
School of Metallurgy, Northeastern University, Shenyang 110004, China
3
Dong Bei Special Steel Group CO., LTD., Fushun 113001, China
*
Author to whom correspondence should be addressed.
Metals 2019, 9(8), 855; https://doi.org/10.3390/met9080855
Submission received: 15 July 2019 / Revised: 31 July 2019 / Accepted: 3 August 2019 / Published: 5 August 2019
(This article belongs to the Special Issue Mold and Tundish Metallurgy)

Abstract

:
The task of the tundish is to supply and distribute the molten steel with the similar temperature and the similar inclusion mass concentration to the continuous casting mold. But it is difficult for the asymmetric tundish to accomplish this task. Thus, the scheme about the asymmetric turbulence inhibitor and the baffle wall with guided holes is proposed to optimize the tundish. In order to have a deep insight into the metallurgical behavior in the asymmetric tundish, numerical simulation is applied to describe the fluid flow, the heat transfer, RTD (residence time distribution) curve, and inclusion collision aggregation behavior. Numerical results show that the predicted temperature and inclusion concentration agree with the industrial experimental data. In the asymmetric two-strand tundish, the asymmetric turbulence inhibitor and the baffle wall with guided holes can extend the mean residence time at the left outlet, reduce the temperature difference between the two outlets, and prompt the inclusion removal rate at the left outlet.

1. Introduction

As the last refractory reactor, the tundish plays important roles in refining and distributing molten steel to the continuous casting mold. In order to realize such an aim, many flow control devices, such as weirs, dams, impact pads, gas curtains, baffle wall, and turbulence inhibitors have been applied to change the fluid flow, and heat and mass transfer in the tundish [1,2,3].
In most steelmaking factory, the ladle shroud is placed in the middle of the tundish, so the fluid flow and heat transfer is symmetric in the tundish. But there are some asymmetric two-strand tundishes in China for some historical reasons, and they have their own metallurgical characteristics. In order to exploit the equipment potential, it is necessary to propose some effective measurements to obtain the quasi-symmetric field in the asymmetric tundish without changing tundish structure. In other words, the optimized tundish should ensure that the molten steel at different tundish outlets has similar temperature and similar inclusion mass concentration.
During the process of optimizing the tundish structure, water model, numerical simulation, and industrial experiment are three effective methods. They have their own advantages and disadvantages.
(1) Water model is the most popular approach for studying the fluid flow, the heat transfer, and the inclusion behavior [4,5,6,7,8,9,10] in the tundish because of low cost, convenient operation, and safety. But usually, only one dimensionless number (Froude number) is applied to satisfy the similarity criterion, so the experimental data cannot give an accurate description of metallurgical phenomena in the tundish.
(2) Numerical simulation is a more and more popular method to have a deep insight into the metallurgical phenomena because it can give detailed information about the metallurgical process [11,12,13,14,15,16,17,18,19,20]. But some assumptions are applied in the mathematical model in order to simplify the governing equations.
(3) Industrial experiment is the most effective method to study metallurgical behavior [21,22,23]. But the high-temperature environment, high costs, and less data limit its application.
In the present work, a three-dimensional numerical simulation is applied to give the quantitative analysis for the original and optimized tundish at first. The key factors include the flow field, the temperature field, the RTD (residence time distribution) curve, and the inclusion field, as shown in Figure 1. Then, an industrial experiment is conducted to evaluate the metallurgical characteristics in the original tundish and optimized tundish.

2. Tundish Description

Figure 2 gives the geometry of the original and optimized tundish. This is a two-strand asymmetric tundish. The ladle shroud is close to outlet 1, and is far away from outlet 2, and the turbulence inhibitor is just below the ladle shroud. The original tundish consists of a circular turbulence inhibitor and two dams, and the optimized tundish has an asymmetric rectangle turbulence inhibitor and two multi-hole baffle walls. The geometric and physical parameters for the model tundish are described in the Table 1.

3. Mathematical Model

3.1. Assumption

(1) The molten steel is an incompressible Newtonian fluid, and the fluid flow in the tundish is at a stable state.
(2) The free surface is flat in the tundish.
(3) The inclusion is identified as a sphere.
(4) The effect of inclusion on the fluid flow is negligible because the inclusion mass fraction is too low.
(5) The inclusions are removed once they touch the tundish wall or the slag layer.
(6) Inclusion phase is treated as a continuous phase.
(7) Brownian collision among inclusions is too weak to be considered.
(8) There is no chemical reaction in the tundish.
(9) The heat transfer and the inclusion collision aggregation are at the stable state.

3.2. Fluid Flow, Heat Transfer and Solute Transport

The fluid flow, the heat transfer, and the tracer transport in the tundish can be described as the following equations [24].
u f = 0 ,
( ρ u f u f ) = p + ρ g + [ μ eff ( u f + ( u f ) T ) ] + β ( T 0 T ) ρ g ,
( ρ C p T ) t + ( ρ T u f ) = ( λ eff T ) ,
( ρ φ ) t + ( ρ u f φ ) = ( ρ D eff φ ) ,
where u f is the velocity of molten steel, ρ is the density of liquid, g is the gravitational acceleration vector, p is the pressure, μeff is the effective viscosity coefficient, Cp is the heat capacity, T is the temperature of liquid, Deff is the effective diffusion coefficient, φ is the tracer mass concentration, T0 is the reference temperature, the turbulent viscosity μeff is determined by the standard k-ε two equations model, β is the coefficient of thermal expansion.
During the numerical simulation, a volume of 200 milliliter tracer is introduced as a whole and is injected into the tundish through the ladle shroud by pluse form, and the tracer concentration at two tundish outlets is recorded continuously. In this way, the curve of tracer concentration at the outlet against the time is the residence time distribution (RTD) curve. During the calculation, the physical parameters of the tracer are the same as those of the molten steel. And the classic combined [24] model is applied to analyze the RTD curve and to give the plug zone (Vpv), the well-mixed zone (Vmv), and the dead zone (Vdv) of the tundish.

3.3. Inclusion Collision–Coalescence Model

The inclusion mass and population conservation model [25,26,27], which are verified by the industrial experiment [26] are applied to describe the inclusion collision-aggregation in the tundish.
( ρ f u C C ) = ( ρ f D eff , C C ) ,
( ρ f u N N ) = ( ρ f D eff , N N ) + S N ,
with D eff = D 0 + μ t / ρ f S c t .
In Equation (6), the source term SN is related to the inclusion collision–coalescence in the molten steel [27].
S N = S turb + S Stokes = 2.6 α ( π ρ f ε μ 1 ) 0.5 N 2 r * 3 + 10 9 6 3 π g Δ ρ μ 1 N 2 r * 4 ,
where r * = 3 C 4 π N 3 is the characteristic inclusion radius, u C and u N are the inclusion slipping velocity, C is the inclusion volume concentration, N is the inclusion number density, D0 is molecular diffusion coefficient, μt is the turbulence viscosity, Sct is the turbulent Schmidt number, SN is the source of inclusion number density, μ1 is the kinematic viscosity, ε is the turbulence dissipation rate.

3.4. Boundary Conditions

The boundary conditions for the fluid flow are listed as follows:
(1) No-slip condition is applied at the tundish wall, and the scalable wall function method is applied near the wall.
(2) The free-slip condition is applied at the free surface.
(3) The full-developed condition is applied at the tundish exit.
The other boundary conditions can be found in Table 2, Table 3 and Table 4.

3.5. Numerical Solution

ANSYS CFX software (Version 11.0, ANSYS, Pittsburgh, PA, USA, 2008) is applied to solve these partial differential equations in order to obtain the flow field, the temperature field, the tracer field, and the inclusion field. The calculation domain is covered by about 200,000 hexahedral grids. The convergence criteria is that the normalized residual for variables should be less than 10−5. Figure 3 gives the numerical solution process.
(1) The fluid flow model and the heat transport model are coupled to obtain the flow field and the temperature field.
(2) On the basis of the known flow field, the tracer transport equation is solved to obtain the RTD curve.
(3) On the basis of the known flow field, the inclusion collision–coalescence model is solved to obtain the spatial distribution of inclusion volume concentration, inclusion number density, and inclusion characteristic radius.

4. Results and Discussion

This tundish is an asymmetric tundish. Figure 4 shows that the ladle shroud is not in the middle of the two outlets and is close to the left outlet (outlet 1). In order to describe the physical field in the tundish clearly, it is necessary to define two specified cross sections, shown in Figure 4. Section A-A (Y = 0), which passes through the center line of the ladle shroud and the center line of the tundish outlet, is the longitudinal symmetrical plane of the tundish, and section B-B (Y = 0.14), which passes through the center line of the guide hole of the baffle wall and is parallel to the section A-A, is the longitudinal cross plane.

4.1. Fluid Flow

Figure 5 shows that the velocity field in the original tundish has the following characteristics: (1) There is a vortex on both sides of the ladle shroud. The left vortex is circular and the right vortex is elliptical, because the ladle shroud is close to the left dam and is far away from the right dam. (2) The fluid bypasses the dam and forms a big recirculation zone above outlet 1. (3) The velocity of molten steel at the free surface at the left side of the ladle shroud (maximum velocity is 0.06 m/s) is greater than that at the right side of the ladle shroud (maximum velocity is 0.04 m/s) because of the longer distance between shroud and right dam.
Figure 6 gives several new flow characteristics in the optimized tundish: (1) There are asymmetric vortices on both side of the main stream from the ladle shroud in the turbulence inhibitor, and the right vortex is bigger than the left vortex, because the centerline of ladle shroud is at the left side of the centerline of the turbulence inhibitor. (2) The fluid flow near the left outlet is similar to that near the right outlet because of the isolation of the baffle walls. (3) The steel stream from the ladle shroud impinges on the bottom of the turbulence inhibitor, and then flows upwards to the free surface. (4) The asymmetric rectangle turbulence inhibitor changes the flow distribution on the left and right sides of the ladle shroud. Specifically, the flow rate of molten steel on the right side of the turbulence inhibitor is greater than that on the left side. Such a flow distribution by the asymmetric turbulence inhibitor can force the quasi-symmetry of the flow field in the asymmetric tundish.

4.2. RTD Curve

Figure 7 gives the RTD curves for the original and optimized tundish. For the original tundish, the difference of maximum concentration between the two outlets is 89.9%, but the difference falls by 20.8% for the optimized tundish.
Table 5 gives the analysis result of RTD curve for the original and optimized tundish. It has the following features. (1) The dead volume fraction is negative for the outlet 2 in the original and optimized tundish, because it is meaningless to calculate the plug volume, the well-mixed volume, and the dead volume at each outlet in the multi-strand tundish [31]. (2) The mean residence time at each outlet is the key to estimate the similarity of fluid flow among strands [31]. The mean residence time of 352.4 s at the outlet 1 in the optimized tundish is 36.8 s greater than 315.6 s at the outlet 1 in the original tundish. And the difference of the mean residence time between the two outlets falls by 10.0%, from 203.8 s to 183.5 s after optimization. (3) The difference of the minimum residence time of 98 s between the two outlets in the optimized tundish is 40 s more than of 58 s in the original tundish, and the difference of the maximum time between the two outlets in the optimized tundish of 167 s is 100 s less than that in the original tundish.

4.3. Heat Transfer

Figure 8 and Figure 9 give the following features about the temperature field in the original tundish and optimized tundish. (1) In the original tundish, the temperature gradient on both sides is greater than that between the two dams because of the insufficient isolation of a low dam. In the optimized tundish, the temperature gradient on both sides is less than that between the two baffle walls because of the effective isolation of baffle wall. (2) Because of the shorter distance between the ladle shroud and the left outlet, the temperature of 1864.9 K at the left outlet in the original tundish is 6.8 K greater than 1858.1 K at right outlet in the original tundish. (3) In the optimized tundish, the temperature of 1863.8 K at the left outlet 1 is only 4.5 K greater than 1859.3 K at right outlet 2, because the asymmetric rectangle turbulence inhibitor changes the flow distribution of molten steel at the left and right sides of the ladle shroud.

4.4. Inclusion Field

Figure 10 and Figure 11 show that the inclusion volume concentration in the original and optimized tundish has the following features: (1) The inclusion volume concentration is asymmetric in the original and optimized tundish. (2) The inclusion volume concentration gradually decreases from the ladle shroud to the tundish outlet, because the inclusions in the molten steel are removed by the tundish wall and the slag layer continuously. (3) The inclusion volume concentration on the left side is greater than that on the right side because there is a longer distance between the ladle shroud and the right outlet and the inclusions have more time to float up and to be removed. (4) The optimized tundish can reduce the difference of inclusion between the right outlet and the left outlet. The inclusion volume concentration of 209.25 ppm at the left outlet is greater than the 139.16 ppm at the right outlet in the original tundish. And the inclusion volume concentration of 194.57 ppm at the left outlet is greater than 145.59 ppm at the right outlet in the optimized tundish.
Figure 12 and Figure 13 show that the inclusion characteristic radius in the original tundish and optimized tundish has some remarkable features: (1) The inclusion characteristic radius increases gradually when the fluid flows from the ladle shroud to the tundish outlet due to the collision aggregation among the inclusions. (2) In the region between the dam (or the multi-hole baffle wall) and outlet, the inclusion in the lower part is bigger than that in the upper part, because the bigger inclusions in the upper zone have more chances to be removed by the slag layer, and the smaller inclusions in the lower zone have more chances to be removed by the tundish wall. (3) The inclusion characteristic radius above the right outlet is greater than that above the left outlet, because the inclusions on the right side of the ladle shroud have more chances to collide aggregate. (4) The inclusion characteristic radius at the left outlet is less than that at the right outlet for the two tundish.
Figure 14 and Figure 15 show that the inclusion number density in the original tundish and optimized tundish has some features: (1) The inclusion number density decreases gradually when the fluid flows from the ladle shroud to the tundish outlet because some inclusions are removed by the slag layer or the tundish wall. (2) In the region between the two dams (or the two multi-hole baffle walls), the inclusion number density in the upper part is greater than that in the lower part, because the molten steel near the free surface is the fresh molten steel, and the inclusion number density is high in the fresh molten steel. (3) The inclusion number density above the outlet is less than that in the region between the ladle shroud and the dam (or the baffle wall), because the new big inclusions come from the collision aggregation among the inclusions, and the big inclusion is removed by the slag layer and the tundish wall. (4) The inclusion number density at the left outlet is less than that at right outlet, because the inclusion has more chances to be removed at the region between the ladle shroud and the right outlet.

4.5. General Discussion

Figure 4, Figure 5, Figure 6, Figure 7, Figure 8, Figure 9, Figure 10, Figure 11, Figure 12, Figure 13, Figure 14 and Figure 15 show that the fluid flow, the heat transfer, and the inclusion distribution are asymmetric because the ladle shroud is not placed in the middle of the original and optimized tundish. In this way, it is necessary to realize the quasi-symmetry distribution in the current asymmetric tundish. In this guidance, the optimized tundish adopts two measurements. (1) Taking the centerline of the ladle shroud as the reference point, the square turbulence inhibitor has a small outlet at the left side and a large outlet at the right side in the optimized tundish. (2) Two baffle walls with the same guide-holes are applied to reduce the asymmetric effect of the ladle shroud on the transfer behavior on both sides of the optimized tundish.
Table 5, Figure 9, Figure 10, Figure 11, Figure 12, Figure 13, Figure 14 and Figure 15 show that there are smaller differences of the mean residence times and the temperatures, and the inclusion size between two exits decreases in the optimized tundish. Such simulation results indicate that the optimized scheme can decrease the asymmetric distribution of physical parameters in the original scheme. Thus, industrial trial is proposed to verify the above ideas.
Table 6 and Table 7 give the industrial result, the related tundish is shown in Figure 16. The temperature difference between two outlets is up to 8.7 °C in the original tundish and is around 6 °C in the optimized tundish, but the predicted temperature difference is 6.8 °C in the original tundish and 4.5 °C in the optimized tundish. Several reasons lead to the difference between the predicted value and the experimental data. (1) There is measurement error for the temperature measurement by the thermocouple. (2) The values of the heat loss in Table 4 come from the literature, not the actual value in the current tundishes. (3) There are some assumptions in the mathematical model.
Figure 10 shows that the inclusion removal rate is only 30.25% at the left outlet and 53.61% at the right outlet in the original tundish. Thus, it is necessary to increase the inclusion removal rate at the left outlet. Figure 11 shows that the inclusion removal rate is 35.14% at the left outlet and 51.47% at the right outlet in the optimized tundish.
Table 8 indicates that the inclusion mass concentration at outlet 1 in the optimized tundish is less than that at outlet 1 in the original tundish, and the inclusion mass concentration at outlet 1 is greater than that at outlet 2 in the original tundish.

5. Conclusions

(1) In the asymmetric two-strand tundish, decreasing the difference of the mean residence time between the two outlets can reduce the temperature difference effectively.
(2) The mean residence time of 352.4 s at the left outlet in the optimized tundish is 36.8 s greater than the mean residence time of 315.6 s at the left outlet in the original tundish. And the difference of mean residence time between the two outlets falls by 10.0% from 203.8 s to 183.5 s.
(3) In the original tundish, the temperature of molten steel at the right outlet is less than that at the left outlet. The asymmetric turbulence inhibitor and the baffle wall with guided holes can reduce the difference of the temperature of molten steel between the two outlets effectively.
(4) In the original tundish, the inclusion removal rate at the right outlet is greater than that at the left outlet. The asymmetric turbulence inhibitor and the baffle wall with guided holes can prompt the inclusion removal rate at the left outlet in the optimized tundish.

Author Contributions

Author Contribution: Investigation, B.Y., G.X.; Methodology, B.Y., H.L.; Writing—original draft preparation, B.Y.; Writing—review and editing, Y.Z., H.Z.; Validation, G.X.; Project administration and funding acquisition, H.L.

Funding

This paper was supported by National Natural Science Foundation of China and Shanghai Baosteel (No. U1460108) and National Natural Science Foundation of China (No. 51574074).

Acknowledgments

The work is supported by National Natural Science Foundation of China and Shanghai Baosteel (No. U1460108) and National Natural Science Foundation of China (No. 51574074).

Conflicts of Interest

The authors declare no conflict of interest.

References

  1. Mazumdar, D.; Guthrie, R.I.L. Physical and mathematical modelling of continuous casting tundish systems. ISIJ Int. 1999, 39, 524–547. [Google Scholar] [CrossRef]
  2. Chattopadhyay, K.; Isac, M.; Guthrie, R.I.L. Effect of flow modifiers on liquid metal cleanliness in four-strand delta shaped bille caster tundish. Ironmak. Steelmak. 2012, 39, 454–462. [Google Scholar] [CrossRef]
  3. Chattopadhyay, K.; Isac, M.; Guthrie, R.I.L. Physical and mathematical modelling of steelmaking tundish operations: a review of the last decade (1999–2009). ISIJ Int. 2010, 50, 331–348. [Google Scholar] [CrossRef]
  4. Chang, S.; Cao, X.; Zou, Z.; Isac, M.; Guthrie, R.I.L. Microbubble swarms in a full-scale water model tundish. Metall. Mater. Trans. B 2016, 47, 2732–2743. [Google Scholar] [CrossRef]
  5. Koizsch, R.; Odenthal, H.J.; Pfeifer, H. Concentration measurements in a water model tundish using the combined DPIV/PLIF technique. Steel Res. Int. 2007, 78, 473–481. [Google Scholar] [CrossRef]
  6. Liu, J.; Yan, H.; Liu, L.; Wang, X. Water model of controlling vortex in tundish. J. Iron Steel Res. Int. 2006, 18, 18–22. [Google Scholar]
  7. Sheng, D.; Kim, C.S.; Yoon, J.K.; Hsiao, T.C. Water model study on convection pattern of molten steel flow in continuous casting tundish. ISIJ Int. 1998, 38, 843–851. [Google Scholar] [CrossRef]
  8. Zhang, S.; Zhu, M. Water model study of removal mechanism of inclusion in continuous casting tundish. Acta Metall. Sin. 2007, 43, 1004–1008. Available online: http://www.ams.org.cn/CN/Y2007/V43/I9/1004 (accessed on 5 August 2019). (In Chinese).
  9. Godiwalla, K.M.; Sinha, S.K.; Sivaramakrishnan, C.S. Water model simulation of tundish flow under varying conditions. Steel Res. 1994, 65, 267–272. [Google Scholar] [CrossRef]
  10. Alizadeh, M.; Edros, H.; Shafyei, A. Fluid flow and mixing in non-isothermal water model of continuous casting tundish. J. Iron Steel Res. Int. 2008, 15, 7–13. [Google Scholar] [CrossRef]
  11. Miki, Y.; Thomas, B.G. Modeling of inclusion removal in a tundish. Metall. Mater. Trans. B 1999, 30, 639–654. [Google Scholar] [CrossRef]
  12. Zhang, L.; Taniguchi, S.; Cai, K. Fluid flow and inclusion removal in continuous casting tundish. Metall. Mater. Trans. B 2000, 31, 253–266. [Google Scholar] [CrossRef]
  13. Ling, H.; Zhang, L. Numerical simulation of the growth and removal of inclusions in the molten steel of a two-strand tundish. JOM 2013, 65, 1155–1163. [Google Scholar] [CrossRef]
  14. Zhang, J.; Lee, H.G. Numerical modeling of nucleation and growth of inclusions in molten steel based on mean processing parameters. ISIJ Int. 2004, 44, 1629–1638. [Google Scholar] [CrossRef]
  15. Zhao, L.; Liu, K.J. Study on inclusion behavior in tundish during continuous casting by mathematical model. Iron Steel Res. Int. 2002, 14, 19–24. [Google Scholar] [CrossRef]
  16. Xu, K.; Thomas, B.G. Particle-size-grouping model of precipitation kinetics in microalloyed steels. Metall. Mater. Trans. A 2012, 43, 1079–1096. [Google Scholar] [CrossRef]
  17. Ho, Y.H.; Hwang, W.S. Numerical simulation of inclusion removal in a billet continuous casting mold based on the partial-cell technique. ISIJ Int. 2003, 43, 1715–1723. [Google Scholar] [CrossRef]
  18. Raghavendra, K.; Sarkar, S.; Ajmani, S.K.; Denys, M.B.; Singh, M.K. Mathematical modelling of single and multi-strand tundish for inclusion analysis. Appl. Math. Model 2013, 37, 6284–6300. [Google Scholar] [CrossRef]
  19. Liu, Z.; Li, L.; Li, B. Large eddy simulation of transient flow, solidification, and particle transport processes in continuous-casting mold. JOM 2014, 66, 1184–1196. [Google Scholar] [CrossRef]
  20. Javurek, M.; Gittler, P.; Rossler, R.; Kaufmann, B.; Presslinger, H. Simulation of nonmetallic inclusions in a continuous casting strand. Steel Res. Int. 2005, 76, 64–70. [Google Scholar] [CrossRef]
  21. Cwudzinski, A. Numerical simulations and industrial experiments of liquid steel alloying process in one strand slab tundish. Ironmak. Steelmak. 2015, 42, 132–138. [Google Scholar] [CrossRef]
  22. Cwudzinski, A. Mathematical modeling and industrial experiment of liquid steel flow in the three outlets continuous casting bloom tundish. Arch. Metall. Mater. 2013, 58, 1077–1083. [Google Scholar] [CrossRef]
  23. Cwudzinski, A. Numerical, physical, and industrial experiments of liquid steel mixture in one strand slab tundish with flow control devices. Steel Res Int. 2014, 85, 623–631. [Google Scholar] [CrossRef]
  24. Sahai, Y.; Emi, T. Melt flow characterization in continuous casting tundishes. ISIJ Int. 1996, 36, 667–672. [Google Scholar] [CrossRef]
  25. Lei, H.; Jiang, J.; Yang, B.; Zhao, Y.; Zhang, H.; Wang, W.; Dong, G. Mathematical model for collision-coalescence among inclusions in the bloom continuous caster with M-EMS. Metall. Mater. Trans. B 2018, 49, 666–676. [Google Scholar] [CrossRef]
  26. Yang, B.; Lei, H.; Bi, Q.; Xiao, Y.; Zhao, Y. Numerical simulation of collision-coalescence and removal of inclusions in a tundish. JOM 2018, 70, 2950–2957. [Google Scholar] [CrossRef]
  27. Lei, H.; Wang, L.; Wu, Z.; Fan, J. Collision and coalescence of alumina particles in the vertical bending continuous caster. ISIJ Int. 2002, 42, 717–725. [Google Scholar] [CrossRef]
  28. Zhang, Y.H.; Wu, W.F.; Huang, J. Numerical simulation research on flow behavior of T-type five strands asymmetric tundish with additional flow control devices. Foundry Technol. 2010, 31, 922–925. [Google Scholar]
  29. Wang, Q.; Li, B.; Tsukihashi, F. Modeling of a thermo-electromagneto-hydrodynamic problem in continuous casting tundish with channel type induction heating. ISIJ Int. 2014, 54, 311–320. [Google Scholar] [CrossRef]
  30. Cong, L.; Zhang, J.M.; Lei, S.W.; Li, M.K. Numerical simulation on tundish induction heating. Res. Iron Steel 2014, 42, 20–25. [Google Scholar]
  31. Lei, H. New insight into combined model and revised model for RTD curves in a multi-strand tundish. Metall. Mater. Trans. B 2015, 46, 2408–2413. [Google Scholar] [CrossRef]
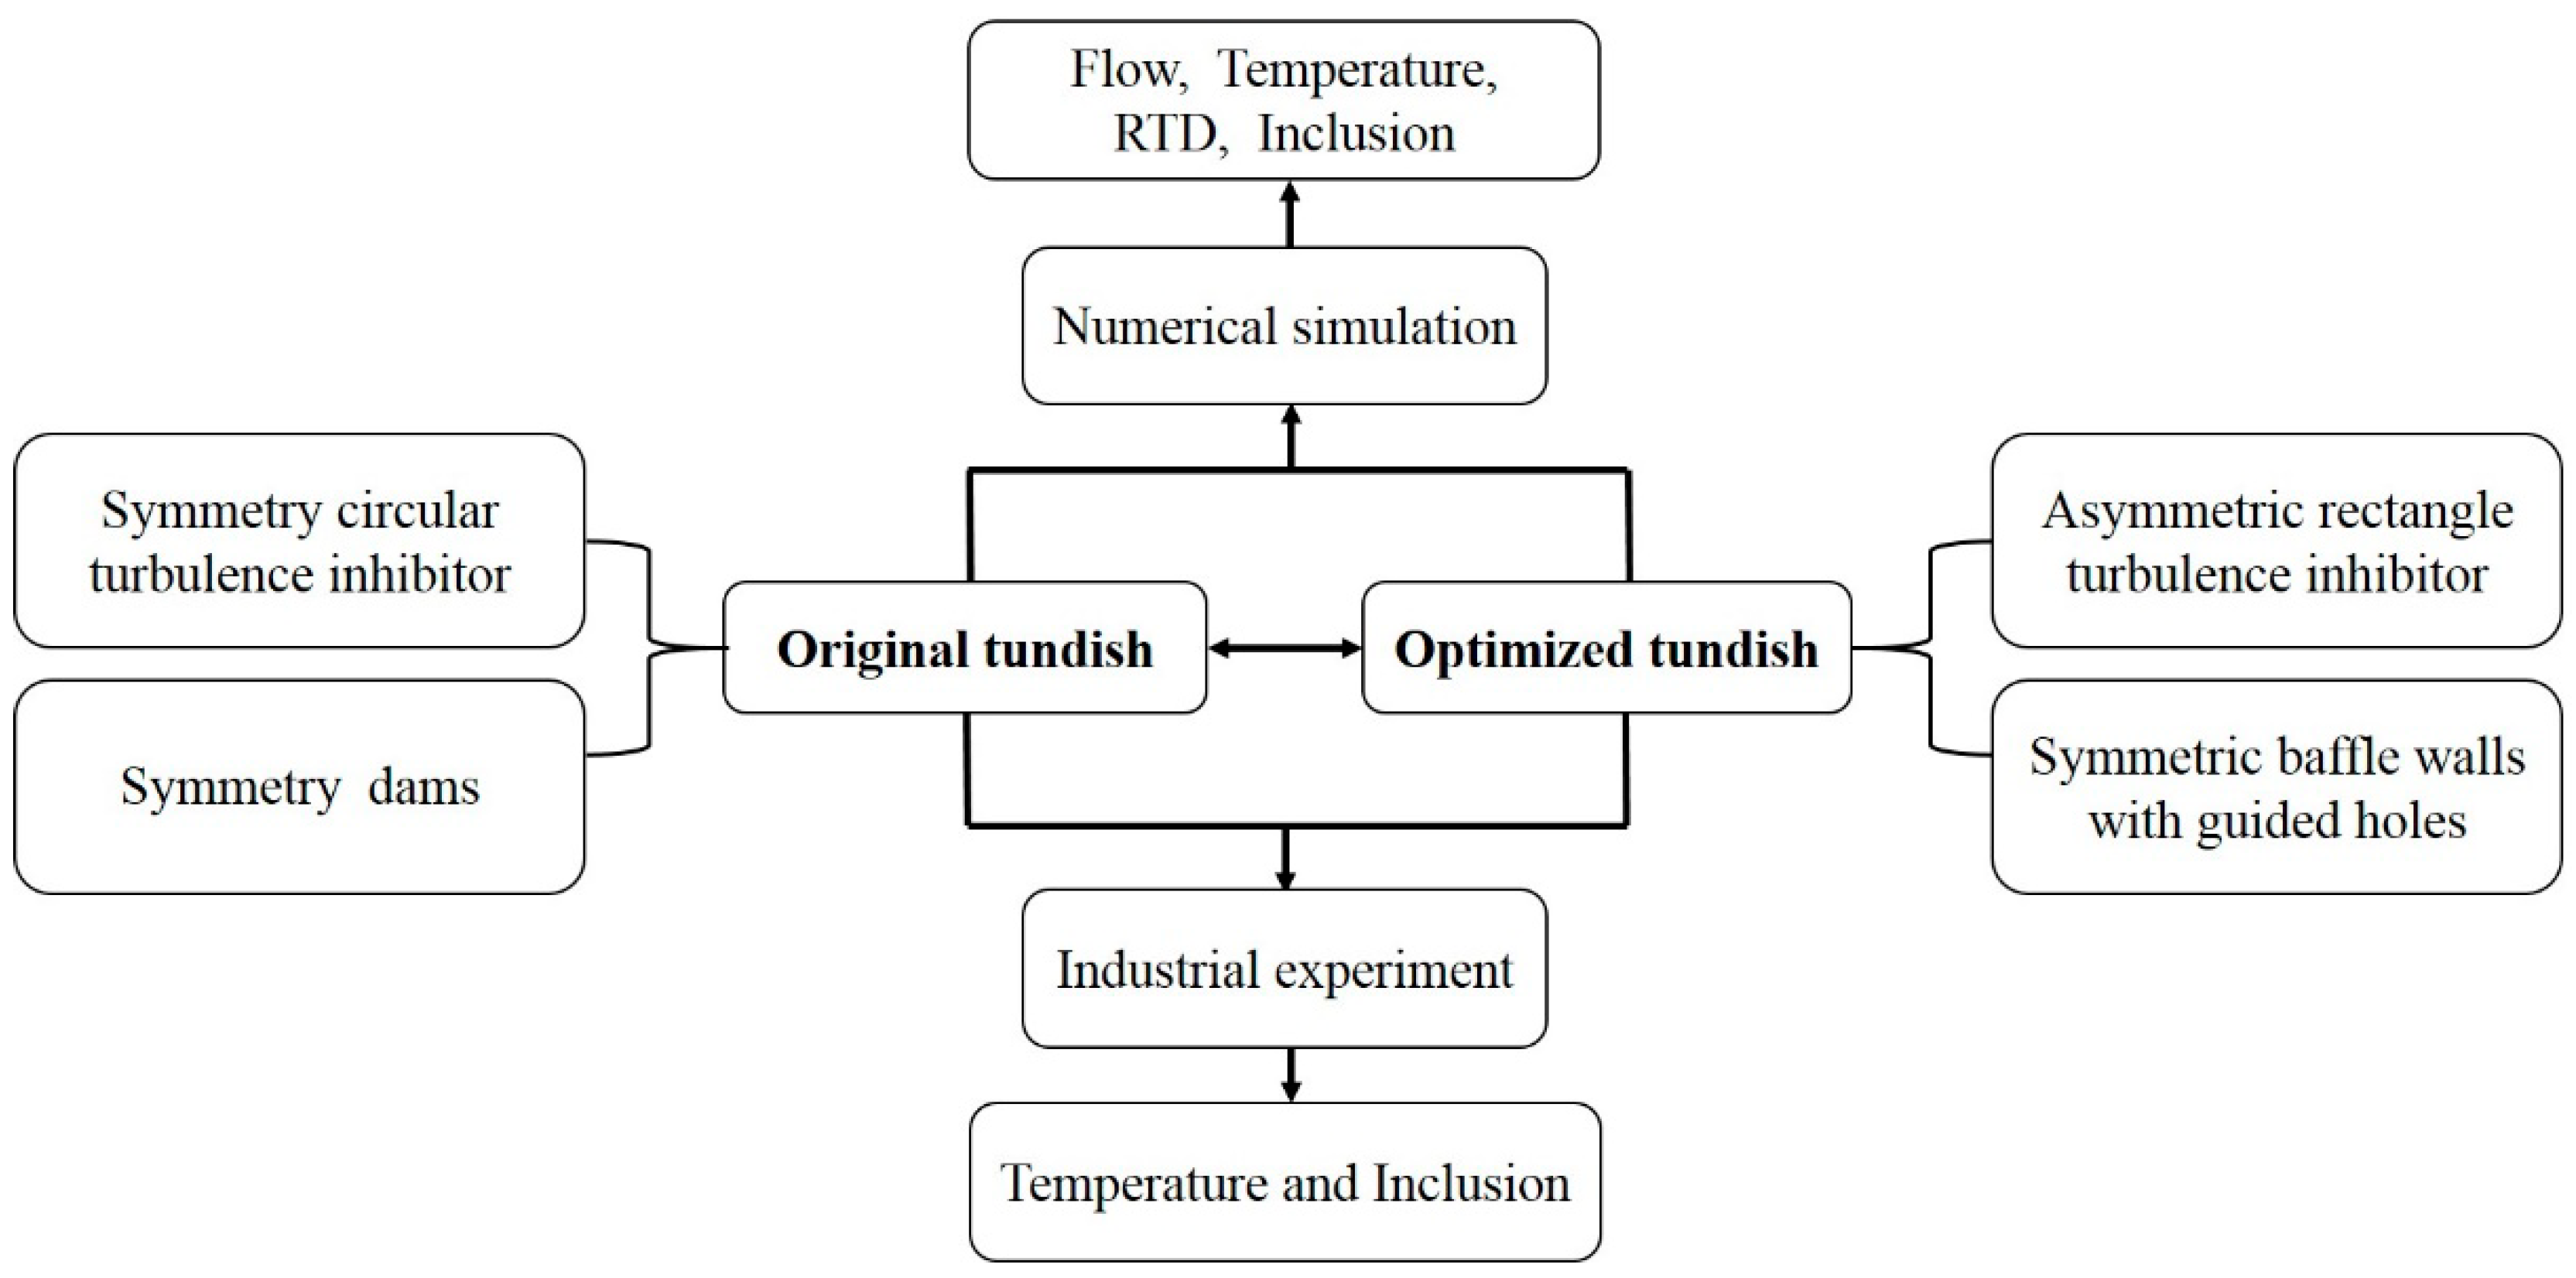
Figure 1. Optimize the physical field for an asymmetric tundish.
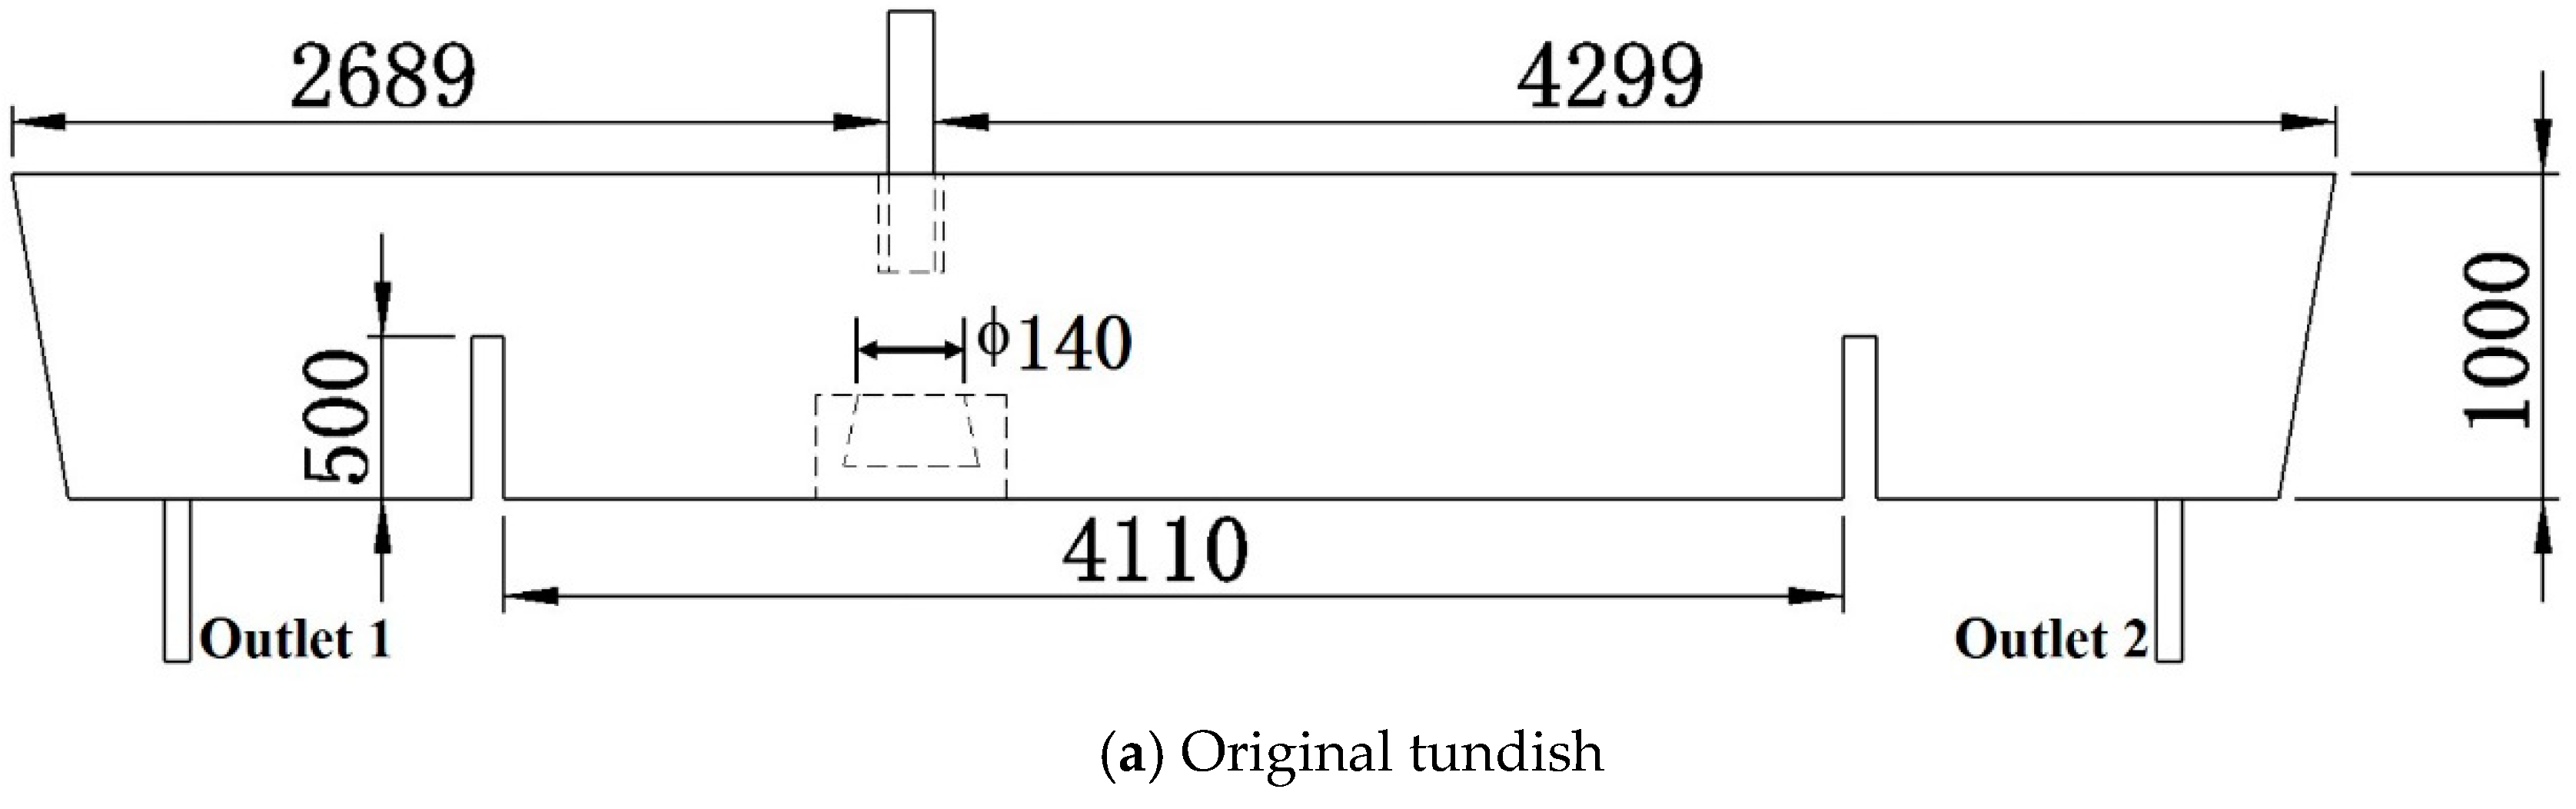
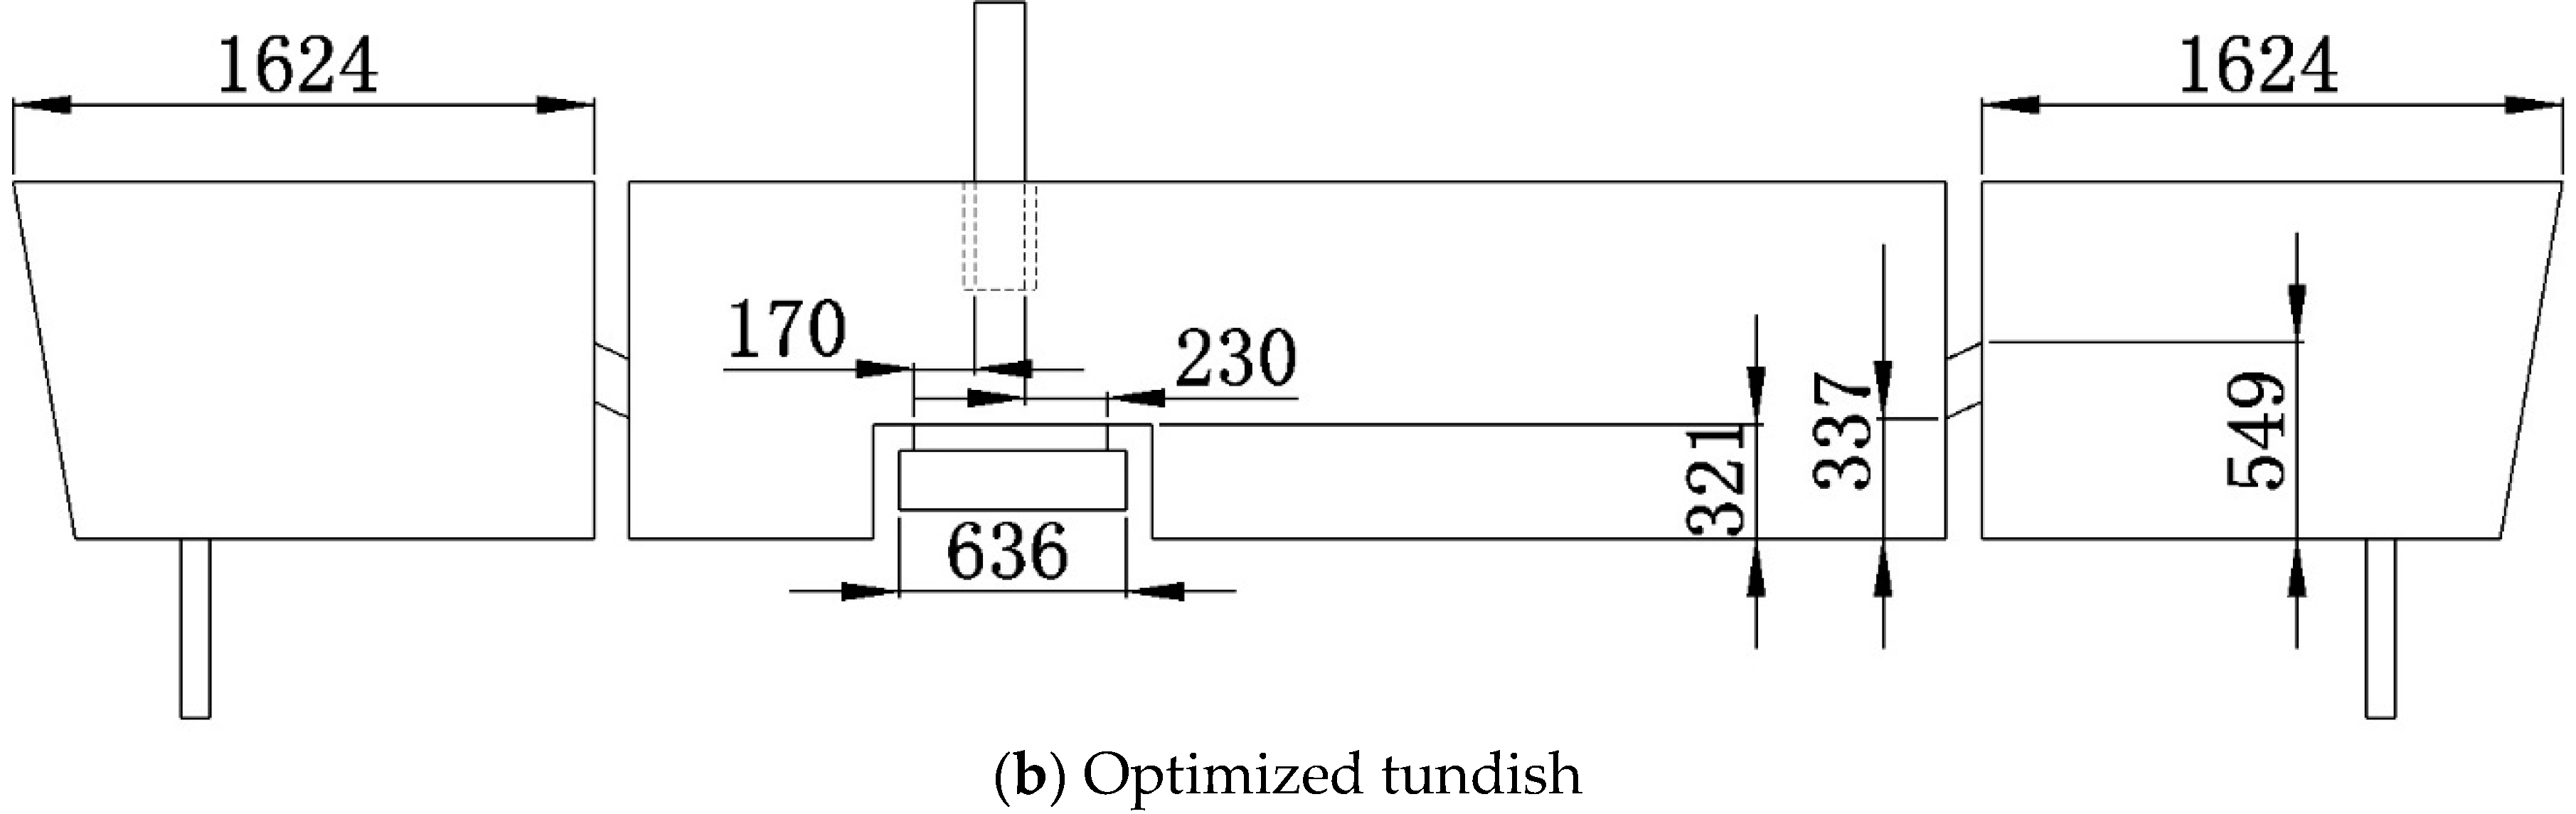
Metals 09 00855 g001
Figure 2. Tundish structure (all dimensions are in mm).
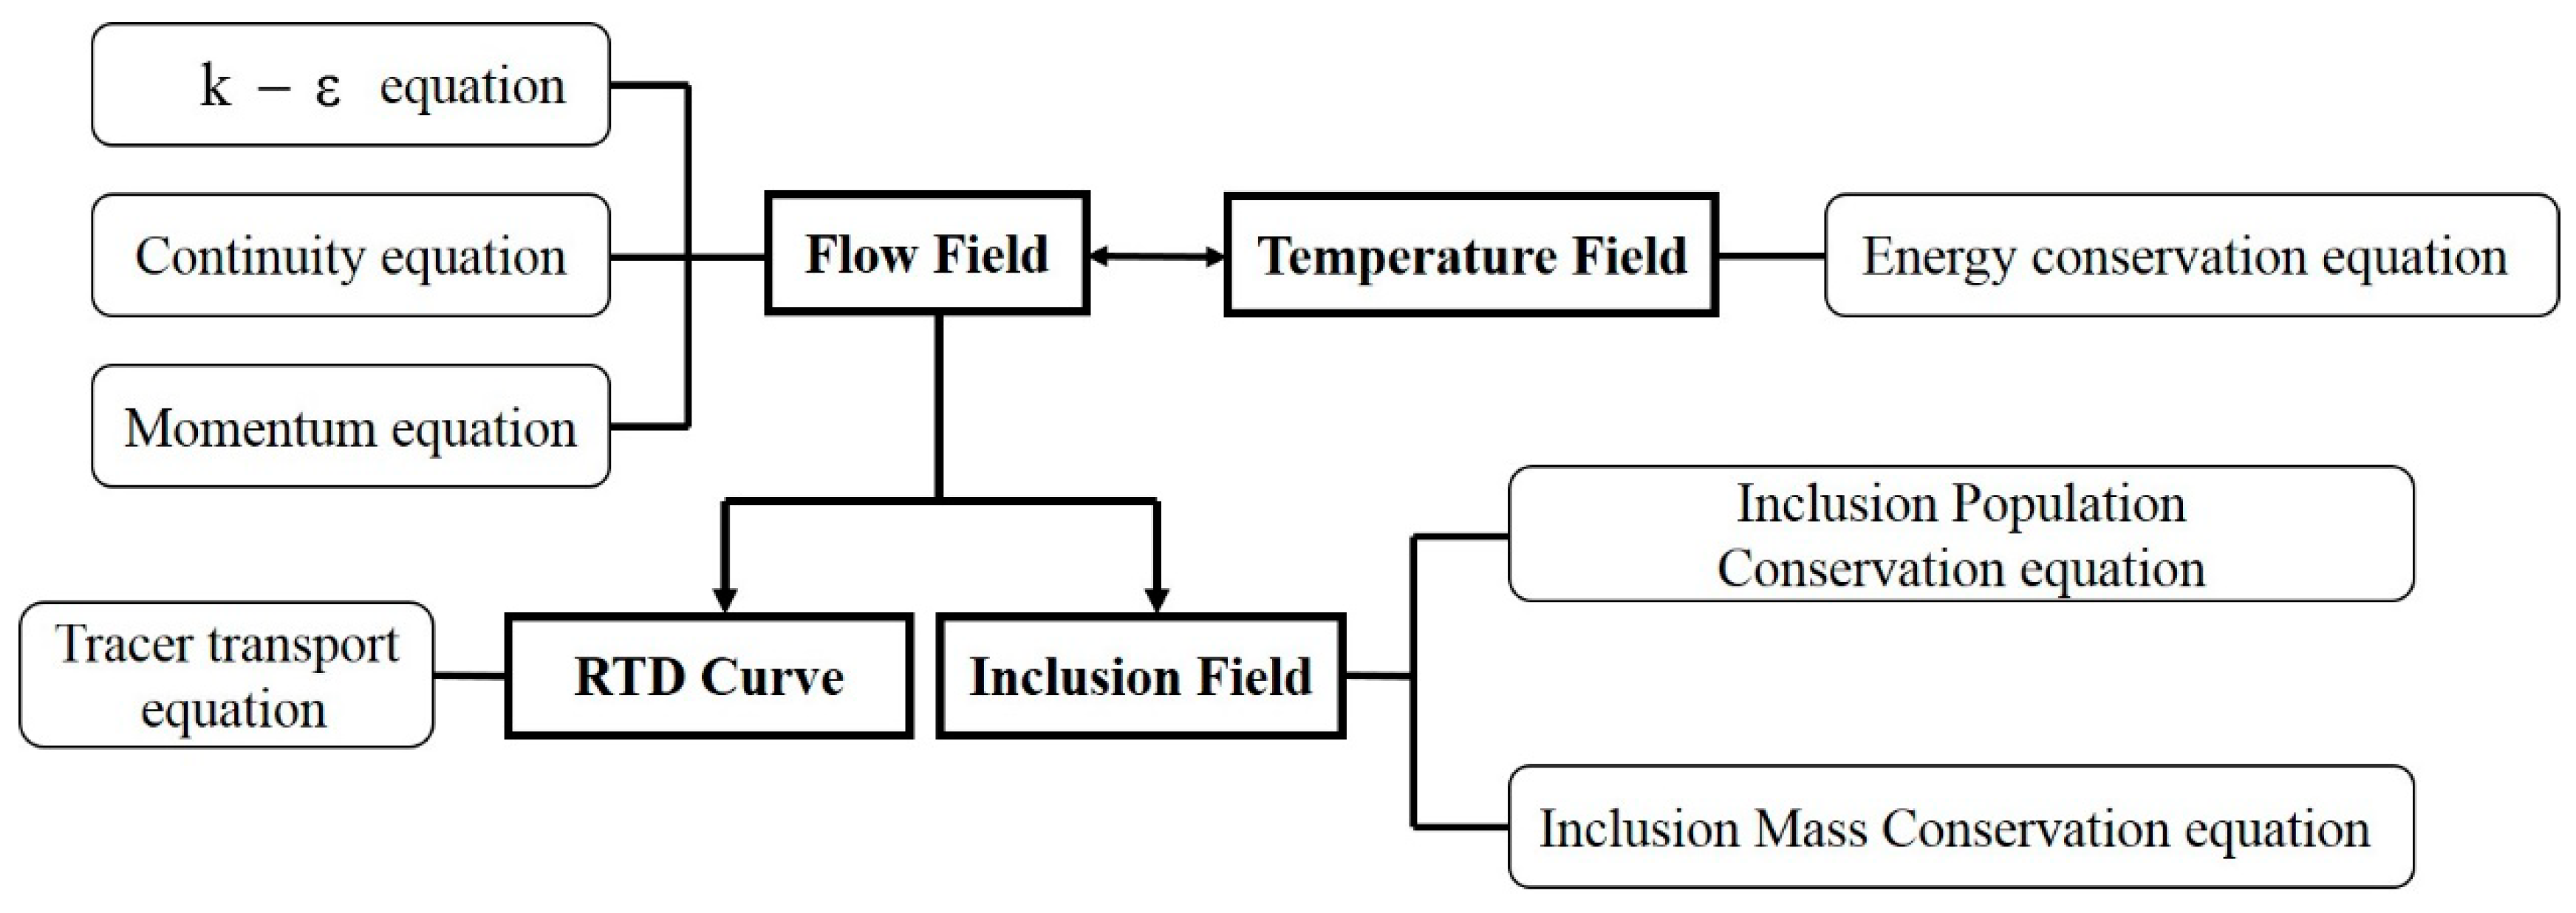
Metals 09 00855 g002aMetals 09 00855 g002b
Figure 3. The numerical solution process.
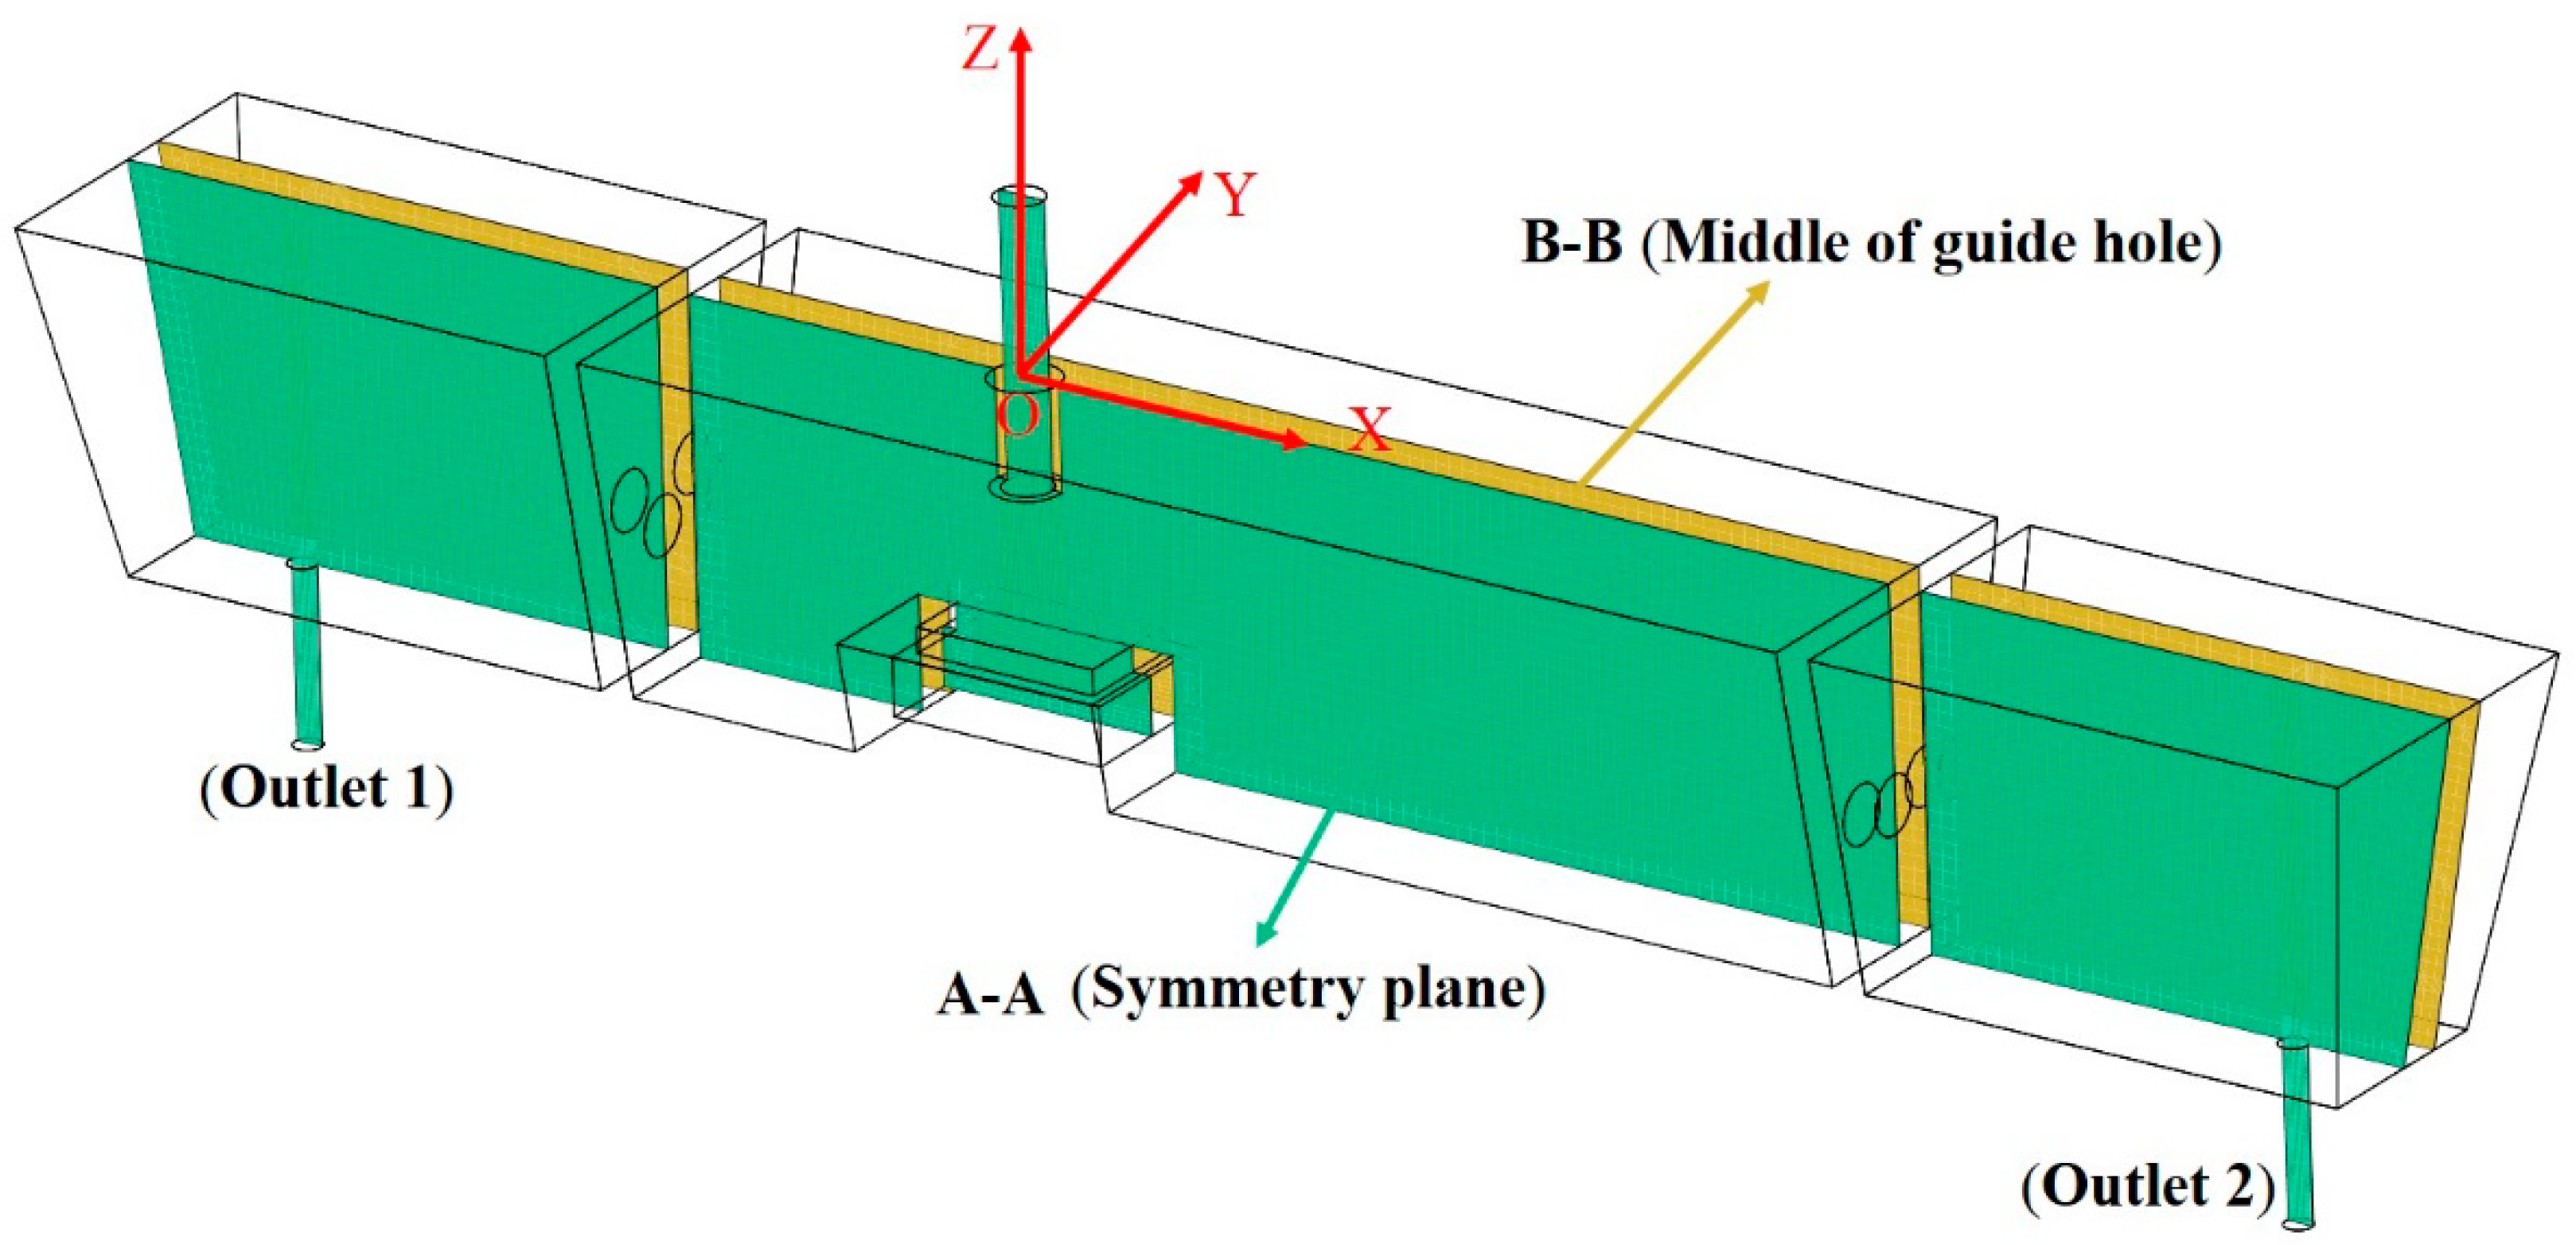
Metals 09 00855 g003
Figure 4. Characteristic sections in the tundish.
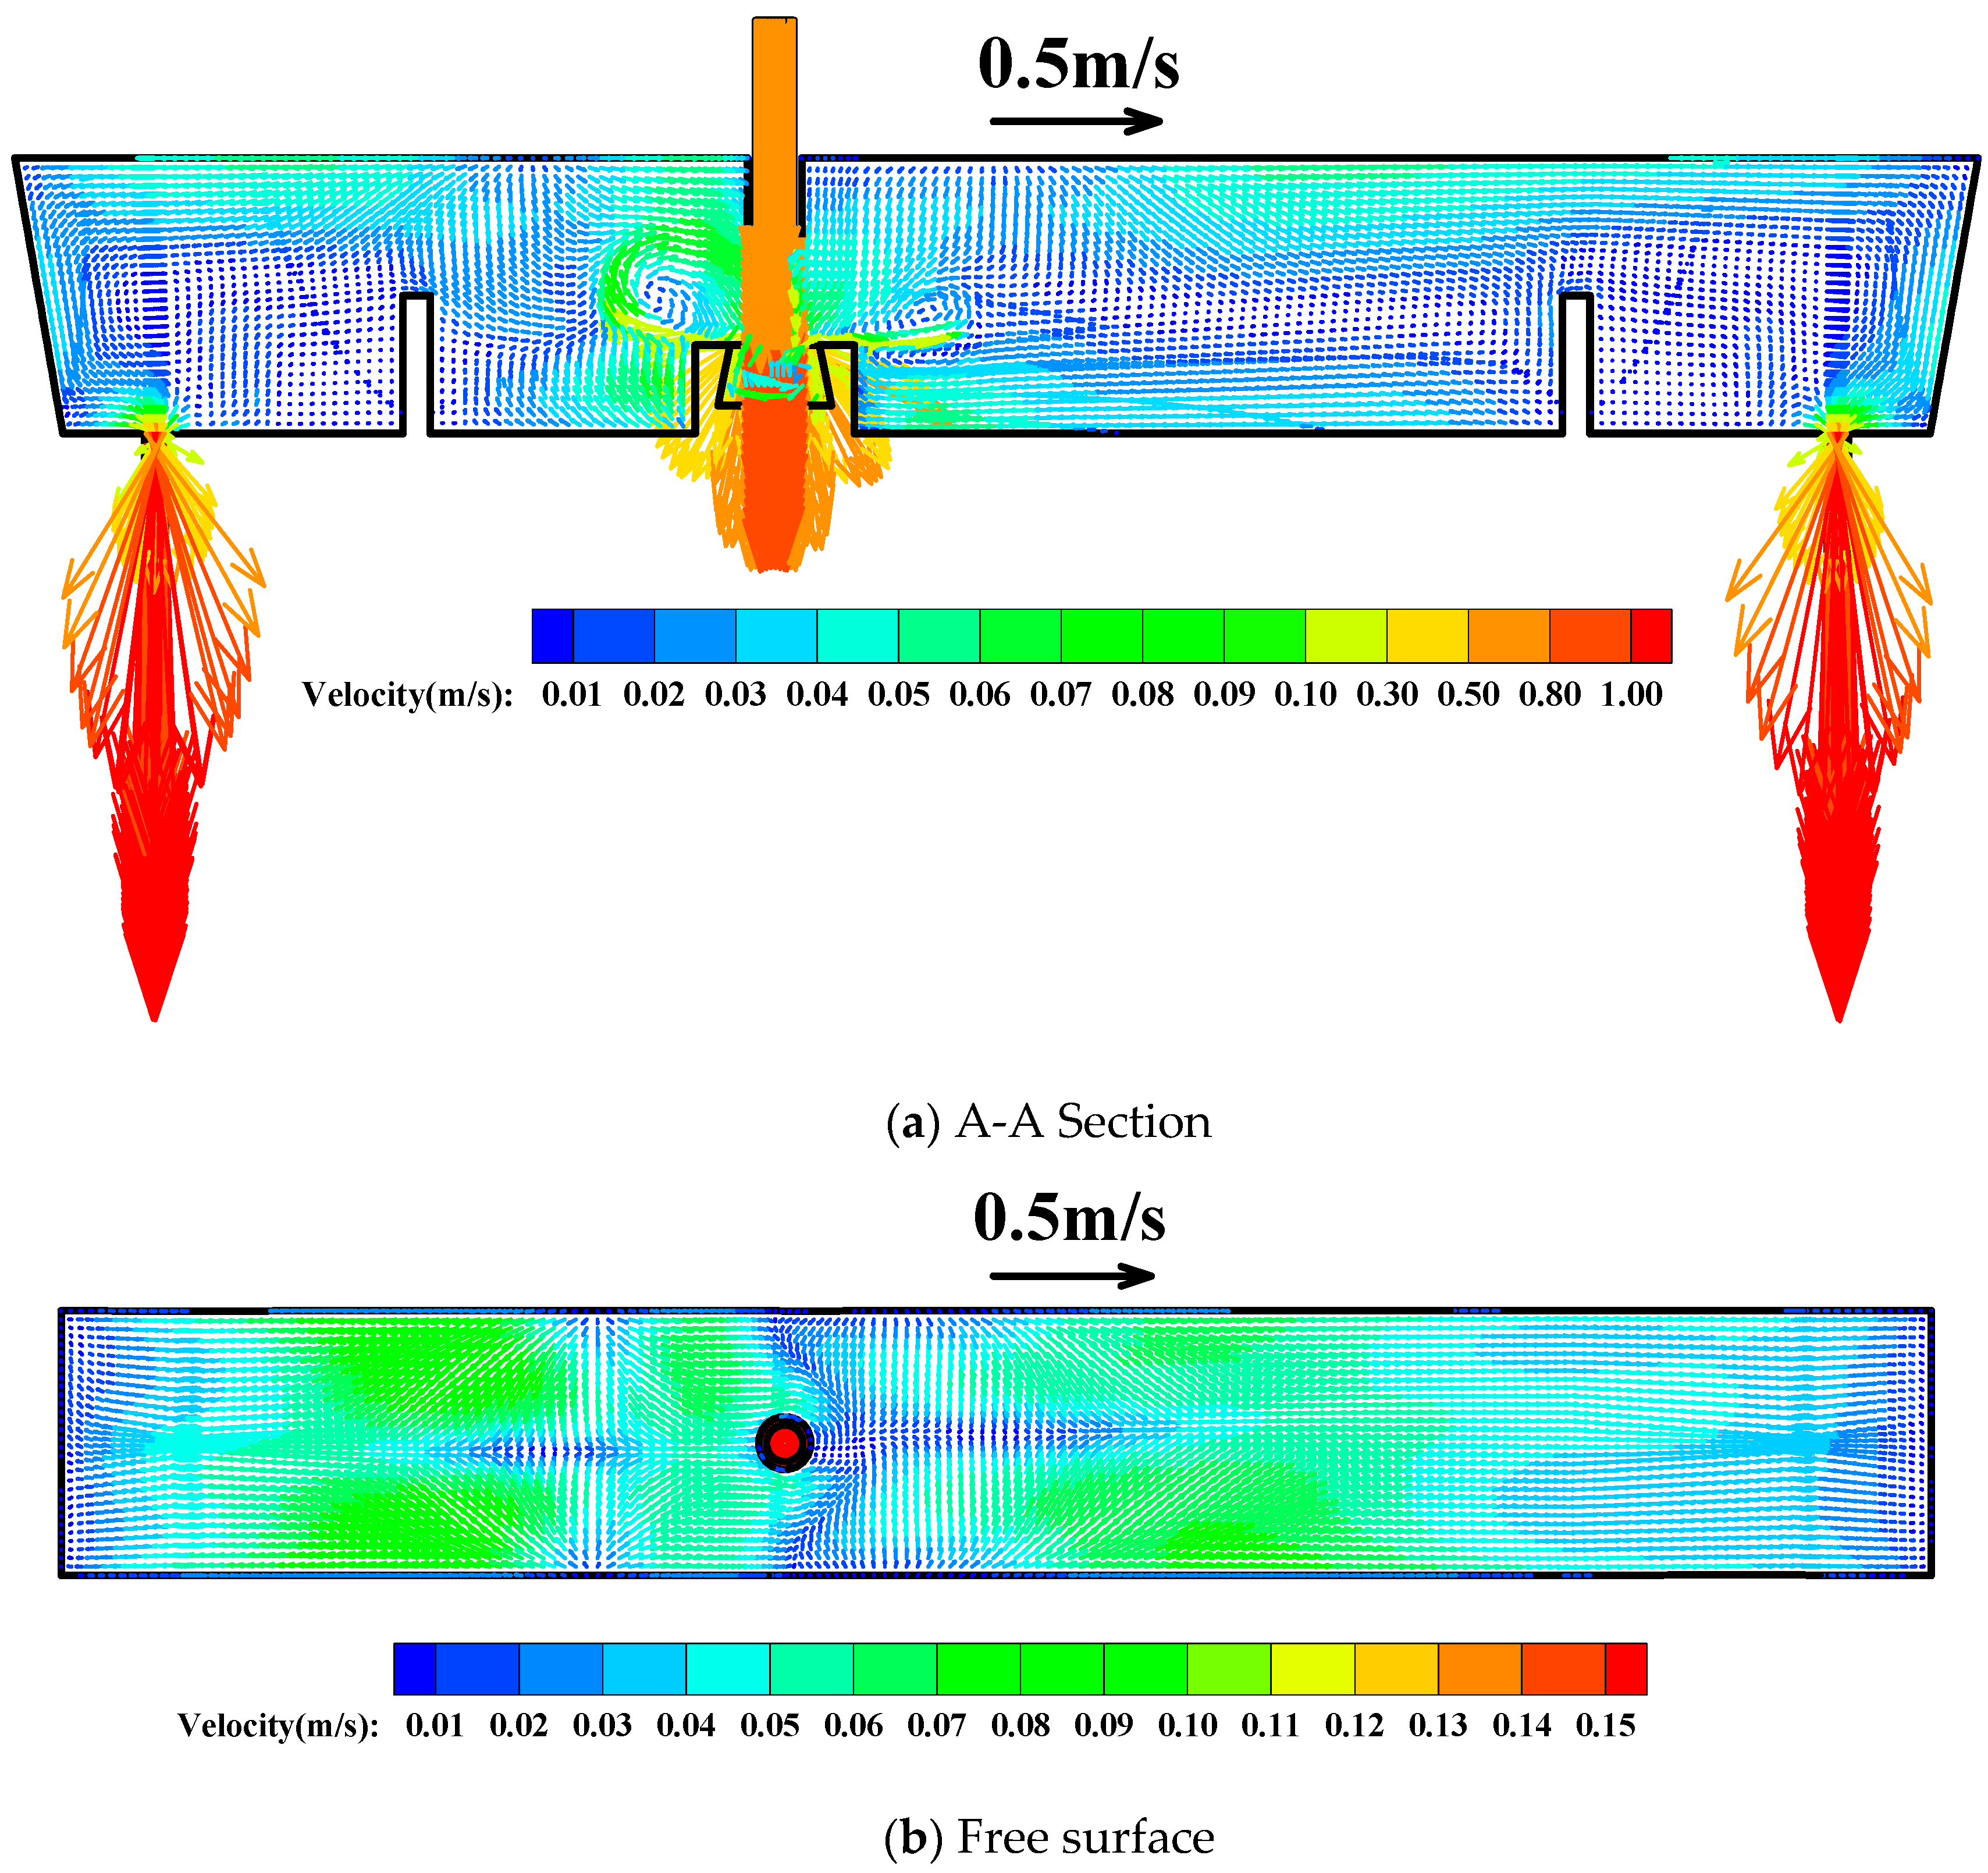
Metals 09 00855 g004
Figure 5. Fluid flow in the original tundish.
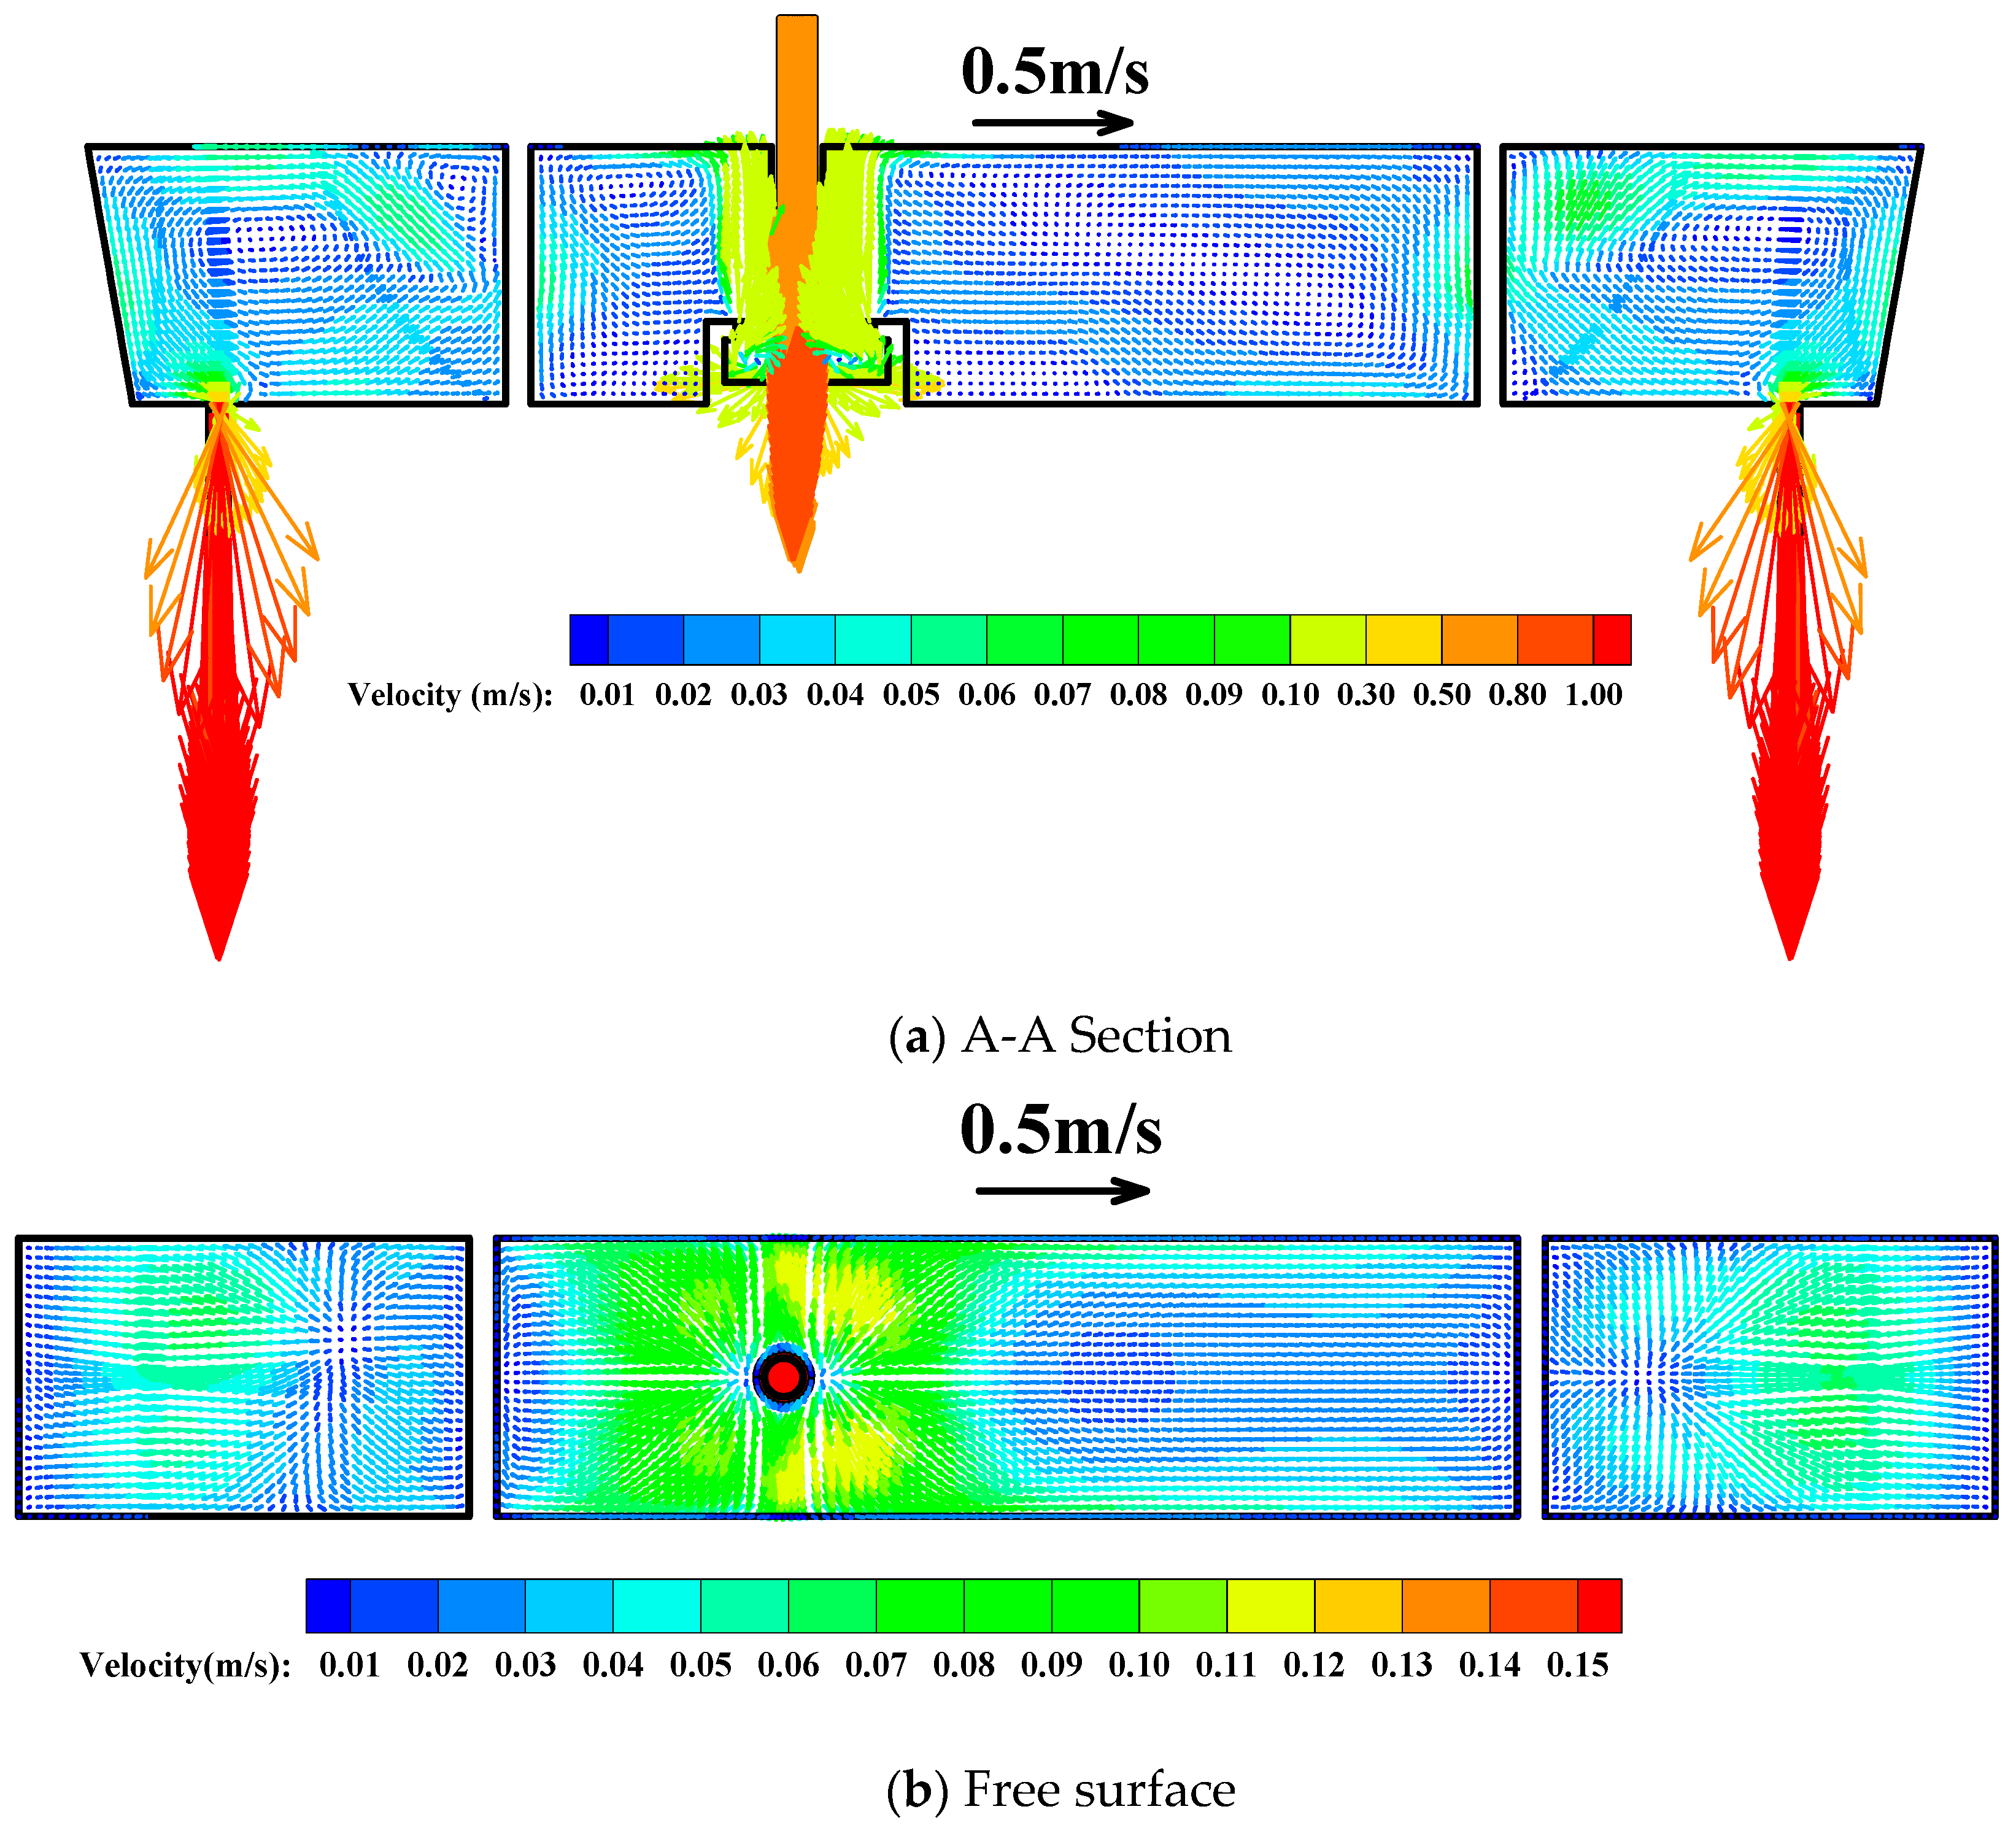
Metals 09 00855 g005
Figure 6. Fluid flow in the optimized tundish.
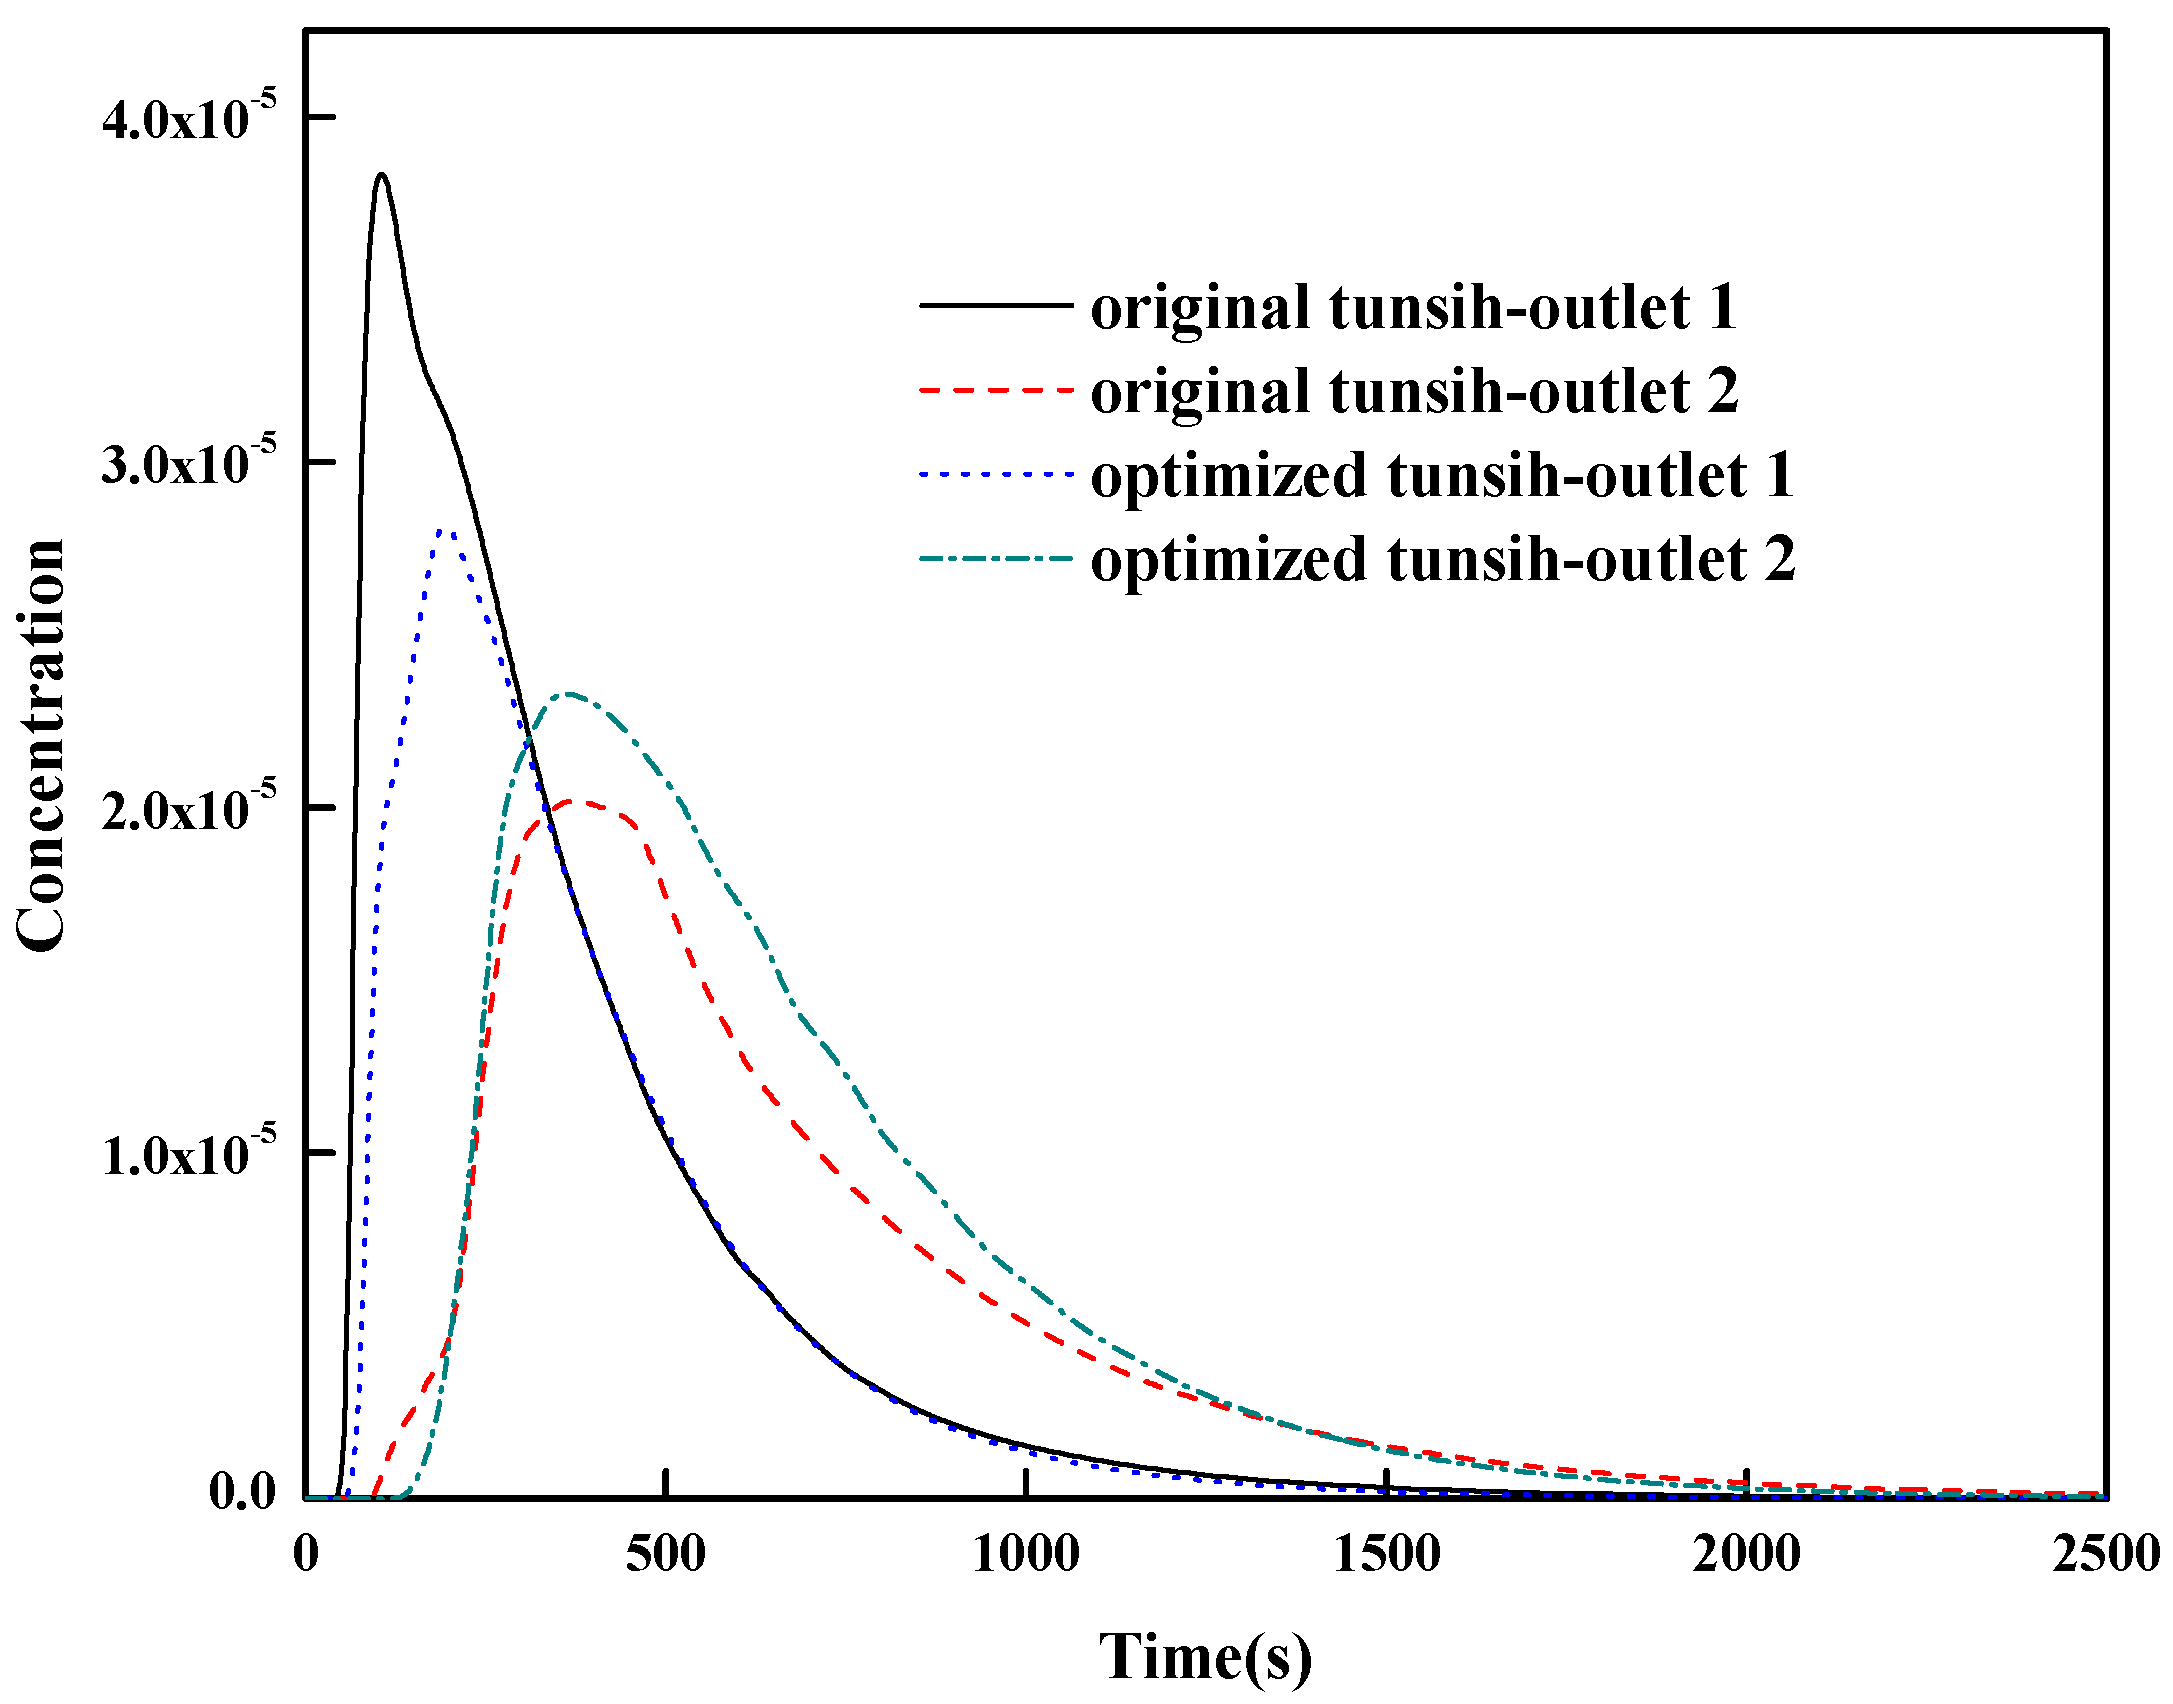
Metals 09 00855 g006
Figure 7. RTD (residence time distribution) curves in the tundish.
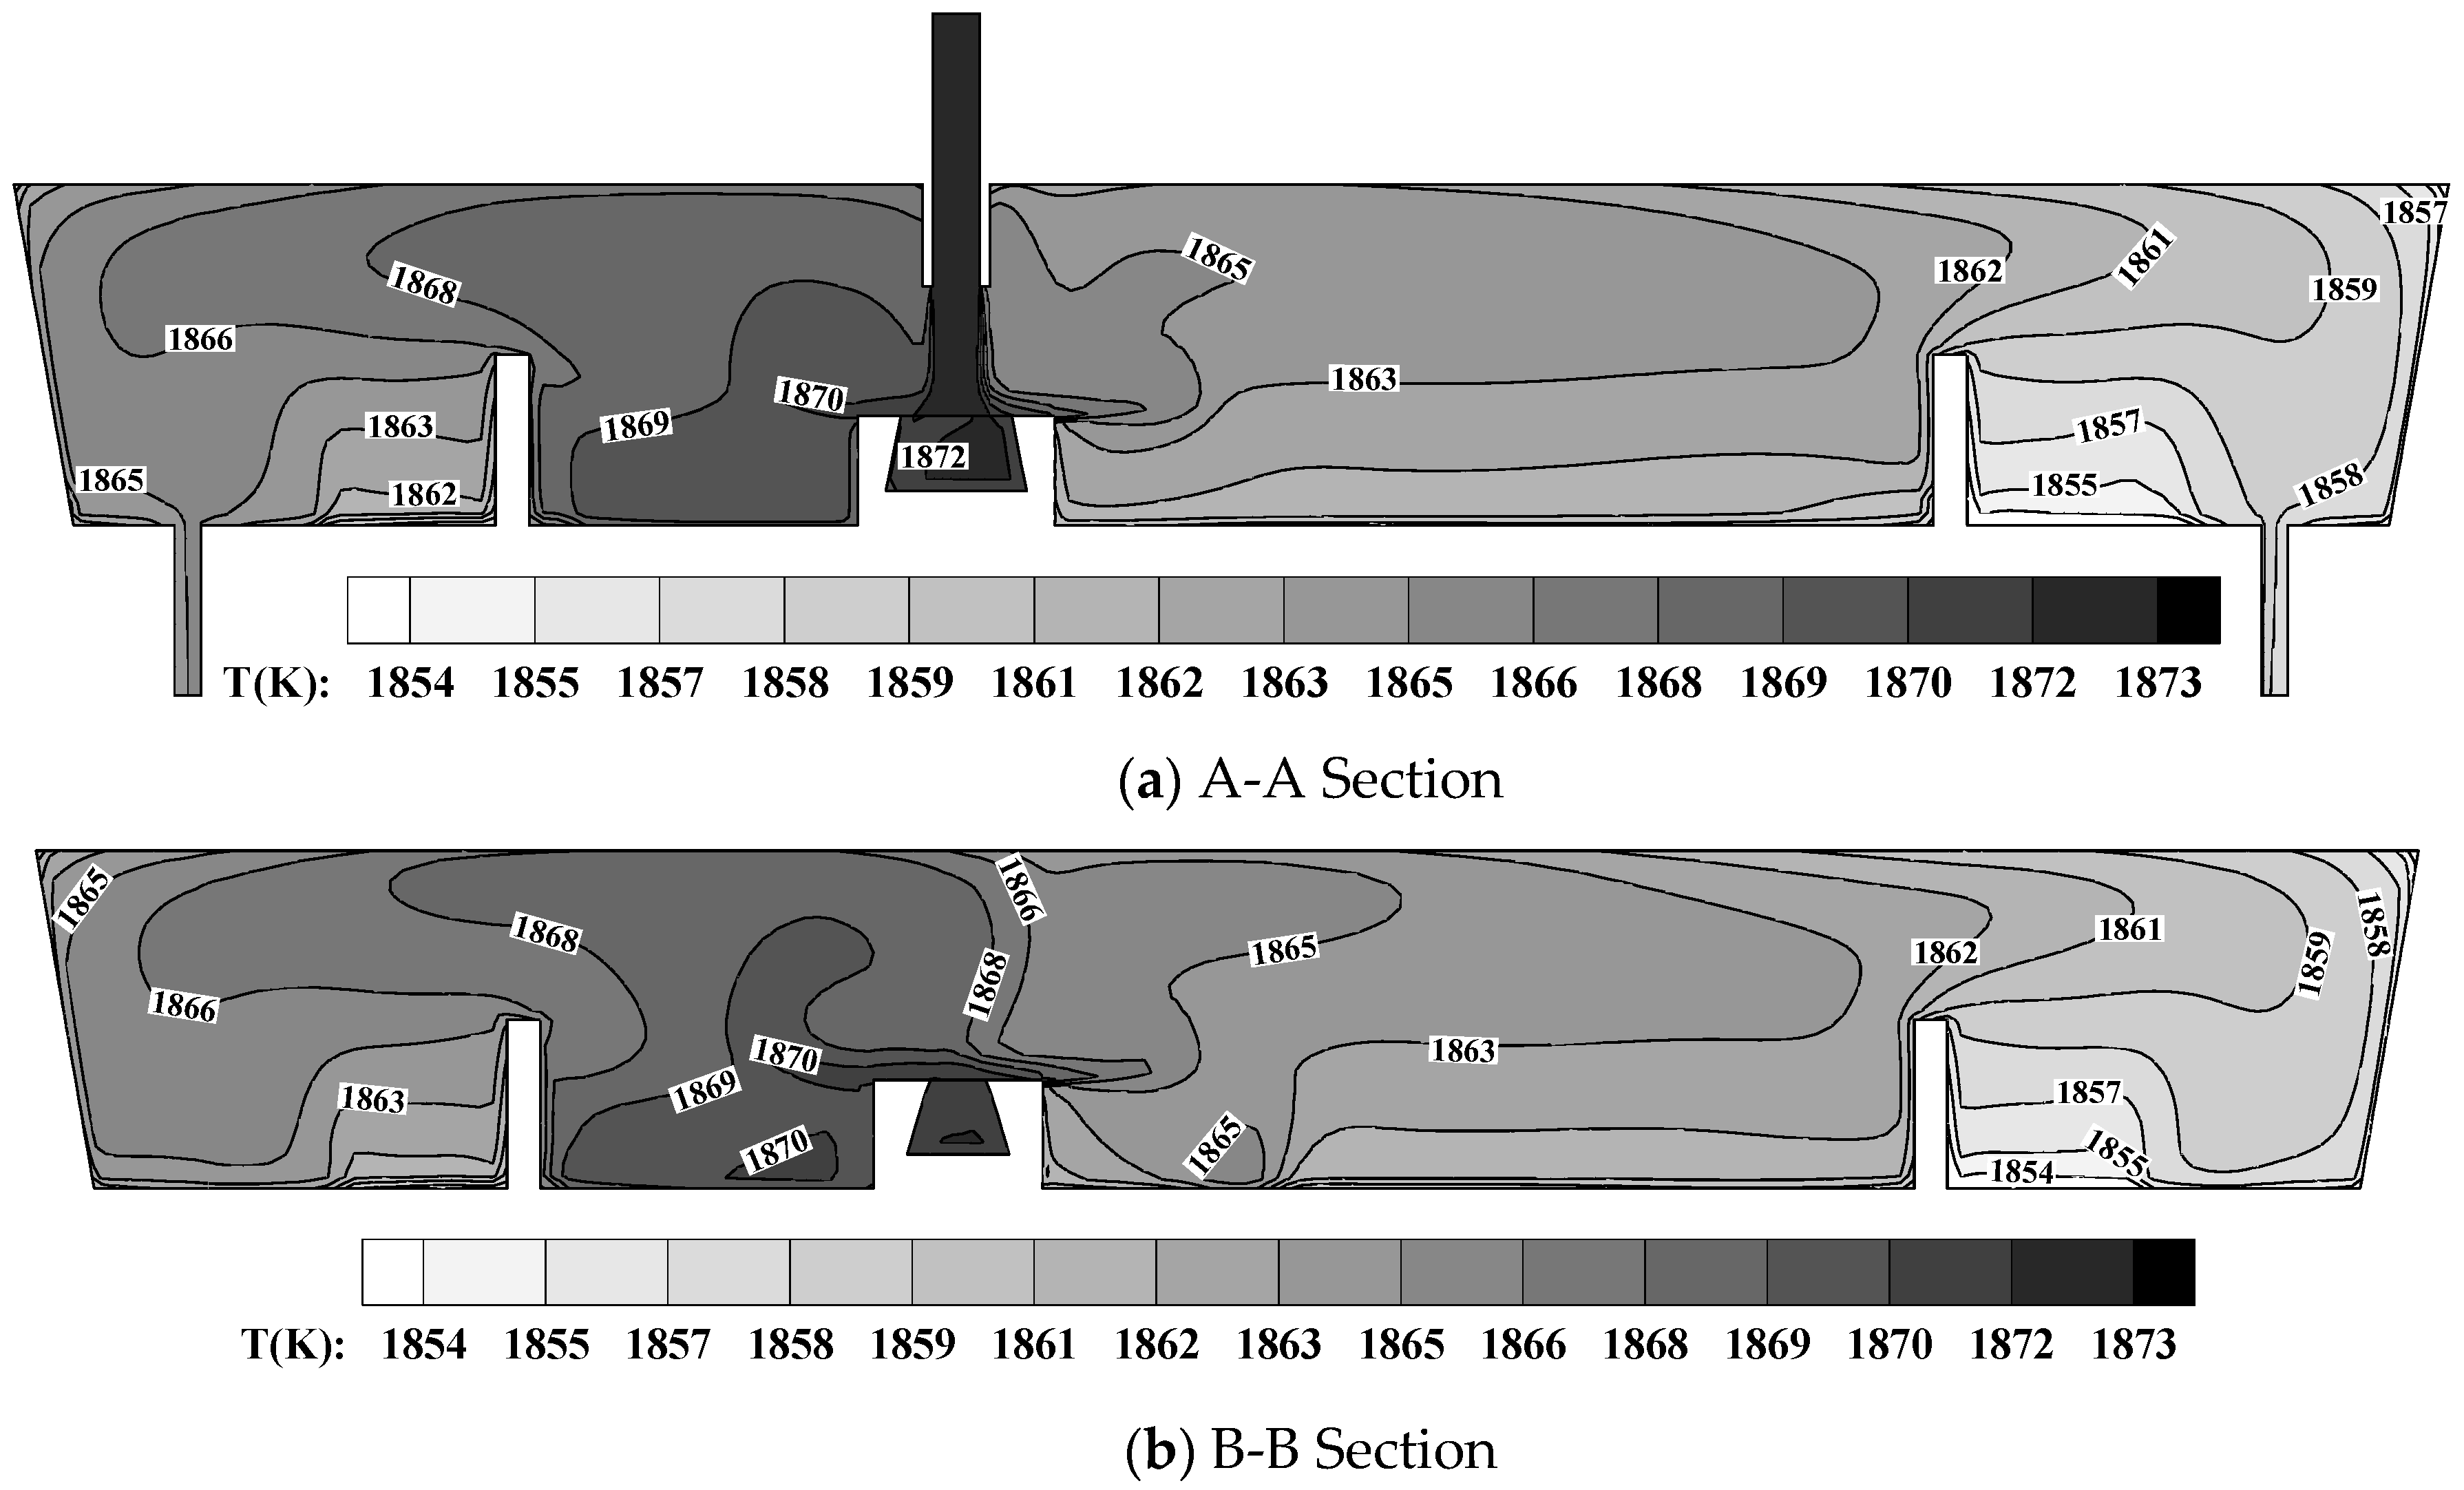
Metals 09 00855 g007
Figure 8. Temperature field in the original tundish.
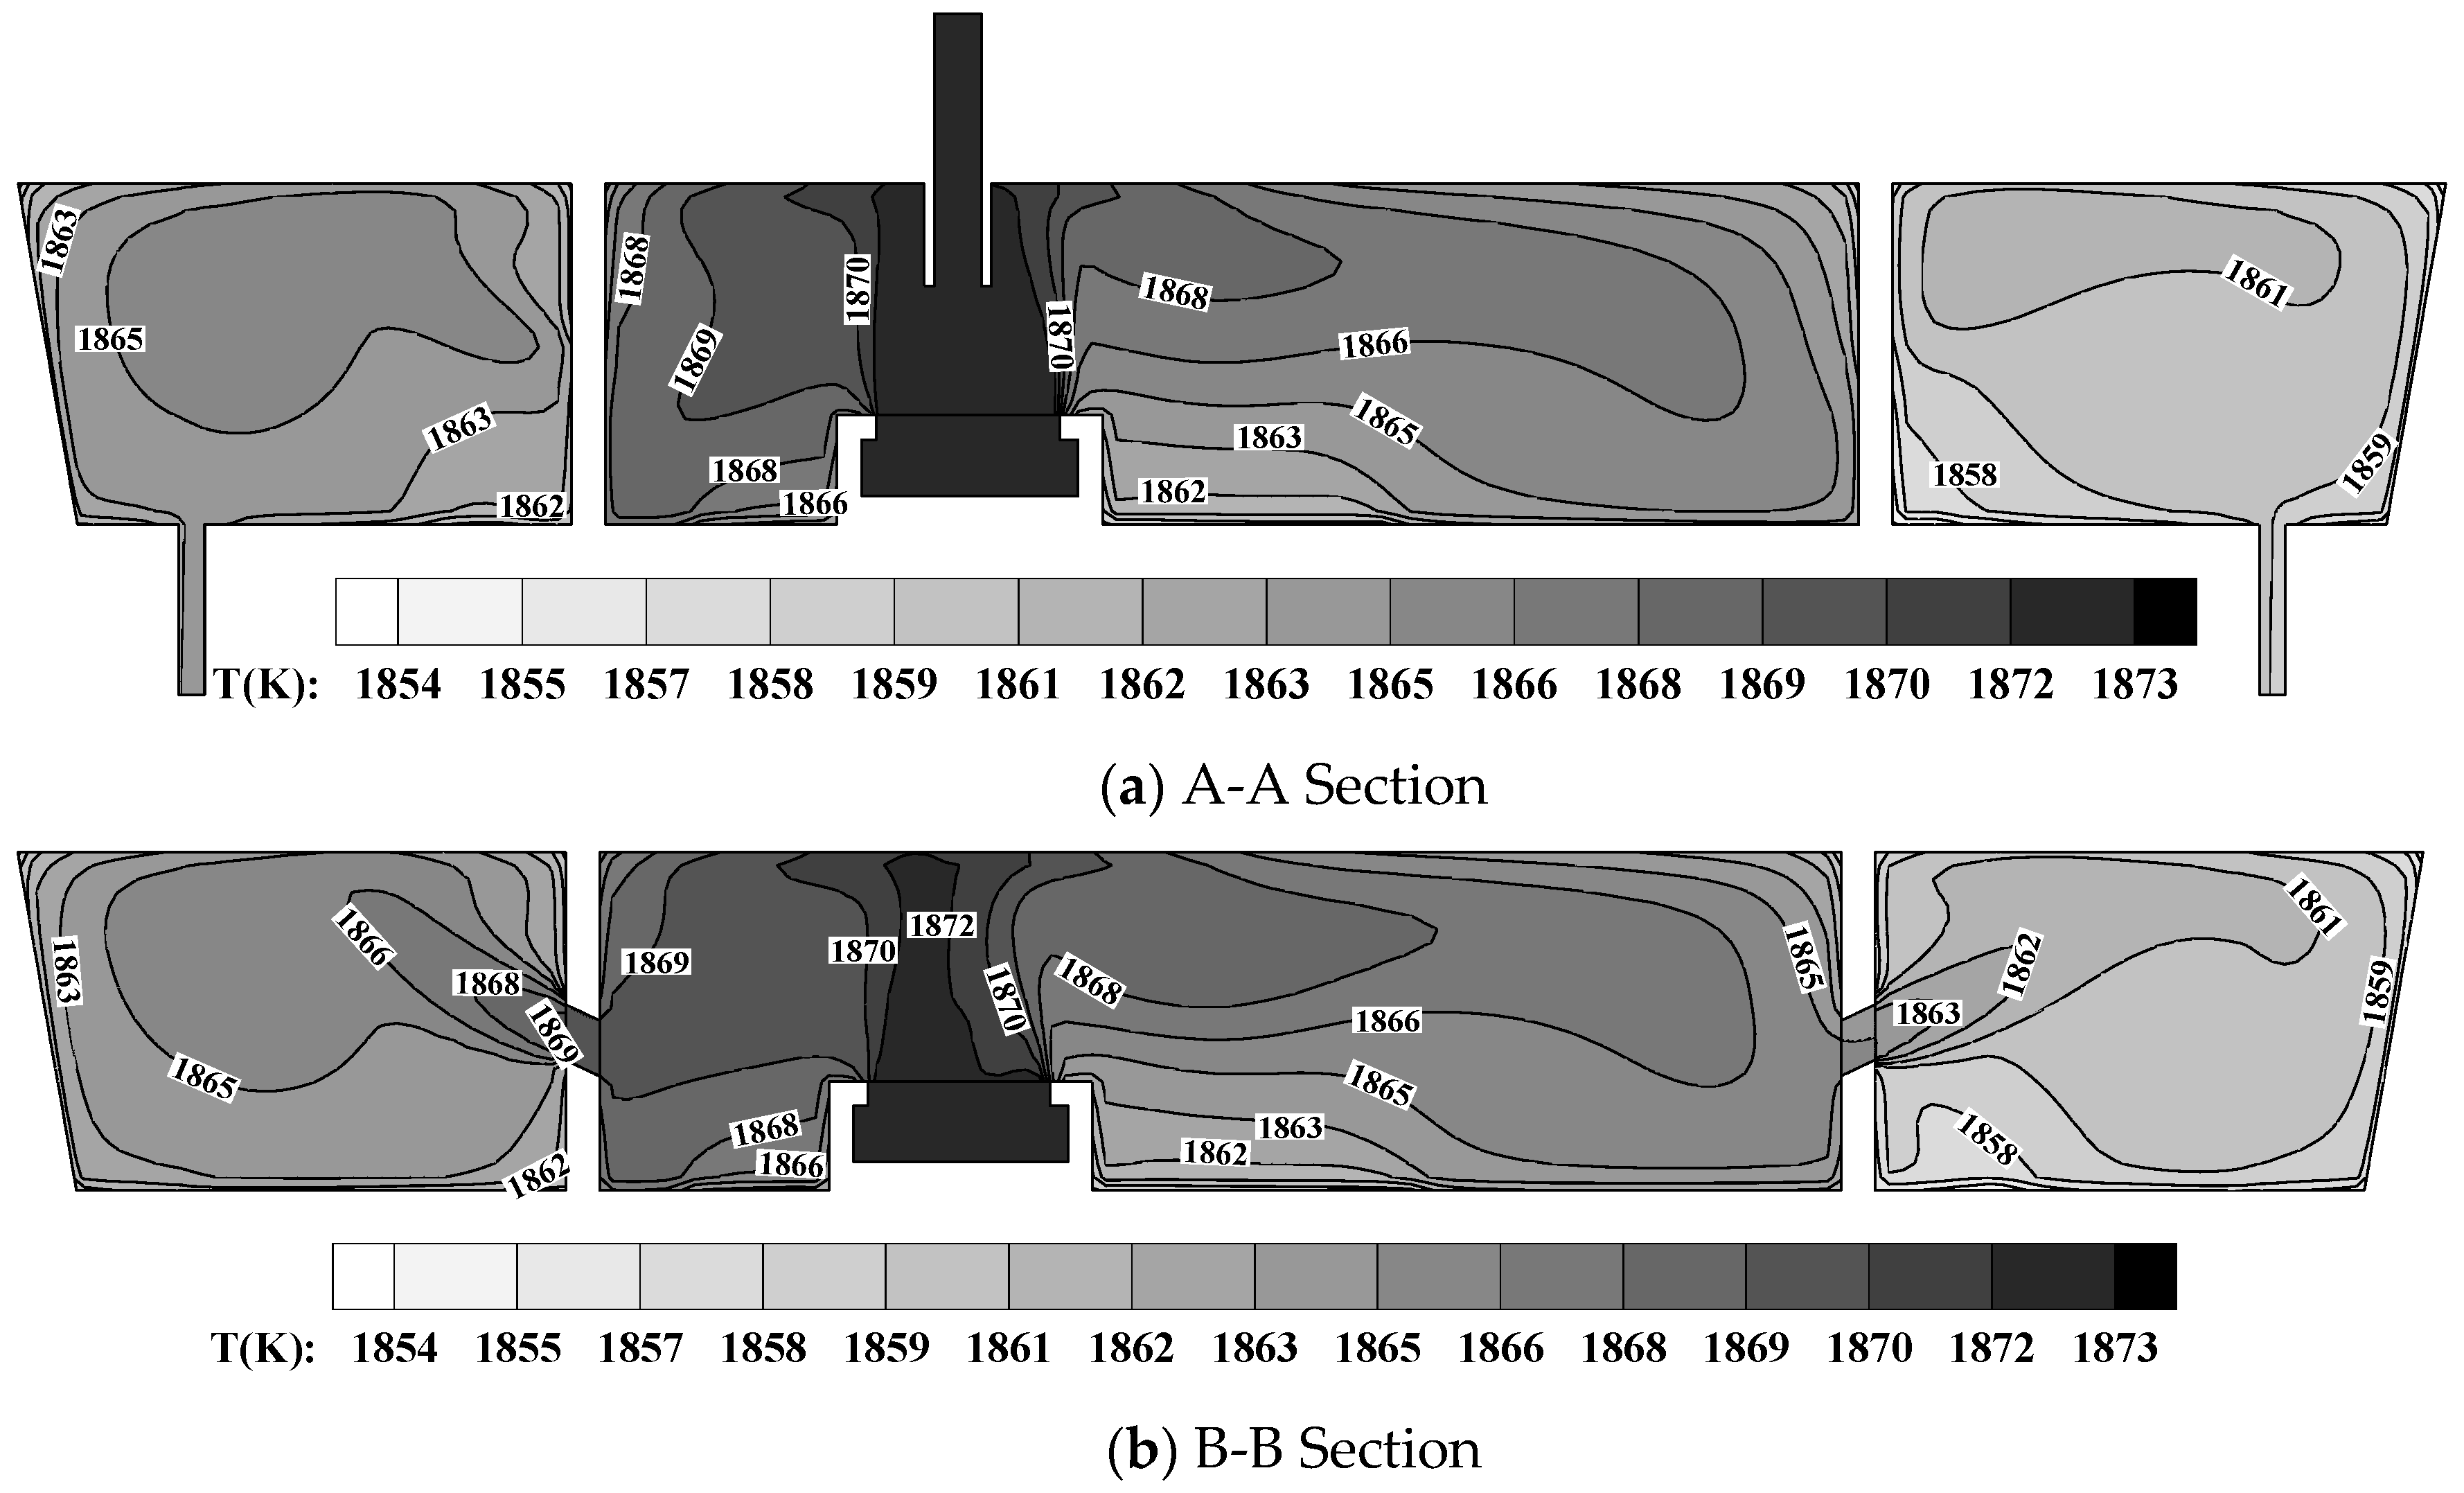
Metals 09 00855 g008
Figure 9. Temperature field in the optimized tundish.
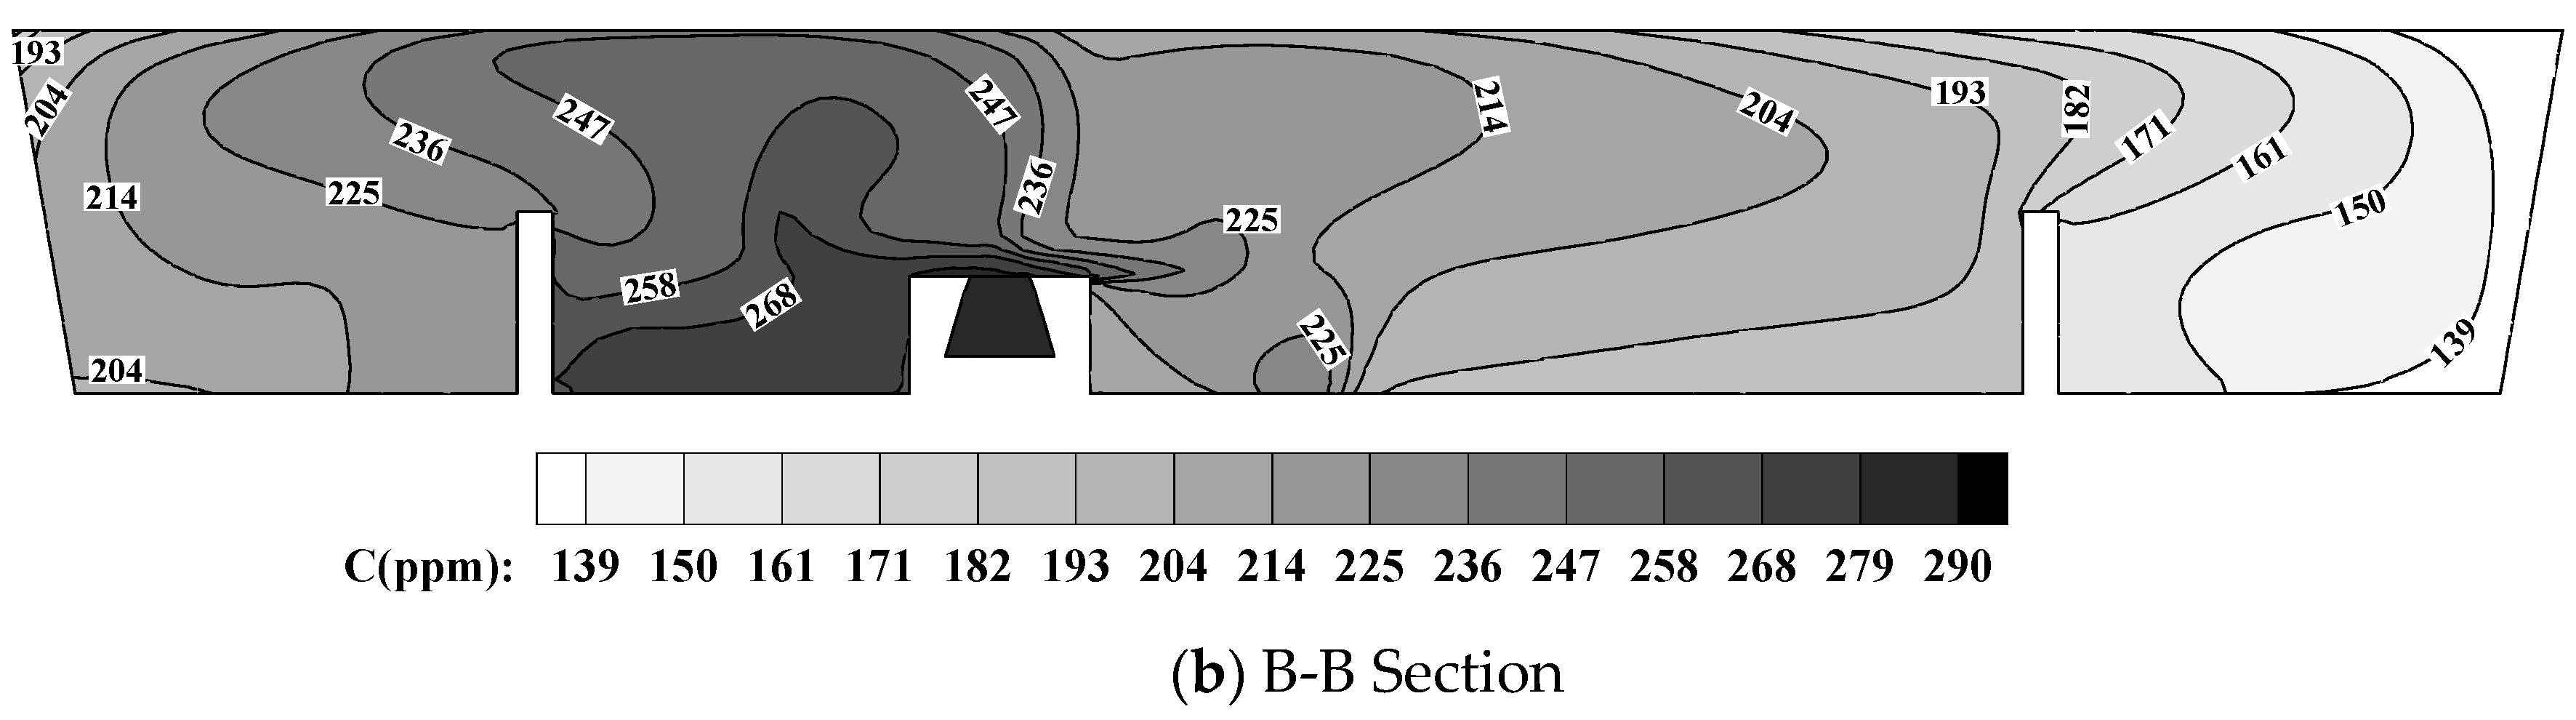
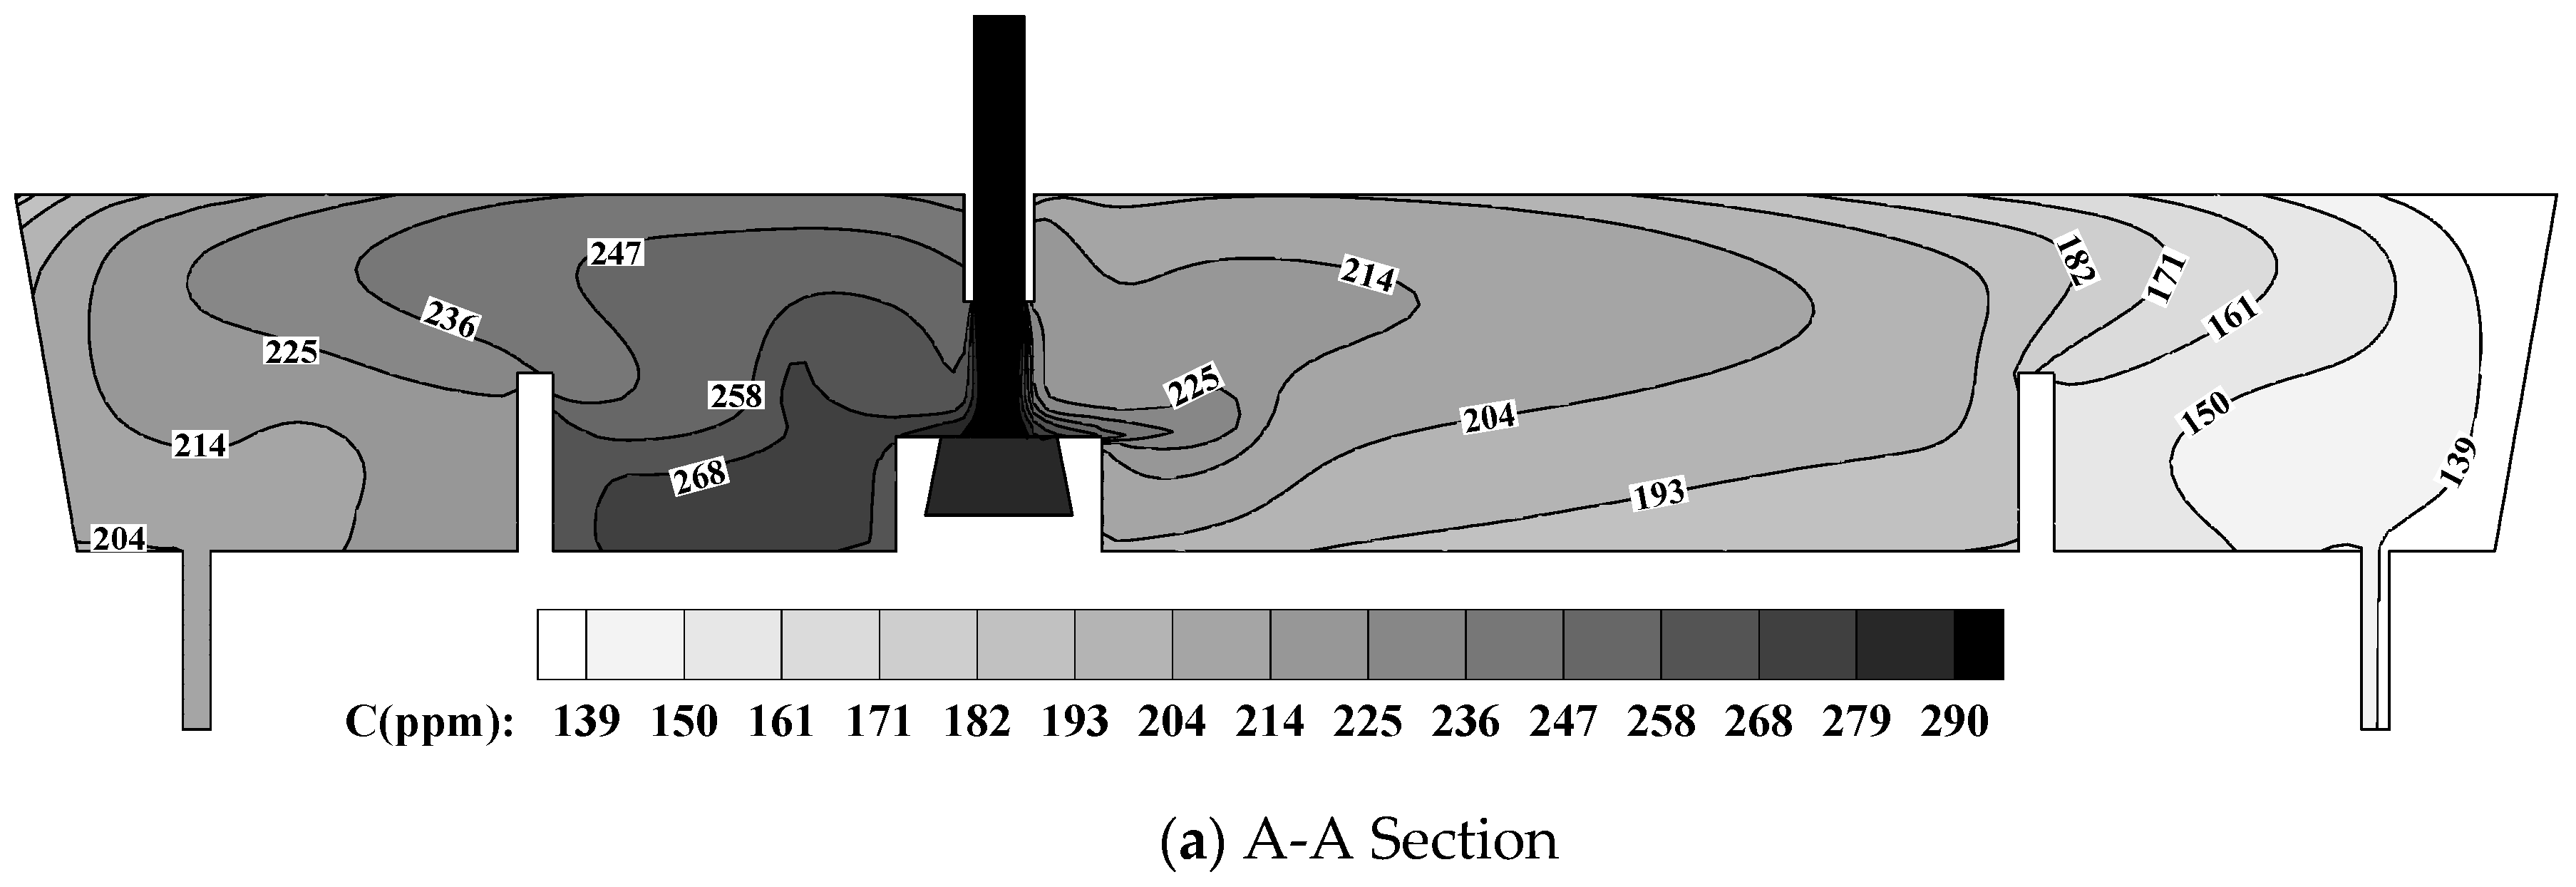
Metals 09 00855 g009
Figure 10. Inclusion volume concentration distribution in the original tundish.
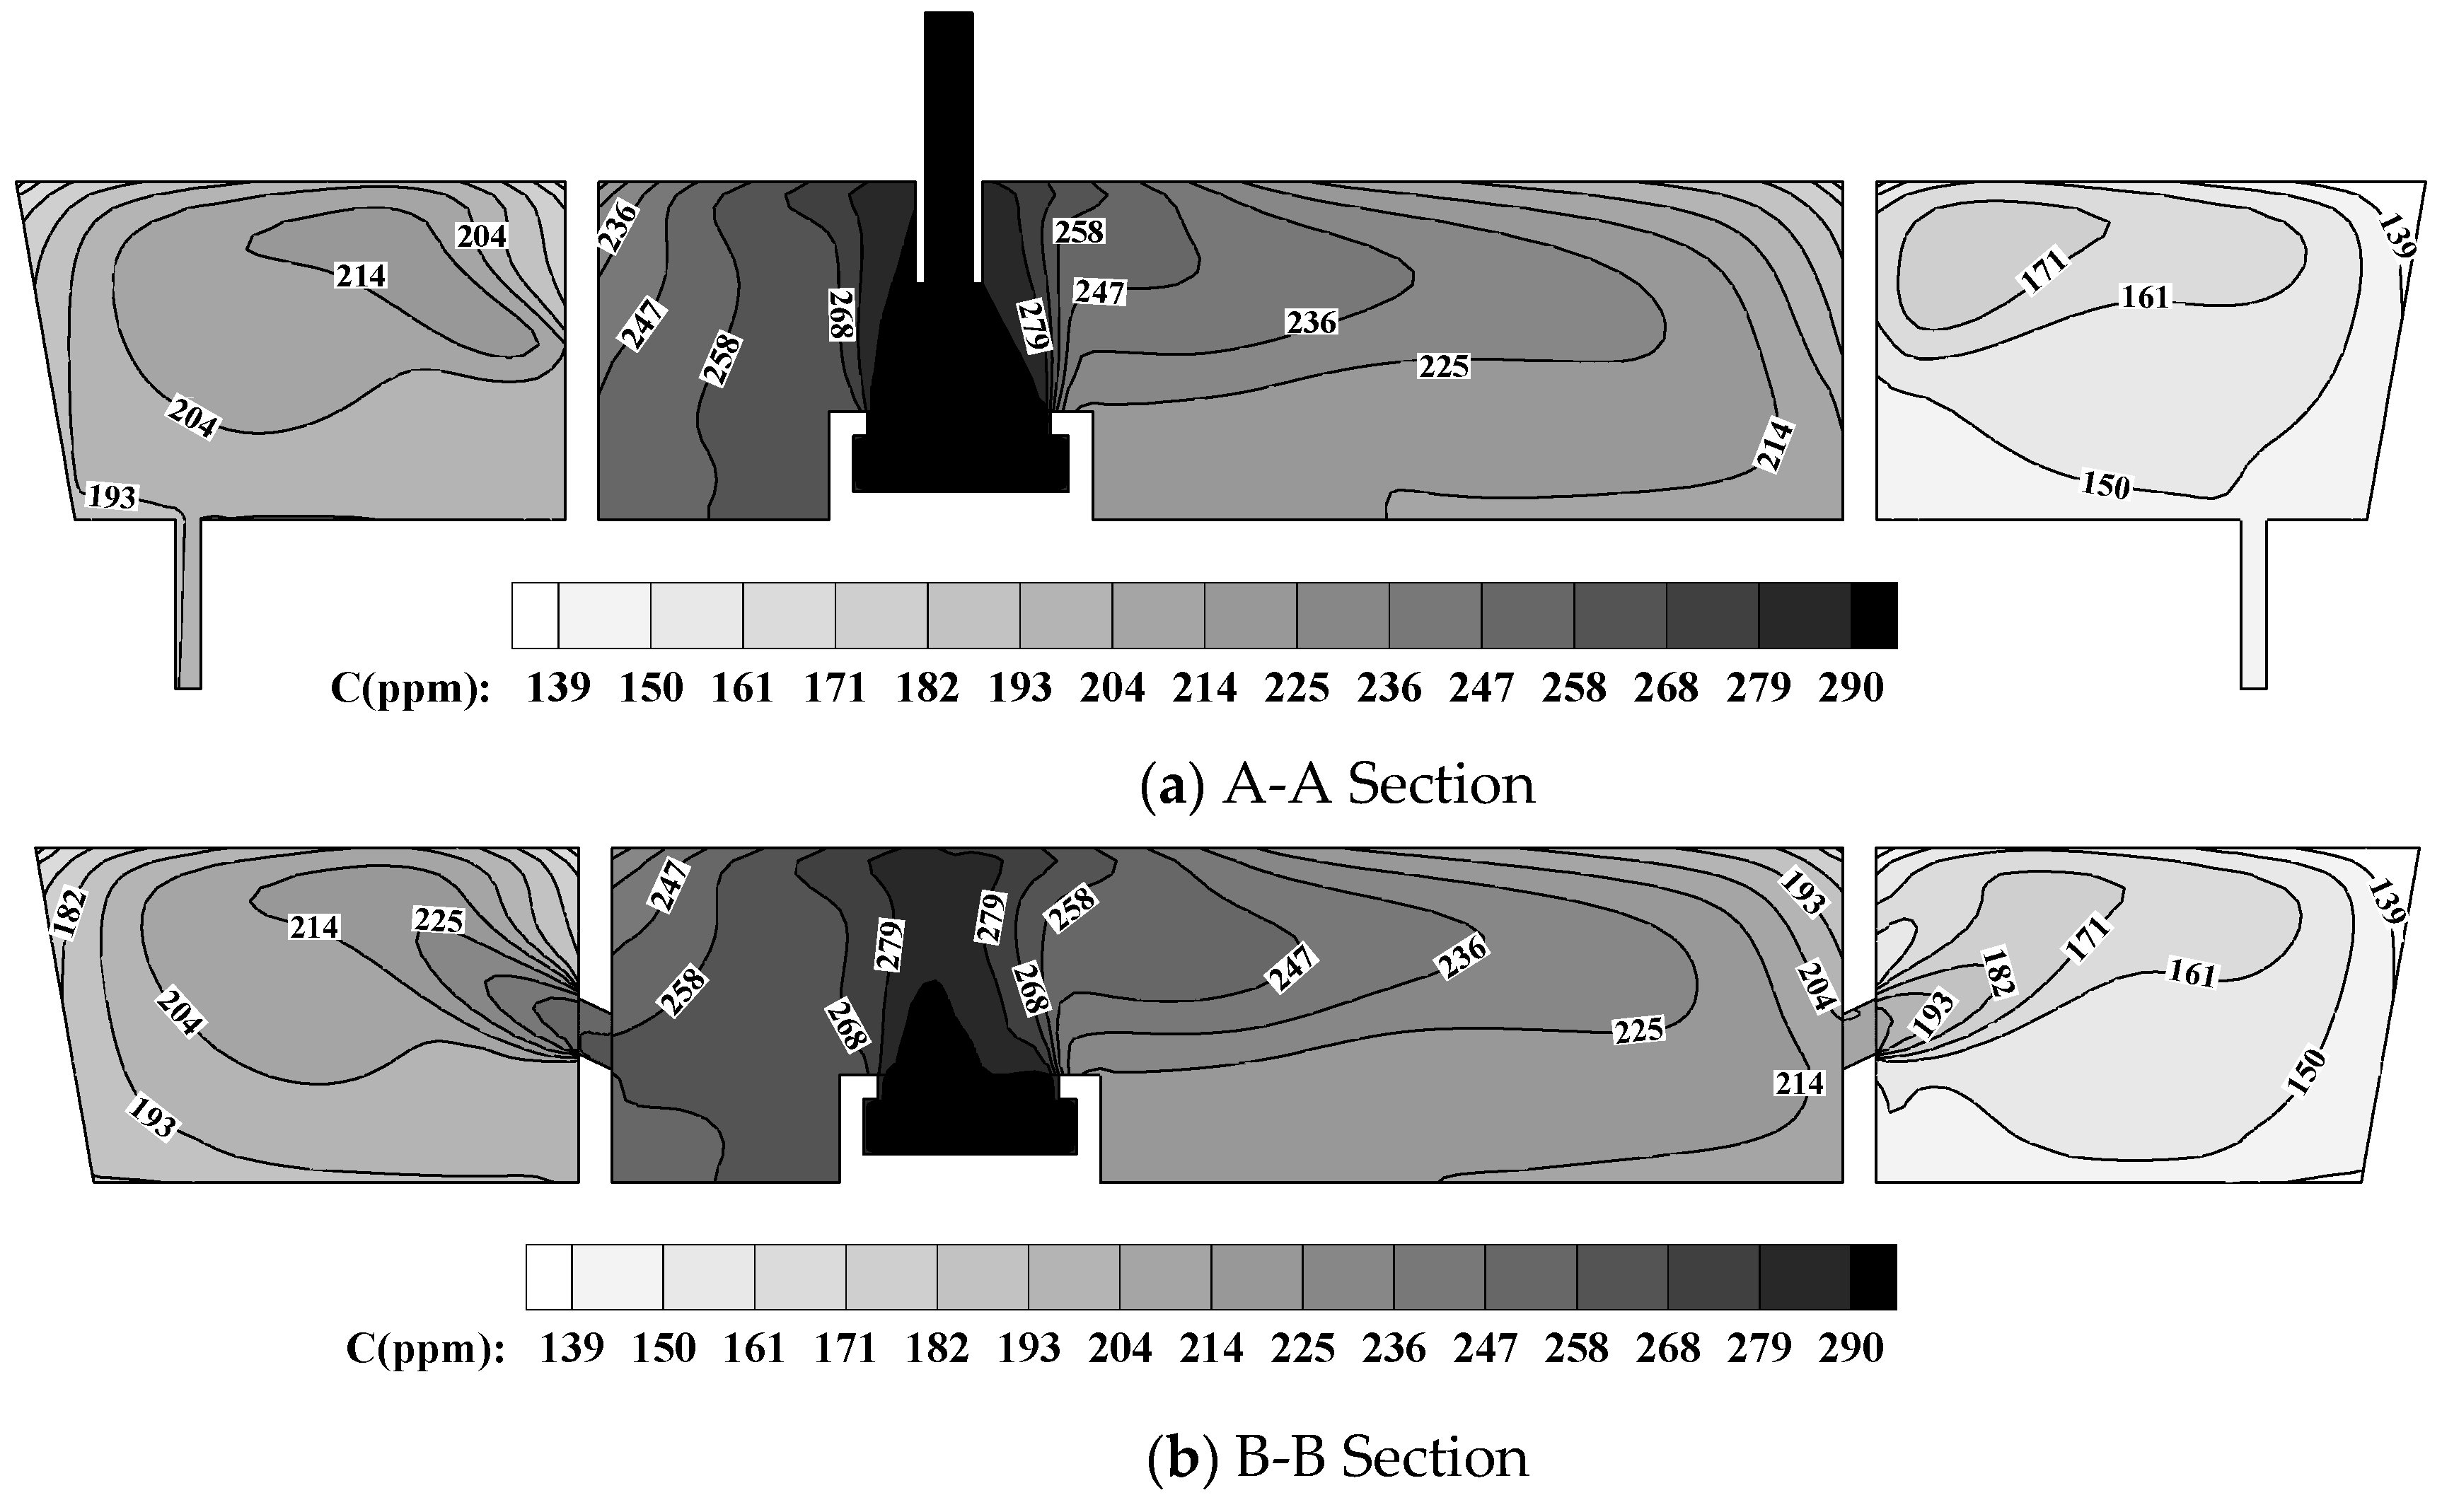
Metals 09 00855 g010aMetals 09 00855 g010b
Figure 11. Inclusion volume concentration distribution in the optimized tundish.
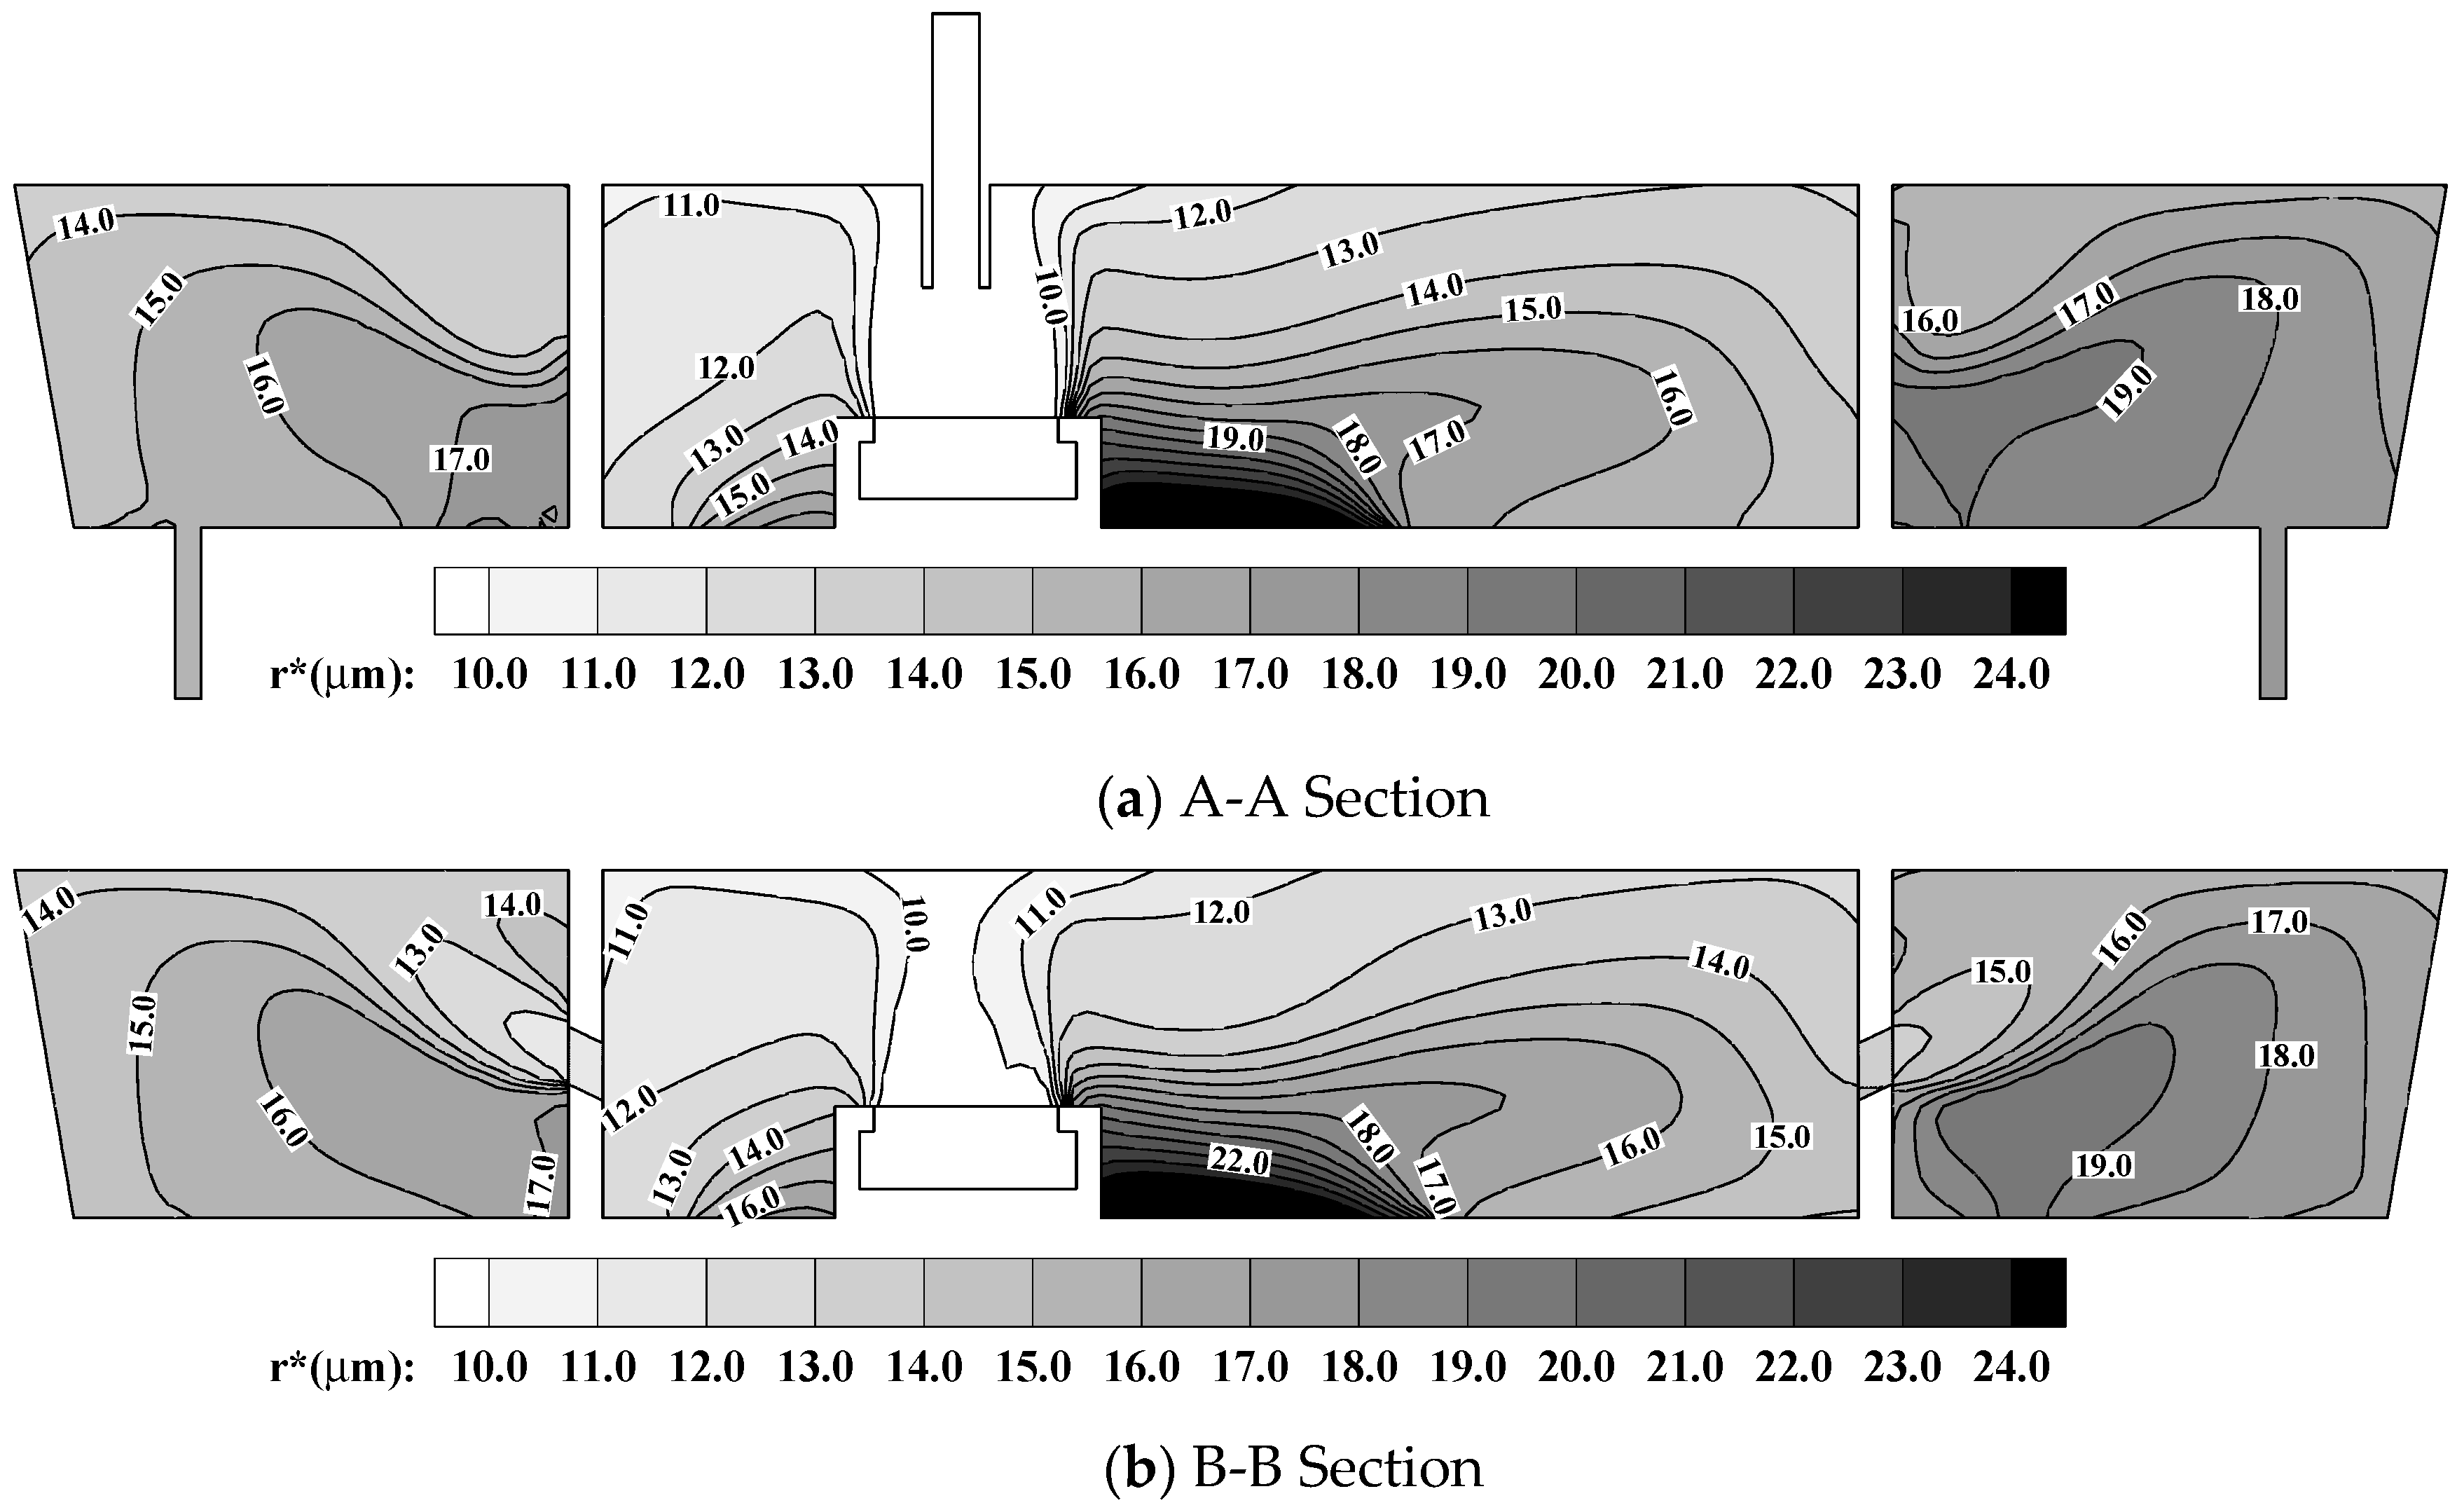
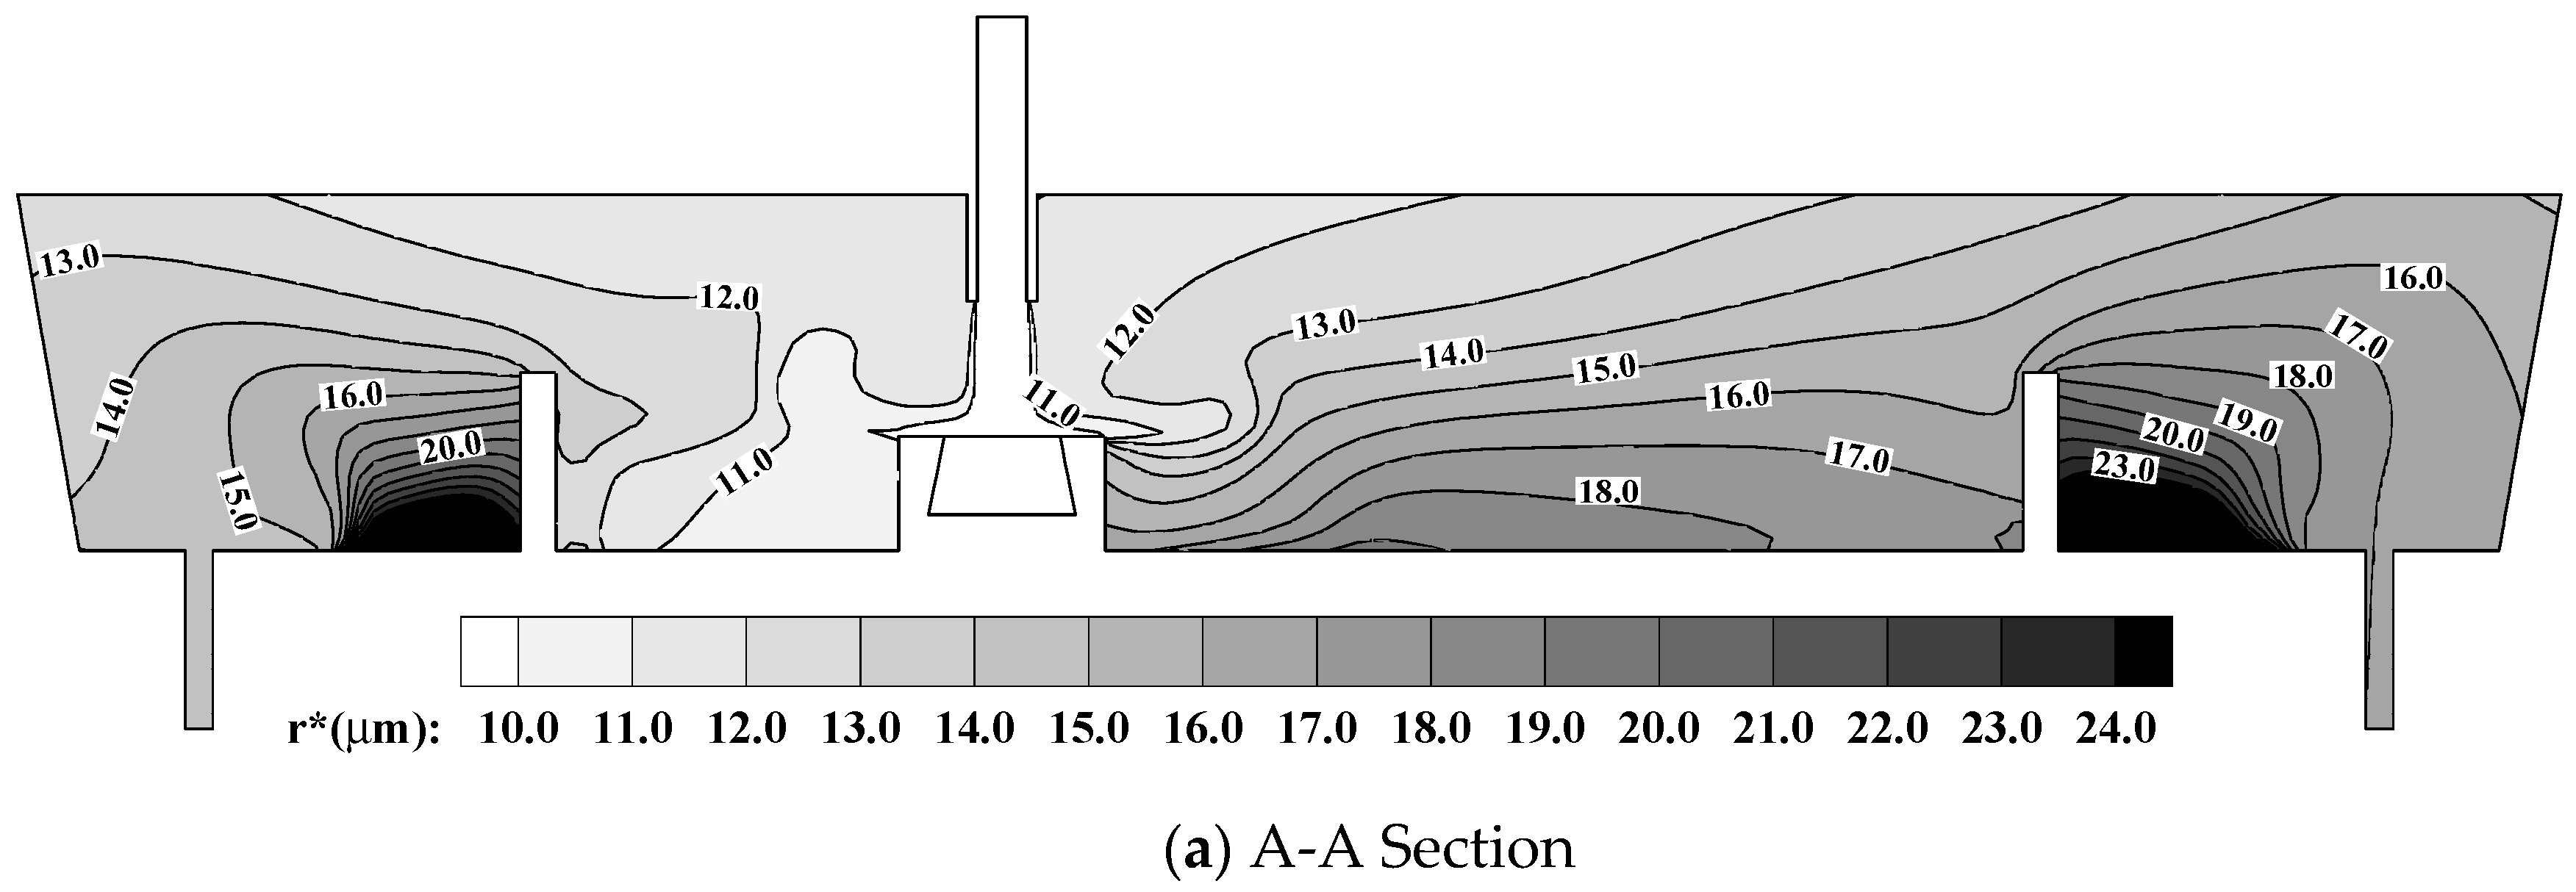
Metals 09 00855 g011
Figure 12. Characteristic inclusion radius in the original tundish.
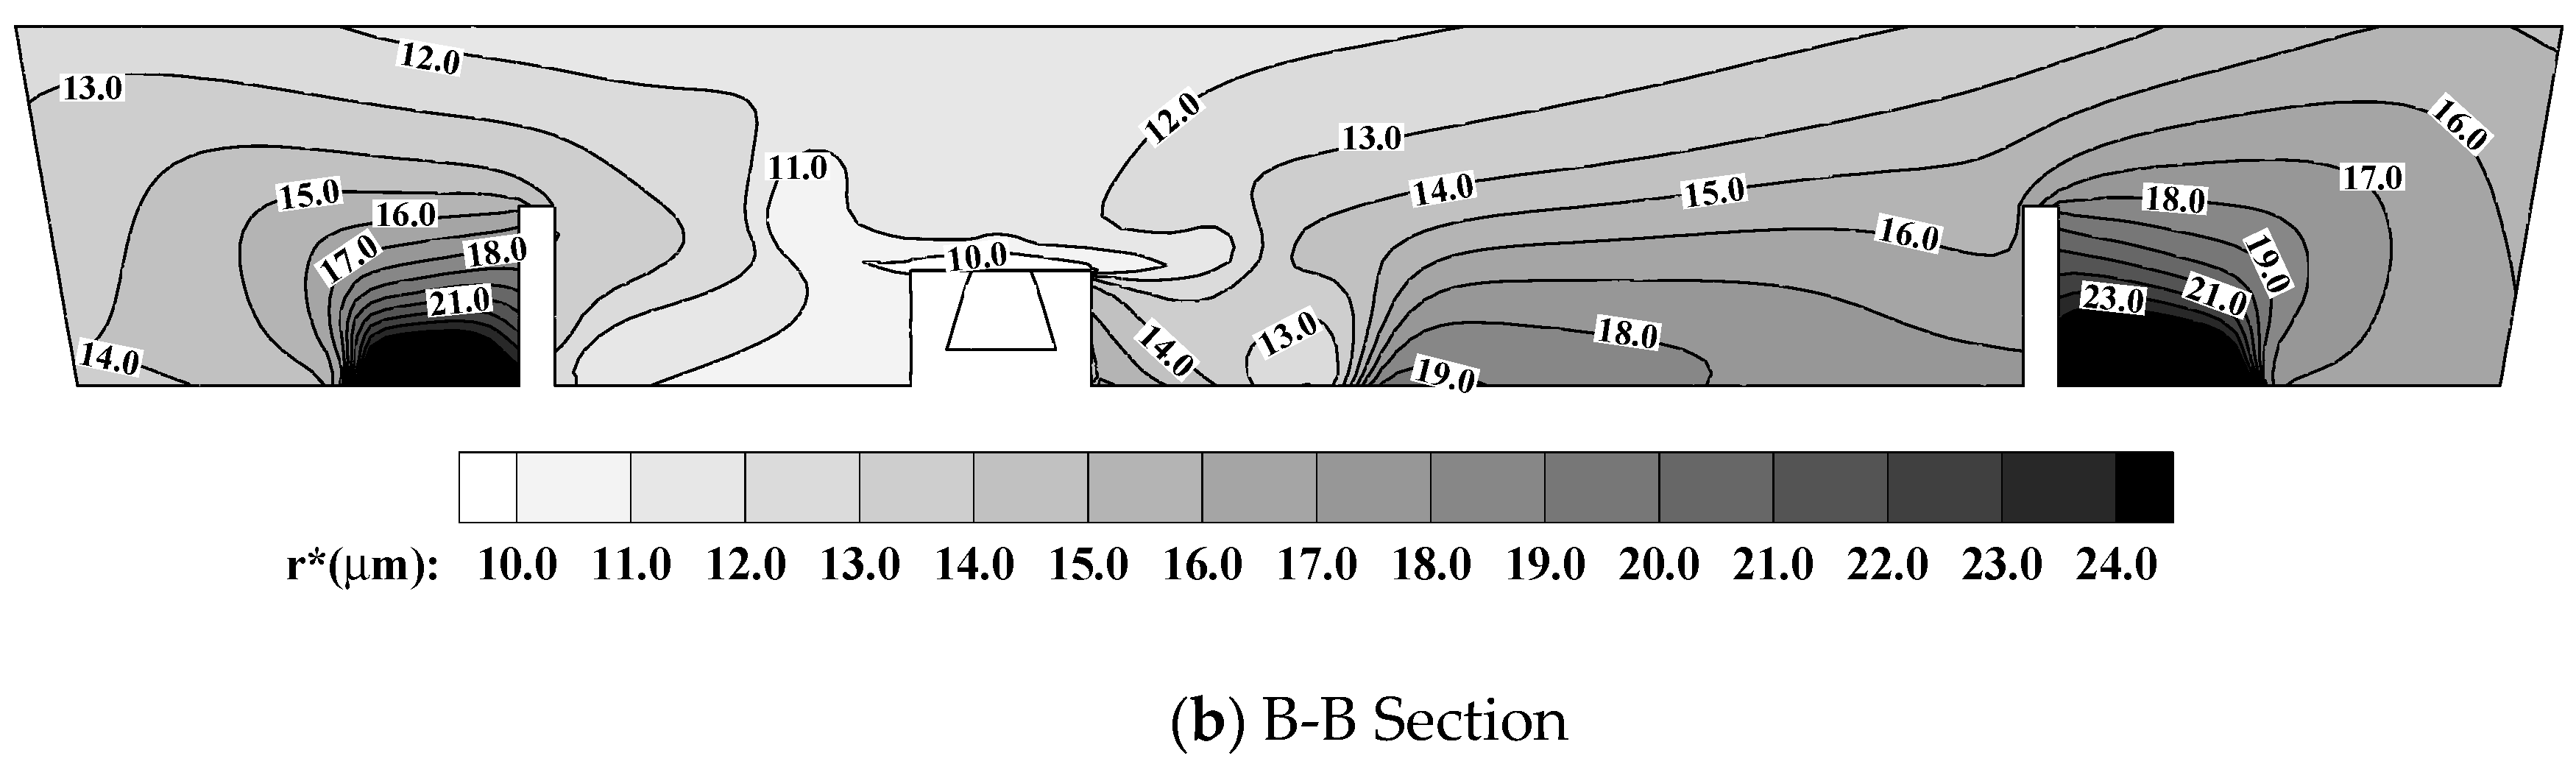
Metals 09 00855 g012aMetals 09 00855 g012b
Figure 13. Characteristic inclusion radius in the optimized tundish.
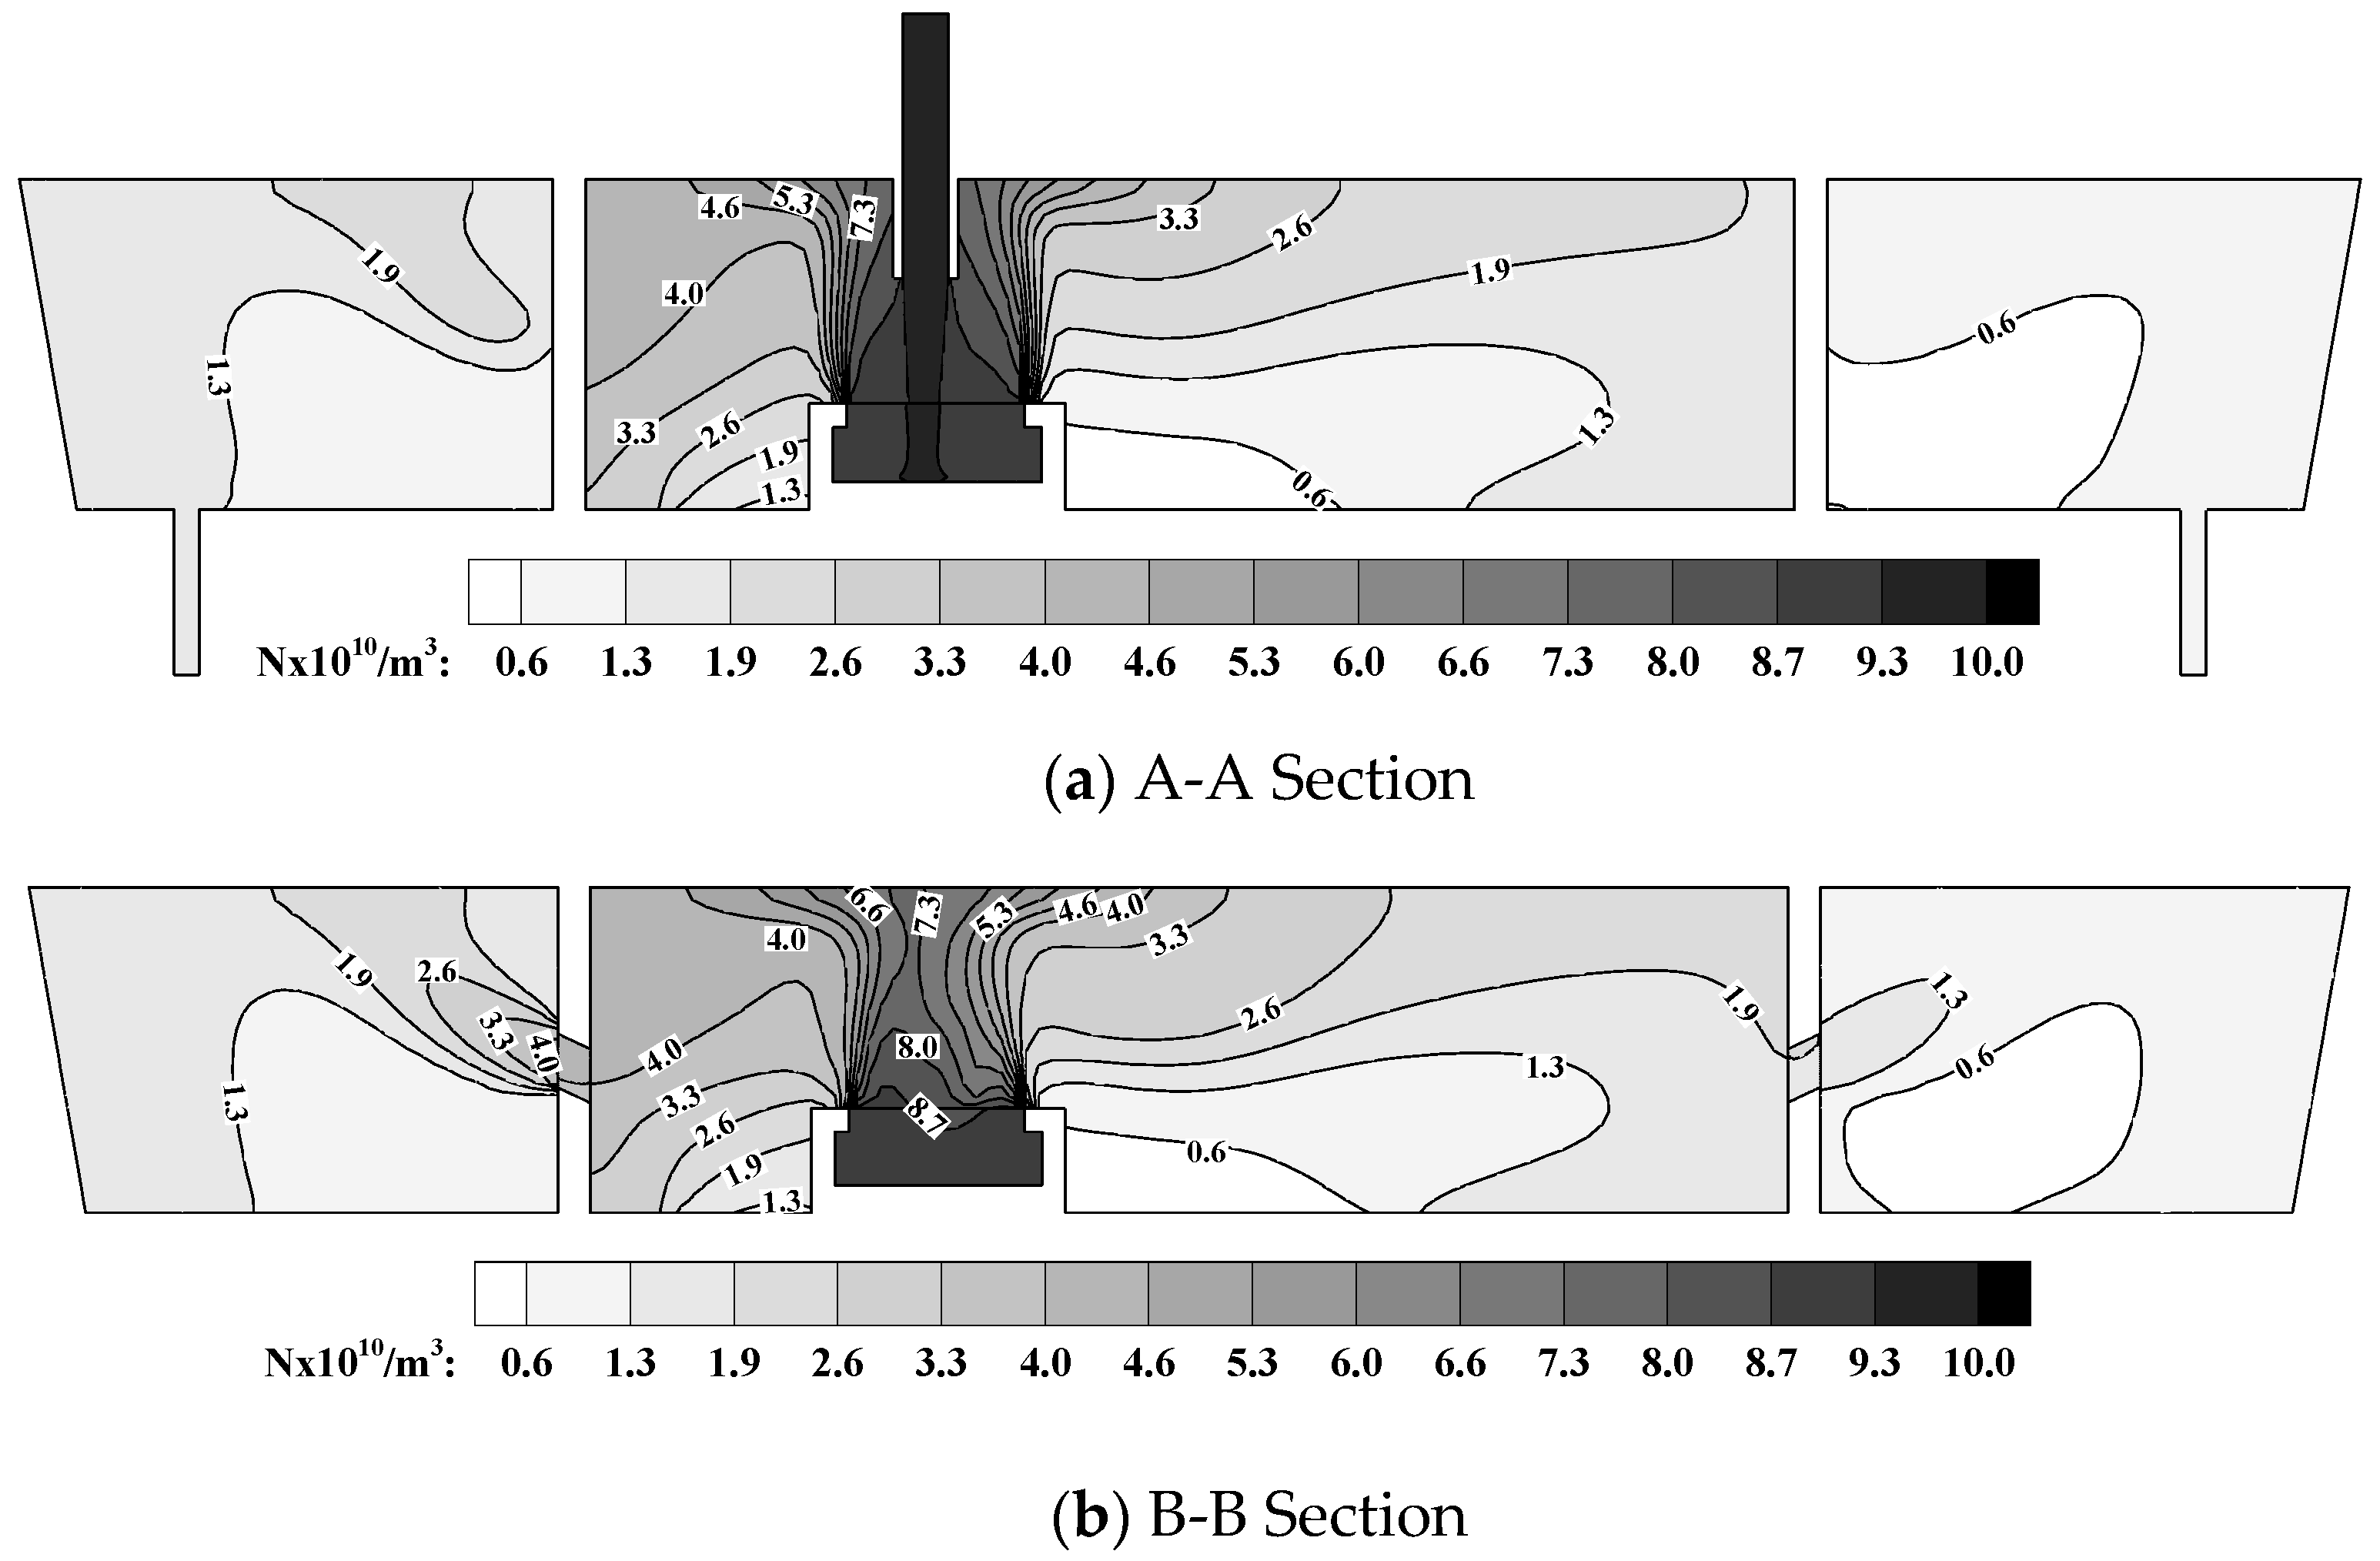
Metals 09 00855 g013
Figure 14. Characteristic inclusion number density in the original tundish.
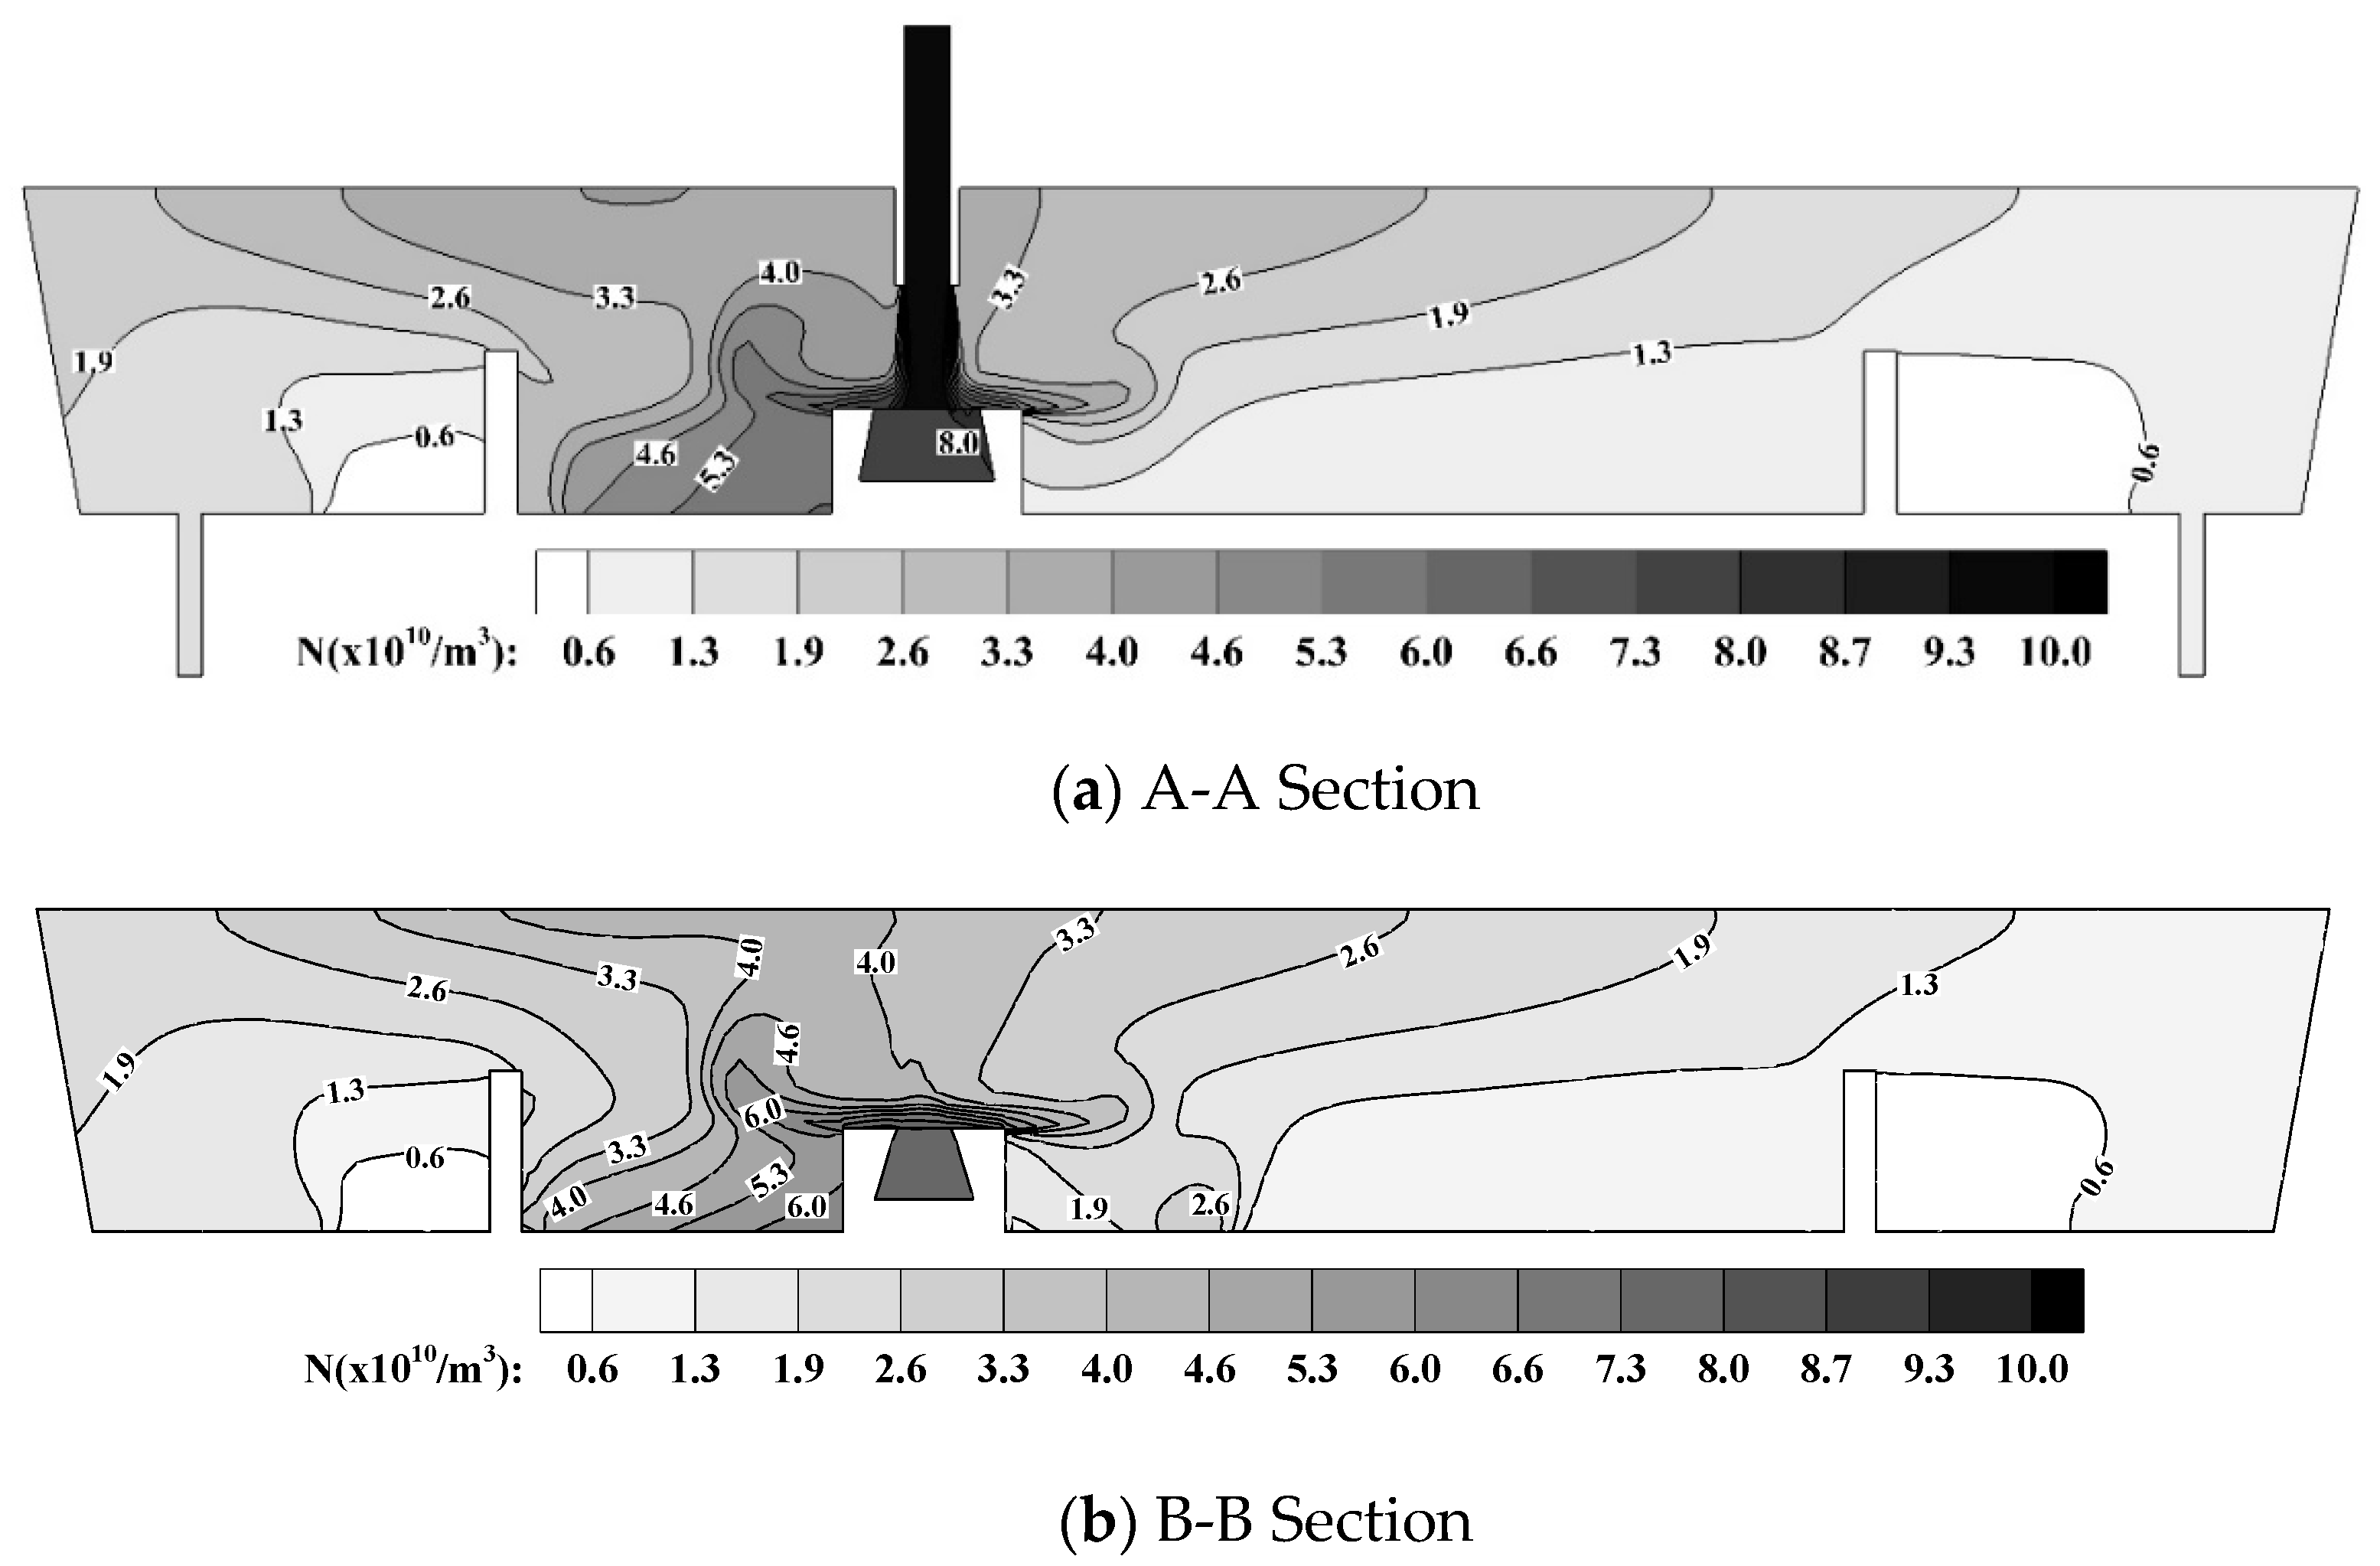
Metals 09 00855 g014
Figure 15. Characteristic inclusion number density in the optimized tundish.
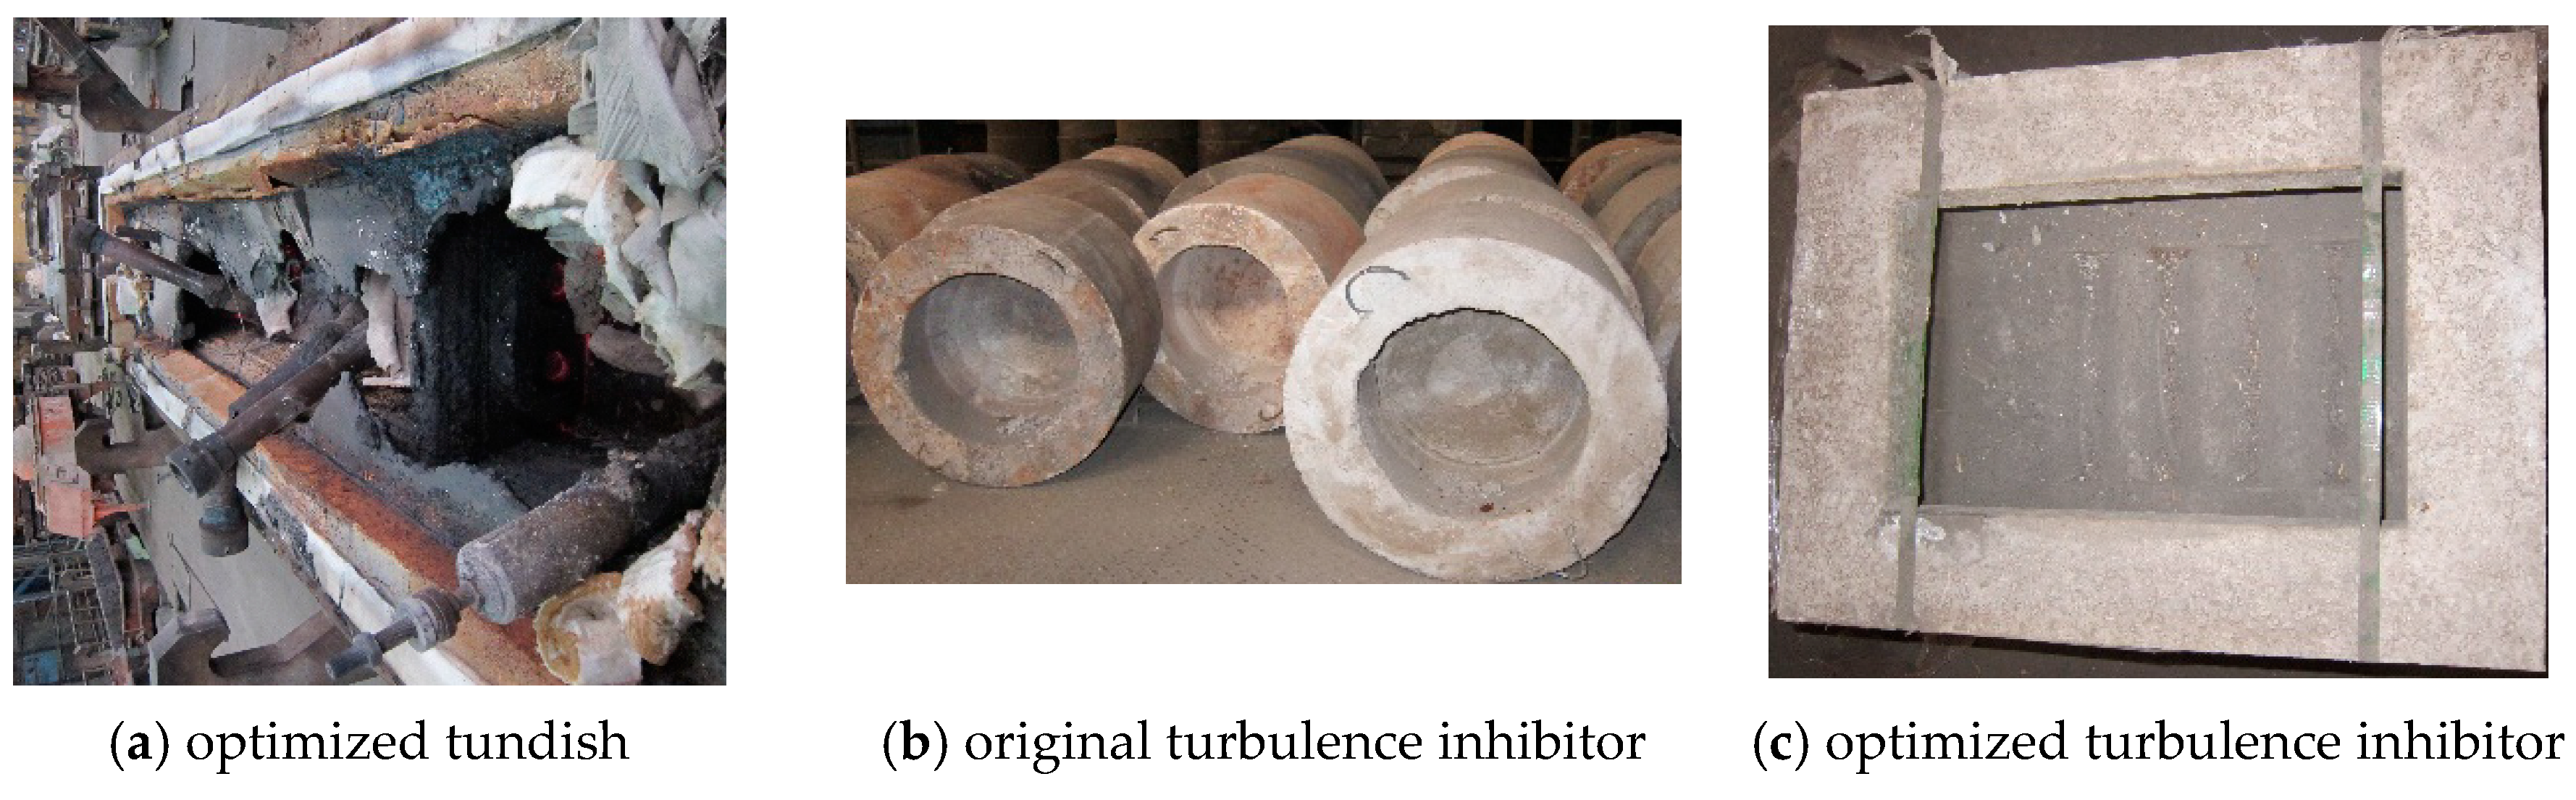
Metals 09 00855 g015
Figure 16. Industrial tundish.
Metals 09 00855 g016
Table 1. Parameters in the model tundish.
ParametersModel Tundish
Number of strand2
Length of upper longitudinal side (mm)7128
Length of lower longitudinal side (mm)6780
Length of lower width side (mm)1007
Length of upper width side (mm)590
Tundish depth (mm)1000
Volume flow of inlet (m3/s)0.012
Diameter of inlet (mm)140
Diameter of outlet (mm)80
Diameter of guided holes (mm)165
Distance between guided holes (mm)285
Table 2. Boundary conditions of inclusion [25,26].
ParameterCN
InletC0N0
Outlet C n = 0 N n = 0
Tundish wall and free surface F C c + F C d F N c + F N d
Table 3. Initial and boundary condition for tracer transport.
TimeInletWallOutletFree surface
t = 0 ϕ = ϕ 0 ϕ n = 0 ϕ n = 0 ϕ n = 0
t > 0 ϕ n = 0 ϕ n = 0 ϕ n = 0 ϕ n = 0
Table 4. Physical parameters and boundary conditions [28,29,30].
ParameterValue
Free surface heat loss (W/m2)75,000
Bottom heat loss (W/m2)8000
Wide wall heat loss (W/m2)4000
Narrow wall heat loss (W/m2)4000
Channel wall heat loss (W/m2)8000
Thermal conductivity of liquid steel (W/(m·K))41
Heat capacity of liquid steel (J/(kg·K))750
Inlet velocity (m/s)0.773
Inlet temperature (K)1873
Density of liquid steel (kg/m3)(8523 − 0.8358T)
Coefficient of thermal expansion of liquid steel (1/K)0.0001
Viscosity of the molten steel (kg/(m·s))0.0061
Table 5. Fluid flow characteristics in the original and optimized tundish.
TundishTime (s)ΔtminΔtmaxΔtavVolume Fraction (%)
tmintmaxtavtmin2tmin1 tmax2tmax1tav2tav1VdVmVp
Original outlet 154.0105.0315.658267203.829.253.017.8
Original outlet 2112.0372.0519.4−16.562.254.3
Optimized outlet 169.0194.0352.498167183.520.949.629.5
Optimized outlet 2167.0361.0535.9−20.261.059.2
Table 6. The measured temperature of molten steel at different outlets in the original tundish.
Temperature MeasurementTOutlet1 (°C)TOutlet2 (°C)TAverage−Outlet1 (°C)TAverage−Outlet2 (°C)ΔT = TAv−1TAv−2 (°C)
The first casting158315701568.715608.7
15901576
15621558
15601557
15611550
15621551
15631558
Table 7. The measured temperature of molten steel at different outlets in the optimized tundish.
Temperature MeasurementTOutlet1 (°C)TOutlet2 (°C)TAverage−Outlet1 (°C)TAverage−Outlet2 (°C)ΔT = TAv−1TAv−2 (°C)
The first casting15601552156015537
15621552
15571555
The second casting154915451548.51543.55
15471546
15491540
15491543
Table 8. Inclusion weight in steel by sample-electrolysing method.
The SampleOriginal Sample Weight (kg)Residual Sample Weight (kg)Electrolytic Sample Weight (kg)Inclusion (mg) 80–140 μmInclusion (mg) 140–300 μm
Outlet 1 in original tundish1.340.311.030.60.7
Outlet 2 in original tundish1.470.441.030.40.7
Outlet 1 in optimized tundish1.330.311.02-0.2

