Article

Environmentally Assisted Cracking Behavior of S420 and X80 Steels Containing U-notches at Two Different Cathodic Polarization Levels: An Approach from the Theory of Critical Distances

LADICIM (Laboratory of Materials Science and Engineering), University of Cantabria, E.T.S. de Ingenieros de Caminos, Canales y Puertos, Av/Los Castros 44, 39005 Santander, Spain
*
Author to whom correspondence should be addressed.
Metals 2019, 9(5), 570; https://doi.org/10.3390/met9050570
Submission received: 29 April 2019 / Revised: 9 May 2019 / Accepted: 14 May 2019 / Published: 16 May 2019
(This article belongs to the Special Issue Fracture, Fatigue and Structural Integrity of Metallic Materials)

Abstract

:
This paper analyzes, using the theory of critical distances, the environmentally assisted cracking behavior of two steels (S420 and API X80) subjected to two different aggressive environments. The propagation threshold for environmentally assisted cracking (i.e., the stress intensity factor above which crack propagation initiates) in cracked and notched specimens (KIEAC and KNIEAC) has been experimentally obtained under different environmental conditions. Cathodic polarization has been employed to generate the aggressive environments, at 1 and 5 mA/cm2, causing hydrogen embrittlement on the steels. The point method and the line method, both belonging to the theory of critical distances, have been applied to verify their capacity to predict the initiation of crack propagation. The results demonstrate the capacity of the theory of critical distances to predict the crack propagation onset under the different combinations of material and aggressive environments.

1. Introduction

It is expected that fossil energies, such as gas and petroleum, will remain the main source of energy for the next two decades. In addition, predictions estimate that energy demand will present an increase of 48% by 2040 [1]. This increasing energy demand has led not only to the development of other energy sources (e.g., nuclear power and renewables), but also to the extraction of fossil energies in more demanding locations. This requires new infrastructure, much of which is operating in increasingly poor conditions (e.g., aggressive environments containing hydrogen sulfides, chlorides and sulfur, among others, elevated temperatures and/or pressures, etc.). The failure of structural components that operate in aggressive environments is often related to environmentally assisted cracking (EAC) processes, such as stress corrosion cracking (SCC) and hydrogen embrittlement (HE) [2,3]. Both phenomena lead to brittle and unexpected failures caused by the degradation of the mechanical properties of the materials [4,5].
In this context, the management of EAC becomes one of the main challenges [6]. The behavior of materials under SCC or HE conditions is a subject of great importance, especially during the material selection process, due to the high cost of the components [7,8,9]. In addition, repairs and replacements of structural components containing defects involve elevated costs. In this sense, there are numerous situations where the defects jeopardizing the structural integrity of the corresponding component are not cracks, whose radius on the tip tends to zero. This is true in the case of, for example, corrosion defects, which generally have a finite radius (i.e., non-zero) on their tip. If these defects are considered to behave as cracks, the corresponding structural integrity assessments, based on fracture mechanics principles, may be overconservative [10,11,12,13]. Hence, it is necessary to develop structural integrity assessment methodologies that take into account the actual behavior of notches, which are here understood as those defects with a finite radius on their tip.
When dealing with the fracture behavior of notches, two different criteria can be distinguished: the global criterion, which is analogous to ordinary fracture mechanics (it compares the notch stress intensity factor with the corresponding notch fracture resistance), and the local criteria, which are based on the stress-strain field around the defect tip. Among the latter, the theory of critical distances (TCD) stands out. The accuracy of the TCD in the prediction of fracture (and fatigue) processes has been widely reported in the literature, especially through its most simple approaches: the point method (PM) and the line method (LM) (e.g., [14,15,16,17,18,19]).
Recently, the authors have proposed the use of the TCD to analyze EAC processes, providing accurate results [20] in one specific aggressive environment. The aim of this paper is to extend the validation of the use of the TCD in EAC assessments, analyzing the effect of two cathodic current densities on two different steels (S420 and X80) that are commonly used in offshore components, power plants and pipes. The experimental program is composed of 40 C(T) specimens (20 of which are presented for the first time in this paper), with notch radii varying from 0 mm (crack-like defects) up to 2 mm. The aggressive environments have been generated through cathodic charges (or cathodic polarization) at 1 mA/cm2 (new tests) and 5 mA/cm2 (tests previously presented in [20]), which are used to cause HE on the steels. The study has been completed with finite element simulations.

2. Theoretical Overview

2.1. The Theory of Critical Distaces

The Theory of Critical Distances (TCD) [14], first presented in the middle of the twentieth century [14,21,22], is a group of methodologies, all of which use a characteristic material length parameter when performing fracture and fatigue assessments. This parameter is called the critical distance, L.
In fracture analysis, the above-mentioned critical distance (L) follows:
L = 1 π ( K m a t σ 0 ) 2
where Kmat is the material fracture toughness and σ0 is a characteristic material strength parameter named the inherent strength, which is usually larger than the ultimate tensile strength and requires calibration. Some critical distance default values for structural steels can be found in the literature [23]. In fatigue analysis, L presents an analogous expression:
L = 1 π ( Δ K t h Δ σ 0 ) 2
The two simplest methodologies of the TCD are explained below.

2.1.1. The Point Method (PM)

The PM establishes that fracture occurs when the stress reaches the inherent strength, σ0, at a distance equal to L/2 from the defect tip. The definition of the PM methodology is shown in Figure 1.
In fracture analyses, the mathematical expressions is [14]:
σ ( L 2 ) = σ 0
whereas in fatigue analyses, the corresponding equation would be analogous [14]:
Δ σ ( L 2 ) = Δ σ 0
The TCD parameters (the critical distance, L, and the inherent strength, σ0) can be easily derived by performing two fracture (or fatigue) tests on two specimens presenting different notch radii. At fracture (or fatigue), the stress-distance curves cross each other at one point with coordinates (L/2, σ0) ((L/2, Δσ0) in fatigue analysis).
When combined with the stress distribution on the notch tip provided by Creager and Paris [24] (Equation (5)), the PM generates predictions of the apparent fracture toughness (KNmat) exhibited by materials containing U-shaped notches:
K m a t N = K m a t ( 1 + ρ L ) 3 / 2 ( 1 + 2 ρ L )

2.1.2. The Line Method (LM)

The LM assumes that fracture takes place when the average stress along a distance equal to 2L (from the notch tip) reaches the inherent strength, σ0 [14]:
1 2 L 0 2 L σ ( r ) d r = σ 0
Analogously, in fatigue analysis, the LM criterion is defined by the following equation [14]:
1 2 L 0 2 L Δ σ ( r ) d r = Δ σ 0
In combination with the Creager-Paris stress distribution, the LM also provides an estimation of the material apparent fracture toughness in the presence of U-shaped notches [14]:
K m a t N = K m a t 1 + ρ 4 L

2.2. Environmentally Assisted Cracking and Hydrogen Embrittlement

Environmentally assisted cracking groups together a wide range of cracking phenomena that take place under aggressive environments. Failure occurs as a consequence of a synergetic action of material, environment and stresses [2]. These phenomena may lead to subcritical crack growth processes and final fracture due to the degradation of the mechanical properties of the materials [5,25].
Hydrogen can cause embrittlement in metals by the action of atoms penetrating the material microstructure and diffusing to the most stressed zones. In order for HE failure to occur, a susceptible material, an exposure to a hydrogen-containing environment and high enough stresses are required. HE can be caused by cathodic polarization, which is a technique employed to prevent corrosion processes by reducing the corrosion rate when a potential (or current density) below the open circuit potential is applied (by means of a cathodic polarization) between the anode and the cathode, usually provided by an external source [8]. However, this method increases the H2 production, and, if the polarization is excessive, a direct reduction of H2O is possible, as shown below:
2 H 2 O + 2 e H 2 + 2 O H
Before the H2 molecule formation, H atoms are present on the metal surface during a significant time, which is increased by the presence of poisons of the hydrogen recombination reaction (e.g., H2S and As). Hydrogen atoms can penetrate into interstitial sites, facilitated by their small size, and cause embrittlement [26,27].

3. Materials and Methods
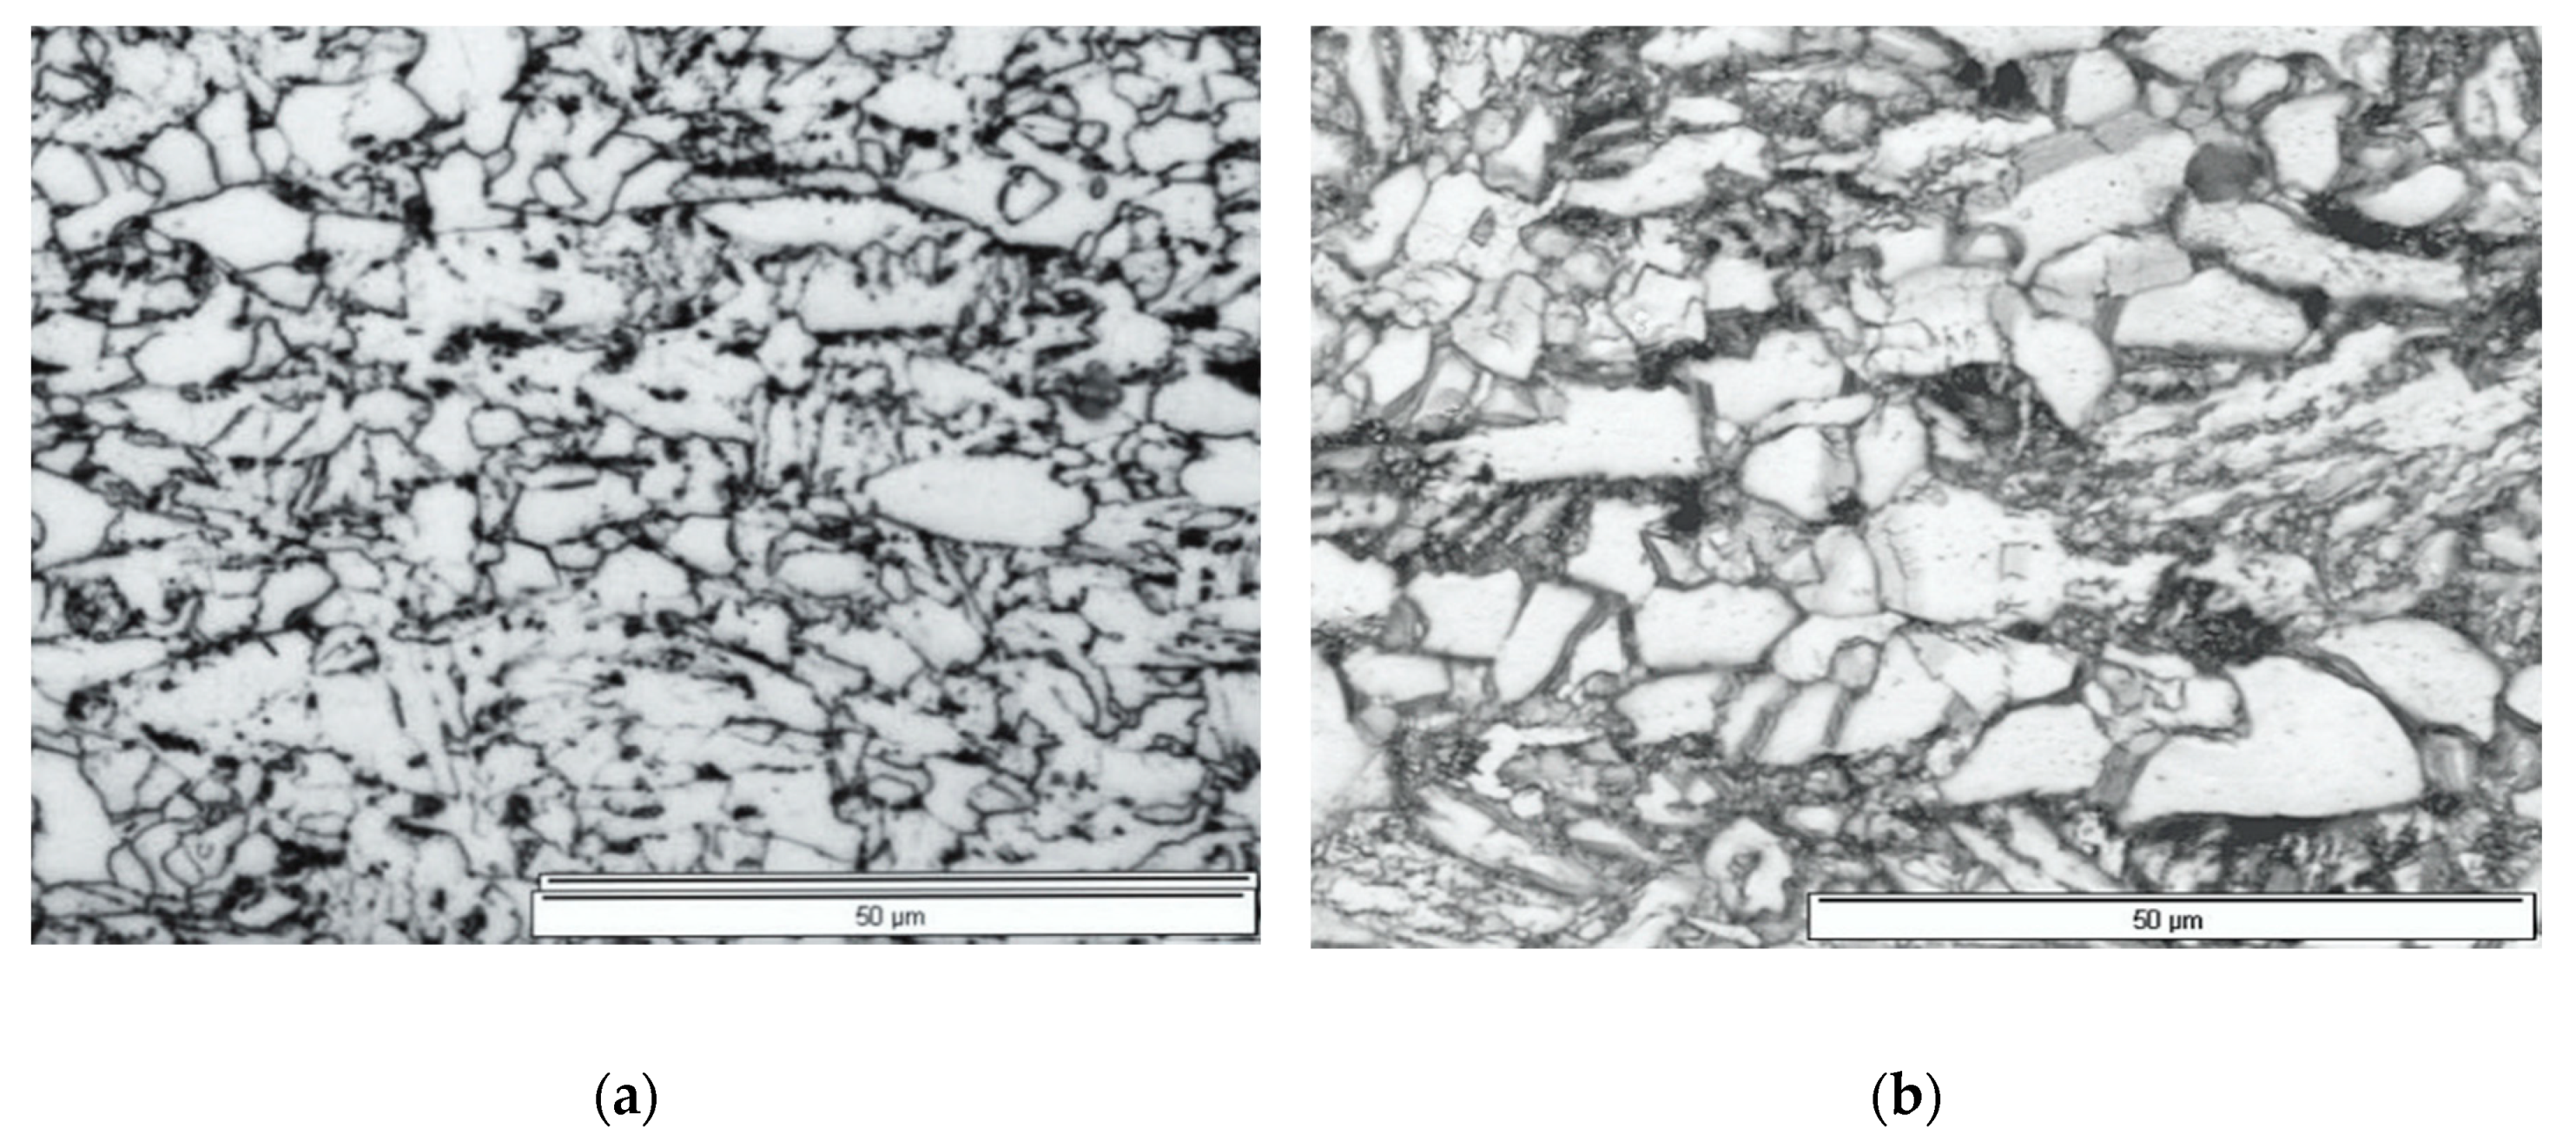
3.1. Materials

This study analyzes, through the application of the PM and the LM, the effect of the environment on the EAC behavior of two steels: a weldable thermo-mechanically treated S420 medium-strength steel [28], and API X80 medium-strength steel obtained by means of control rolling and accelerate cooling [29]. The mechanical properties of these steels, as received, are shown in Table 1:
The S420 steel is mainly used in offshore structures, pressure vessels and power plants. It presents a ferritic-pearlitic microstructure with a grain size ranging between 5–25 μm. The X80 steel, which is employed in oil and gas transportation at low temperatures, presents a ferritic-pearlitic microstructure with a grain size ranging between 5–15 μm. It is interesting to notice the presence of a small volumetric fraction of bainite/degenerated pearlite and the absence of acicular ferrite in X80 steel. The chemical composition and the microstructure of these steels are gathered in Table 2 and Figure 2, respectively.

3.2. Simulation of Hydrogen Embrittlement

Cathodic polarization (or cathodic charge) has been used in this work to cause embrittlement on the steels through fixed current intensities between the steel and the anode (in this case platinum) [26]. Both metals are connected through an aqueous solution, which is prepared following Pressouyre’s method [30] and consists of an 1 N H2SO4 solution in distilled water with 10 mg of an As2O3 solution and 10 drops of CS2 per liter of dissolution. The pH of the aqueous environment is kept in the range 0.65–0.80 at room temperature [31,32].
In this study, two levels of current intensity (5 mA/cm2 and 1 mA/cm2) have been considered. The former was previously applied in [20], whereas the latter has been specifically applied for this study. Cathodic polarization at these levels is used to cause two levels of hydrogen embrittlement on the steels. These testing conditions have been used, in combination with slow strain rate conditions and notched geometries, to generate hydrogen embrittlement. The application of cathodic polarization in actual structures, and their corresponding structural materials, is generally far from these circumstances, so that HE is avoided.
Figure 3 shows a schematic of the cathodic charge used in this work. The solution is stirred to avoid hydrogen bubbles on the specimen surface and prevent localized corrosion. As shown in Figure 4, the C(T) specimen is used as the working electrode, the platinum grid is used as the counter electrode and the saturated calomel electrode becomes the reference electrode.

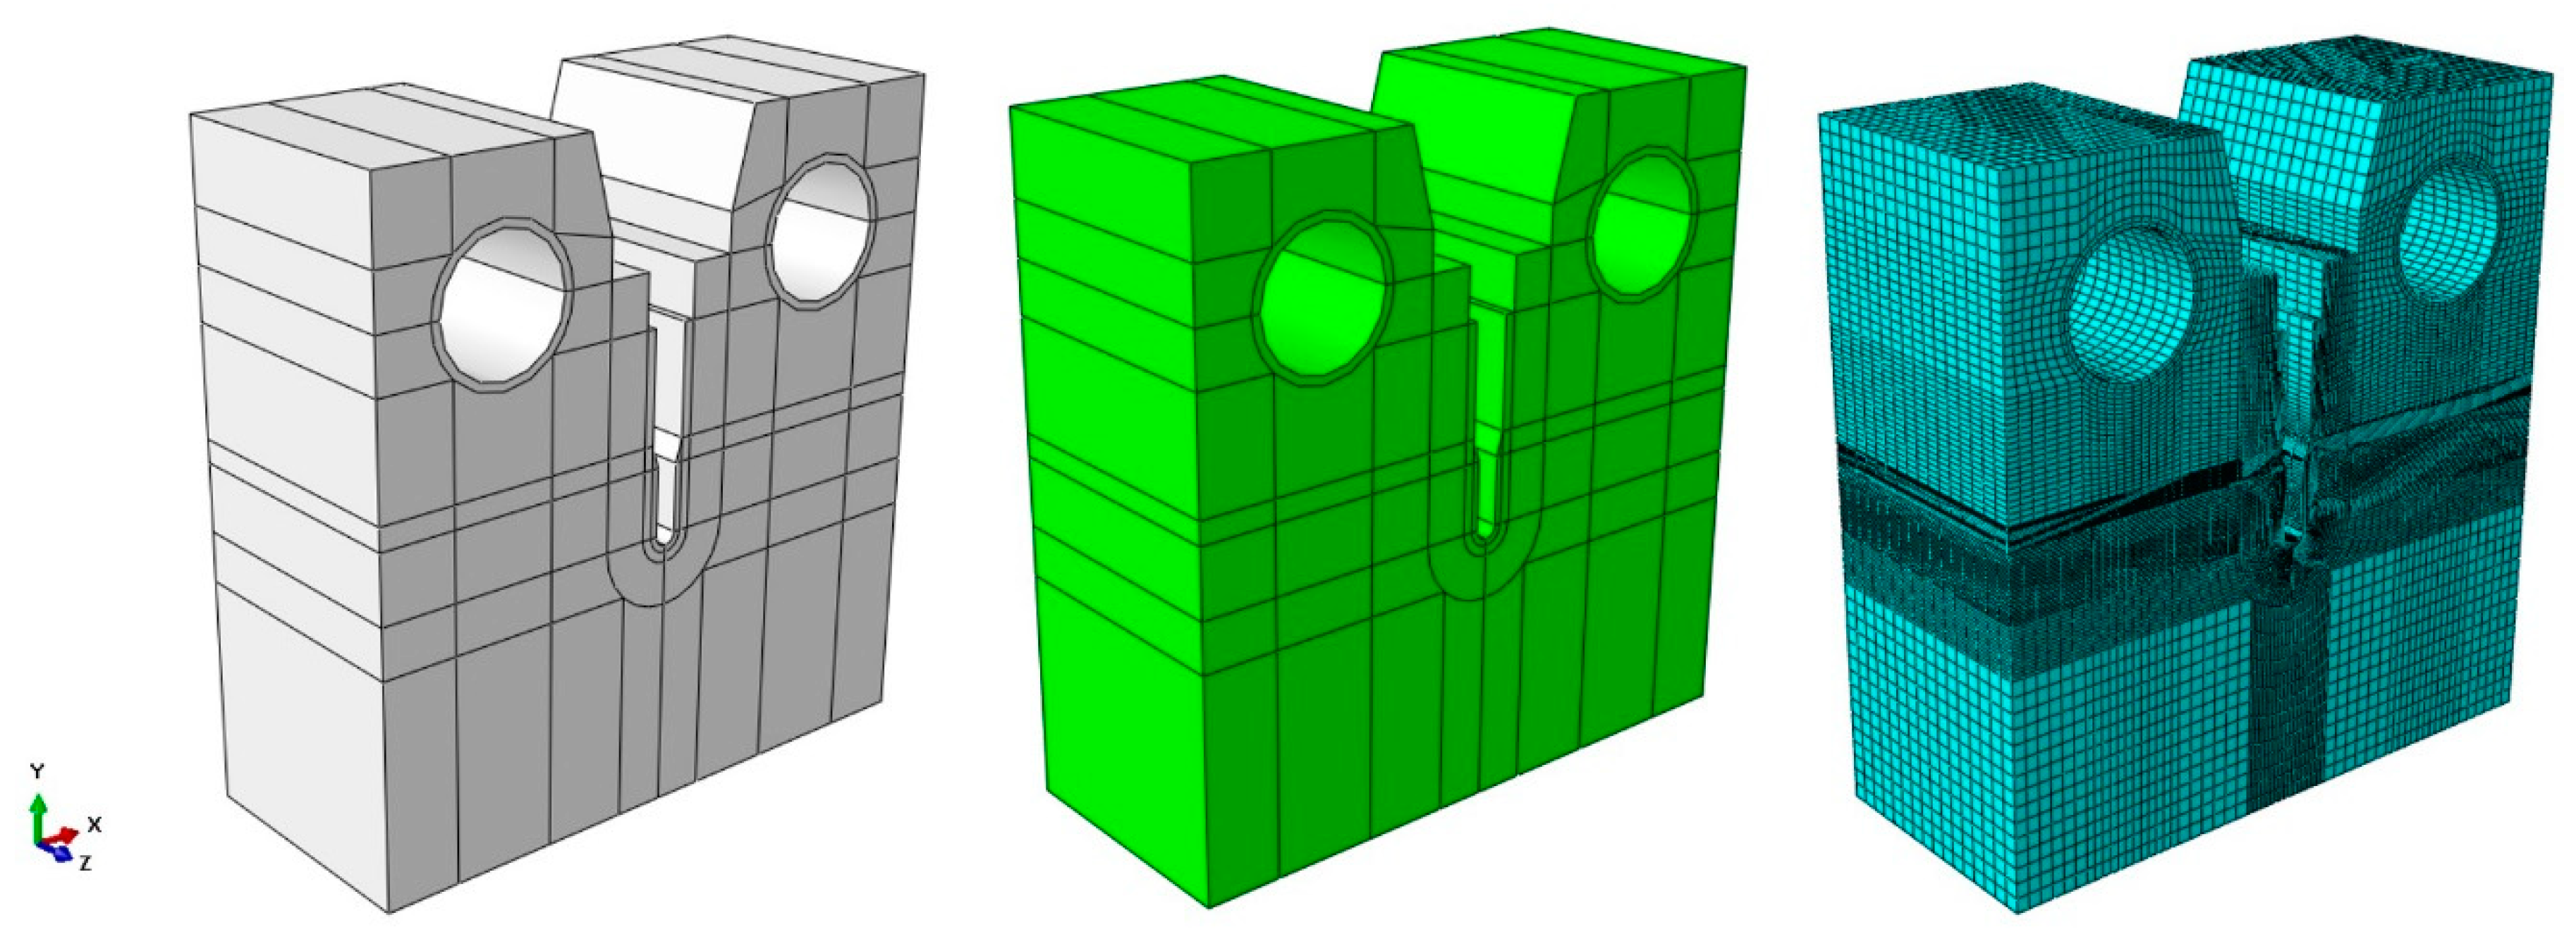
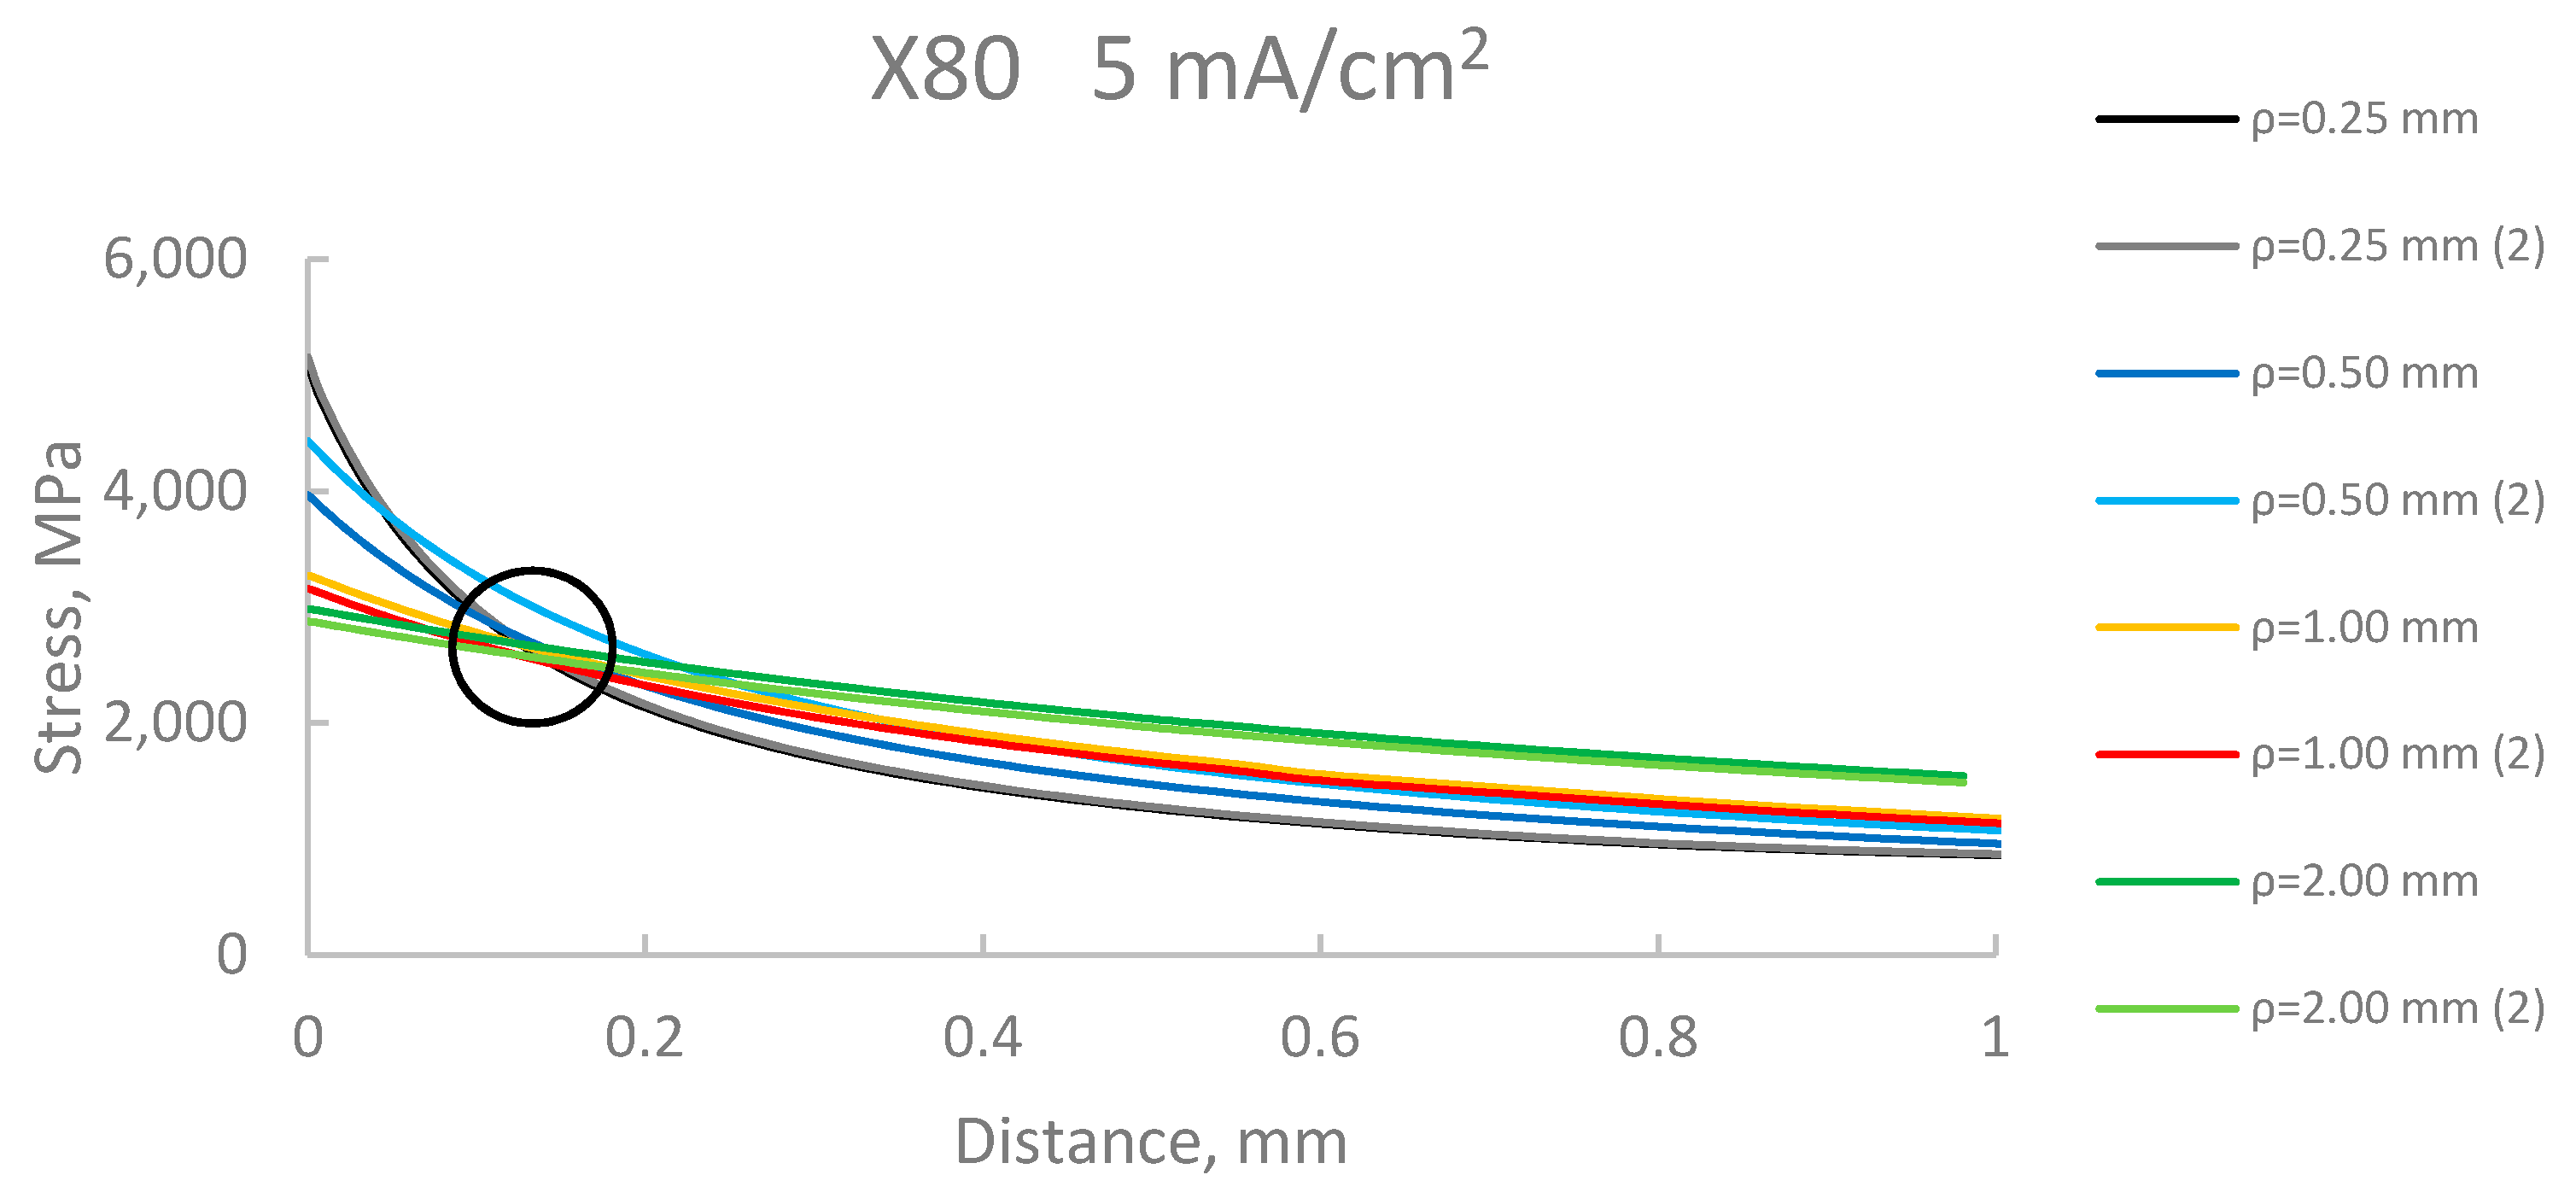
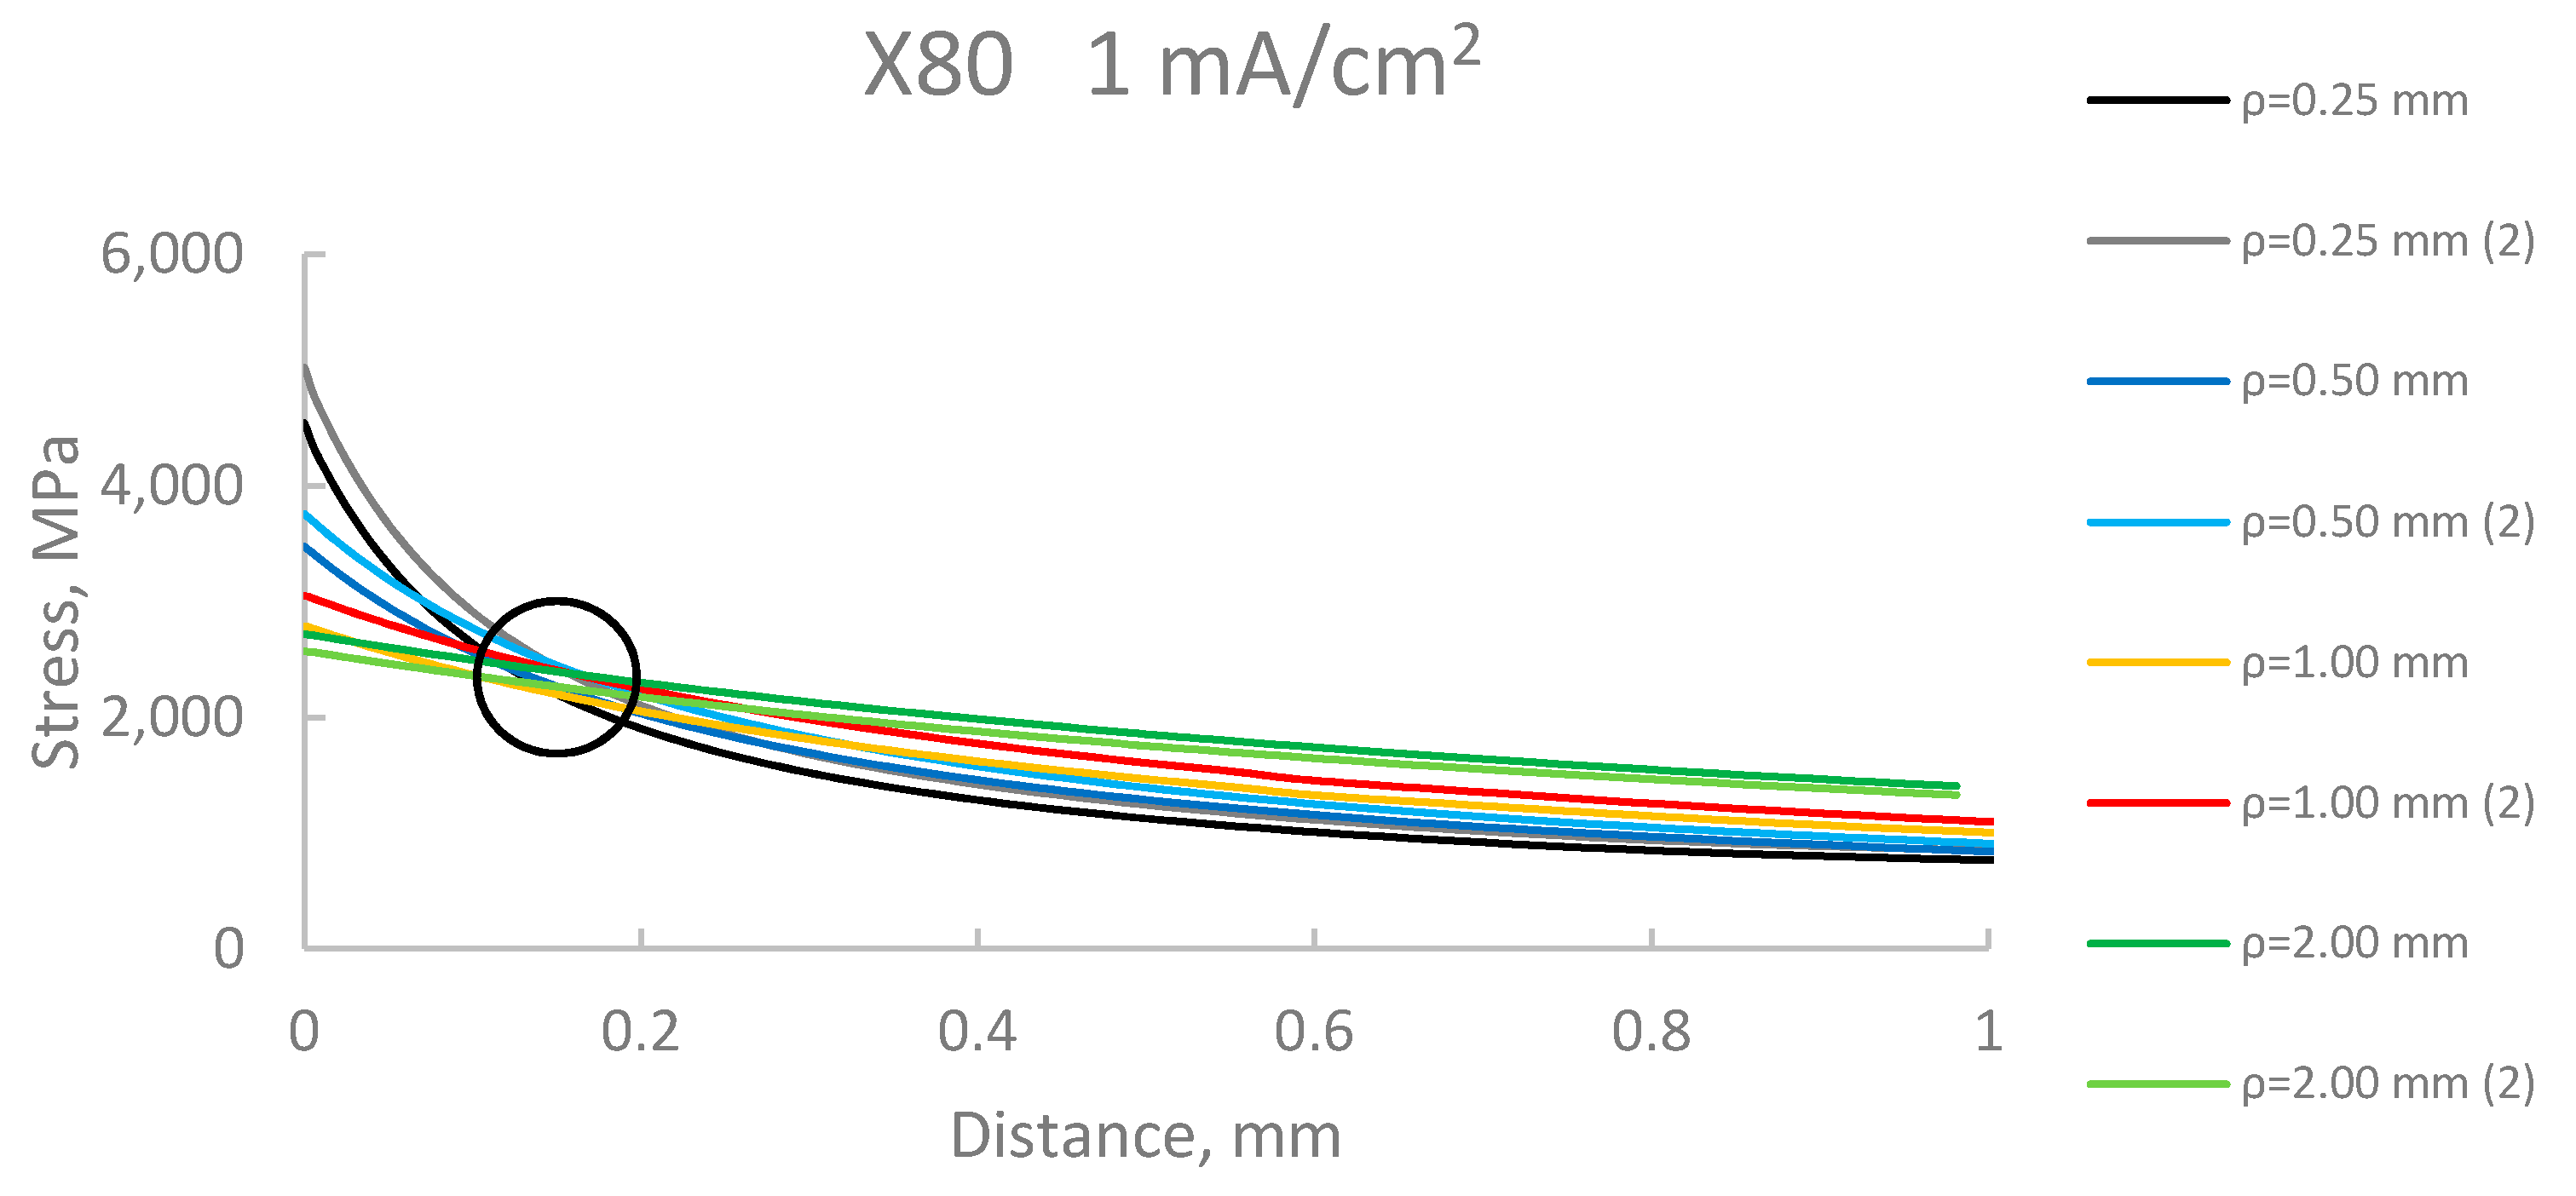
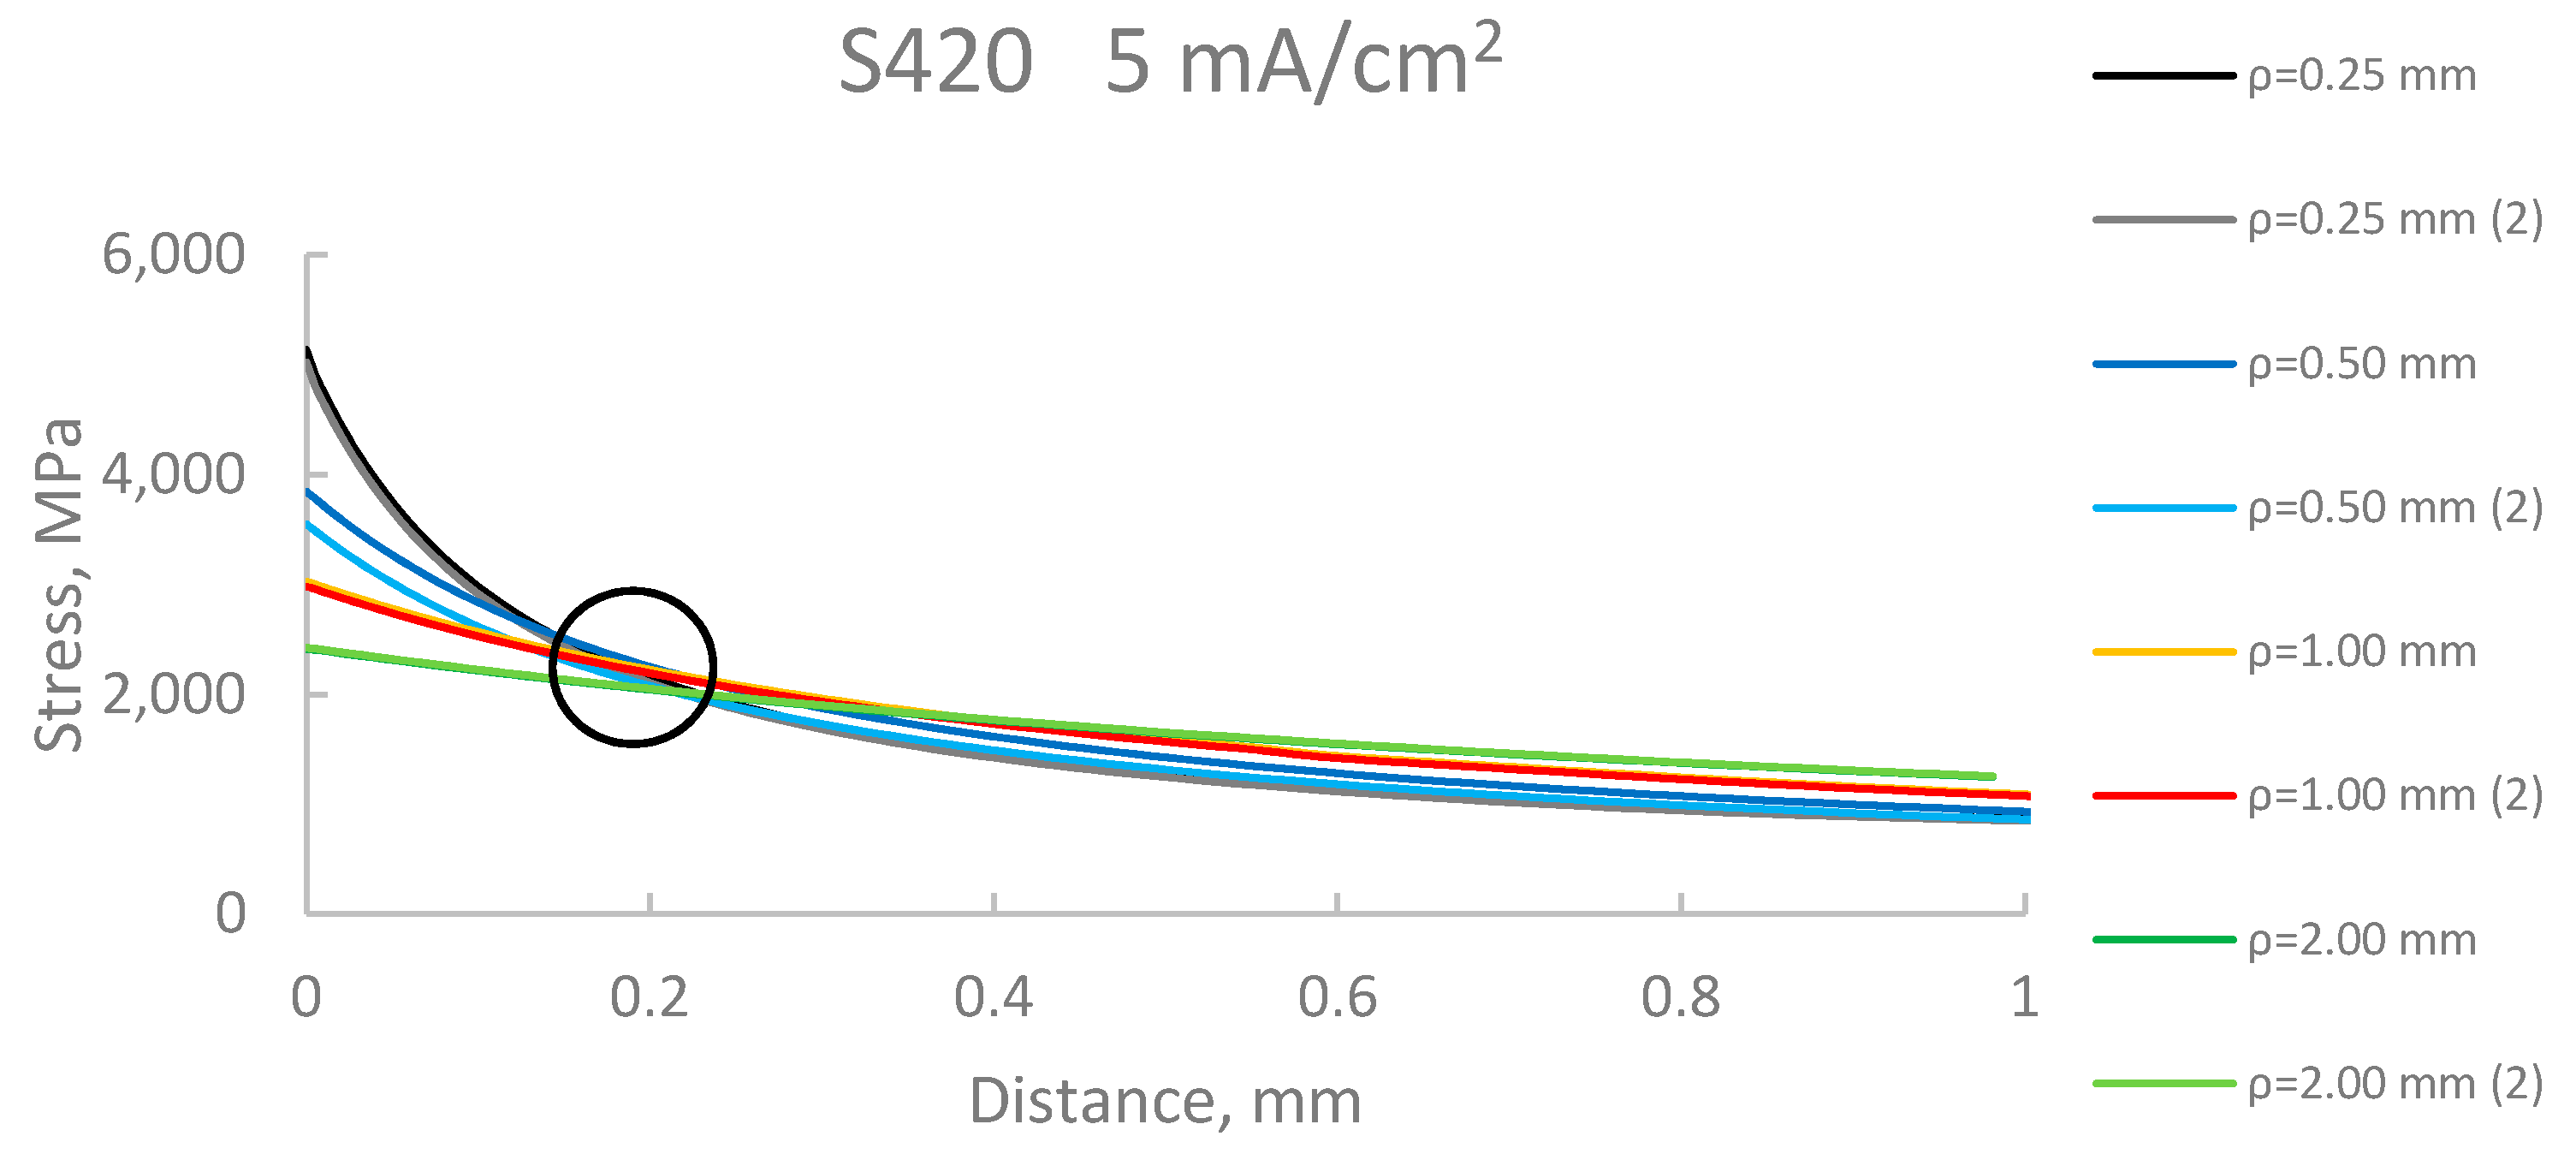
3.3. Analysis of Environmental Assisted Cracking: An Approach from the Theory of Critical Distances

The TCD has been reformulated to address EAC processes [20]. In order to obtain the critical distance in EAC conditions, LEAC, the equation proposed is [20]:
L E A C = 1 π ( K I E A C σ 0 E A C ) 2
where LEAC is the EAC critical distance, KIEAC is the EAC crack propagation threshold (obtained from cracked specimens) and σ0EAC is the inherent strength under EAC conditions, which has to be calibrated.
Analogously to fracture processes, and assuming Equation (10) for the EAC critical distance, predictions of the apparent crack propagation threshold for EAC (KNIEAC), above which EAC initiates and grows from U-shaped notches, can be derived. The combination of Creager-Paris stress distribution [24] with the PM and the LM leads to Equations (11) and (12), respectively:
K I E A C N = K I E A C ( 1 + ρ L E A C ) 3 / 2 ( 1 + 2 ρ L E A C )
K I E A C N = K I E A C 1 + ρ 4 L E A C
These equations allow the apparent EAC crack propagation threshold, KNIEAC, to be calculated from the notch radius, ρ, the material EAC critical distance, LEAC, and the material EAC crack propagation threshold, KIEAC (calculated in cracked conditions following the methodology proposed in the standard ISO 7539 [33]).

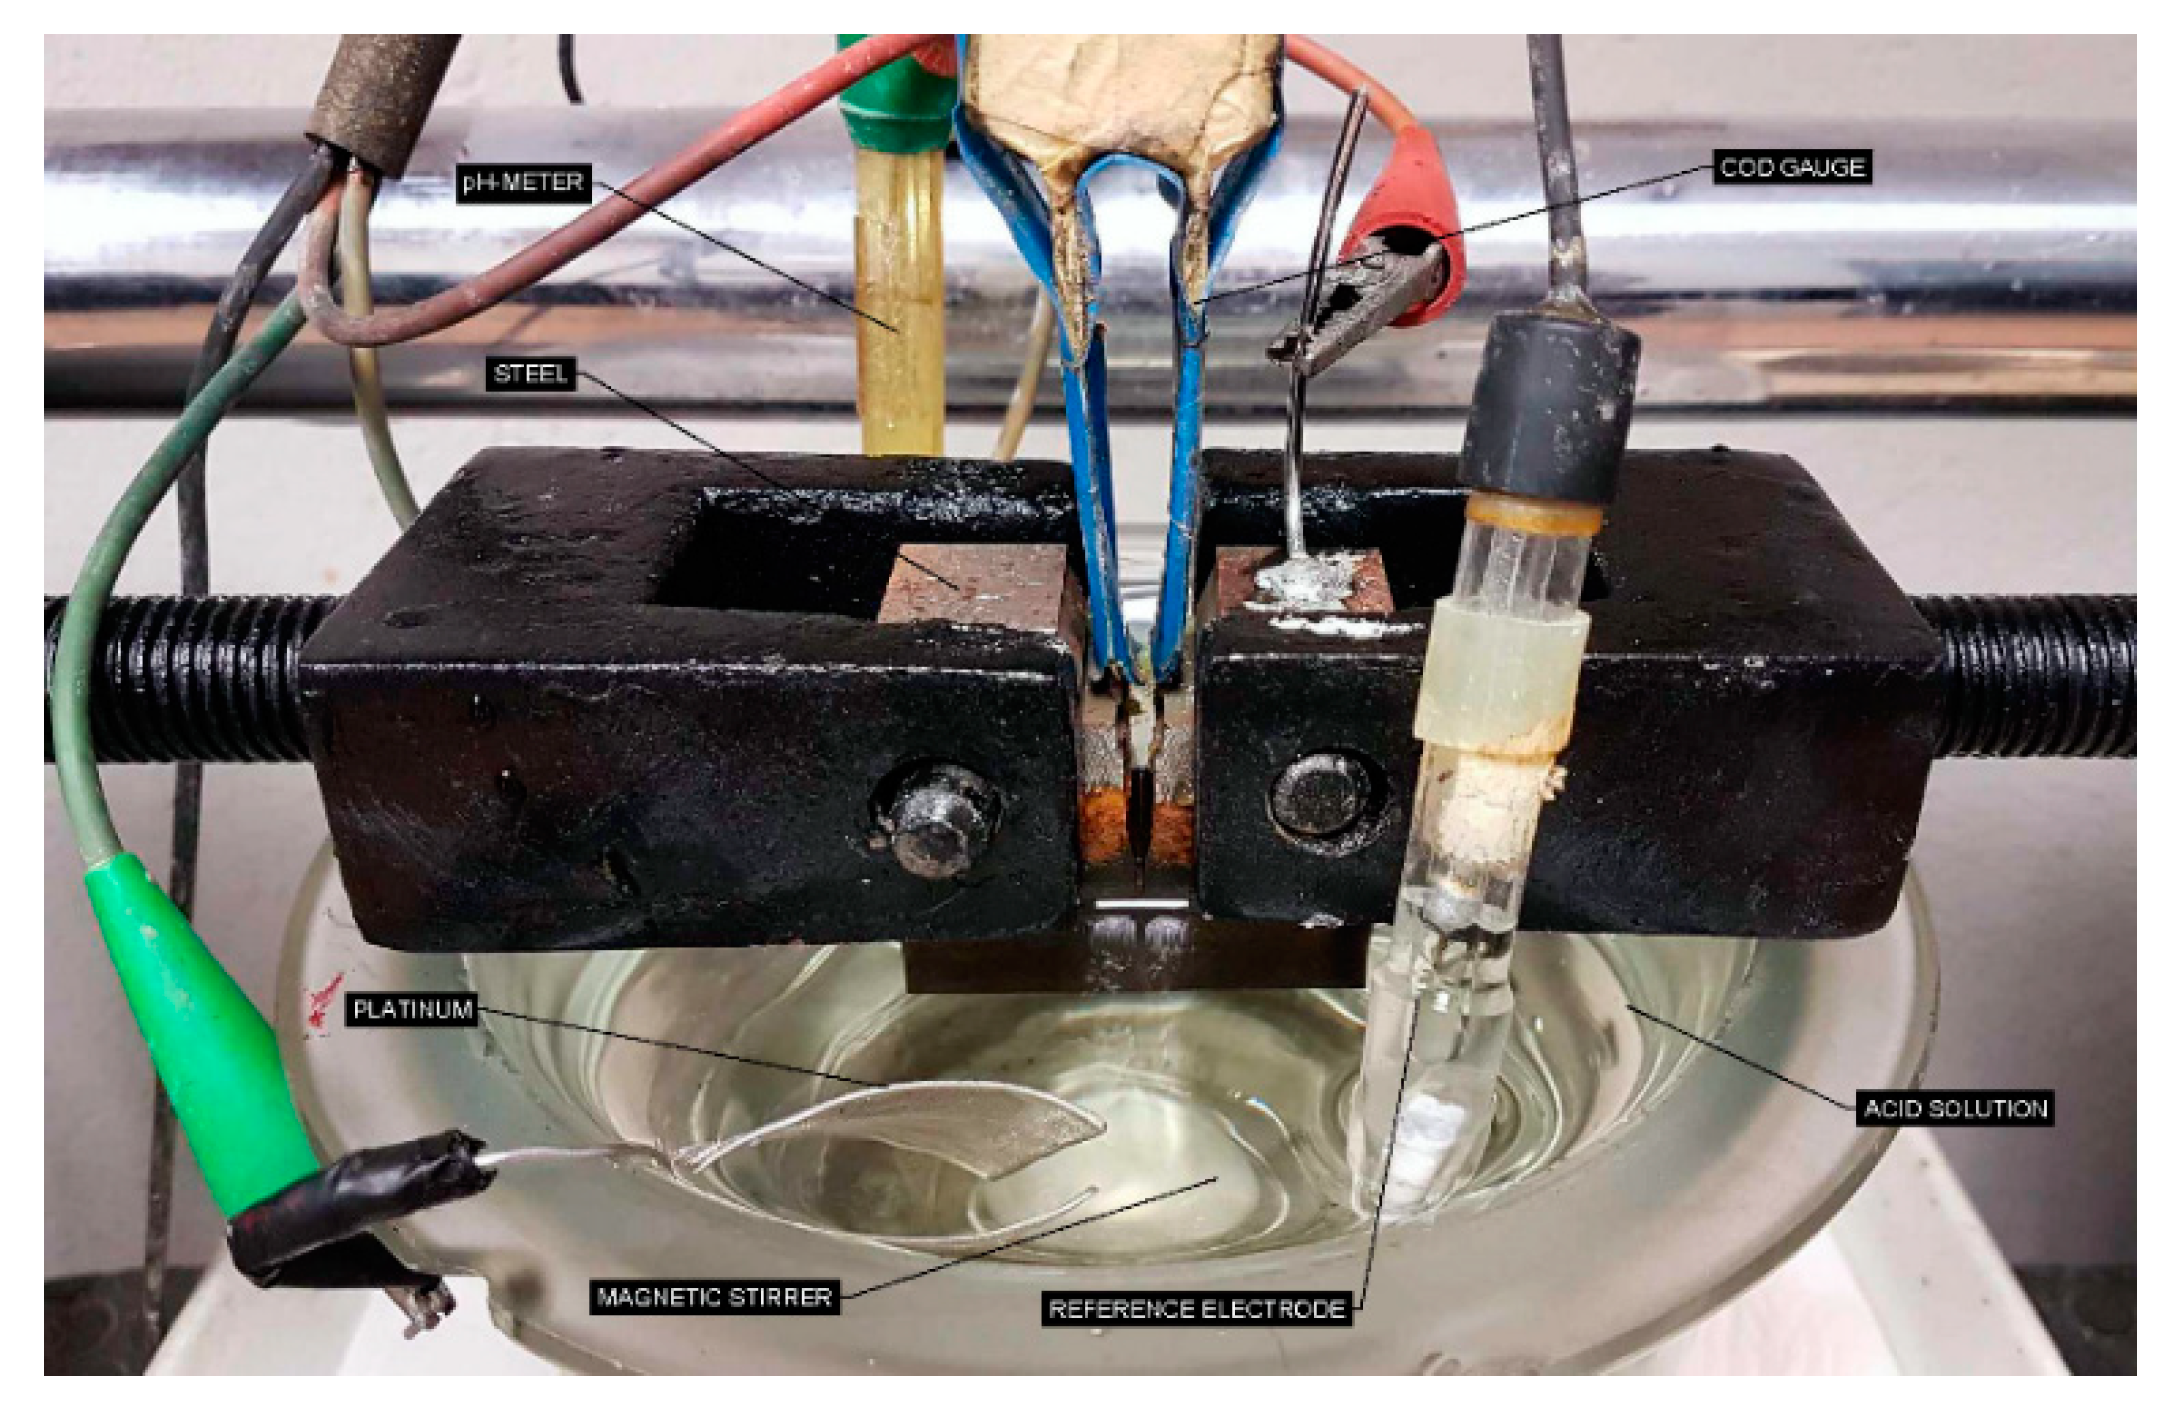
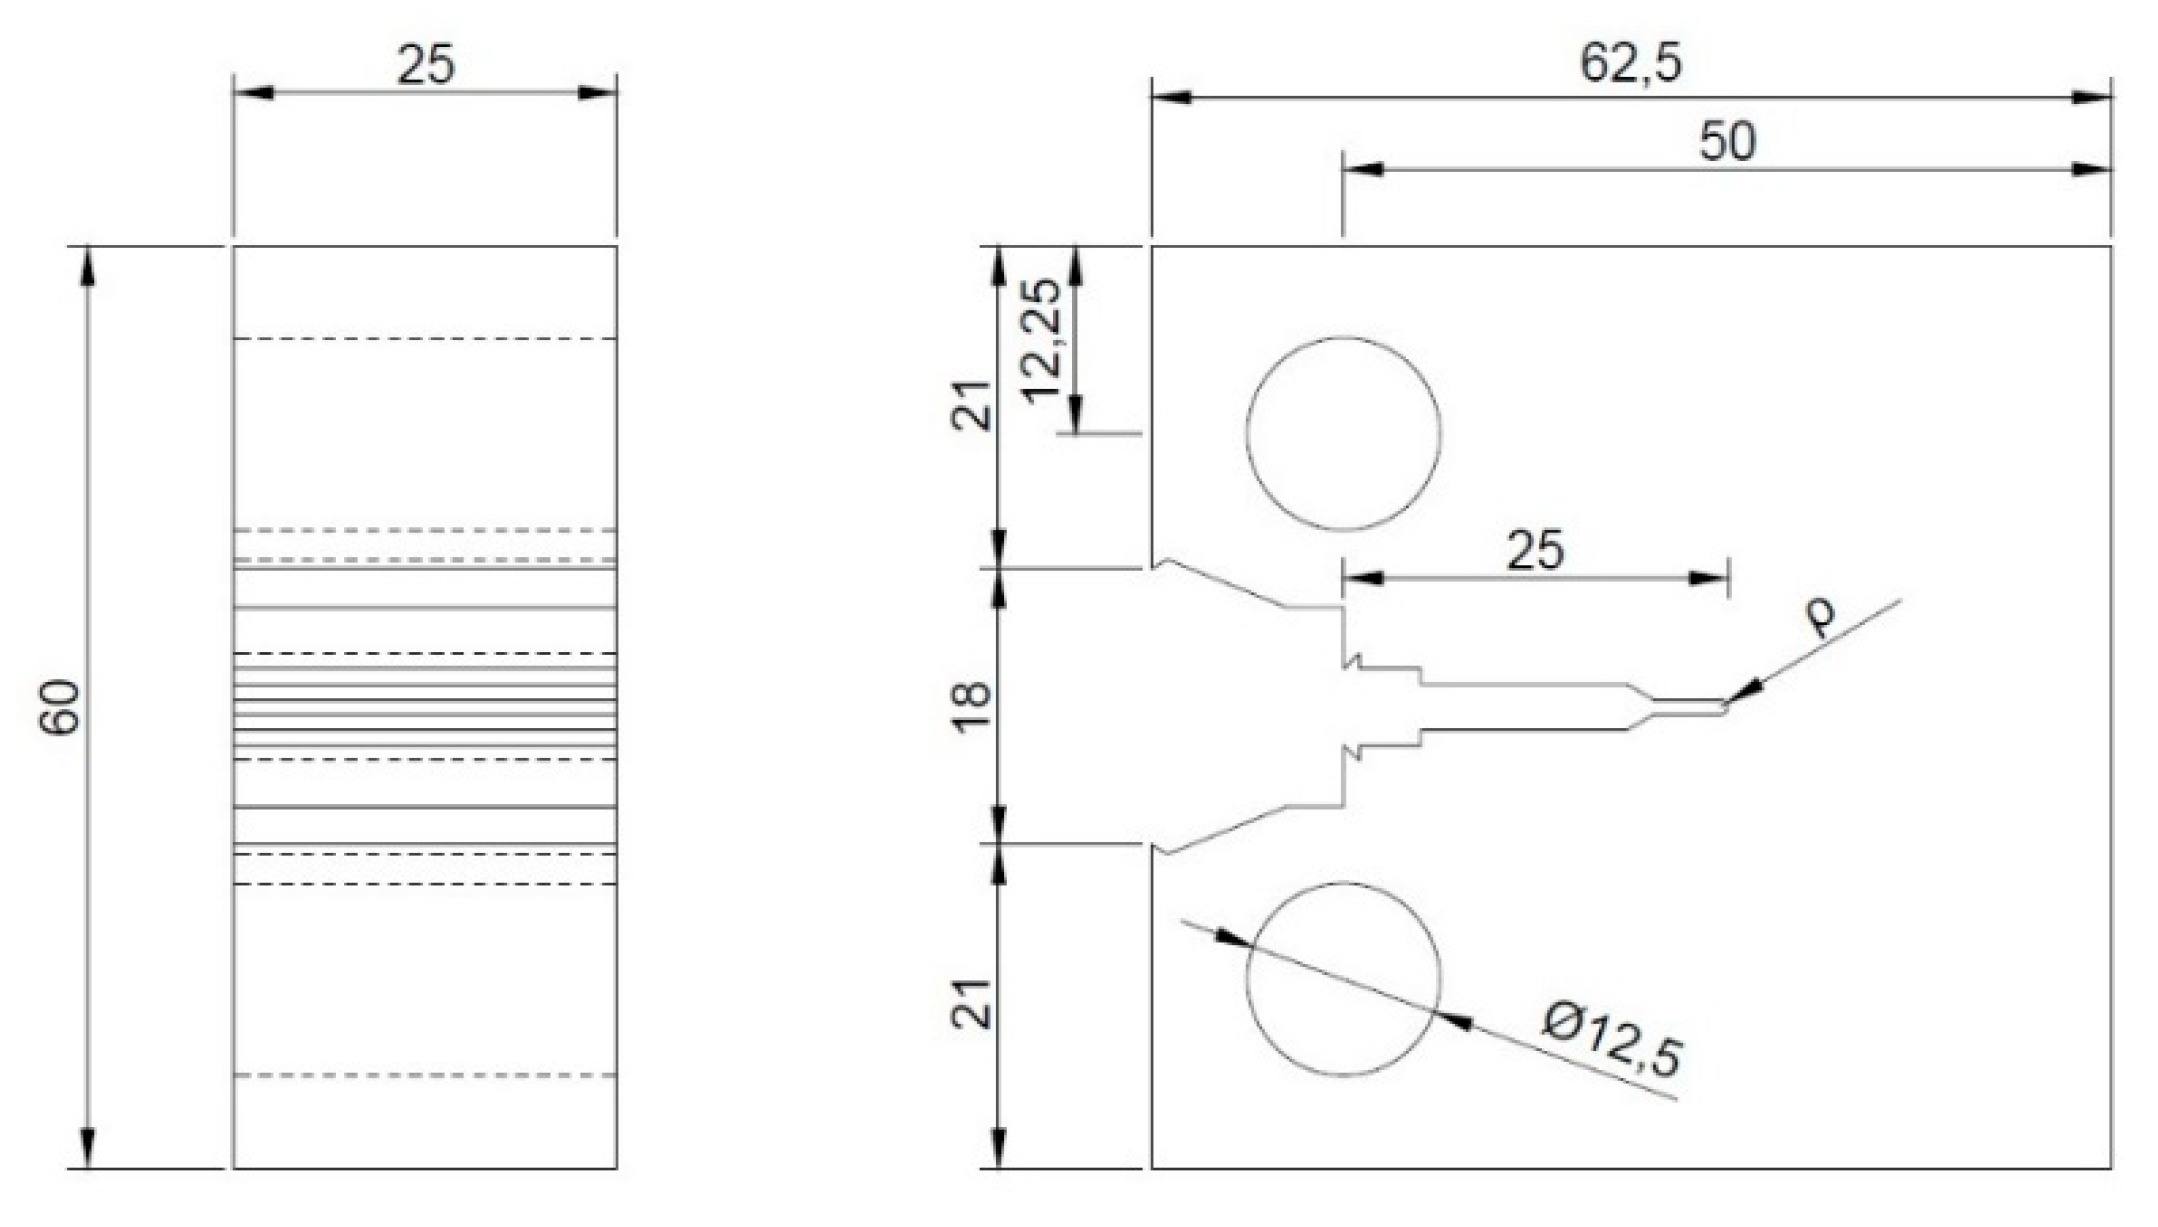
3.4. Experimental Methods
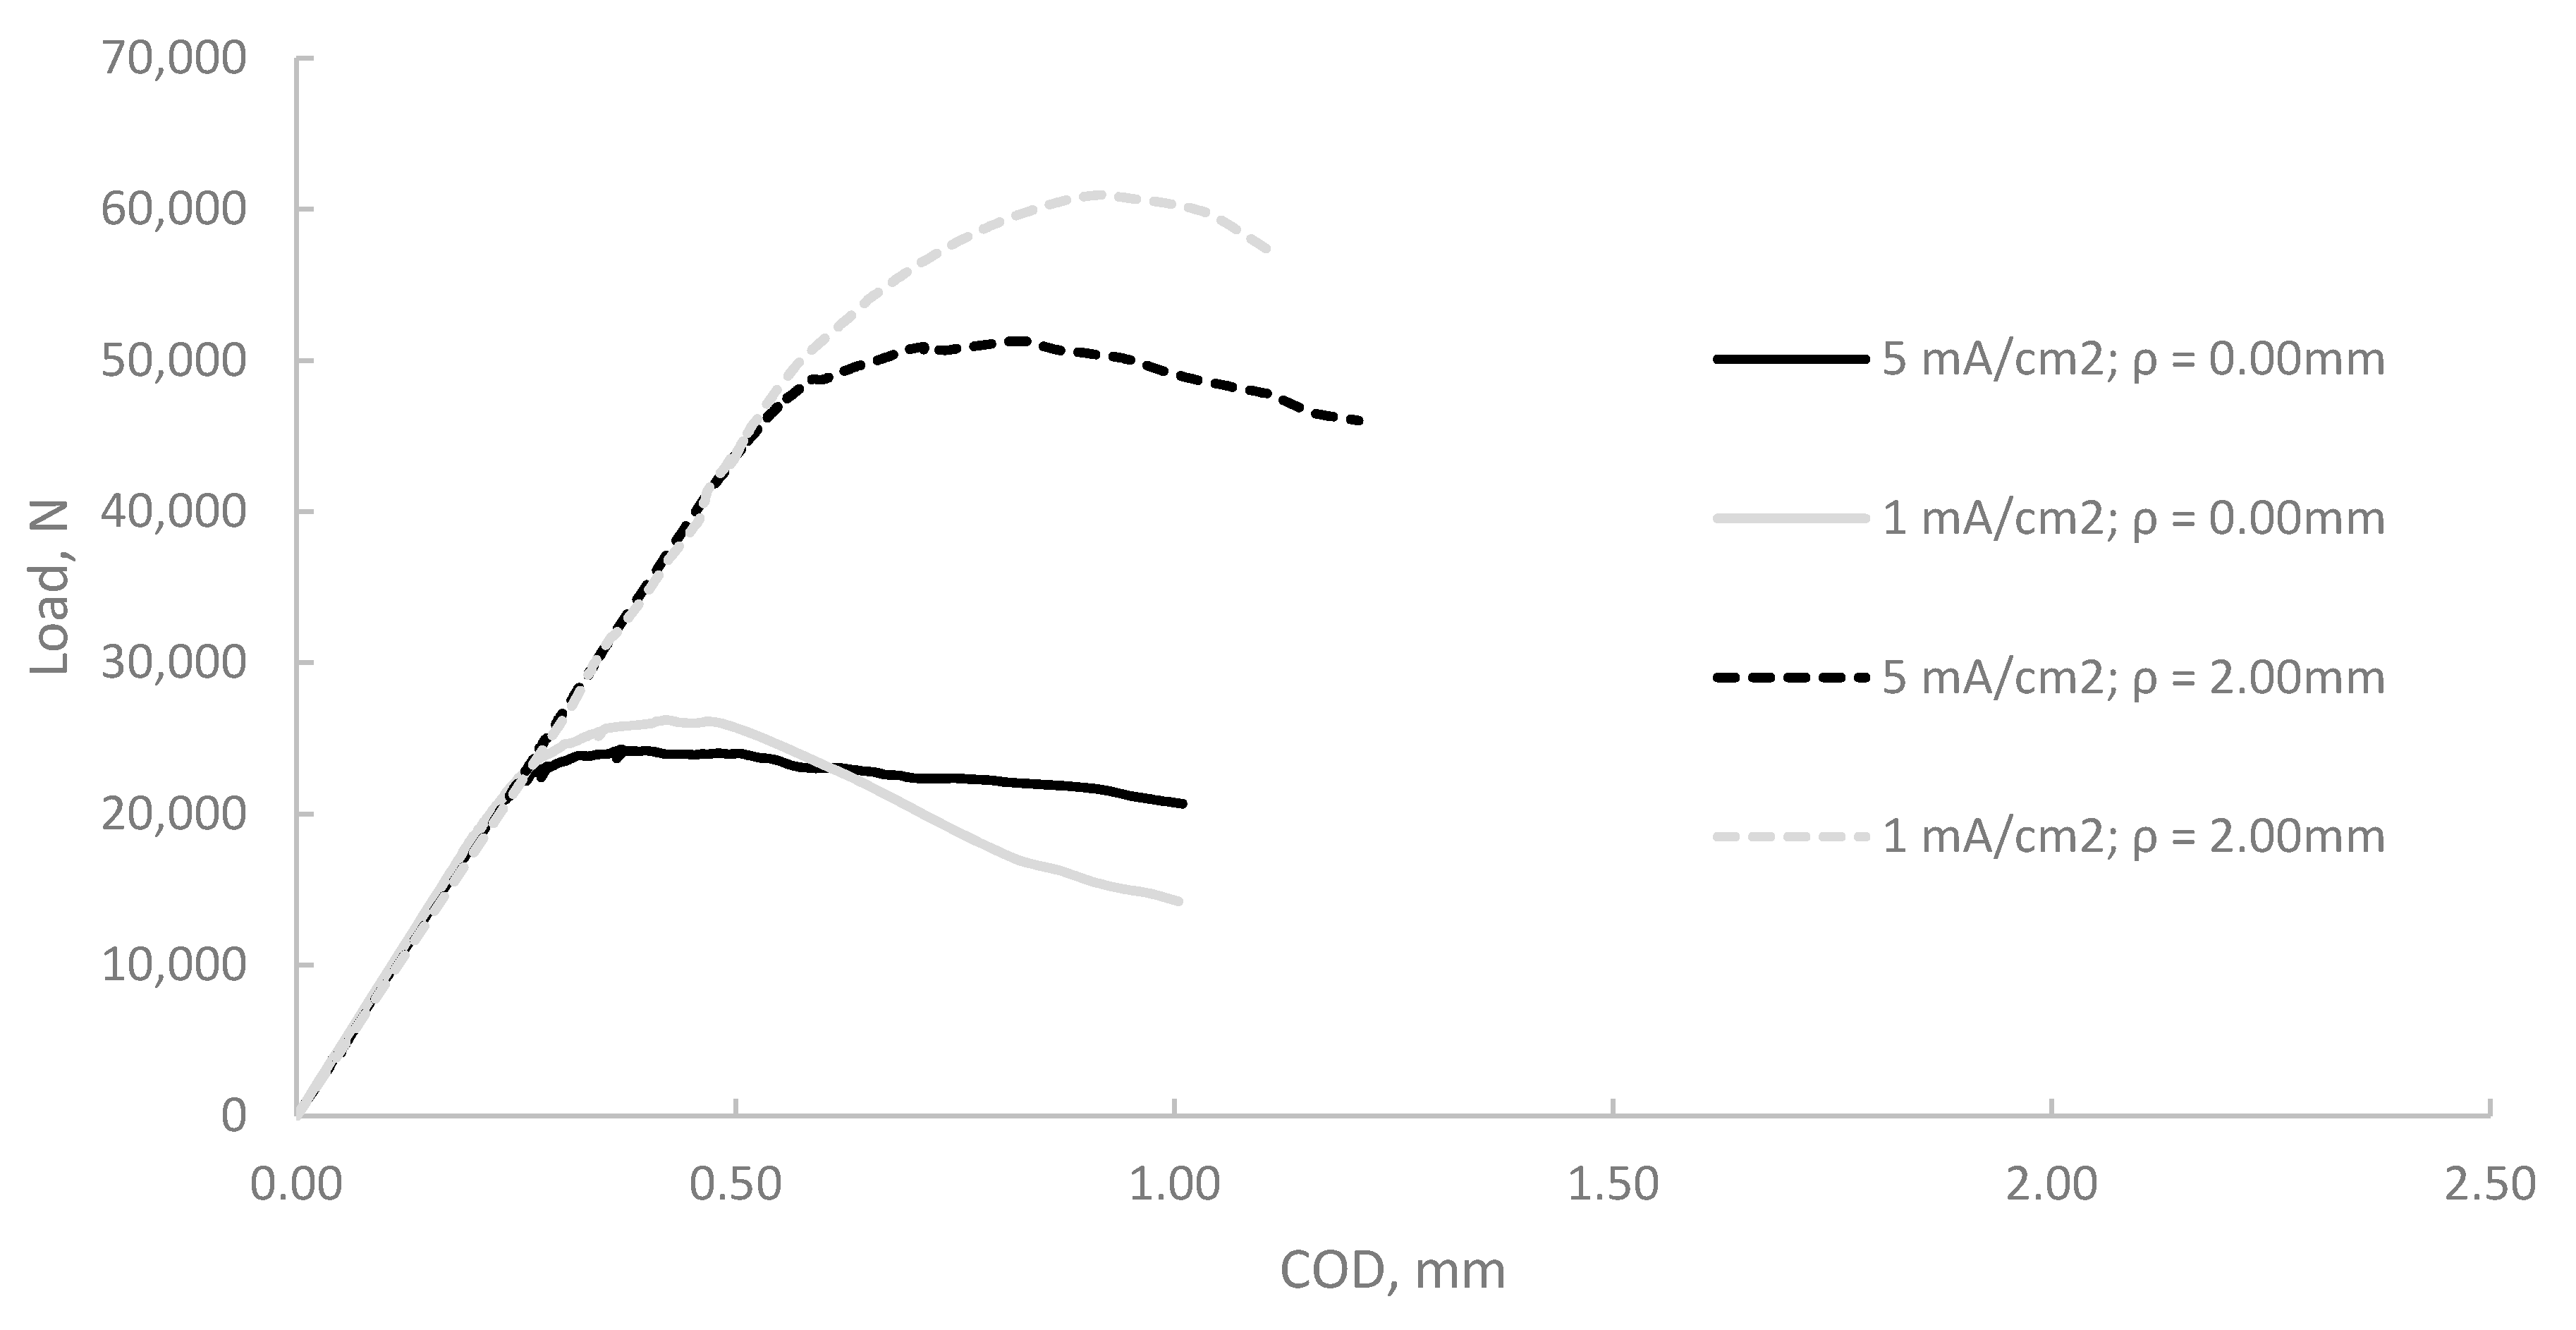
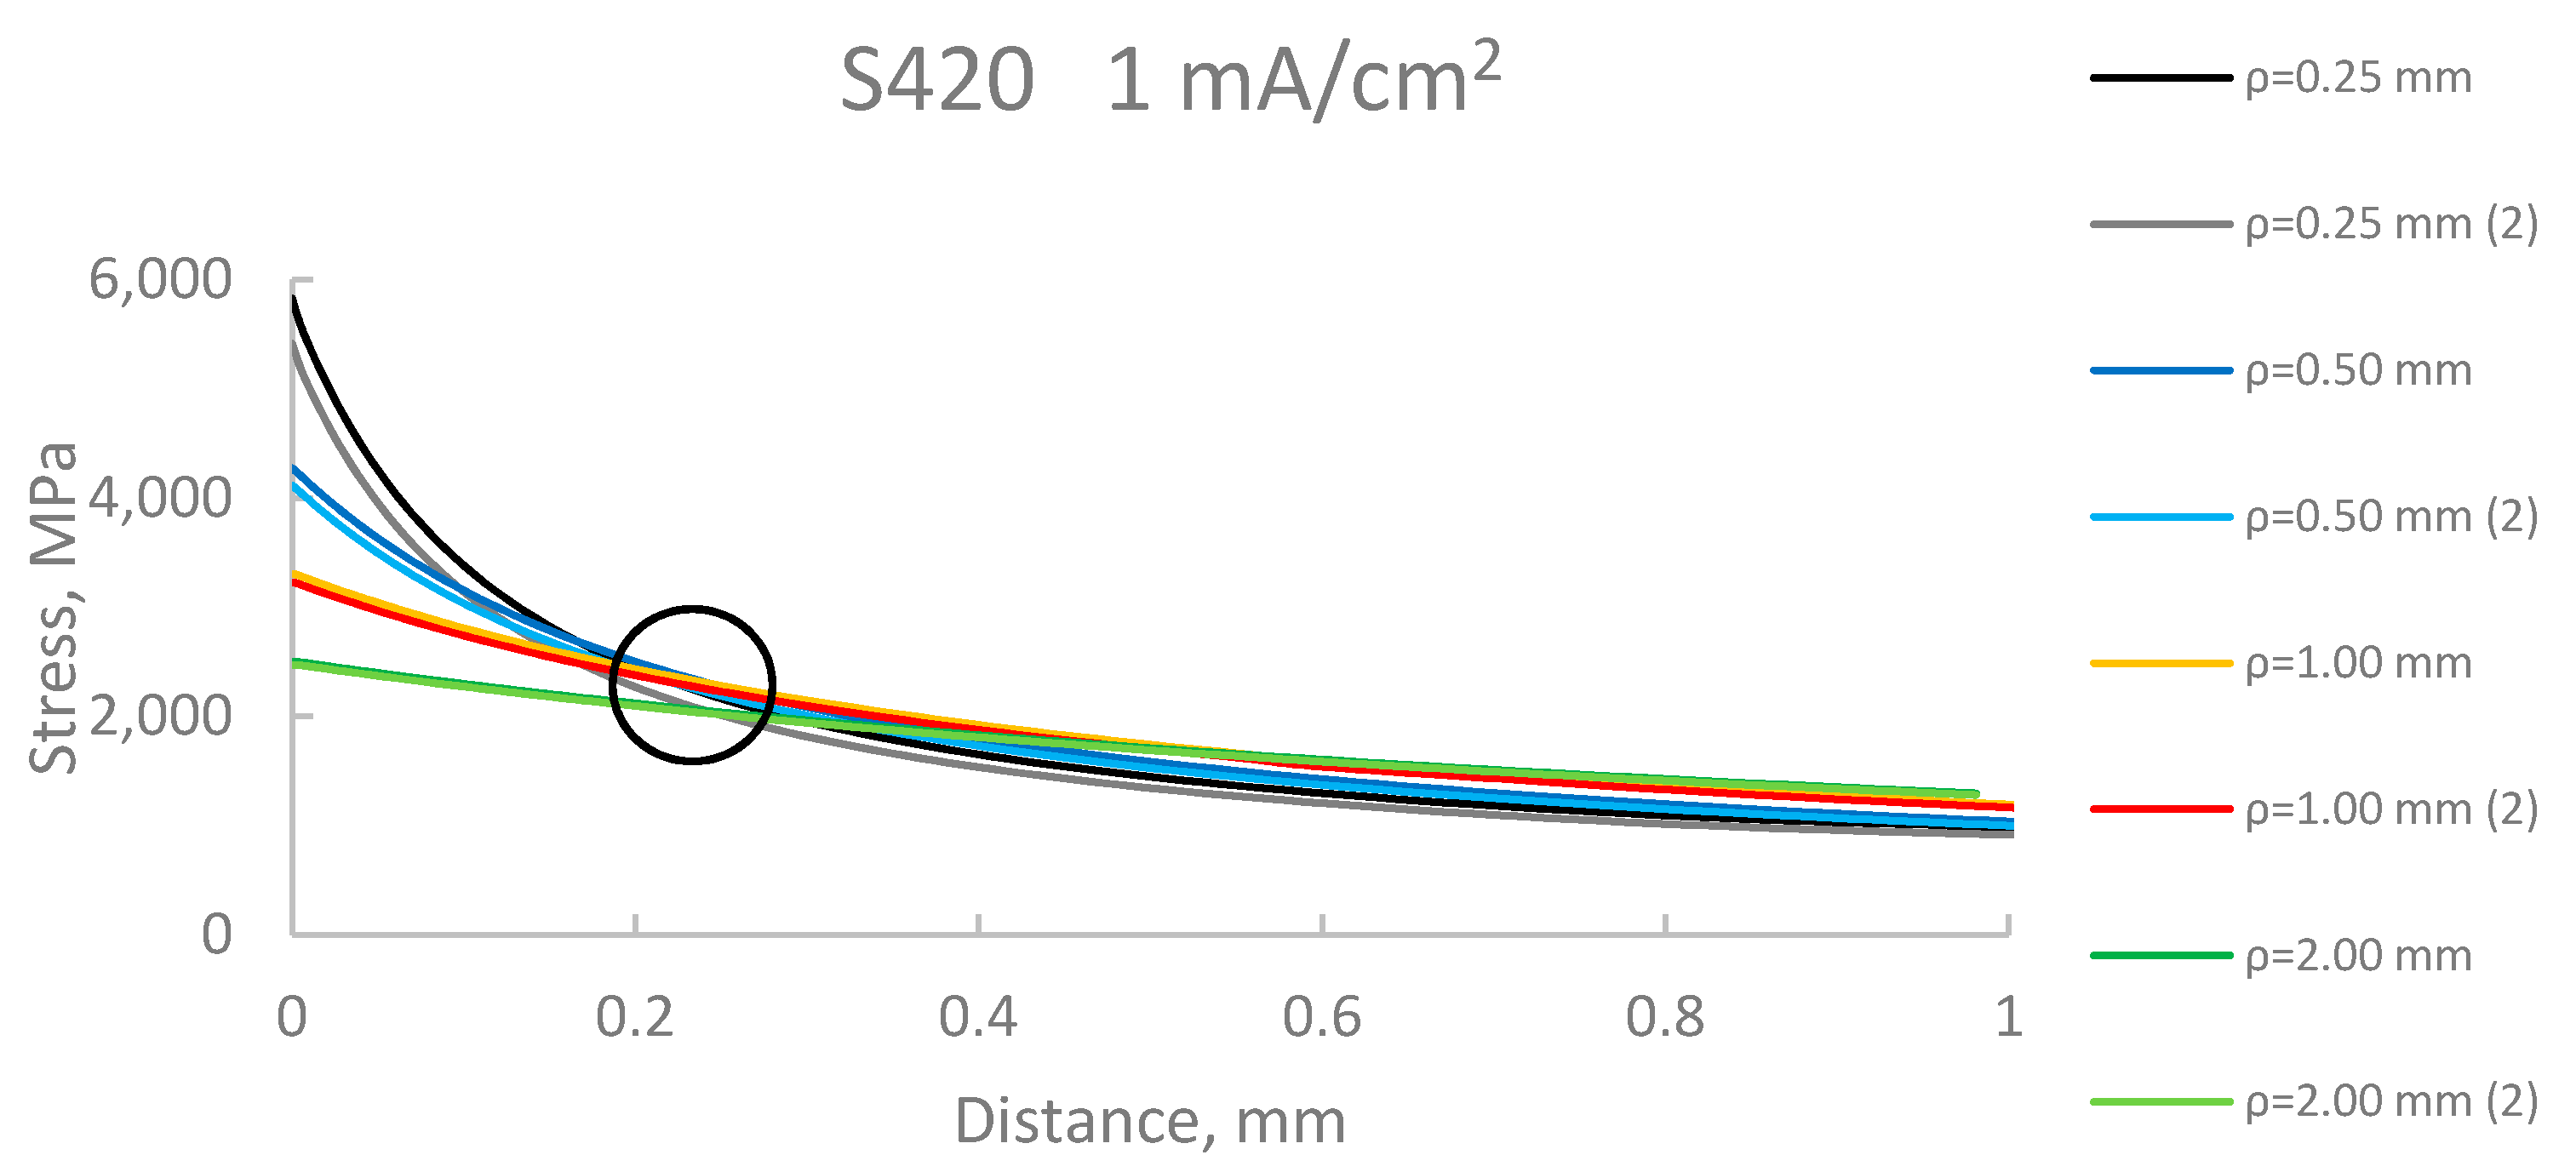
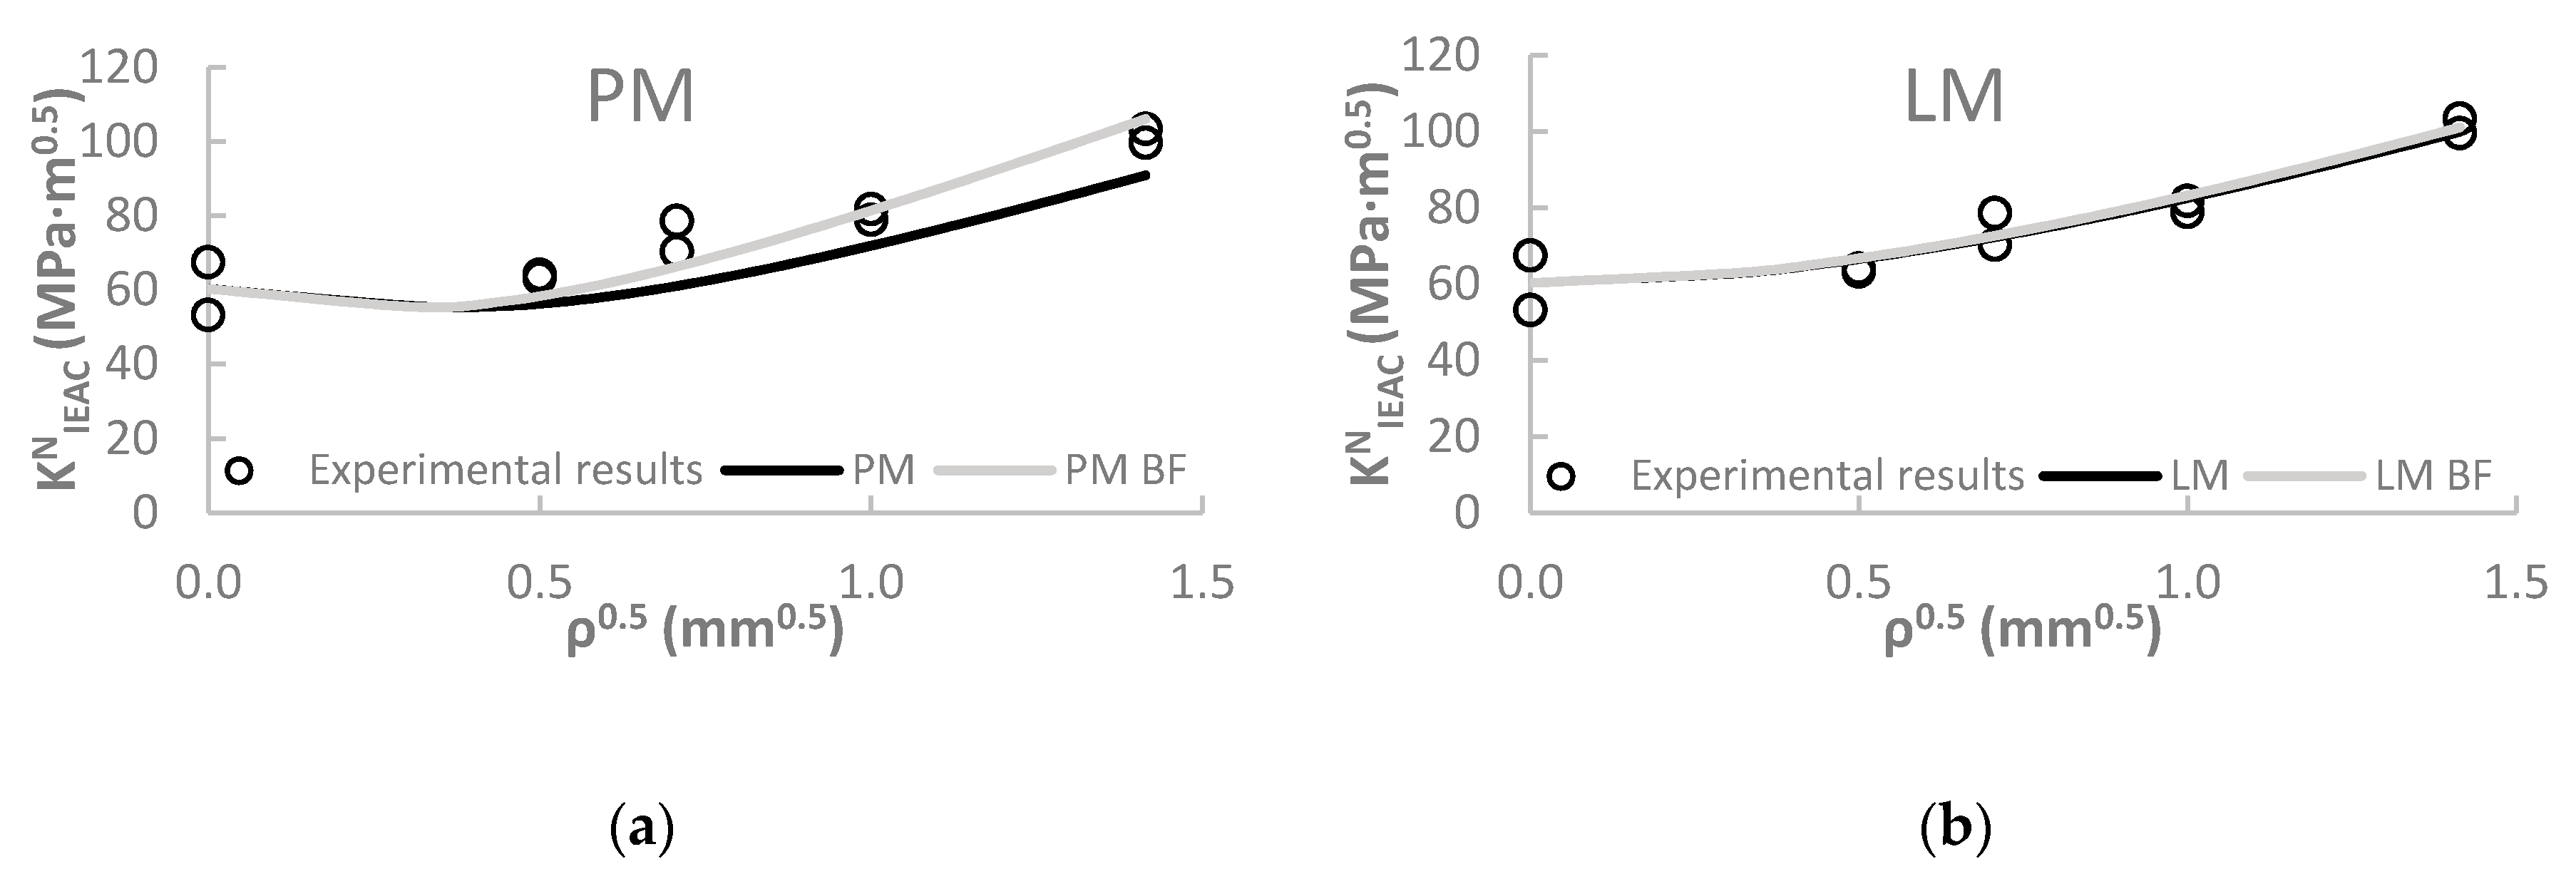
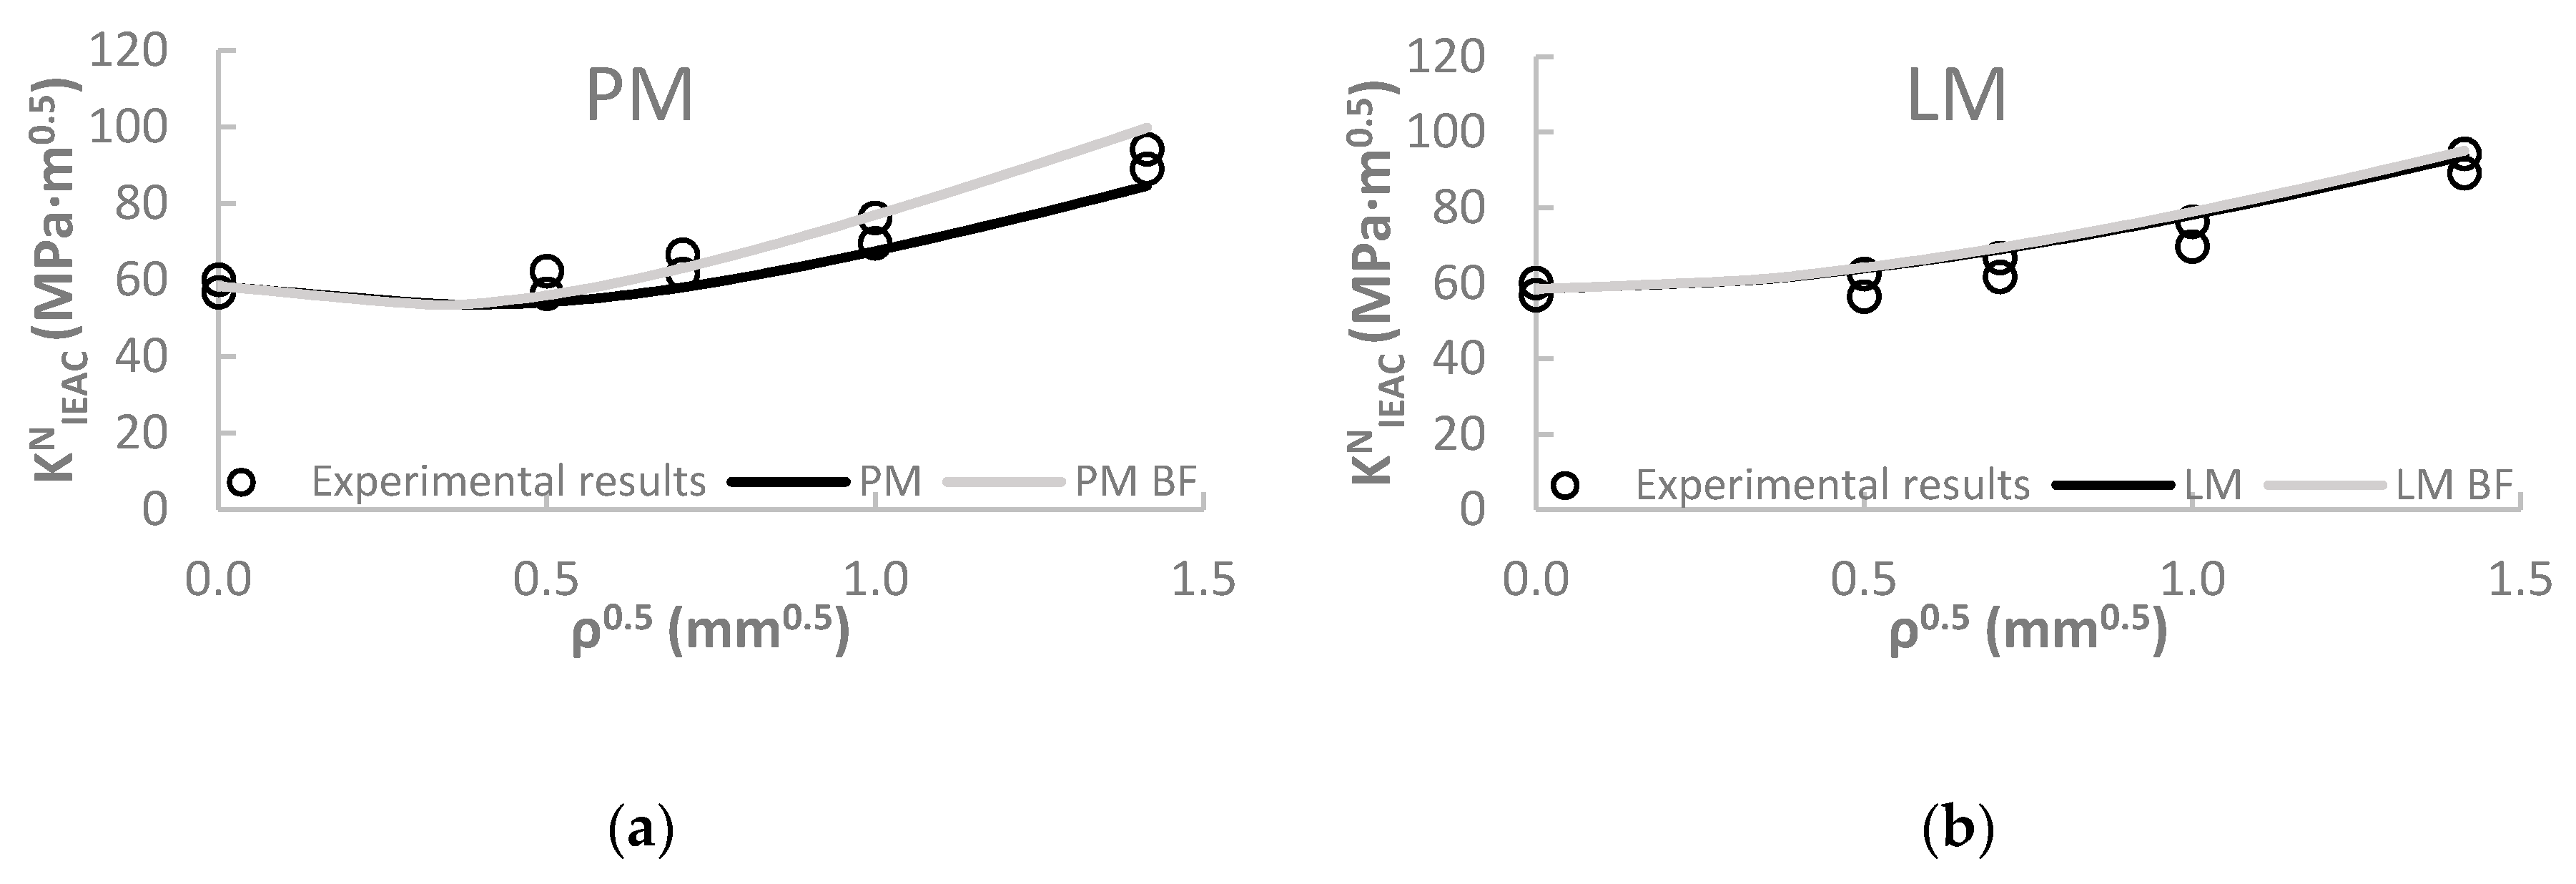
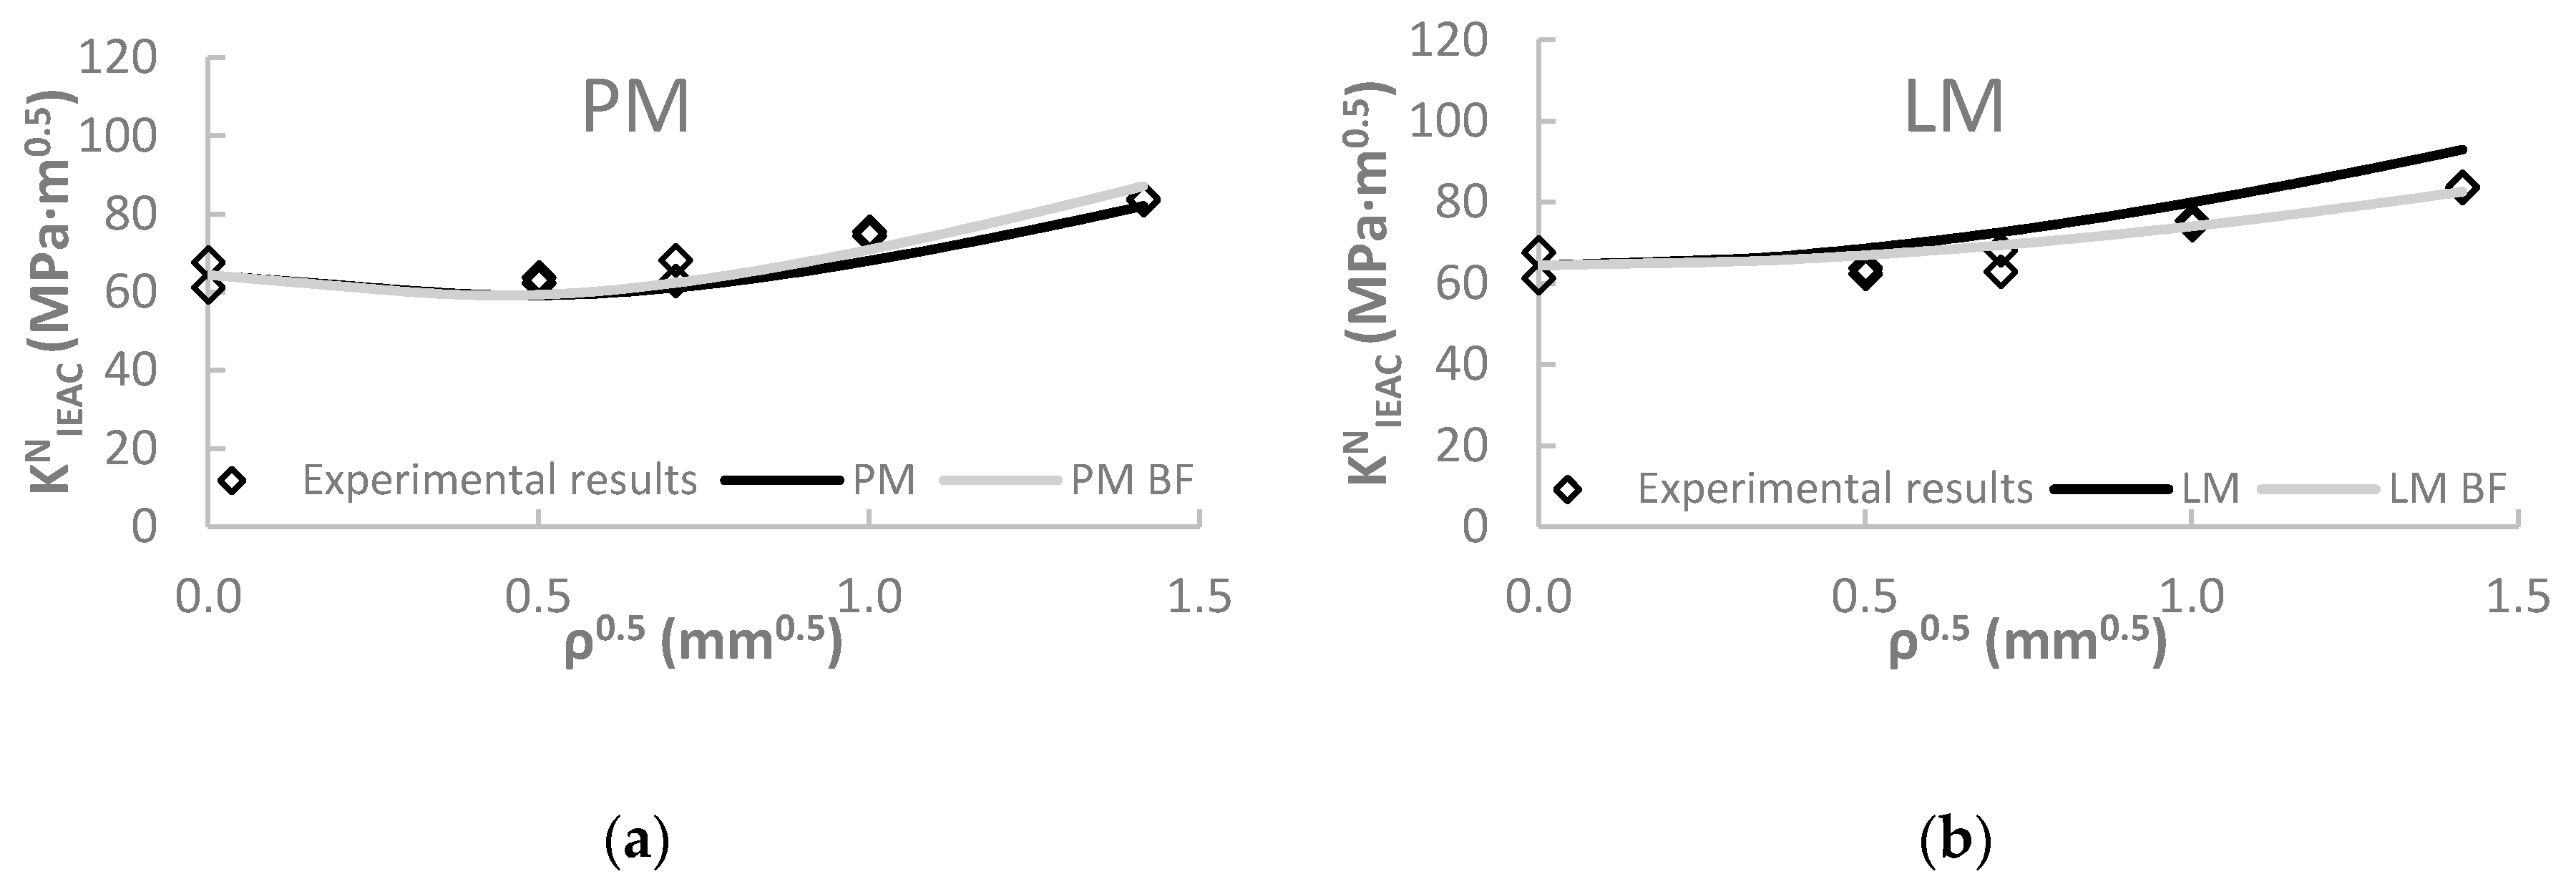
In this work, fatigue pre-cracked C(T) specimens and notched C(T) specimens were tested using a slow strain rate machine. A constant displacement rate of 6·10−8 m/s was employed in each material and environment. Cathodic polarizations at 5 mA/cm2 and 1 mA/cm2 were used to generate two different conditions. Both S420 and X80 specimens were manufactured in TL orientation. Standard geometry [33] was used for pre-cracked specimens, slightly modified for notched ones, as shown in Figure 5. As mentioned above, the use of the TCD in EAC analyses has been previously presented in [20]. The resulting methodology was validated in steels S420 and X80 subjected to cathodic polarization at 5 mA/cm2, obtaining satisfactory results. However, before extending the use of the TCD in EAC assessments, it is necessary to provide further validation. Such validation is provided in this work through the application of the TCD in the analysis of the EAC generated by an additional cathodic polarization (1 mA/cm2).
The whole experimental program is composed of 40 C(T) specimens with notch radii varying from 0 mm (crack-like defect) up to 2.0 mm, as shown in Table 3. Half of the tests (those corresponding to cathodic polarization at 5 mA/cm2) have been previously reported in [20], whereas the other half are totally new. Each test has been duplicated in order to obtain more representative results. Before conducting EAC tests, the specimens were exposed to the aqueous environment under cathodic polarization conditions for 2 days in order to achieve the highest possible level of hydrogen absorption through the corresponding environment. During the hydrogen absorption and the EAC test, the specimens, were submerged in the aqueous solution, ensuring that the defect tip (crack or notch) is always covered by the solution [34]. After the hydrogen absorption, a slow strain rate machine was employed for the mechanical tests, where the specimens were subjected to a constantly rising displacement at 6·10−8 m/s constant displacement rate, while being exposed to the cathodic polarization [35]. Load-COD (Crack Opening Displacement) curves were obtained for all the specimens.
The methodology proposed by the standard ISO 7539 [33] was employed in order to calculate the stress intensity factor above which EAC initiates, KIEAC. The corresponding equation is:
K I E A C = P Q ( B B N W ) 1 / 2 f ( a W )
where PQ is the applied load at the propagation onset due to EAC, B is the specimen thickness, BN is the net specimen thickness (B = BN if no side grooves are present), W is the specimen width and f(a/W) is a geometrical factor depending on the crack size, a, and the specimen width, W. In case of C(T) specimens, the geometrical factor follows this equation:
f ( a W ) = [ ( 2 + a W ) ( 0.886 + 4.64 a W 13.32 ( a W ) 2 + 14.72 ( a W ) 3 5.6 ( a W ) 4 ) ] ( 1 a W ) 3 / 2
These equations were applied to both cracked specimens (generating KIEAC values) and notched specimens (generating KNIEAC values).
Finally, a finite element (FE) analysis was carried out in Abaqus (SIMULIA Academic Research Suite, Abaqus 2016) in order to obtain the stress field at the defect tip when the crack starts to propagate. The simulation was performed in linear elastic conditions. The structured meshing technique was used and the model was developed using C3D8R 3D solid elements with reduced integration. This 3D model required manual partitioning, which has been performed following the specimen shape in order to refine the mesh in the most complex regions, such as the notch tip and the holes. The notch tip presents 60 elements around the perimeter and 30 elements along the width. As the distance moves away from the notch tip, the mesh becomes thicker. In other words, the mesh, which has been built using hexahedric elements, is more refined close to the notch tip. Figure 6 represents the FE model employed together with the mesh.

4. Results

Table 4 gathers the experimental results of the tests. The values of KNIEAC have been obtained following the methodology proposed in ISO 7539 and using Equations (13) and (14). For cracked specimens (ρ = 0 mm), KNIEAC coincides with KIEAC.
Figure 7 shows, as an example, four of the experimental Load-COD curves obtained. They all correspond to steel X80, with two different notch radii (ρ = 0 mm and ρ = 2.0 mm), and the two cathodic polarizations (5 mA/cm2 and 1 mA/cm2). A clear notch effect and a much more moderate (but still significant) effect of the cathodic polarization level can be observed.
The stress-distance curves at the notch tip and at crack propagation onset were obtained through the FE model (i.e., when applying the corresponding PQ). The PM postulates (Figure 1) that the curves cross each other at one point with coordinates (LEAC/2, σ0EAC). Figure 8, Figure 9, Figure 10 and Figure 11 represent the stress-distance curves for the different combinations of steel (X80 and S420) and environmental condition (5 mA/cm2 and 1 mA/cm2). The resulting stress-distance curves were obtained with the average value of PQ obtained in the two tests performed in nominally identical conditions.
Table 5 shows the experimental results of KIEAC (obtained from Equation (13) and the PQ values obtained in cracked specimens) and the experimental values of LEAC. Figure 8, Figure 9, Figure 10 and Figure 11 reveal how the different curves do not cross each other at the same point, although the fundamental assumption of the PM is fulfilled. Taking the average values, obtained in the different cut-off points obtained from the stress-distance curves, the derivation of LEAC is straightforward.
Once KIEAC and LEAC were obtained, predictions of KNIEAC can be derived for each notch radius following the PM (Equation (11)) or the LM (Equation (12)). Predictions provided by PM and LM using the obtained LEAC values, and their comparison with the corresponding best fit of the experimental results are shown in Figure 12, Figure 13, Figure 14 and Figure 15. The values of the critical distance providing the best fit (least squares) of the experimental results (LEAC-BF), when using both the PM (Equation (11)) and the LM (Equation (12)), are also gathered in Table 5.

5. Discussion

KIEAC values have been obtained as the average value obtained in the pre-cracked specimens (ρ = 0 mm), for each combination of material and environment. Even though the S420 steel does not fulfil the recommendation for size independency specified by the standard, the aggressive environment (hydrogen embrittlement) reduces the plasticity and, hence, the sample dimensions required to limit plastic deformations. Consequently, a minimum thickness cannot be specified [33]. In any case, regardless of whether or not KIEAC is size independent for the specimens being tested, the analysis performed allows the results obtained for the different notch radii to be compared (as the thickness is the same for the different specimens). Therefore, and for the sake of simplicity, they are all named equally, without any reference to any possible size independence.
Moreover, the TCD assumes linear-elastic conditions, although the real situation may have certain non-linearities. This may be done, and has been widely validated, once σ0 (or σ0EAC) is conveniently calibrated. In other words, under non-linear conditions, σ0 becomes a parameter that converts a non-linear situation into an equivalent linear-elastic one [14,36].
Tests under two levels of cathodic polarization (embrittlement levels) have been carried out in X80 and S420 steels. Stress-distance curves have been obtained through finite element simulations using the load when the crack starts to propagate. In the four combinations of material and environment, the different curves cross each other at approximately one point with coordinates (LEAC/2, σ0EAC), as the TCD (PM) assumption postulates. Thus, it can be stated that the TCD assumptions are fulfilled in EAC conditions, likewise in fracture and fatigue phenomena.
The values of LEAC at 1 mA/cm2 of cathodic polarization are larger than those values obtained at 5 mA/cm2. This is related with the presence of sulfur in the acidic solution, given that sulfur ions acting as poison are less active than the undissociated H2S during the hydrogen recombination reaction. The test conditions may cause alkalinisation, and this phenomenon increases with the current density. The alkalinisation reduces the hydrogen evolution and may form an oxide layer on the specimen that prevents the hydrogen entry into the steel.
The experimental results of KNIEAC show that an evident notch effect has been observed in all combinations of material and environment, this effect being more pronounced in the X80 steel. This also implies that steel X80 has lower values of LEAC than steel S420 (it is thus more sensitive to notches).
In any case, it has been observed that both PM and LM provide accurate predictions of KNIEAC, regardless of the material, environment and notch radius being analyzed. Some of the predictions basically provide the same values as those generated by the best-fit. However, the LM provides predictions that are more accurate, and the PM offers both straightforward and safe predictions.

6. Conclusions

In this paper, the effect of an aggressive environment on the environmentally assisted cracking behavior of two steels containing U-shaped notches has been analyzed using the theory of critical distances (TCD). The TCD has been applied through the point method and the line method to predict the apparent crack propagation threshold for EAC, KNIEAC, under two hydrogen embrittlement conditions caused by cathodic polarization at a level of 5 mA/cm2 (previously reported in the literature) and 1 mA/cm2. TCD parameters have been obtained by a combination of experimental tests and finite element simulations.
Both materials present an evident notch effect, with an increase of KNIEAC with the notch radius, ρ. This has been accurately predicted using the TCD (PM and LM).
Also, the capacity of the TCD for predicting the effect of the embrittlement conditions in the EAC behavior of the notched steels being analyzed has been demonstrated.
Thus, this work provides additional validation of the use of the TCD for the analysis of EAC processes.

Author Contributions

S.C. and J.A.A. proposed the model, S.C., B.A. and J.A.A. conceived and designed the experiments; P.G. performed the experiments and wrote the paper; all the authors analyzed the data and provided comments and corrections to the first draft of the document.

Funding

This research received no external funding.

Acknowledgments

The authors of this work would like to express their gratitude to the Spanish Ministry of Science and Innovation for the financial support of the projects MAT2014-58738-C3-3-R and MAT2014-58443-P developed by the University of Cantabria.

Conflicts of Interest

The authors declare no conflict of interest. The funders had no role in the design of the study; in the collection, analyses, or interpretation of data; in the writing of the manuscript, or in the decision to publish the results.

References

  1. International Energy Outlook 2016; U.S. Energy Information Administration: Washington, DC, USA, 2016; ISBN 9781613241431.
  2. Wolski, K. Environmentally assisted cracking (EAC) in nuclear reactor systems and components. In Nuclear Corrosion Science and Engineering; Woodhead Publishing Series in Energy; Woodhead Publishing Limited: Sawston, UK, 2012. [Google Scholar]
  3. Lynch, S.P. Failures of structures and components by metal-induced embrittlement. In Stress Corrosion Cracking; Raja, V.S., Shoji, T., Eds.; Woodhead Publishing Series in Metals and Surface Engineering; Woodhead Publishing: Sawston, UK, 2011; pp. 714–748. ISBN 978-1-84569-673-3. [Google Scholar]
  4. Gangloff, R.P. Hydrogen Assisted Cracking of High Strenght Alloys; Aluminum co of America Alcoa Center PA Alcoa Technical Center: Charlotesville, VA, USA, 2003. [Google Scholar]
  5. Brown, B.F. Stress Corrosion Cracking Control Measures; National Bureau of Standards Monograph 156; American University Washington DC Department of Chemistry: Washington, DC, USA, 1977. [Google Scholar]
  6. Iannuzzi, M. Environmentally assisted cracking (EAC) in oil and gas production. In Stress Corrosion Cracking; Raja, V.S., Shoji, T., Eds.; Woodhead Publishing Series in Metals and Surface Engineering; Woodhead Publishing: Sawston, UK, 2011; pp. 570–607. ISBN 978-1-84569-673-3. [Google Scholar]
  7. Koch, G. Cost of corrosion. In Trends in Oil and Gas Corrosion Research and Technologies; Woodhead Publishing: Sawston, UK, 2017; pp. 3–30. [Google Scholar] [CrossRef]
  8. Jones, D.A. Principles and Prevention of Corrosion; Prentice-Hall, Inc. Simon & Schuster: Upper Saddle River, NJ, USA, 1996; ISBN 0-13-359 993-0. [Google Scholar]
  9. Elboujdaini, M. Hydrogen-Induced Cracking and Sulfide Stress Cracking. In Uhlig’s Corrosion Handbook, 3rd ed.; John Wiley & Sons, Inc.: Hoboken, NJ, USA, 2011; pp. 183–194. ISBN 9780470080320. [Google Scholar]
  10. Atzori, B.; Lazzarin, P.; Filippi, S. Cracks and notches: Analogies and differences of the relevant stress distributions and practical consequences in fatigue limit predictions. Int. J. Fatigue 2001, 23, 355–362. [Google Scholar] [CrossRef]
  11. Fenghui, W. Prediction of intrinsic fracture toughness for brittle materials from the apparent toughness of notched-crack specimen. J. Mater. Sci. 2000, 35, 2543–2546. [Google Scholar] [CrossRef]
  12. Pluvinage, G. Fatigue and fracture emanating from notch; the use of the notch stress intensity factor. Nucl. Eng. Des. 1998, 185, 173–184. [Google Scholar] [CrossRef]
  13. Nui, L.S.; Chehimi, C.; Pluvinage, G. Stress field near a large blunted tip V-notch and application of the concept of the critical notch stress intensity factor (NSIF) to the fracture toughness of very brittle materials. Eng. Fract. Mech. 1994, 49, 325–335. [Google Scholar] [CrossRef]
  14. Taylor, D. The Theory of Critical Distances: A New Perspective in Fracture Mechanics; Elsevier: Oxford, UK, 2007; ISBN 9780080444789. [Google Scholar]
  15. Taylor, D.; Kasiri, S.; Brazel, E. The theory of critical distances applied to problems in fracture and fatigue of bone. Frat. Integrità Strutt. 2009, 3. [Google Scholar] [CrossRef]
  16. Susmel, L. The theory of critical distances: A review of its applications in fatigue. Eng. Fract. Mech. 2008, 75, 1706–1724. [Google Scholar] [CrossRef]
  17. Cicero, S.; Madrazo, V.; Carrascal, I.; García, T. The use of the theory of critical distances in fracture and structural integrity assessments. In Research and Applications in Structural Engineering, Mechanics and Computation, Proceedings of the 5th International Conference on Structural Engineering, Mechanics and Computation (SEMC 2013), Cape Town, South Africa, 2–4 September 2013; CRC Press: Boca Raton, FL, USA; pp. 573–578.
  18. Ibáñez-Gutiérrez, F.T.; Cicero, S.; Carrascal, I.A. Analysis of notch effect in short glass fibre reinforced polyamide 6. In Proceedings of the 17th European Conference on Composite Materials (ECCM 2016), Munich, Germany, 26–30 June 2016. [Google Scholar]
  19. Cicero, S.; Madrazo, V.; Carrascal, I.A.; Cicero, R. Assessment of notched structural components using Failure Assessment Diagrams and the Theory of Critical Distances. Eng. Fract. Mech. 2011, 78, 2809–2825. [Google Scholar] [CrossRef]
  20. González, P.; Cicero, S.; Arroyo, B.; Álvarez, J.A. A Theory of Critical Distances based methodology for the analysis of environmentally assisted cracking in steels. Eng. Fract. Mech. 2019. [Google Scholar] [CrossRef]
  21. Neuber, H. Theory of Notch Stresses: Principles for Exact Calculation of Strength with Reference to Structural form and Material; Springer Verlag: Berlin, Germany, 1958; Volume 4547. [Google Scholar]
  22. Peterson, R.E. Notch sensitivity. In Metal Fatigue; McGraw Hill: New York, NY, USA, 1959; pp. 293–306. [Google Scholar]
  23. Cicero, S.; Fuentes, J.D.; Procopio, I.; Madrazo, V.; González, P. Critical distance default values for structural steels and a simple formulation to estimate the apparent fracture toughness in u-notched conditions. Metals 2018, 8. [Google Scholar] [CrossRef]
  24. Creager, M.; Paris, P.C. Elastic field equations for blunt cracks with reference to stress corrosion cracking. Int. J. Fract. Mech. 1967, 3, 247–252. [Google Scholar] [CrossRef]
  25. Gangloff, R.P. Hydrogen-assisted Cracking. Compr. Struct. Integr. 2003, 6, 31–101. [Google Scholar] [CrossRef]
  26. Hamilton, J.M. The challenges of deep-water arctic development. Int. J. Offshore Polar Eng. 2011, 21, 241–247. [Google Scholar]
  27. Shipilov, S.; Jones, R.; Olive, J.-M.; Rebak, R. Environment-Induced Cracking of Materials; Shipilov, S.A., Jones, R.H., Olive, J.-M., Rebak, R.B., Eds.; Elsevier: Amsterdam, The Netherlands, 2008; ISBN 9780080446356. [Google Scholar]
  28. BS EN 10225:2009, Weldable Structural Steels for Fixed Offshore Structures Technical Delivery Conditions; BSI: London, UK, 2009; ISBN 9780580646232.
  29. Specification, A.P.I. 5LD-2009: Specification for CRA Clad or Lined Steel Pipe; American Petroleum Institute: Washington, DC, USA, 2009. [Google Scholar]
  30. Bernstein, I.M.; Pressouyre, G.M. Role of Traps in the Microstructural Control of Hydrogen Embrittlement of Steels; Noyes Publ: Park Ridge, NJ, USA; Pittsburgh, PA, USA, 1988; ISBN 0815510276. [Google Scholar]
  31. Arroyo, B.; Álvarez, J.A.; Lacalle, R.; Uribe, C.; García, T.E.; Rodríguez, C. Analysis of key factors of hydrogen environmental assisted cracking evaluation by small punch test on medium and high strength steels. Mater. Sci. Eng. A 2017, 691, 180–194. [Google Scholar] [CrossRef]
  32. Alvarez, J.A.; Gutiérrez-Solana, F. Elastic-plastic fracture mechanics based methodology to characterize cracking behavior and its application to environmental assisted processes. Nucl. Eng. Des. 1999, 188, 185–202. [Google Scholar] [CrossRef]
  33. ISO 7539 Corrosion of Metals and Alloys. Stress Corrosion Testing. Parts 1 to 11; ISO: Geneva, Switzerland, 2015.
  34. Dietzel, W.; Srinivasan, P.B.; Atrens, A. Testing and evaluation methods for stress corrosion cracking (SCC) in metals. In Stress Corrosion Cracking; Raja, V.S., Shoji, T., Eds.; Woodhead Publishing Series in Metals and Surface Engineering; Woodhead Publishing: Sawston, UK, 2011; pp. 133–166. ISBN 978-1-84569-673-3. [Google Scholar]
  35. Turnbull, A. Test methods for environment assisted cracking. Br. Corros. J. 1992, 27, 271–289. [Google Scholar] [CrossRef]
  36. Susmel, L.; Taylor, D. An Elasto-Plastic Reformulation of the Theory of Critical Distances to Estimate Lifetime of Notched Components Failing in the Low/Medium-Cycle Fatigue Regime. J. Eng. Mater. Technol. 2010, 132, 021002. [Google Scholar] [CrossRef]
Figure 1. Definition of the point method (PM) methodology. Stress (σ1)-distance from the notch tip (r) curves due to two different notches in fracture analysis.
Metals 09 00570 g001
Figure 2. Microstructure of: (a) X80 steel; (b) S420 steel.
Metals 09 00570 g002
Figure 3. Cathodic polarization employed in this work.
Metals 09 00570 g003
Figure 4. Experimental setup.
Metals 09 00570 g004
Figure 5. Geometry of the tested specimens (dimensions in mm).
Metals 09 00570 g005
Figure 6. Manual partitioning and mesh employed in the FEA.
Metals 09 00570 g006
Figure 7. Examples of Load-COD curves (X80 steel, ρ = 0.00 mm and ρ = 2.00 mm).
Metals 09 00570 g007
Figure 8. Stress-distance curves at crack initiation in X80 steel at 5 mA/cm2 of cathodic polarization [20].
Metals 09 00570 g008
Figure 9. Stress-distance curves at crack initiation in X80 steel at 1 mA/cm2 of cathodic polarization.
Metals 09 00570 g009
Figure 10. Stress-distance curves at crack initiation in S420 steel at 5 mA/cm2 of cathodic polarization [20].
Metals 09 00570 g010
Figure 11. Stress-distance curves at crack initiation in S420 steel at 1 mA/cm2 of cathodic polarization.
Metals 09 00570 g011
Figure 12. Predictions in X80 steel at 5 mA/cm2: (a) PM; (b) line method (LM).
Metals 09 00570 g012
Figure 13. Predictions in X80 steel at 1 mA/cm2: (a) PM; (b) LM.
Metals 09 00570 g013
Figure 14. Predictions in S420 steel at 5 mA/cm2: (a) PM; (b) LM.
Metals 09 00570 g014
Figure 15. Predictions in S420 steel at 1 mA/cm2: (a) PM; (b) LM.
Metals 09 00570 g015
Table 1. Mechanical properties of the materials being analyzed.
MaterialE (GPa) σy (MPa)σu (MPa)eu (%)
S420206.4447.7547.121.7
0209.9621.3692.929.6
Table 2. Chemical composition of the two steels being analyzed.
MaterialCSiSPMnNiCrMoCuAlVTiNb
S4200.080.280.0010.0121.440.030.020.0030.0150.0360.0050.0150.031
X800.070.18<0.005<0.0051.830.03-0.150.020.03--0.03
Table 3. Experimental program.
MaterialDisplacement Rate (m/s)Cathodic Polarization (mA/cm2)ρ (mm)Number of Tests
X806·10−85 [20]0.002
0.252
0.502
1.002
2.002
10.002
0.252
0.502
1.002
2.002
S4206·10−85 [20]0.002
0.252
0.502
1.002
2.002
10.002
0.252
0.502
1.002
2.002
Table 4. Summary of the experimental results analyzed in this paper.
MaterialSpecimenCathodic Polarization (mA/cm2)ρ (mm)PQ (kN)KNIEAC (MPa·m0.5)
X80X80-5-15 [20]0.0027.8667.42
X80-5-223.1253.16
X80-5-30.2534.4163.21
X80-5-434.8564.01
X80-5-50.5038.2670.28
X80-5-642.7578.52
X80-5-71.0044.5081.74
X80-5-842.9378.87
X80-5-92.0056.24103.31
X80-5-1054.2099.59
X80-1-110.0024.3060.00
X80-1-224.3254.40
X80-1-30.2530.7056.40
X80-1-433.9362.33
X80-1-50.5033.5361.58
X80-1-636.2566.59
X80-1-71.0037.9069.62
X80-1-841.4976.21
X80-1-92.0051.2494.12
X80-1-1048.4889.05
S420S420-5-15 [20]0.0028.7667.58
S420-5-224.0161.25
S420-5-30.2534.7063.74
S420-5-433.9462.34
S420-5-50.5037.0968.13
S420-5-634.2162.84
S420-5-71.0041.0975.48
S420-5-840.4974.37
S420-5-92.0045.4583.49
S420-5-1045.6783.89
S420-1-110.0024.8962.17
S420-1-224.6561.61
S420-1-30.2539.3672.31
S420-1-436.5767.17
S420-1-50.5041.2175.70
S420-1-639.6872.90
S420-1-71.0044.9482.54
S420-1-843.8680.58
S420-1-92.0047.1386.57
S420-1-1046.6085.60
Table 5. Values of KEAC, LEAC and the best fit of the EAC critical distance depending on the methodology.
MaterialCathodic Polarization (mA/cm2)KIEAC (MPa·m0.5)LEAC (mm)PM LEAC-BF (mm)LM LEAC-BF (mm)
X805 [20]60.290.2860.1940.276
158.370.3180.2080.303
S4205 [20]64.420.4620.3860.776
161.890.4990.2730.441

