Article

Hysteretic Behavior and Ultimate Energy Dissipation Capacity of Large Diameter Bars Made of Shape Memory Alloys under Seismic Loadings

by
Guillermo González-Sanz
,
David Galé-Lamuela
,
David Escolano-Margarit
and
Amadeo Benavent-Climent
*
Department of Mechanical Engineering, Universidad Politécnica de Madrid, 28006 Madrid, Spain
*
Author to whom correspondence should be addressed.
Metals 2019, 9(10), 1099; https://doi.org/10.3390/met9101099
Submission received: 24 September 2019 / Revised: 10 October 2019 / Accepted: 12 October 2019 / Published: 13 October 2019
(This article belongs to the Special Issue Shape Memory Alloys 2020)

Abstract

:
Shape memory alloys in the form of bars are increasingly used to control structures under seismic loadings. This study investigates the hysteretic behavior and the ultimate energy dissipation capacity of large-diameter NiTi bars subjected to low- and high-cycle fatigue. Several specimens are subjected to quasi-static and to dynamic cyclic loading at different frequencies. The influence of the rate of loading on the shape of the hysteresis loops is analysed in terms of the amount of dissipated energy, equivalent viscous damping, variations of the loading/unloading stresses, and residual deformations. It is found that the log-log scale shows a linear relationship between the number of cycles to failure and the normalized amount of energy dissipated in one cycle, both for low- and for high-cycle fatigue. Based on the experimental results, a numerical model is proposed that consists of two springs with different restoring force characteristics (flag-shape and elastic-perfectly plastic) connected in series. The model can be used to characterize the hysteretic behavior of NiTi bars used as energy dissipation devices in advanced earthquake resistant structures. The model is validated with shake table tests conducted on a reinforced concrete structure equipped with 12.7 mm diameter NiTi bars as energy dissipation devices.

Graphical Abstract

1. Introduction

Earthquakes cause heavy casualties and property damage worth billions. Designing structures to withstand the vibrations induced by seismic actions is of primary concern. The conventional seismic design approach relies on the ability of a structure to dissipate the energy input by the earthquake through inelastic deformations in special regions of the structure (e.g., column bases and beam-ends in frame structures). This conventional approach accepts heavy damage (or the need for possible demolition) on the structure after a severe earthquake. To overcome this drawback and improve overall performance, an important research effort in the last two decades has been devoted to the development of innovative structures with passive control systems. This type of structure features special members called energy dissipation devices that are designed to dissipate most of the energy input by the earthquake, thus minimizing or avoiding damage to the main structure. Among the different types of energy dissipation devices developed in the past, those based on the use of shape memory alloys (SMAs) are particularly appealing because, in addition to dissipating energy, they are able to regain their original shape after being deformed well beyond 6–8% strain [1,2,3,4,5,6,7,8]. This ability is a result of a phase transformation that may be induced by either stress or a temperature change. SMAs have a crystal structure with two main phase transformations: the martensite and the austenite. Under high stresses detwinned martensite is the stable crystal structure. Twinned martensite may exist as a pure crystal structure under low stress levels. The austenite phase is stable at high temperatures or low stresses. The phase transformation involves four characteristic temperatures: Mf, Ms, As and Af (ordered from lowest to highest). During the forward transformation, under zero load, austenite begins to transform to twinned martensite at the martensitic start temperature Ms. This transformation completes to martensite at the martensitic finish temperature Mf. At this stage, the material is fully in the twinned martensitic phase. During heating, the reverse transformation initiates at the austenitic start temperature As and the transformation is completed at the austenitic finish temperature Af [9]. Figure 1 shows a typical phase diagram and stress-strain-temperature curve of a NiTi SMA [10].
The key advantage of this solid-solid transformation is the reversibility of the process and the complete recovery of strain. In most civil engineering applications, SMAs are used at temperatures above Af, with the material in its austenite phase. When sufficiently high stress is applied to the material in the austenite phase, the SMA transforms into so-called “detwinned” martensite. When the load is released, a reverse transformation to the austenite state occurs, resulting in nearly complete shape recovery and a substantial hysteretic loop. The shape recovery is known as the superelastic effect, and it provides the structures equipped with SMAs with recentering properties. The hysteretic loop is a source of energy dissipation. The mechanical behavior of superelastic SMAs fits perfectly with the requirements of a seismic control device [2]. The main benefits can be summarized as follows: (i) reduction or even nullification of the residual deformation on the main structure after the earthquake due to the self-centering property, (ii) increase in the energy dissipation capacity of the overall structure, (iii) limitation of the forces imparted to the main structure because of the stress plateau present in strain levels up to 6–8%, (iv) reduction of lateral displacements and, as a result, limitation of the P-Δ effects, and (v) excellent resistance to corrosion and high-cycle resistance. The P-Δ the effect is a destabilizing moment that takes place when the structure deforms laterally (e.g., due to earthquake or wind loads), which equals the force of the gravity loads multiplied by the horizontal displacement of the structure. The most commonly used SMAs are those based on nickel-titanium- (NiTi) and copper- (Cu) based alloys [2,3,7]. For engineering applications, the almost equiatomic system of NiTi alloys is found to be the best combination, owing to their temperature variation stability and higher resistance to corrosion and fatigue [1,3].
Figure 2 shows the typical stress-strain relationship of a bar made of SMA subjected to a cycle of forced displacements at constant temperature, together with several parameters that characterize its mechanical behavior [3,4]: residual strain εR, loading transformation stresses at start σLs and finish σLf of the phase, unloading transformation stresses at start σULs and finish σULf of the phase, initial elastic modulus EA, loading phase transformation elastic modulus EA-M, unloading phase transformation elastic modulus EM-A, and modulus in the full martensite phase EM. The shaded area in Figure 2 represents the energy dissipated in one loop of hysteresis ED. To determine σLs, σLf, σULs, and σULf, five lines tangent to the relevant parts of the ε-σ curve are drawn, as shown with dot lines in Figure 2. The slopes of these lines are EA, EA-M, EM, EM-A, and EA, respectively. σLs, σLf, σULs, and σULf are the ordinates of the intersection points of these lines.
Residual strain is a measure of the recentering capability, and it refers to the strain that the material does not recover when it returns to a zero stress state. The points that define the loading and unloading transformation stresses are not evident because of the nonlinear shape of the hysteresis loops. A simplified approximation is to define the loading transformation stress at the 2% strain from the initial loading cycle [3]. Nevertheless, in order to define the four transformation stress points, a better approximation is to estimate the change of slope on the curve for loading and unloading paths. EA is referred to as the austenite stable phase and it provides valuable information to calculate the initial stiffness of the device. Two additional parameters that characterize the mechanical behavior of bars made of NiTi alloys are the equivalent viscous damping ratio associated with a given cycle ζeq and number of cycles to failure. For a given cycle, ζeq is defined by [11]:
ζ eq = E D 2 π ε max σ max V
where εmax and σmax are the maximum strain and stress, respectively, in the cycle, and V is the volume of the bar. The number of cycles to failure is an indicator of the life of the material.
Past research showed that hysteretic behavior and the superelastic properties of SMAs vary during the cyclic loading. For cycles of constant amplitude and during the first cycles there is a decrease in σLs and σLf, while σULs and σUlf remain approximately constant. This results in a decrease of the energy ED dissipated in the cycle and in the corresponding ζeq. However, the response stabilizes as the number of cycles increases. Under cycles of increasing amplitude, εR remains constant as well as σLs and σLf, whereas σULs and σUlf decrease. Consequently, the hysteresis shape involves greater energy dissipated, resulting in higher equivalent viscous damping. When the loading stress plateau (i.e., the segment with slope EA-M in Figure 2) is overcome (onset of the pure martensite phase), the strain-stress curve exhibits a strain hardening effect [1,2,3,4,5].
The hysteretic behavior and superelastic properties of SMAs are influenced by the size, strain rate, and temperature. As for the size effect, the superelastic properties can be achieved both in bars and in wires, although some studies reveal less residual strain in large diameter bars [4]. Loading transformation stresses are lower in bars than in wires and unloading transformation stress becomes higher in bars. The consequence is a narrower hysteresis shape, with less energy dissipated per cycle for bars in comparison with wires, and a lower equivalent viscous damping. It has been shown that the strain rate effect does not have a remarkable impact on the residual strain εR but does indeed have a significant influence on the shape of the hysteresis loops. Increasing the strain rate results in a vertical displacement (i.e., both loading and unloading transformation stresses increase) and narrowing of the hysteretic loops. The narrowing implies a loss of energy dissipated per cycle. This reduction of dissipated energy, together with the vertical displacement of the loops, reduces the equivalent viscous damping. The reason for this behavior is the self-heating of the material associated with an increasing difficulty to transfer the heat generated between phase transformations at high strain rates [1,2,3].
Most past studies have focused on small diameter wires, and there is little information on large diameter bars, which are more usual in earthquake engineering applications. Past research did not clarify if the strain rate effect varies significantly with size. As for the effect of temperature, it has been shown that the residual strain remains the same for temperatures larger than Af, thus keeping the recentering capability unaffected. However, increasing temperature above Af causes a vertical displacement of the hysteresis loop (i.e., higher loading and unloading transformation stresses), while the energy dissipated per cycle remains almost the same. The vertical displacement of the loops, despite the fact that ED remains unchanged, results in a reduction of ζeq. Finally, regarding the amount of energy that the SMA can dissipate up to failure (ultimate energy dissipation capacity), most studies to date address this issue as a problem of high-cycle fatigue [12]. Yet earthquakes impose on the structures a relatively low number of cycles (in comparison with wind or traffic loads) having high stress levels that involve plastic deformations. These are the two common factors attributed to low-cycle fatigue. Some recent investigations on SMA low-cycle fatigue have been carried out on small diameter wires and micro-tubes [13,14], whose conclusions may not be consistent with large diameter bars. Studies on the ultimate energy dissipation capacity of SMA large diameter bars under low cyclic fatigue are almost inexistent.
This paper presents an experimental study aimed at (i) characterizing the hysteretic behavior and evaluating the ultimate energy dissipation capacity of large diameter bars made of NiTi alloys, and (ii) proposing a simple numerical model that can be easily implemented in a finite element code to perform non-linear time history analyses and obtain the seismic response of structures equipped with devices that use large diameter NiTi bars as a source of energy dissipation. First, the results of quasi-static and dynamic cyclic tests conducted on NiTi bars isolated from the structure are presented. Next, a simple numerical model for characterizing their hysteretic behavior is developed and calibrated with the results of these tests. Finally, the NiTi bars were assembled to form an energy dissipation device that was installed in a reinforced concrete (RC) structure and subjected to seismic simulations in a shake table. The results of the shake table tests were used to validate the numerical model proposed.

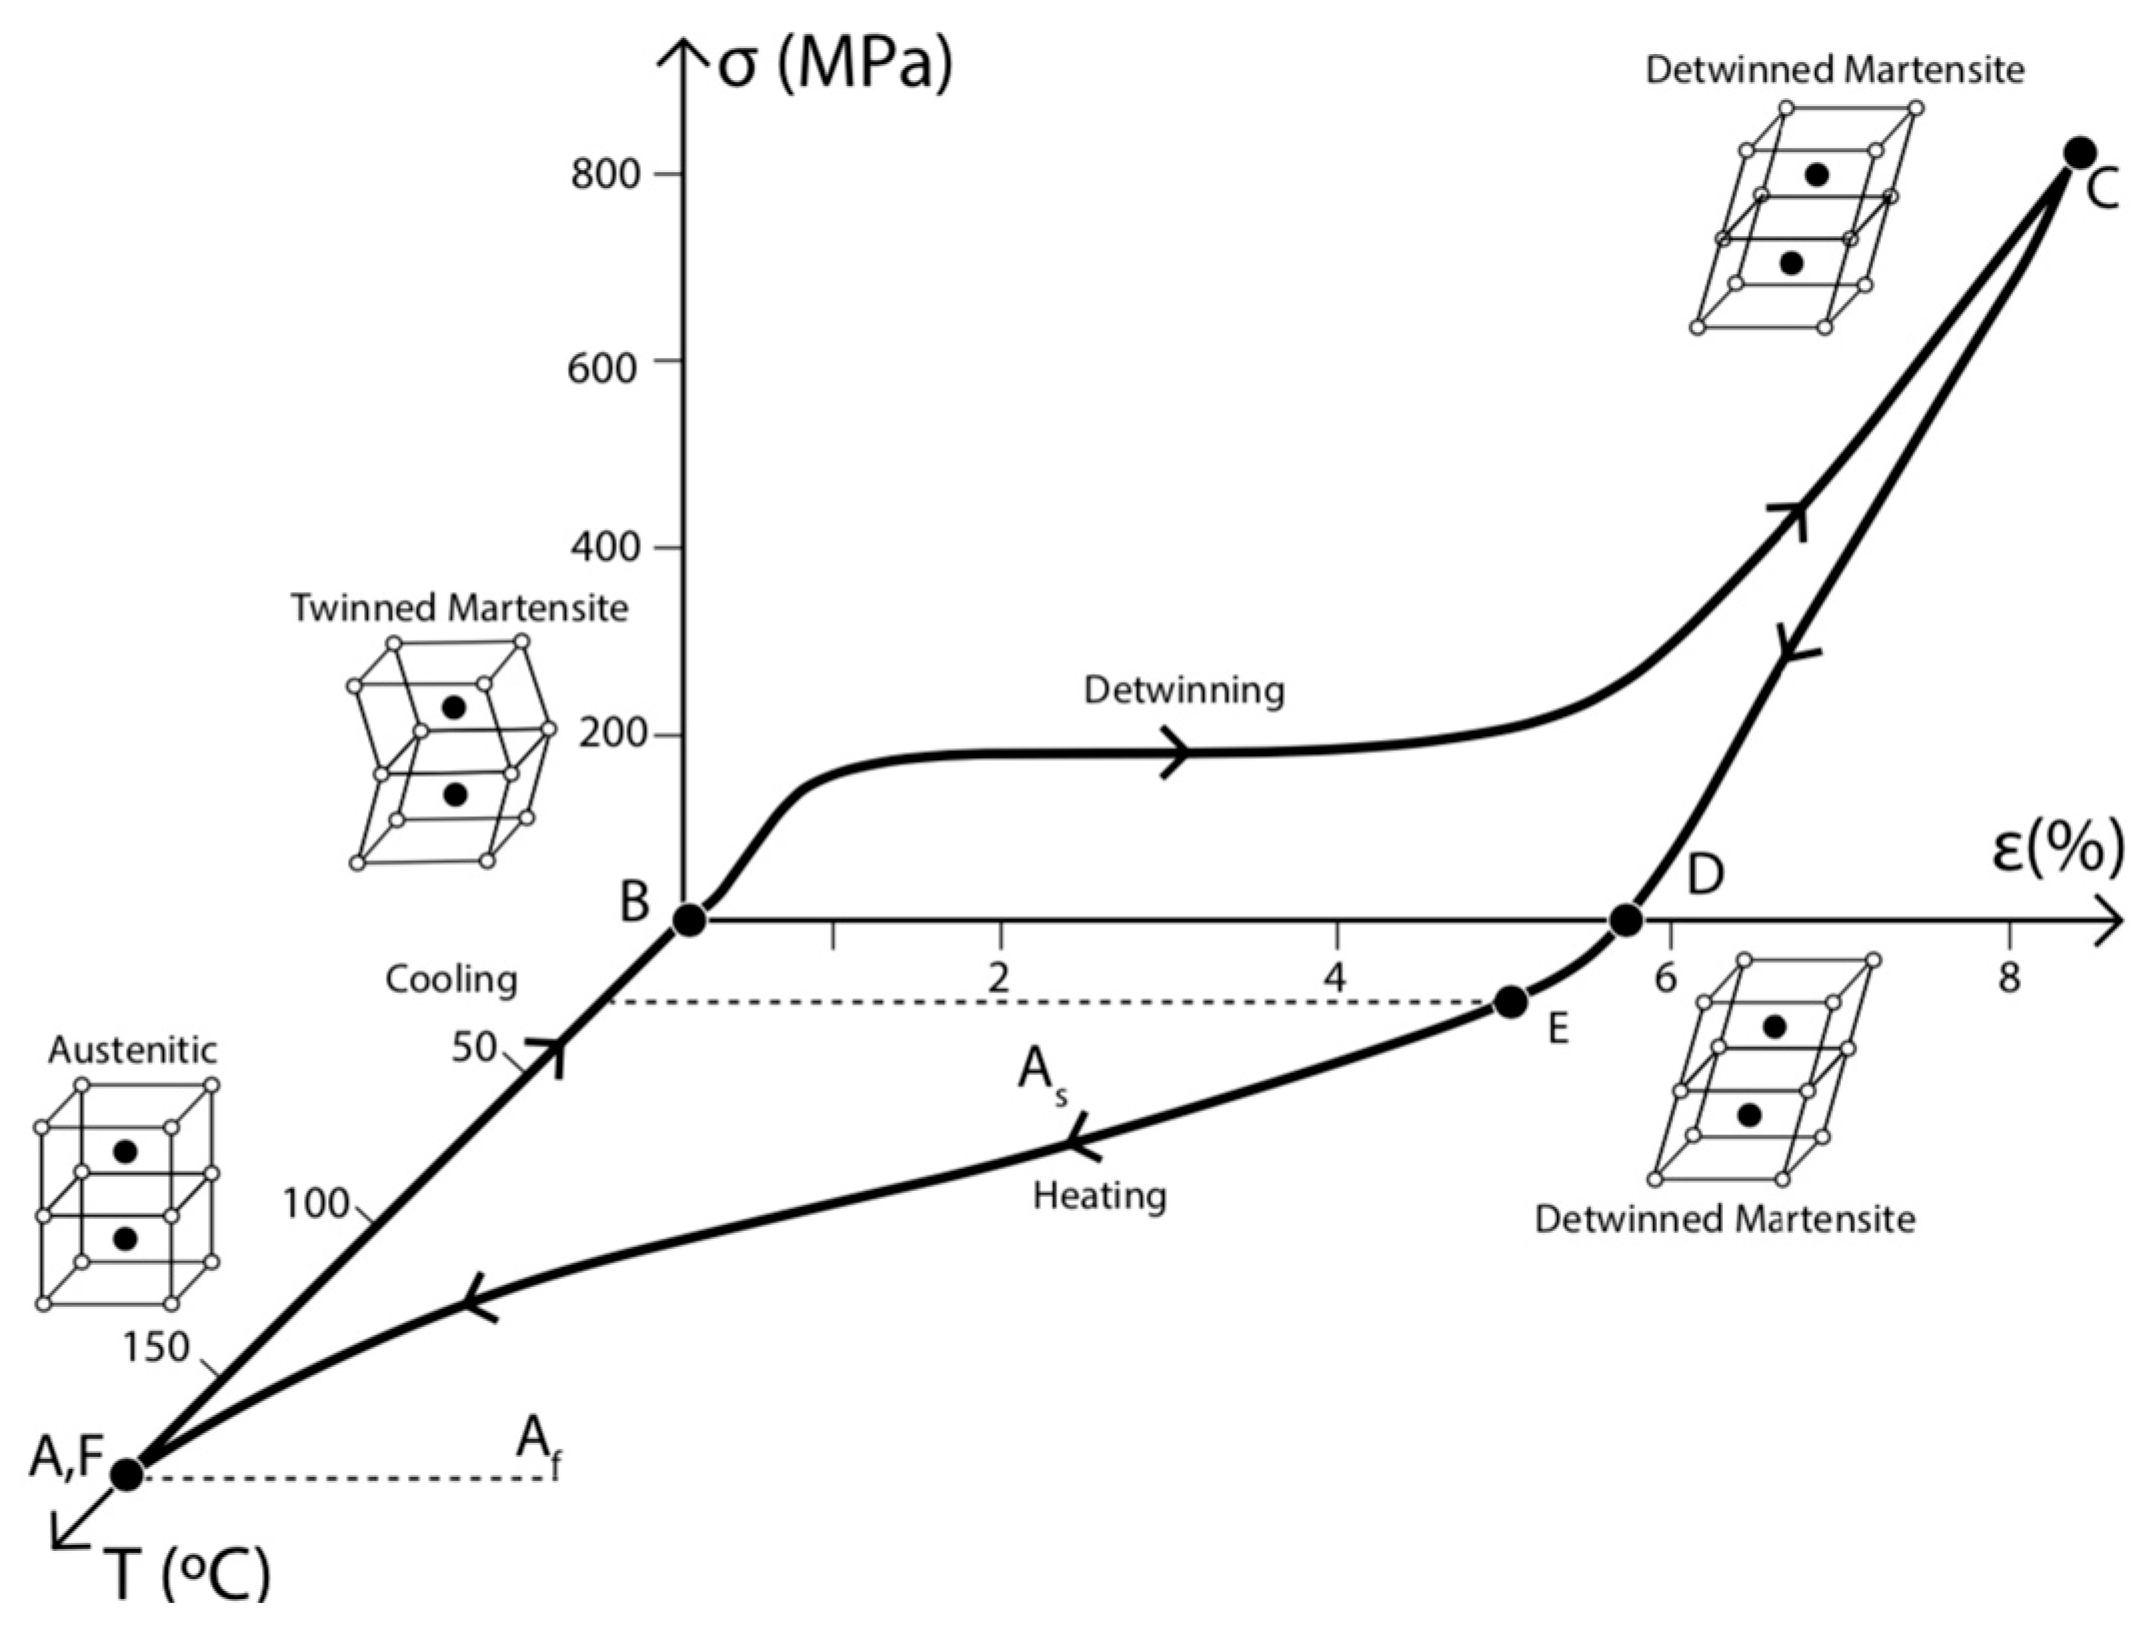
2. Cyclic Tests on NiTi Bars
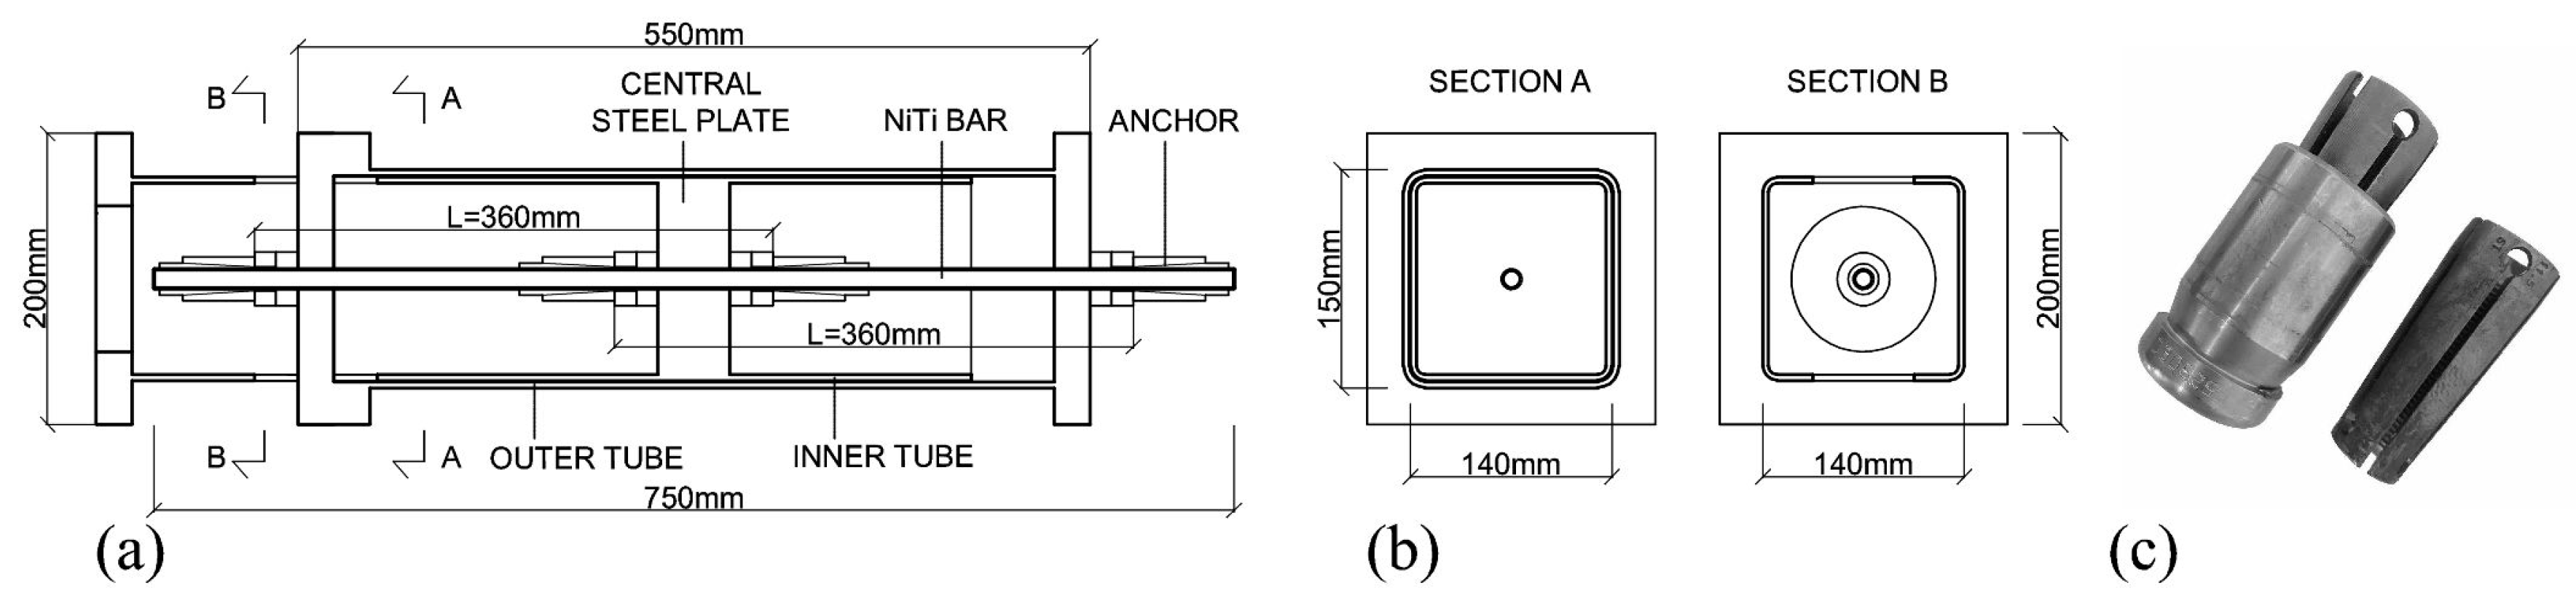
2.1. Test Specimens

Initially, thirteen specimens consisting of cylindrical bars, 12.7 mm in diameter and 750 mm in length, made of SMAs were tested under quasi-static and dynamic cyclic loadings. All the specimens have the same geometry, material composition, and thermo-mechanical processing. The bar was heat treated for superelastic properties. The heat treatment applied guaranteed the superelastic properties at room temperature by full annealment with a reference temperature (As) between −30 and −10 °C. The transition temperatures are Mf = −37.66 °C, Ms = −31.36 °C, As = −16.13 °C and Af = −5.16 °C. Figure 3 shows the results of the (Differential Scanning Calorimetry) DSC experiment. The NiTi bars were manufactured by the company SAES Smart Materials (New Hartford, NY, USA). Unfortunately, no more specific material-related information was available from the manufacturer.

2.2. Loading Set up and Loading Protocol

The authors considered the standard ASTM F20516 (“Standard Test Method for Tension Testing of Nickel-Titanium Superelastic Materials”) and testing protocols used in the literature [1,2,3,4,5]. Herein, the tests conducted at frequencies less than 0.05 Hz are considered as quasi-static and those conducted at frequencies larger than 0.2 Hz as dynamic.

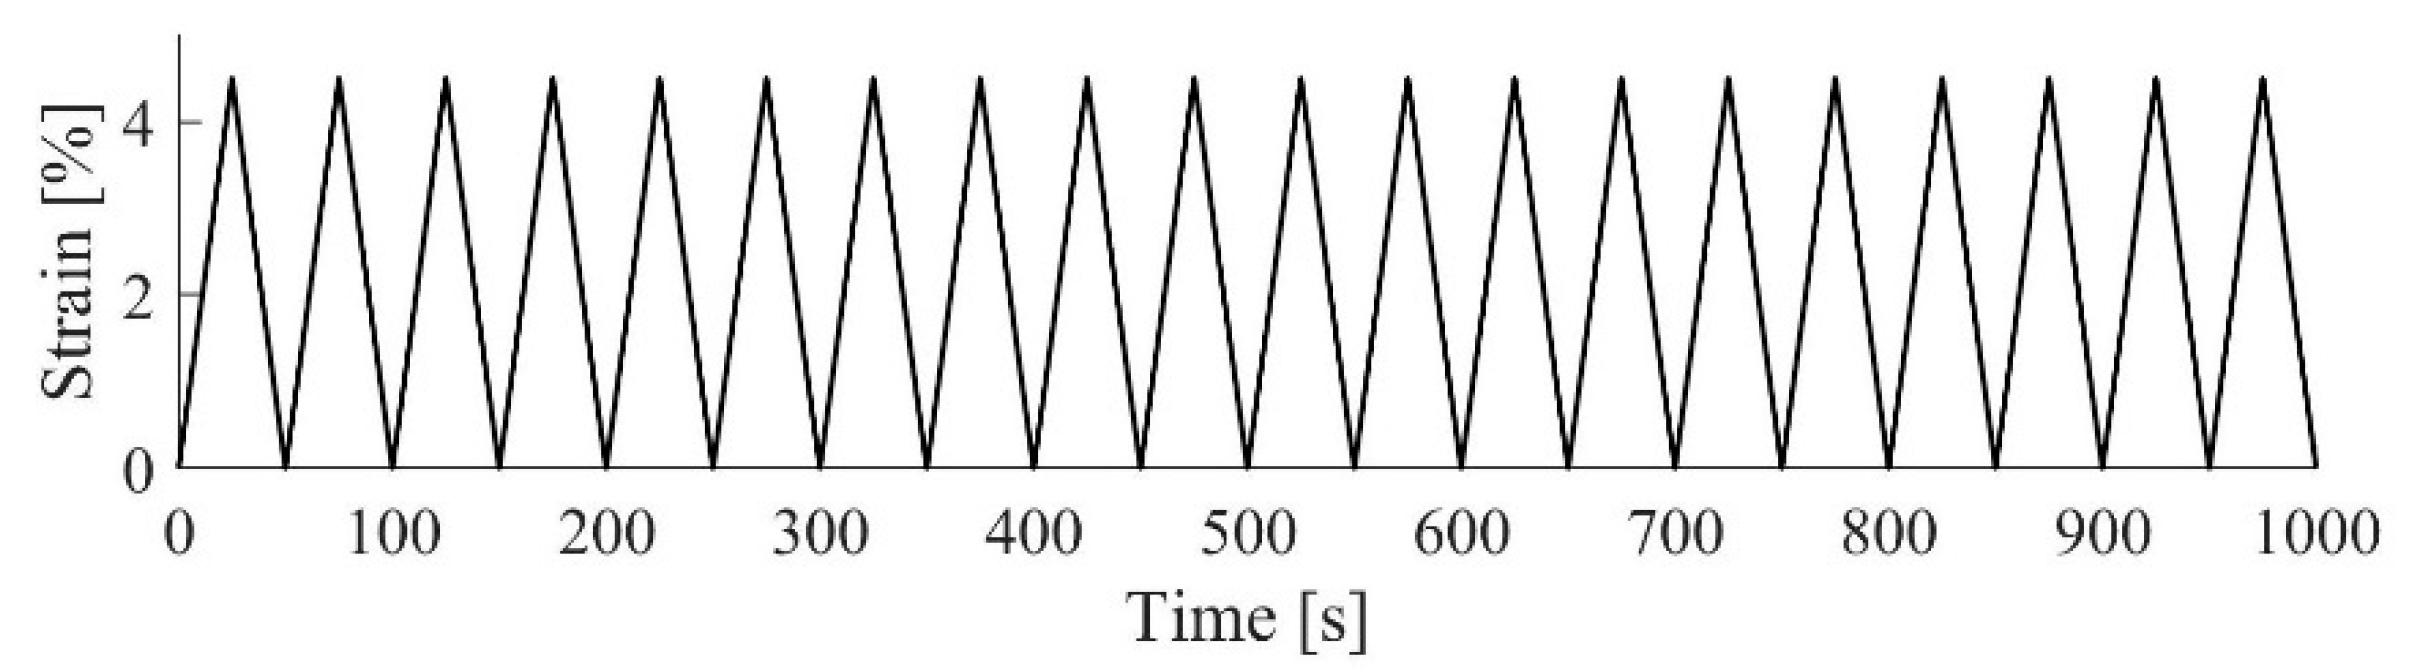
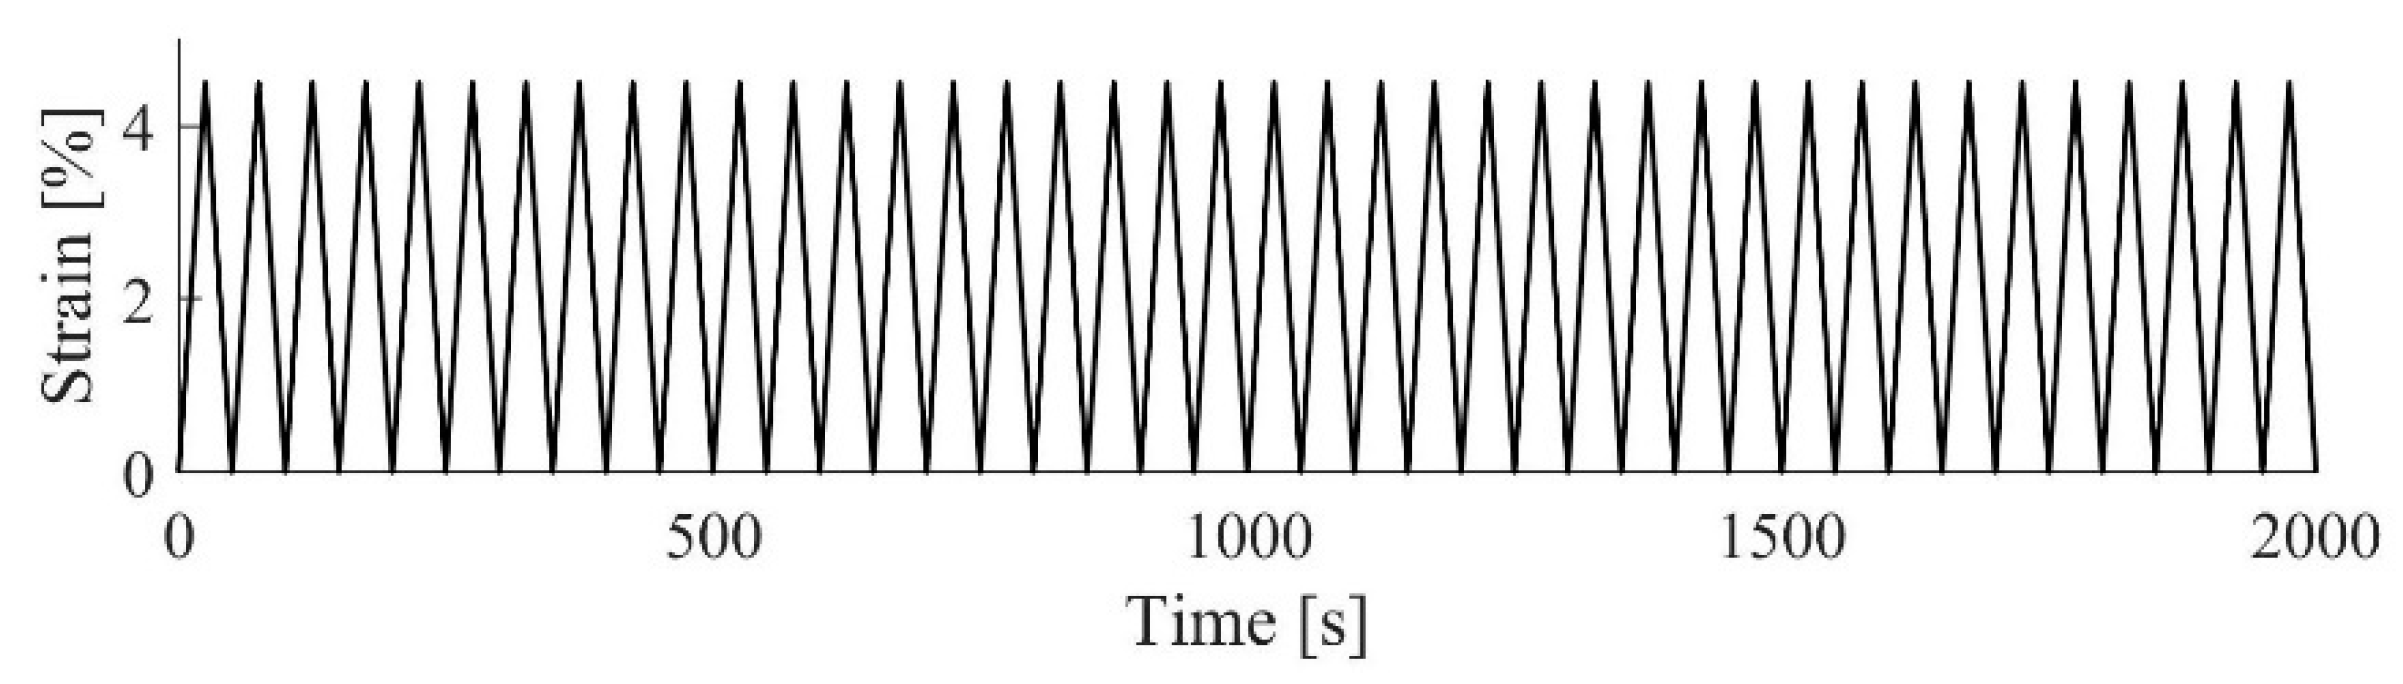
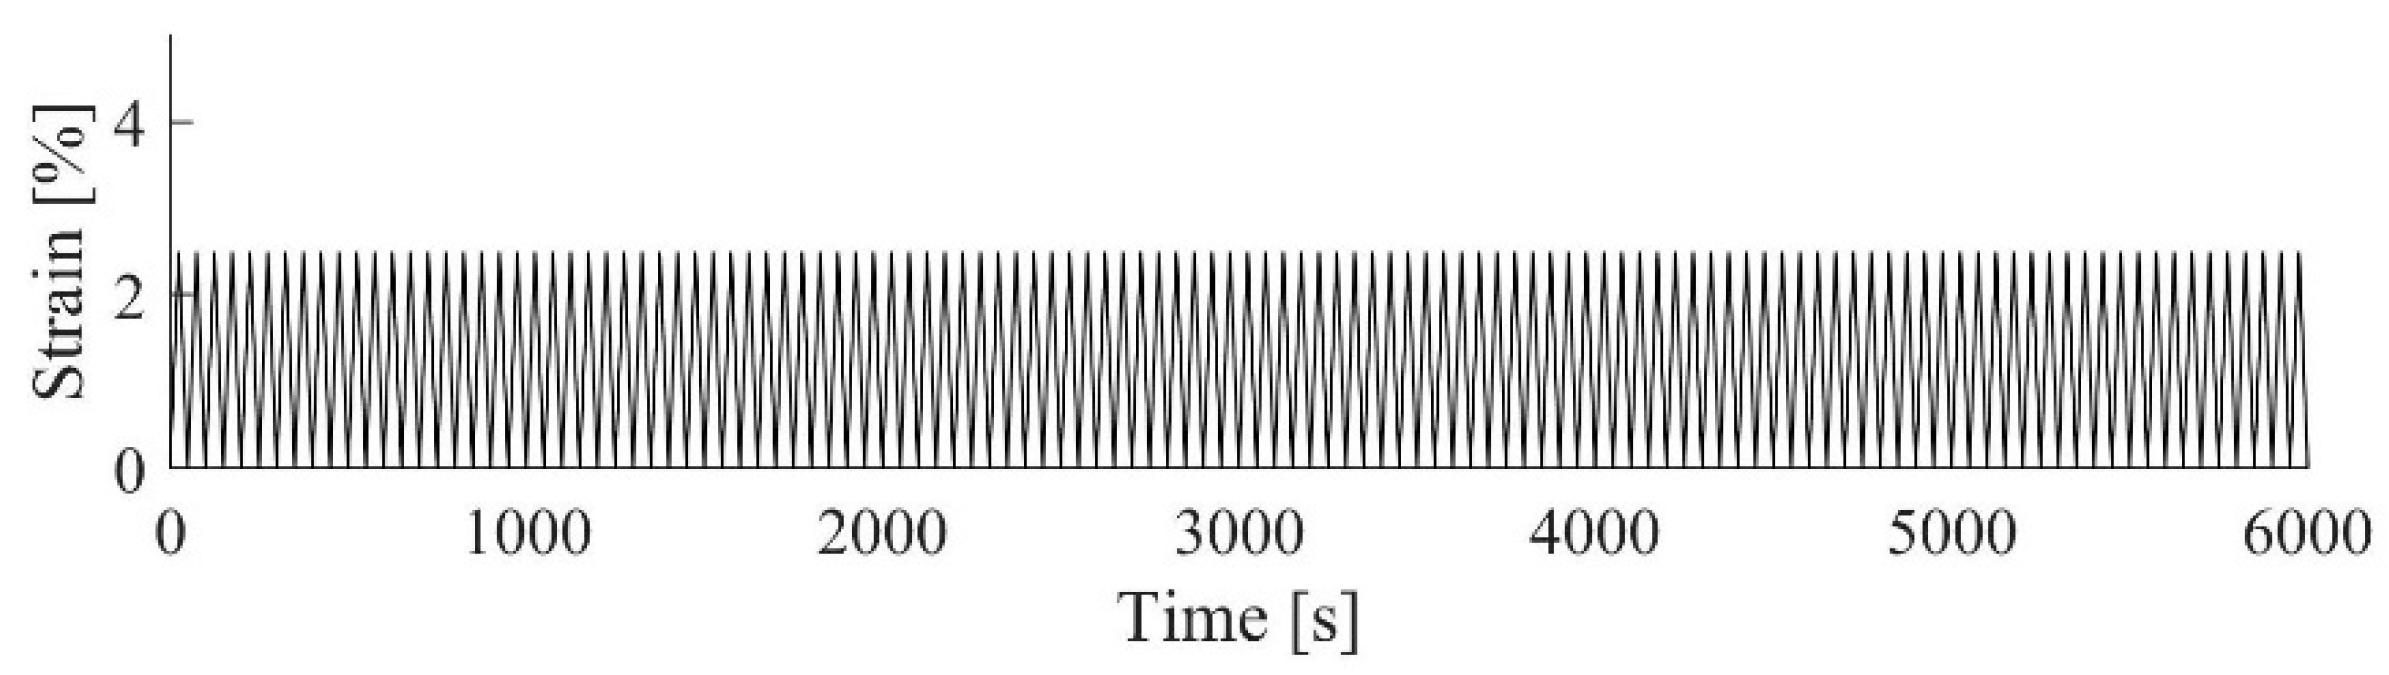
2.2.1. Quasi-Static Cyclic Tests

A total of eleven specimens were tested under quasi-static loads, applying different frequencies and loading patterns, as explained below. Six specimens were subjected to cyclic displacements of constant amplitude at ε = 4.5% with a frequency of 0.02 Hz, following the loading protocol 1 shown in Figure 4. These specimens will be referred to as S11 to S16, where the letter refers to Static, the first sub index identifies the loading protocol, and the second sub index the number of the specimen. The results of the SMA under constant amplitude and low frequency test (protocol 1) were used as “benchmark response”. A relatively large number of specimens were tested with this protocol 1 in order to assess the repeatability of the results, particularity in terms of (i) number of cycles required to stabilize the shape of the hysteresis loops, (ii) the maximum stress attained in the cycle, and (iii) the residual strain. The coefficients of variation (ratio of standard deviation to the mean) obtained for these variables were 0, 0.04 and 0.10, respectively. Two specimens (referred to as S21 to S22) were subjected to cyclic loads following the loading protocol 2 shown in Figure 5, applied at two different frequencies of 0.02 Hz (in specimen S21) and 0.04 Hz (in specimen S22). Two specimens (referred to as S31 and S32) were subjected to cyclic displacements until failure, following the multiple-step loading protocol 3 shown in Figure 6 at a frequency of 0.02 Hz (quasi-static). One specimen (referred to as S41) was subjected to the cyclic displacements until failure following the loading pattern shown in Figure 7 applied at a frequency of 0.02 Hz (quasi-static). All tests were conducted in ambient conditions (20–25 °C) with a universal testing machine, SAXEWAY T1000 (MOOG Inc., East Aurora, NY, USA). The experimental set up involved a pair of transducers for the displacement control plus the internal load cell of the actuator that measured the applied force.

2.2.2. Dynamic Cyclic Tests

Two additional specimens were tested under dynamic loads, following the loading protocol shown in Figure 5 applied at two different frequencies, 0.2 Hz and 1.0 Hz. These specimens will be referred to hereafter as D21 and D22, respectively, where the letter indicates Dynamic. The tests were conducted in ambient conditions (20–25 °C) with an INSTRON 8803 fatigue testing system (INSTRON, Norwood, MA, USA).

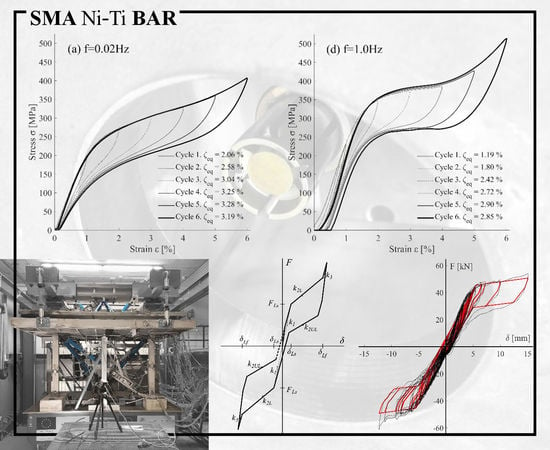
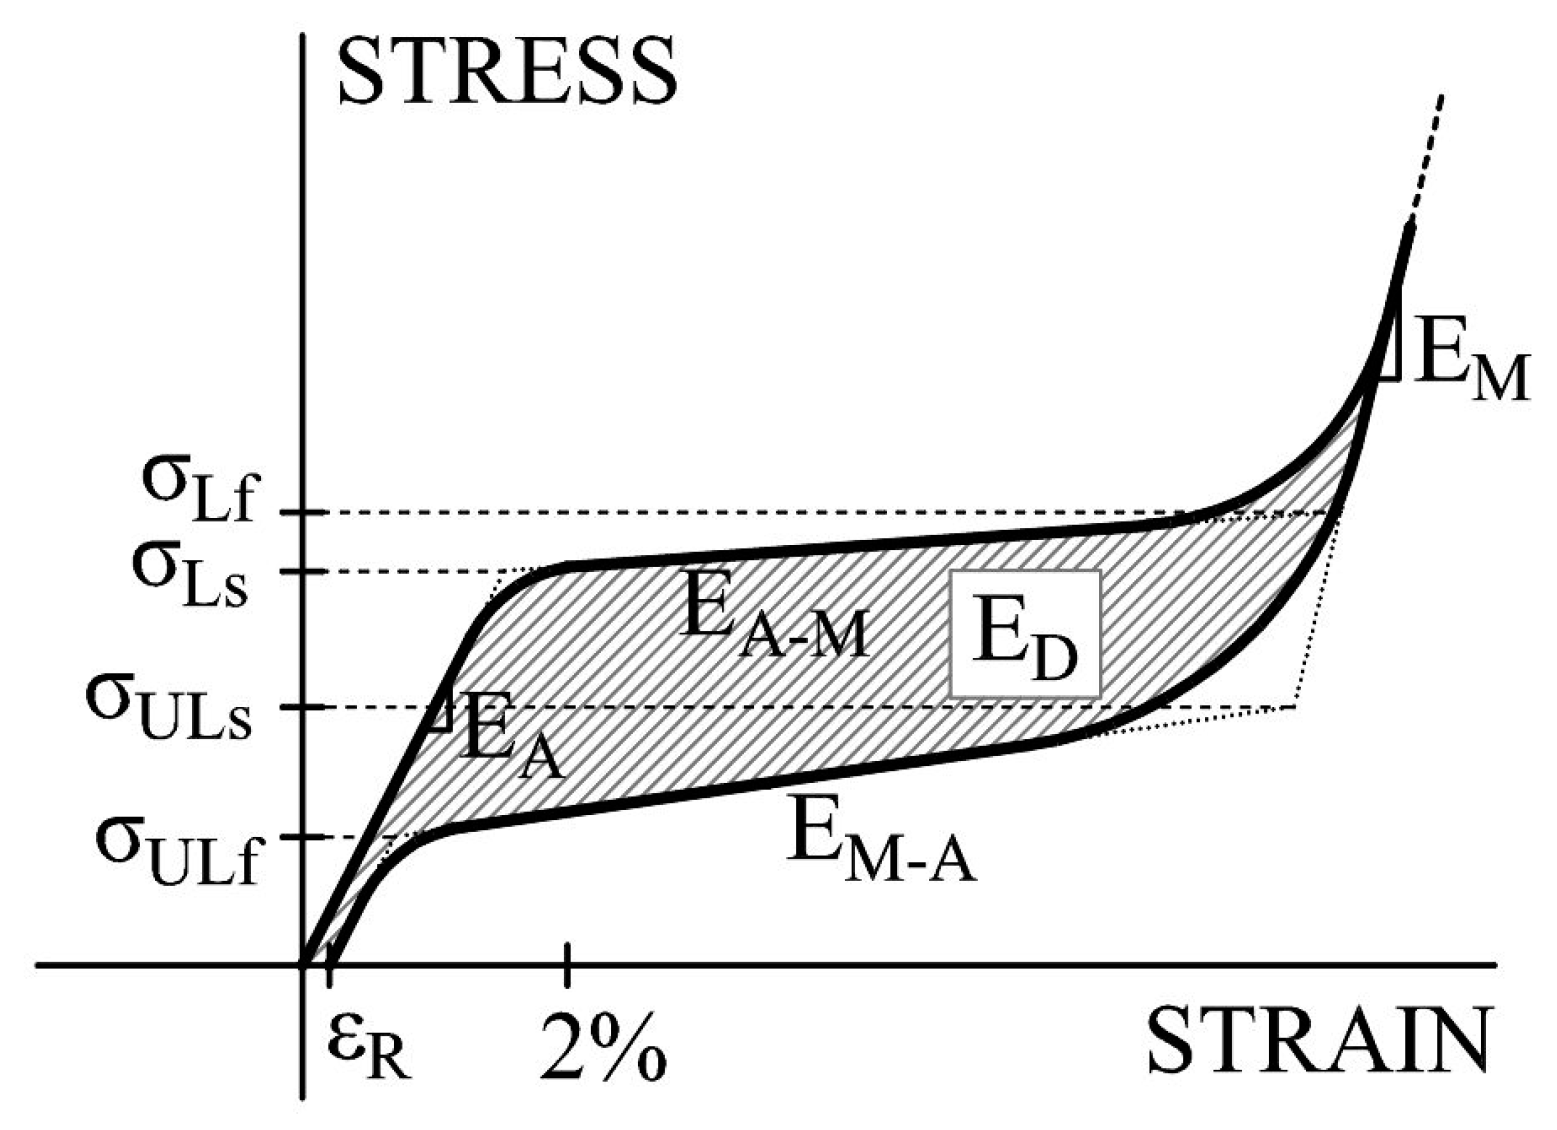
2.3. Test Results and Discussion

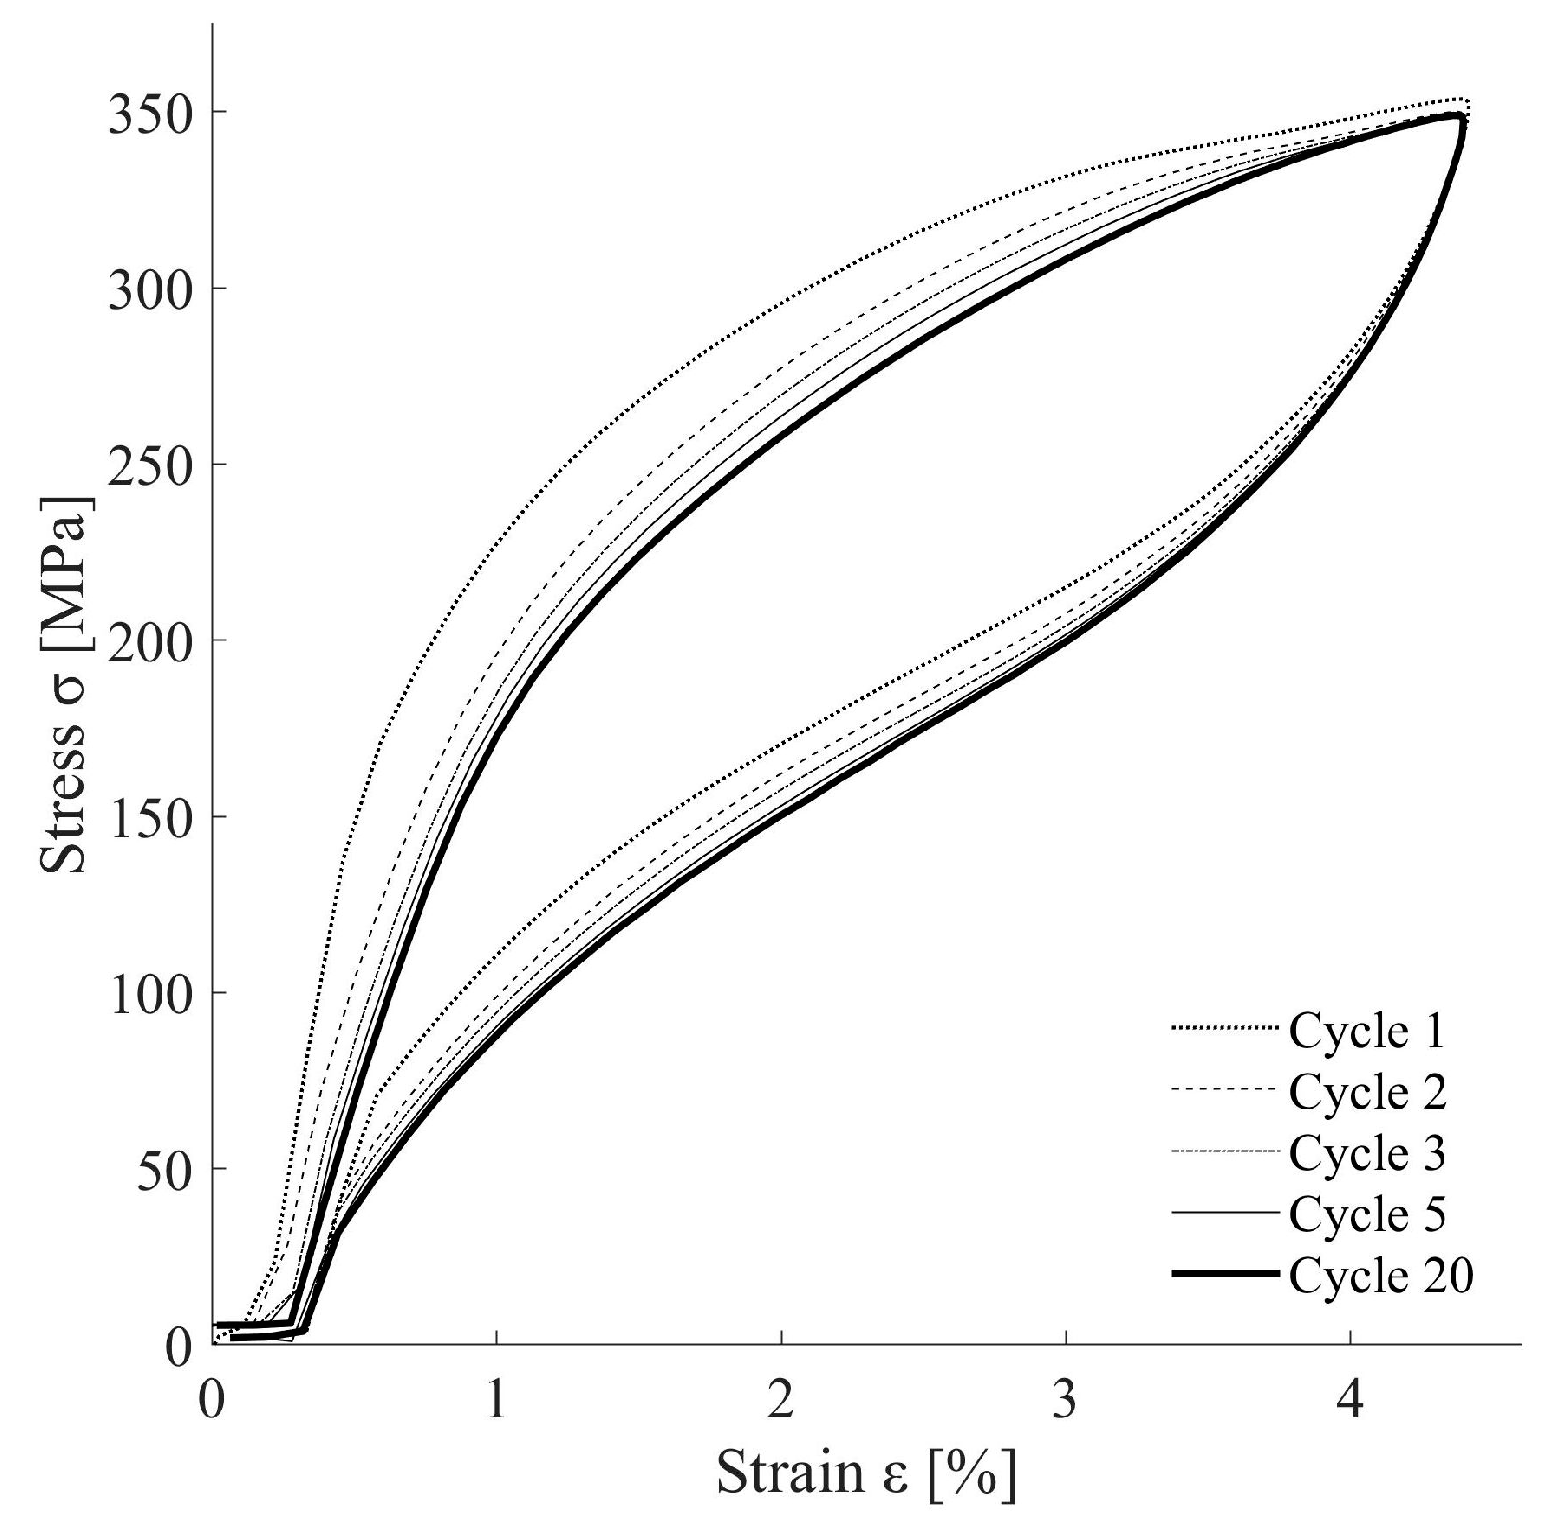
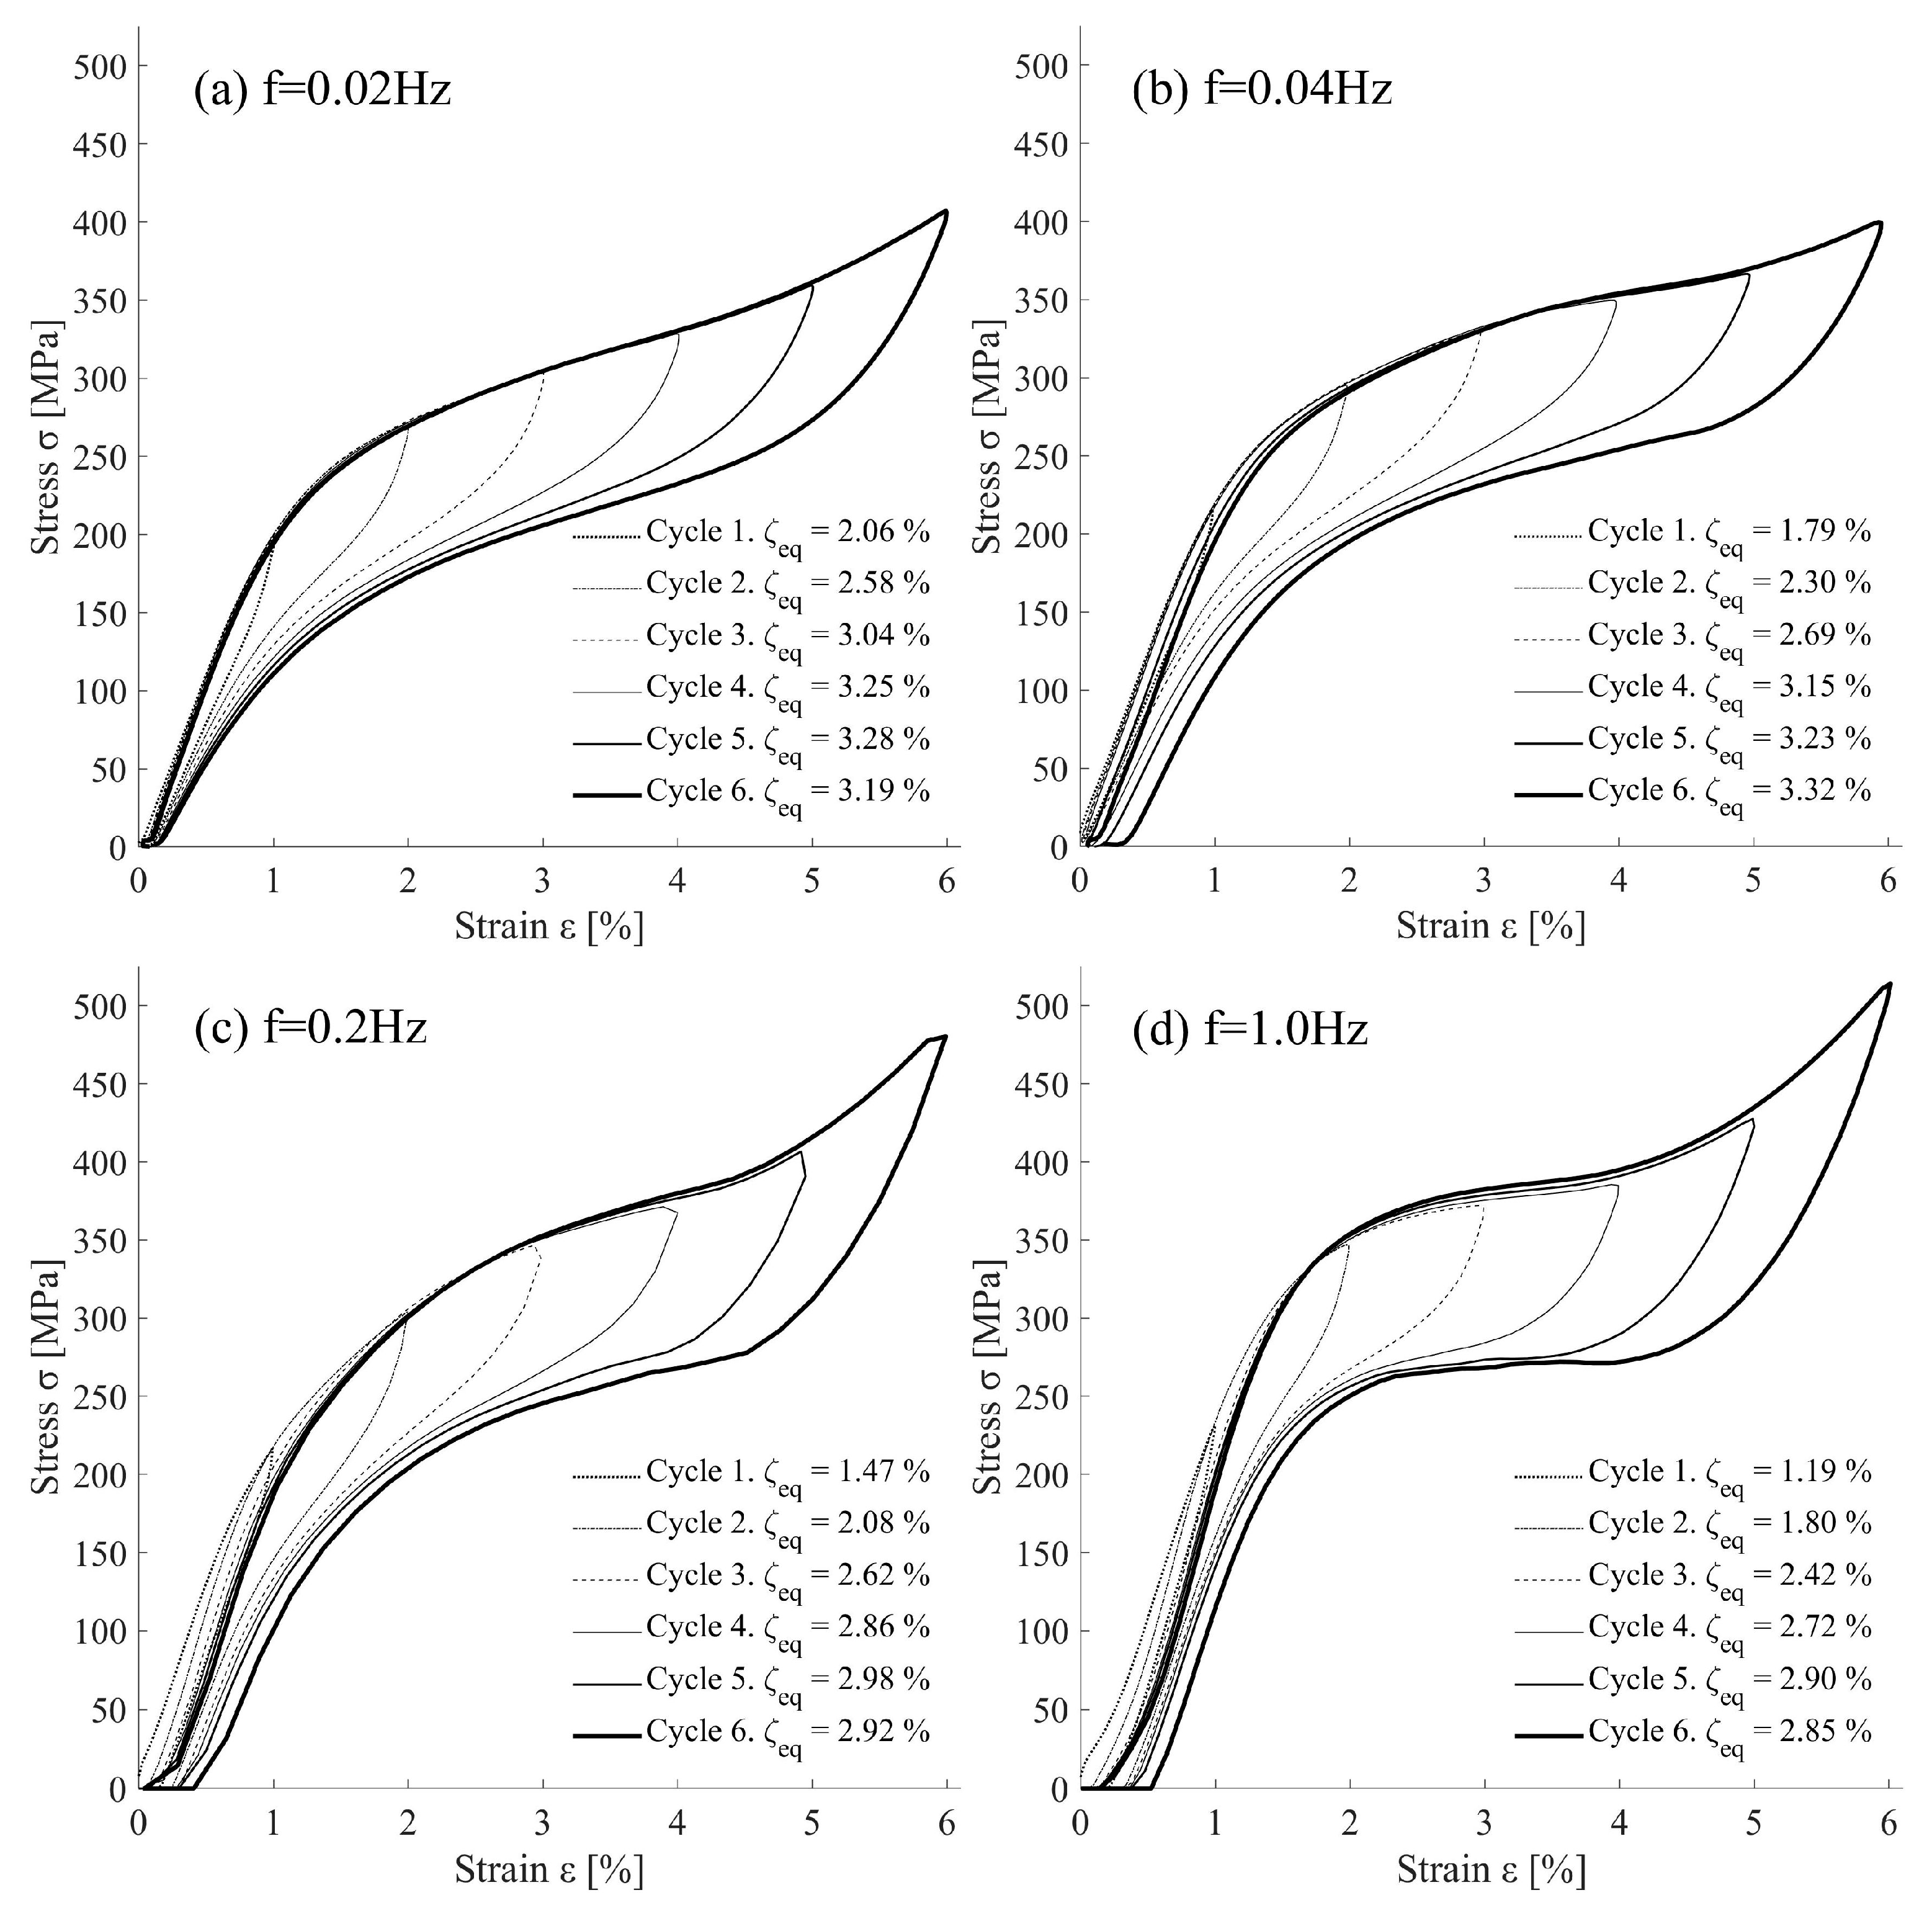
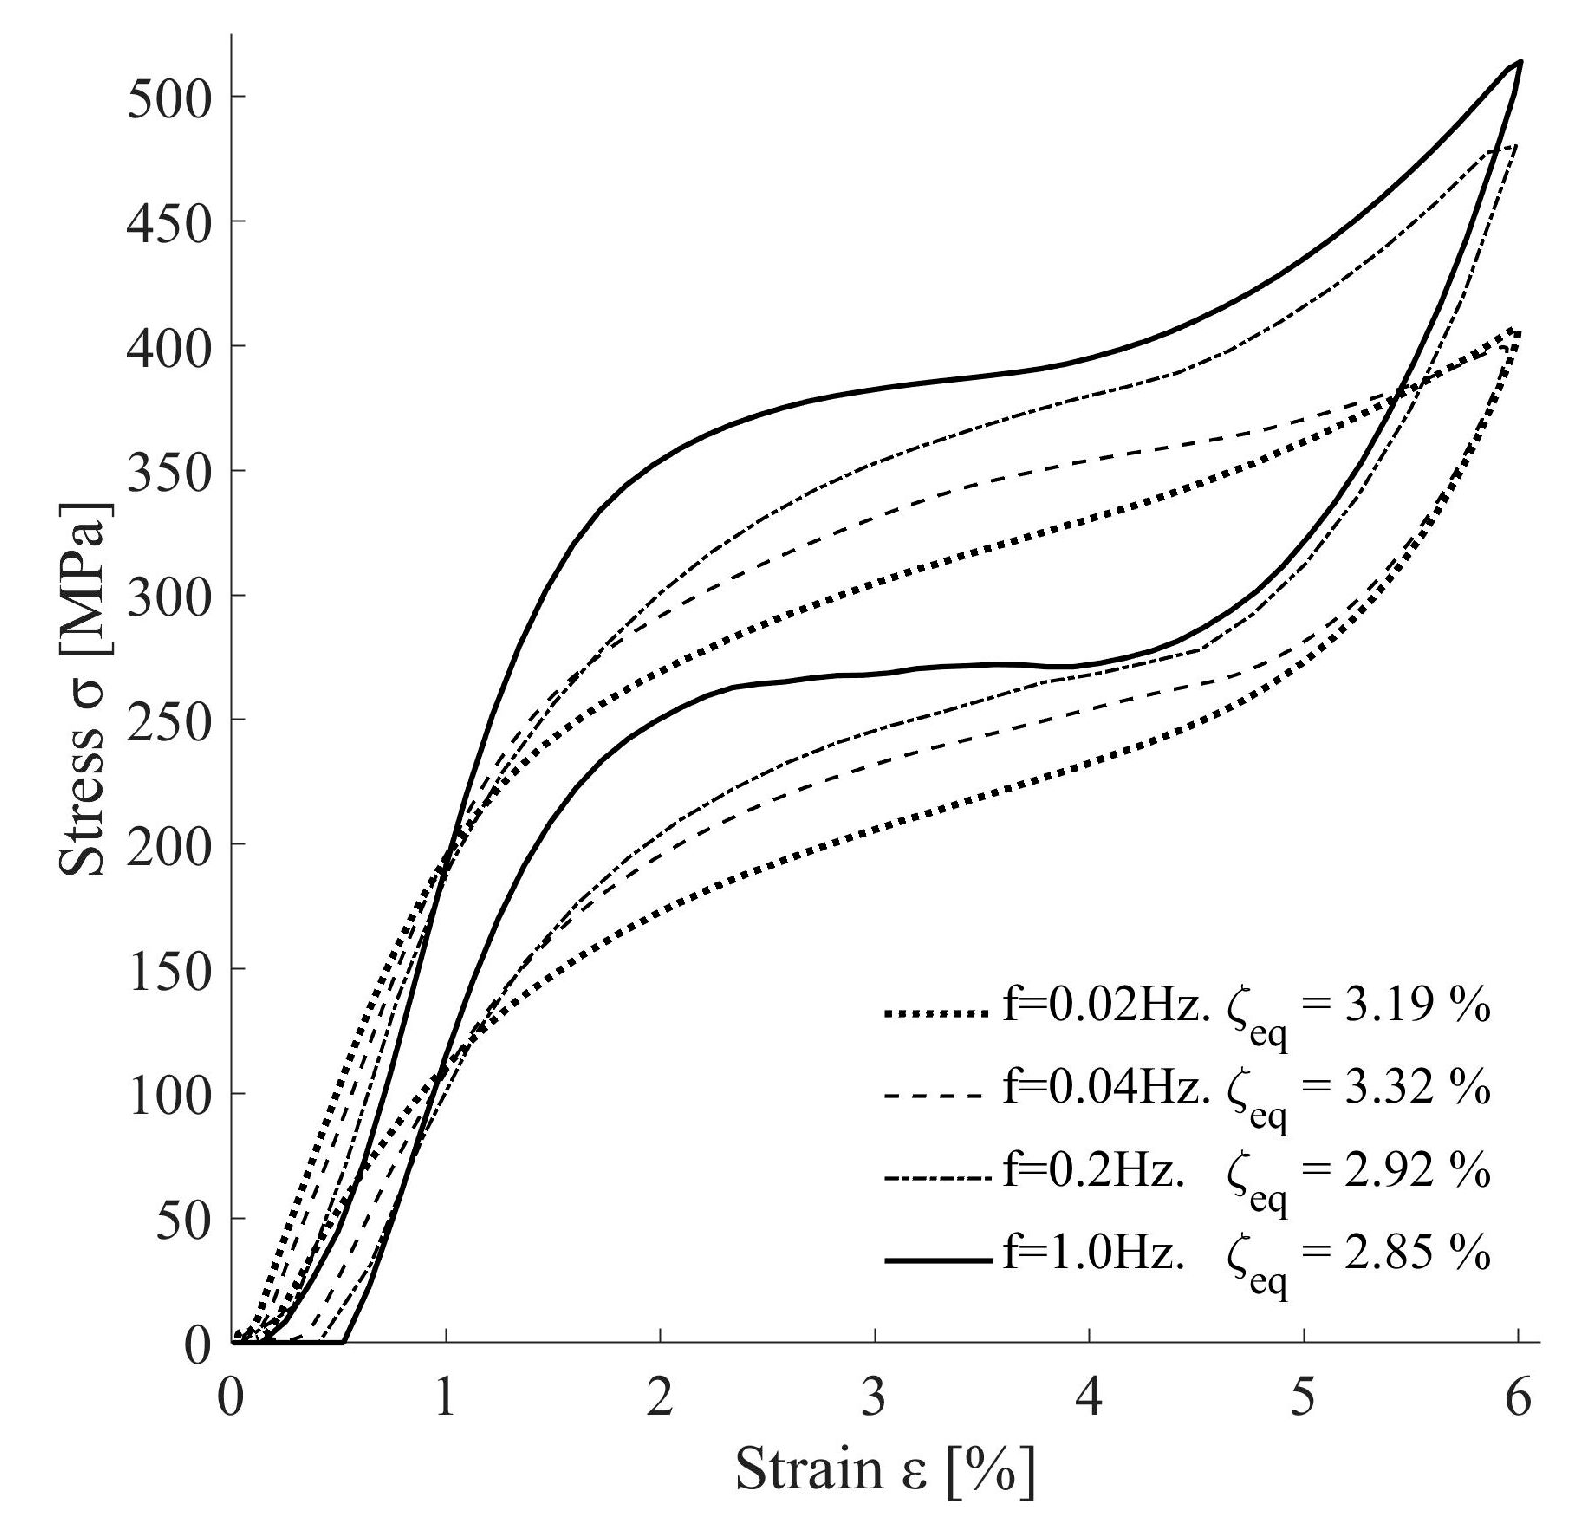
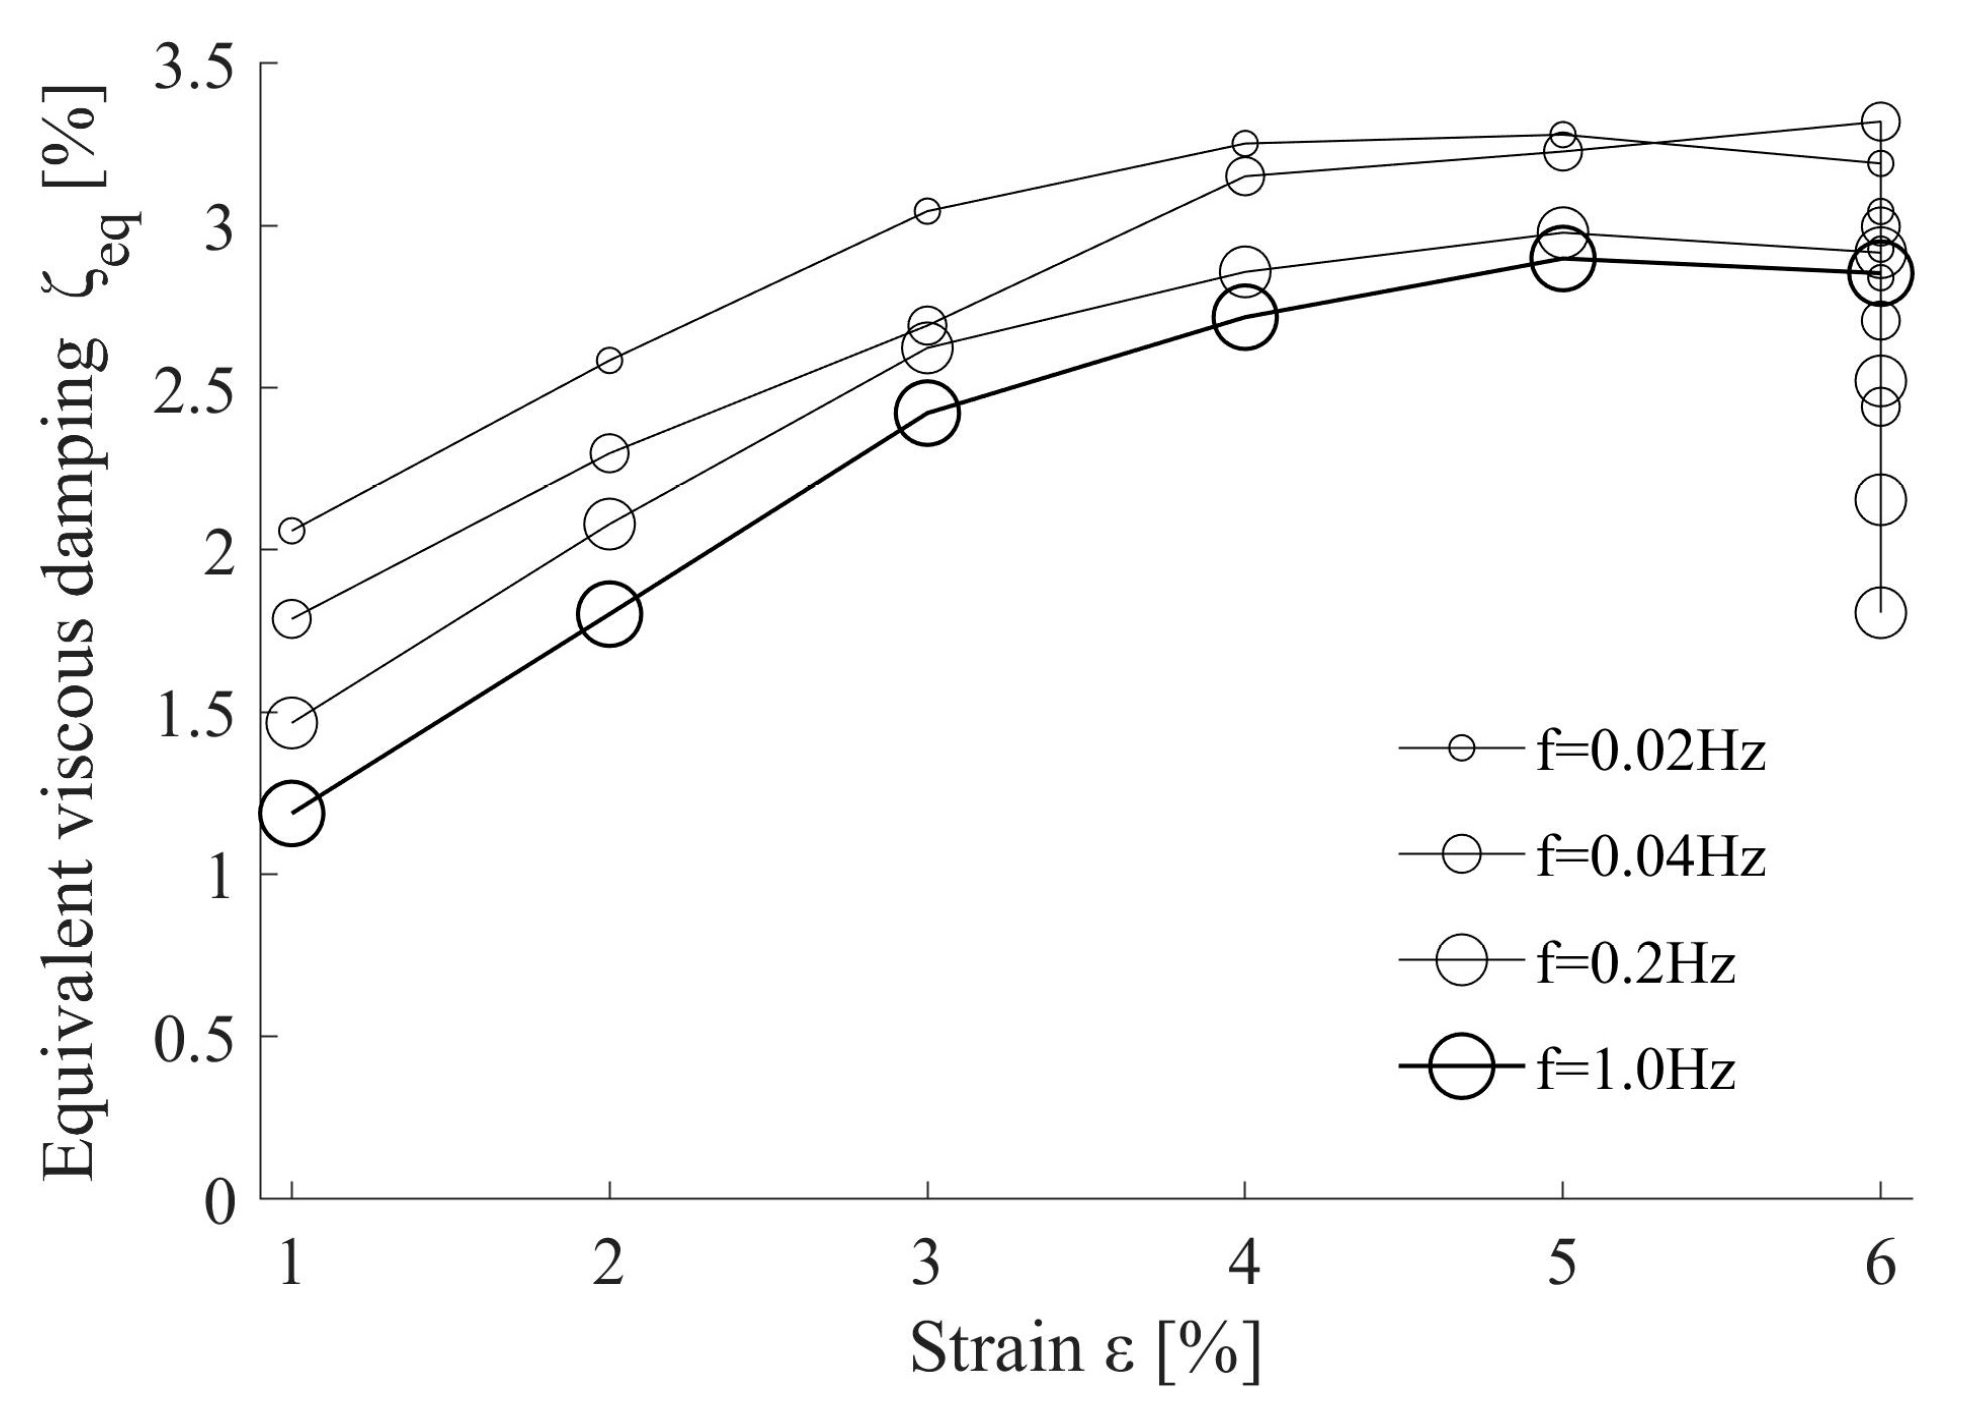
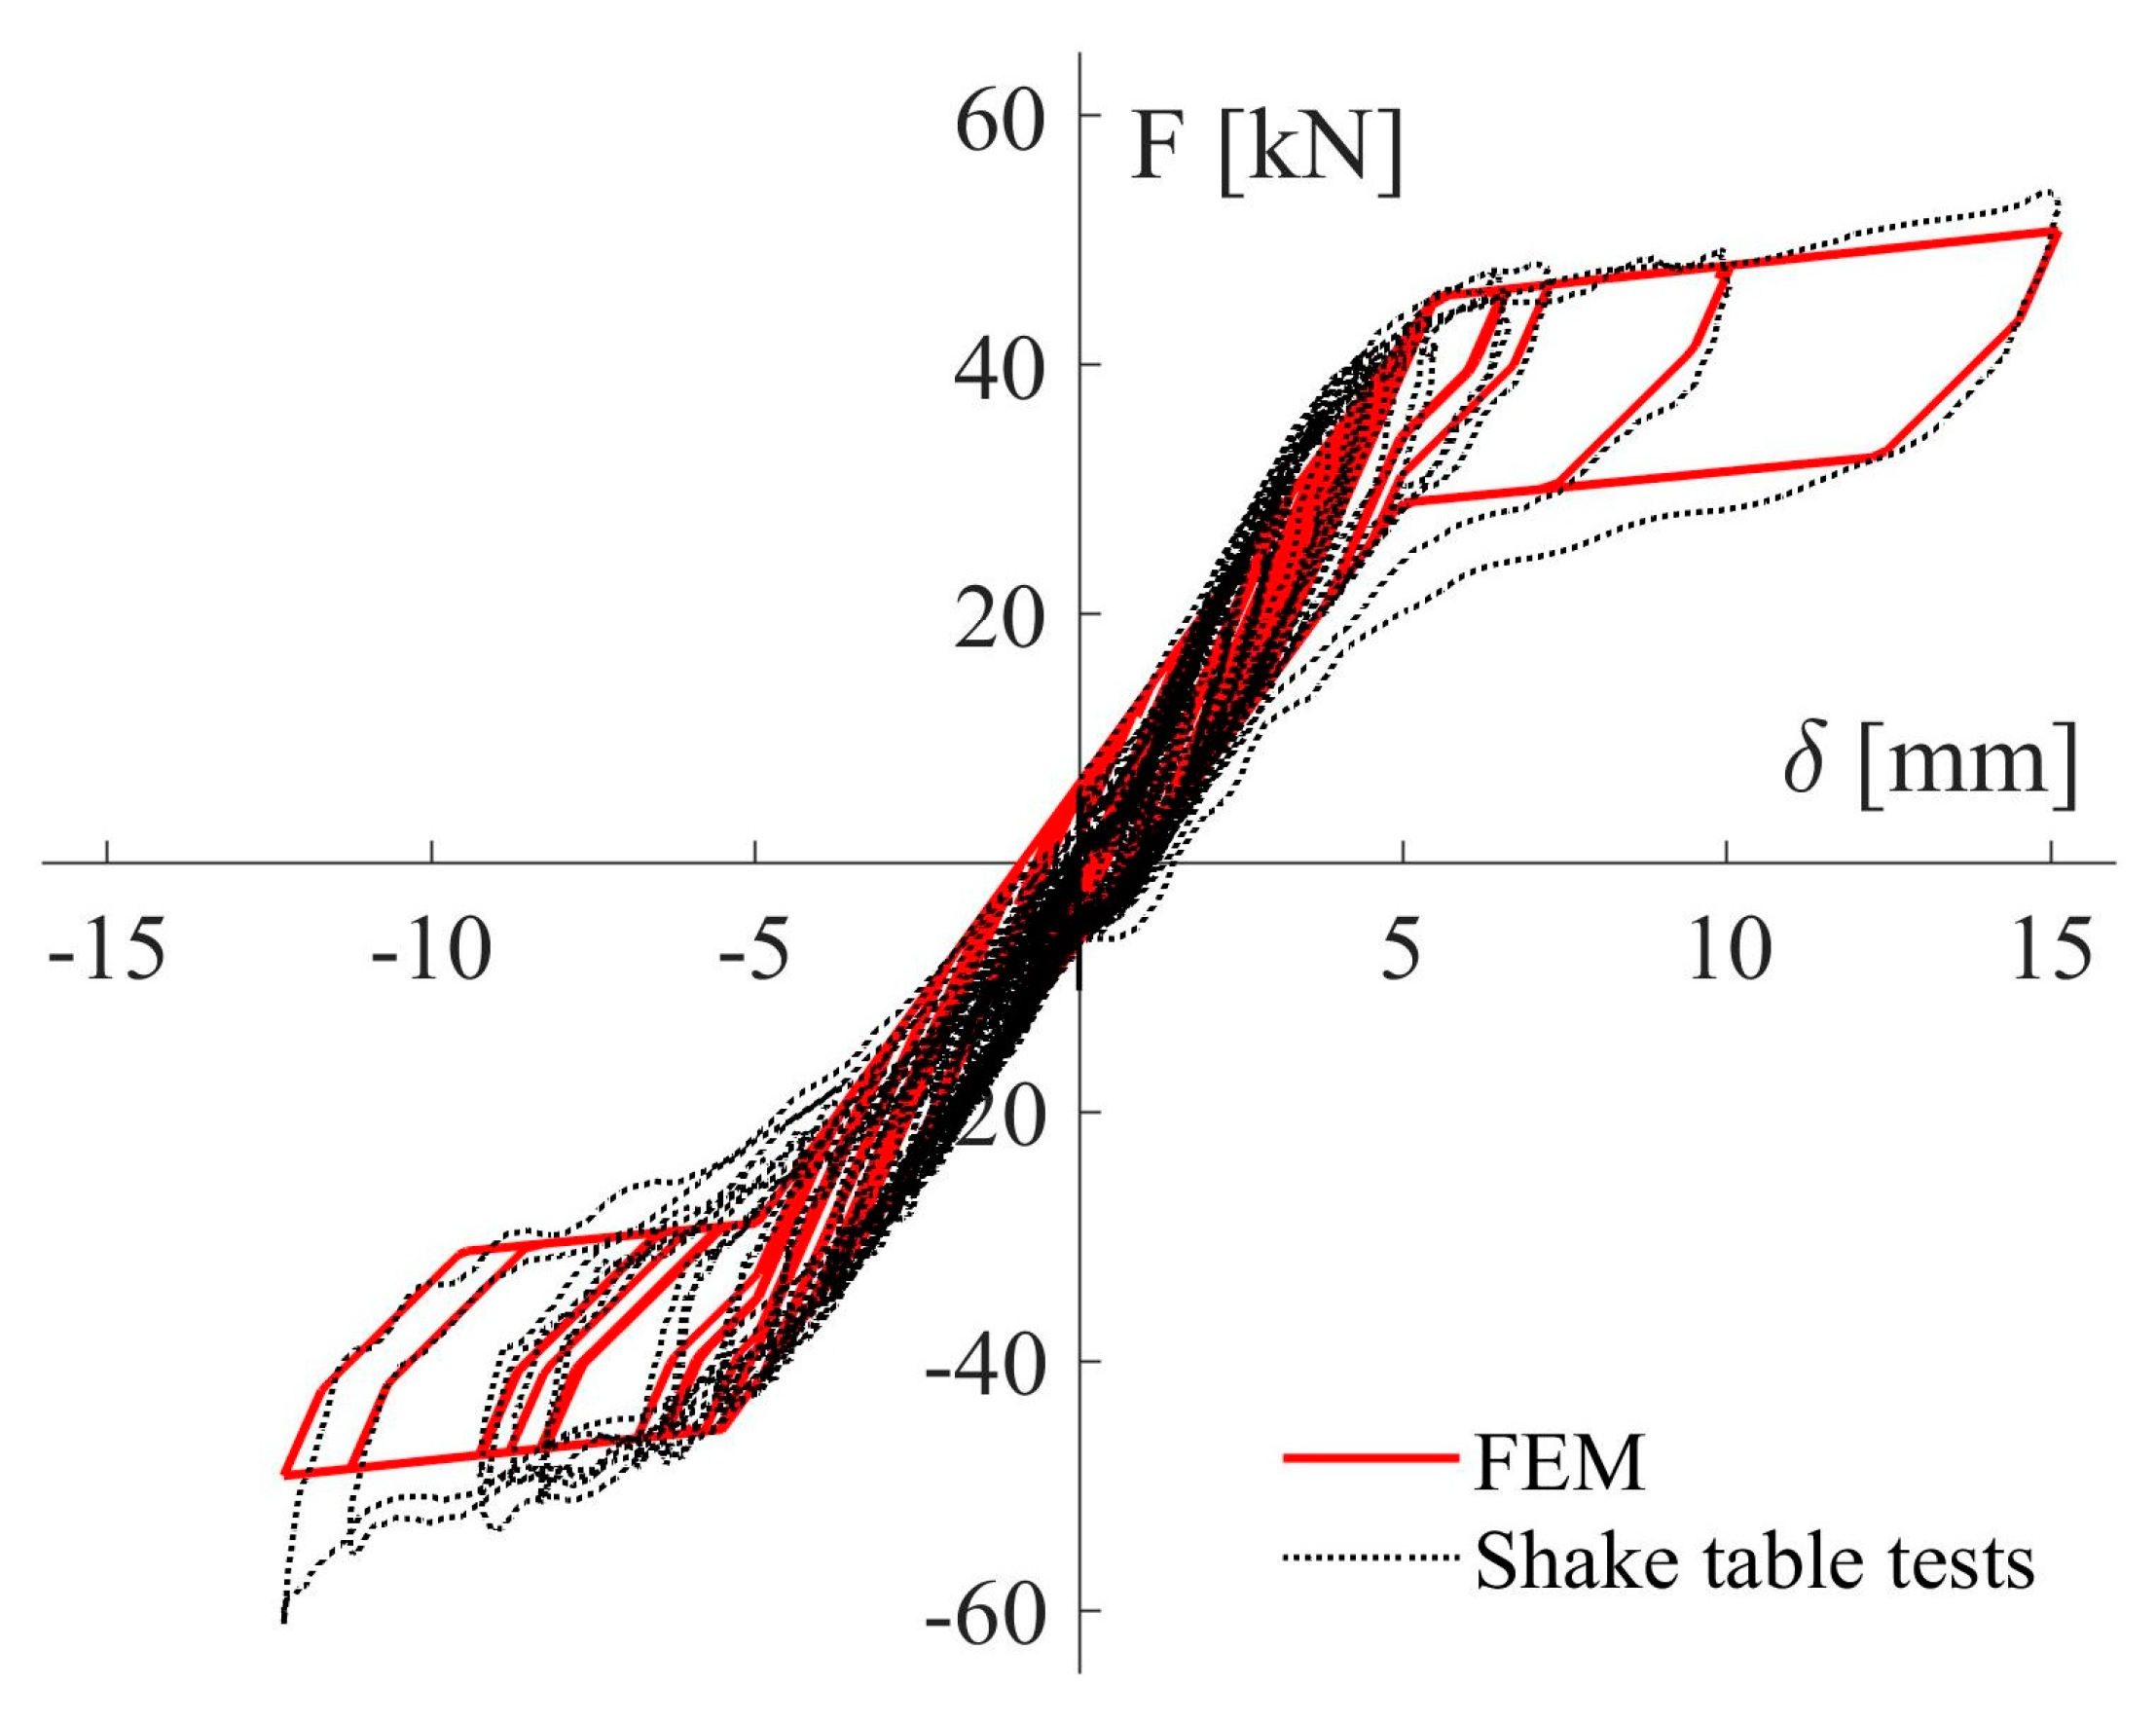
2.3.1. Hysteretic Behavior

Figure 8 shows the stress-strain curves obtained for specimen S11. Specimens S12 to S16 exhibited similar behavior. Three relevant features should be noted. First, in the initial cycles, the loading and unloading transformation stresses tend to diminish, which results in a reduction of the energy dissipated in each cycle. This phenomenon is called in the literature “functional fatigue” [15]. In successive cycles, the shape of the hysteresis loops tends to quickly stabilize, becoming almost identical. Second, the maximum stress is practically the same in all cycles. Third, the residual strain εR remains approximately constant.
Figure 9 shows the stress-strain curves obtained for specimens S21, S22, D21, and D22, subjected to cycles of increasing amplitude following protocol 2 at frequencies of 0.02, 0.04 (quasi-static) and 0.2, 1.0 Hz (dynamic), respectively. The first frequency (0.2 Hz) is approximately the fundamental frequency of a high-rise building vibrating in the fundamental mode. The second frequency (1 Hz) is typical of low to moderate rise buildings. Two relevant features should be noted. First, for a fixed frequency, the shape of the loops at different amplitudes is seen to follow basically the same pattern, that is, the loading and unloading paths for a given amplitude overlap the loading and unloading paths obtained in cycles of lower amplitude. Kimiecik et al. [16] studied the configurations of transforming martensite during ambient temperature cyclic deformations of superelastic NiTi and found that local transformation history is responsible for this macroscopically observed performance.
Second, the shape of the loops differs notably depending on the frequency of the loading. In order to better understand the effect of the strain rate, the hysteresis loops at 6% strain described by each specimen are shown in Figure 9. It is clear from this Figure that an increase in the strain rate results in (i) greater values for loading and unloading transformation stresses, (ii) narrower hysteresis loops, and (iii) earlier and more remarkable occurrence of the strain hardening effect. These variations imply a decrease in the energy dissipation per cycle and in the equivalent viscous damping as the frequency of the applied loads increases. The obtained response is justified by the high dependency of SMA response on thermo-mechanical loading conditions [17,18,19]. More precisely, the self-heating of the SMA under cyclic loading and the difficulty of transferring this heat to the environment at high strain rates is responsible for the alterations observed on the shape of the hysteretic loops. It can be also observed in Figure 10 that the amount of residual strain is not clearly affected by the frequency of loading.
Figure 11 shows the equivalent viscous damping ratios computed for specimens S21, S22, D21, and D22. It is worth recalling that specimens S21, S22, and D21 were subjected to one cycle at amplitudes ε = 1%, 2%, 3%, 4%, and 5%, and to four cycles at amplitude ε = 6%. Therefore, each specimen provided four values of ζeq at ε = 6%. Yet specimen D22 failed during the second cycle at ε = 6%, therefore there is only one point at this strain amplitude. It can be observed that, for the same frequency, ζeq tends to increase with ε, and becomes approximately constant beyond ε = 4%. Under cycles of constant amplitude at ε = 6%, ζeq tends to decrease with the number of cycles applied.
The effect of the strain rate on the amount of energy dissipated in a single cycle at ε = 6% amplitude was further investigated to identify possible differences between wires and bars made of NiTi alloys. To this end, the results obtained in this study with specimens S21 and D22 were compared with the tests conducted by other researchers [2,3,4,17] on wires and bars subjected to one cycle of amplitude ε = 6% at frequencies of 0.02 Hz and 1.0 Hz. The information regarding the SMA materials used in these studies can be summarized as follows. In [2]: NiTi 50%Ni, cold working and annealing. In [3] NiTi 56%Ni, cold drawn with 30% cold working and annealing. In [4]: NiTi near equiatomic, cold drawn 30% and cold worked prior to annealing. In [17]: Nitinol.
In order to make the results comparable, the energy ED dissipated in one cycle was normalized by the product of the yield force Fy and yield displacement δy determined as follows. The loading branch of the force-deformation curve F-δ obtained experimentally was idealized with two segments as shown in Figure 12. The slope and position of these segments were determined so that: (i) the slope of the second segment of the bilinear approximation closely fits the path of the loading transformation phase, and (ii) the area under the real curve and the bilinear approximation was the same. The results are shown in Table 1. In this Table, ϕ is the diameter of the wire or bar, σy is the yield stress obtained dividing Fy by π(ϕ/2)2, εy is the yield strain obtained dividing δy by the initial length, and E ¯ D is the dissipated energy ED normalized by Fyδy. The values of σy, εy, EA, and E ¯ D vary depending on the frequency applied. The last column of Table 1 shows the ratio between E ¯ D obtained for quasi-static loading (0.02Hz), E ¯ D , static , and the corresponding value obtained for dynamic loading (1.0 Hz), E ¯ D , dynamic . The specimens with ϕ < 2 mm are referred to as wires hereafter, and those with ϕ > 6 mm as bars.
For the same type of loading (i.e., quasi-static or dynamic), Table 1 does not reflect any clear differences between wires and bars in terms of normalized dissipated energy, the average normalized energy under quasi-static loads, E ¯ D , static , is 1.4 in wires and 1.62 in bars, while the counterpart values under dynamic loadings, E ¯ D , dynamic , are respectively 1.1 and 0.87. Still, there is a clear difference in terms of the reduction of normalized energy dissipation due to the type of loading. More precisely, E ¯ D , dynamic / E ¯ D , static is about 40% greater on bars than on wires. It is also seen that the yielding stress σy increases with the frequency. This increase is larger in bars than in wires. As for the yielding strain, it is reduced in wires when the load is applied dynamically in comparison with the static case. The tendency is the opposite for bars, however. This is possibly due to the sample size that may produce different deformation mechanisms within the superelastic strain range [20].

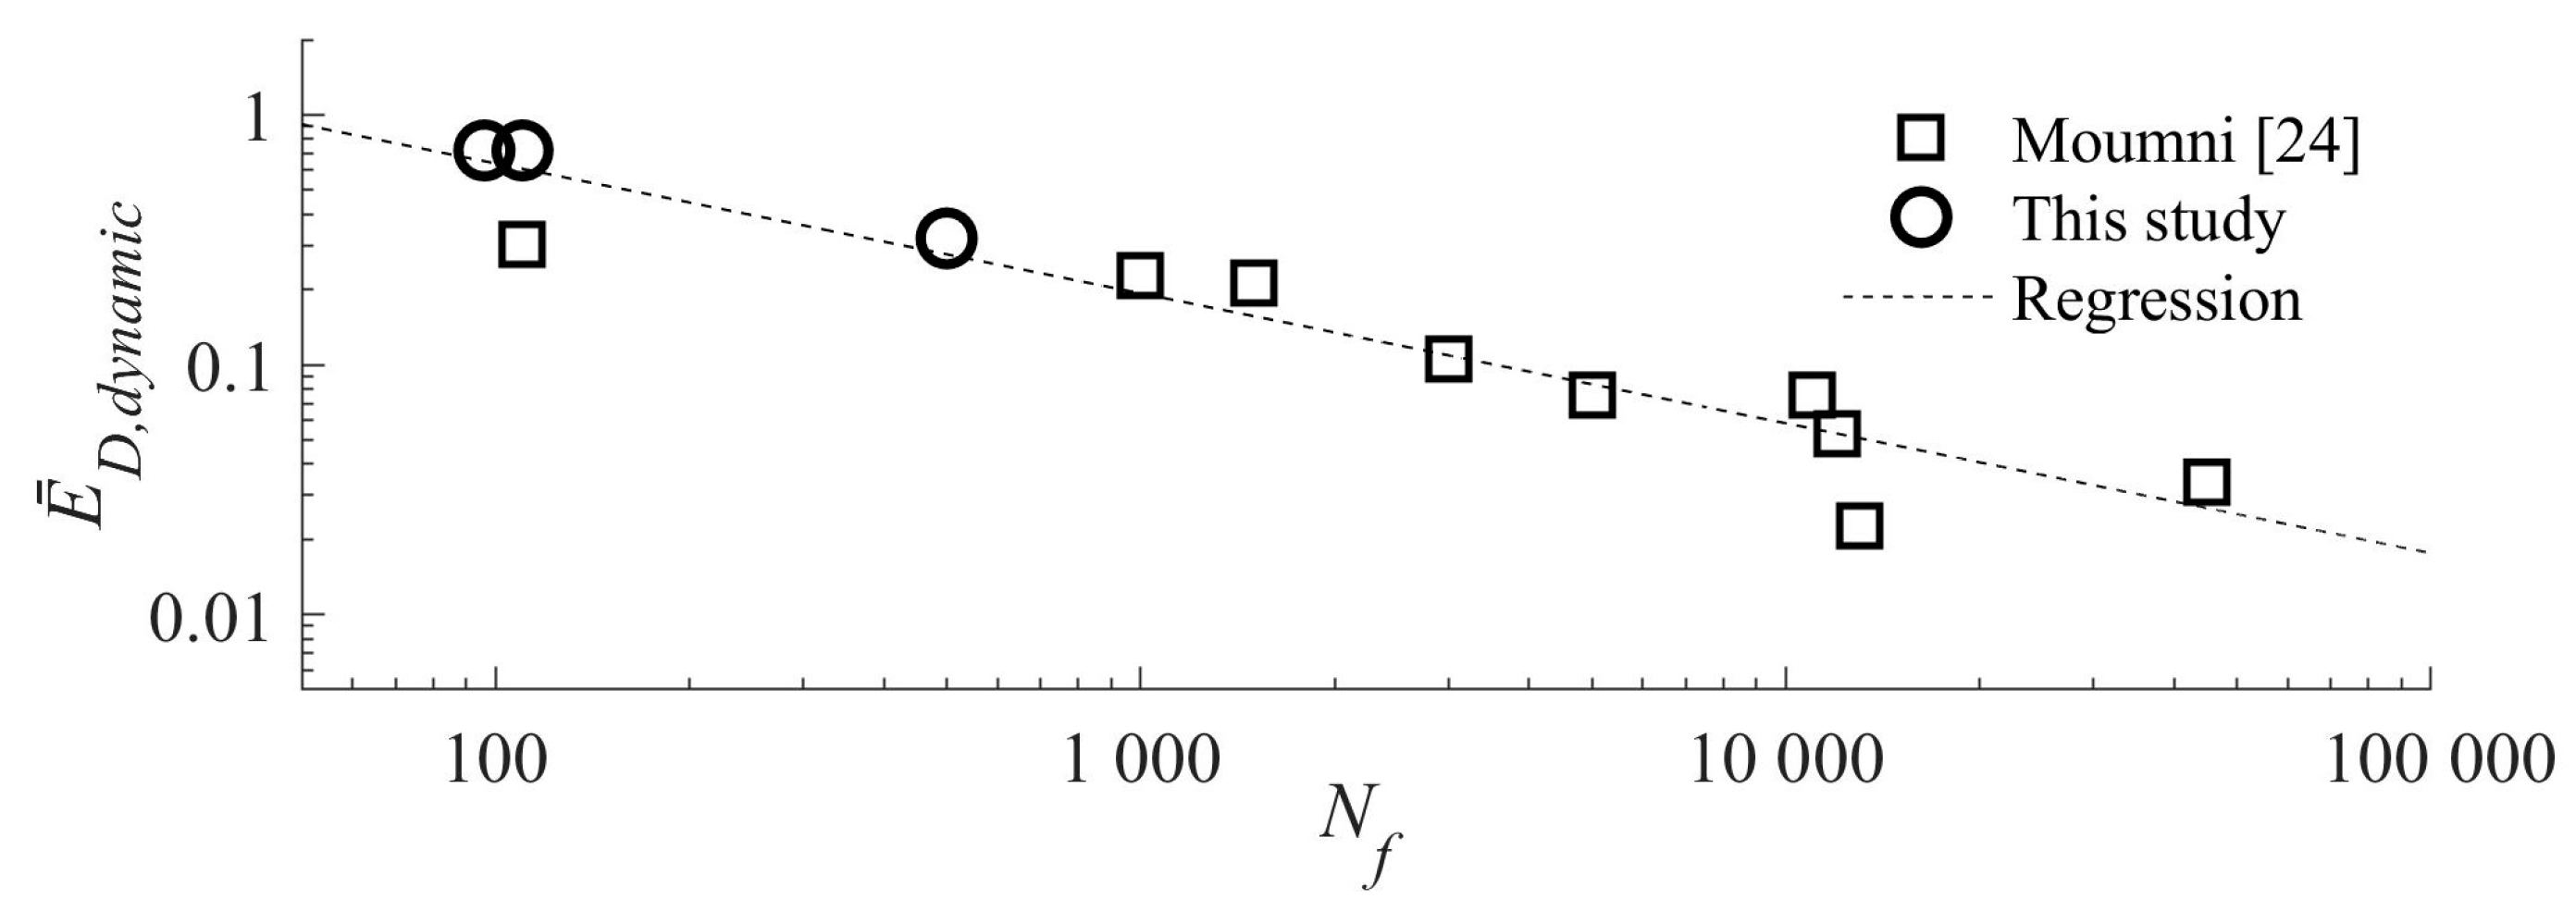
2.3.2. Ultimate Energy Dissipation Capacity

Past research on the fatigue of NiTi SMAs distinguishes their functional fatigue from structural fatigue [15,21]. Functional fatigue was described in Section 2.3.1. Structural fatigue refers to the gradual loss of strength under repeated loading that occurs after applying a large number of cycles, driving the specimen to failure. In turn, two types of structural fatigue can be distinguished: high-cycle fatigue and low-cycle fatigue. The former occurs after a relatively large number of cycles (several thousands of cycles) in which the material remains in the elastic range. The latter occurs at a small number of cycles (several dozens or hundreds) and involves plastic deformations. The vibrational response of a structure subjected to severe earthquakes is characterized by an occurrence from several dozens to several hundreds of cycles in which the members are strained beyond the elastic range. Therefore, the problem of fatigue in structural members subjected to seismic loadings is a problem of low-cycle fatigue.
Some recent works aspire to gain a better understanding of the structural fatigue of NiTi SMAs based on both experimental and theoretical investigations [14,22,23]. Several fatigue failure models have been developed following an energy criterion that appears to keep a good correlation between experimental and prediction approaches. However, failure models are based on tests conducted with NiTi wires and micro-tubes. This section investigates their validity for NiTi bars. To this end, the results of the tests conducted on specimens S31, S32, and S41 subjected to cycles of constant amplitude were used. The total energy dissipated by these specimens and accumulated in successive cycles until failure, E ¯ D , static , was normalized by Fyδy (determined as described in Section 2.3.1), i.e., E ¯ D , static = E D , static / ( F y δ y ) , and is shown in the second column of Table 2. The normalized energy dissipated in the first cycle was also calculated for each specimen, i.e., E ¯ D , static = E D , static / ( F y δ y ) , and is shown in the third column of Table 2. Further, the total amount of dissipated energy was expressed in terms of the equivalent number of cycles Nf defined by Nf = E ¯ D , static / E ¯ D , static and is shown in the fourth column of Table 2. It is worth recalling that the loads applied to specimens S31, S32 and S41 were quasi-static, and it was shown in Section 2.3.1 that the amount of energy dissipated under dynamic loading is smaller than under static loads. More precisely, for the 12.7 mm diameter bars tested in this study, the ratio E ¯ D , dynamic / E ¯ D , static is 0.62 (last row in Table 1). Therefore, the normalized energy dissipated in a single cycle under dynamic loading E ¯ D , dynamic can be estimated by multiplying E ¯ D , static by 0.62, and it is indicated in the last column of Table 2. The pairs of values (Nf, E ¯ D , dynamic ) obtained in this way for specimens S31, S32 and S41 are plotted with circles in Figure 13 and compared with those obtained by [24] (square symbols) for 6.2 mm diameter NiTi bars tested under dynamic (0.3 Hz) loads. Since the ratio E ¯ D , dynamic increases with the amplitude of the cycle, E ¯ D , dynamic is directly related to the amplitude of the cyclic loading. The ultimate energy dissipation capacity corresponding to each point, shown in Figure 13, can be simply obtained by multiplying its abscissa (Nf) by its ordinate E ¯ D , dynamic .
Figure 13 shows that the ultimate energy dissipation capacity of NiTi bars under low-cycle fatigue obtained in this study is consistent with the values reported in [24]. Performing a regression analysis of these results, the ultimate energy dissipation capacity of NiTi bars subjected to dynamic cyclic loading, expressed in terms of Nf and E ¯ D , dynamic , can be approximated through the following expression:
E ¯ D , dynamic = 7.0 N f 0.52

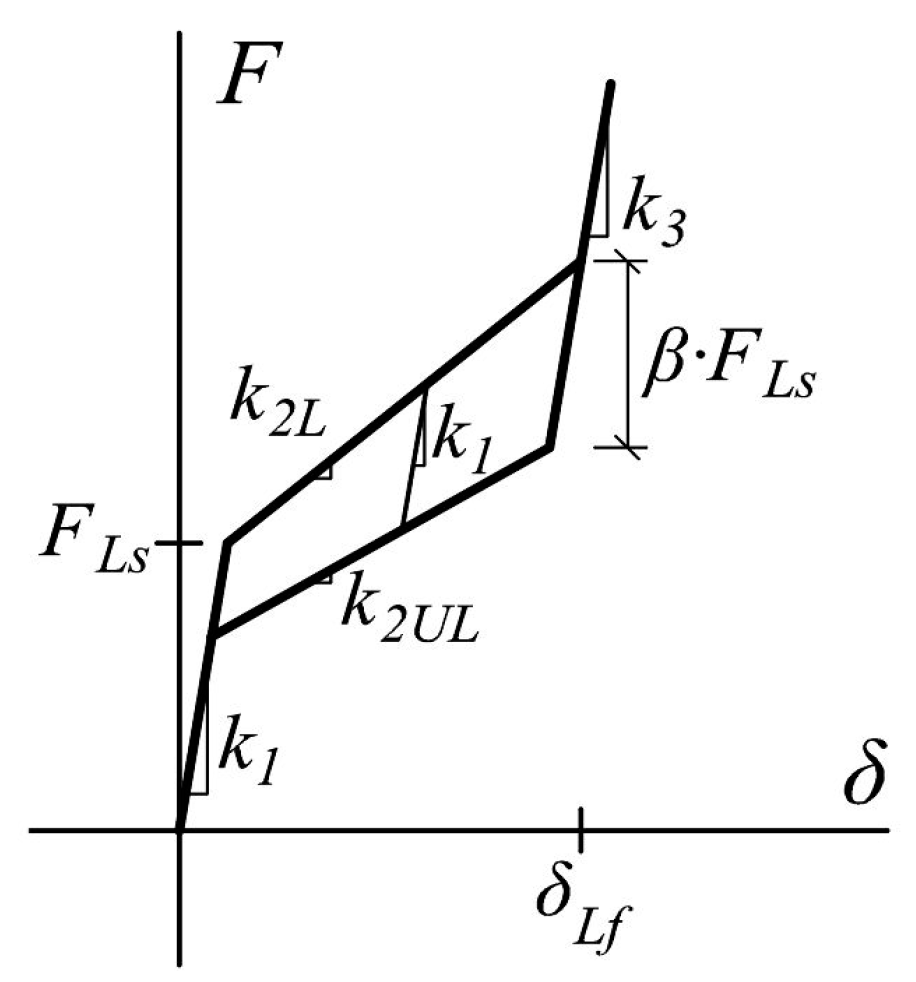
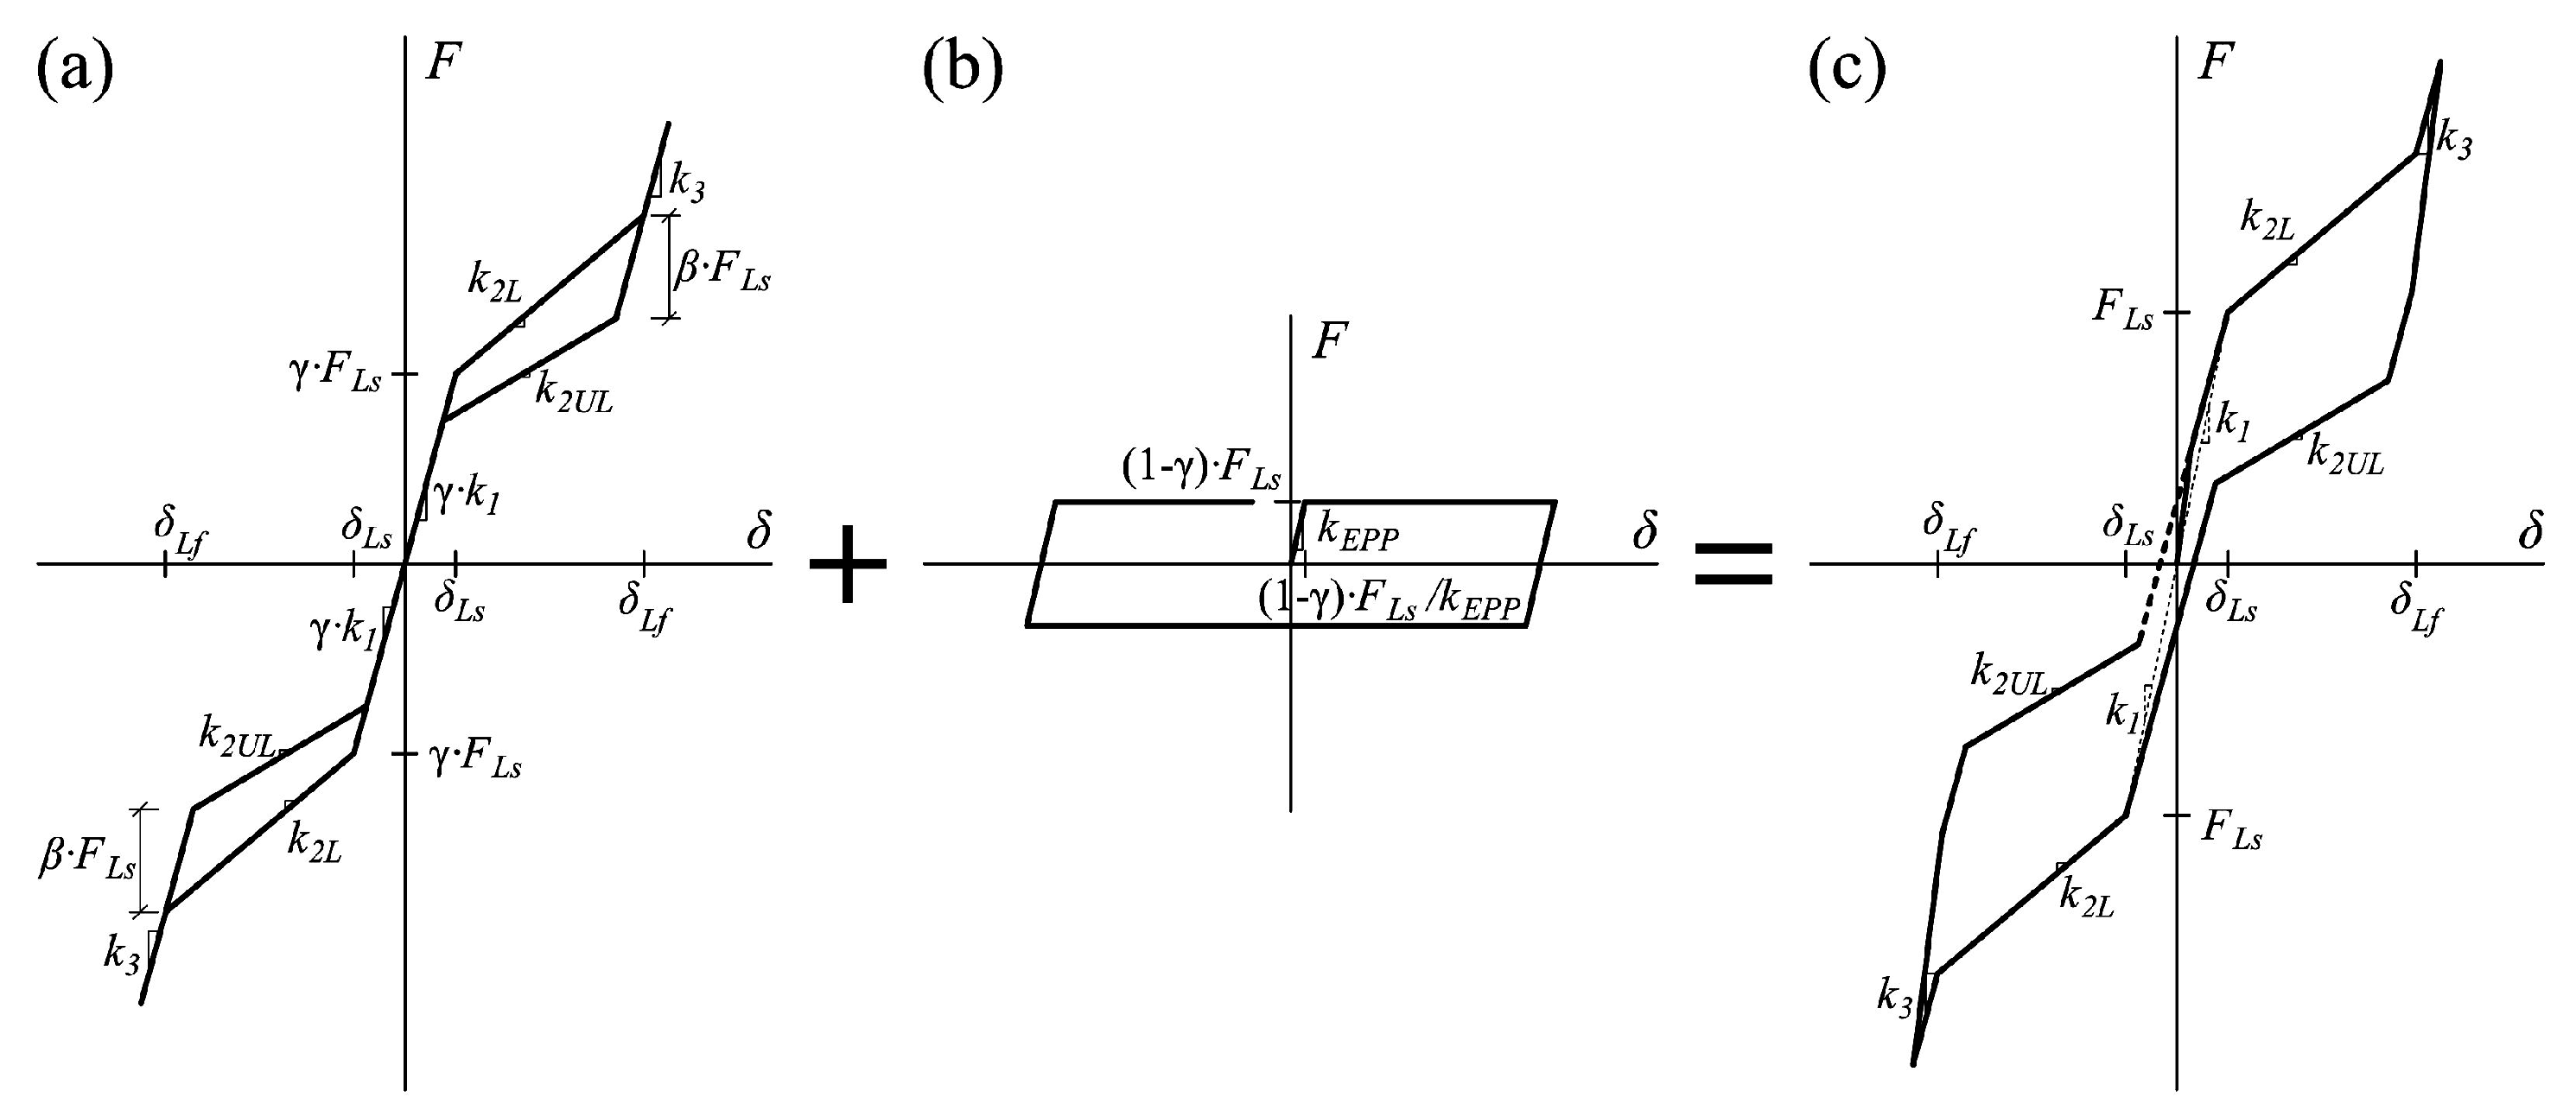
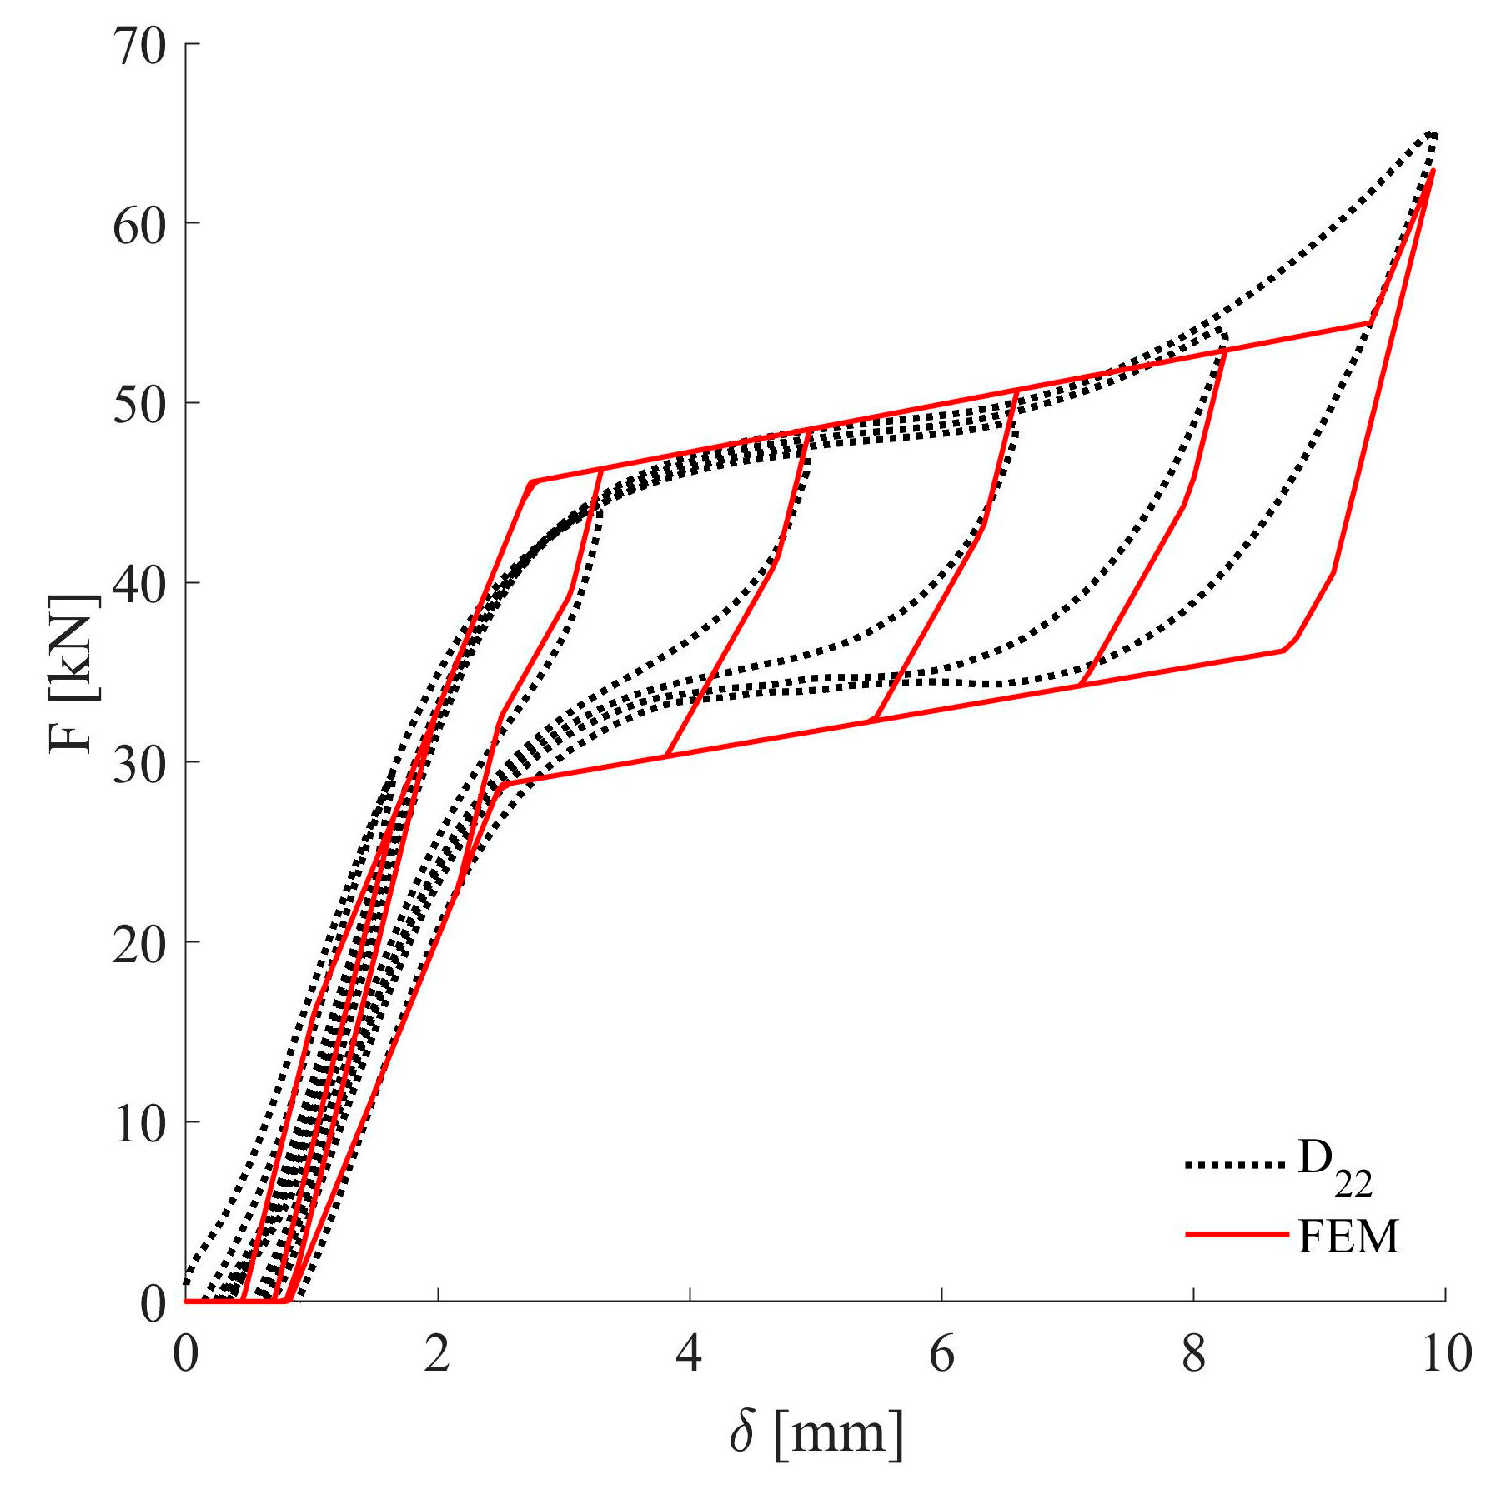
3. Numerical Characterization of the Hysteretic Behavior of NiTi Bars

Several models have been proposed in the literature to characterize the hysteretic behavior of NiTi bars. Ikeda et al. [25] proposed a specimen-based macroscopic model of SMA for unidirectional loading that considers the inner hysteretic loops of a stress-strain-temperature relationship and includes the memory effect of deformation history. This model was derived from a grain-based microscopic model. Saleeb et al. [26] proposed a fully general, three-dimensional, constitutive model for SMA that can describe all the salient features of SMA evolutionary response under complex thermo-mechanical loading conditions. This model uses multiple inelastic mechanisms to organize the exchange between the energy stored and energy dissipated during the deformation history. Karakalas et al. [27] proposed a different approach that combines a physical constitutive model with an expression that describes the hardening behavior of SMA.
Because of its simplicity, the conventional flag-shape model displayed in Figure 14 has been widely used to represent the hysteretic behavior—i.e., axial force F versus axial deformation δ—of NiTi bars. In the conventional flag-shape model the behavior of the SMAs is defined by several parameters: initial stiffness k1, loading phase transformation stiffness k2L, unloading phase transformation stiffness k2UL, the strain hardening stiffness k3, loading transformation strength at start FLs, loading transformation deformation at finish δLf, and ratio of loading transformation strength at start β. Here, FLs and k1 can be easily determined from the geometry (cross area A and length L) of the bar, and the mechanical properties of the material (Young’s modulus E and yield stress σLS), i.e., FLS = σLsA and k1 = EA/L. The simplicity reduces computational efforts substantially when performing complex time history nonlinear analysis of structures subjected to seismic loadings. The conventional flag-shape model cannot, however, capture the residual deformation associated with the residual strain εR typically exhibited by all hysteresis loops, as seen in Figure 10. If the NiTi bar is subjected to just a few cycles of large amplitude (e.g., far beyond ε = σLS/EA in Figure 2), the amount of dissipated energy associated with the residual strain εR (represented by the area σLS εR in Figure 2) is negligible in comparison with the energy dissipated in a complete cycle (represented by the shaded area of the complete loop in Figure 2). In such a case, the conventional flag-shape model captures the actual amount of energy dissipated by the NiTi bar reasonably well. Yet if the loading history consists of a combination of few cycles of large amplitude and a large number of cycles of small amplitude, i.e., below ε = σLS/EA in Figure 2, the amount of energy dissipated by the small amplitude cycles can be comparatively large. The latter is the typical displacement pattern imposed by earthquakes on structural members. In this case, the conventional flag-type model can lead to a wrong prediction of the energy accumulated on the NiTi bars and to an unsafe estimation of failure.
To remediate this flaw without sacrificing simplicity, a new hysteretic model is proposed for characterizing the hysteretic behavior of NiTi bars. It consists of two springs connected in parallel. The force-displacement relationship of one of the springs follows the conventional flag-type model described above and shown in Figure 14, but with the initial stiffness and the loading transformation strength at start weighted by a factor γ, as shown in Figure 15a. The second spring follows an elastic-perfectly plastic (EPP) hysteretic behavior, with yield force equal to (1 − γ)FLS and elastic stiffness kEPP, as shown in Figure 15b. The sum of the restoring forces provided by each spring at a given displacement δ gives the complete hysteretic model depicted in Figure 15c. Worth noting in Figure 15c is that the secant stiffness at δ = δLS gives the stiffness k1 = EA/L.
In the proposed hysteretic model, FLs and k1 are determined from the geometry of the bar and the mechanical properties of the material, as indicated above (i.e., FLS = σLsA and k1 = EA/L). The rest of the parameters were calibrated with the results of the dynamic cyclic tests described in Section 2, giving: k2L = k1/15, k2UL = 3k1/50, k3 = k1, δLf = 4FLs/k1, β = 0.1, kEPP = 4k1, and γ = 0.86. Figure 16 compares the shape of the hysteresis loops obtained with the proposed model and the results of the dynamic cyclic tests (specimen D22). Comparison in terms of dissipated energy gives ED = 130 kN·mm for the numerical model and ED = 119 kN·mm for the test, the difference being less than 10%.

4. Shake Table Tests of a Structure with NiTi Bars

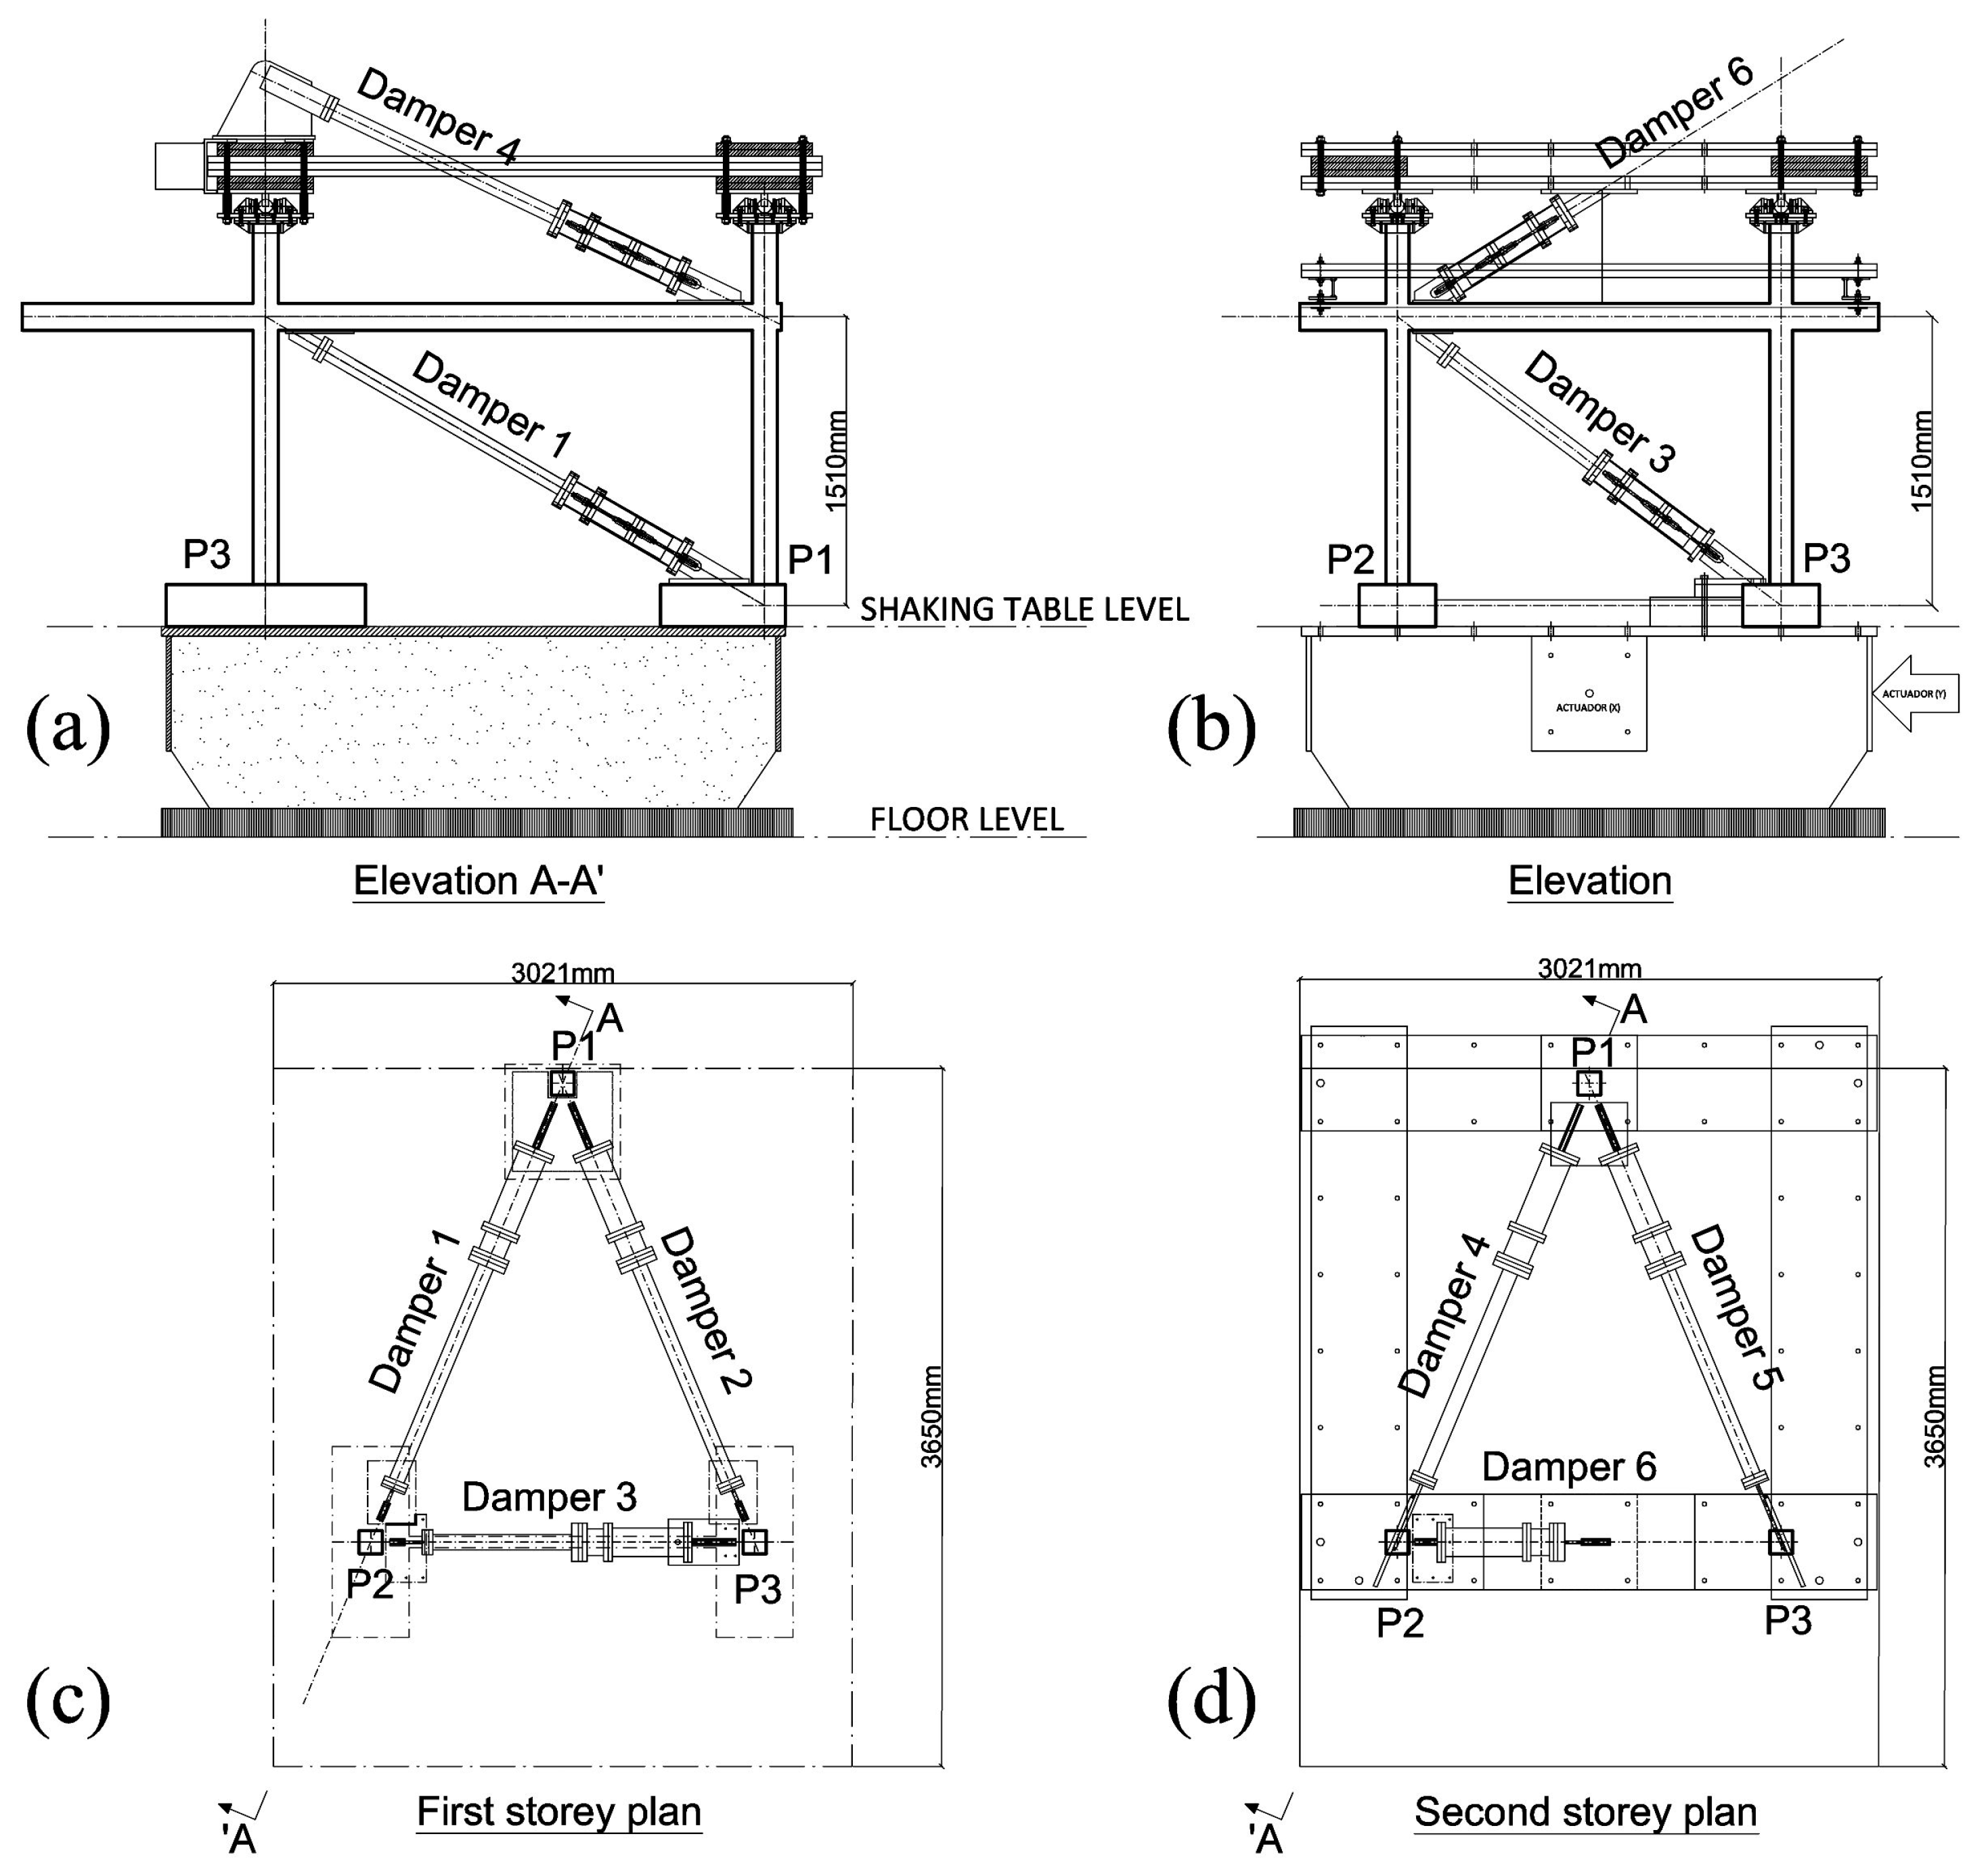
4.1. Brace-Type NiTi Damper

In order to validate the hysteretic model proposed in Section 3, several NiTi bars identical to those described in Section 2 were assembled forming the hysteretic damper shown in Figure 17. The damper has the form of a conventional brace and is intended to be installed in a structure as a standard diagonal bar. It is constructed by assembling two standard hollow structural rectangular sections, one into the other, with a central NiTi bar. The inner tube has a central steel plate. The NiTi bar is fixed at mid-length to the central steel plate and at both ends to the inner and outer tubes, with the mechanical anchors shown in Figure 17c. The NiTi bar is arranged inside the tubes in such a way that when the damper is subjected to forced axial deformations (tension or compression), there is always one half of the NiTi bar of length L carrying tension forces, while the other half does not carry any load.

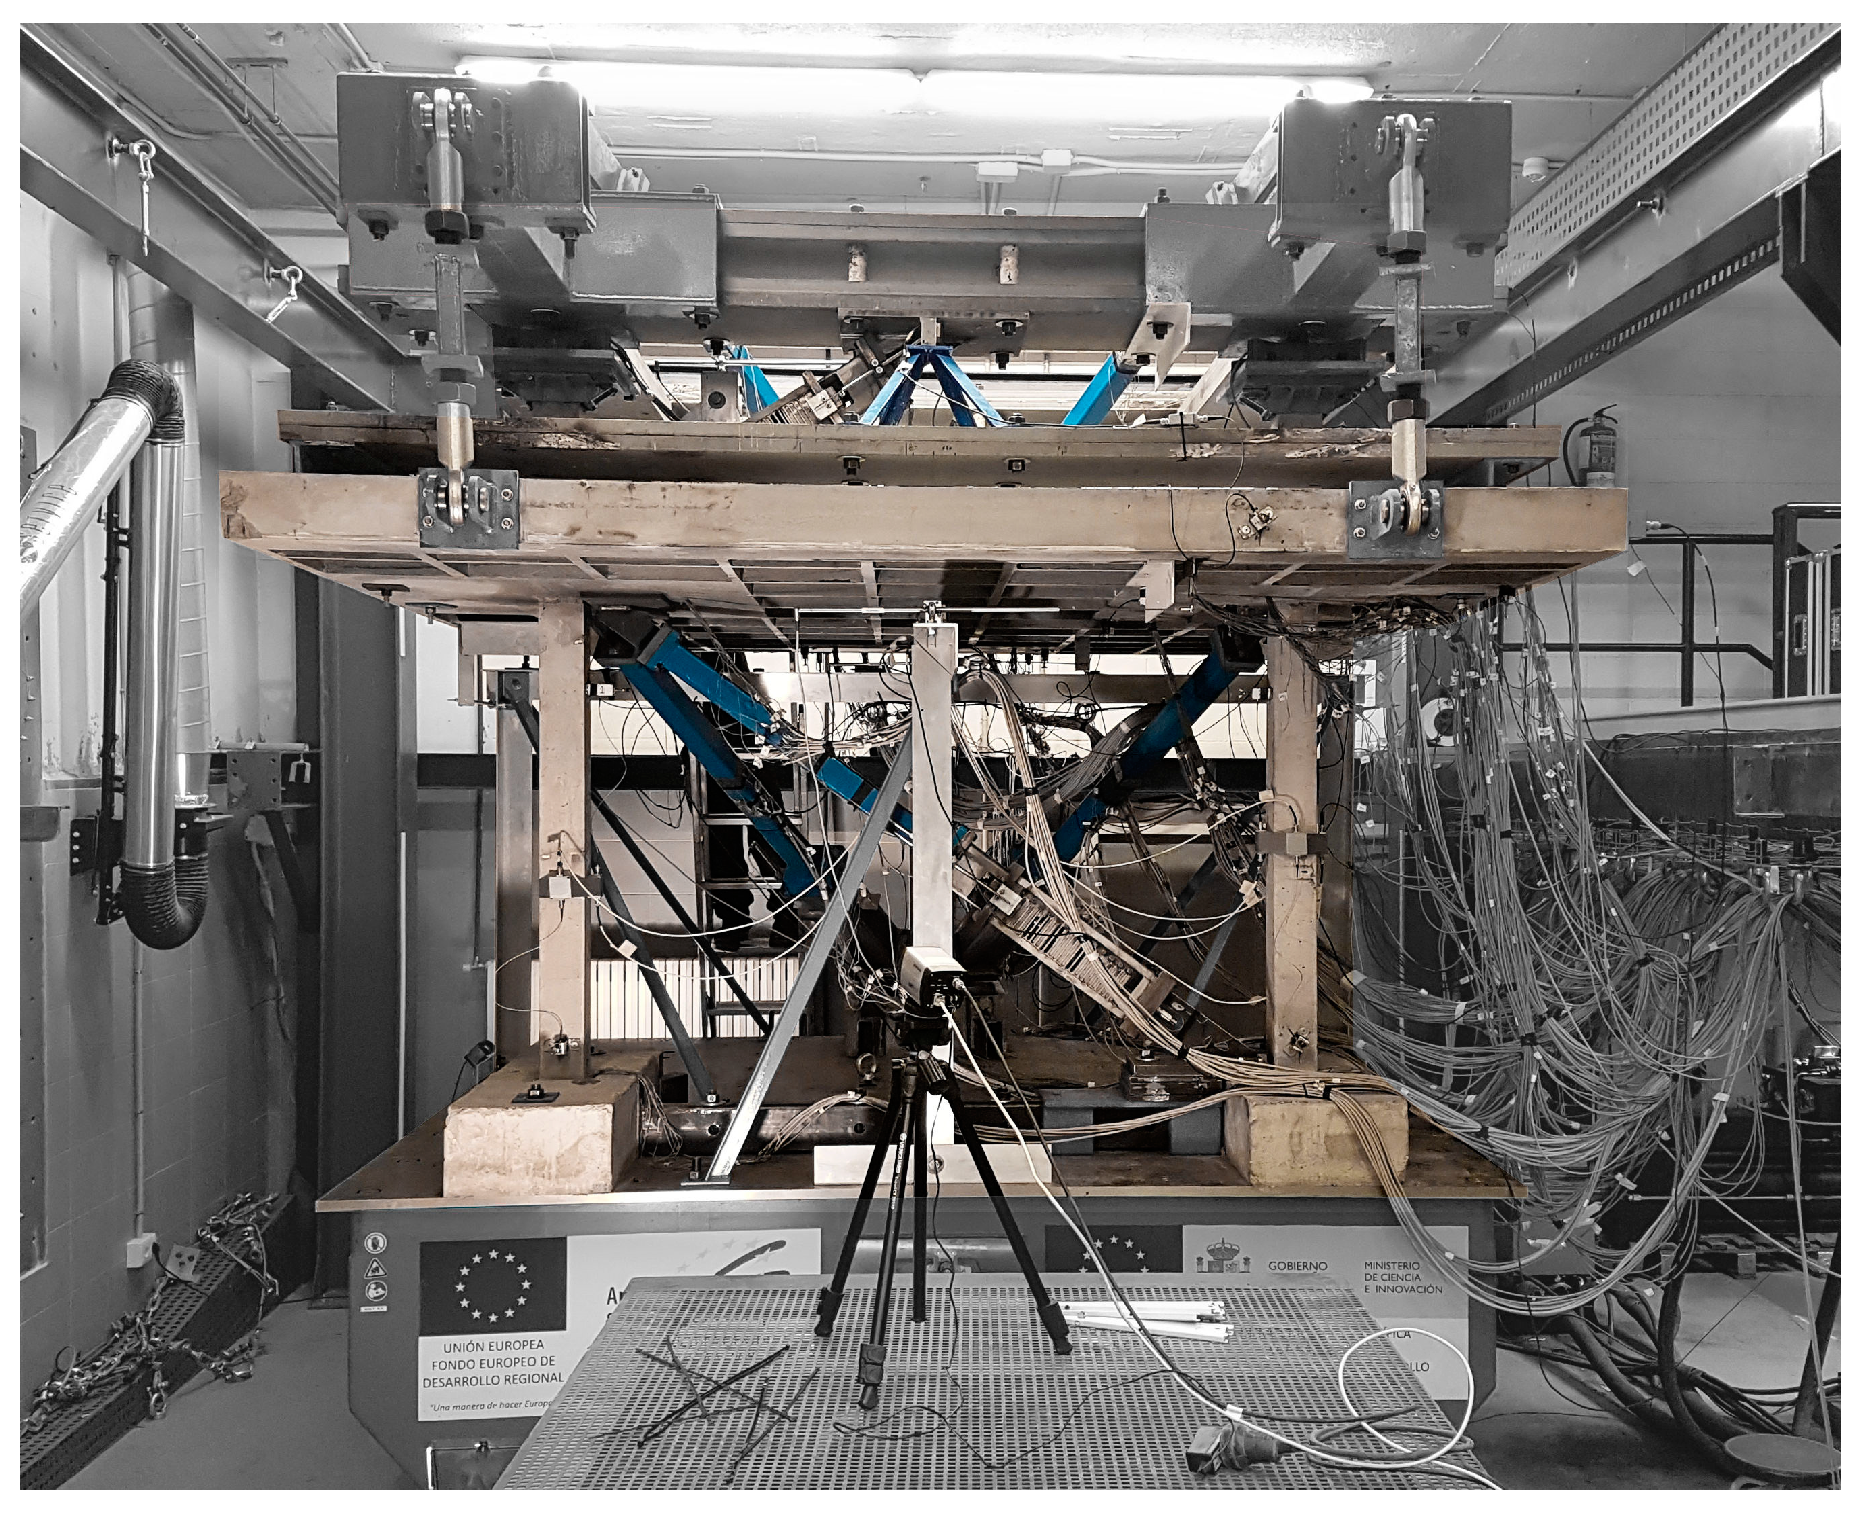
4.2. Test Specimen and Experimental Set up

First, a prototype reinforced concrete (RC) structure—consisting of waffle flat plates supported on isolated columns—was designed. The prototype had three stories and the dimensions in the plan were 18 × 15 m2. Second, a partial structural model having three columns and the height of one story and a half was selected from this prototype structure. Third, a test specimen was defined from the partial structural model by applying scale factors of λL = 2/5 for length. The test specimen was built in Laboratory and three brace-type hysteretic dampers consisting of NiTi bars and steel tubes assembled as shown in Figure 17 were installed in each story as diagonal elements. Additional steel blocks were attached at the top of the RC plate and at the top half of the columns of the second story to represent the gravity loads acting on the floors. Finally, the test specimen with the brace-type NiTi dampers was mounted on a bidirectional 3 × 3 m2 shake table forming the experimental set up shown in Figure 18 and Figure 19. The brace-type NiTi dampers were instrumented with displacement transducers and strain gauges.

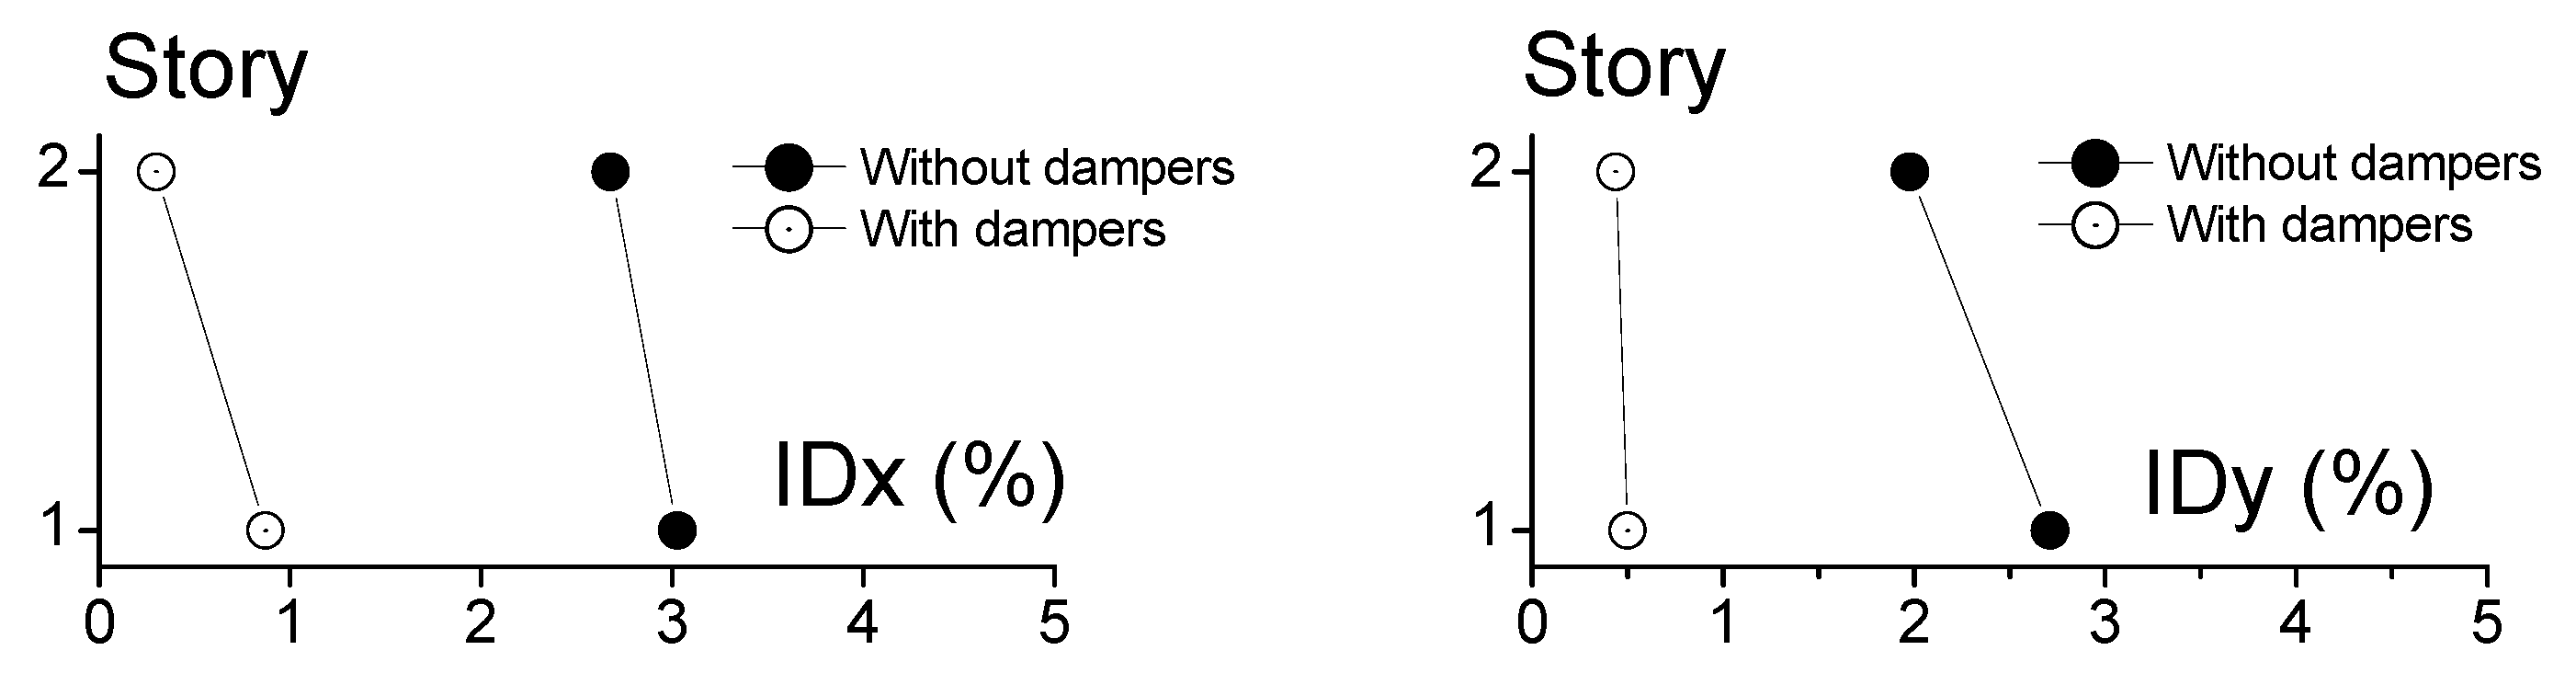
4.3. Seismic Tests and Results

The test specimen was subjected simultaneously to the two horizontal components (NS and EW) of the far-field ground motion recorded at Calitri during the Campano Lucano (Italy, 1980) earthquake. The response on the NiTi dampers expressed in terms of axial force F and axial displacement δ was obtained from the measurements provided by the displacement transducers and the strain gauges. Figure 20 shows with dot lines the F-δ curves obtained for one of the NiTi bars. Meanwhile, a numerical model that represents the hysteretic behavior of the NiTi bar was developed, as explained in Section 3. The numerical model was subjected to the imposed axial displacements measured with the displacement transducers during the tests. The solid red line in Figure 20 shows the hysteresis curves predicted with the model put forth in Section 3, and the dot lines the experimental results obtained from the shake table tests. The proposed model is seen to predict with reasonable accuracy the forces sustained by the NiTi bar. In addition to the similarity in the shape of the hysteresis loops, the total amount of energy dissipated by the proposed model (ED = 2699 kN·mm) is very similar to the actual value (ED = 2563 kN·mm) measured during the tests. Finally, the response of the structure equipped with the SMA dampers is compared in Figure 21 with that of a counterpart structure without dampers that were subjected to the same earthquake in a previous study [28]. The response is compared in terms of maximum inter-story drift for the horizontal X direction, IDx, and in the Y direction IDy. The inter-story drift is defined as the relative lateral displacement between the top and bottom parts of each story, divided by the story height. It can be seen, that the SMA dampers reduced to less than one fourth the maximum inter-story drifts.

5. Conclusions

A set of 12.7 mm diameter NiTi bars were tested under cyclic loading in both static and dynamic conditions, and at different frequencies. Some of them were tested up to failure in order to evaluate the ultimate energy dissipation capacity when subjected to low-cycle fatigue. Under cyclic static loadings at constant amplitude, the shape of the hysteresis loops stabilized after some cycles of deformation and the residual strain remained unaffected. The shape of the hysteretic loop is influenced by the frequency applied. Increasing the frequency leads to an increase in the loading and unloading stresses and a reduction of the amount of energy dissipated in each cycle, while the residual stress remains almost constant. The value of the equivalent viscous damping ratio was similar in all specimens tested, ranging between about 2.5% and 3% under dynamic loadings. The amount of energy dissipated under dynamic loading was 62% of the counterpart value obtained under static loads, and about 40% lower than the values reported in the literature for NiTi wires. The ultimate energy dissipation capacity of NiTi bars under low-cycle fatigue was found to be consistent with the values reported in the literature for NiTi bars subjected to high-cycle fatigue. An expression is proposed to quantify the ultimate energy dissipation capacity in terms of the number of cycles at constant amplitude to failure, and the normalized energy dissipation in one cycle. Finally, a new hysteretic model that consists of two springs connected in parallel is proposed for characterizing the hysteretic behavior of NiTi bars. One spring follows the conventional flag-type model (weighted by a factor γ) and the other spring follows an elastic-perfectly plastic rule. The proposed model is calibrated with the results of cyclic tests and validated with the results of dynamic shake table tests conducted on an RC structure equipped with NiTi bars as energy dissipation devices.

Author Contributions

Conceptualization, methodology, review, and editing, A.B.-C.; formal analysis, investigation and original draft preparation, G.G.-S.; test and validation G.G.-S., D.G.-L., and D.E.-M.

Funding

This work is funded by the European Union under the program H2020 with the project SERA “Seismology and Earthquake Engineering Research Infrastructure Alliance for Europe”, responding to the priorities identified in the call INFRAIA-01-2016-2017 Research Infrastructure for Earthquake Hazard H2020-INFRAIA-2016-1.

Acknowledgments

One of the authors was given a grant from the Spanish Government FPU16/03006 that is gratefully acknowledged. Thanks are given to Jaime Gálvez Ruiz for helping with the management of the dynamic cyclic tests.

Conflicts of Interest

The authors declare no conflict of interest.

References

  1. Dolce, M.; Cardone, D. Mechanical behaviour of shape memory alloys for seismic applications 1. Martensite and austenite NiTi bars subjected to torsion. Int. J. Mech. Sci. 2001, 43, 2631–2656. [Google Scholar] [CrossRef]
  2. Dolce, M.; Cardone, D. Mechanical behaviour of shape memory alloys for seismic applications 2. Austenite NiTi wires subjected to tension. Int. J. Mech. Sci. 2001, 43, 2657–2677. [Google Scholar] [CrossRef]
  3. DesRoches, R.; McCormick, J.; Delemont, M. Cyclic properties of superelastic shape memory alloy wires and bars. J. Struct. Eng.-ASCE 2004, 130, 38–46. [Google Scholar] [CrossRef]
  4. McCormick, J.; DesRoches, R.; Fugazza, D.; Auricchio, F. Seismic vibration control using superelastic shape memory alloys. J. Eng. Mater. Technol.-Trans. ASME. 2006, 128, 294–301. [Google Scholar] [CrossRef]
  5. McCormick, J.; Tyber, J.; DesRoches, R.; Gall, K.; Maier, H.J. Structural engineering with NiTi. II: Mechanical behavior and scaling. J. Eng. Mech.-ASCE 2007, 133, 1019–1029. [Google Scholar] [CrossRef]
  6. Tyber, J.; McCormick, J.; Gall, K.; DesRoches, R.; Maier, H.J.; Maksoud, A.E.A. Structural engineering with NiTi. 1: Basic materials characterization. J. Eng. Mech.-ASCE 2007, 133, 1009–1018. [Google Scholar] [CrossRef]
  7. Ozbulut, O.E.; Hurlebaus, S.; Desroches, R. Seismic response control using shape memory alloys: A review. J. Intell. Mater. Syst. Struct. 2011, 22, 1531–1549. [Google Scholar] [CrossRef]
  8. Wang, J.; Zhao, H. High performance damage-resistant seismic resistant structural systems for sustainable and resilient city: A review. Shock Vibrat. 2018, 2018, 8703697. [Google Scholar] [CrossRef]
  9. Lagoudas, D.C. Shape Memory Alloys: Modeling and Engineering Applications; Springer: New York, NY, USA, 2008; pp. 6–7. [Google Scholar]
  10. Hartl, D.J.; Lagoudas, D.C. Aerospace applications of shape memory allows. J. Aerosp. Eng. 2007, 221, 535–552. [Google Scholar] [CrossRef]
  11. Chopra, A.K. Dynamics of Structures; Prentice Hall: Upper Saddle River, NJ, USA, 1995; Volume 3. [Google Scholar]
  12. Mahtabi, M.J.; Shamsaei, N.; Mitchell, M.R. Fatigue of nitinol: The state-of-the-art and ongoing challenges. J. Mech. Behav. Biomed. Mater. 2015, 50, 228–254. [Google Scholar] [CrossRef]
  13. Song, D.; Kang, G.; Kang, Q.; Yu, C.; Zhang, C. Experimental observations on uniaxial whole-life transformation ratchetting and low-cycle stress fatigue of super-elastic NiTi shape memory alloy micro-tubes. Smart Mater. Struct. 2015, 24, 075004. [Google Scholar] [CrossRef]
  14. Zhang, Y.; You, Y.; Moumni, Z.; Anlas, G.; Zhu, J.; Zhang, W. Experimental and theoretical investigation of the frequency effect on low cycle fatigue of shape memory alloys. Int. J. Plast. 2017, 90, 1–30. [Google Scholar] [CrossRef]
  15. Eggeler, G.; Hornbogen, E.; Yawny, A.; Heckmann, A.; Wagner, M. Structural and functional fatigue of NiTi shape memory alloys. Mater. Sci. Eng. A-Struct. Mater. Prop. Microstruct. Process. 2004, 378, 24–33. [Google Scholar] [CrossRef]
  16. Kimiecik, M.; Jones, J.W.; Daly, S. The effect of microstructure on stress-induced martensitic transformation under cyclic loading in the SMA nickel-titanium. J. Mech. Phys. Solids 2016, 89, 16–30. [Google Scholar] [CrossRef]
  17. Zhu, S.; Zhang, Y. Loading rate effect on superelastic SMA-based seismic response modification devices. Earthq. Struct. 2013, 4, 607–627. [Google Scholar] [CrossRef]
  18. Kan, Q.; Yu, C.; Kang, G.; Li, J.; Yan, W. Experimental observations on rate-dependent cyclic deformation of super-elastic NiTi shape memory alloy. Mech. Mater. 2016, 97, 48–58. [Google Scholar] [CrossRef]
  19. Ammar, O.; Haddar, N.; Dieng, L. Experimental investigation of the pseudoelastic behaviour of NiTi wires under strain- and stress-controlled cyclic tensile loadings. Intermetallics 2017, 81, 52–61. [Google Scholar] [CrossRef] [Green Version]
  20. Nemat-Nasser, S.; Choi, J.-Y.; Guo, W.-G.; Isaacs, J.B. Very high strain-rate response of a NiTi shape-memory alloy. Mech. Mater. 2005, 37, 287–298. [Google Scholar] [CrossRef]
  21. Treadway, J.; Abolmaali, A.; Lu, F.; Aswath, P. Tensile and fatigue behavior of superelastic shape memory rods. Mater. Des. 2015, 86, 105–113. [Google Scholar] [CrossRef] [Green Version]
  22. Kang, G.; Song, D. Review on structural fatigue of NiTi shape memory alloys: Pure mechanical and thermo-mechanical ones. Theor. Appl. Mech. Lett. 2015, 5, 245–254. [Google Scholar] [CrossRef] [Green Version]
  23. Zhang, Y.; Zhu, J.; Moumni, Z.; Van Herpen, A.; Zhang, W. Energy-based fatigue model for shape memory alloys including thermomechanical coupling. Smart Mater. Struct. 2016, 25, 035042. [Google Scholar] [CrossRef] [Green Version]
  24. Moumni, Z.; Van Herpen, A.; Riberty, P. Fatigue analysis of shape memory alloys: Energy approach. Smart Mater. Struct. 2005, 14, S287–S292. [Google Scholar] [CrossRef]
  25. Ikeda, T.; Nae, F.A.; Naito, H.; Matsuzaki, Y. Constitutive model of shape memory alloys for unidirectional loading considering inner hysteresis loops. Smart Mater. Struct. 2004, 13, 916–925. [Google Scholar] [CrossRef]
  26. Saleeb, A.F.; Padula II, S.A.; Kumar, A. A multi-axial, multimechanism based constitutive model for the comprehensive representation of the evolutionary response of SMAs under general thermomechanical loading conditions. Int. J. Plast. 2011, 27, 655–687. [Google Scholar] [CrossRef]
  27. Karakalas, A.A.; Machairas, T.T.; Solomou, A.G.; Saravanos, D.A. Modeling of partial transformation cycles of SMAs with a modified hardening function. Smart Mater. Struct. 2019, 28, 1–20. [Google Scholar] [CrossRef]
  28. Benavent-Climent, A.; Galé-Lamuela, D.; Donaire-Avila, J. Energy capacity and seismic performance of RC waffle-flat plate structures under two components of far-field ground motions: Shake table tests. Earthquake Eng. Struct. Dyn. 2019, 48, 949–969. [Google Scholar] [CrossRef]
Figure 1. Phase diagram and stress-strain-temperature curve.
Metals 09 01099 g001
Figure 2. Idealized cyclic behavior of superelastic shape memory alloy (SMA).
Metals 09 01099 g002
Figure 3. DSC experiment.
Metals 09 01099 g003
Figure 4. Loading protocol 1 (frequency 0.02 Hz) used for specimens S11 to S16.
Metals 09 01099 g004
Figure 5. Loading protocol 2 applied at frequencies 0.02, 0.04, 0.2, 1.0 Hz used for S21, S22, D21, D22.
Metals 09 01099 g005
Figure 6. Loading protocol 3 (frequency 0.02 Hz) used for specimens S31, S32.
Metals 09 01099 g006
Figure 7. Loading protocol 4 (frequency 0.02 Hz) used for specimen S41.
Metals 09 01099 g007
Figure 8. Hysteresis loops of specimen S11.
Metals 09 01099 g008
Figure 9. Hysteresis loops of specimens: (a) S21, (b) S22, (c) D21, and (d) D22.
Metals 09 01099 g009
Figure 10. Hysteresis loops of specimens under quasi-static and dynamic loading at 6% strain.
Metals 09 01099 g010
Figure 11. Equivalent damping ζeq for 12.7 mm diameter NiTi bars.
Metals 09 01099 g011
Figure 12. Idealization of the loading branch of the force-deformation curve with two segments.
Metals 09 01099 g012
Figure 13. Normalized energy dissipation versus the number of cycles to failure.
Metals 09 01099 g013
Figure 14. Conventional flag-shape model.
Metals 09 01099 g014
Figure 15. Proposed hysteretic model: (a) flag-shape component, (b) elastic-perfectly plastic component, (c) complete model.
Metals 09 01099 g015
Figure 16. Comparison between the proposed hysteretic model and dynamic cyclic tests.
Metals 09 01099 g016
Figure 17. Assemblage of NiTi bars to form a hysteretic damper: (a) elevation, (b) sections, (c) detail of the anchorage of the NiTi bars.
Metals 09 01099 g017
Figure 18. Overall view of the experimental set up for the shake table tests.
Metals 09 01099 g018
Figure 19. Details of the experimental set up for the shake table tests: (a) elevation view A-A’, (b) elevation, (c) plan (first storey), (d) plan (second storey).
Metals 09 01099 g019
Figure 20. Experimental test vs numerical models implemented in FEM software.
Metals 09 01099 g020
Figure 21. Response of the structure with and without SMA dampers.
Metals 09 01099 g021
Table 1. Energy dissipated in a single cycle at ε = 6% amplitude and different frequencies.
ReferenceFrequency (Hz): ϕ (mm)σy (MPa)εy (%)EA (MPa) E ¯ D = E D / ( F y δ y ) E ¯ D , dynamic E ¯ D , static
0.021.00.021.00.021.00.021.0
McCormick [4]0.255045531.831.792753091.121.000.89
Zhu [17]0.583053091.221.122502752.101.480.71
Dolce [2]1.843904151.401.252793321.000.830.84
DesRoches [3]7.103153741.331.402372671.670.710.42
McCormick [4]12.703284141.331.542472691.410.780.56
This study12.702453591.121.392192581.781.110.62
Table 2. Ultimate normalized energy dissipation capacity.
ε (%) E ¯ D , static E ¯ D , static Nf E ¯ D , dynamic
4.01241.171060.73
4.01121.17960.73
2.52600.525000.32

