Article

{111}<110> Orientation Induced Anisotropy of Shape Memory Effect in NiTiNb Pipe Joints

Institute of Machinery Manufacturing Technology, China Academy of Engineering Physics, Mianyang 621900, China
*
Authors to whom correspondence should be addressed.
Metals 2020, 10(6), 776; https://doi.org/10.3390/met10060776
Submission received: 28 April 2020 / Revised: 28 May 2020 / Accepted: 4 June 2020 / Published: 11 June 2020
(This article belongs to the Special Issue Shape Memory Alloys 2020)

Abstract

:
This work aims to clarify the influence of texture type and intensity on the shape memory effect (SME) in NiTiNb shape memory alloy (SMA) pipe joints, especially revealing the causes for the anisotropy of SME via texture changes. Three NiTiNb rods with different intensities of the {111}<110> texture were fabricated, and their microstructures, crystalline orientation distribution functions and inverse pole figures were obtained by X-ray diffraction and electron backscatter diffraction measurements. Simultaneously, the SME was characterized by inner-diameter recoverability of the corresponding pipe joints. For a given intensity of the {111}<110> texture, the SME of the NiTiNb pipe joints strongly depended on the expansion direction due to {111}<110> orientation-induced anisotropy of SME. In addition, both the SME and anisotropy of NiTiNb pipe joints increased with the increased intensity of the {111}<110> texture. Therefore, a suitable expansion direction and strong texture intensity should be considered for high SME in NiTiNb pipe joints.

1. Introduction

NiTi-based shape memory alloys (SMAs), due to their unique shape memory effect (SME), have been wildly used in many fields such as aerospace, biomedicine, mechanical electronics and automotive industries [1,2,3,4]. Among them, one of the most important and successful applications is the pipe joint [5,6,7]. NiTiNb alloys, especially those with a nominal composition of Ni47Ti44Nb9 (at%), have attracted much attention as SMAs because they demonstrate wide transformation hysteresis after pre-deformation [8,9,10,11,12]. Thus, pipe joints constructed from NiTiNb alloys do not require storing and installing at low temperatures, which is quite useful for the engineering uses [13,14,15].
Generally, pipe joints are machined from NiTiNb rods and then expanded at low temperature to augment their inner diameter [16,17]. According to previous studies, in order to store and ship NiTiNb pipe joints at room temperature and simultaneously optimize the SME, researchers mainly pay attention to the key problem of finding appropriate expansion temperatures and critical expansion strains [18,19,20,21,22]. However, the expansion direction is rarely considered, despite the anisotropy of SME induced by texture in NiTiNb rods. Identifying the expansion direction that optimizes the SME is therefore crucial for fabricating high-performance NiTiNb pipe joints. The expansion direction can be controlled by preparing the pipe joints along the radial or axial direction of the rods.
As is well known, the NiTiNb rods used for pipe joints are typically prepared by vacuum melting, followed by thermomechanical deformation and finally by a suitable heat-treatment [23,24,25,26]. These processes inevitably generate crystallographic textures that profoundly affect the SME. It is necessary to understand which type of orientation features a higher reversibility and the extent to which texture intensity should be improved to satisfy pipe joints’ application. Currently, studies on texture of NiTiNb are mainly focused on the effect and control of deformation and heat-treatment on the final texture types [26,27,28,29]. For example, Yan et al. found that the main texture types in Ni47Ti44Nb9 hot-rolled rods concentrate on γ fiber (<111> // axial direction), while heat-treatment only decreases its intensity [26]. In addition, Yin et al. obtained <113> fiber texture in Ni47Ti44Nb9 hot-forged rods, which turned into a strong γ fiber texture after cold-drawing [27]. In contrast, the relationship between texture and SME has been rarely investigated. The few studies on this topic have concentrated on the variations of recovery strain between the rolling direction (RD) and transverse direction (TD) in thin sheets, whereas pipe joints are generally prepared from rods [26]. Moreover, the positive role of texture in the SME of NiTiNb pipe joints has not been clearly clarified, because the expansion stress states of these joints are far more complex than those of uniaxial tensile or compressed specimens.
In this study, using Ni47Ti44Nb9 as an example, three rods with different intensities of the {111}<110> texture were investigated. The study focused on clarifying the influence of texture type and intensity on the SME of Ni47Ti44Nb9 pipe joints, especially revealing the causes for the anisotropy of SME via texture changes. The aim is to provide referential data for engineering applications.

2. Experimental Procedures

As shown in Figure 1, first, vacuum induction melting was used to produce the master ingot of Ni47Ti44Nb9 (at%) with a diameter of 150 mm and a height of 200 mm. The master ingot was multi-directionally forged at 900 °C into 35 mm diameter rods for the sake of improving and homogenizing the microstructure of the as-cast ingot. To account for the influence of texture intensity on the resulting SME, the rods were rotary hot-forged along the axial direction by different passes to diameters of 15 mm, 10 mm and 8 mm (forming Samples A, B and C, respectively). Then, all rods were heat-treated in an evacuated quartz tube at 900 °C for 2 h followed by air quenching (AC) from high temperature to room temperature without cryogenic treatment. Finally, all samples were electric-discharge machined into the sizes needed for relevant measurements.
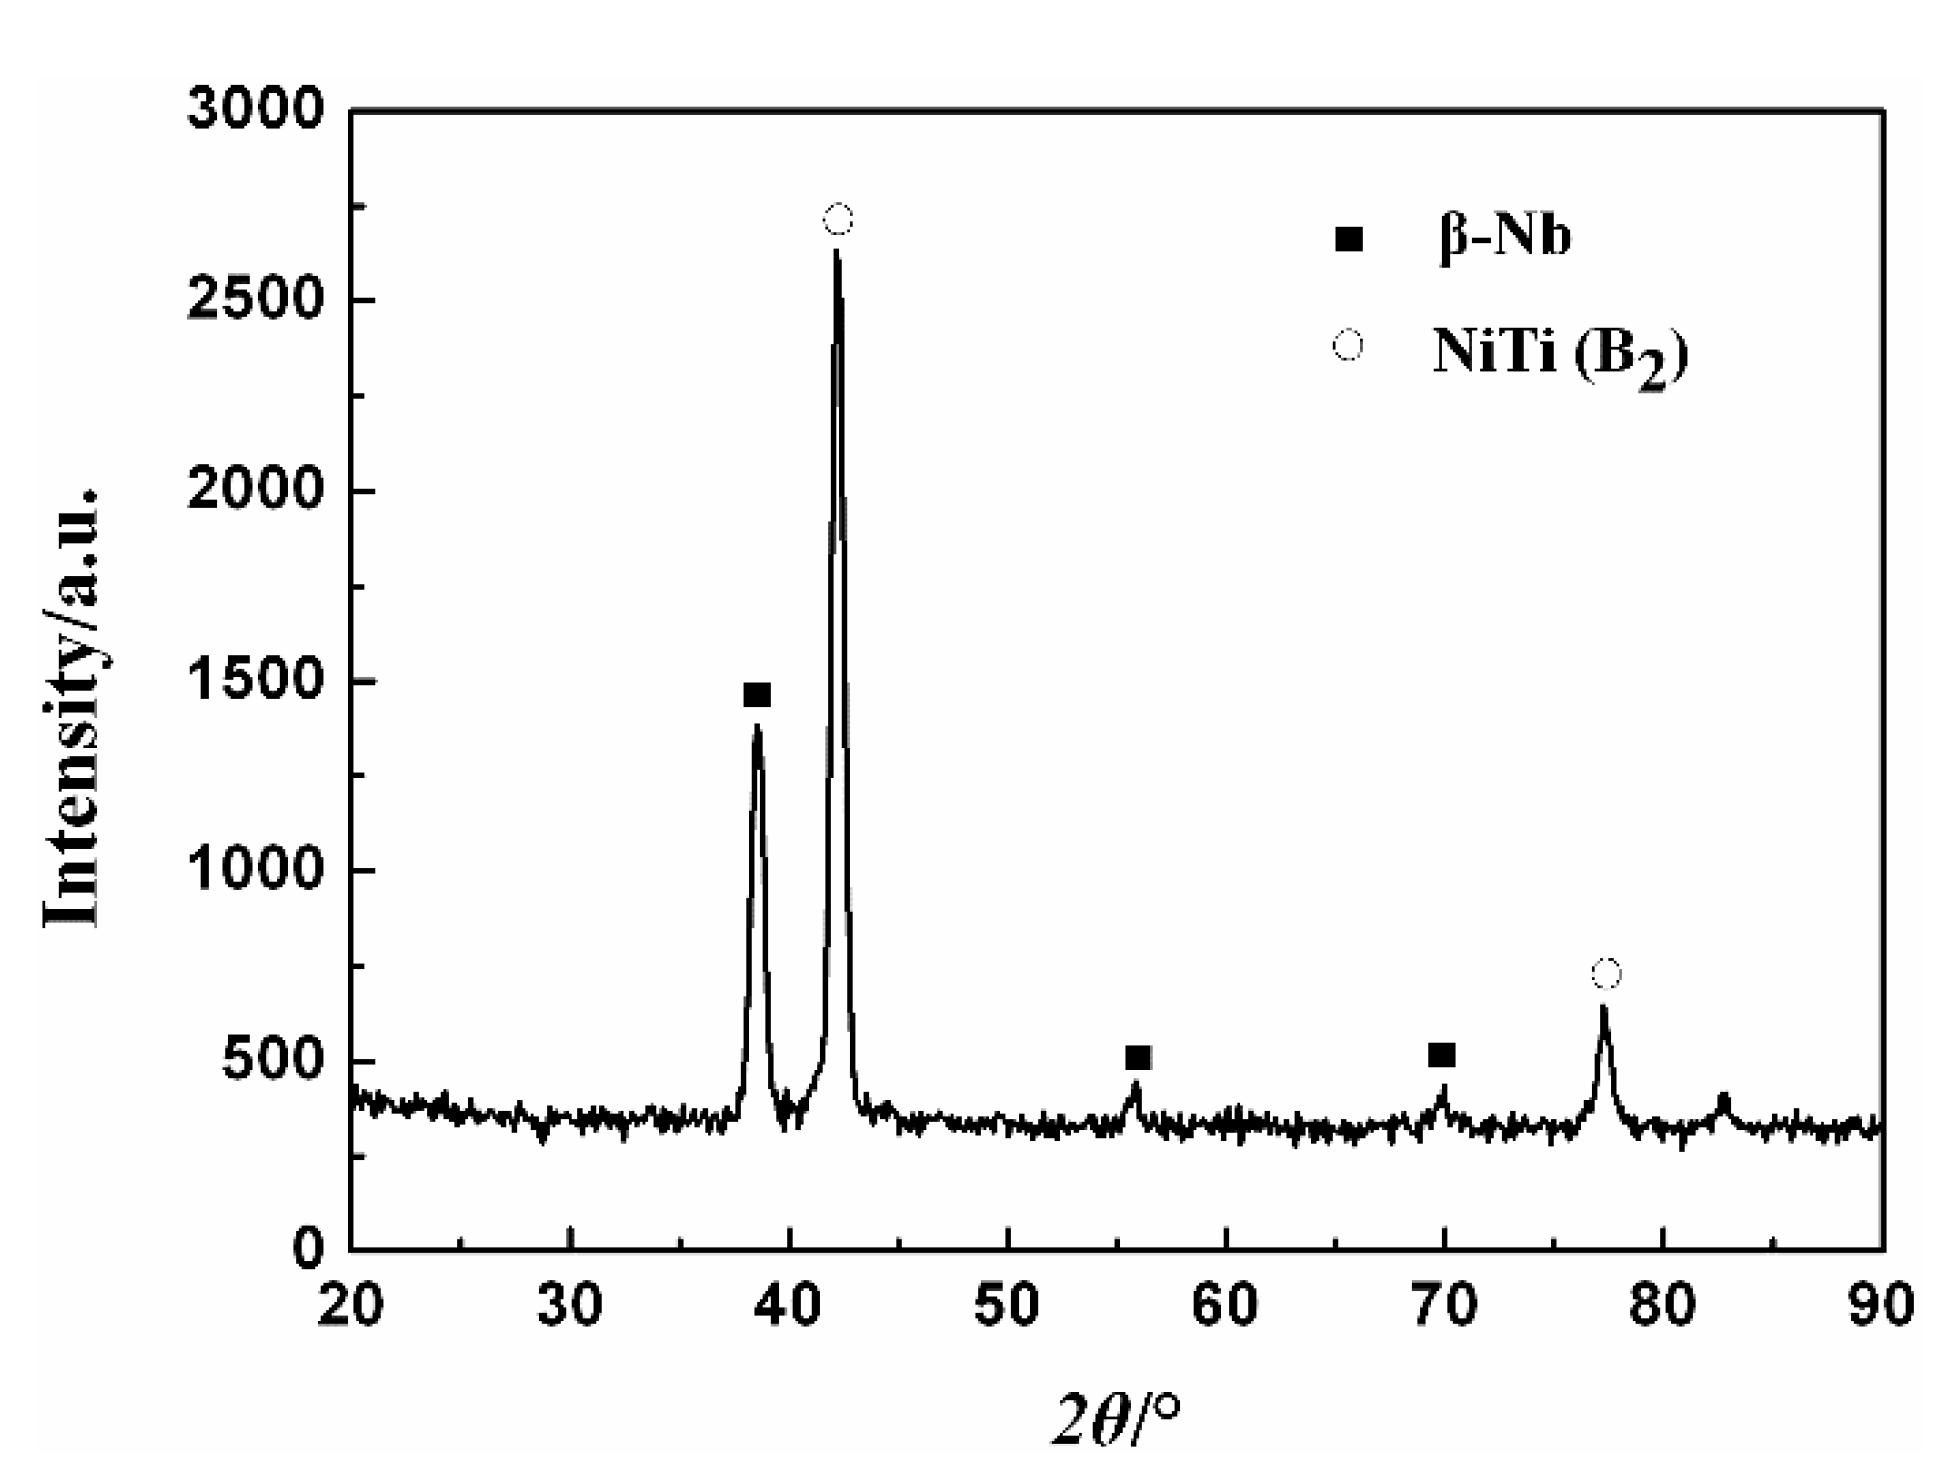
Phase identification and texture measurements were carried out by Cu Kα radiation using X-ray diffractometer (Empyrean, Panalytical, Almelo, Netherlands). The X-ray diffraction (XRD) patterns of the three samples are similar, as shown in Figure 2. The pole figures from the crystallographic planes {110}, {200}, {211} of the B2 phase were measured at α = 0–70° and β = 0–360° with a step size of 5° and presented as orientation distribution function (ODF) charts. The texture-test Samples A, B and C (with dimensions of 15 mm, 10 mm and 8 mm in diameter, respectively, and 5 mm in length) were machined in the excision direction, which is perpendicular to the axial direction of the rods, as seen in Figure 1. Thus, the measured texture component {hkl}<uvw> means that the {hkl} planes perpendicular to the axial direction of the rods, the <uvw> directions aligned along the radial direction and the <rst> directions aligned along the circumferential direction.
The phase transformation behavior was determined by differential scanning calorimeter (DSC, DSC 214 Polyma, Netzsch, Selb, Germany) at a 10 °C/min heating and cooling rate. DSC specimens (with dimensions of 1 × 1 × 2 mm3) were chemically washed in a mixed acid solution.
The microstructures were characterized by electron backscatter diffraction (EBSD) to reveal their crystallographic grain boundaries and grain orientations. Both cross sections and longitudinal sections of the rods were tested. Specimens for EBSD were mechanically polished and then vibratory polished in colloidal silica. Field emission scanning electron microscope (SEM, JSM-6700F, JEOL Ltd., Tokyo, Japan) equipped with an EBSD detector and data analysis software (OIMTM, TSL-EDAX, Mahwah, NJ, USA) was used for EBSD test. For a convenient analysis, the normal direction (ND) of the EBSD test zones was set perpendicular to the test plane of the rods and the RD for specimens with cross section and longitudinal section paralleled the radial direction and axial direction of the rods, respectively.
Tensile tests were carried out in an electronic universal testing system equipped with an environmental experiment box under a loading speed of 0.5 mm/min. Dog-bone-shaped tensile specimens were cut to a gauge length of 7 mm and a width of 1 mm, along the axial and radial direction of the rods, as shown in Figure 3a.
To ensure that the results closely matched those of actual engineering applications, the SME was characterized by inner-diameter recoverability of real pipe joints. The pipe joints were machined with an initial inner diameter (D0), a wall thickness of 1.5 mm and the expansion direction (ED) along the radial and axial direction of the rods, as shown in Figure 3b. Then, the pipe joints were heat-treated at 900 °C for 2 h in an evacuated quartz tube and then expanded at −60 °C by using a core bar. After the inner diameter (D1) was measured, the pipe joints were heated to 200 °C for 10 min to complete the inverse martensitic transformation. Then the inner diameter was again measured and recorded as D2 The recovery rate (η) and recovery strain (εr) of the pipe joints were calculated according to the following formulas:
η = D 1 D 2 D 1 D 0 × 100 %
ε r = D 1 D 2 D 0 × 100 %

3. Results

3.1. Texture Comparison and EBSD Characterization

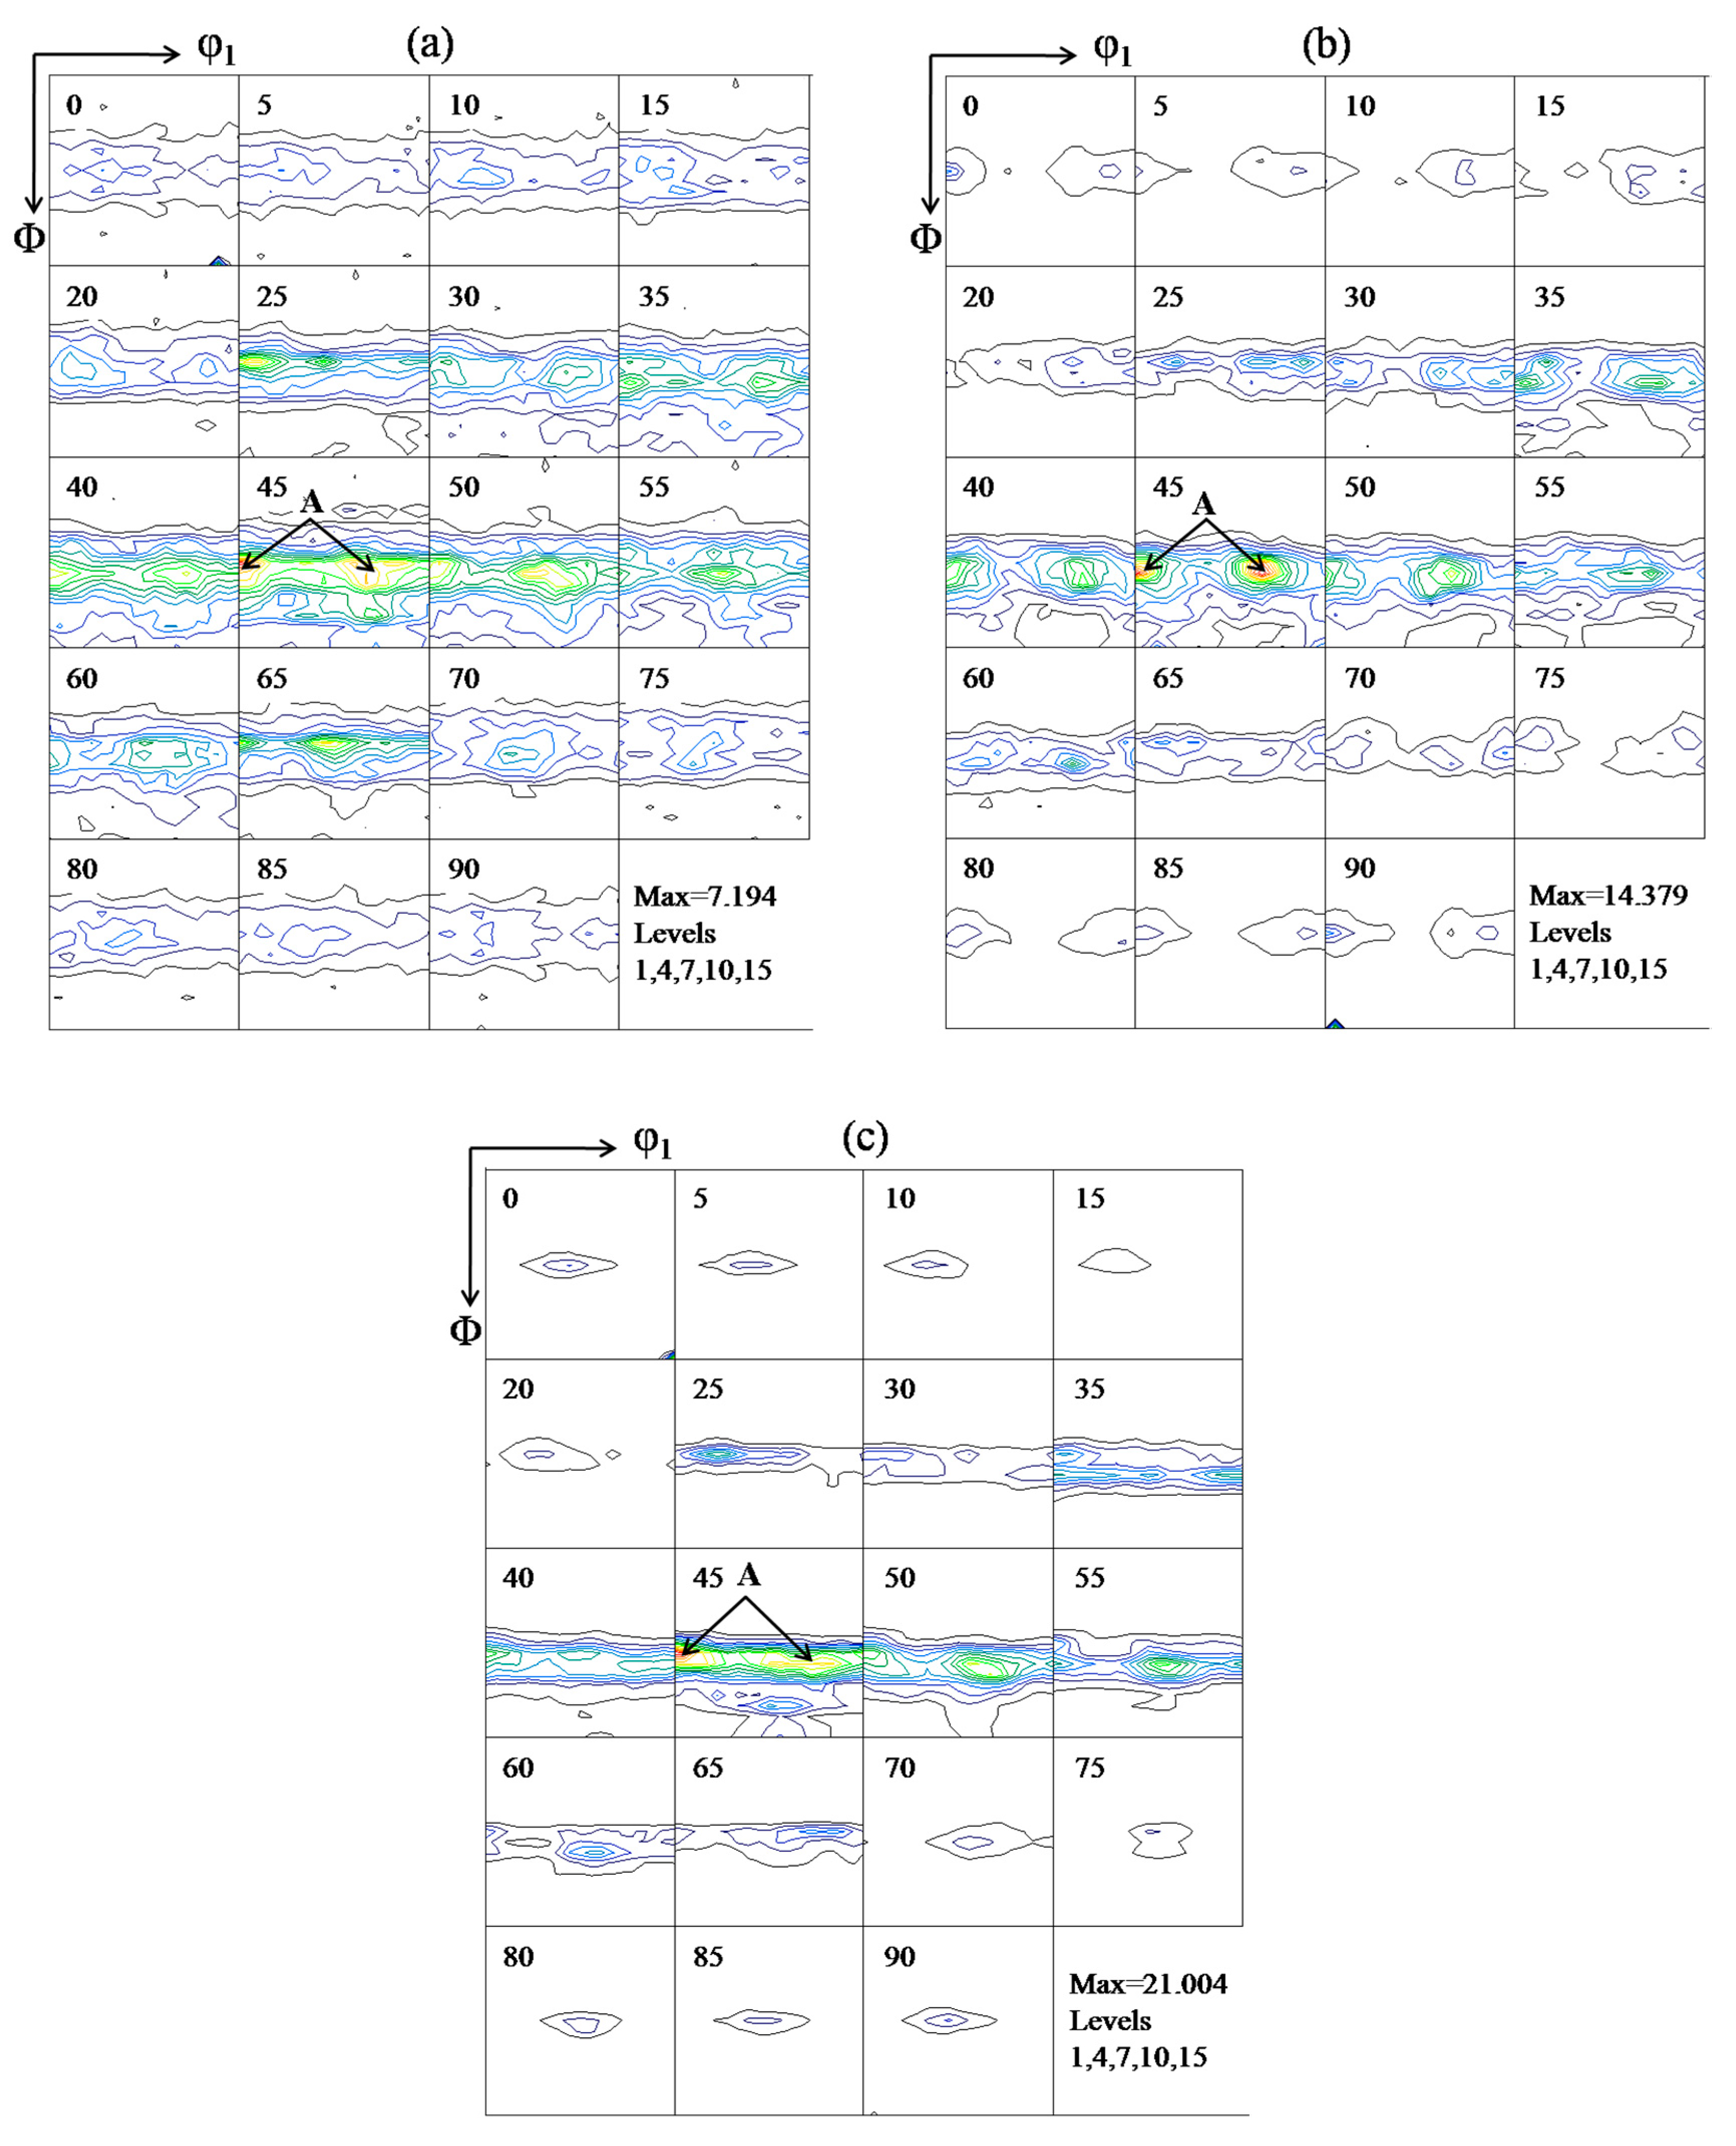
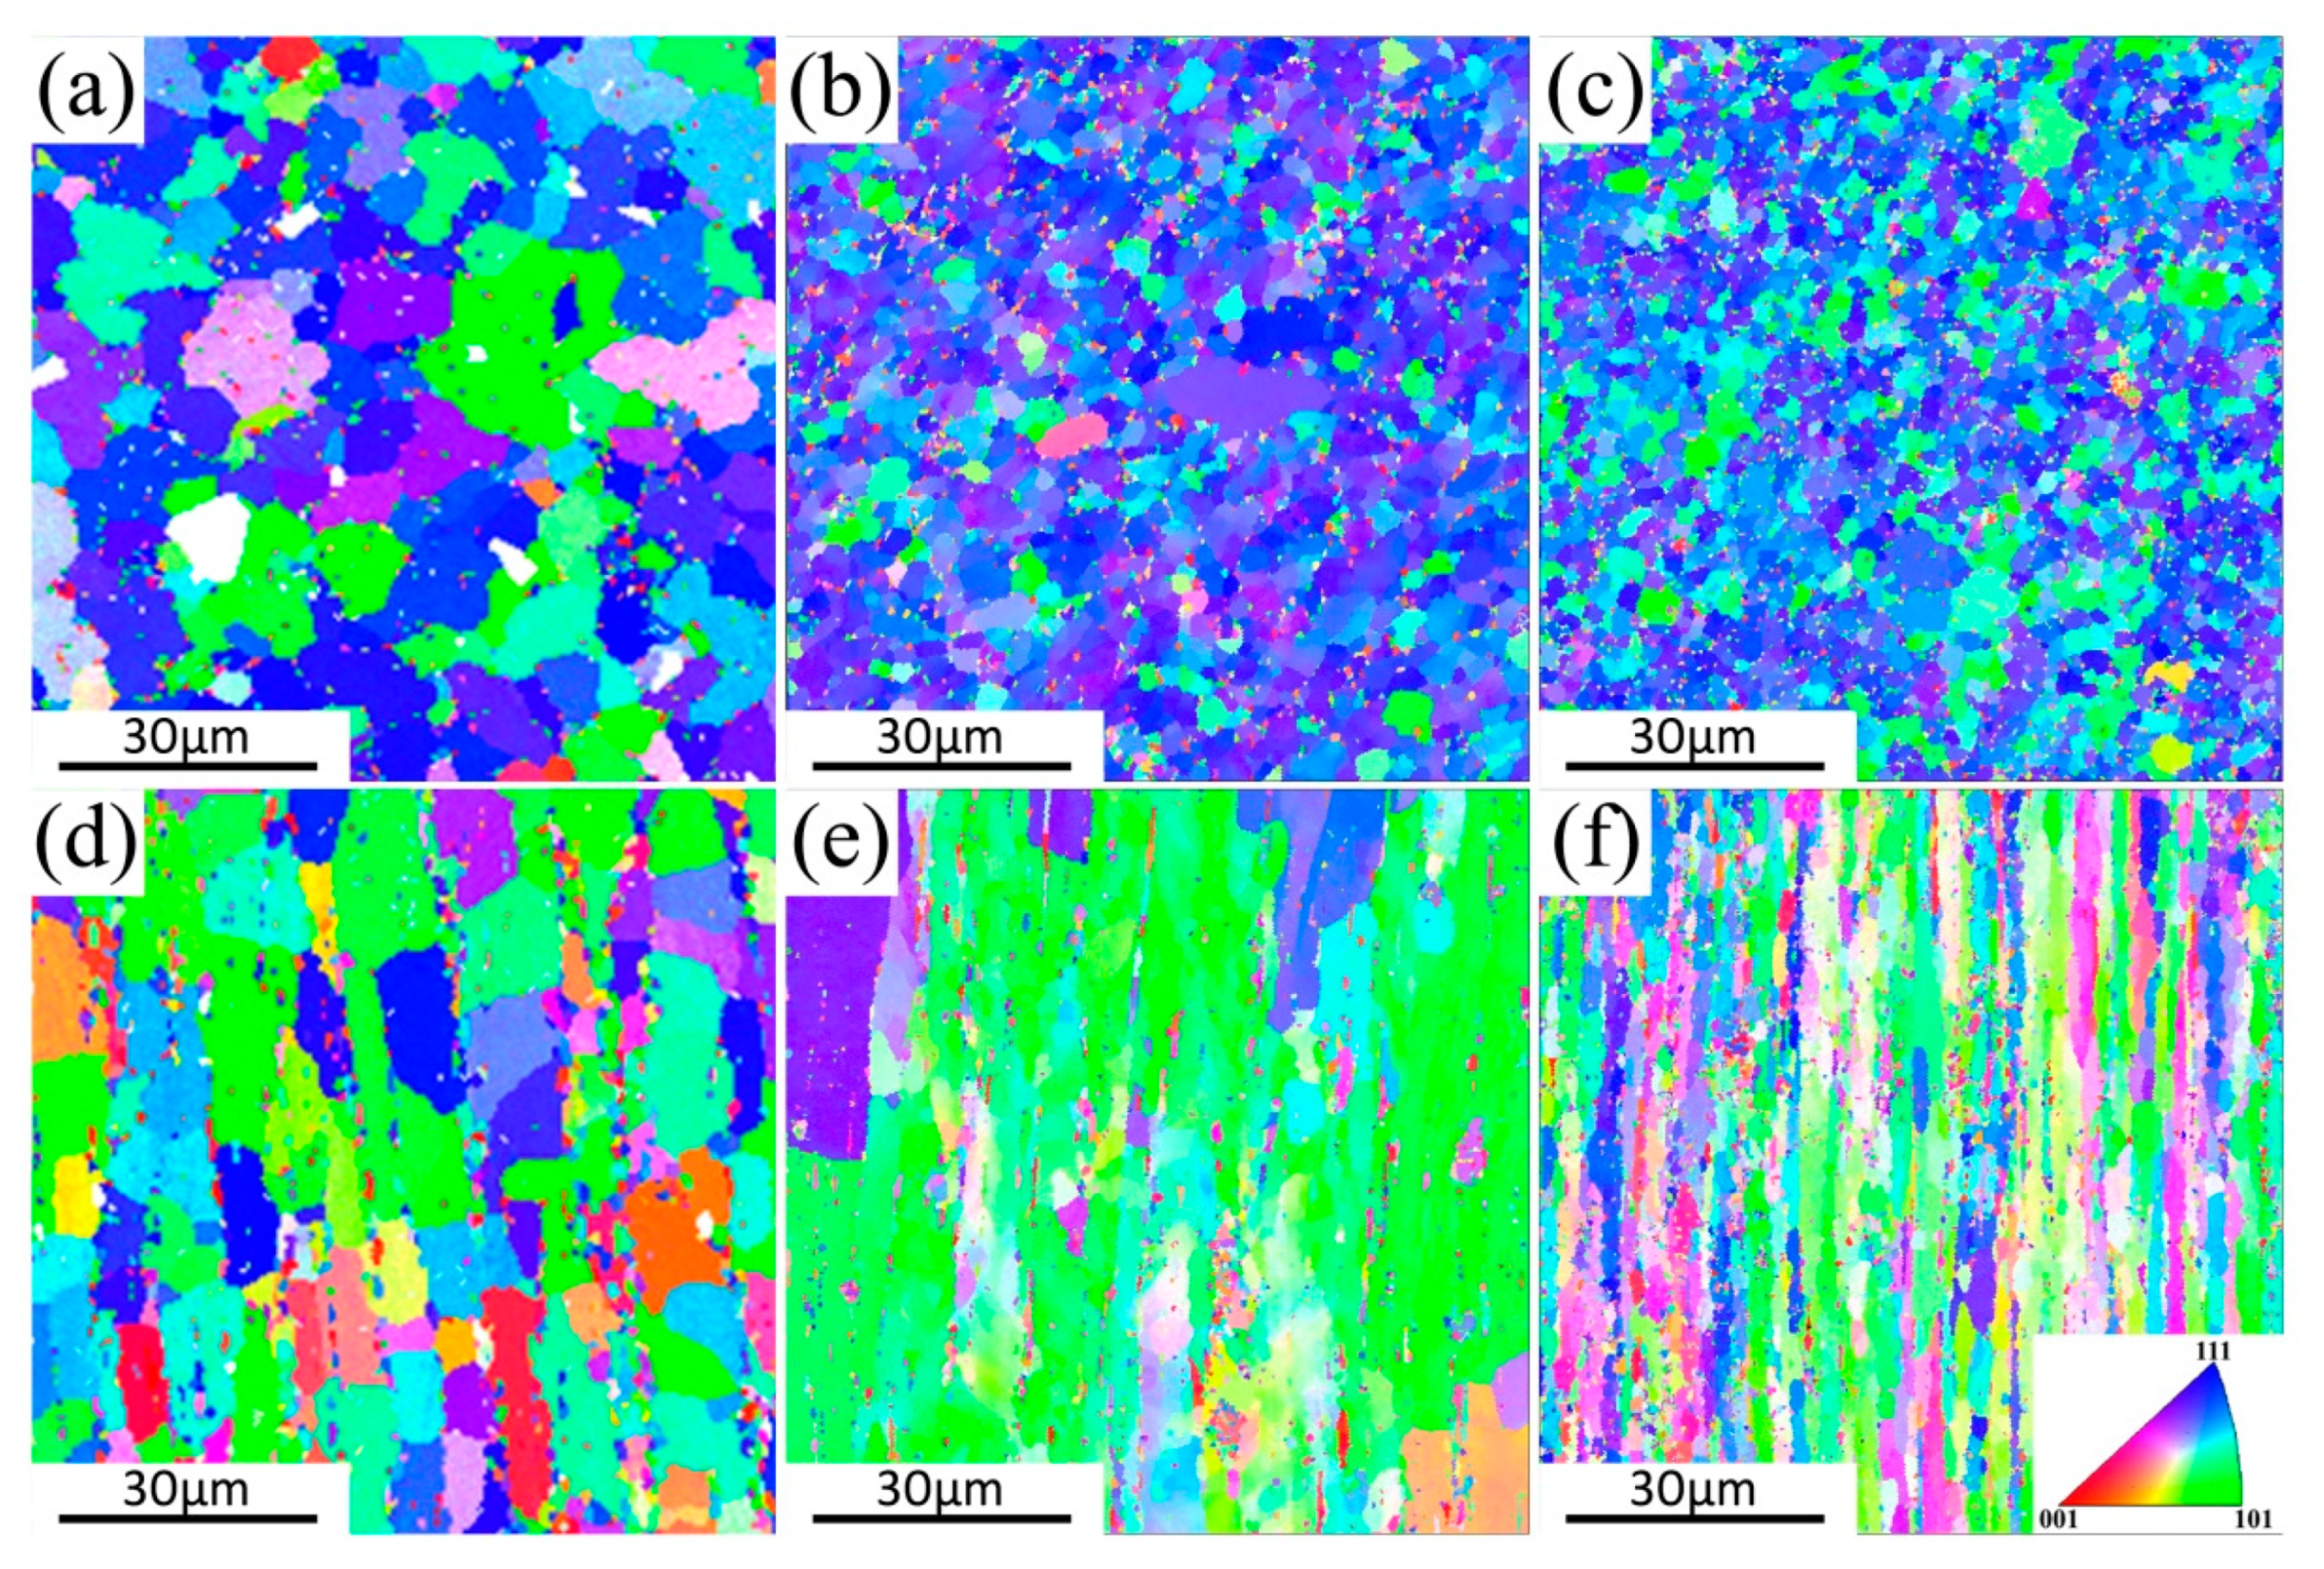
The ODF results of Samples A, B and C are shown in Figure 4. The preferred orientation of all samples concentrates on {111}<110>, as shown in the φ2 = 45° sections of Figure 4a–c. According to Yan’s analysis, on rotary hot forging, the radial direction of rod is subjected to compressive stress, slip planes rotate toward the direction perpendicular to the external stress axis and slip directions toward the plastic flow direction or to the rod axis [23]. Thereby, the {111}<110> texture formed in the hot-forged rods are mainly related to the activation of {111}<110> slip systems in the B2 phase. Meanwhile, the maximum orientation density of {111}<110>, from low to high, is ordered as A, B and C, indicating that the texture intensity can be controlled by the deformation degree. The inverse pole figure (IPF) maps of above three samples are obtained by EBSD test to present grain orientation (Figure 5). A strong {111}<110> texture is also observed in all samples, with grains in blue (<111> // axial direction) crossing most of the cross section and grains in green (<110> // radial direction) crossing most of the longitudinal section of the rods. This is consistent with the result tested by XRD above. In addition, grains of different shape with equiaxed grains on cross section (Figure 5a–c) and elongated grains on longitudinal section (Figure 5d–f) are observed, which means that the grains are elongated along the axial direction. Meanwhile, with the increase of deformation degree, the average grain size decreases and the grain morphology is further elongated.

3.2. Tensile Tests and Corresponding Anisotropic SME in the Rods

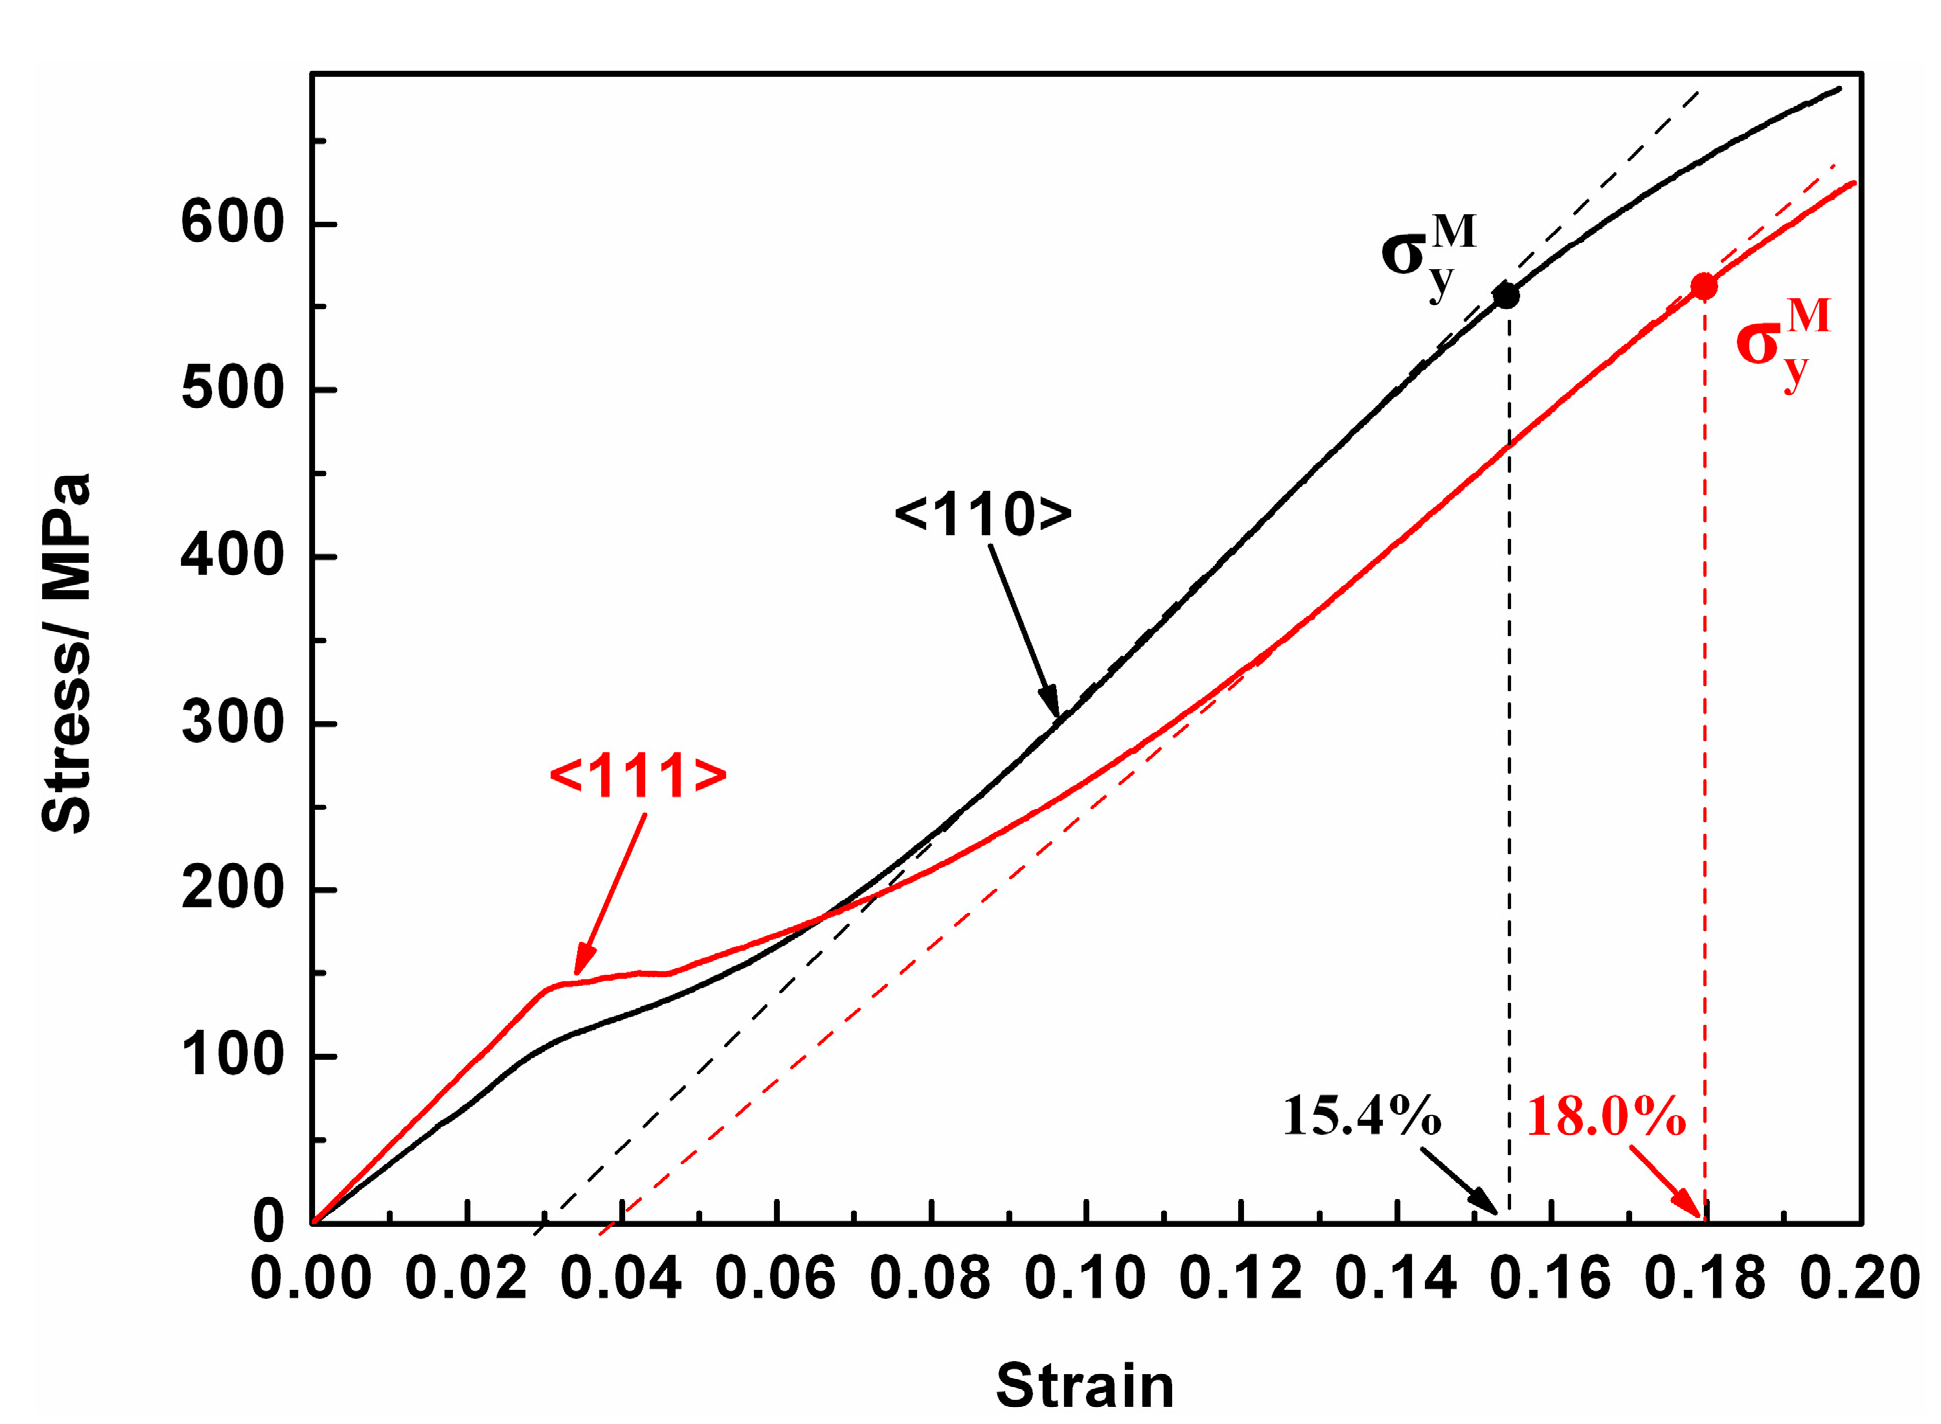
In order to clearly investigate the {111}<110> orientation-induced anisotropic SME in Ni47Ti44Nb9 pipe joints, the deformation mode of uniaxial tension in Ni47Ti44Nb9 rods is considered firstly. Taking Sample A as an example, dog-bone shaped tensile specimens are loaded at temperature of −60 °C, along the axial and radial direction (that is <111> and <110> direction, respectively) of the rods. As shown in Figure 6, the anisotropic stress–strain curves exhibit different length of phase transformation plateaus and different plateau stresses along the <111> and <110> directions. Specifically, the phase transformation plateau is longer along the <111> direction than along <110> direction and the plateau stress is higher along the <111> direction than that along the <110> direction. These results suggest that the stress-induced martensitic critical stress σsim along the <111> direction is larger. Meanwhile, the strain of the martensite nominal yield point (the nominal starting point that the dislocations begin to slip in martensite) is obviously larger along the <111> direction than along the <110> direction. In addition. after tension to 16%, the specimens are heated at 200 °C to calculate their recovery property. The recovery strain along the <111> direction is 9.7%, versus 9.1% along the <110> direction.

3.3. Recoverability of the Pipe Joins

Six pipe joins in each sample were measured for SME. The average value of η and εr are shown in Figure 7a,b, respectively. For the same expanding direction of ED1 or ED2, the average value of η and εr from low to high, is ordered as A, B and C. Meanwhile, in each sample, both η and εr along ED1 are higher than along ED2. In addition, the difference of recoverability between ED1 and ED2 increases on the order of A, B and C. These results reflect that Sample C with strongest texture of {111}<110> has the highest recoverability and the strongest anisotropy of recoverability and the reasons are discussed in the following section.

4. Discussions

4.1. Effects of {111}<110> Orientation on SME in the Uniaxial Tensile Samples

As is well known, the SME of SMA is determined by the crystallographic reversibility of the reverse martensite transformation. Therefore, different lattice orientations lead to distinct recoverability. Previously, several researchers concentrating on NiTi single crystals have shown that the tensile recovery strains of <001>, <110>, <111> are 2.7%, 8.4%, 9.8%, respectively, while compressive recovery strains of <001>, <110>, <111> are 4.2%, 5.2%, 3.6%, respectively [30,31]. As for Ni47Ti44Nb9 polycrystals, it is NiTi phase which plays the main role in recoverability, thus the recovery strain of the polycrystalline alloy can be computed as:
ε ¯ M = i = 1 n ε r i I i
Here ε ¯ M is the average recovery strain, εri is the recovery strain in each orientation, Ii is the proportion of each orientation among the total orientations, and n is the number of the orientations. Therefore, as for the uniaxial tensile samples, the recovery strain along the <111> direction is larger than that along the <110> direction, which is in agreement with above experimental results.
To deeply understand the causes for anisotropic SME between the <111> and <110> direction, the tensile curves are analyzed in detail. According to previous studies on NiTiNb, the phase transformation plateau in stress–strain curves is formed by stress-induced martensite transformation and reorientation, the reversibility of which contributes to the strain recovery [32,33]. Therefore, when subject to the same deformation strain, a long plateau generally indicates a large recovery strain. As shown in Figure 6, the plateau is longer along the <111> direction than along the <110> direction, so the most favorably oriented martensite variants originating from <111> can generate larger strain than that from <110>, thus resulting in high SME. In addition, the strain of martensite nominal yield point along <111> direction is obviously larger than that along <110> direction. Thus, when loaded to the same strain of 16%, dislocations are easily generated along the <110> direction, which will partly impede the reverse transformation, according to the previous research that deformation-induced dislocations/vacancies are considered to be related to the martensite stabilization [34]. Therefore, from this point of view, the recovery strain along <111> direction is also larger than that along <110> direction.
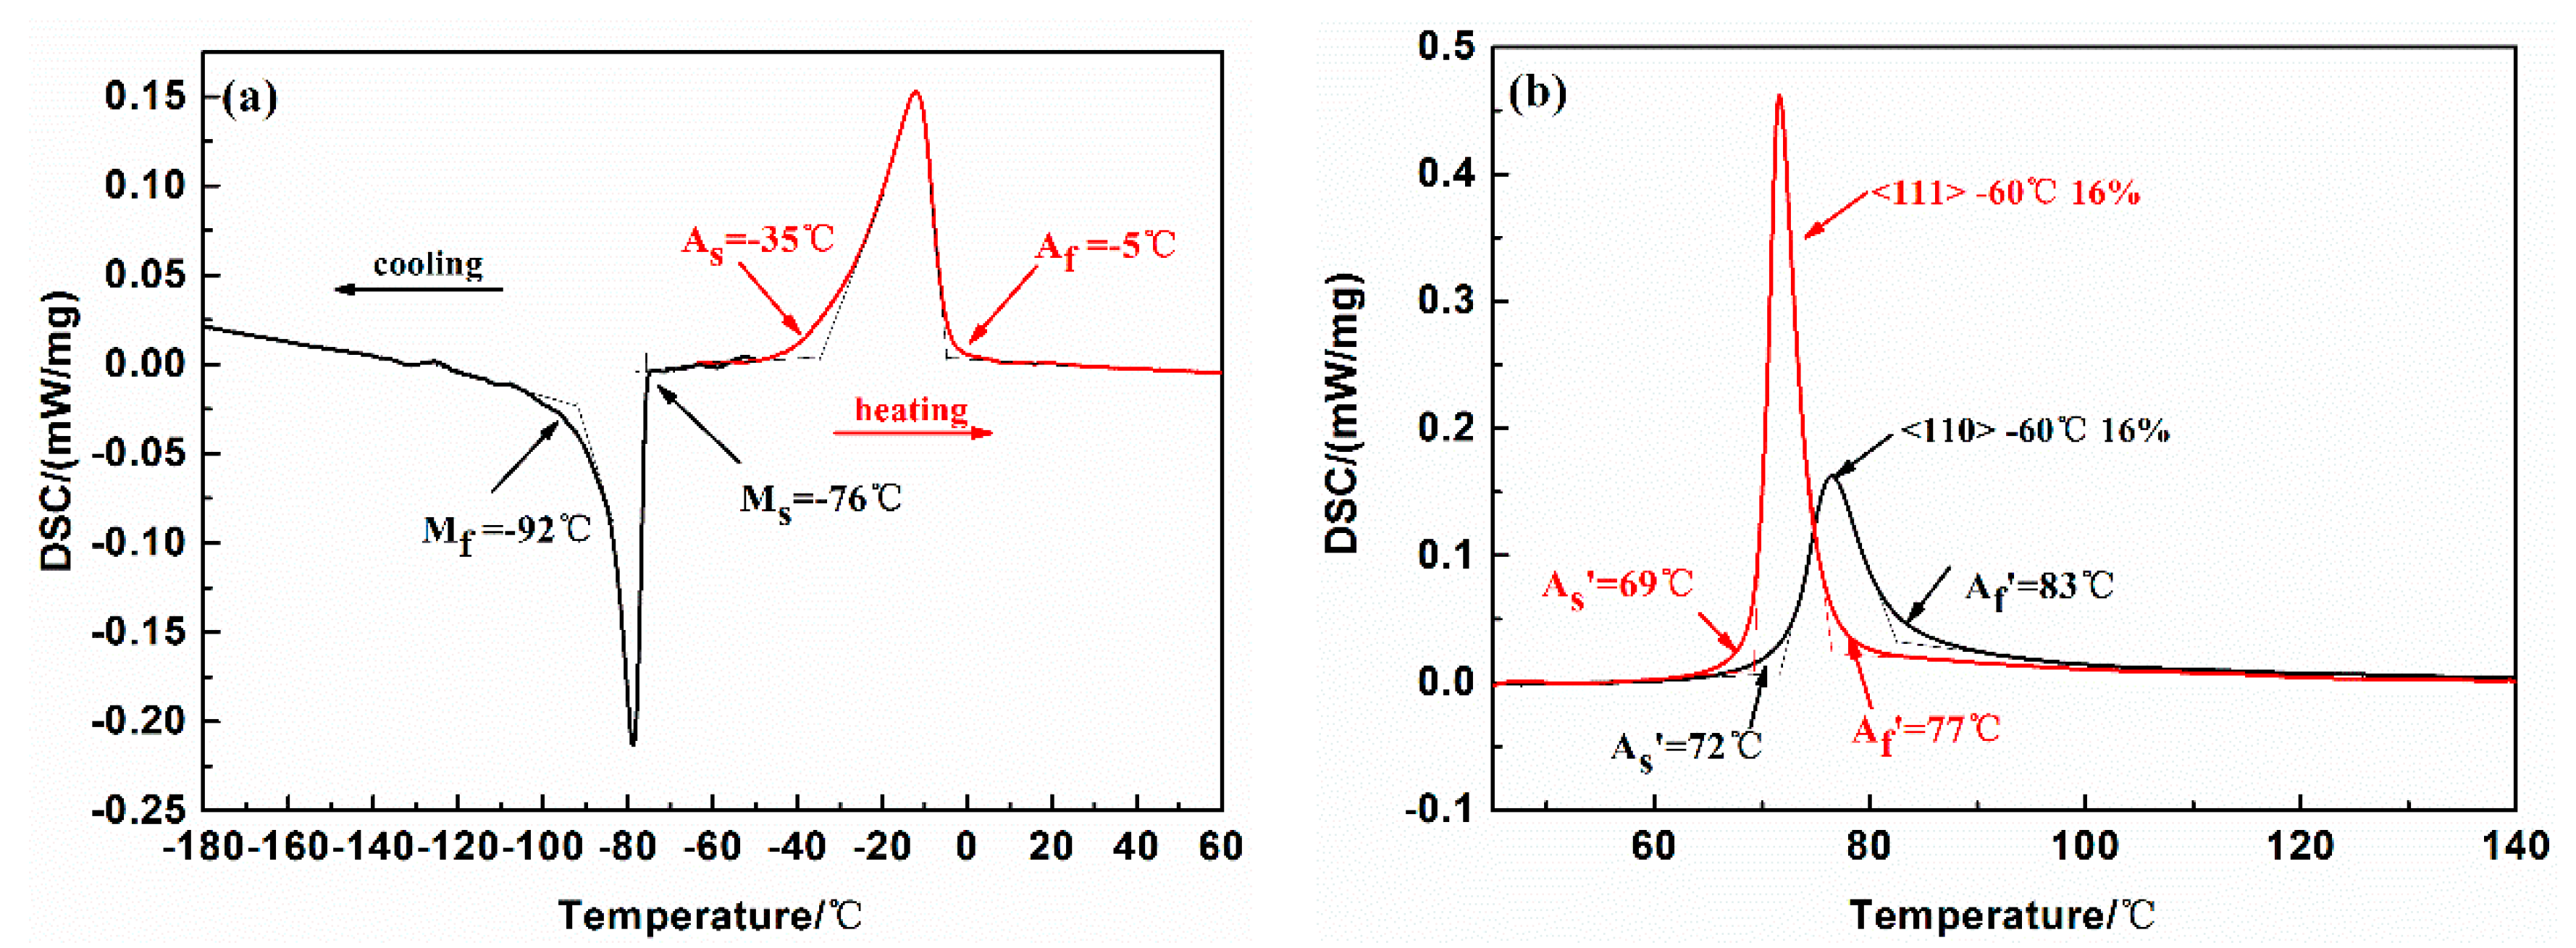
For more details, Figure 8 shows the DSC curves before and after 16% tension along the <111> and <110> directions at −60 °C. Shown in figure, the As and Af are largely increased after tension. In addition, the reverse transformation temperature of As along the <111> direction is 69 °C, which is lower than 72 °C along the <110> direction, indicating that the reverse transformation occurs more easily along the <111> direction. The reason for the difference in the transformation temperatures of both conditions presented is related to the martensite stabilization introduced by deform-induced dislocations/vacancies. Samples with more dislocations tend to highly impede the reverse transformation and make the reverse transformation temperature higher. The result also provides evidence that <111> direction tends to generate fewer dislocations, thus achieve higher recoverability, as is mentioned above.

4.2. Effects of {111}<110> Orientation on SME in Pipe Joints

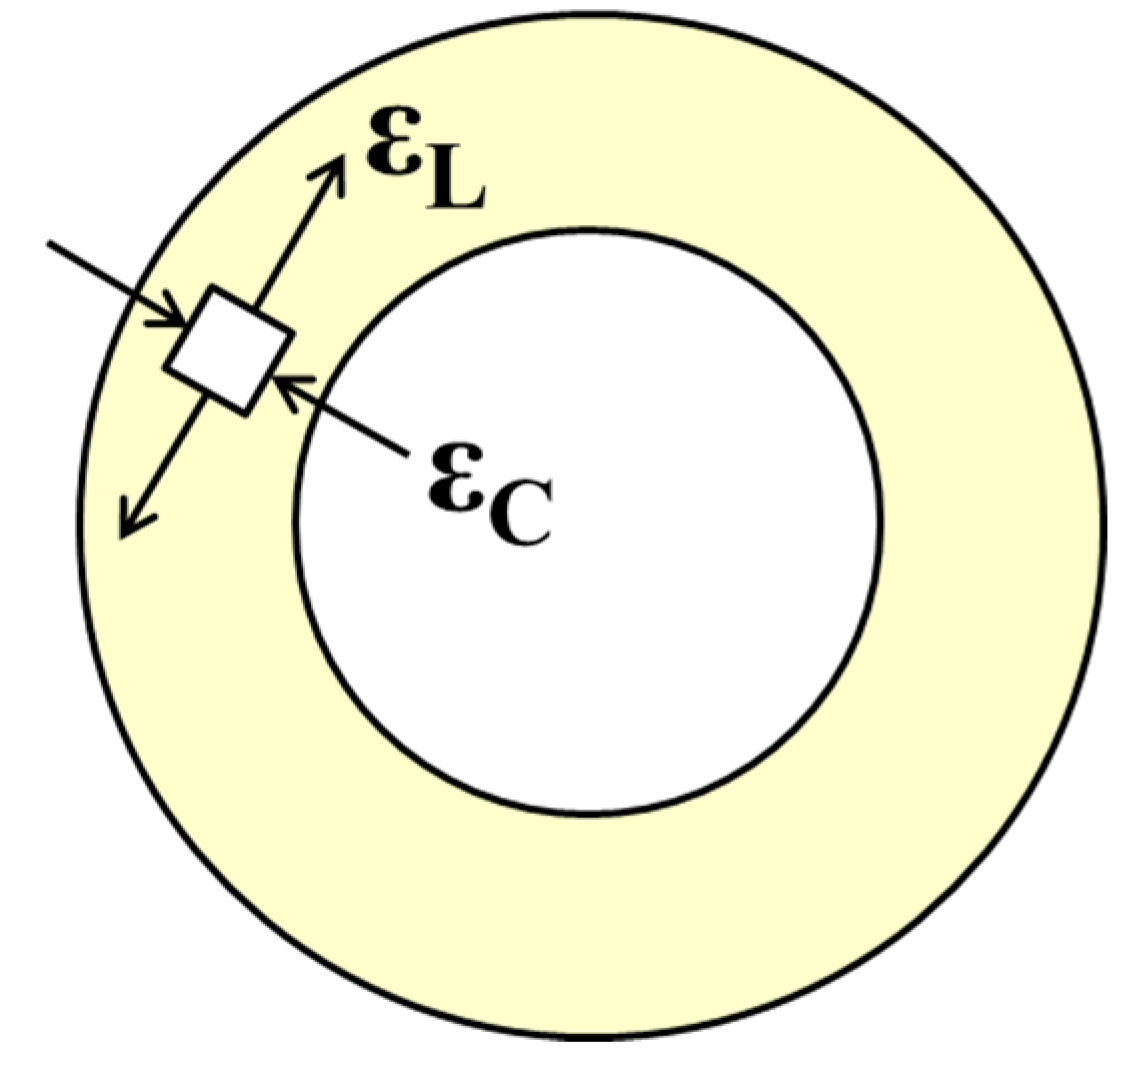
Different from uniaxial tensile sample, as for pipe joints, it should be analyzed in cylindrical coordinate rather than rectangular coordinate. With the inner diameter D0 expands to D1 in the cross section, the mechanical strain ε can be divided into a radial compressive strain εC and a circumferential tensile strain εL, as shown in Figure 9. During the heating process, the recovery of εC and εL make the inner diameter D1 decreasing to D2, thus realizing the connection of the two pipes. According to previous studies, the SME of pipe joints is mainly determined by circumferential strain εL rather than radial strain εC [27]. Hence, the recovery strain of pipe joints can be calculated as
ε ¯ M = i = 1 n ε L r i I i
Here εLri is the recovery strain originating from the circumferential tensile strain εL in each orientation.
Therefore, in samples of A, B, C with the same ED, the texture types are the same, while the texture intensity is different. In the order of A, B and C, the intensity of {111}<110> texture increases gradually, so the recoverability increases too, which is consistent with the results obtained in Figure 7.
In the same sample with different expansion directions of ED1 and ED2, the texture intensity is fixed, so the ε ¯ M is mainly determined by the εLri of the preferred orientation along the circumferential direction of the pipe joints. Taking sample C for an example, the IPF of ND, RD and TD is shown in Figure 10. There is high density preferred orientation in <111> district of ND IPF and <110> district of RD IPF and TD IPF, indicating that the <111> direction is parallel to the axial direction while the <110> direction is parallel to the radial and circumferential directions of the rod. Hence, when the pipe joint is expanded along ED1, the preferred orientation is <110> and this preferred orientation causes higher recovery strain, as is performed in single crystal materials. However, when expanded along ED2, the preferred orientation of circumferential direction in pipe joint is quite complicated, maybe including many orientations such as <111>, <110> and <001> with different recovery strains, thus the average recovery strain along ED2 is supposed to be smaller than that along ED1 due to the imbalance of recovery strain in many orientations.
In addition. the reason that the recoverability difference between ED1 and ED2 increases on the order of A, B and C can be related to the texture intensity obviously. The stronger texture intensity the rod has, the bigger the recoverability difference is. Hence, strong texture intensity can strengthen the anisotropy of the SME in Ni47Ti44Nb9 rods.
It is worth noting that, along with texture, grain size and grain morphology may also contribute to anisotropic SME. Both slender and small grains are expected to increase the anisotropy of SME. This trend may be explained by grain-boundary strengthening theory. Samples with more grain boundaries tend to own higher martensite yield stress. Thus, when loaded to the same strain, samples with more grain boundaries tend to generate fewer dislocations and exhibit better recoverability. However, it is still hard to know which factor plays a dominant role, since grain size, grain morphology and texture usually change together under deformation, and it is very hard to study a single factor without changing others. Obviously, to further clarify the cause, more work needs to be done.

5. Conclusions

1. The uniaxial tensile recovery strain along the <111> direction was larger than that along the <110> direction in NiTiNb rods;
2. For the same texture type of {111}<110> with the same expansion direction, the εr and η of the NiTiNb pipe joints increase along with increasing texture intensity. Thus, a strong texture intensity is desired in engineering applications;
3. For the same texture type of {111}<110> with the same texture intensity, the εr and η of the pipe joints along ED1 were higher than along ED2, indicating that the recoverability of NiTiNb pipe joints strongly depends on the expansion direction. Thus, the suitable expansion direction should be selected to improve the SME in pipe joints;
4. The recoverability difference between ED1 and ED2 increased along with increasing texture intensity, suggesting that a strong texture intensity further strengthens the anisotropy of the SME in NiTiNb rods.

Author Contributions

M.S. and S.H. proposed the main idea; M.S. and Q.F. made investigation; M.S. and Y.W. designed experiments with the help of Q.F.; M.S., Q.F. and Y.W. collected and analysed the data with the help of Q.Y., J.C. and Y.Z., M.S. wrote the original draft; Q.F., S.H. and Y.Z. reviewed and edited the draft. All authors have read and agreed to the published version of the manuscript.

Funding

This research was funded by NSAF (No. U1930207 and No. U1730125) and NSFC (No. 51901214).

Conflicts of Interest

The authors declare no conflict of interest.

References

  1. Chen, X.; Liu, T.; Li, R.; Liu, J.S.; Zhao, Y. Molecular dynamics simulation on the shape memory effect and superelasticity in NiTi shape memory alloy. Comput. Mater. Sci. 2018, 146, 61–69. [Google Scholar] [CrossRef]
  2. Luo, J.; Bobanga, J.O.; Lewandowski, J. Microstructural heterogeneity and texture of as-received, vacuum arc-cast, extruded, and re-extruded NiTi shape memory alloy. J. Alloy. Compd. 2017, 712, 494–509. [Google Scholar] [CrossRef]
  3. Wang, X.B.; Verlinden, B.; Kustov, S. Multi-stage martensitic transformation in Ni-rich NiTi shape memory alloys. Funct. Mater. Lett. 2017, 10, 1740004. [Google Scholar] [CrossRef]
  4. Li, J.; Wang, H.F.; Liu, J.; Ruan, J.M. Effects of Nb addition on microstructure and mechanical properties of TiNiNb alloys fabricated by elemental powder sintering. Mater. Sci. Eng. A 2014, 609, 235–240. [Google Scholar] [CrossRef]
  5. Tabesh, M.; Boyd, J.; Atli, K.; Karaman, I.; Lagoudas, D. Design, fabrication, and testing of a multiple-actuation shape memory alloy pipe coupler. J. Intell. Mater. Syst. Struct. 2017, 29, 1165. [Google Scholar] [CrossRef]
  6. Niccoli, F.; Garion, C.; Maletta, C.; Sgambitterra, E.; Furgiuele, F.; Chiggiato, P. Beam-pipe coupling in particle accelerators by shape memory alloy rings. Mater. Des. 2017, 114, 603–611. [Google Scholar] [CrossRef]
  7. Niccoli, F.; Garion, C.; Maletta, C.; Chiggiato, P. Shape-memory alloy rings as tight couplers between ultrahigh-vacuum pipes: Design and experimental assessment. J. Vac. Sci. Technol. A 2017, 35, 031601. [Google Scholar] [CrossRef]
  8. Piotrowski, B.; Ben Zineb, T.; Patoor, E.; Eberhardt, A. Modeling of niobium precipitates effect on the Ni47Ti44Nb9 Shape Memory Alloy behavior. Int. J. Plast. 2012, 36, 130–147. [Google Scholar] [CrossRef] [Green Version]
  9. Zhu, R.; Tang, G.; Shi, S.-Q.; Fu, M. Effect of electroplastic rolling on deformability and oxidation of NiTiNb shape memory alloy. J. Mater. Process. Technol. 2013, 213, 30–35. [Google Scholar] [CrossRef]
  10. Jiang, S.Y.; Mao, Z.N.; Zhang, Y.Q.; Hu, L. Mechanisms of nanocrystallization and amorphization of NiTiNb shape memory alloy subjected to severe plastic deformation. Procedia Eng. 2017, 207, 1493–1498. [Google Scholar] [CrossRef]
  11. Fan, Q.; Zhang, Y.; Zhang, Y.; Wang, Y.; Yan, E.; Huang, S.; Wen, Y. Influence of Ni/Ti ratio and Nb addition on martensite transformation behavior of NiTiNb alloys. J. Alloy. Compd. 2019, 790, 1167–1176. [Google Scholar] [CrossRef]
  12. Fan, Q.C.; Sun, M.Y.; Zhang, Y.H.; Wang, Y.Y.; Zhang, Y.; Peng, H.B.; Sun, K.H.; Fan, X.H.; Huang, S.K.; Wen, Y.H. Influence of precipitation on phase transformation and mechanical properties of Ni-rich NiTiNb alloys. Mater. Charact. 2019, 154, 148–160. [Google Scholar] [CrossRef]
  13. Liu, W.; Zhao, X.Q. Mechanical Properties and Transformation Behavior of NiTiNb Shape Memory Alloys. Chin. J. Aeronaut. 2009, 22, 540–543. [Google Scholar]
  14. He, X.M.; Rong, L.J. Effect of Deformation on the Stress-Induced Martensitic Transformation in (Ni47Ti44)100-xNbx Shape Memory Alloys with Wide Hysteresis. Met. Mater Int. 2006, 12, 279–288. [Google Scholar] [CrossRef]
  15. He, X.M.; Rong, L.J. DSC analysis of reverse martensitic transformation in deformed Ti–Ni–Nb shape memory alloy. Scr. Mater. 2004, 51, 7–11. [Google Scholar] [CrossRef]
  16. Wang, L.; Rong, L.J.; Yan, D.S.; Jiang, Z.M.; Li, Y.Y. DSC study of the reverse martensitic transformation behavior in a shape memory alloy pipe-joint. Intermetallics 2005, 13, 403–407. [Google Scholar] [CrossRef]
  17. Tabesh, M.; Atli, K.; Rohmer, J.; Franco, B.; Karaman, I.; Boyd, J.G.; Lagoudas, D. Design of shape memory alloy pipe couplers: Modeling and experiments. Ind. Commer. Appl. Smart Struct. Technol. 2012, 8343, 83430J. [Google Scholar] [CrossRef]
  18. Yang, G.L.; Ni, Z.M.; Han, J.; Wang, E.M. Simulation on Pipe Joints Expansion Technology of NiTiNb Shape Memory Alloy. Adv. Mater. Res. 2011, 189–193, 1711–1717. [Google Scholar] [CrossRef]
  19. Uchida, K.; Shigenaka, N.; Sakuma, T.; Sutou, Y.; Yamauchi, K. Effects of Pre-Strain and Heat Treatment Temperature on Phase Transformation Temperature and Shape Recovery Stress of Ti-Ni-Nb Shape Memory Alloys for Pipe Joint Applications. Mater. Trans. 2008, 49, 1650–1655. [Google Scholar] [CrossRef] [Green Version]
  20. Zhang, C.S. Effects of deformation on the transformation hysteresis and shape memory effect in a Ni47Ti44Nb9 alloy. Scr. Mater. 1990, 24, 1807–1812. [Google Scholar] [CrossRef]
  21. Wang, K.L.; Lu, S.Q.; Li, G.F.; Liu, J.W.; Wang, E.M. Influence of Pre-Deformation Strain on Recovery Performance of Ni47Ti44Nb9 Alloy Φ8mm Pipe Joint. Adv. Mater. Res. 2015, 1095, 140–144. [Google Scholar] [CrossRef]
  22. Li, G.F.; Lu, S.Q.; Wang, K.L.; Liu, J.W.; Wang, E.M. Influence of Predeformation Temperature on Recovery Performance of Ni47Ti44Nb9 Alloy Φ16mm Pipe Joint. Adv. Mater. Res. 2014, 904, 41–45. [Google Scholar] [CrossRef]
  23. Wang, E.M.; Hong, Q.H.; Ni, Z.M.; Han, J. Influence of Processing State on Recovery Stress in NiTiNb Shape Memory Alloy. Adv. Mater. Res. 2014, 875–877, 1525–1528. [Google Scholar] [CrossRef]
  24. Cai, S.; Schaffer, J.E.; Ren, Y.; Wang, L. Deformation of a super-elastic NiTiNb alloy with controllable stress hysteresis. Appl. Phys. Lett. 2016, 108, 261901. [Google Scholar] [CrossRef]
  25. Hamilton, R.F.; Lanba, A.; Ozbulut, O.E.; Tittmann, B.R. Shape Memory Effect in Cast Versus Deformation-Processed NiTiNb Alloys. Shape Mem. Superelast. 2015, 1, 117–123. [Google Scholar] [CrossRef] [Green Version]
  26. Yan, Y.; Jin, W.; Li, X. Texture Development in the Ni47Ti44Nb9 Shape Memory Alloy During Successive Thermomechanical Processing and Its Effect on Shape Memory and Mechanical Properties. Met. Mater. Trans. A 2012, 44, 978–989. [Google Scholar] [CrossRef]
  27. Yin, X.; Mi, X.; Li, Y.; Gao, B. Microstructure and Properties of Deformation Processed Polycrystalline Ni47Ti44Nb9 Shape Memory Alloy. J. Mater. Eng. Perform. 2012, 21, 2684–2690. [Google Scholar] [CrossRef]
  28. Feng, Z.W.; Mi, X.J.; Wang, J.B.; Yuan, Z.S.; Zhou, J. Effect of Annealing Temperature on the Transformation Temperature and Texture of Ni47Ti44Nb9 Cold-Rolled Plate. Adv. Mater. Res. 2012, 557, 1281–1287. [Google Scholar] [CrossRef]
  29. Liu, H.; Sun, G.; Wang, Y.; Chen, B.; Tian, Q.; Wang, X.; Zhang, C. Texture evolution in shocked Ni47Ti44Nb9 shape memory alloys. Mater. Sci. Technol. 2013, 29, 1499–1502. [Google Scholar] [CrossRef]
  30. Gall, K.; Sehitoglu, H.; Chumlyakov, Y.I.; Kireeva, I.V. Tension-compression asymmetry of the stress-strain response in aged single crystal and polycrystalline. NiTi Acta Mater. 1999, 47, 1203–1217. [Google Scholar] [CrossRef]
  31. Miyazaki, S.; Kimura, S.; Otsuka, K.; Suzuki, Y. The habit plane and transformation strains associated with the martensitic transformation in Ti-Ni single crystals. Scr. Metall. 1984, 18, 883. [Google Scholar] [CrossRef]
  32. Sun, G.A.; Wang, X.L.; Wang, Y.D.; Woo, W.C.; Wang, H.; Liu, X.P.; Chen, B.; Fu, Y.Q.; Sheng, L.S.; Ren, Y. In-situ high-energy synchrotron X-ray diffraction study of micromechanical behavior of multiple phases in Ni47Ti44Nb9 shape memory alloy. Mater. Sci. Eng. A 2013, 560, 458–465. [Google Scholar] [CrossRef]
  33. Chen, X.; Peng, X.; Chen, B.; Han, J.; Zeng, Z.; Hu, N. Experimental investigation on transformation, reorientation and plasticity of Ni47Ti44Nb9SMA under biaxial thermal–mechanical loading. Smart Mater. Struct. 2015, 24, 75025. [Google Scholar] [CrossRef]
  34. Lin, H.C.; Wu, S.K.; Chou, T.S.; Kao, H.P. The effects of cold rolling on the martensitic transformation of an equiatomic TiNi alloy. Acta Metall. Mater. 1991, 39, 2069–2080. [Google Scholar] [CrossRef]
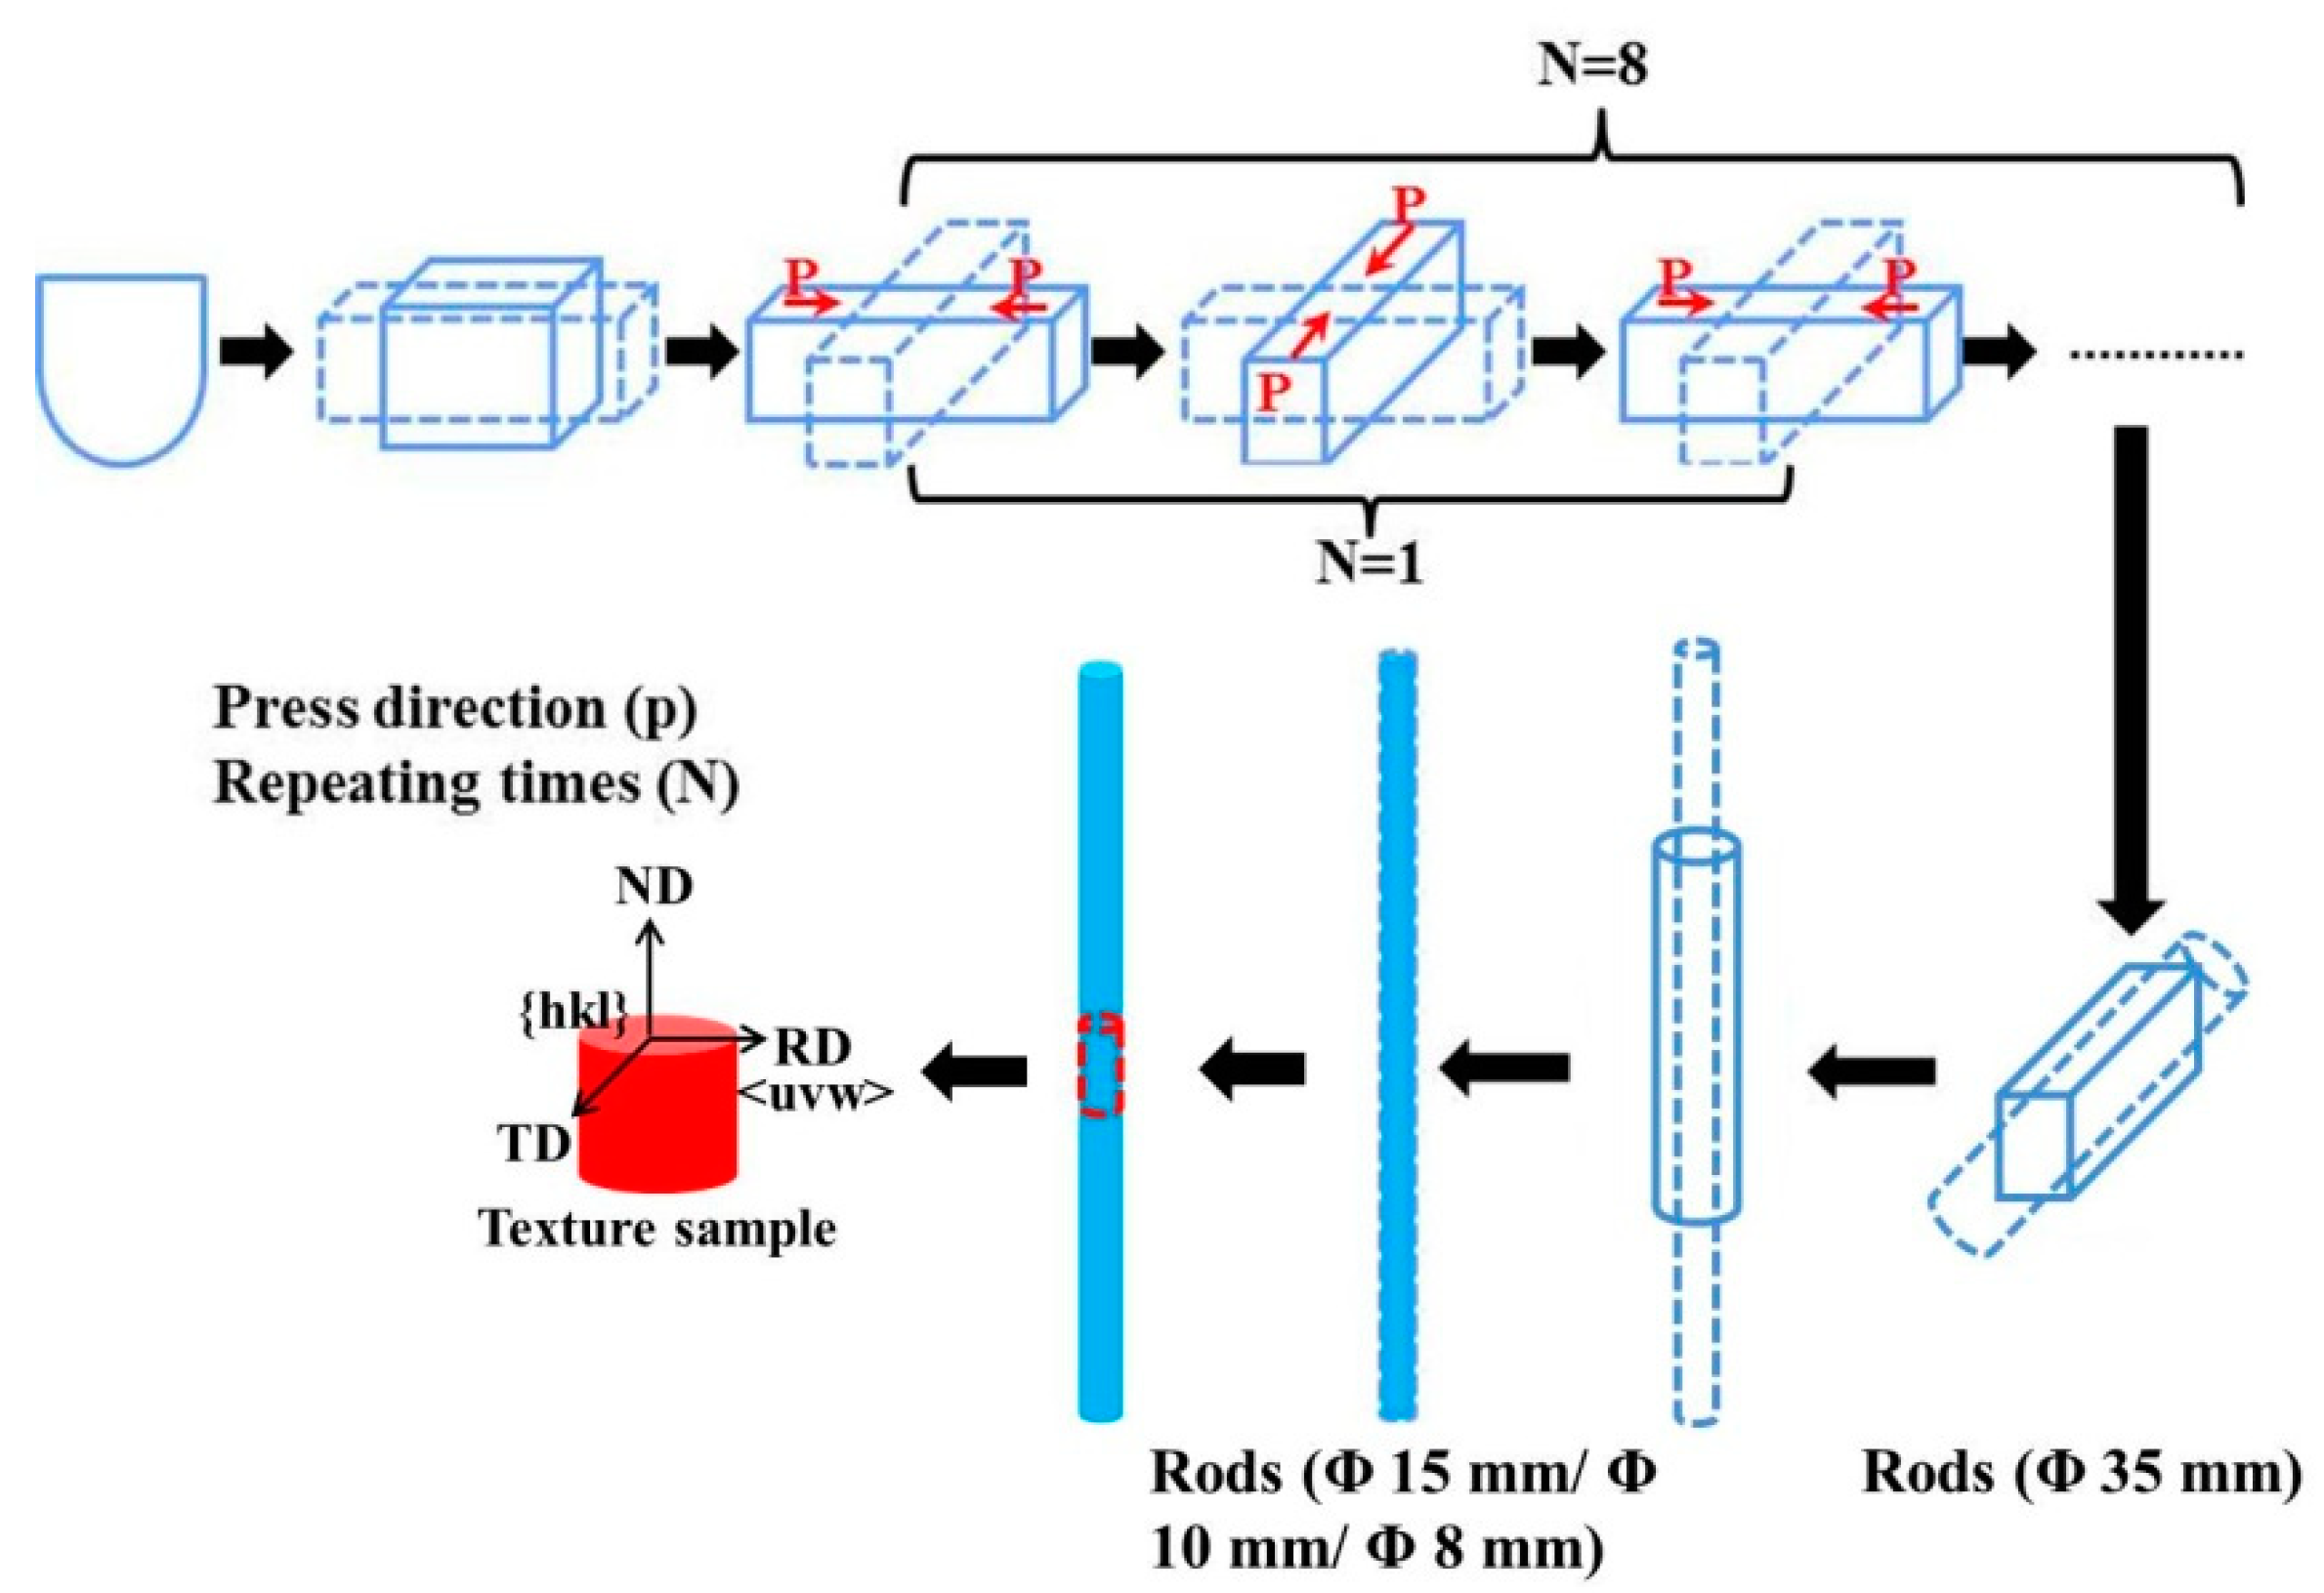
Figure 1. Schematic of the fabrication process of hot-forged rods and the orientations of the samples cut from the rods for texture measurements.
Metals 10 00776 g001
Figure 2. X-ray diffraction (XRD) patterns of Samples A, B and C, with the β-Nb and NiTi (B2) peaks identified.
Metals 10 00776 g002
Figure 3. Schematic of the samples used for (a) the tensile test and (b) the shape memory effect (SME) test.
Metals 10 00776 g003
Figure 4. Orientation distribution function (ODF) results of the Ni47Ti44Nb9 rods. (a) Sample A, (b) Sample B and (c) Sample C. Point A represents the {111}<110> component.
Metals 10 00776 g004
Figure 5. Inverse pole figure (IPF) maps of the NiTi (B2) phase in different states, representing the preferred crystalline orientation in the normal direction (ND) of the test planes. (ac) cross sections of Samples A, B and C, respectively; (df) longitudinal sections of Samples A, B and C, respectively.
Metals 10 00776 g005
Figure 6. Tensile curves obtained during loading at −60 °C along the <111> and <110> direction. The martensite yield nominal point is got from the intersection of true stress–strain curve with the martensite elastic stage tangent after 0.2% horizontal movement.
Metals 10 00776 g006
Figure 7. Recoverability of Samples A, B and C along the expansion directions of ED1 and ED2: (a) recovery rate η and (b) recovery strain εr.
Metals 10 00776 g007
Figure 8. Differential scanning calorimetry (DSC) curves (a) before and (b) after tension to 16% at −60 °C along the <111> and <110> direction.
Metals 10 00776 g008
Figure 9. Schematic of the strain state in the cross section of a pipe joint.
Metals 10 00776 g009
Figure 10. Inverse pole figures (IPFs) of Sample C, representing the preferred crystalline orientations in the axial direction (ND), radial direction (RD) and circumferential direction (TD) of the rod.
Metals 10 00776 g010