Characterization of the Microstructure, Local Macro-Texture and Residual Stress Field of Commercially Pure Titanium Grade 2 Prepared by CONFORM ECAP

 ,
, 
Abstract
1. Introduction
2. Materials and Methods
2.1. Neutron Diffraction
- (1)
- diffraction vector was parallel with the radial direction of the sample;
- (2)
- diffraction vector was parallel with the hoop direction;
- (3)
- diffraction vector was parallel with the axial direction.
2.2. EBSD
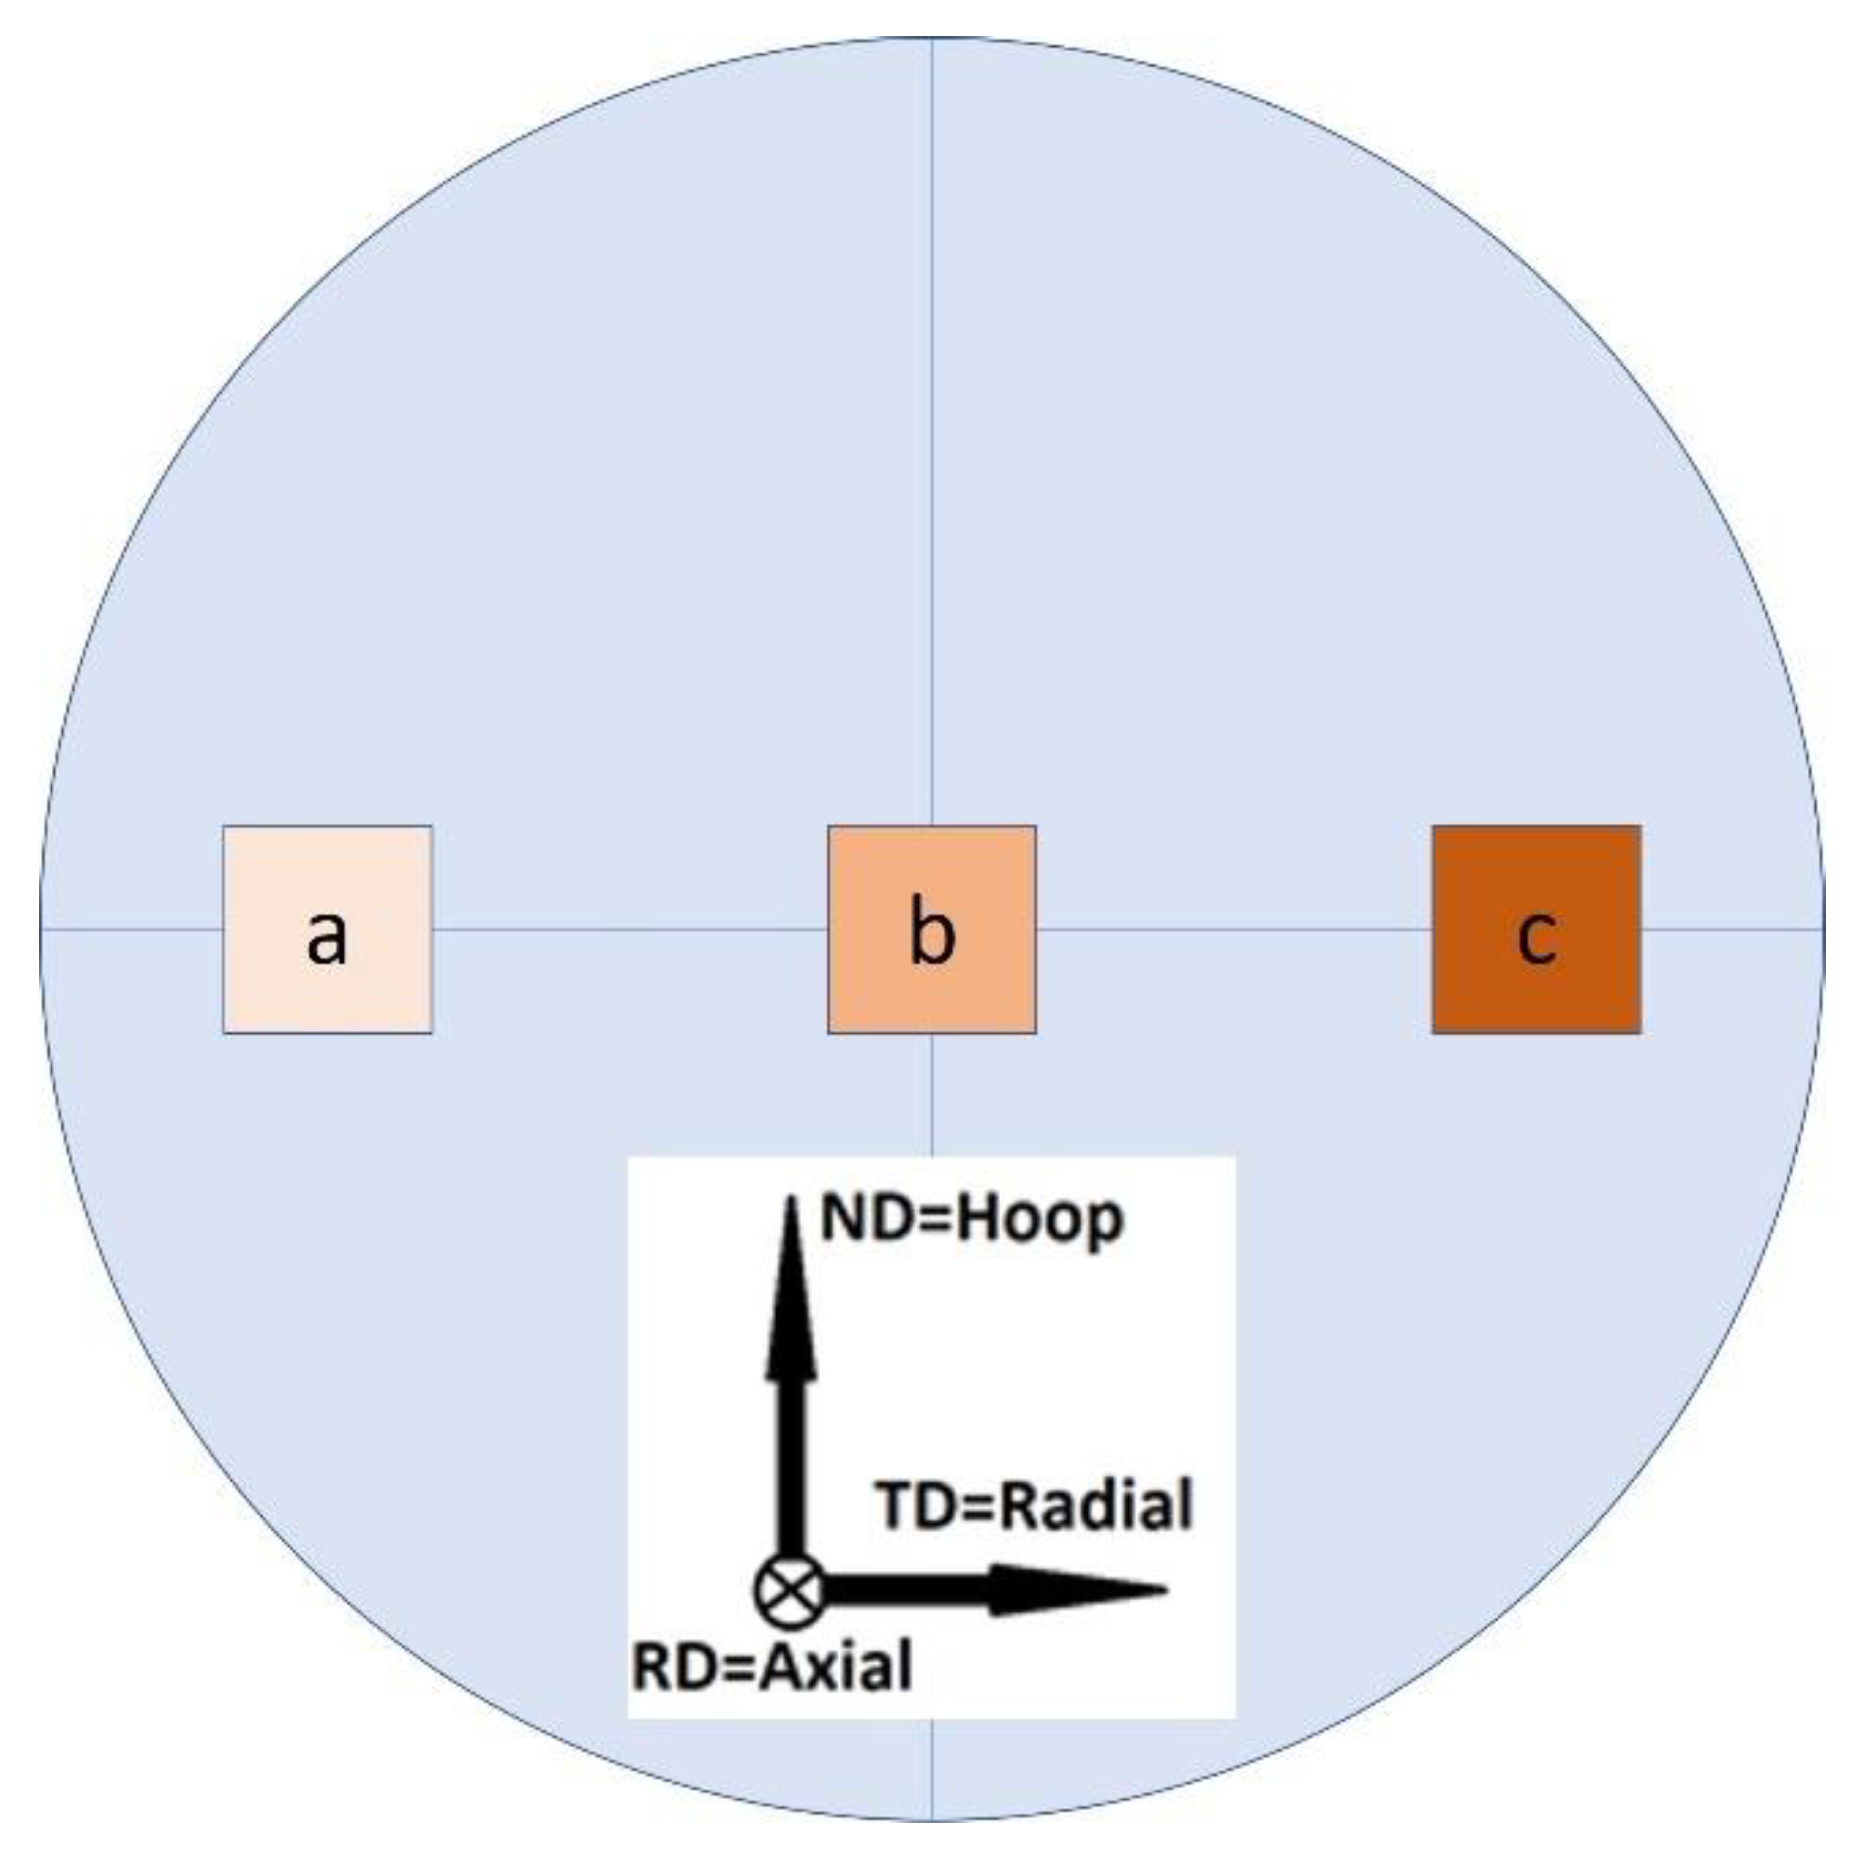
2.3. X-ray Texture
2.4. Calculation of the Residual Stresses
3. Results and Discussion
3.1. Neutron Diffraction and Residual Strain
3.1.1. Axial Direction
3.1.2. Hoop Direction
3.1.3. Radial Direction
3.2. Microstructure: EBSD Results
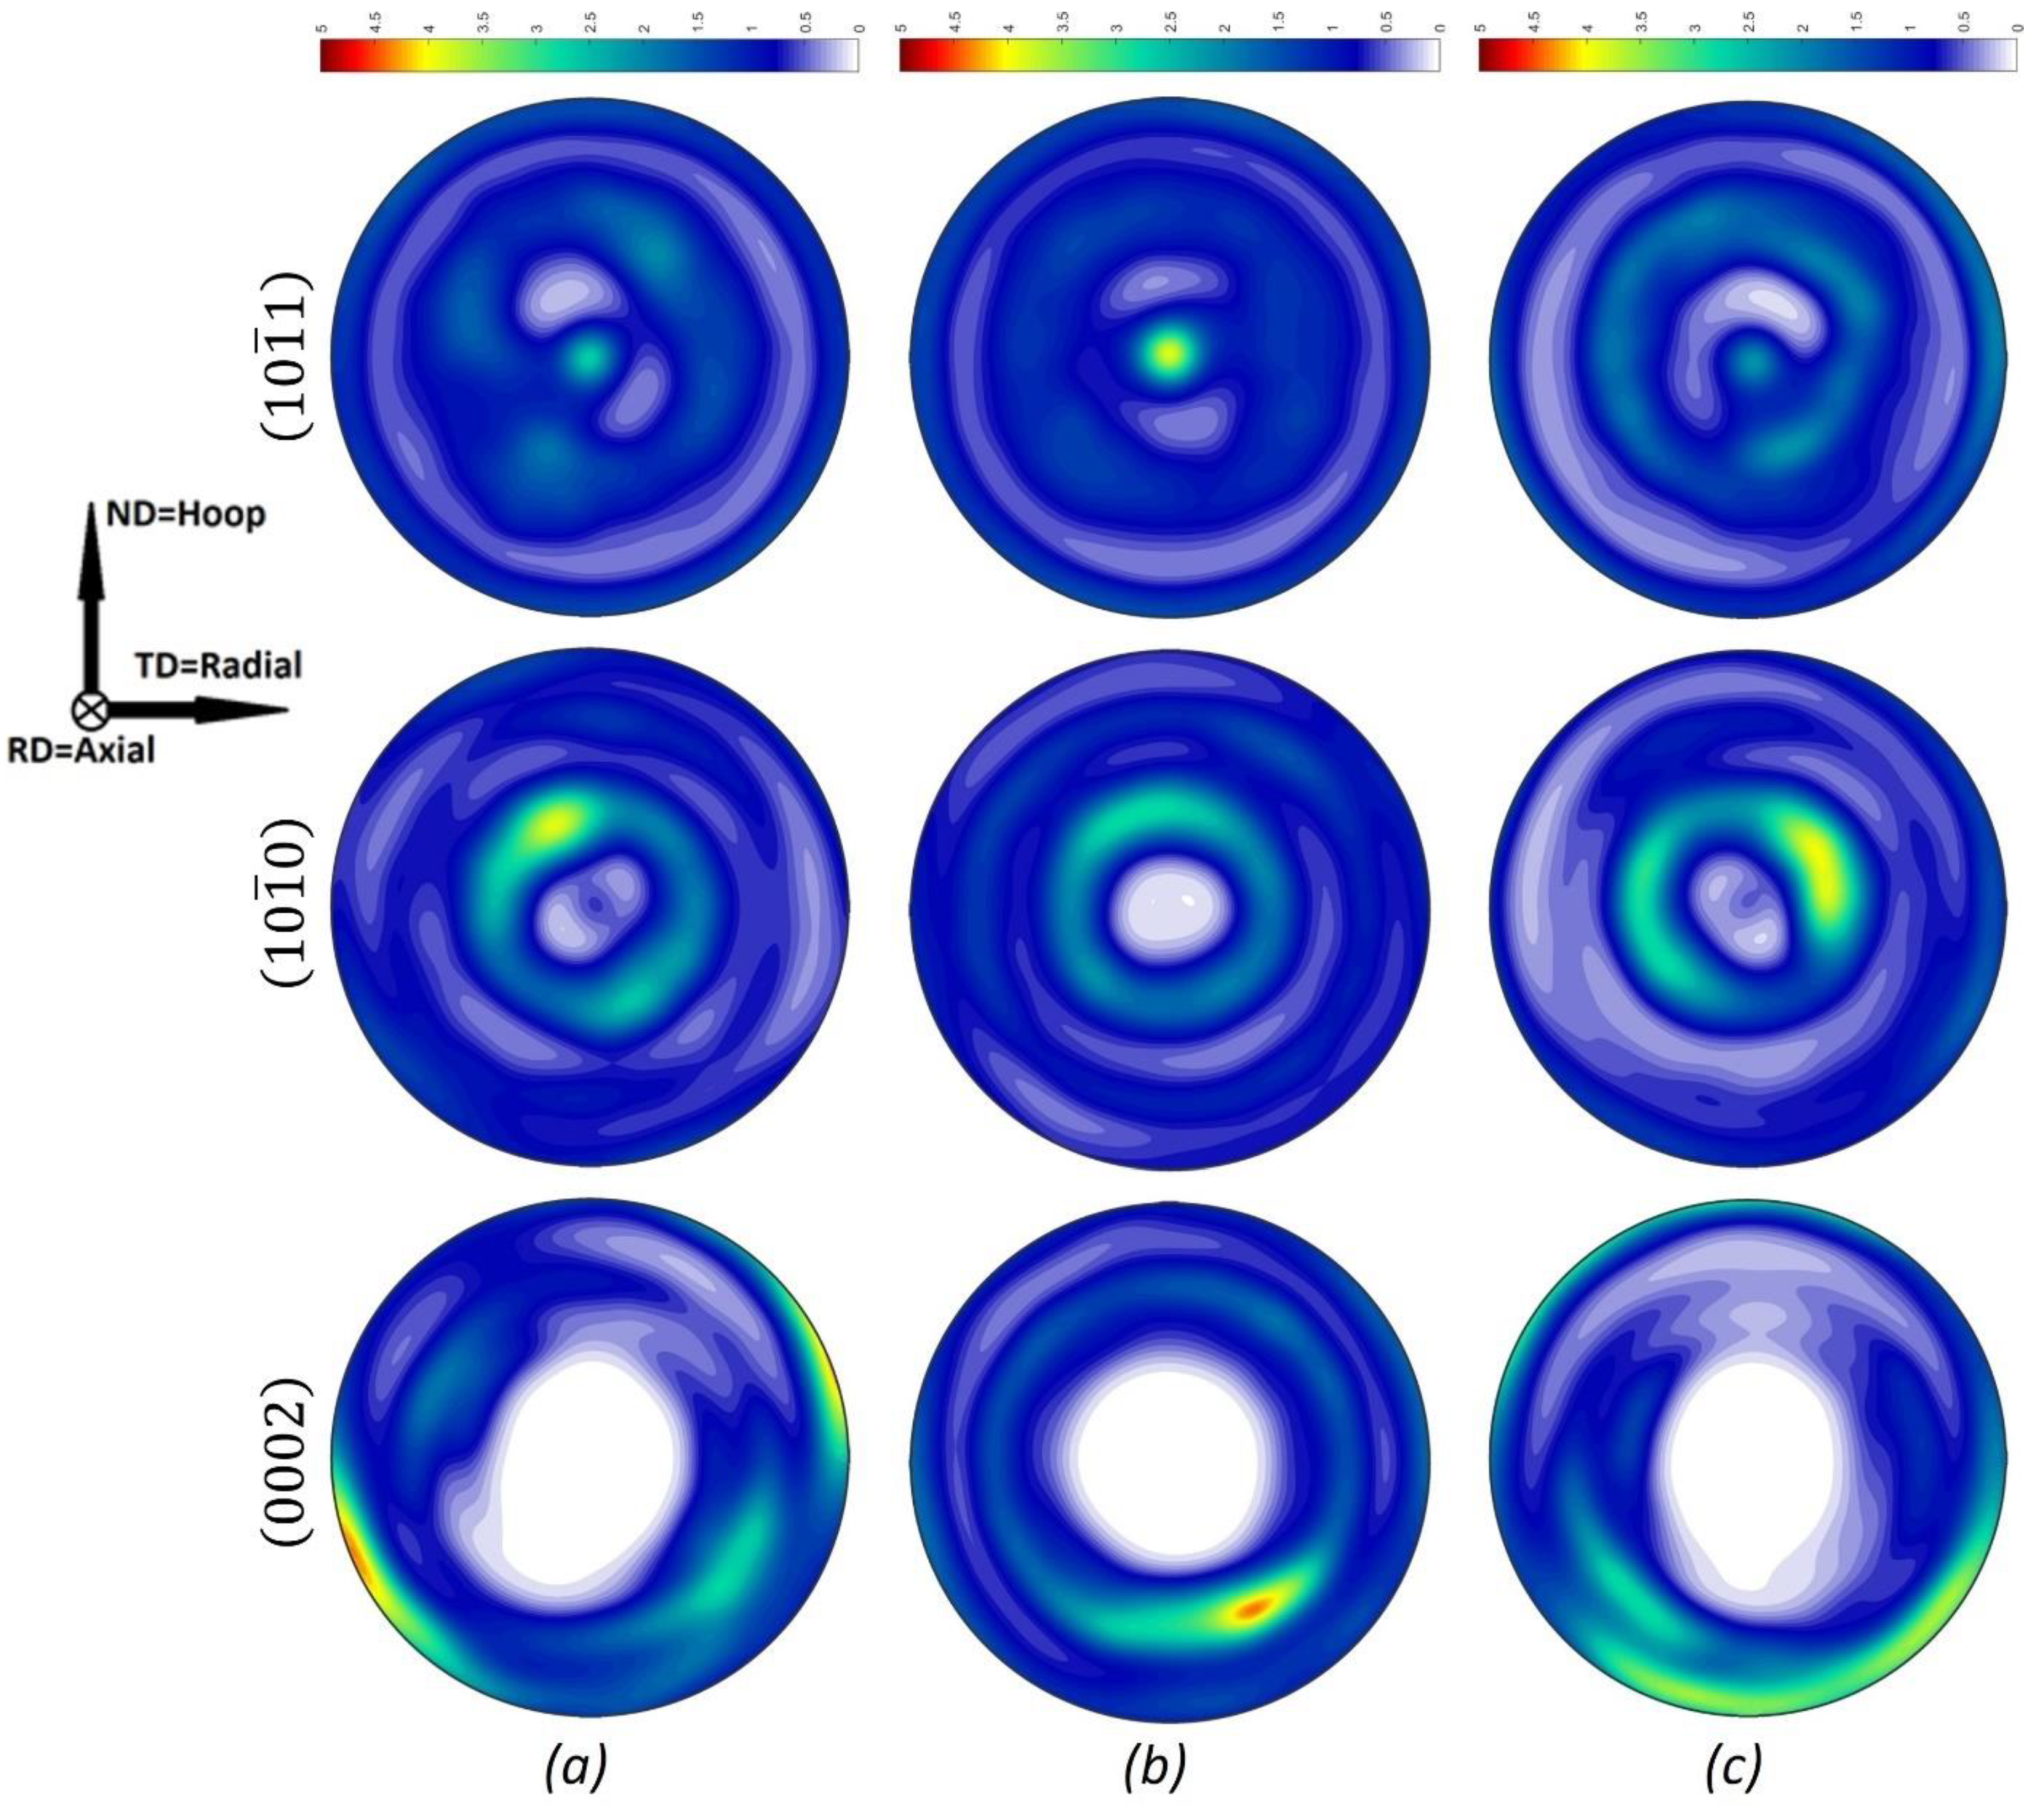
3.3. X-ray Texture Measurements
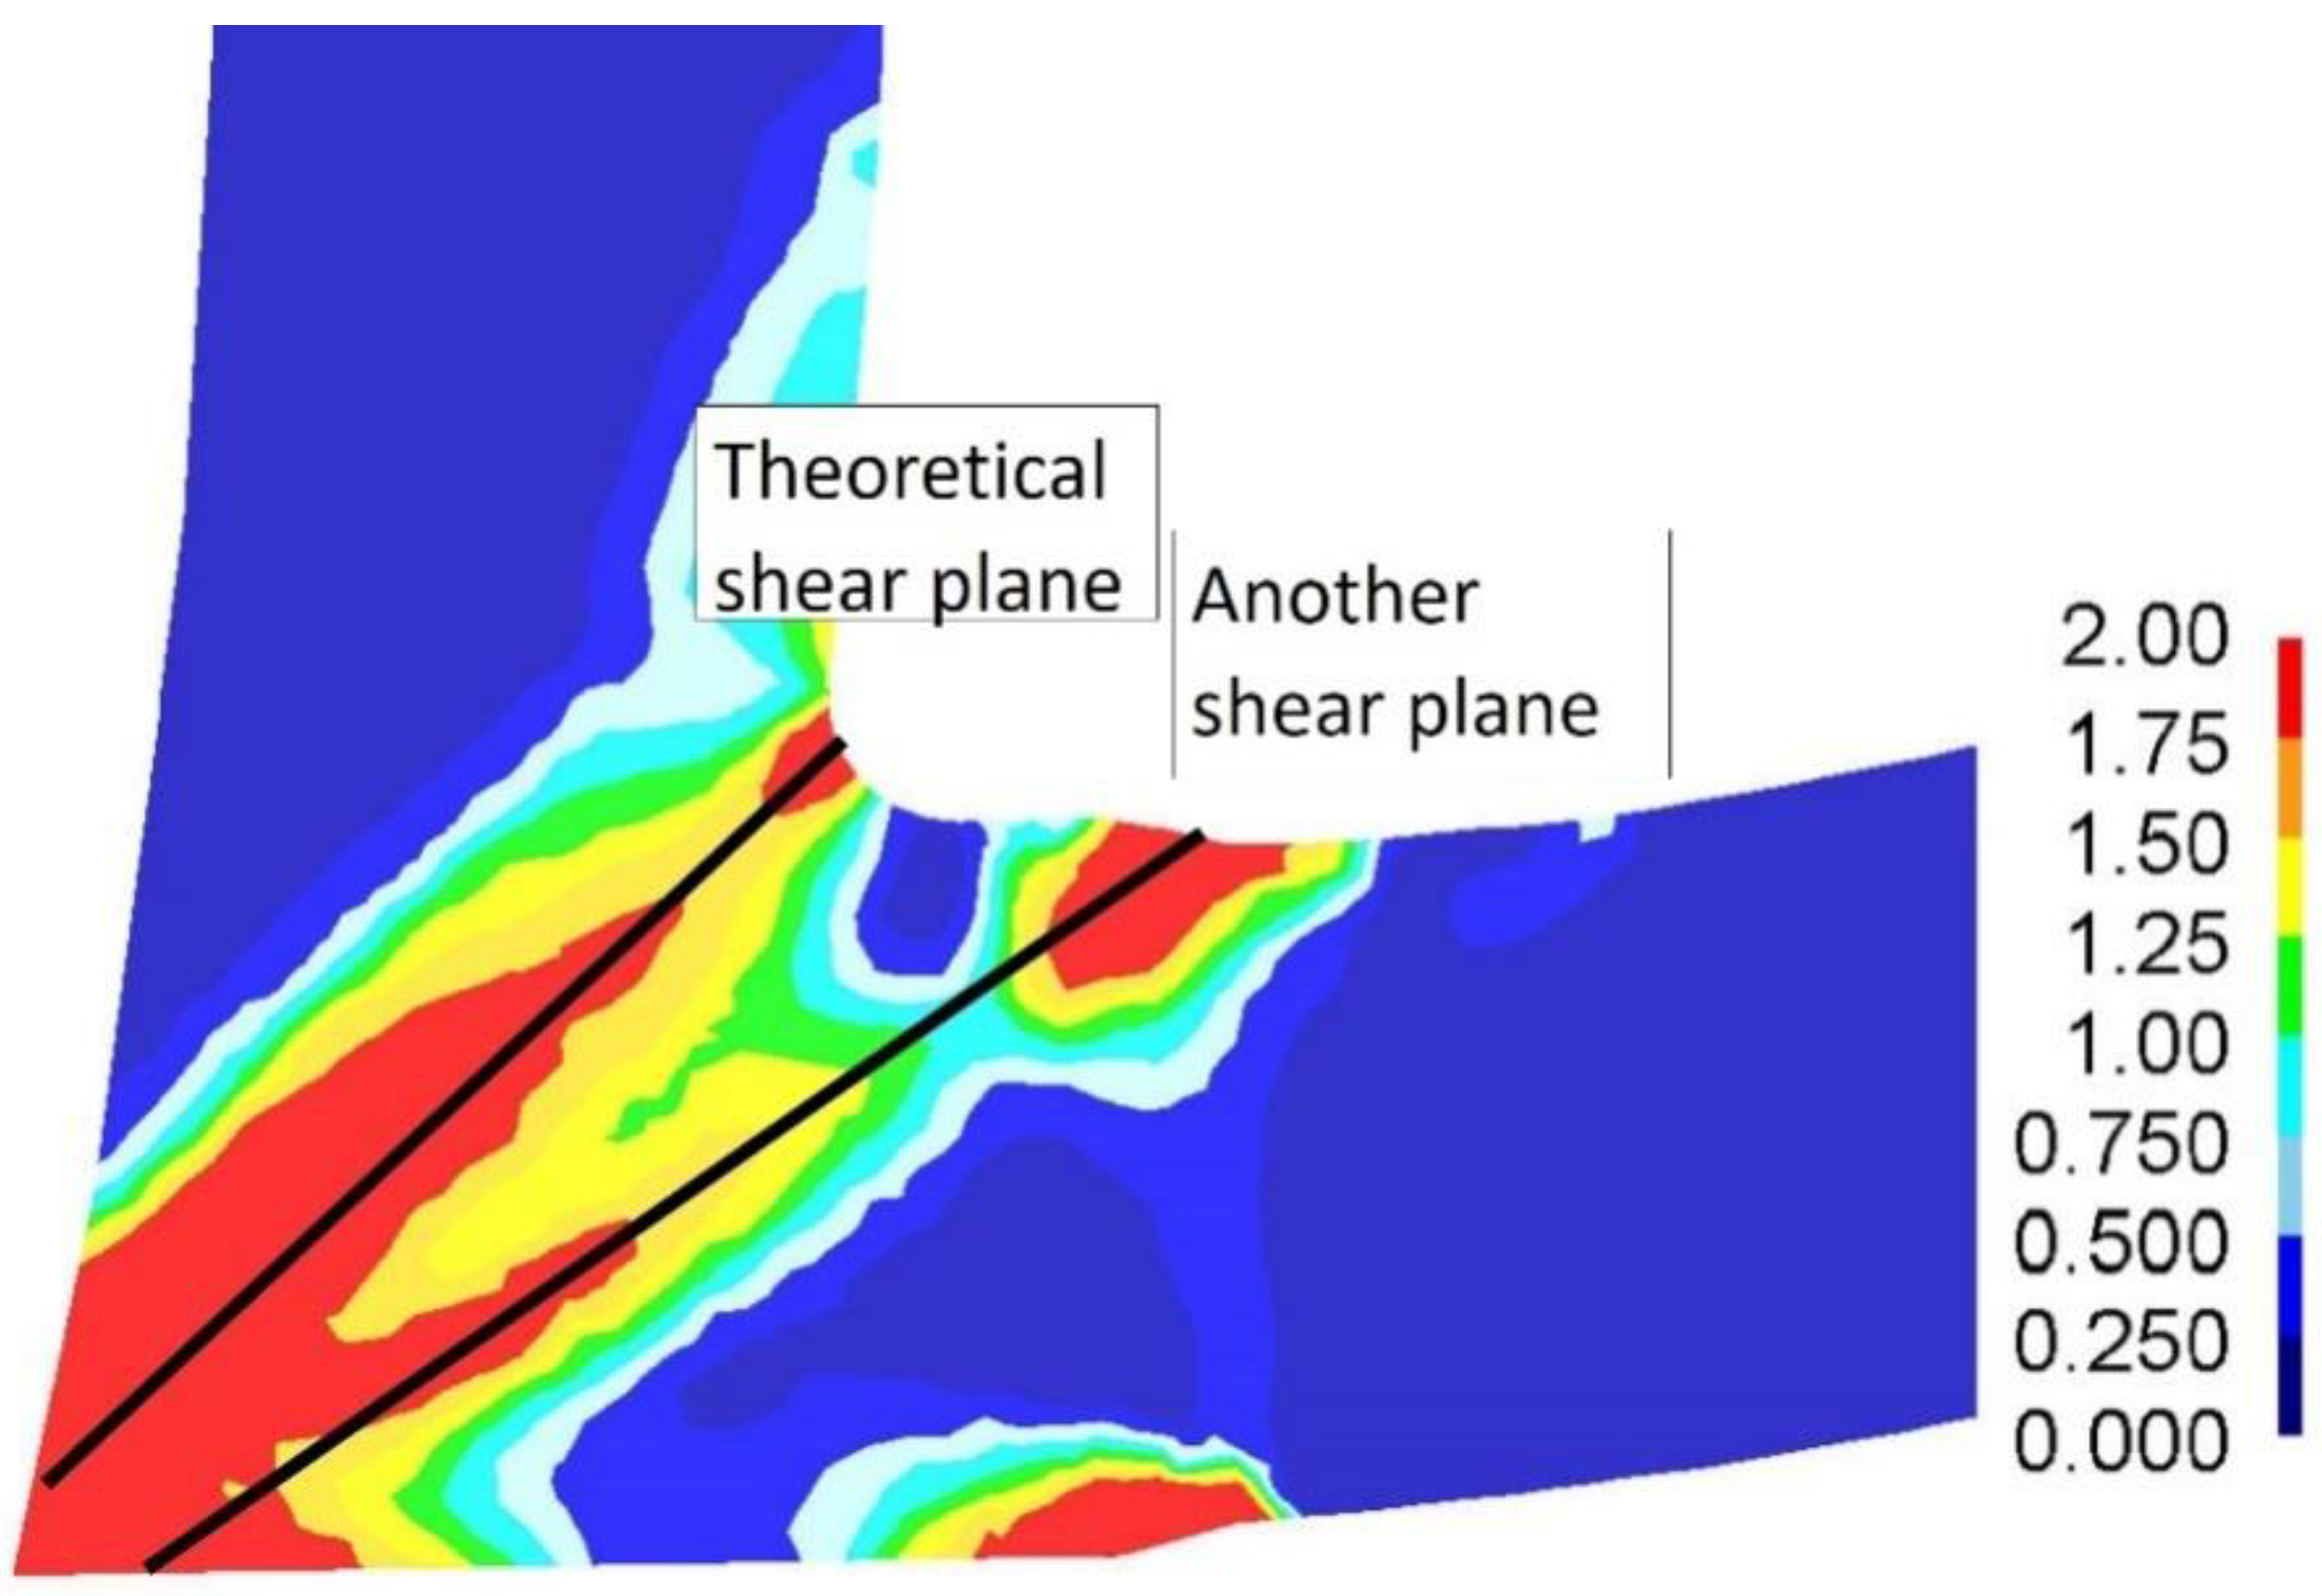
3.4. Residual Stress Calculation Rresults
4. Conclusions
Author Contributions
Acknowledgments
Conflicts of Interest
References
- Elias, C.N.; Lima, H.C.J.; Valiev, R.Z.; Meyers, M.A. Biomedical applications of titanium and its alloys, JOM: The journal of the Minerals. Met. Mater. Soc. 2008, 60, 46–49. [Google Scholar] [CrossRef]
- Lotkov, A.I.; Baturin, A.A.; Grishkov, V.N.; Kopylov, V.I. Possible role of crystal structure defects in grain structure nanofragmentation under severe cold plastic deformation of metals and alloys. Phys. Mesomech. 2007, 10, 179–189. [Google Scholar] [CrossRef]
- Semenova, I.P.; Modina, J.M.; Polyakov, A.V.; Klevtsov, G.V.; Klevtsova, N.A.; Pigaleva, I.N.; Valiev, R.Z.; Langdon, T.G. Fracture toughness at cryogenic temperatures of ultrafine-grained Ti-6Al-4V alloy processed by ECAP. Mater. Sci. Eng. A 2018, 716, 260–267. [Google Scholar] [CrossRef]
- Stolyarov, V.V.; Alexandrov, I.V.; Valiev, R.Z.; Zhu, Y.T.; Lowe, T.C. Grain refinement and properties of pure Ti processed by warm ECAP and cold rolling. Mater. Sci. Eng. A 2003, 343, 43–50. [Google Scholar] [CrossRef]
- Dyakonov, G.S.; Mironov, S.; Semenova, I.P.; Valiev, R.Z.; Semiatin, S.L. Microstructure evolution and strengthening mechanisms in commercial-purity titanium subjected to equal-channel angular pressing. Mater. Sci. Eng. A 2017, 701, 289–301. [Google Scholar] [CrossRef]
- Vinogradov AYu Stolyarov, V.V.; Hashimoto, S.; Valiev, R.Z. Cyclic behavior of ultrafine-grain titanium produced by severe plastic deformation. Mater. Sci. Eng. A 2001, 318, 163–173. [Google Scholar] [CrossRef]
- Dyakonov, G.S.; Zemtsova, E.; Mironov, S.; Semenova, I.P.; Valiev, R.Z.; Semiatin, S.L. An EBSD investigation of ultrafine-grain titanium for biomedical applications. Mater. Sci. Eng. A 2015, 648, 305–310. [Google Scholar] [CrossRef]
- Jäger, A.; Gärtnerova, V.; Tesař, K. Microstructure and anisotropy of the mechanical properties in commercially pure titanium after equal channel angular pressing with back pressure at room temperature. Mater. Sci. Eng. A 2015, 644, 114–120. [Google Scholar] [CrossRef]
- Raab, G.J.; Valiev, R.Z.; Lowe, T.C.; Zhu, Y.T. Continuous processing of ultrafine grained Al by ECAP-Conform. Mater. Sci. Eng. A 2004, 382, 30–34. [Google Scholar] [CrossRef]
- Medvedev, A.; Ng, H.P.; Lapovok, R.; Estrin, Y.; Lowe, T.C.; Anumalasetty, V.N. Comparison of laboratory-scale and industrial-scale equal channel angular pressing of commercial purity titanium. Mater. Lett. 2015, 145, 308–311. [Google Scholar] [CrossRef]
- Djavanroodi, F.; Omranpour, B.; Ebrahimi, M.; Sedighi, M. Designing of ECAP parameters based on strain distribution uniformity. Prog. Nat. Sci. Mater. Int. 2012, 22, 452–460. [Google Scholar] [CrossRef]
- Tong, Y.; Dmowski, W.; Witczak, Z.; Chuang, C.-P.; Egami, T. Residual elastic strain induced by equal channel angular pressing on bulk metallic glasses. Acta Mater. 2013, 61, 1204–1209. [Google Scholar] [CrossRef]
- Webster, G.A.; Wimpory, R.C. Non-destructive measurement of residual stress by neutron diffraction. J. Mater. Process. Technol. 2001, 117, 395–399. [Google Scholar] [CrossRef]
- Holmberg, J.; Steuwer, A.; Stormvinter, A.; Kristoffersen, H.; Haakanen, M.; Berglund, J. Residual stress state in an induction hardened steel bar determined by synchrotron- and neutron diffraction compared to results from lab-XRD. Mater. Sci. Eng. A 2016, 667, 199–207. [Google Scholar] [CrossRef]
- Vidal, V.; Thilly, L.; Van Petegem, S.; Stuhr, U.; Lecouturier, F.; Renault, P.-O.; Van Swygenhoven, H. Plasticity of nanostructured Cu-Nb-based wires: Strengthening mechanisms revealed by in situ deformation under neutrons. Scr. Mater. 2009, 60, 171–174. [Google Scholar] [CrossRef]
- Lee, H.H.; Gangwar, K.D.; Park, K.-T.; Woo, W.; Kim, H.S. Neutron diffraction and finite element analysis of the residual stress distribution of copper processed by equal-channel angular pressing. Mater. Sci. Eng. A 2017, 682, 691–697. [Google Scholar] [CrossRef]
- Kubina, T.; Dlouhý, J.; Kövér, M.; Hodek, J. Study of Thermal Stability of Ultra Fine-Grained Commercially Pure Titanium Wire Prepared in Conform Equipment. Mater. Sci. Forum 2014, 782, 415–420. [Google Scholar] [CrossRef]
- Valiev, R.Z.; Langdon, T.G. Principles of equal-channel angular pressing as a processing tool for grain refinement. Prog. Mater. Sci. 2006, 51, 881–981. [Google Scholar] [CrossRef]
- Mikula, P. Past and present status of neutron scattering at the research reactor in Řež. Mater. Struct. 2006, 13, 51–62. [Google Scholar]
- Hervoches, C.H.; Mikula, P.; Vrána, M. Recent instrumentation upgrades on the residual strain/stress diffractometer at NPI-Řež. In Proceedings of the 53rd International Scientific Conference on Experimental Stress Analysis (EAN 2015), Český Krumlov, Czech Republic, 1–4 June 2015; pp. 119–120. [Google Scholar]
- Hutchings, M.T.; Withers, P.J.; Holden, T.M.; Lorentzen, T. Introduction to the Characterization of Residual Stresses by Neutron Diffraction; CRC Press: Boca Raton, FL, USA, 2005; Chapter 3.6.4.; ISBN 9780415310000. [Google Scholar]
- Bachmann, F.; Hielscher, R.; Schaeben, H. Texture analysis with mtex—Free and open source software toolbox. Solid State Phenom. 2010, 160, 63–68. [Google Scholar] [CrossRef]
- Gnäupel-Herold, T. ISODEC: Software for calculating diffraction elastic constants. J. Appl. Crystallogr. 2012, 45, 573–574. [Google Scholar] [CrossRef]
- Kröner, E. Berechnung der elastischen Konstanten des Vielkristalls aus den Konstanten des Einkristalls. Zeitschrift für Physik 1958, 151, 504–518. [Google Scholar] [CrossRef]
- Bollenrath, F.; Hauk, V.; Müller, E.H. Zur Berechnung der vielkristallinen Elastizitäts-konstanten aus den Werten des Einkristalls. Z. Metallkunde 1967, 58, 76–82. [Google Scholar]
- Behnken, H.; Hauk, V. Berechnung der Röntgenographischen Elastizitätskonstanten (REK) des Vielkristalls aus den Einkirstalldaten fur beliebige Kristallsymmetrie. Z. Metallkunde 1986, 77, 620–626. [Google Scholar]
- Kawałko, J.; Wroński, M.; Bieda, M.; Sztwiertnia, K.; Wierzbanowski, K.; Wojtas, D.; Łagoda, M.; Ostachowski, P.; Pachla, W.; Kulczyk, M. Microstructure of titanium on complex deformation paths: Comparison of ECAP, KOBO and HE techniques. Mater. Charact. 2018, 141, 19–31. [Google Scholar] [CrossRef]
- Garcés, G.; Oñorbe, E.; Gan, W.; Máthis, K.; Tolnai, D.; Horváth, K.; Pérez, P.; Adeva, P. Evolution of twinning in extruded AZ31 alloy with bimodal grain structure. Mater. Charact. 2017, 126, 116–124. [Google Scholar] [CrossRef]
- Minárik, P.; Král, R.; Čížek, J.; Chmelík, F. Effect of different c/a ratio on the microstructure and mechanical properties in magnesium alloys processed by ECAP. Acta Mater. 2016, 107, 83–95. [Google Scholar] [CrossRef]
- Iwahashi, Y.; Horita, Z.; Nemoto, M.; Langdon, T.G. An investigation of microstructural evolution during equal-channel angular pressing. Acta Mater. 1997, 45, 4733–4741. [Google Scholar] [CrossRef]
- Stolyarov, V.V.; Theodore Zhu, Y.; Alexandrov, I.V.; Lowe, T.C.; Valiev, R.Z. Influence of ECAP routes on the microstructure and properties of pure Ti. Mater. Sci. Eng. A 2001, 299, 59–67. [Google Scholar] [CrossRef]
- Yoo, M.H. Slip, Twinning, and Fracture in Hexagonal Close-Packed Metals. Metall. Trans. A 1981, 12, 409–418. [Google Scholar] [CrossRef]
- Minonishi, Y.; Morozumi, S.; Yoshinaga, H. {1122} <1123> slip in titanium. Scr. Metall. 1982, 16, 427–430. [Google Scholar] [CrossRef]
- Paton, N.E.; Backofen, W.A. Plastic deformation of titanium at elevated temperatures. Metall. Trans. 1970, 1, 2839–2847. [Google Scholar] [CrossRef]
- Suwas, S.; Beausir, B.; Tóth, L.S.; Fundenberger, J.-J.; Gottstein, G. Texture evolution in commercially pure titanium after warm equal channel angular extrusion. Acta Mater. 2011, 59, 1121–1133. [Google Scholar] [CrossRef]
- Kim, I.; Jeong, W.-S.; Kim, J.; Park, K.-T.; Shin, D.H. Deformation structures of pure Ti produced by equal channel angular pressing. Scr. Mater. 2001, 45, 575–580. [Google Scholar] [CrossRef]
- Chen, Y.J.; Li, Y.J.; Walmsley, J.C.; Dumoulin, S.; Gireesh, S.S.; Armada, S.; Skaret, P.C.; Roven, H.J. Quantitative analysis of grain refinement in titanium during equal channel angular pressing. Scr. Mater. 2011, 64, 904–907. [Google Scholar] [CrossRef]
- Kim, I.; Kim, J.; Shin, D.H.; Lee, C.S.; Hwang, S.K. Effects of equal channel angular pressing temperature on deformation structures of pure Ti. Mater. Sci. Eng. A 2003, 342, 302–310. [Google Scholar] [CrossRef]
- Palán, J. Comprehensive evaluation of properties of ultrafine to nanocrystalline wires of Grade 2 titanium made by Conform SPD and rotary swaging technique, in process.
- Lahaie, D.; Embury, J.D.; Chadwick, M.M.; Gray, G.T. A note on the deformation of fine grained magnesium alloys. Scr. Metall. Mater. 1992, 27, 139–142. [Google Scholar] [CrossRef]
- Luan, Q.; Britton, T.B.; Jun, T.-S. Strain rate sensitivity in commercial pure titanium: The competition between slip and deformation twinning. Mater. Sci. Eng. A 2018, 734, 385–397. [Google Scholar] [CrossRef]
- Prangnell, P.B.; Harris, C.; Roberts, S.M. Finite element modelling of equal channel angular extrusion. Scr. Mater. 1997, 37, 983–989. [Google Scholar] [CrossRef]
- Duchek, M.; Kubina, T.; Hodek, J.; Dlouhy, J. Development of the production of ultrafine-grained titanium with the conform equipment. Mater. Tehnol. 2013, 47, 515–518. [Google Scholar]
- Gunderov, D.V.; Polyakov, A.V.; Semenova, I.P.; Raab, G.I.; Churakova, A.A.; Gimaltdinova, E.I.; Sabirov, I.; Segurado, J.; Sitdikov, V.D.; Alexandrov, I.V.; et al. Evolution of microstructure, macrotexture and mechanical properties of commercially pure Ti during ECAP-conform processing and drawing. Mater. Sci. Eng. A 2013, 562, 128–136. [Google Scholar] [CrossRef]


| Element | Fe | O | C | H | N | Ti |
|---|---|---|---|---|---|---|
| Content | 0.046 | 0.12 | 0.023 | 0.0026 | 0.0076 | Rest |
© 2018 by the authors. Licensee MDPI, Basel, Switzerland. This article is an open access article distributed under the terms and conditions of the Creative Commons Attribution (CC BY) license (http://creativecommons.org/licenses/by/4.0/).
Share and Cite
Németh, G.; Horváth, K.; Hervoches, C.; Cejpek, P.; Palán, J.; Duchek, M.; Máthis, K. Characterization of the Microstructure, Local Macro-Texture and Residual Stress Field of Commercially Pure Titanium Grade 2 Prepared by CONFORM ECAP. Metals 2018, 8, 1000. https://doi.org/10.3390/met8121000
Németh G, Horváth K, Hervoches C, Cejpek P, Palán J, Duchek M, Máthis K. Characterization of the Microstructure, Local Macro-Texture and Residual Stress Field of Commercially Pure Titanium Grade 2 Prepared by CONFORM ECAP. Metals. 2018; 8(12):1000. https://doi.org/10.3390/met8121000
Chicago/Turabian StyleNémeth, Gergely, Klaudia Horváth, Charles Hervoches, Petr Cejpek, Jan Palán, Michal Duchek, and Kristián Máthis. 2018. "Characterization of the Microstructure, Local Macro-Texture and Residual Stress Field of Commercially Pure Titanium Grade 2 Prepared by CONFORM ECAP" Metals 8, no. 12: 1000. https://doi.org/10.3390/met8121000
APA StyleNémeth, G., Horváth, K., Hervoches, C., Cejpek, P., Palán, J., Duchek, M., & Máthis, K. (2018). Characterization of the Microstructure, Local Macro-Texture and Residual Stress Field of Commercially Pure Titanium Grade 2 Prepared by CONFORM ECAP. Metals, 8(12), 1000. https://doi.org/10.3390/met8121000