Article

Sequential Structural and Casting Simulation Approach for the Fabrication of Ni–Al–Bronze Submarine Mast Cover

School of Mechanical Engineering, Kyungnam University, 7 Kyungnamdaehak-ro, Masanhappo-gu, Changwon-si 51767, Republic of Korea
Metals 2026, 16(9), 1044; https://doi.org/10.3390/met16091044 (registering DOI)
Submission received: 10 August 2026 / Revised: 7 September 2026 / Accepted: 11 September 2026 / Published: 20 September 2026

Abstract

Submarine mast covers are critical cantilever appendages subjected to extreme hydrostatic pressure during submerged transit. To ensure structural reliability and control internal defects inherent in heavy-section casting, an integrated design-to-manufacturing framework sequentially linking structural finite element analysis (FEA), fluid volume method (FVM)-based casting simulation, and full-scale experimental sand casting was established. FEA under a 600 m submergence depth (7.0 MPa hydrostatic pressure) identified stress concentrations on the inner surface along the major-axis section. Introducing an optimized fillet radius at a sharp step reduced peak equivalent stress from 216.0 MPa to below 194.0 MPa, securing a safety factor exceeding 2.0 against the yield strength of nickel–aluminum–bronze (390 MPa). MAGMA5 casting simulations verified an unpressurized bottom-gating system (S:R:G = 1.00:2.88:4.80), achieving smooth laminar filling with gate velocities under 1.25 m/s without cold shuts. To mitigate predicted shrinkage porosity, process modifications enlarging riser diameters from Ø30 mm to Ø60 mm and placing chills were implemented in the actual casting trial, while top porosity was removed via machining allowances. Specimens harvested from the full-scale prototype yielded 757.8 MPa UTS, 392.5 MPa yield strength, 17.9% elongation, and 197 HB hardness.

1. Introduction

Submarine snorkel mast covers are critical cantilever components that safeguard internal equipment, such as periscopes and communication antennas, against severe hydrostatic pressure and hydrodynamic loads [1,2,3,4,5,6,7]. Due to their high mechanical strength and excellent seawater corrosion resistance, nickel–aluminum–bronze (NAB) alloys are widely employed as the primary material for these hollow cylindrical structures [8,9,10,11,12]. Given their large-scale dimensions and complex hollow geometry, these components are predominantly fabricated via sand casting. However, manufacturing such heavy-section structural components presents significant process challenges, including high susceptibility to shrinkage porosity, complex fluid-flow behaviors, and localized stress concentrations. Consequently, establishing a comprehensive design and casting simulation strategy is essential to guarantee both structural integrity and defect-free manufacturing of full-scale NAB components.
To fabricate such complex hollow components, sand casting has been the traditional process of choice, but empirical shop-floor designs consistently suffer from internal defect formation. Campbell [13] established that fluid turbulence during liquid metal pouring initiates entrained oxide films, which significantly deteriorate the mechanical reliability of heavy-section castings. Riedler et al. [14] analyzed thermal gradients during mold cooling and reported that non-uniform solidification rates directly trigger macro-shrinkage cavity formation in thick-walled sections. To address these casting defects, Kelley et al. [15] evaluated micro-porosity evolution in copper-based alloys, showing that inadequate riser sizing accelerates pore nucleation. Furthermore, Majidi and Beckermann [16] examined gas porosity in gravity sand casting, concluding that atmospheric air entrainment during liquid pouring remains a primary cause of subsurface voids. On the thermal stress front, Teke and Ertaş [17] modeled the cooling process of large sand-cast components and identified significant thermal stress accumulation at geometric transition zones. Liu et al. [18] further investigated these residual stress profiles, revealing that unmitigated casting thermal stresses severely diminish fatigue performance under cyclic operational loading.
In parallel with research on casting process optimization, numerous finite element (FE) and fluid–structure interaction (FSI) studies have been conducted to evaluate the structural integrity of submarine appendages. Hsu et al. [19] investigated stress concentration effects around penetrations in curved shells of deep-diving submersible vehicles, establishing that hull discontinuities critically govern failure modes and structural stability under hydrostatic pressure. Vernengo et al. [20] examined the free-surface hydrodynamics of submarine mast configurations, showing that unsteady turbulent flow around surface-piercing masts generates significant hydrodynamic loading on cantilevered mast structures during snorkel operation. Jeyamohan et al. [21] analyzed vortex-shedding-induced vibration in slender cylindrical mast structures, demonstrating that lock-in between the shedding frequency and the structure’s natural frequency produces amplified fatigue damage in high aspect ratio masts. Khan et al. [22] investigated dynamic loading on submarine hull appendages, revealing that oscillatory hydrodynamic forces under combined vertical/horizontal plane motions significantly affect the fatigue evaluation of appendage configurations. Furthermore, recent advanced numerical investigations have further expanded the scope of finite element frameworks for evaluating stress distributions and structural behaviors under complex marine environmental loadings [23,24].
However, a critical gap remains in these existing structural evaluations: Hsu et al. [19], Vernengo et al. [20], Jeyamohan et al. [21], and Khan et al. [22] all assumed idealized, defect-free material conditions in their FE models, largely overlooking the internal shrinkage porosity and residual stress fields highlighted by Riedler et al. [14] and Teke and Ertaş [17]. Furthermore, while numerical casting process simulations have been individually applied to optimize gating/riser configurations, an integrated engineering framework that sequentially bridges structural finite element analysis, casting defect prediction, and full-scale experimental sand casting validation remains remarkably lacking [25].
In this study, an integrated design-to-manufacturing verification framework sequentially implementing structural finite element analysis, computational fluid dynamics-based casting simulation, and experimental validation was developed to fabricate a highly reliable submarine mast cover. To prevent costly trial-and-error during physical mold fabrication, this study adopts a sequential simulation-based framework where target structural geometries are defined prior to casting process optimization. First, the structural integrity under extreme submerged loading conditions was evaluated using the finite element method (FEM) to identify structurally vulnerable regions. Following structural reinforcement, casting process simulations using the finite volume method (FVM) were performed to model molten metal flow and solidification kinetics, thereby optimizing the gating and riser systems to minimize internal casting defects. Finally, based on the optimized computational parameters, a full-scale NAB sand-cast prototype was fabricated.

2. Design and Analysis

2.1. Geometric Design

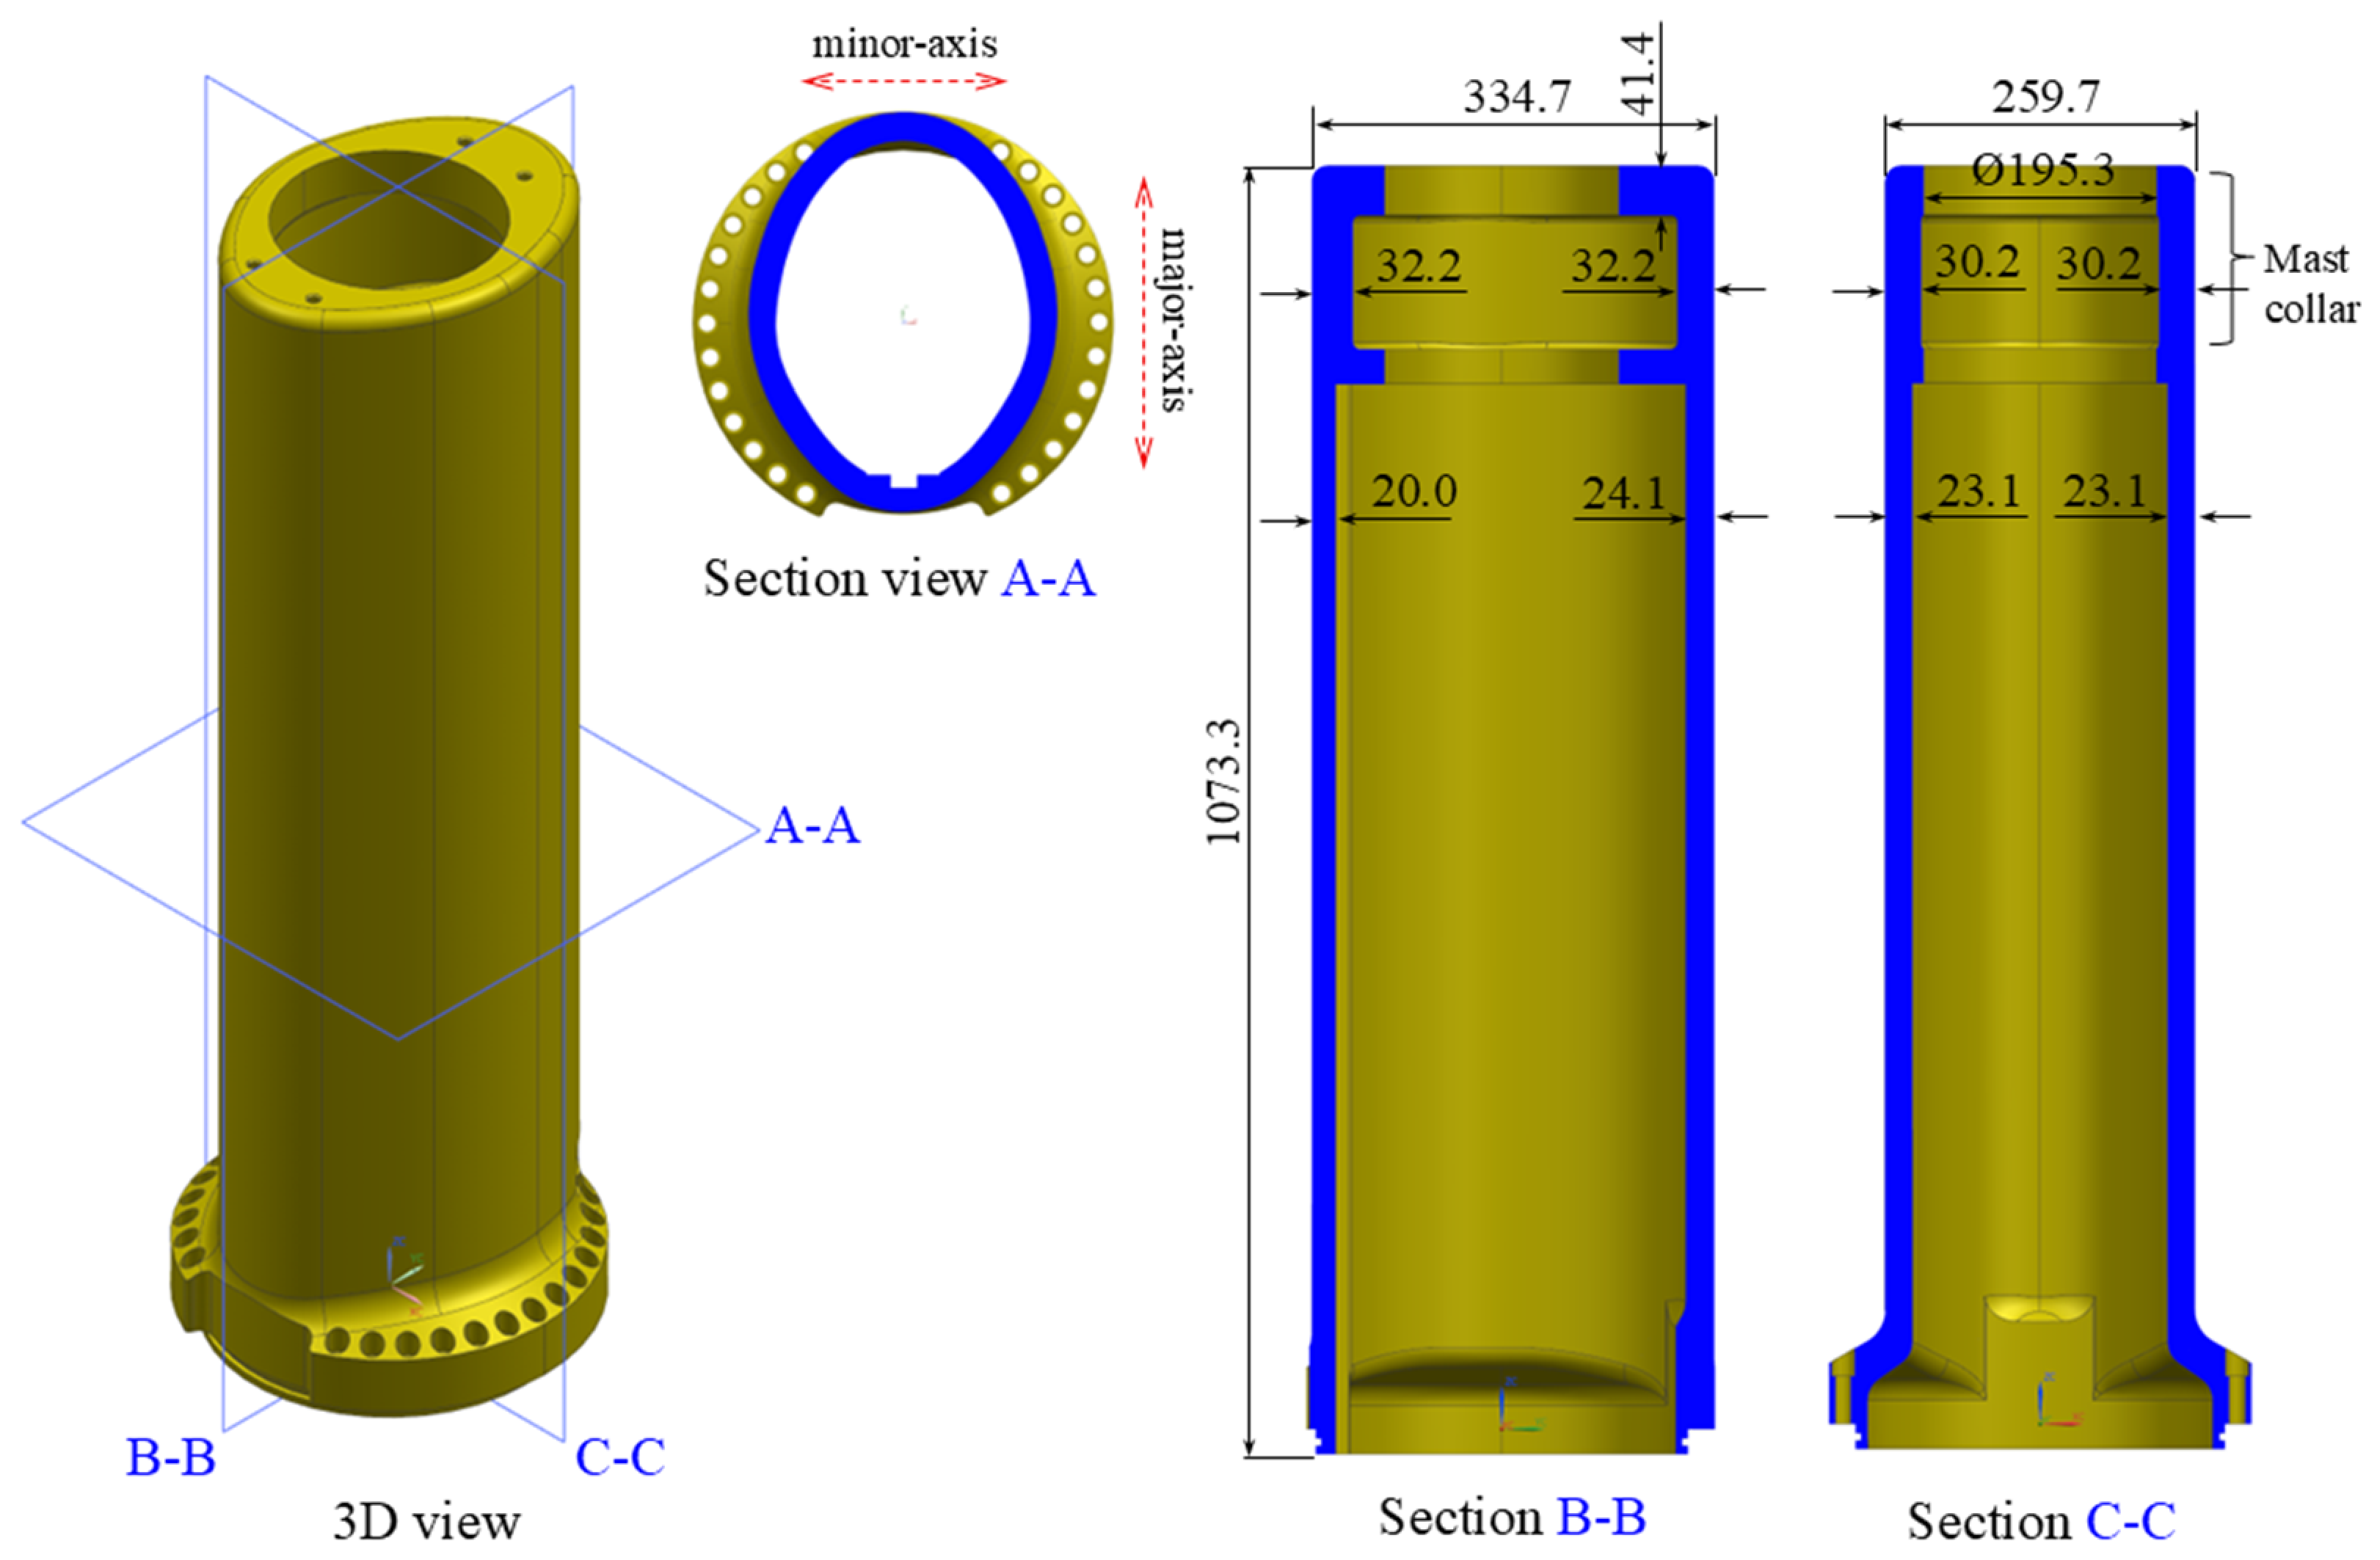
Figure 1 illustrates the 3D CAD geometry and key cross-sectional dimensions of the designed submarine snorkel mast cover. To safeguard internal sensor components, the mast cover is configured as a hollow cylindrical structure. As depicted in the 3D view and Section A-A of Figure 1, the primary body features an elliptical cross-section to minimize hydrodynamic drag during submerged transit, following established design principles for streamlined marine appendages [26,27].
The total axial length of the mast cover is 1073.3 mm, with major and minor outer axes of the elliptical cross-section measuring 334.7 mm and 259.7 mm, respectively. Regarding the wall thickness distribution, the section along the minor axis (Section C-C) is symmetric, with a uniform thickness of 23.1 mm on both sides. Conversely, the section along the major axis (Section B-B) possesses an asymmetric thickness profile, measuring 24.1 mm on the right side and 20.0 mm on the left side, which represents the thinnest region of the component. This asymmetric wall thickness distribution was deliberately incorporated to accommodate the internal equipment layout and secure sufficient clearance for sensor wiring under restricted spatial constraints [28].
The lower section transitions into a circular profile to interface with the mounting yoke and is equipped with 26 bolt holes for secure bolted joint assembly, minimizing stress concentrations at the flanged joint [29]. The upper section, designated as the mast collar, features a through-hole with a diameter of ∅195.3 mm to accommodate the head sensor assembly. To withstand localized load concentrations, the mast collar is structurally reinforced, exhibiting wall thicknesses of 32.2 mm along the major axis, 30.2 mm along the minor axis, and an axial top thickness of 41.4 mm.
The total volume of the designed mast cover is approximately 2.415 × 107 mm3. Applying the theoretical density of the NAB alloy (7.58 g/cm3) [30], the total calculated mass of the component is 183.0 kg.

2.2. Casting Process Design

To fabricate the designed mast cover via the sand casting (gravity casting) process, the manufacturing route was divided into primary casting and post-processing machining stages. The overall hollow cylindrical configuration is formed during the casting stage, whereas intricate features such as bolt holes and precision mating surfaces are finalized through subsequent machining operations. Consequently, regions requiring machining, including the 26 bolt holes at the lower flange, were modeled as solid structures with added machining allowances.
The sand mold cavity system consists of a pouring cup, a gating system to deliver molten metal, the main casting cavity, and risers to compensate for solidification shrinkage. The gating system is further divided into a sprue, runners, and gates. Molten metal poured into the pouring cup flows downward through the sprue, passes through the runner and gates, and fills the casting cavity smoothly from the bottom upward. The pouring process terminates when the liquid metal reaches the top level of the risers. Precise gating system design is imperative to minimize liquid turbulence within the mold cavity, while optimized riser placement is essential to promote directional solidification toward the feeder [31,32].
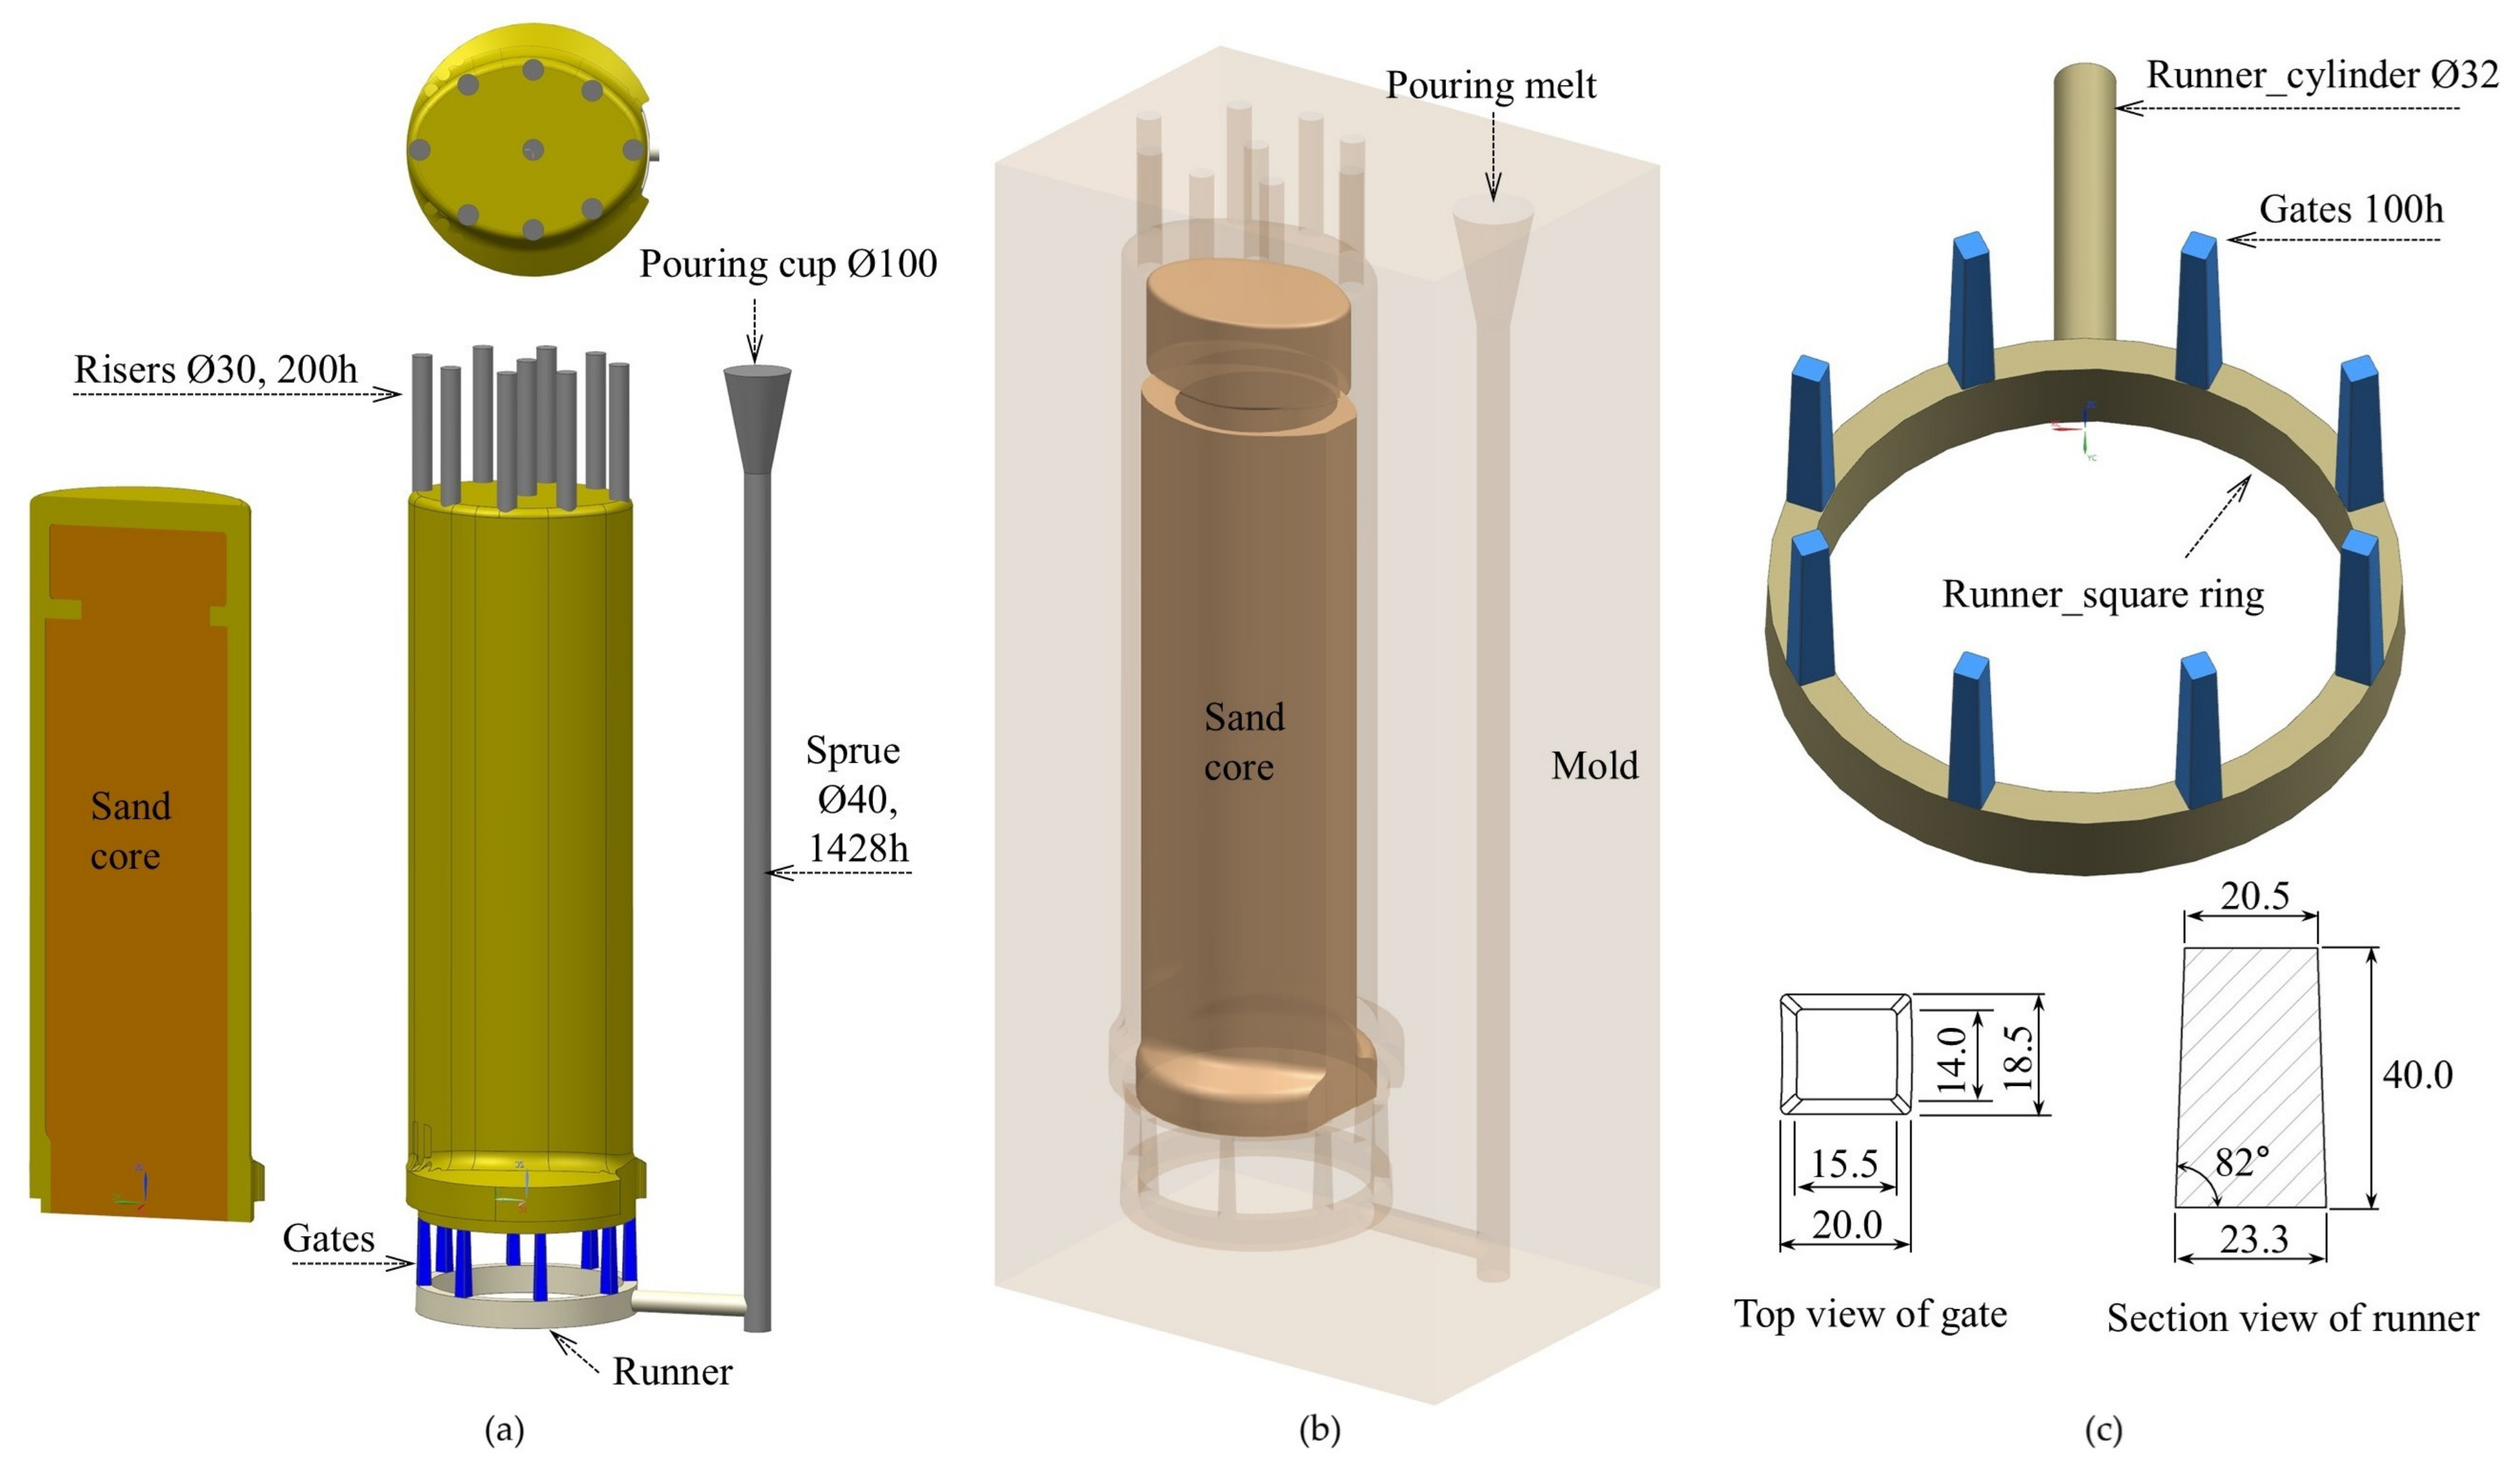
Figure 2 illustrates the 3D gating and risering system designed for the sand casting of the mast cover. Considering the high density and susceptibility to oxide film entrapment of the NAB alloy, an unpressurized gating system with a cross-sectional area ratio (sprue–runner–gate (S:R:G)) of 1.00:2.88:4.80 was adopted to mitigate flow velocity and induce stable laminar filling. As shown in Figure 2a, the overall gating concept adapts the bottom-gating configuration typically employed in bell casting. The longitudinal axis of the mast cover is aligned parallel to the gravity vector, allowing the liquid metal exiting the gating system to ascend against gravity (bottom-up filling). Furthermore, Figure 2b presents the full 3D assembly layout enclosed within the sand mold, illustrating the spatial arrangement of the internal sand core and the melt pouring position. A central sand core is positioned inside the cavity to form the hollow cylindrical geometry. The pouring cup top diameter is ∅100 mm, and the sprue diameter is ∅40 mm, with a total sprue height of 1428.3 mm including the pouring cup. To ensure directional solidification, nine cylindrical risers, each with a diameter of 30 mm and a height of 200 mm, are located at the top section of the mast cover: eight distributed circumferentially along the side wall and one centered at the top of the inner core.
Figure 2c depicts the 3D geometry and cross-sectional details of the runner and gates. To match the circular lower flange of the mast cover, the runner is designed as a flat square ring. The inlet connecting the sprue to the runner is cylindrical, with a diameter of 32 mm and a length of 187.5 mm. The main runner ring features a trapezoidal cross-section. Eight tower-shaped gates, each 100 mm in length, are arranged circumferentially at 45° intervals. The gate cross-section is rectangular, tapering from 18.5 mm × 20.0 mm at the runner junction to 15.5 mm × 14.0 mm at the casting interface. Because the inflow velocity of the liquid metal entering the casting cavity is directly governed by the cross-sectional area of the gate, the gate area connected to the mast cover was systematically adjusted to control the overall mold filling rate.
In this design, the calculated weights of the gating system and risers are 26.0 kg and 10.1 kg, respectively, while the as-cast mast cover weight (including machining allowances) is 198.7 kg. The total poured mass comprising the casting, gating system, and risers is 234.8 kg, yielding a high casting yield of 84.6%.

3. Computational Methods and Experimental Conditions

3.1. Structural Analysis

Finite element analysis was performed to evaluate the structural integrity of the designed snorkel mast cover using the Static Structural tool in ANSYS Workbench (2025 R2). The mechanical properties of the NAB alloy were incorporated into the ANSYS Engineering Data platform based on established material databases and standards [33]. The density of the NAB alloy is 7.58 g/cm3, with a Young’s modulus of 115 GPa and a Poisson’s ratio of 0.328. The yield strength and ultimate tensile strength (UTS) are 390 MPa and 760 MPa, respectively.
As illustrated in Section B-B of Figure 1, the mast cover exhibits structural symmetry across the longitudinal major-axis section plane. To optimize computational efficiency and facilitate clear visualization of internal stress distributions, a half-symmetry model was established by sectioning along the major-axis plane (Section B-B) and applying a symmetric boundary condition.
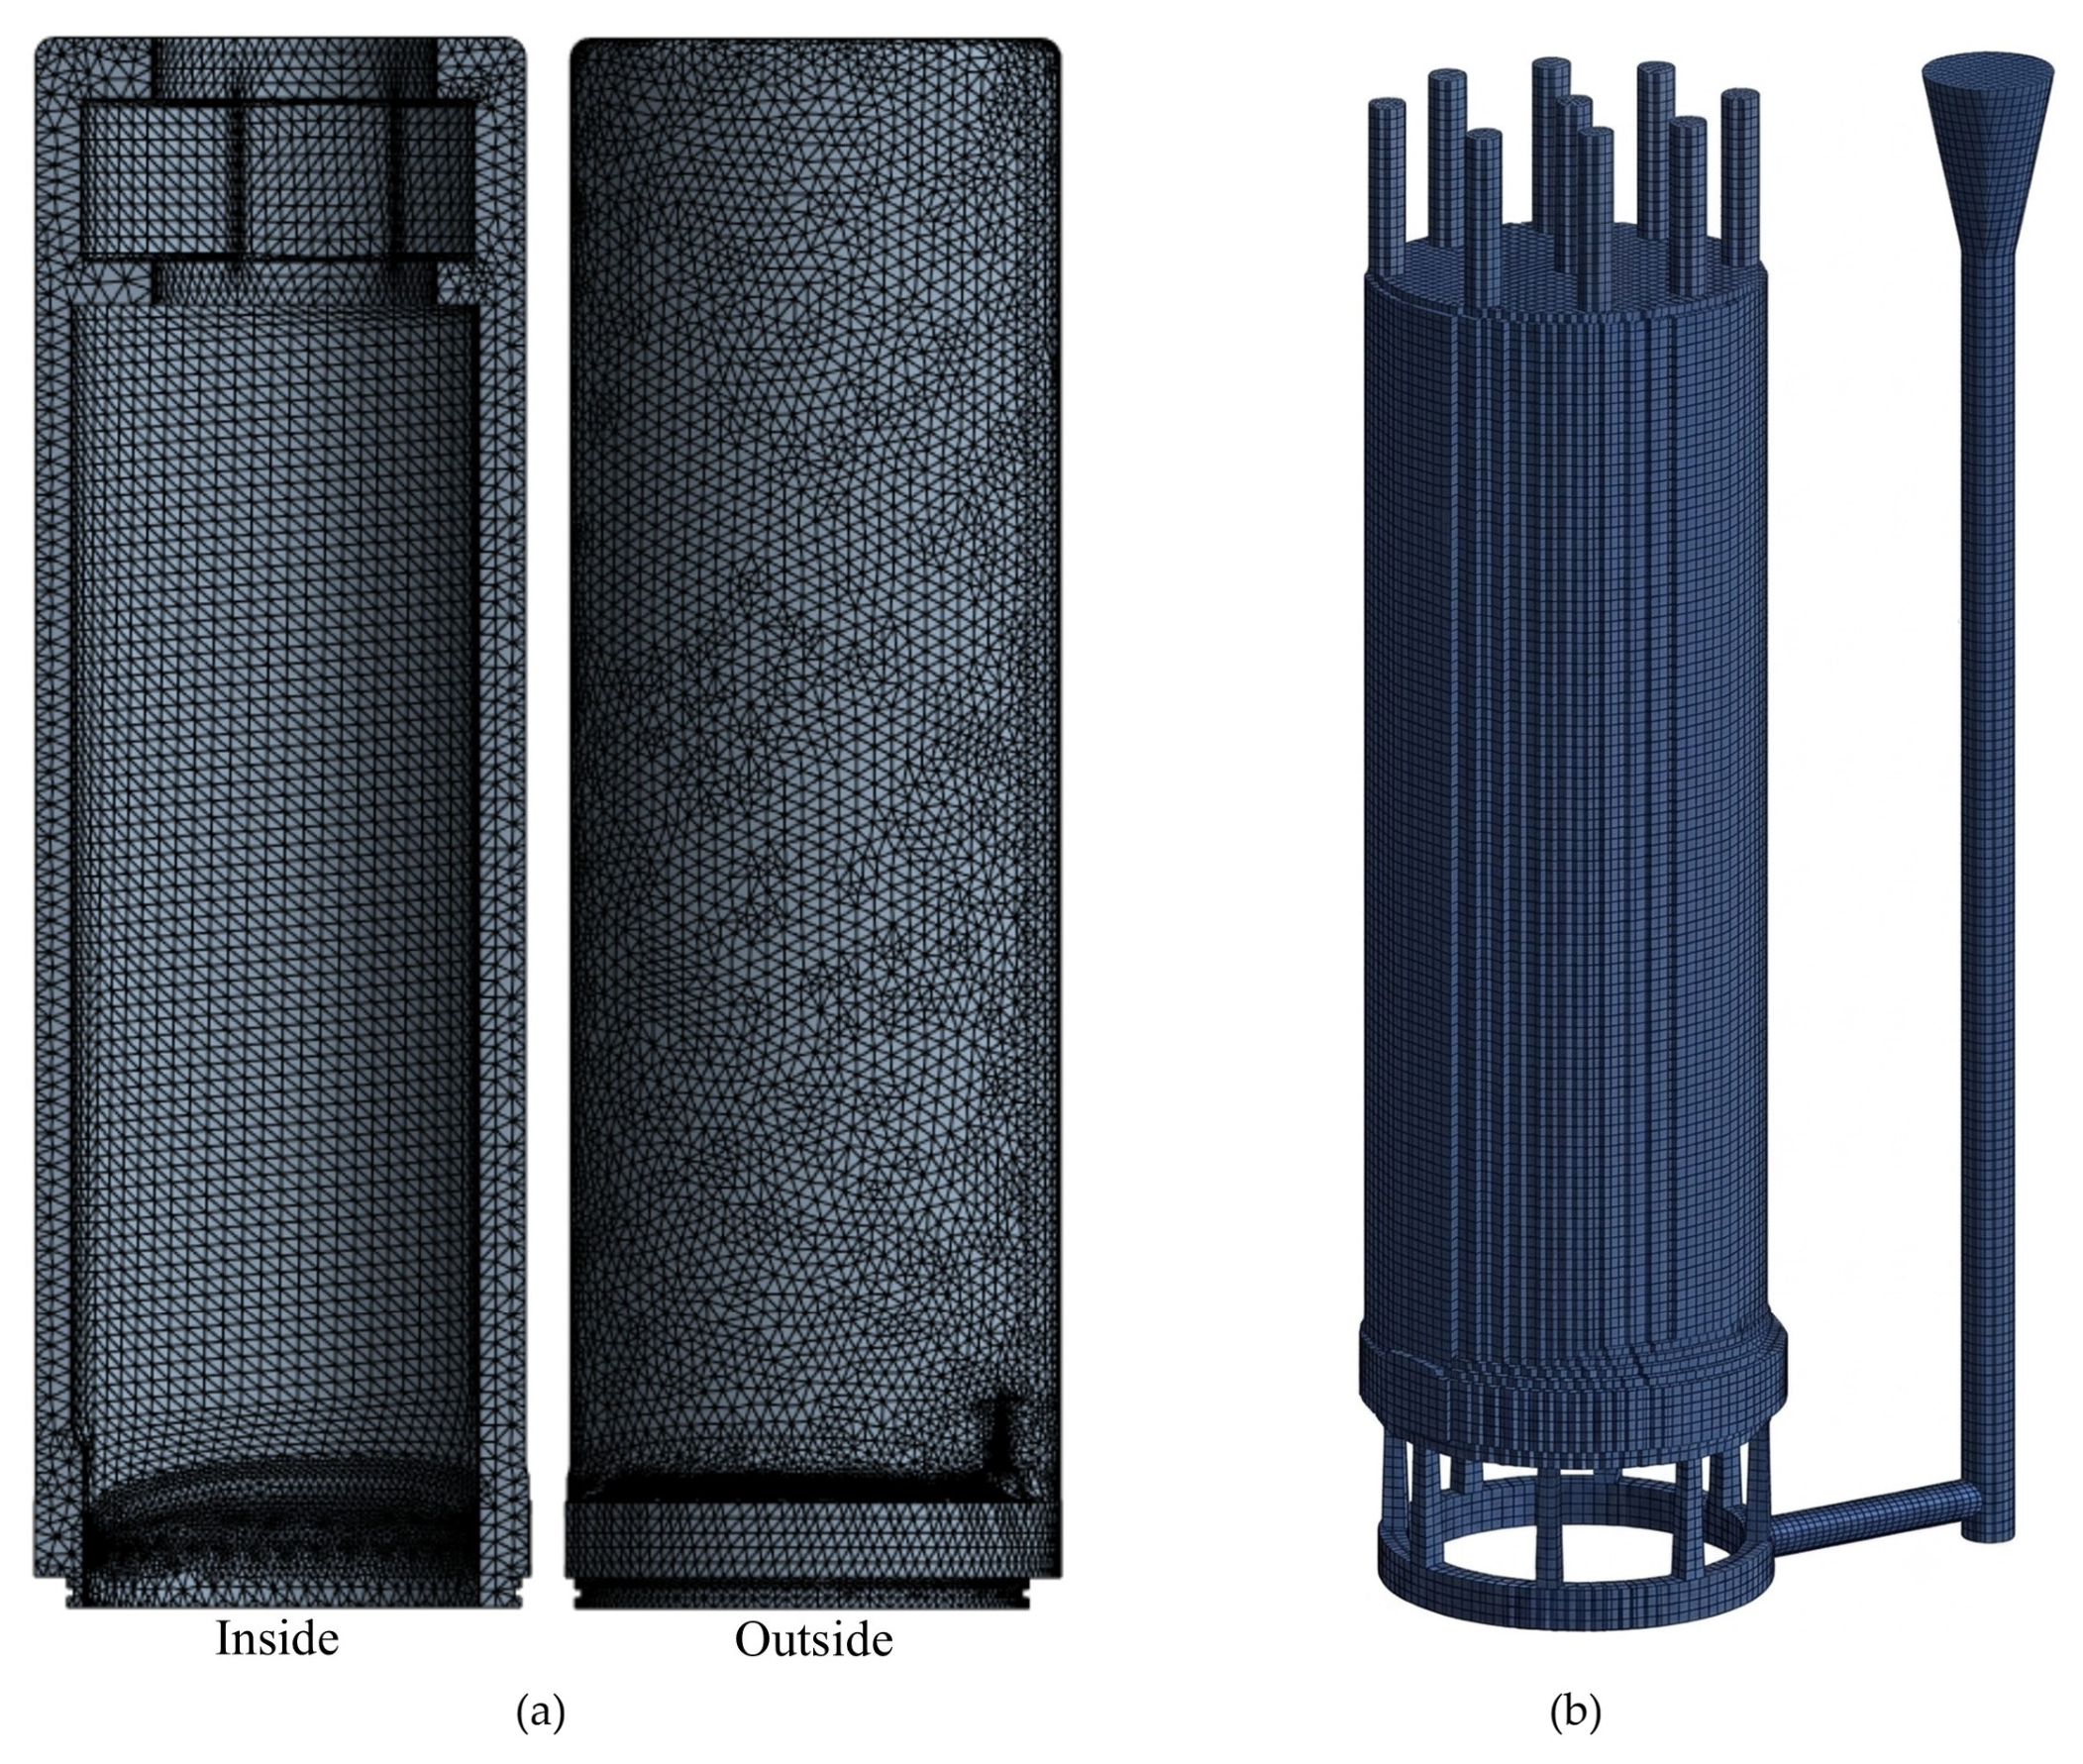
The computational domain was discretized using tetrahedral elements. Local mesh refinement options were applied to curved geometries and transition zones to capture localized stress concentrations accurately. Following a mesh sensitivity analysis to ensure solution convergence [34], the final generated mesh consisted of 152,964 elements and 249,091 nodes, as shown in Figure 3a.
During submerged operation, the snorkel mast cover functions as an exposed cantilever structure, rendering it structurally vulnerable to extreme external hydrostatic loading. Although dynamic wave-induced loads occur during shallow snorkeling, deep submergence to 600 m represents the most critical loading scenario where hydrostatic pressure dominates due to low maneuvering speeds. Therefore, a uniform static hydrostatic pressure of 70 bar (7.0 MPa) was applied normally to the entire outer surface of the mast cover [35] as a conservative design limit exceeding the theoretical hydrostatic pressure at 600 m depth (about 6.1 MPa) to evaluate structural integrity under worst-case operational conditions. Regarding boundary conditions, a fixed support condition was applied to the 26 bolt holes at the bottom flange to simulate the rigid bolted constraint with the mounting yoke. The detailed material properties, mesh configurations, and boundary conditions applied in the structural FEA are summarized in Table 1.

3.2. Casting Process Simulation Setup

To evaluate the fluid flow and solidification kinetics of the designed mast cover gating system shown in Figure 2, numerical casting simulations were conducted using the commercial casting simulation software MAGMA5 (Version 5.4). The 3D CAD geometries of the eight functional components (sprue, runner, gates, mast cover, risers, top mold, bottom mold, and sand core) were exported as STL files, imported into the MAGMA5 environment, and assigned their respective functional domain designations. Specifically, the sprue and runner were designated as the runner, the mast cover body as the casting, the risers as feeders, the sand core as the core, and the top boundary of the pouring cup as the inlet. Notably, the eight gates were assigned as individual entities rather than a single merged object. This individual domain discretization enabled localized flow velocity monitoring and the assessment of potential filling imbalances across the eight gate entry points during the mold filling stage.
The MAGMA5 software’s mesh-generation method is the finite volume method (FVM). The mesh-generation results were 484,585 meshes on the metal cell (sprue, runner, gates, mast cover, and risers) and 5,320,510 meshes on the control volume, which is the material group (top mold, bottom mold, and sand core), as shown in Figure 3b.
For the casting material, CuAl10Ni from the MAGMA5 material database was selected. This database model corresponds to the UNS C95800 (ASTM B505) [30] specification, and its key thermophysical properties are comparable to those of the actual alloy composition (8.91% Al, 4.45% Ni, 4.04% Fe, and 1.17% Mn). CuAl10Ni from the simulation database corresponds to the standard chemical classification of NAB alloy [33]. As summarized in Table 2, the thermophysical properties of both alloys show minimal differences. The agreement across key parameters confirms that the database properties represent the thermal and solidification behavior of the NAB alloy [33].
The liquidus temperature of the CuAl10Ni alloy is 1108 °C, and the molten metal pouring temperature was set to 1300 °C. The furan sand mold data from the database were assigned to both the sand mold and the internal core, with an initial mold temperature of 20 °C. The pouring time was calculated as approximately 22 s using the empirical Kotschi equation [36] based on casting mass and critical wall thickness, and this was prescribed as the inflow boundary condition. To accurately describe the physical transport phenomena during the casting process, the governing equations implemented in the numerical formulation comprise the continuity equation, the Navier–Stokes momentum equation, the energy equation, and the volume of fluid (VOF) advection equation for tracking the transient free-surface liquid–air interface. Furthermore, the phase-change heat transfer and solidification kinetics were governed by the enthalpy–porosity formulation, taking into account the latent heat release between the liquidus and solidus temperatures [37]. Interface heat transfer coefficients (HTC) were specified as 8000 W/(m2·K) between the casting and the sand mold and 1000 W/(m2·K) between the mold sections [38]. The complete numerical setup, governing physical models, material designations, grid counts, and boundary conditions for the casting process simulation are summarized in Table 3.

3.3. Experimental Conditions for Sand Casting

To experimentally validate the structural integrity and casting process parameters optimized through numerical simulations, a full-scale sand casting trial of the mast cover prototype was conducted. The foundry pattern was fabricated based on the optimized 3D CAD geometry, incorporating machining allowances and the volumetric shrinkage allowance (1.5~2.0%) of the NAB alloy. Table 4 summarizes the chemical composition of the NAB alloy utilized in the experimental sand casting trial. The primary constituent elements were determined to be 8.91 wt.% Al, 4.45 wt.% Ni, and 81.3 wt.% Cu (balance). Based on this composition, the nominal liquidus and solidus temperatures of the alloy are approximately 1070 °C and 1010 °C, respectively.
A precision wooden pattern was manufactured in accordance with the optimized gating process design shown in Figure 2, from which a furan-bonded sand mold and core system utilizing self-hardening silica sand were constructed. Precise core print positioning and chaplet arrangements were implemented to maintain internal core alignment and prevent displacement induced by molten metal buoyancy forces during pouring. The molten metal temperature was continuously monitored using an immersion thermocouple and maintained at 1300 ± 10 °C, strictly aligning with the numerical simulation boundary conditions. Bottom pouring was executed in accordance with the calculated target filling time of approximately 22 s.
Following complete solidification and cooling, the casting was shaken out from the mold and subjected to a shot peening process for surface scale removal. The upper section of the mast collar was subsequently machined to form a through-hole with a diameter of 195.3 mm. Tensile and Brinell hardness test specimens were harvested directly from the ring section removed during this machining process, ensuring that the specimens reflected the actual microstructure and mechanical history of the full-scale casting. Tensile test specimens were prepared according to the JIS Z 2241 standard [39], featuring a gauge diameter of 12.5 mm and a gauge length of 50 mm. To ensure data reliability and statistical significance, both tensile testing and Brinell hardness measurements were performed in triplicate (n = 3) under identical testing conditions.

4. Results and Discussion

4.1. Structural Analysis

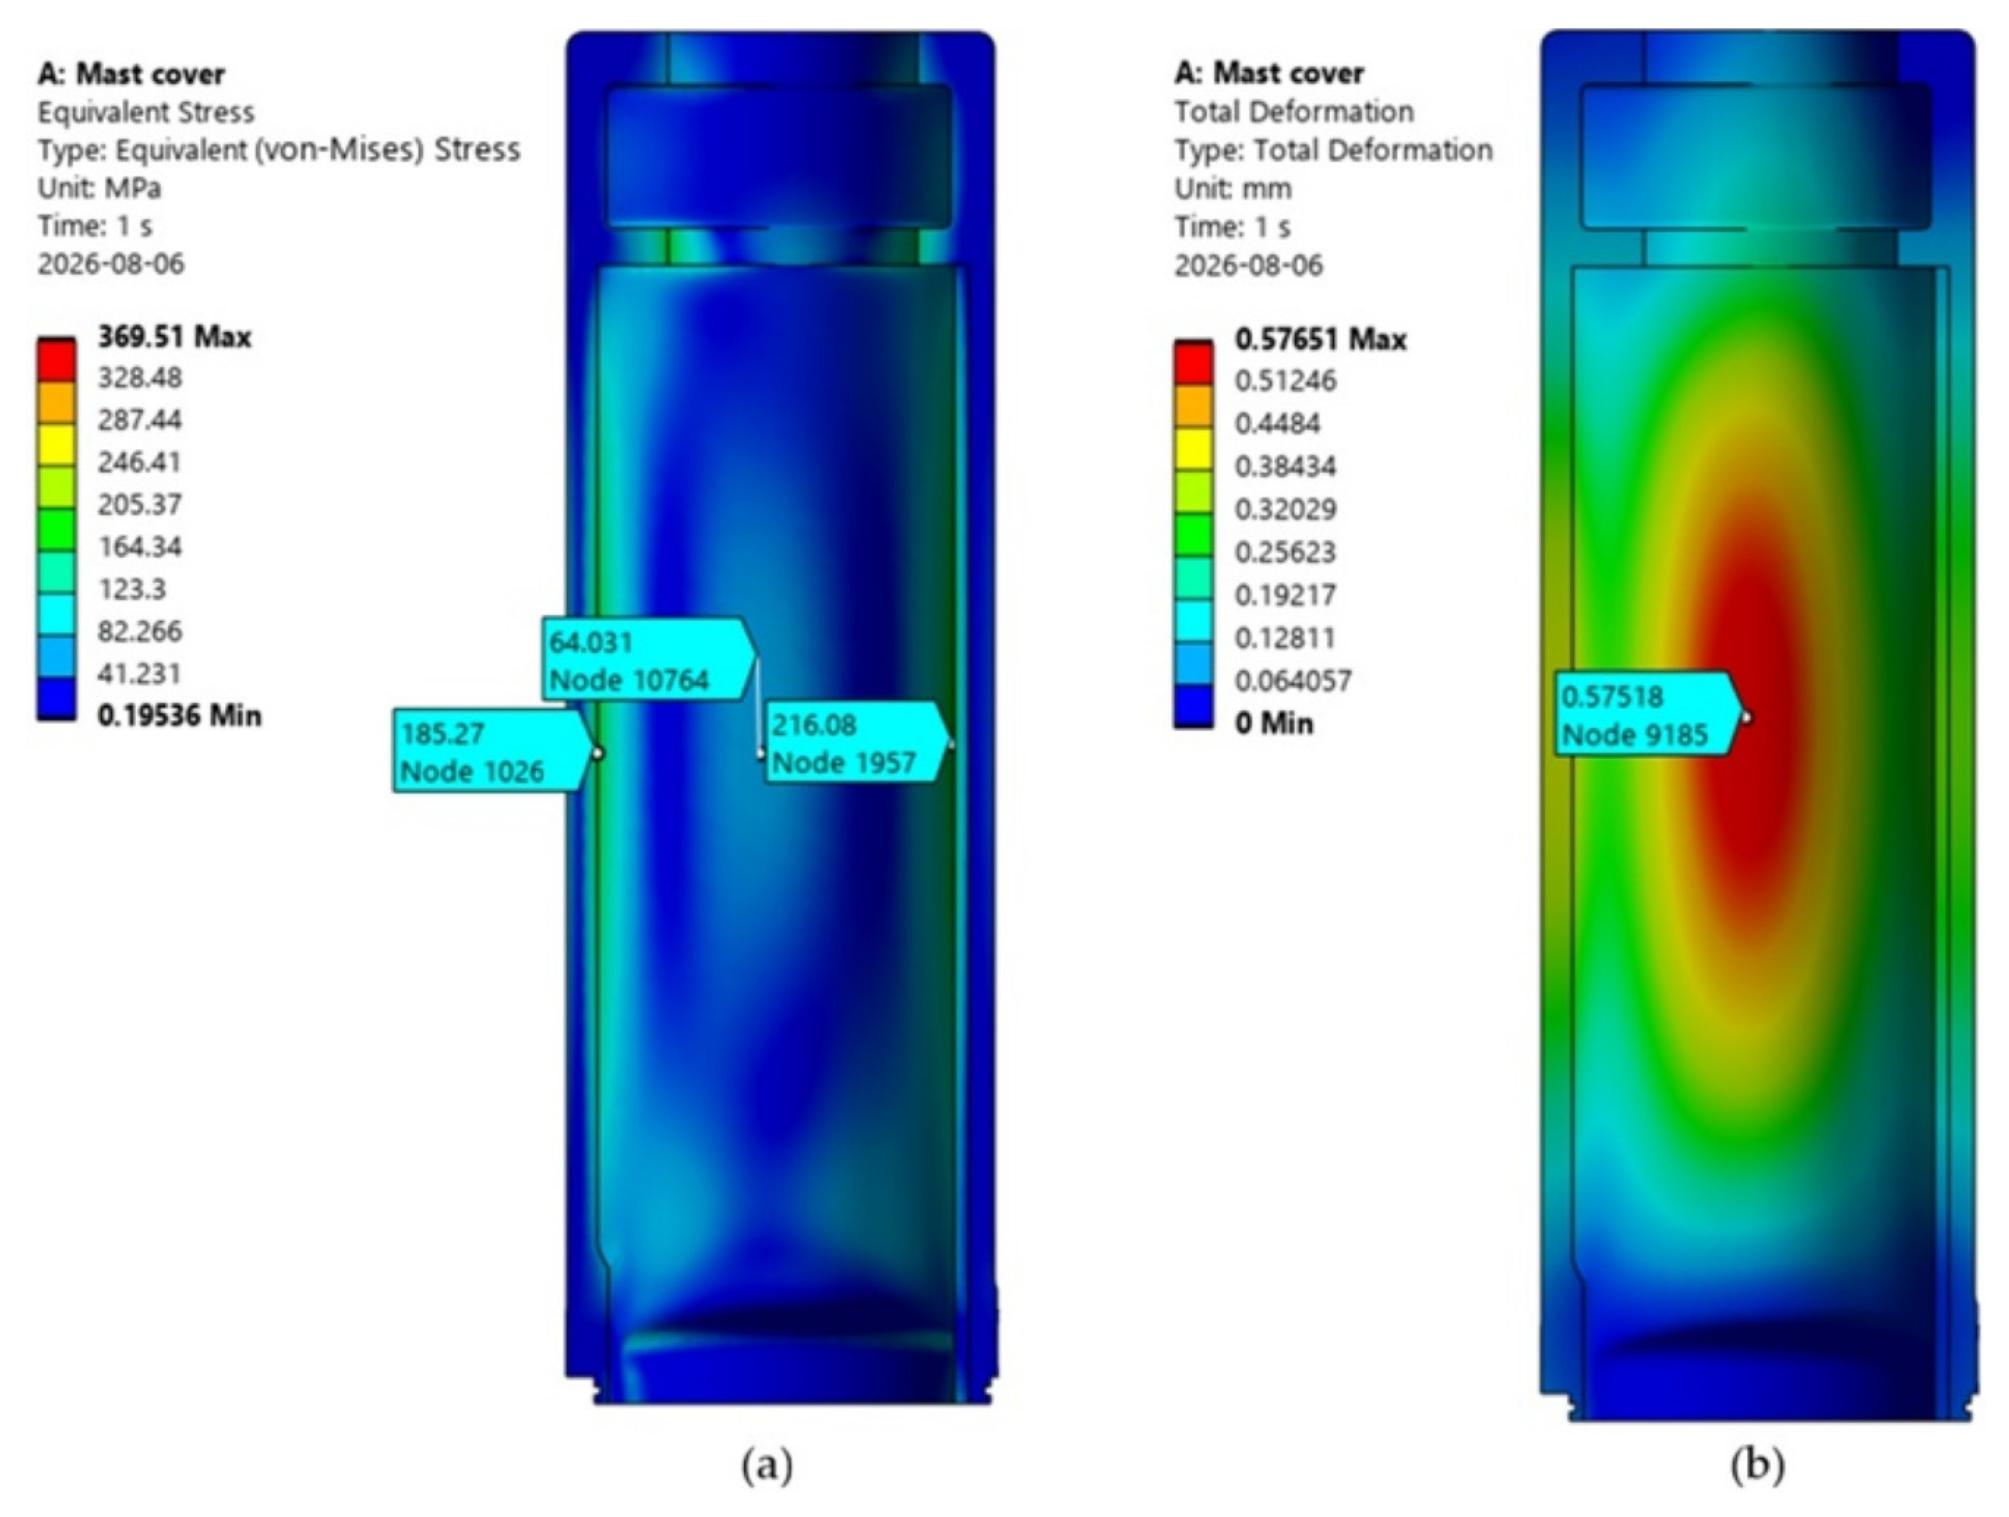
Figure 4 illustrates the FEA results of the mast cover under a submergence depth condition of 600 m (external pressure of 7.0 MPa), where Figure 4a and Figure 4b depict the von Mises equivalent stress and total deformation distributions, respectively. The visualization presents the internal view sliced along the longitudinal major-axis section plane (Section B-B in Figure 1).
The maximum equivalent stress occurred approximately at the longitudinal midpoint (488 mm from the bottom base) and was quantitatively labeled. Within this section, the central region corresponds to the minor-axis orientation, whereas the outer edge corresponds to the major-axis orientation. Stress distribution analysis revealed that significantly higher stresses were generated along the major-axis edges compared to the central region. The equivalent stress at the center was 64.0 MPa, whereas the left and right major-axis edges reached 185.2 MPa and 216.0 MPa, respectively. Notably, the high stress concentrations at the edges were localized on the inner surface rather than the outer surface. Regarding total deformation, the maximum values were also observed near the longitudinal midpoint; however, unlike the stress state, the deformation was noticeably higher along the minor-axis direction. This behavior is attributed to the elliptical cross-section of the mast cover, which exhibits lower structural stiffness against radial deformation along the minor axis under external hydrostatic loading.
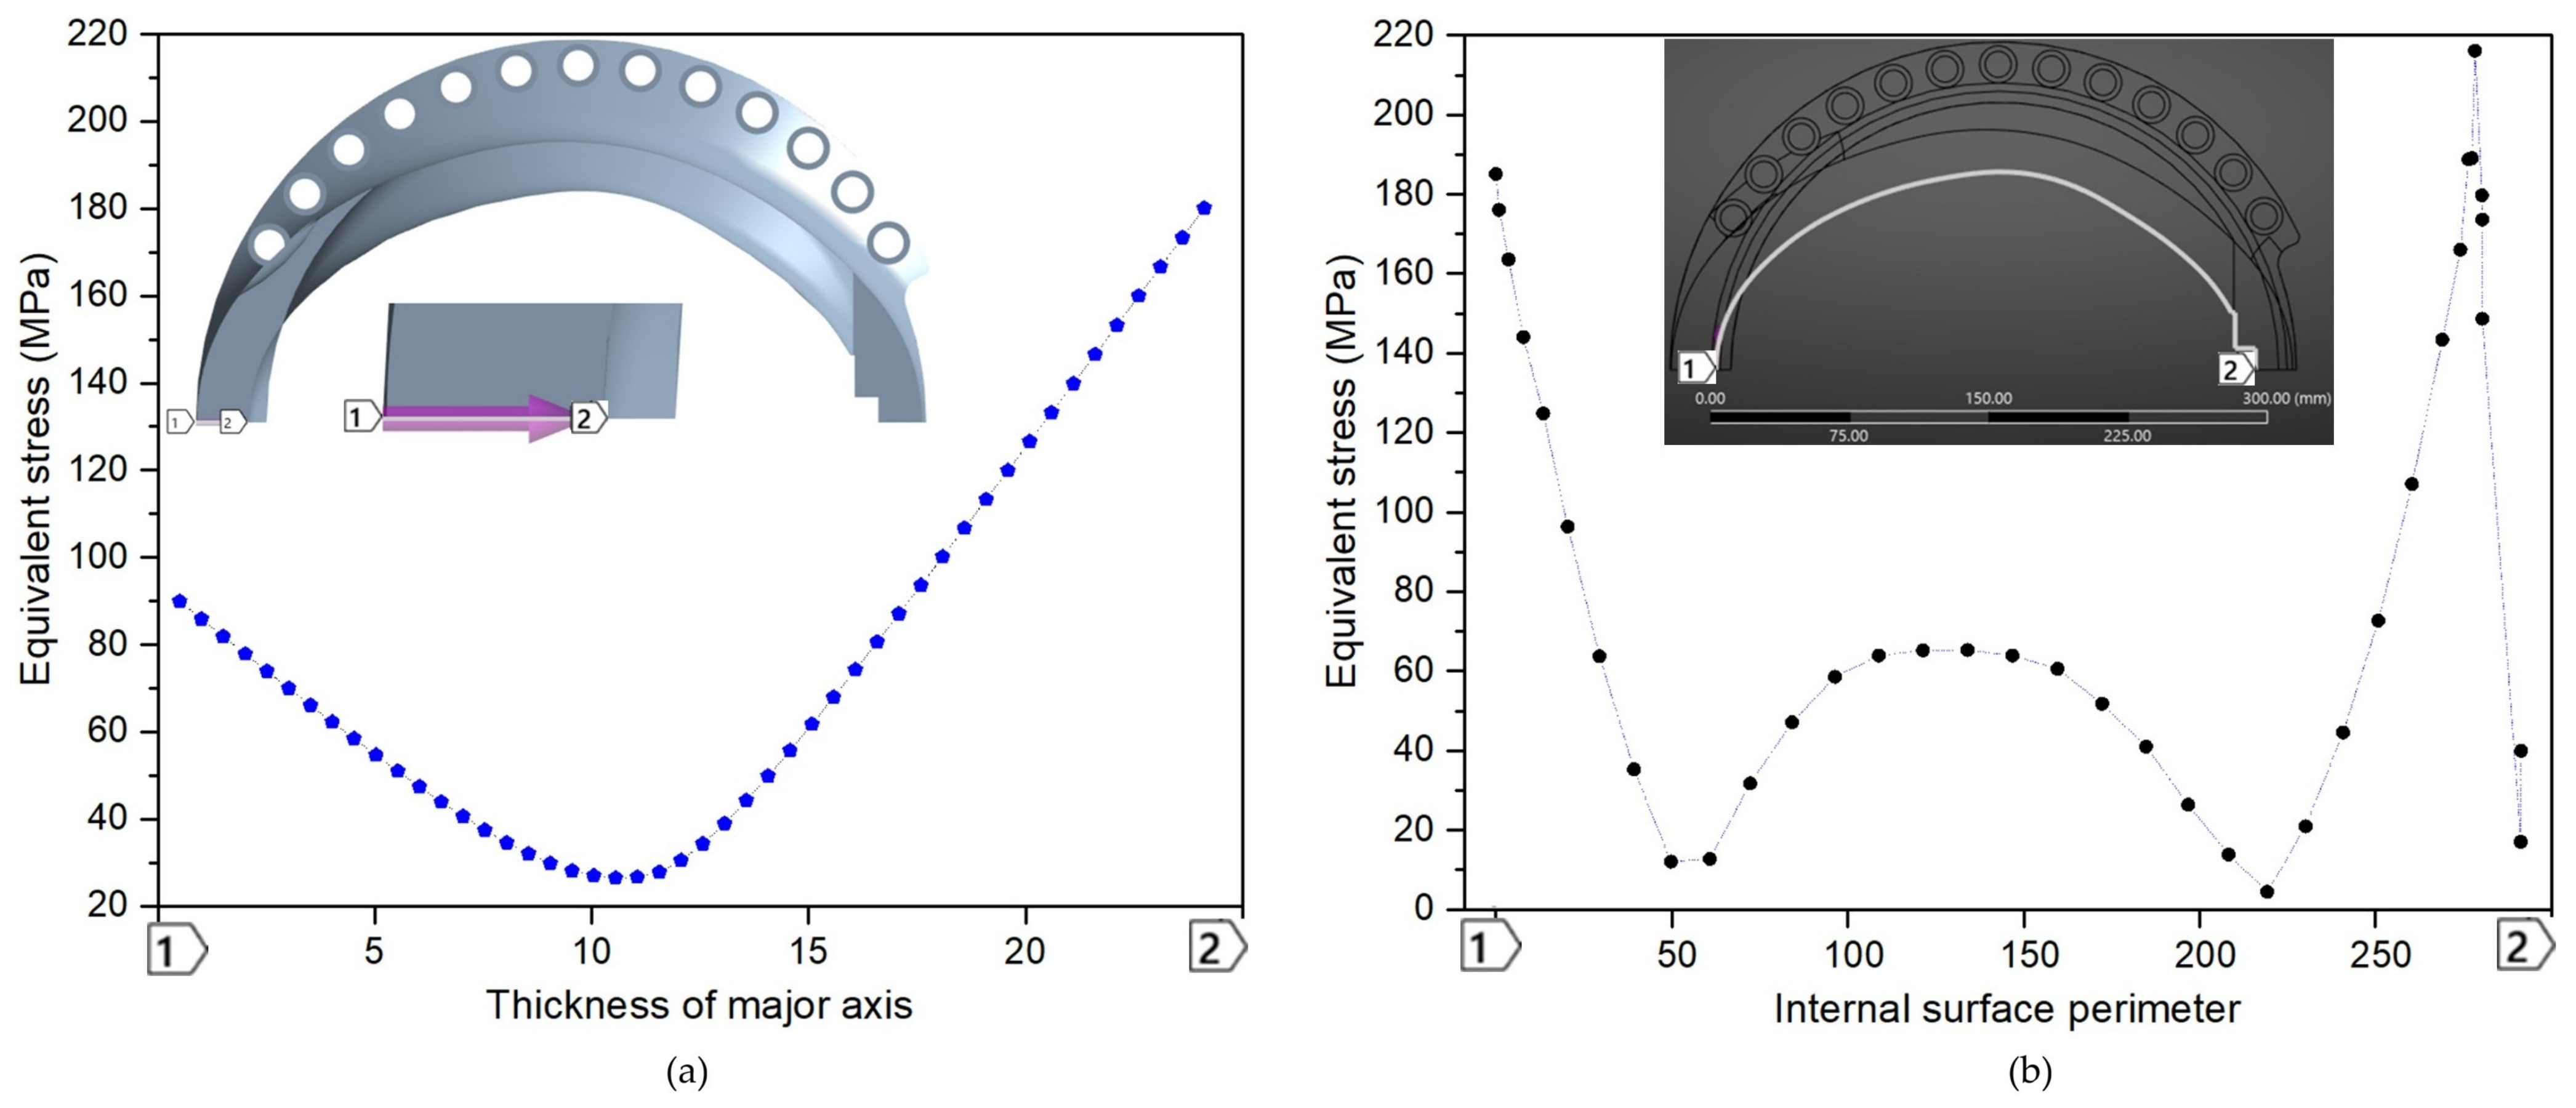
To further elucidate the equivalent stress behavior, stress profiles along the wall thickness and the inner surface perimeter were extracted using the Path function in ANSYS. Figure 5a shows the stress profile across the major-axis wall thickness from the outer to the inner surface. The equivalent stress at the outer surface (Point 1) was 89.9 MPa, which initially decreased toward the interior before linearly increasing to a peak value of 180.1 MPa at the inner surface (Point 2). This indicates that the stress on the inner surface is approximately twice as high as that on the outer surface. Figure 5b depicts the equivalent stress distribution along the inner perimeter path, where the left major-axis position (Point 1) exhibited 185.1 MPa and the right major-axis position (Point 2) recorded the maximum value of 216.0 MPa.
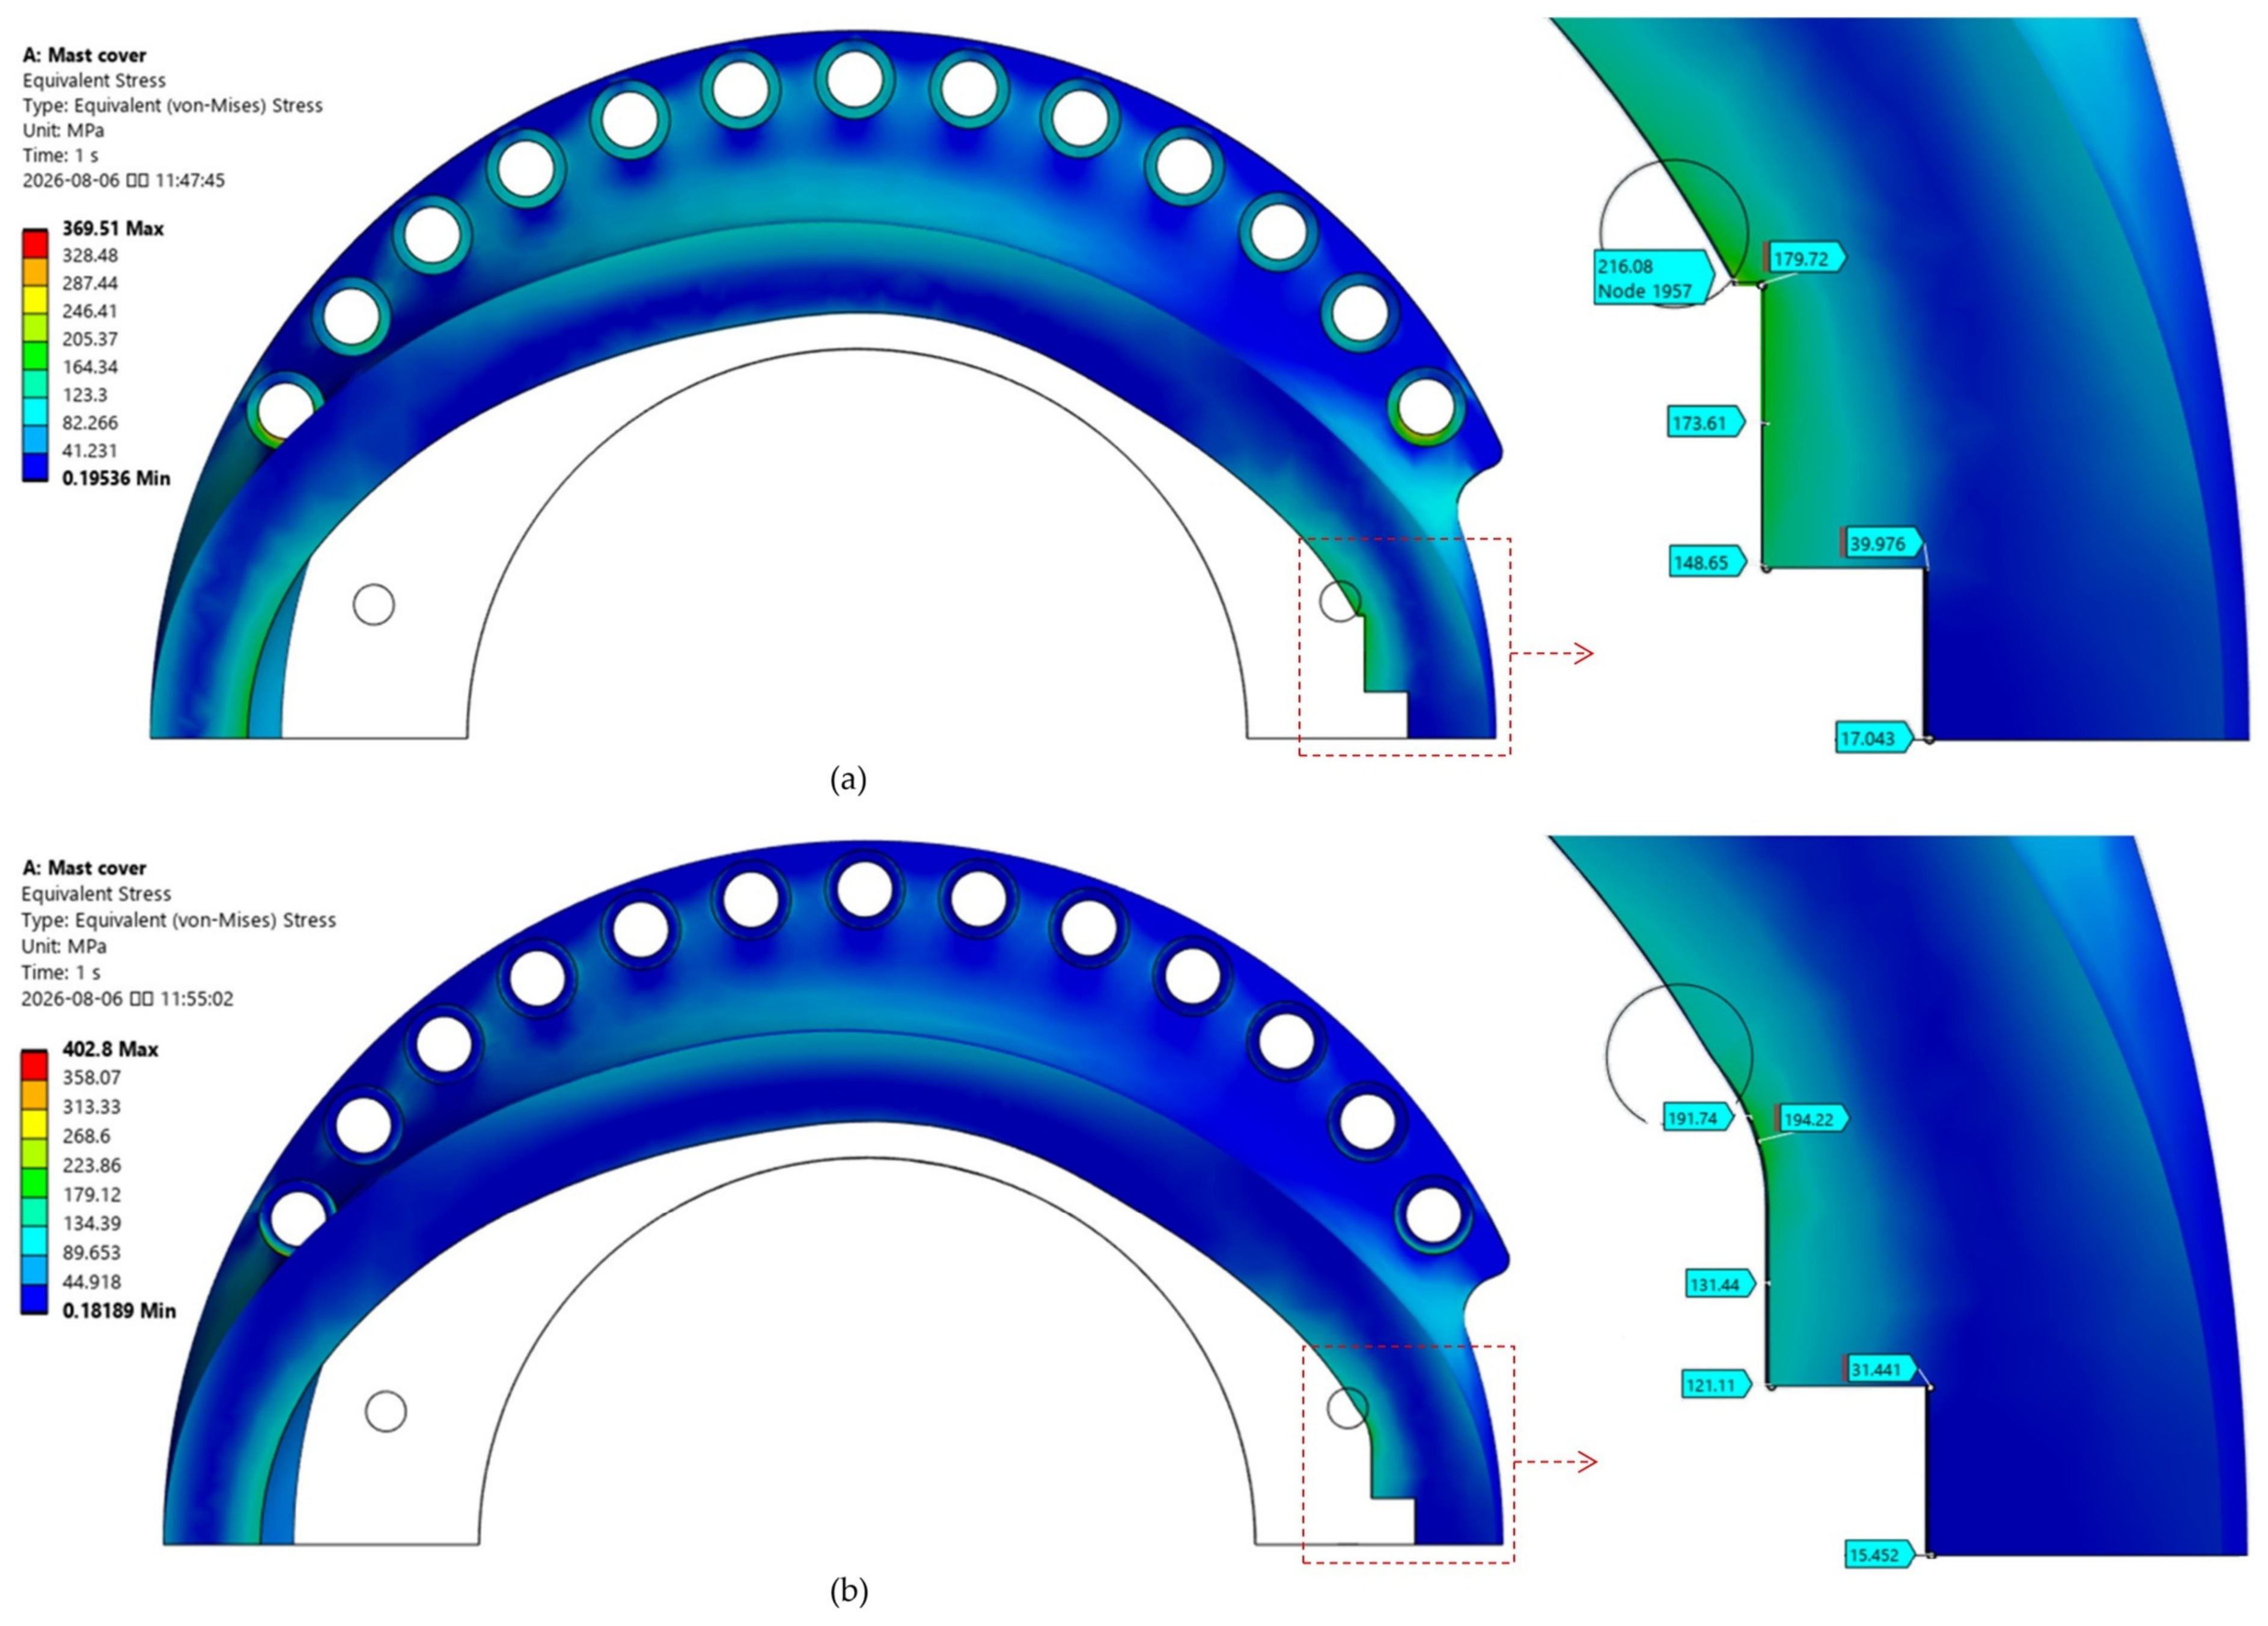
A detailed geometric examination of the maximum stress region (216.0 MPa) revealed that it corresponded to a sharp right-angled step designed for mechanical assembly with adjacent components, as shown in Figure 6a. Severe stress concentration occurred at the sharpest corner among the right-angled geometries on the right major-axis side. To mitigate this stress peak, a design modification was implemented by introducing a suitable fillet radius to the sharp corner. Figure 6b shows the FEA results after applying the fillet radius, demonstrating that the maximum equivalent stress was substantially reduced to below 194 MPa due to stress redistribution. Based on the nominal yield strength of 390.0 MPa, the safety factor is calculated as 2.01 (390.0/194.0), confirming that the optimized design maintains a safety factor exceeding 2.0. Consequently, it was verified that the designed mast cover maintains structural stability within the purely elastic regime without undergoing plastic deformation under the maximum operating submergence depth of 600 m.

4.2. Casting Process Simulation

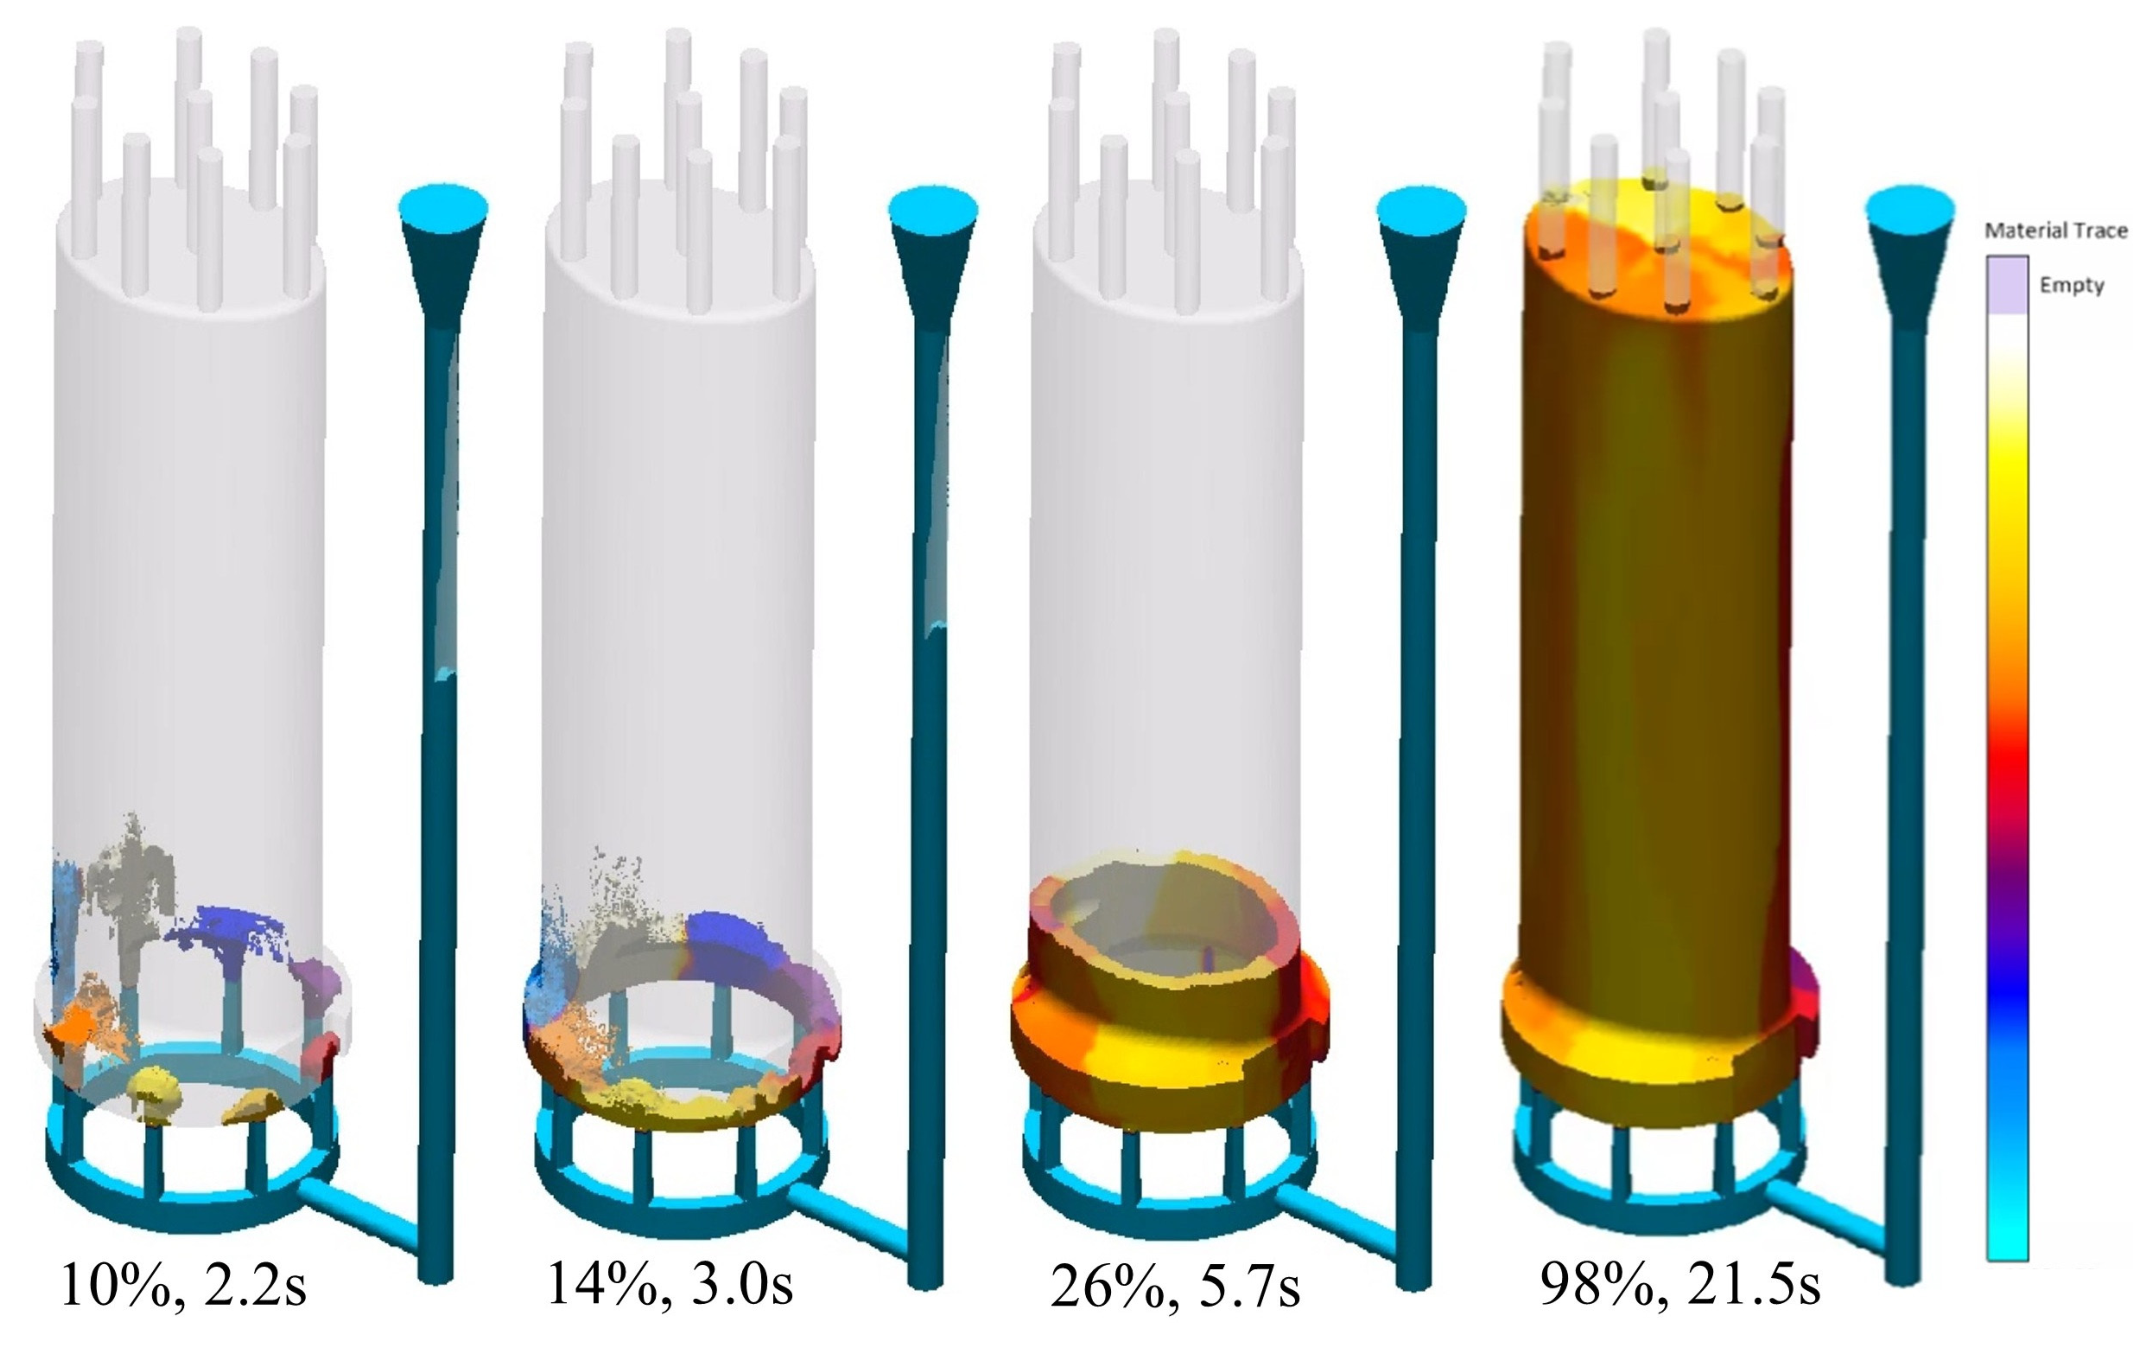
Using the specialized casting simulation software MAGMA5, fluid flow and solidification kinetics, including gate flow velocity, mass flow rate, material trace (flow mixing behavior), temperature distribution within the cavity, and shrinkage porosity formation, were quantitatively analyzed. Figure 7 illustrates the material trace showing the flow mixing behavior as the molten metal enters the mast cover cavity through the eight individual gates. During the initial filling stage (10% filled), the molten metal enters uniformly as eight distinct color-coded streams from each gate. Up to the lower region filling stage (14%), equal flow rates are maintained across all gates, preserving the eight distinct flow paths. As filling reaches 26%, adjacent streams begin to merge into four color domains, eventually synthesizing into two representative flow streams upon completion (98%). This sequential flow merging indicates that the molten metal is stably and symmetrically distributed through the gating system without severe initial turbulence or localized channeling.
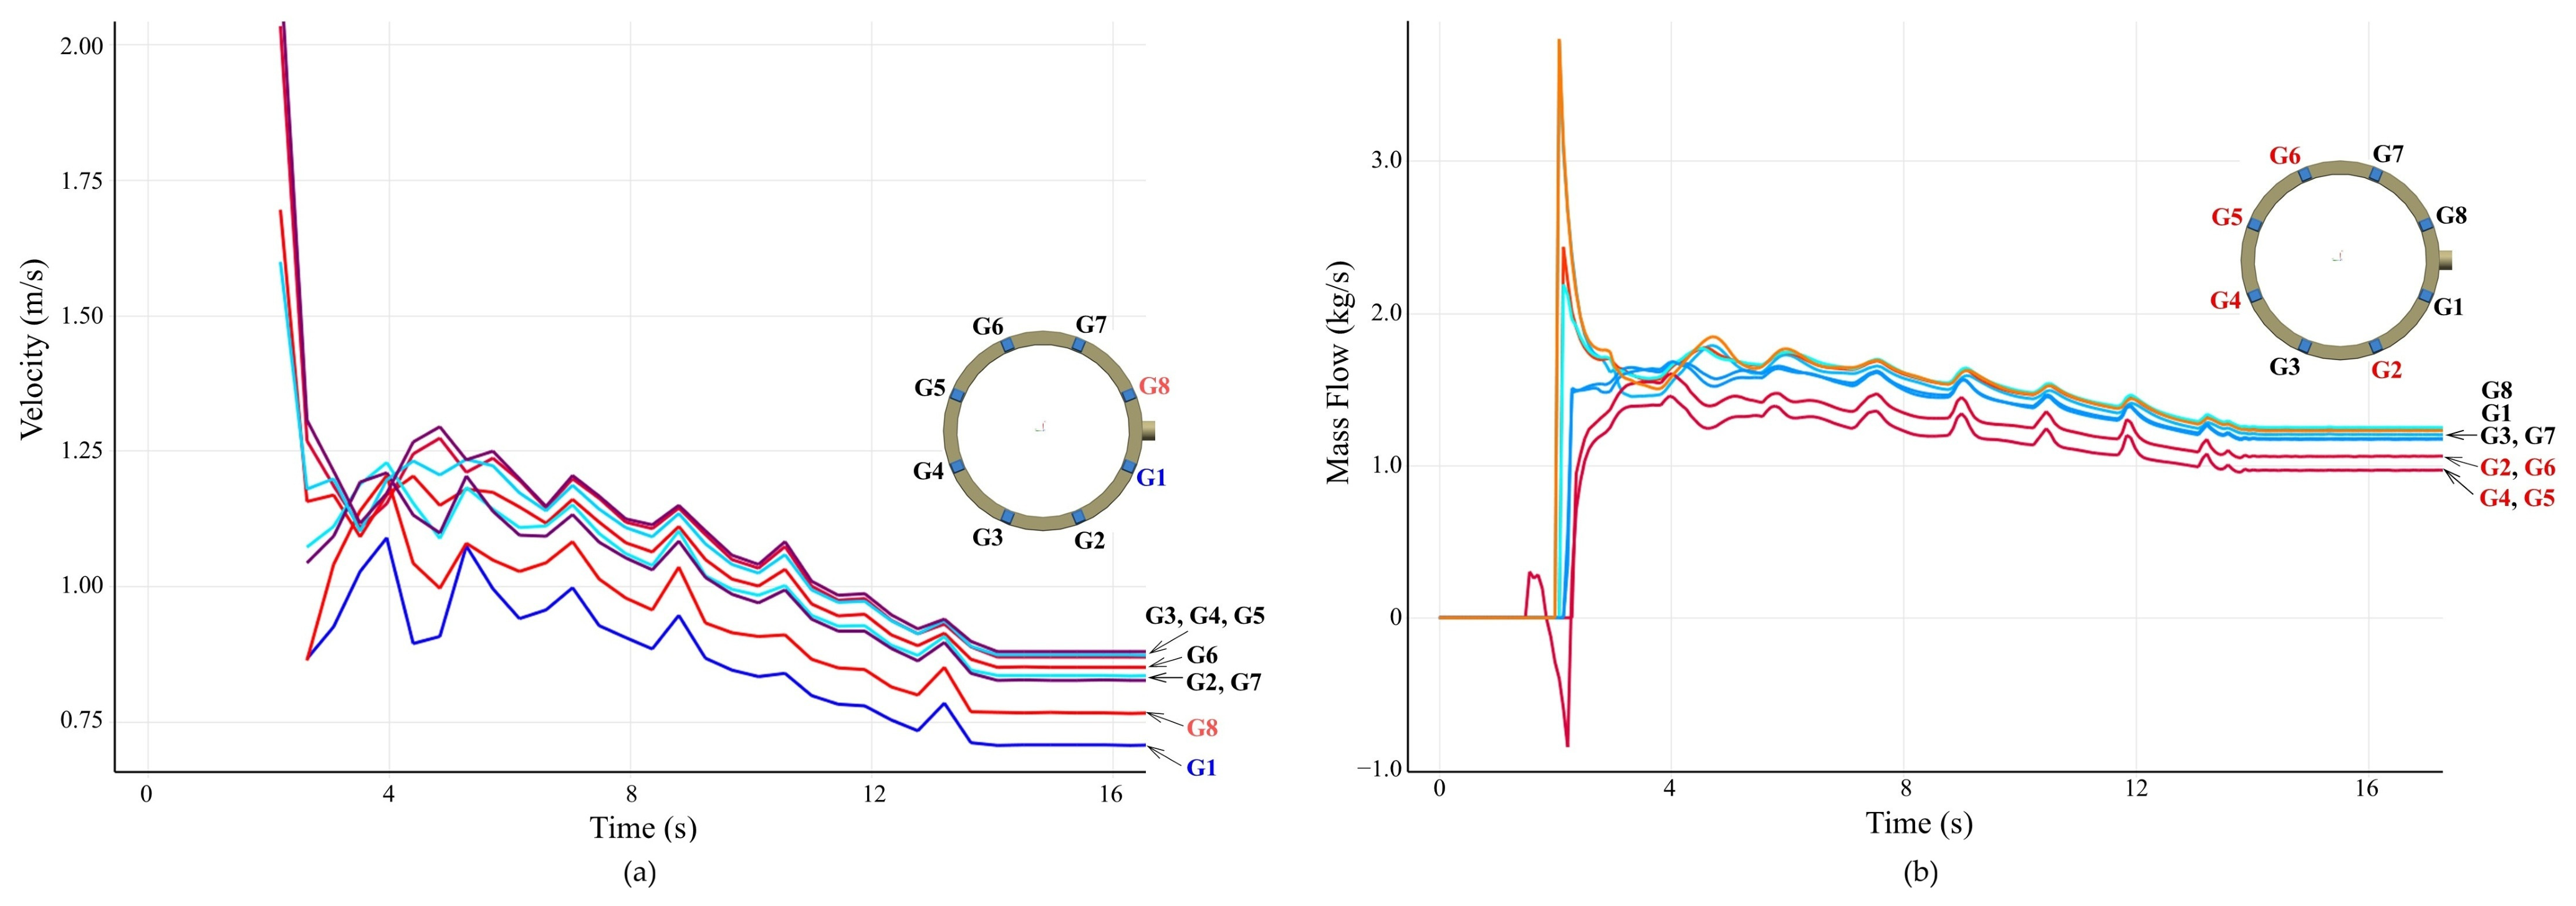
Figure 8a presents the flow velocity profiles at each gate during mold filling. At the onset of pouring (2.2 s), the gate entry velocities range from 1.60 to 2.25 m/s. As the lower cavity is filled (3.8 s), the velocities stabilize and drop below 1.25 m/s. Beyond 13 s (50% filled), the gate velocities remain highly stable under 0.9 m/s due to the established hydrodynamic backpressure. Although gates nearer to the sprue inlet (G1 and G8) exhibit slightly lower velocities compared to the downstream gates (G3–G6), the maximum velocity deviation among all gates remains within 0.8 m/s, confirming a smooth laminar flow state. Figure 8b shows the mass flow rate through each gate, exhibiting a trend consistent with the velocity profiles. The gating design, including gate count and spatial arrangement, proved highly effective for achieving balanced filling kinetics.
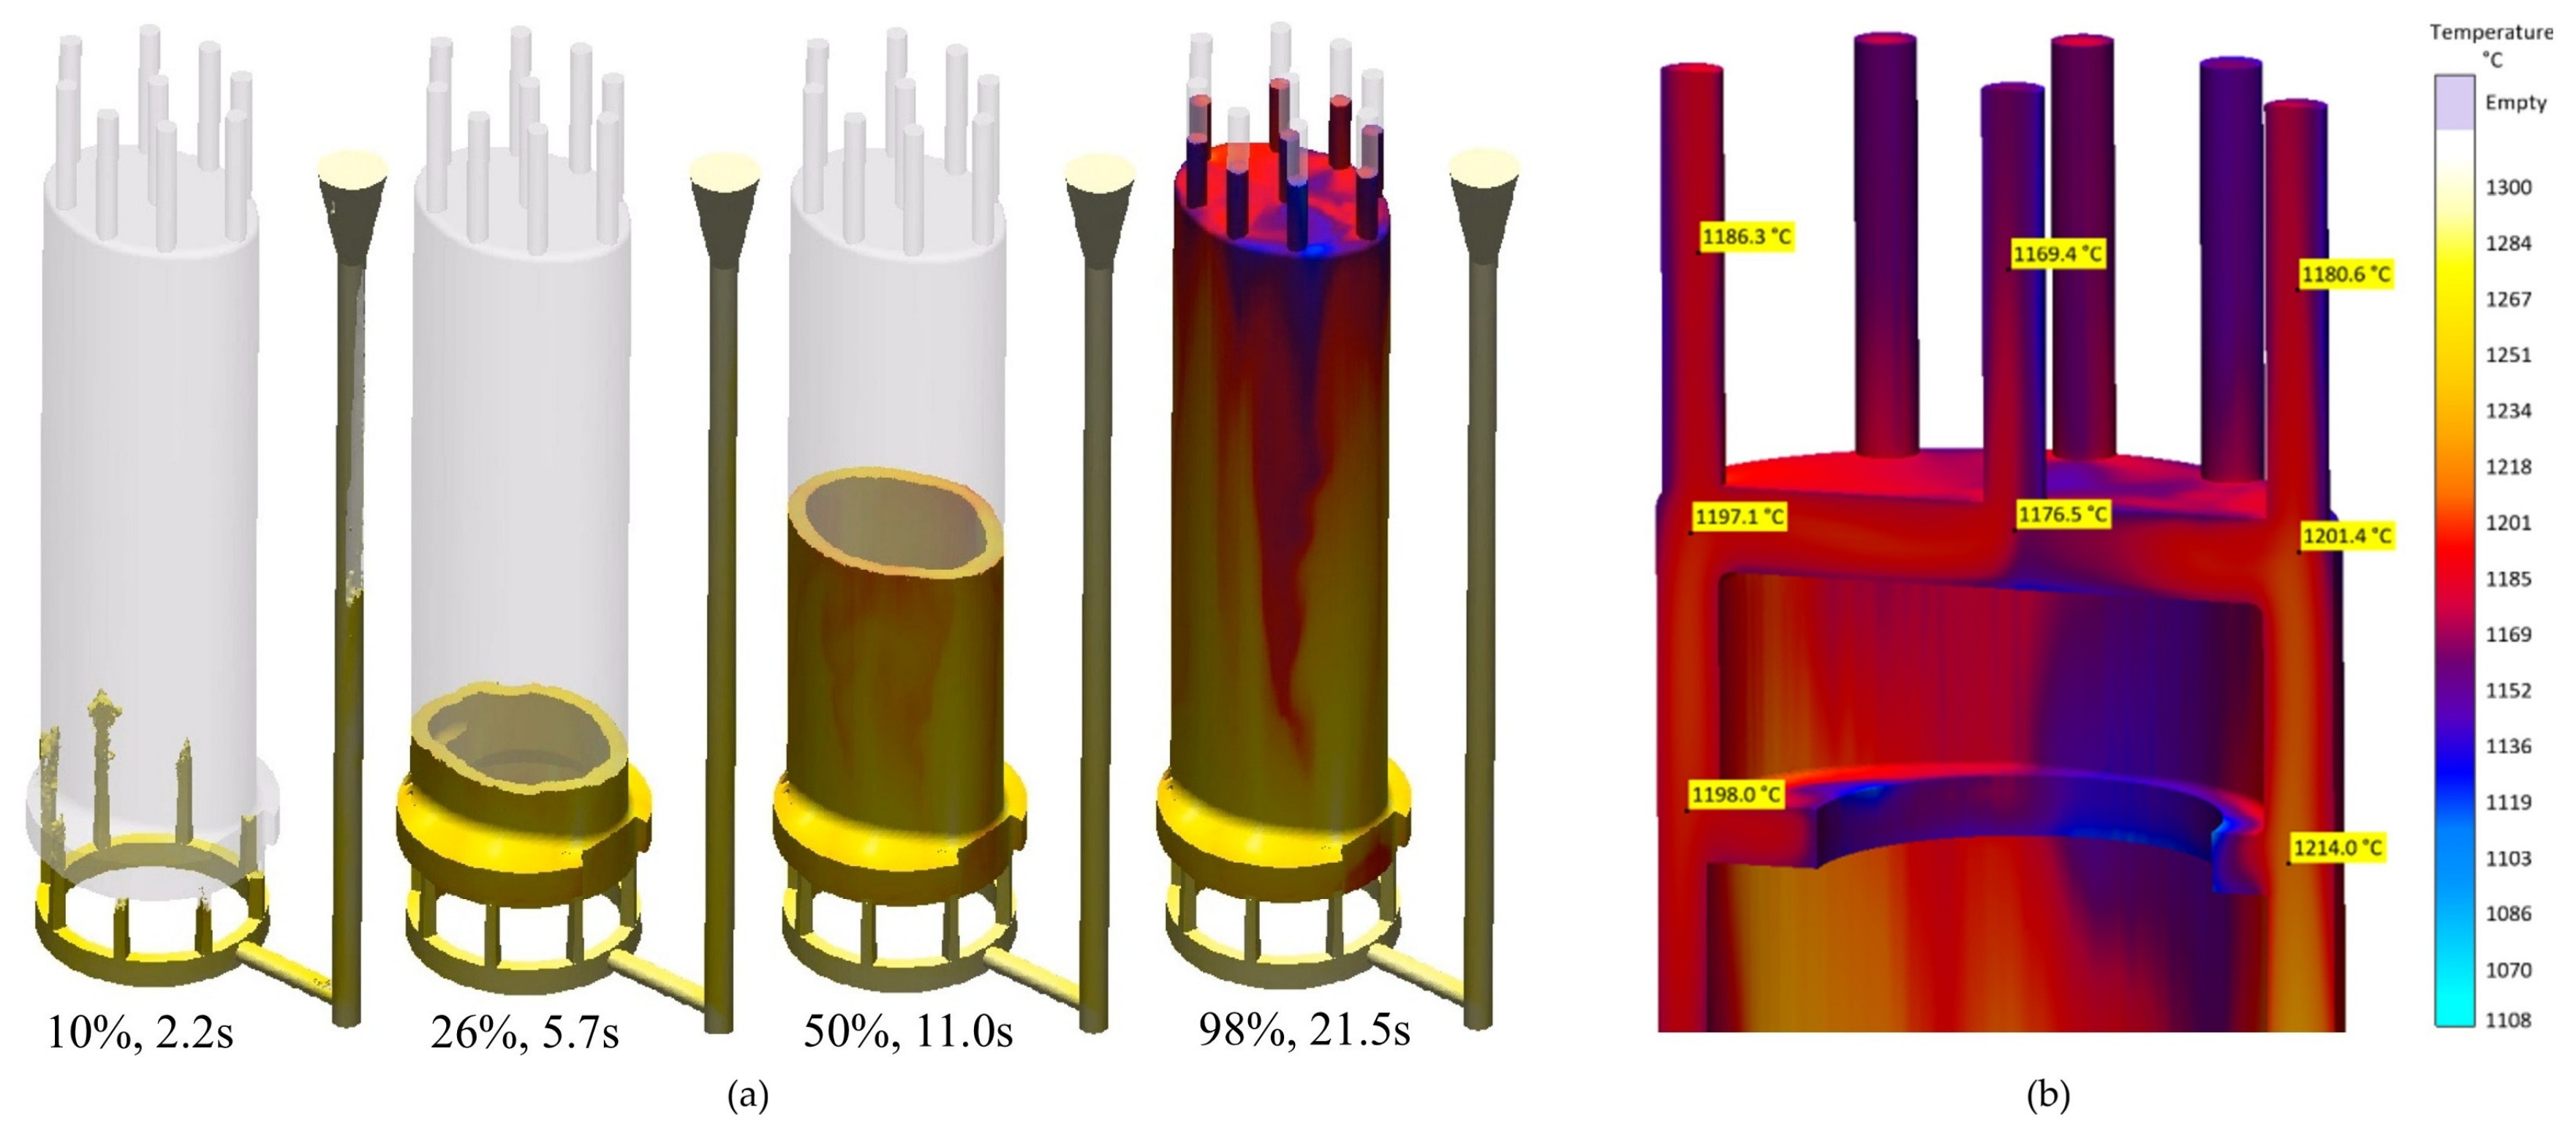
Figure 9a demonstrates the temperature distribution of the melt during cavity filling. Minor localized turbulence was observed during the initial filling of the bottom flange (14%), which quickly transitioned into a smooth, ascending flow (26%). While minor thermal loss occurred near the top mast collar region (90%), the molten metal flowed smoothly into the risers without premature freezing. Figure 9b details the temperature field immediately after filling completion. The temperature in the mast collar region ranged from 1197 to 1214 °C, while the riser region recorded 1169 to 1186 °C, with the maximum localized temperature drop reaching 1130~1176 °C. Since all predicted temperatures significantly exceed the solidus temperature of the CuAl10Ni alloy (1108 °C), complete cavity filling is accomplished strictly in the liquid state, eliminating risks of misruns or cold shuts.
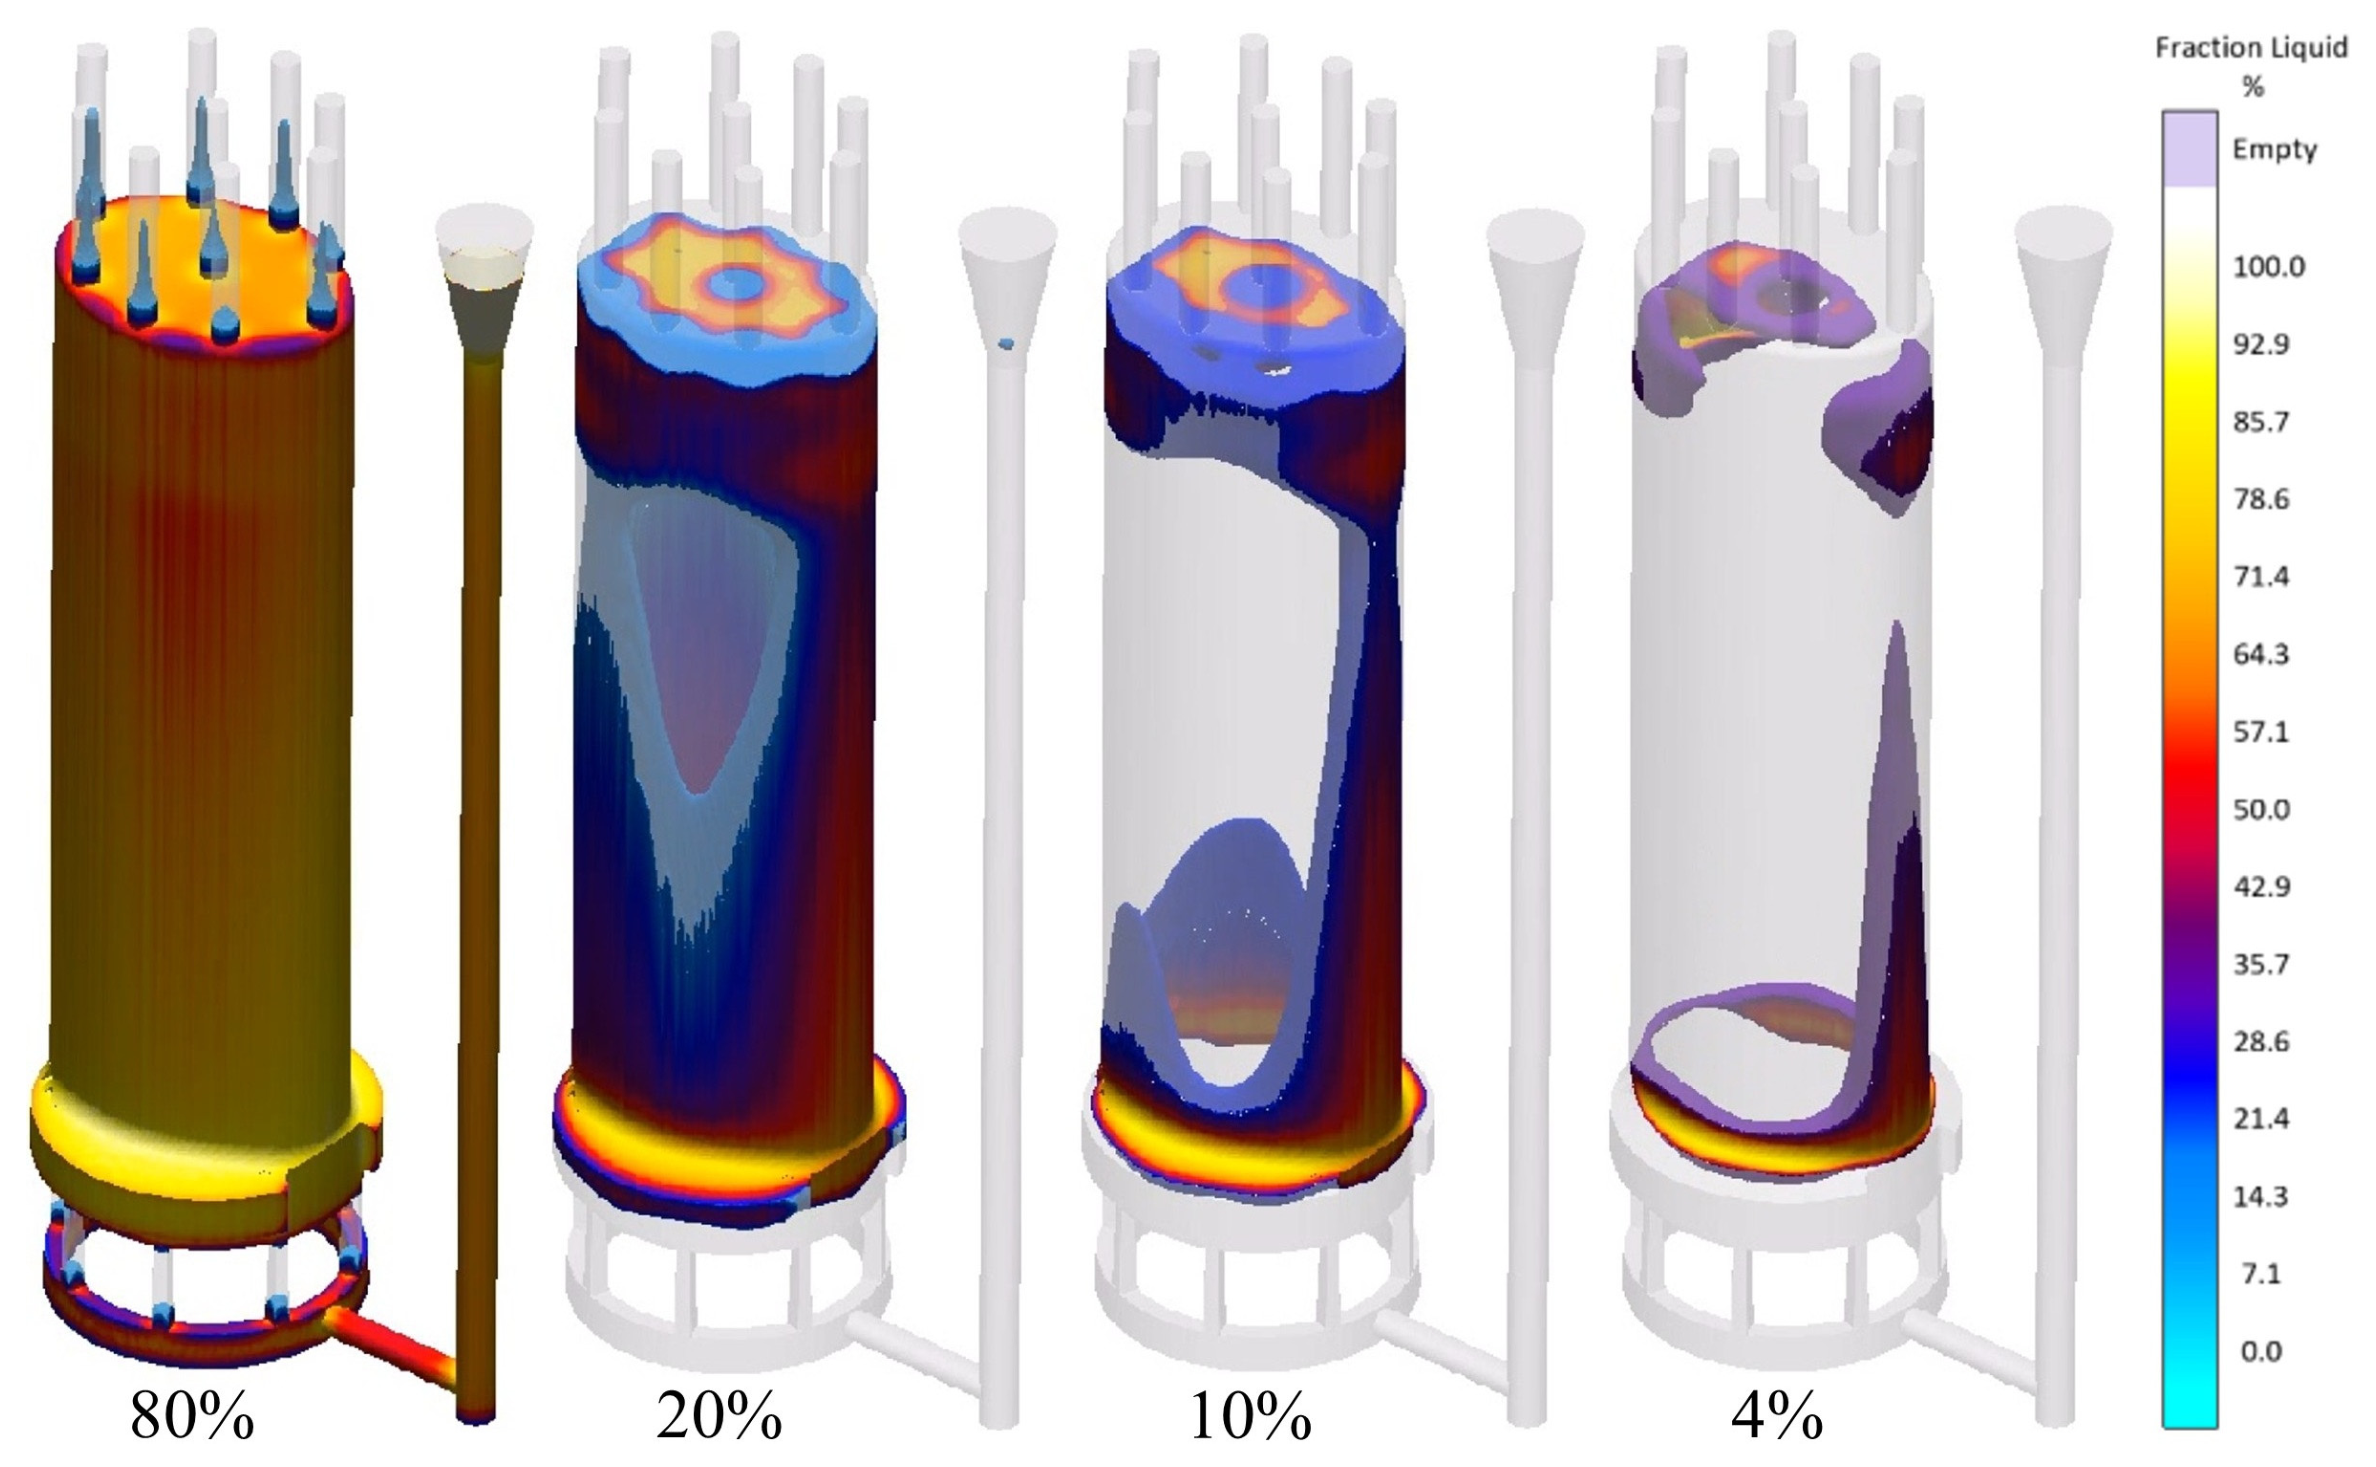
Figure 10 depicts the solidification progress as a function of fraction solid after filling. Fast solidification initiates at thin-walled sections of the gating system (risers, gates, and runner). At a solid fraction stage corresponding to 60% solid in the gating elements, the gates and risers solidify first, while the main mast’s cover body remains in a mushy (liquid-solid coexisting) state. Within the mast cover, solidification progresses first from the central thin-walled section, whereas the top and bottom thick-section regions solidify last. This sequence underscores the necessity of optimizing riser volume or applying chills during experimental casting to enforce ideal directional solidification toward the risers.
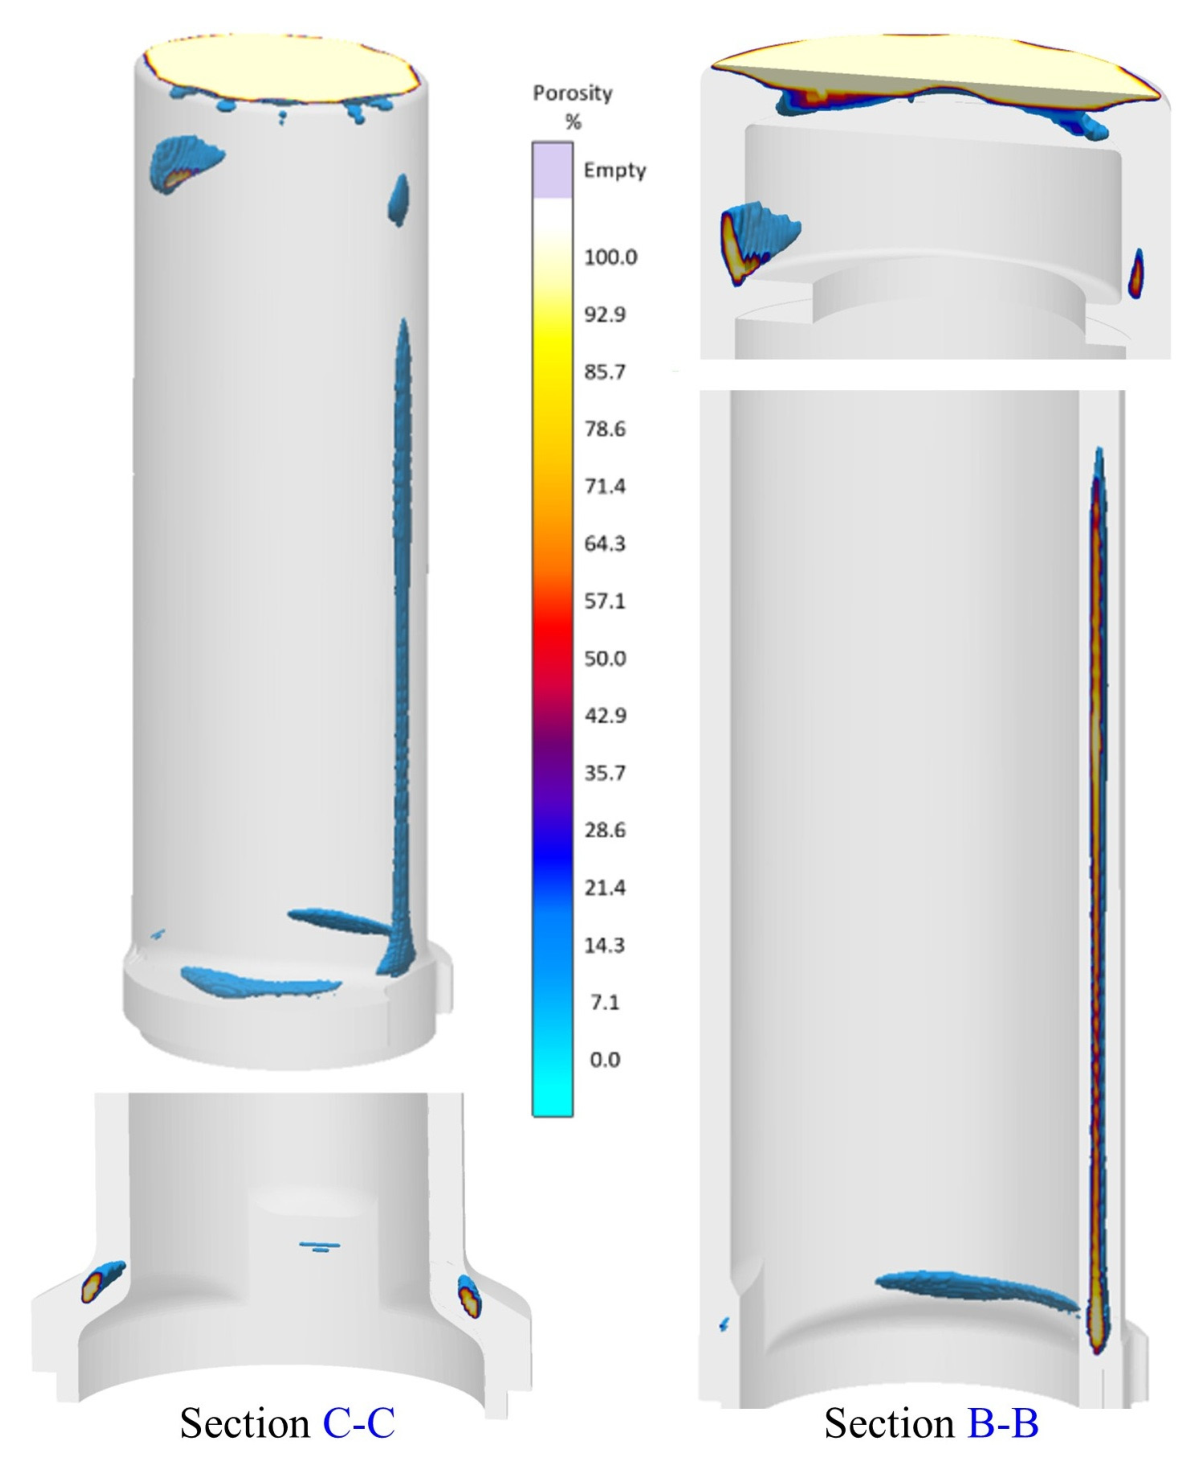
Figure 11 illustrates the predicted shrinkage porosity distribution across the internal cross-sections (Section B-B and Section C-C). Porosity formation was predicted in the late-solidifying top, bottom, and major-axis boundary regions. The porosity probability was below 20% at the bottom flange and below 50% at the major-axis boundaries, whereas the top mast collar exhibited a porosity probability exceeding 50%. However, because this high-porosity zone at the top of the mast collar is situated entirely within the machining allowance region, which is subsequently removed during the final machining of the Ø195.3 mm through-hole, it poses no threat to the structural integrity and mechanical performance of the final cast product.

4.3. Prototype Sand Casting

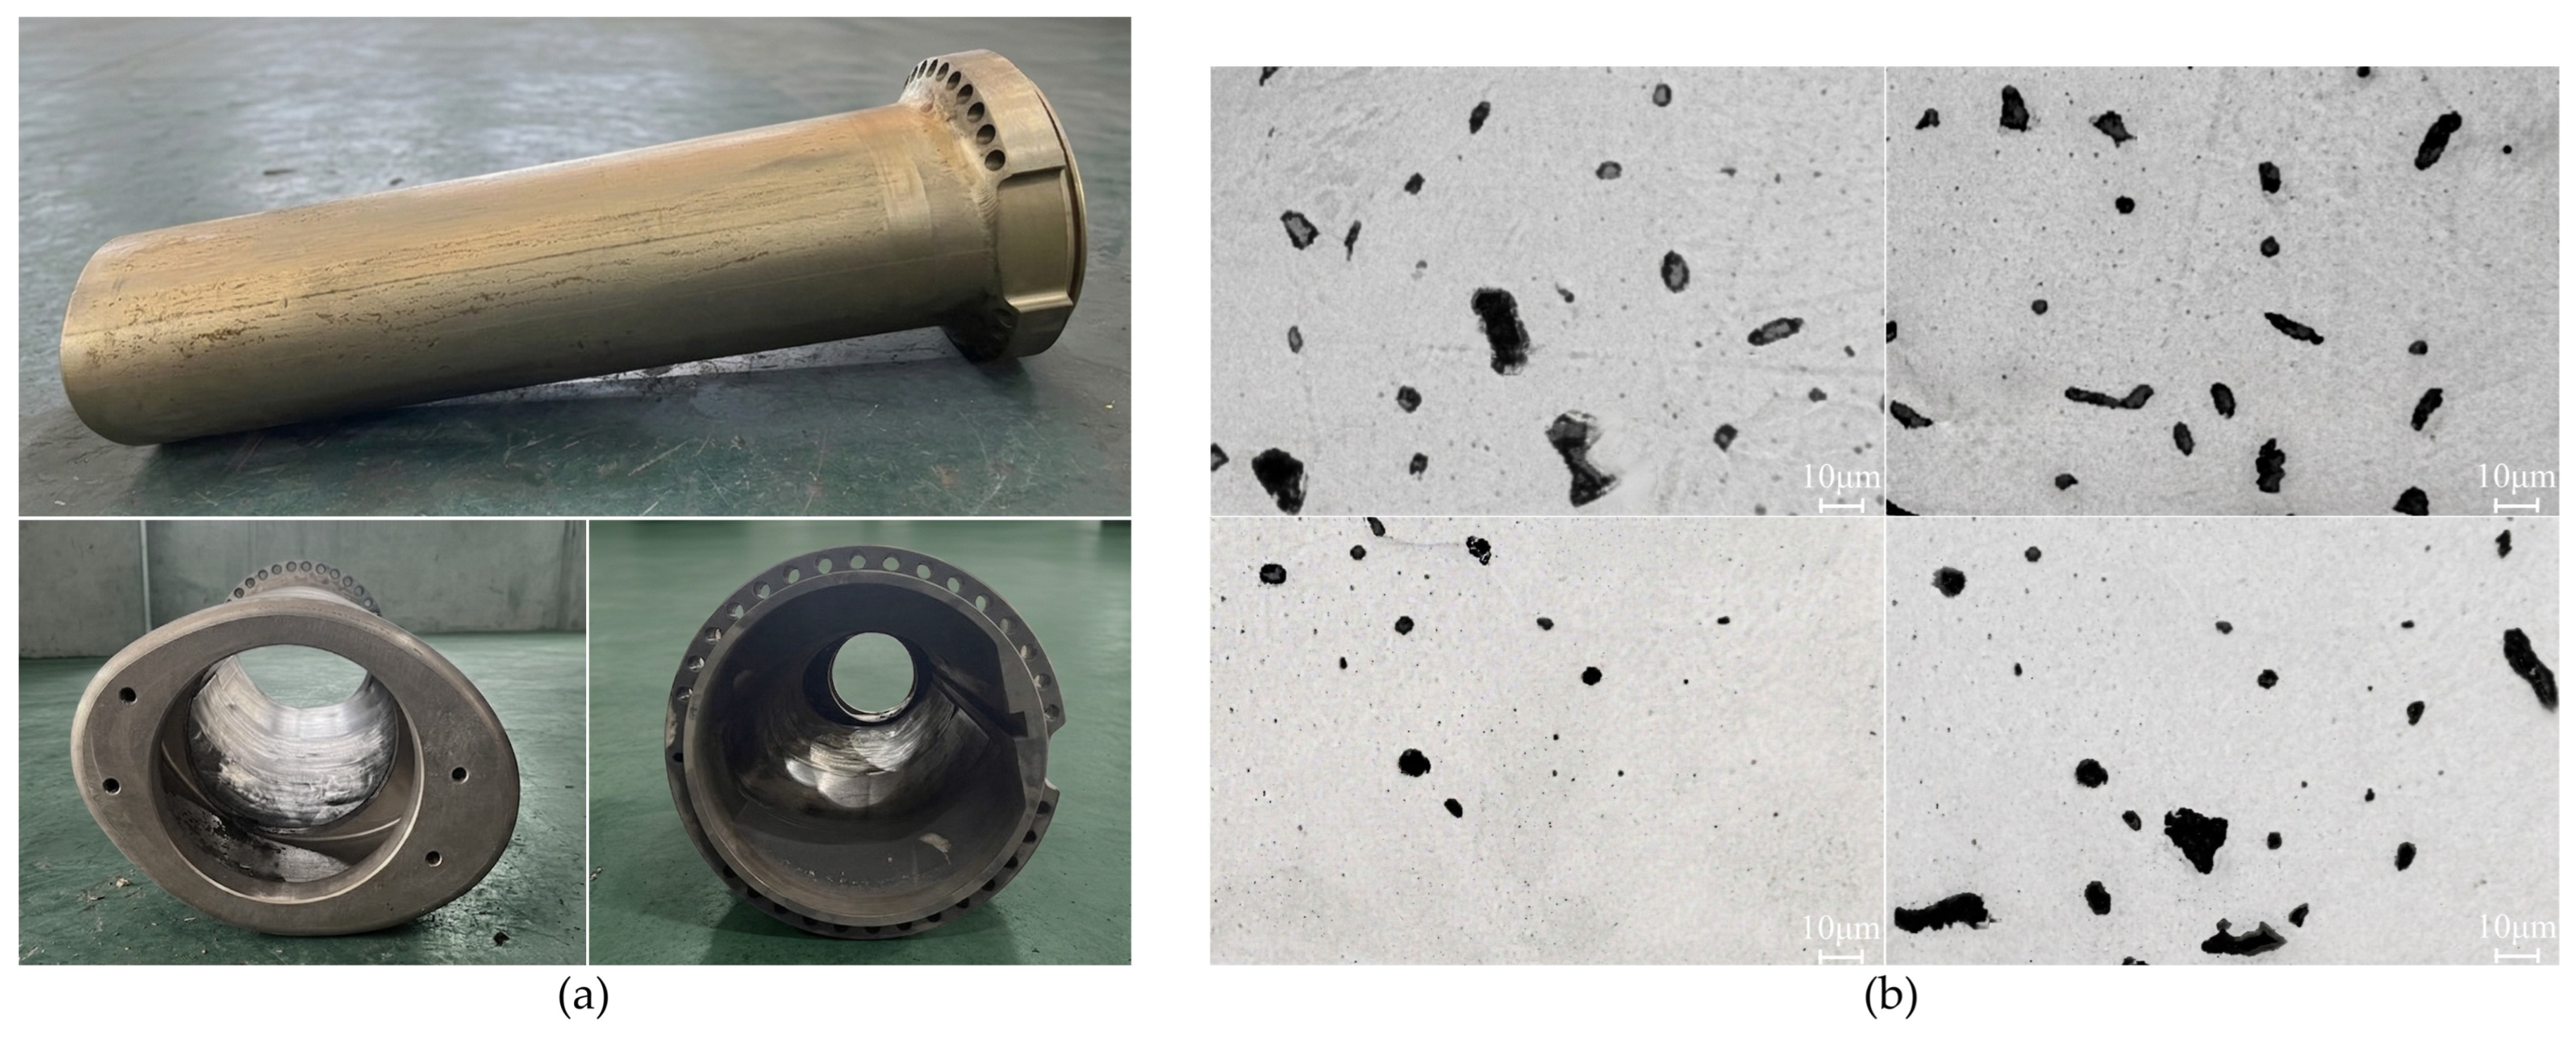
Based on the solidification analysis in Figure 12, the initial gating design (Figure 2) was revised to enforce directional solidification. The riser diameter was enlarged from Ø30 mm to Ø60 mm, and metallic chills were placed near the bottom heavy-section region of the sand mold cavity to promote localized cooling. Figure 12a shows the finalized NAB mast cover prototype fabricated via sand casting followed by post-machining operations. The prototype was successfully produced with excellent dimensional alignment with the reverse-engineered 3D CAD model (Figure 1). No misrun defects were observed, though minor surface pinholes and subtle cold shut marks were detected on localized cast surfaces. Minor surface marks like subtle cold shuts can arise in actual castings due to dynamic foundry variables (e.g., ambient conditions, binder reactions, and pouring temperature control) that differ from ideal simulation assumptions. Improper process design for such a large component would have caused critical misruns, whereas these superficial artifacts were completely removed during post-machining to yield a sound casting. To directly validate the casting simulation results, optical microscopy was performed on specimens extracted from the heavy-section region, which corresponds to the last-solidifying zone in Figure 10 and the maximum porosity hazard area in Figure 11. As shown in Figure 12b, fine micro-porosities with equivalent diameters of 10~20 μm were observed within the matrix. This microstructural evidence matches the spatial distribution and scale of shrinkage porosity predicted by the casting simulation.
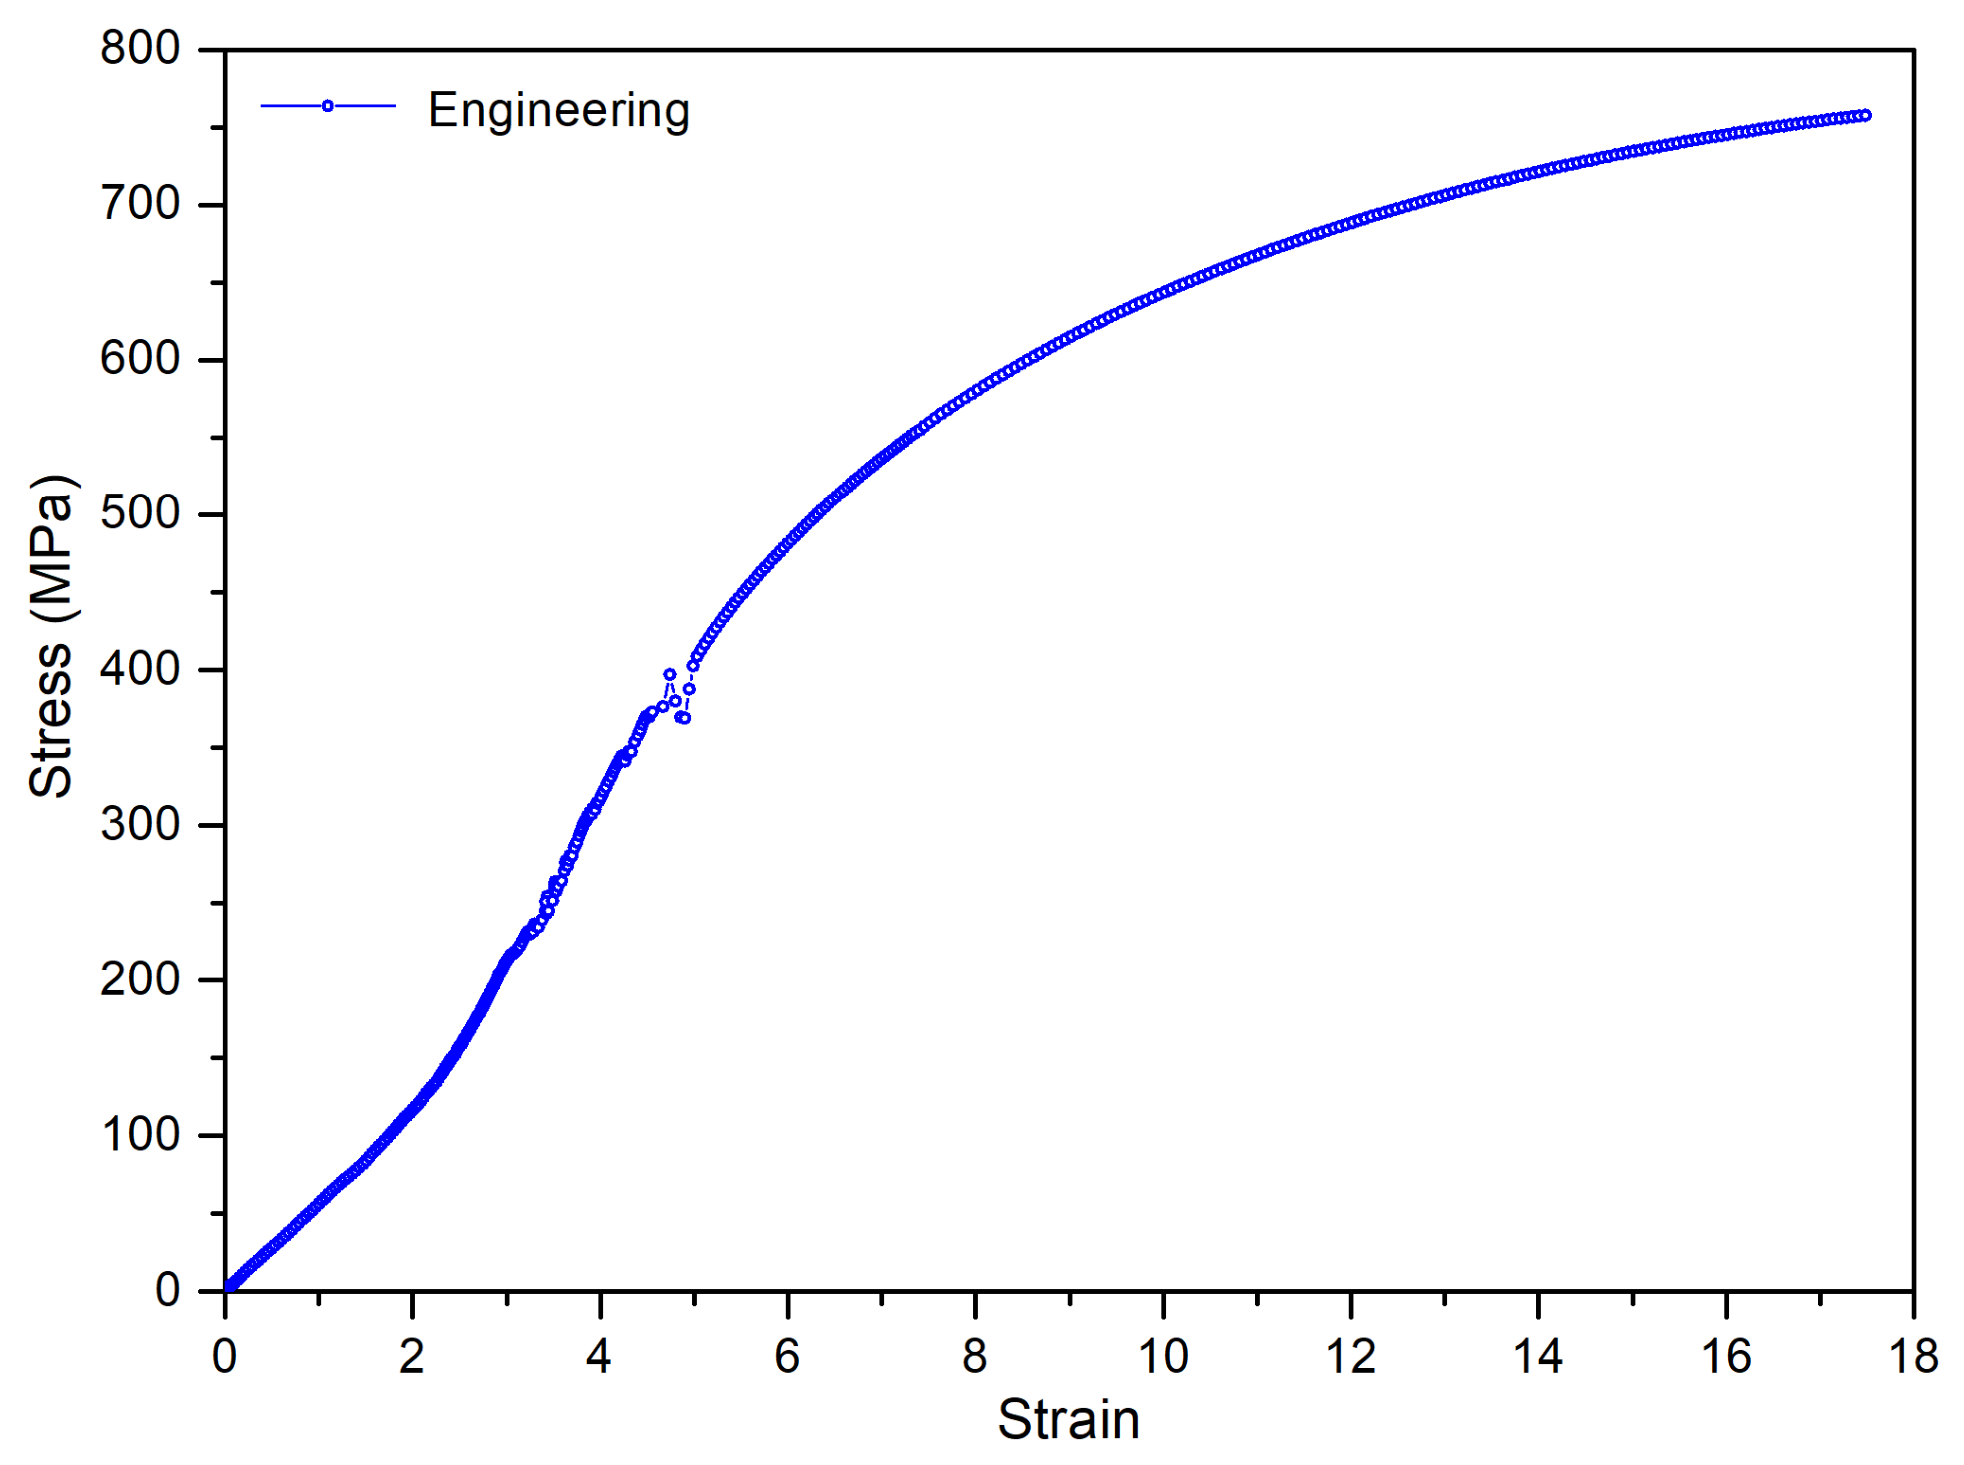
Figure 13 shows a representative engineering stress–strain curve selected from three tensile tests (n = 3) of specimens harvested from the cast prototype. The curve exhibits discontinuous yielding behavior during the initial plastic transition, with measured upper and lower yield strengths averaging 397.0 MPa and 387.7 MPa, respectively. Across all tested specimens, the average yield strength was 392.5 ± 10 MPa. The ultimate tensile strength reached an average of 757.8 ± 12 MPa, followed immediately by final fracture upon the onset of localized necking. The elongation at fracture was measured at 17.9 ± 3%, demonstrating a favorable combination of high mechanical strength and good ductility. Brinell hardness measurements under a 3000 kgf load yielded an average hardness of 197 ± 17 HB. Table 5 summarizes the measured mechanical properties of the sand-cast NAB alloy mast cover prototype along with their standard deviations. All mechanical property values comfortably satisfied the standard specifications (ASTM B505/C95800), verifying the structural soundness and practical applicability of the fabricated component.

5. Conclusions

In this study, an integrated design-to-manufacturing framework systematically combining structural finite element analysis, computational fluid dynamics-based casting process simulation, and experimental validation was successfully developed to produce a highly reliable NAB submarine mast cover. The primary conclusions are as follows:
(1)
Under maximum operating hydrostatic pressure (7.0 MPa, 600 m depth), equivalent stress in the mast cover was concentrated along the inner surface of the major-axis elliptical section, reaching a peak stress of 216.0 MPa at a sharp stepped corner. Applying an optimized fillet radius at this stepped region reduced the peak equivalent stress to 194.0 MPa. This secured a safety factor of 2.01 relative to the nominal yield strength (390.0 MPa), confirming that the structure operates strictly within the elastic deformation regime under deep submergence.
(2)
MAGMA5 fluid flow and solidification simulations confirmed that the unpressurized bottom-gating system (S:R:G = 1.00:2.88:4.80) achieved smooth laminar filling with gate velocities below 1.25 m/s and temperatures above the solidus range (1197~1214 °C), preventing misrun defects. To suppress thermal centers and shrinkage porosity predicted by the simulation, process modifications enlarging the riser diameter from Ø30 mm to Ø60 mm and applying metallic chills at the bottom flange were implemented in the actual casting trial. Remaining porosity (>50%) at the top collar was strategically assigned within the machining allowance (Ø195.3 mm through-hole) and eliminated during post-processing.
(3)
The full-scale sand-cast NAB prototype fabricated using the modified process parameters demonstrated high dimensional fidelity with the 3D CAD model. Mechanical testing yielded an average yield strength of 392.5 MPa, ultimate tensile strength of 757.8 MPa, elongation of 17.9%, and hardness of 197 HB, fully satisfying and exceeding the ASTM B505 specification requirements.

Funding

This work was supported by Kyungnam University Foundation Grant, 2025.

Data Availability Statement

The original contributions presented in this study are included in the article. Further inquiries can be directed to the corresponding author.

Conflicts of Interest

The author declares no conflicts of interest.

References

  1. Jones, M.C. Give Credit Where Credit Is Due: The Dutch Role in the Development and Deployment of the Submarine Schnorkel. J. Mil. Hist. 2005, 69, 987–1012. [Google Scholar] [CrossRef] [Scilit]
  2. Rao, K.C.; Nataraj, D.; Chakradhar, K.S.; Ujwala, G.V.; Sudhir, B.; Lakshmunaidu, M.; Dadi, H.S. An Integrated Dual Antenna for Multi-Band Satellite Communication Applications. Eng. Technol. Appl. Sci. Res. 2025, 15, 23707–23713. [Google Scholar] [CrossRef] [Scilit]
  3. Conway, A.S.; Ranmuthugala, D.; Renilson, M. The effect of geometry on the surface waves generated by vertical surface–piercing cylinders with a horizontal velocity. Proc. Inst. Mech. Eng. Part M J. Eng. Marit. Environ. 2017, 233, 14–26. [Google Scholar] [CrossRef] [Scilit]
  4. Smith, M.J.; Macadam, T.; MacKay, J.R. Integrated modelling, design and analysis of submarine structures. Ships Offshore Struct. 2015, 10, 349–366. [Google Scholar] [CrossRef] [Scilit]
  5. Feng, B.; Feng, C.; Zhong, J.; Zhou, Y. Revolutionizing naval stealth: Advanced composite mast design unveiled. Ships Offshore Struct. 2025, 20, 1–16. [Google Scholar] [CrossRef] [Scilit]
  6. Mouritz, A.P.; Gellert, E.; Burchill, P.; Challis, K. Review of advanced composite structures for naval ships and submarines. Compos. Struct. 2001, 53, 21–42. [Google Scholar] [CrossRef] [Scilit]
  7. Liu, Z.; Wang, G.; Rui, X.; Miao, Y.; Wu, G. Analysis of submarine mast vibration response by transfer matrix method for multibody systems. In Proceedings of the 1st International Conference on Mechanical System Dynamics (ICMSD 2022), Nanjing, China, 24–27 August 2022. [Google Scholar] [CrossRef] [Scilit]
  8. Xu, C.; Peng, Y.; Chen, L.-Y.; Zhang, T.-Y.; He, S.; Wang, K.-H. Corrosion behavior of wire-arc additive manufactured and as-cast Ni-Al bronze in 3.5 wt% NaCl solution. Corros. Sci. 2023, 215, 111048. [Google Scholar] [CrossRef] [Scilit]
  9. Wang, L.; Liu, K.; Li, J.; Geng, S. A Review on Corrosion Behavior and Surface Modification Technology of Nickel Aluminum Bronze Alloys: Current Research and Prospects. Adv. Eng. Mater. 2025, 27, 2401779. [Google Scholar] [CrossRef] [Scilit]
  10. Tan, Y.; Xie, H.; Feng, X.; Huang, S.; Zhang, W.; Peng, L.; Wang, W.; Zhao, Y. Effect of Al/Ni Ratio on the Microstructure and Properties of Nickel–Aluminum Bronze Alloys. Materials 2024, 17, 1330. [Google Scholar] [CrossRef] [Scilit] [PubMed]
  11. Wharton, J.A.; Barik, R.C.; Kear, G.; Wood, R.J.K.; Stokes, K.R.; Walsh, F.C. The corrosion of nickel-aluminum bronze in seawater. Corros. Sci. 2005, 47, 3336–3367. [Google Scholar] [CrossRef] [Scilit]
  12. Basumatary, H.; Wood, R.J.K. Synergistic effects of cavitation erosion and corrosion for nickel aluminium bronze with oxide film in 3.5% NaCl solution. Wear 2017, 376–377, 1286–1297. [Google Scholar] [CrossRef] [Scilit]
  13. Campbell, J. Entrainment defects. Mater. Sci. Technol. 2006, 22, 127–145. [Google Scholar] [CrossRef] [Scilit]
  14. Riedler, M.; Michelic, S.; Bernhard, C. Formation of shrinkage porosity during solidification of steel: Numerical simulation and experimental validation. IOP Conf. Ser. Mater. Sci. Eng. 2016, 143, 012035. [Google Scholar] [CrossRef] [Scilit]
  15. Kelley, A. Microporosity Formation Analysis of Low-Lead and Leaded Copper Alloys. Master’s Thesis, University of Alabama at Birmingham, Birmingham, Alabama, 2017. All ETDs from UAB. 2120. [Google Scholar]
  16. Majidi, H.S.; Beckermann, C. Effect of Pouring Conditions and Gating System Design on Air Entrainment During Mold Filling. Int. J. Met. 2019, 13, 255–272. [Google Scholar] [CrossRef] [Scilit]
  17. Teke, I.T.; Ertaş, A.H. Integrating prestress simulation and literature insights to assess mold design effects in sand-cast components. J. Intell. Manuf. Spec. Equip. 2025, 6, 248–272. [Google Scholar] [CrossRef] [Scilit]
  18. Liu, J.; Lei, H.; Gao, W.; Liu, H.; Wu, Z.; Pu, Q. Effect of Casting Residual Stress on Fatigue Life of Aluminum Alloy Sub-frame. J. Hunan Univ. Nat. Sci. 2018, 45, 28–34. [Google Scholar] [CrossRef]
  19. Hsu, C.Y.; Liang, C.C.; Shiah, S.W.; Jen, C.Y. A study of stress concentration effect around penetrations on curved shell and failure modes for deep-diving submersible vehicle. Ocean Eng. 2005, 32, 1098–1121. [Google Scholar] [CrossRef] [Scilit]
  20. Vernengo, G.; Gaggero, S.; Villa, D.; Mazzarello, G.; Gualeni, P. Free surface hydrodynamics of submarine masts configurations. Prog. Mar. Sci. Technol. 2022, 6, 271–278. [Google Scholar] [CrossRef] [Scilit]
  21. Jeyamohan, K.; Bandara, C.S.; Jayasinghe, J.A.S.C. Vortex Shedding-Induced Fatigue Analysis for High-Mast Lighting Towers. In 12th International Conference on Structural Engineering and Construction Management; Dissanayake, R., Mendis, P., Weerasekera, K., De Silva, S., Fernando, S., Konthesingha, C., Eds.; Springer: Singapore, 2022. [Google Scholar]
  22. Khan, M.K.; Nagarajan, V.; Sha, O.P. Steady and dynamic load measurements over a generic submarine hull form with various appendage configurations. Proc. Inst. Mech. Eng. Part M 2025, 239, 577–607. [Google Scholar] [CrossRef] [Scilit]
  23. Zhang, T.; Wang, B.; Wu, W.; Chu, Y. Numerical analysis of post-cyclic ultimate bearing capacity of helical anchors in clay. Ocean Eng. 2026, 352, 124583. [Google Scholar] [CrossRef] [Scilit]
  24. Wang, L.; Zhang, L.; Chen, H.; Zhang, T.; Yi, J.; Zhang, J.; Zhou, T.; Chen, L.; Xu, Y.; Tian, Y.; et al. Combined effects of anchor geometry and soil spatial variability on the probabilistic pullout capacity of helical anchors. Comput. Geotech. 2026, 200, 108482. [Google Scholar] [CrossRef] [Scilit]
  25. Bekele, B.T.; Bhaskaran, J.; Tolcha, S.D.; Gelaw, M. Simulation and experimental analysis of re-design the faulty position of the riser to minimize shrinkage porosity defect in sand cast sprocket gear. Mater. Today Proc. 2022, 59, 598–604. [Google Scholar] [CrossRef] [Scilit]
  26. Mohamad, M.; Amroune, S.; Miri, R.; Benchekkour, A.; Galoyan, K. Design Optimization Methodology of Submarine Using Multilevel Numerical CFD Models. FME Trans. 2025, 53, 280–288. [Google Scholar] [CrossRef] [Scilit]
  27. Niu, S. Ellipse phenomenon and oval phenomenon found in fault diagnoses of tower-mast structures and experimental verification. Structures 2023, 57, 105135. [Google Scholar] [CrossRef] [Scilit]
  28. Choi, W.S.; Chang, H.S.; Lee, Y.S.; Kim, S.I. A Study on Improvement of Submarine Attack Periscope Operation Performance using Installing Protector on Sail. J. Korea Acad.-Ind. Cooper. Soc. 2021, 22, 199–206. [Google Scholar] [CrossRef]
  29. Mashiri, F.R.; Zhao, X.L.; Grundy, P. Stress concentration factors and fatigue behaviour of welded thin-walled CHS–SHS T-joints under in-plane bending. Eng. Struct. 2004, 26, 1861–1875. [Google Scholar] [CrossRef] [Scilit]
  30. ASTM B505/B505M-18; Standard Specification for Copper-Alloy Sand Castings for General Applications (UNS C95800 Nickel-Aluminum Bronze). ASTM International: West Conshohocken, PA, USA, 2018.
  31. Campbell, J. Complete Casting Handbook: Metal Casting Processes, Techniques and Design, 2nd ed.; Butterworth-Heinemann: Oxford, UK, 2015; pp. 615–650. ISBN 9780444635099. [Google Scholar]
  32. Ravi, B. Metal Casting: Computer-Aided Design and Analysis; PHI Learning Pvt. Ltd.: New Delhi, India, 2010; pp. 1–120. ISBN 9788120327269. [Google Scholar]
  33. MatWeb Material Property Data. Nickel Aluminum Bronze; UNS C95800; MatWeb LLC: Blacksburg, VA, USA, 2024. [Google Scholar]
  34. Cadet, G.; Paredes, M. Convergence analysis and mesh optimization of finite element analysis related to helical springs. Mech. Ind. 2024, 25, 22. [Google Scholar] [CrossRef] [Scilit]
  35. Burcher, R.; Rydill, L. Concepts in Submarine Design; Cambridge University Press: Cambridge, UK, 1994; pp. 120–145. [Google Scholar] [CrossRef] [Scilit]
  36. Kotschi, R.M.; Loper, C.R., Jr. Design of t and x sections for castings. AFS Trans. 1974, 82, 535–542. [Google Scholar]
  37. Voller, V.R.; Prakash, C. A fixed grid numerical modelling methodology for convection-diffusion musky region phase change problems. Int. J. Heat Mass Transf. 1987, 30, 1709–1719. [Google Scholar] [CrossRef] [Scilit]
  38. Szeliga, D.; Kubiak, K.; Ziaja, W.; Cygan, R.; Suchy, J.S.; Burbelko, A.; Nowak, W.J.; Sieniawski, J. Investigation of casting–ceramic shell mold interface thermal resistance during solidification process of nickel based superalloy. Exp. Therm. Fluid Sci. 2017, 87, 149–160. [Google Scholar] [CrossRef] [Scilit]
  39. JIS Z 2241:2011; Japanese Industrial Standards of Metallic Materials Tensile Testing Method of Test at Room Temperature. Japanese Standards Association: Tokyo, Japan, 2011.
Figure 1. The 3D CAD model and detailed cross-sectional dimensions of the designed submarine mast cover, showing the elliptical main body, asymmetric wall thickness distribution (Sections B-B and C-C), lower mounting flange, and upper mast collar.
Metals 16 01044 g001
Figure 2. Schematics of the gating and risering system designed for sand casting of the mast cover: (a) overall 3D assembly including pouring cup, sprue, bottom runner, gates, and nine cylindrical risers; (b) transparent 3D layout showing the sand mold, internal sand core, and melt pouring position; (c) detailed top and sectional views of the square-ring runner and tapered rectangular gates.
Metals 16 01044 g002
Figure 3. Meshes generated for numerical simulations: (a) FEM mesh of the submarine mast cover; (b) FVM mesh of the gating and risering system with the mast cover.
Metals 16 01044 g003
Figure 4. Structural FEA results of the mast cover under a 600 m submergence depth (7.0 MPa hydrostatic pressure): (a) von Mises equivalent stress distribution; (b) total deformation contour.
Metals 16 01044 g004
Figure 5. Equivalent stress profiles along designated paths under 7.0 MPa hydrostatic pressure: (a) stress distribution across the wall thickness along the major axis (from outer Point 1 to inner Point 2); (b) stress distribution along the inner surface perimeter.
Metals 16 01044 g005
Figure 6. Comparison of von Mises stress distributions on the inner surface of the stepped region: (a) initial design with a sharp step exhibiting a peak stress of 216.0 MPa; (b) modified design with an optimized fillet radius showing reduced stress below 194.0 MPa.
Metals 16 01044 g006
Figure 7. Material trace analysis illustrating molten metal flow mixing and domain synthesis at various filling stages (10%, 14%, 26%, and 98%).
Metals 16 01044 g007
Figure 8. Hydrodynamic filling behavior at each individual gate (G1–G8) during mold filling: (a) flow velocity profiles over time; (b) mass flow rate profiles over time.
Metals 16 01044 g008
Figure 9. Thermal behavior during cavity filling and post-filling states: (a) temperature progression during mold filling (10%, 26%, 50%, and 98%); (b) temperature distribution inside the casting cavity immediately upon filling completion.
Metals 16 01044 g009
Figure 10. Solidification sequence represented by fraction solid contours at various stages (80%, 20%, 10%, and 4% liquid remaining).
Metals 16 01044 g010
Figure 11. Predicted shrinkage porosity distribution across internal cross-sections (Section C-C and Section B-B), highlighting localized porosity at the top mast collar machining allowance.
Metals 16 01044 g011
Figure 12. (a) The fabricated full-scale NAB submarine mast cover prototype following experimental sand casting and final machining operations; (b) optical micrographs of the heavy-section region showing micro-porosity corresponding to the predicted final solidification and porosity zones in Figure 10 and Figure 11.
Metals 16 01044 g012
Figure 13. Engineering stress–strain curve obtained from tensile testing of specimens harvested from the full-scale NAB mast cover prototype.
Metals 16 01044 g013
Table 1. Simulation parameters and boundary conditions for the finite element analysis of the mast cover.
Mechanical PropertyDensityYoung’s modulusPoisson’s ratioYield strength
7.58 g/cm3115 GPa0.328390 MPa
MeshNumber of meshesNumber of nodes
152,964249,091
Boundary conditionLoadSupport
Static pressure 7.0 MPaFixed support at 26 bolt holes
Table 2. Comparison of thermophysical properties between CuAl10Ni (simulation DB) and standard NAB alloy.
PropertyCuAl10NiStandard NAB
Density7.60 g/cm37.64 g/cm3
Thermal conductivity (20 °C)36.5 W/m·K36.0 W/m·K
Thermal expansion coefficient (20~300 °C)16.2 μm/m·°C16.2 μm/m·°C
Specific heat capacity435 J/kg·K439 J/kg·K
Liquidus temperature1108 °C1060 °C
Solidus temperature1070 °C1040 °C
Table 3. Simulation parameters and boundary conditions for the casting simulation of the mast cover.
MaterialCastingMold
CuAl10NiFuran
Heat transfer coefficientCasting to moldMold and environment
8000 W/(m2·K)1000 W/(m2·K)
MeshNumber of metal cellsNumber of control volumes
484,5855,320,510
Boundary conditionInitial Pouring TemperatureInitial Mold Temperature
1300 °C20 °C
Filling methodInlet diameterFilling time
Gravity pouring100 mm22 s
Table 4. Chemical composition (wt.%) and phase transformation temperatures of the Ni–Al–bronze alloy.
AlNiFeMnSiPbCuLiquidus
Temperatures
Solidus
Temperatures
8.914.454.041.170.040.02Bal.1070 °C1010 °C
Table 5. Mechanical properties of the mast cover fabricated by sand casting with Ni–Al–bronze alloy.
Yield StrengthUltimate Tensile StrengthElongationHardness
392.5 ± 10 MPa757.8 ± 12 MPa17.9 ± 3%197 ± 17 HB
Disclaimer/Publisher’s Note: The statements, opinions and data contained in all publications are solely those of the individual author(s) and contributor(s) and not of MDPI and/or the editor(s). MDPI and/or the editor(s) disclaim responsibility for any injury to people or property resulting from any ideas, methods, instructions or products referred to in the content.