Article

The Evolution of Intergranular Second-Phase Precipitation and Matrix Microstructure of SLM-Formed Fe-Mn-Al-C Lightweight Steel Under Different Solution Treatments

1
College of Intelligent Robotics and Advanced Manufacturing, Fudan University, Shanghai 200433, China
2
Chengdu Holy Aviation Science & Technology Co., Ltd., Chengdu 611900, China
3
School of Advanced Materials, Chengdu Aeronautic Polytechnic University, Chengdu 610100, China
*
Author to whom correspondence should be addressed.
Metals 2026, 16(7), 801; https://doi.org/10.3390/met16070801
Submission received: 26 June 2026 / Revised: 11 July 2026 / Accepted: 14 July 2026 / Published: 17 July 2026
(This article belongs to the Special Issue Laser Additive Manufacturing of Metallic Alloys)

Abstract

Fe-Mn-Al-C lightweight high-strength steels are promising for aerospace and defense applications, but selective laser melting (SLM) introduces steep thermal gradients and rapid solidification, causing directional grain growth, crystallographic texture, and the non-uniform precipitation of κ-carbides and B2 phase at grain boundaries. This results in pronounced mechanical anisotropy between XY and YZ planes, limiting engineering use. To eliminate this anisotropy, we investigate the post-SLM solution treatment of an SLM-fabricated Fe-Mn-Al-C steel at 1050–1150 °C for 0.5–1.5 h followed by oil quenching, and characterize microstructures and tensile properties on both planes. At 1050 °C, the XY plane remained equiaxed γ-austenite, while the YZ plane transformed to α and became equiaxed over time, causing strength–ductility anisotropy. At 1100 °C for 1 h, anisotropy was effectively removed: XY and YZ planes exhibited tensile strengths of ~1159 and 1154 MPa and elongations of ~40% and 41%. TEM revealed that uniform fine κ-carbides and coarsened B2 at grain boundaries suppressed direction-dependent strain. At 1150 °C, dissolved boundary phases and diffuse intragranular κ-carbides severely reduced ductility. The optimal treatment is 1100 °C for 1 h, yielding a homogeneous microstructure and excellent isotropic properties.

1. Introduction

With the rapid development of the aerospace and weapon equipment fields, material lightweighting has become one of the core technologies for enhancing the overall performance of systems. Traditional lightweight metals such as titanium alloys and aluminum alloys have shown mechanical performance degradation and insufficient impact toughness in extreme service environments, which has restricted their further application in high-end equipment [1,2,3,4,5,6]. In recent years, Fe-Mn-Al-C series lightweight high-strength steels have attracted extensive attention due to their low density (ρ = 6.2~7.7 g/cm3) and good mechanical properties. However, these steels often encounter metallurgical-forming difficulties and macroscopic element segregation during conventional manufacturing processes, hindering their practical application. Selective laser melting (SLM) technology, with its advantages of high precision and high flexibility in additive manufacturing, provides an effective solution to overcome these problems, significantly improving the formability and comprehensive performance of Fe-Mn-Al-C lightweight steels [7,8,9,10,11].
SLM enables near-net-shape fabrication through the layer-wise fusion of metal powders using high-energy laser beams. This process involves extreme temperature gradients and ultra-fast cooling rates, promoting directional solidification within the melt pool. As a result, grains undergo epitaxial growth along the thermal gradient direction, leading to the development of pronounced crystallographic texture and a dominant columnar grain morphology. Such directional solidification behavior induces elemental microsegregation, non-uniform precipitation of secondary phases at grain boundaries, and the inherited distribution of high dislocation densities and low-angle grain boundaries. These microstructural features collectively give rise to significant mechanical anisotropy between different sample orientations particularly between the XY plane and YZ plane. Notably, discrepancies in strength, ductility, and fracture mechanisms are observed between the longitudinal (Z) and transverse (XY) directions, which critically undermine structural reliability and limit the engineering applicability of SLM-fabricated components under load-bearing conditions [12].
To eliminate this anisotropy, it is necessary to regulate the SLM-formed microstructure through subsequent heat-treatment. Among various heat treatment methods, solution treatment exhibits unique advantages [13]: it promotes element diffusion and dissolves non-equilibrium precipitates through high-temperature holding, inducing recrystallization and grain growth, thereby achieving microstructure homogenization and texture weakening. Especially for Fe-Mn-Al-C lightweight steel, its phase transformation behavior and second-phase precipitation are sensitive to temperature and time. The parameter design of the solution treatment process (such as temperature and holding time) directly affects the dissolution–reprecipitation behavior of κ-carbides and B2 phase, the ratio of austenite/ferrite, grain boundary characteristics and dislocation configuration, and thus determines the isotropy degree of the final material. Although previous studies have focused on the solution behavior of lightweight steel prepared by traditional processes, in-depth research on the microstructure evolution and anisotropy elimination mechanism of SLM-formed materials during solution treatment is still insufficient. Particularly, the differences in phase composition, grain morphology, texture, second-phase distribution, and defect recombination kinetics between the XY and YZ planes under different solution temperatures and times have not been systematically clarified.
Therefore, this paper takes the SLM-formed Fe-Mn-Al-C lightweight steel samples as the research object. By designing three solid solution temperature points of 1050 °C, 1100 °C and 1150 °C, combined with the holding times of 0.5 h, 1 h and 1.5 h, the influence of the solid solution process on the anisotropic evolution law of the microstructure is systematically studied. By comprehensively applying characterization methods such as XRD, EBSD and TEM, as well as mechanical property tests, the intrinsic connection between recrystallization, phase transformation, second-phase behavior and anisotropy elimination during the solution treatment process is revealed, providing theoretical basis and process guidance for achieving microstructure regulation and performance optimization of SLM-formed lightweight steel.

2. Materials and Methods

2.1. Experimental Materials and Parameter Setting

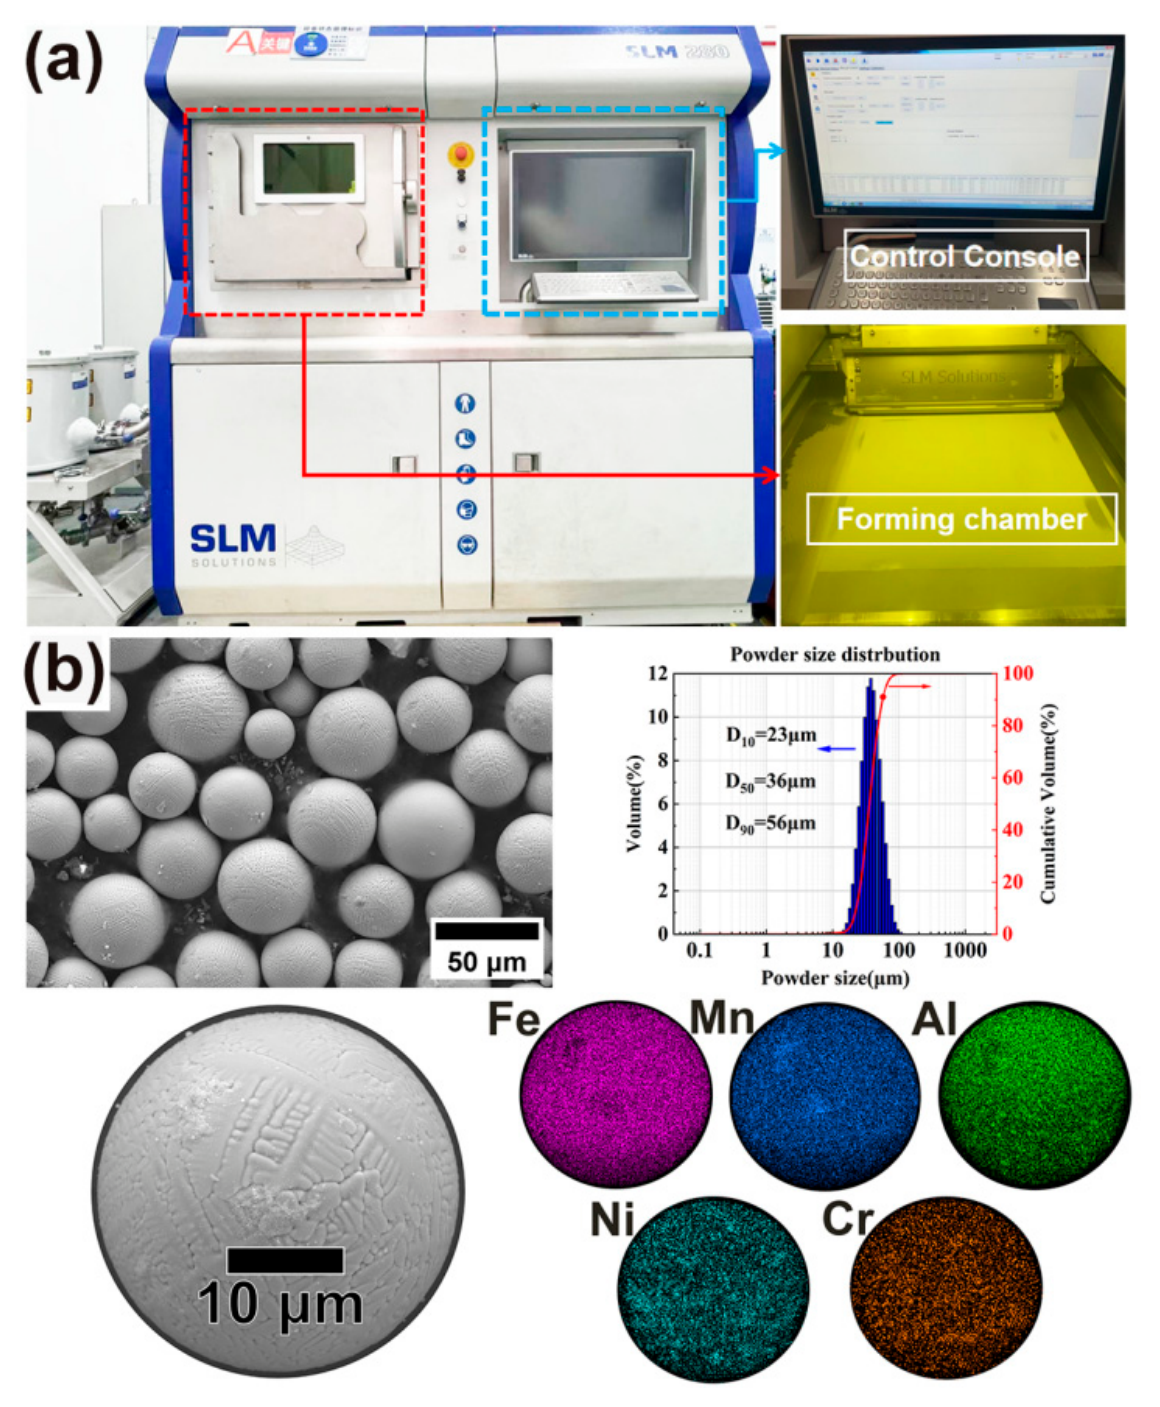
SLM was performed using an SLM-280 system (SLM Solutions, Lübeck, Germany), as illustrated in Figure 1a. Fe-Mn-Al-C lightweight steel samples were fabricated in both the XY and YZ build orientations using a laser power of 110 W and a scanning speed of 800 mm/s. The hatch spacing (h) and layer thickness (t) were set to 0.08 mm and 0.02 mm, respectively. Argon gas protection was used throughout the SLM process, along with a cross-scanning strategy. The scanning stripe width was 50 mm, with an overlap of 0.12 mm between adjacent stripes. Additionally, each successive layer was rotated by 67° to alter the scanning direction. The porosity of all printed specimens was below 0.5%.
The Fe-Mn-Al-C powder, with a particle size range of 15 to 53 μm, was obtained through the plasma rotating electrode process (PREP), and supplied by the Advanced Corporation for Materials and Equipments Co. (Changsha, China). The primary components of the powder were analyzed using energy-dispersive spectrometry (EDS), as presented in Table 1. The particle morphologies and size distributions are shown in Figure 1b. Prior to SLM fabrication, the powder was dried for 8 h in a vacuum desiccator at 75 °C.

2.2. Thermodynamic Calculation and Solution Treatment System

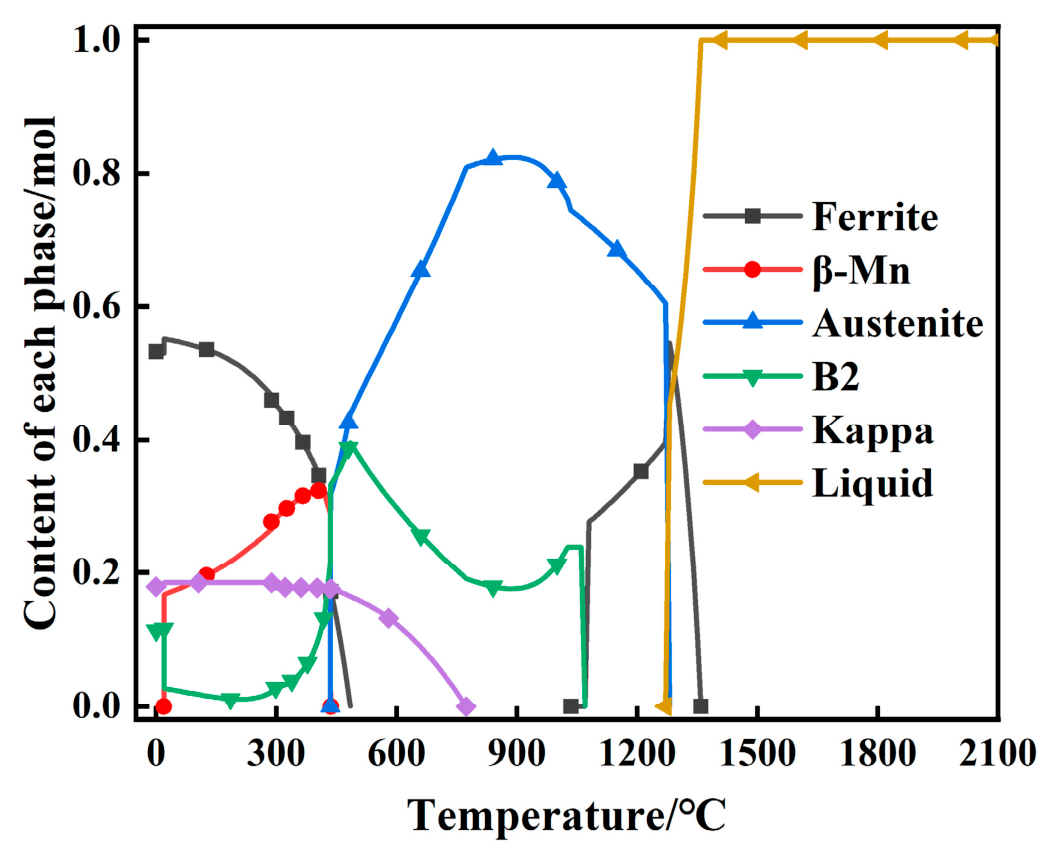
In response to the heat-treatment design requirements for SLM-formed Fe–Mn–Al–C lightweight steel, thermodynamic calculations were performed using the Thermo-Calc 2023b software with the TCFE12 steel database, based on the CALPHAD method [14]. A 1 mol alloy system was set as the calculation basis, with the reference state temperature at 1000 °C (γ-austenite stable region) and the pressure at 100 Pa (covering vacuum heat-treatment conditions). The atomic percentages of the elemental composition (accuracy ±0.01 at.%) were input, and a global thermodynamic equilibrium calculation was carried out over the temperature range of 0–2100 °C with a step size of 5 °C. Figure 2 shows the equilibrium phase diagram of the Fe-Mn-Al-C lightweight steel simulated by Thermo-Calc, reflecting the existence state of each phase and the dissolution–precipitation behavior of the precipitates. The key calculation outputs include the following: the thermodynamically stable precipitation temperature range of κ-carbides is 422–773 °C; the B2-ordered phase begins to precipitate at 502 °C and dissolves at 1070 °C, together defining its metastable existence window; and the austenite (γ)-to-ferrite (α) transformation spans 1100~1280 °C. These thermodynamic boundaries provide the core basis for the heat-treatment process design of SLM-formed Fe-Mn-Al-C steel.
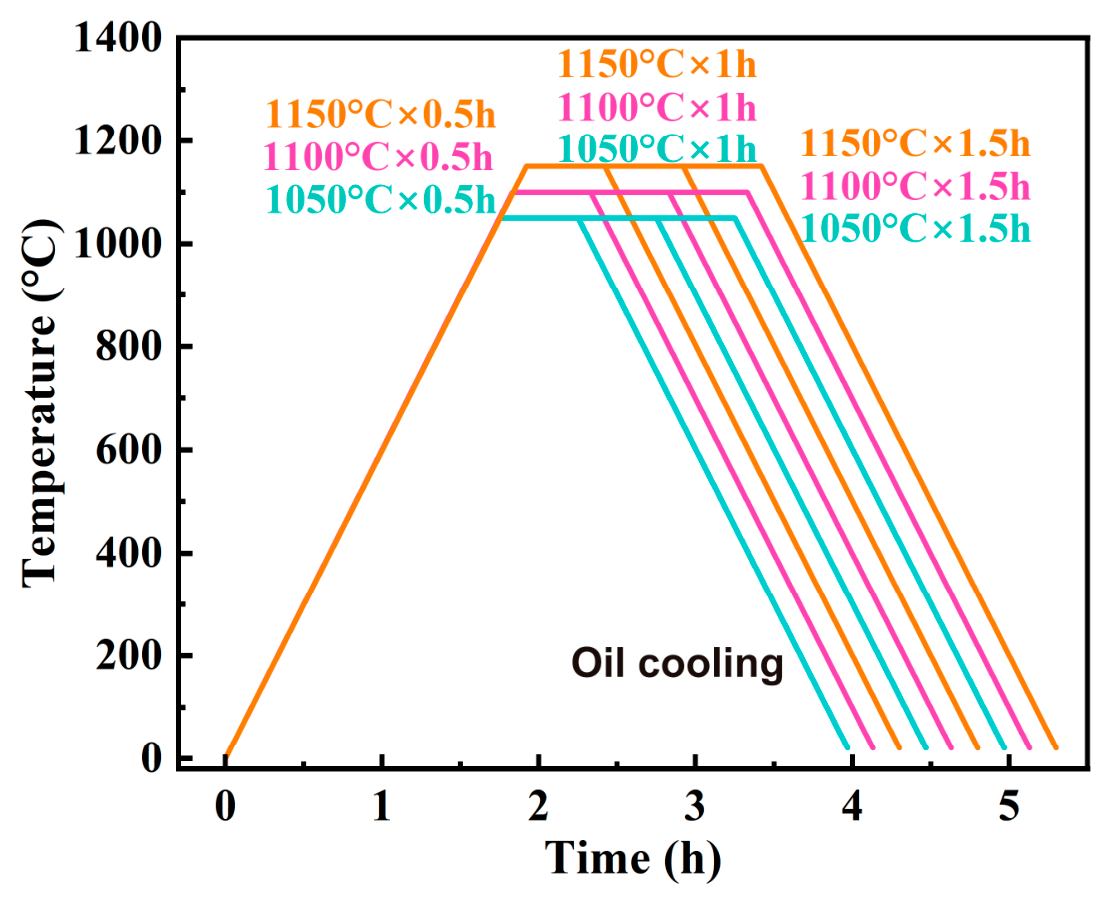
The solution heat-treatment process of this study (1050 °C/1100 °C/1150 °C for 0.5 h/1 h/1.5 h, oil quenched, as shown in Figure 3) focuses on eliminating the anisotropy caused by the rapid solidification of SLM and regulating the mechanical properties of the samples, providing flexibility for engineering applications. The solution heat-treatment at 1050 °C is slightly lower than the B2 phase dissolution point (1070 °C), aiming to explore the influence of κ-carbides at the grain boundaries and undissolved residual B2 phases on the mechanical properties and anisotropy, as well as the changes in the microstructure within the grains. At 1100 °C and 1150 °C, the study investigates whether the second-phase precipitation behavior at the grain boundaries and the changes in the microstructure within the grains significantly improve the anisotropy and mechanical properties as the solution heat-treatment temperature increases. This heat-treatment process also explores the effects of holding time on the grain size, dislocation density, high-angle and low-angle grain boundaries, and texture of the samples through varying the holding time, ultimately determining the optimal solution heat treatment process to regulate the microstructure and achieve the best mechanical properties and anisotropy elimination.

2.3. Microstructural Characterization

Phase analysis was performed using a Bruker D8 Advance X-ray diffractometer (Bruker AXS GmbH, Karlsruhe, Germany) equipped with a copper Kα radiation source (λ = 0.15418 nm). The diffraction patterns were collected over a 2θ range of 10° to 100° at a scan rate of 2° per minute. Microstructural characterization was carried out via electron backscatter diffraction (EBSD) coupled with a field-emission scanning electron microscope (Zeiss Gemini 300 Carl Zeiss Microscopy GmbH, Oberkochen, Germany). EBSD measurements were conducted under an accelerating voltage of 20 kV, employing a step size between 0.2 and 1 μm. The acquired EBSD data were analyzed using AZtecCrystal 2.1 software, and grain boundaries were classified according to misorientation angles: high-angle grain boundaries (HAGBs) for angles greater than 15°, and low-angle grain boundaries (LAGBs) for angles between 2° and 15°. Sample preparation for EBSD involved electropolishing in a solution of 10 vol% perchloric acid in alcohol at 20 V. Furthermore, transmission electron microscopy (TEM) was conducted on a Thermo Fisher Talos F200X microscope (Thermo Fisher Scientific, Eindhoven, The Netherlands) to investigate the microstructure and nanoscale precipitates in samples treated with varying laser powers. TEM samples were prepared by twin-jet electropolishing using the same electrolyte (10 vol% perchloric acid in alcohol) at 24 V and a temperature of −30 °C.

2.4. Mechanical Testing

The tensile behavior of each lightweight sample fabricated by selective laser melting (SLM) was assessed at room temperature using a Suns universal testing machine (Shenzhen SUNS Technology Stock Co., Ltd., Shenzhen, China). Cylindrical dog-bone specimens with a gauge length of 25 mm and a diameter of 5 mm were employed for the tests. A consistent loading rate of 1 mm/min was applied, and deformation was accurately measured using an Epsilon 3542 electronic extensometer (Epsilon Technology Corp., Jackson, WY, USA) to ensure precise strain data acquisition.

3. Results

3.1. Microstructure

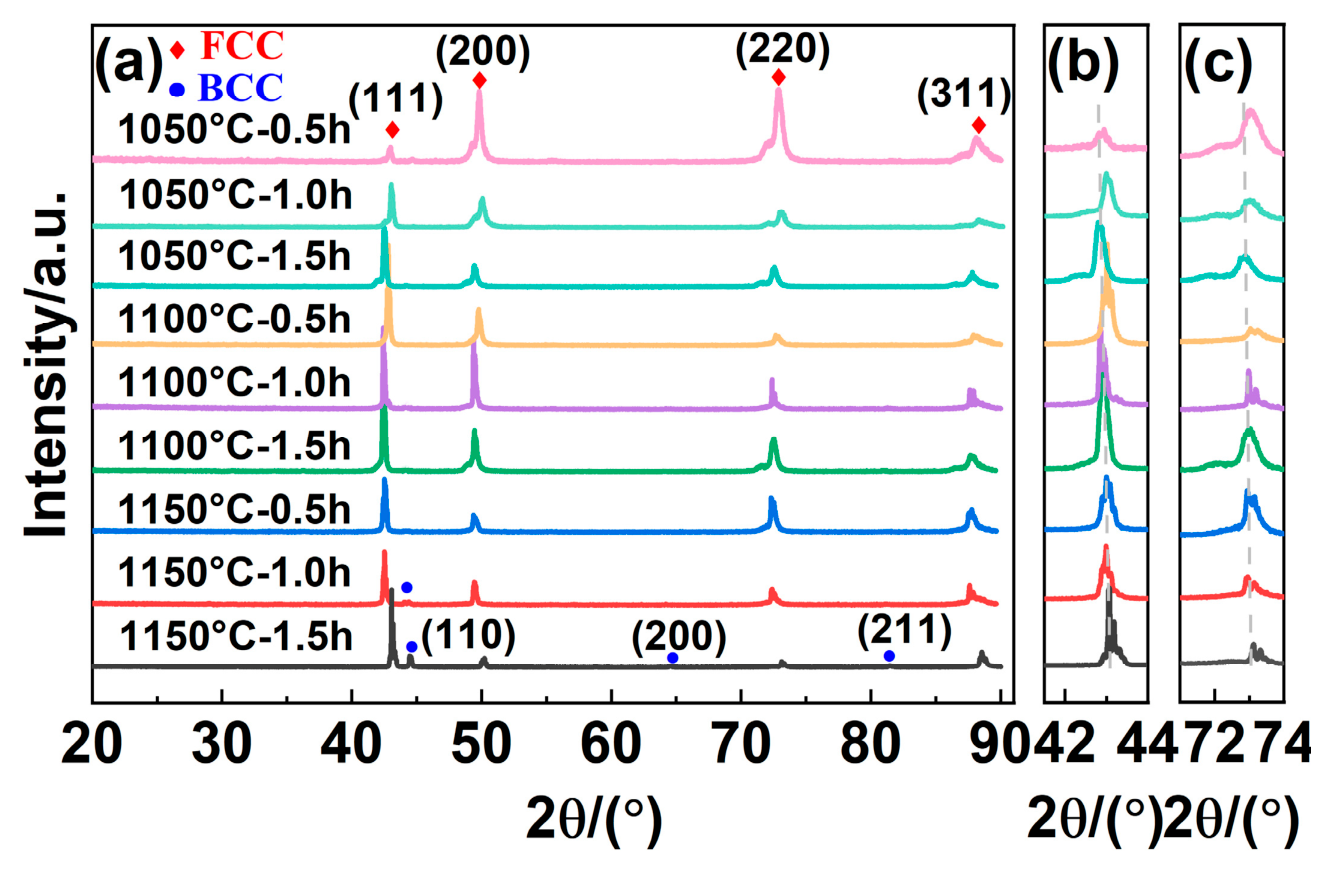
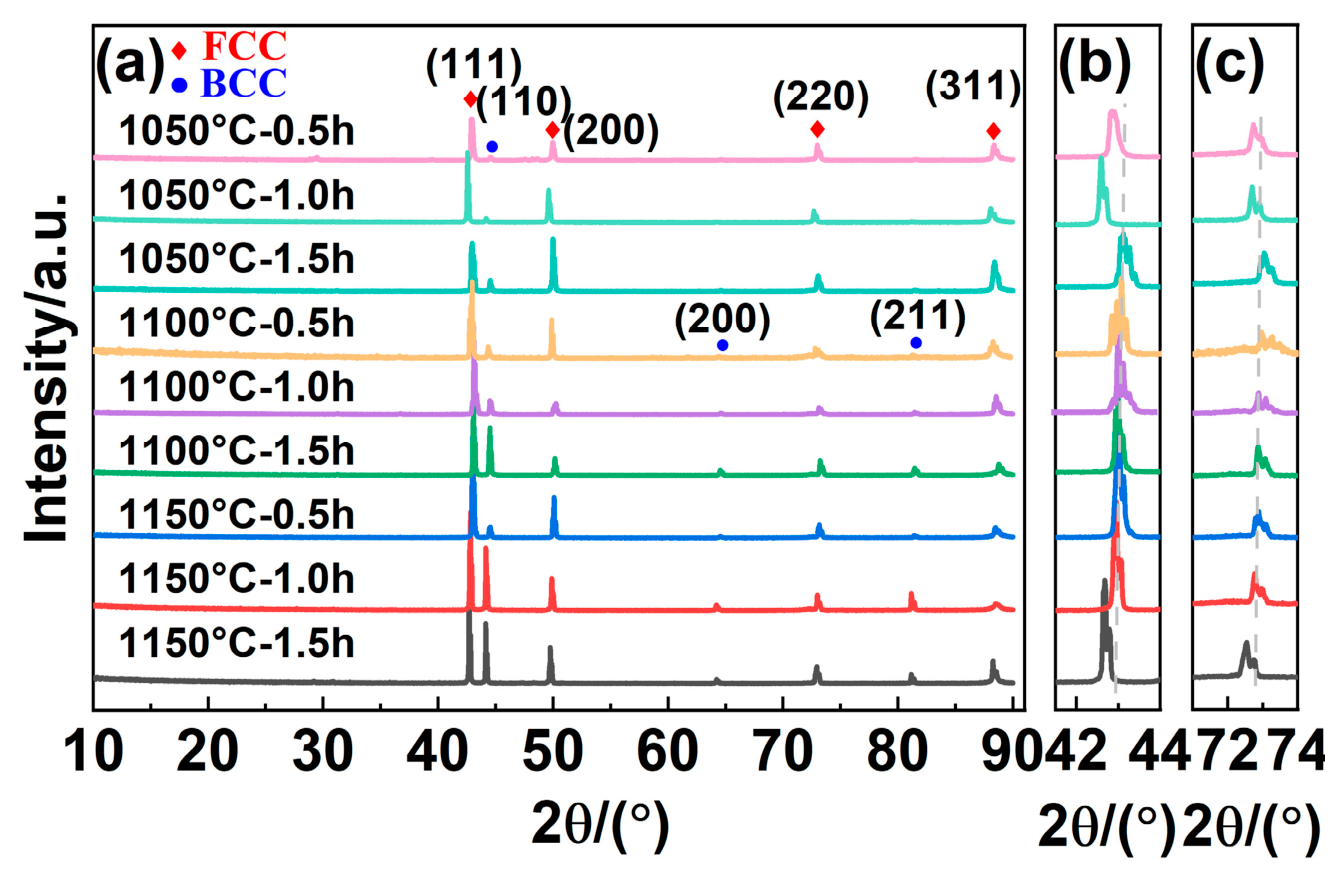
Figure 4 and Figure 5 show the XRD patterns of the XY and YZ planes of the SLM-formed Fe-Mn-Al-C lightweight steel samples under different solution treatment temperatures and holding times. The analysis results indicate that when the solution treatment temperature is 1050 °C, the XY plane of the samples held for 0.5 h to 1.5 h is composed of FCC face-centered cubic γ-austenite, and the diffraction peak intensities of the (111) and (220) crystal planes increase continuously with the increase in holding time. Moreover, the diffraction peak positions shift at 0.5 h and 1 h holding times, but do not shift at 1.5 h. The YZ plane is composed of FCC face-centered cubic γ-austenite and BCC body-centered cubic α-ferrite. Similarly, the diffraction peak positions shift at 0.5 h and 1 h holding times, but do not shift at 1.5 h. The reason for the diffraction peak positions shifting at 0.5 h and 1 h and returning to their original positions at 1.5 h is that there are local textures in the samples held for 0.5 h and 1 h, and the cooperative stress accumulation of the preferentially oriented grain clusters induces the directional shift in the lattice parameters. However, at 1.5 h, the grains have no preferred orientation, and the inter-grain stresses cancel each other out, causing the lattice constants to return to the equilibrium state and the diffraction peaks to reset.
When the solution temperature is 1100 °C, the XY plane of the samples held for 0.5 h to 1.5 h is still composed of FCC face-centered cubic γ-austenite. The diffraction peak intensities of the (111) and (220) crystal planes do not change significantly and do not shift, indicating that the grains on the XY plane of the samples do not have preferred orientation under this holding temperature. The YZ plane is the same as that of the sample held at 1050 °C, composed of FCC γ-austenite and BCC body-centered cubic α-ferrite. However, the diffraction peak intensity of α-ferrite is significantly higher than that of the sample held at 1050 °C, and the diffraction peak intensity of the (110) crystal plane of α-ferrite continuously increases with the increase in holding time, indicating that the content of α-ferrite is continuously increasing. The diffraction peaks on the YZ plane do not shift either, indicating that the grains do not have preferred orientation. When the solution temperature is 1150 °C, the XY plane of the sample held for 0.5 h is composed of only FCC γ-austenite, and the diffraction peaks of the (111) and (220) crystal planes do not shift. However, when the holding time is extended to 1 h and 1.5 h, the XY plane is composed of FCC γ-austenite and BCC α-ferrite. The diffraction peaks do not shift when held for 1 h, but shift when held for 1.5 h. The YZ plane is still composed of FCC γ-austenite and BCC α-ferrite, but it is obvious that the diffraction peak intensity of the (110) crystal plane of α-ferrite is further increased compared to 1100 °C. Similarly to the XY plane, the diffraction peaks of the (111) and (220) crystal planes do not shift when held for 0.5 h and 1 h, but shift when held for 1.5 h. The above diffraction peak phenomena indicate that when there is no preferred orientation on both sides for 0.5 h and 1 h, the lattice strain is uniform, resulting in no peak shift. At 1.5 h, the XY plane shows a weak preferred orientation of austenite due to the island-like formation of a small amount of ferrite. While on the YZ plane, the strong texture and the preferred arrangement of ferrite jointly trigger the lattice cooperative strain, causing the diffraction peaks to shift.
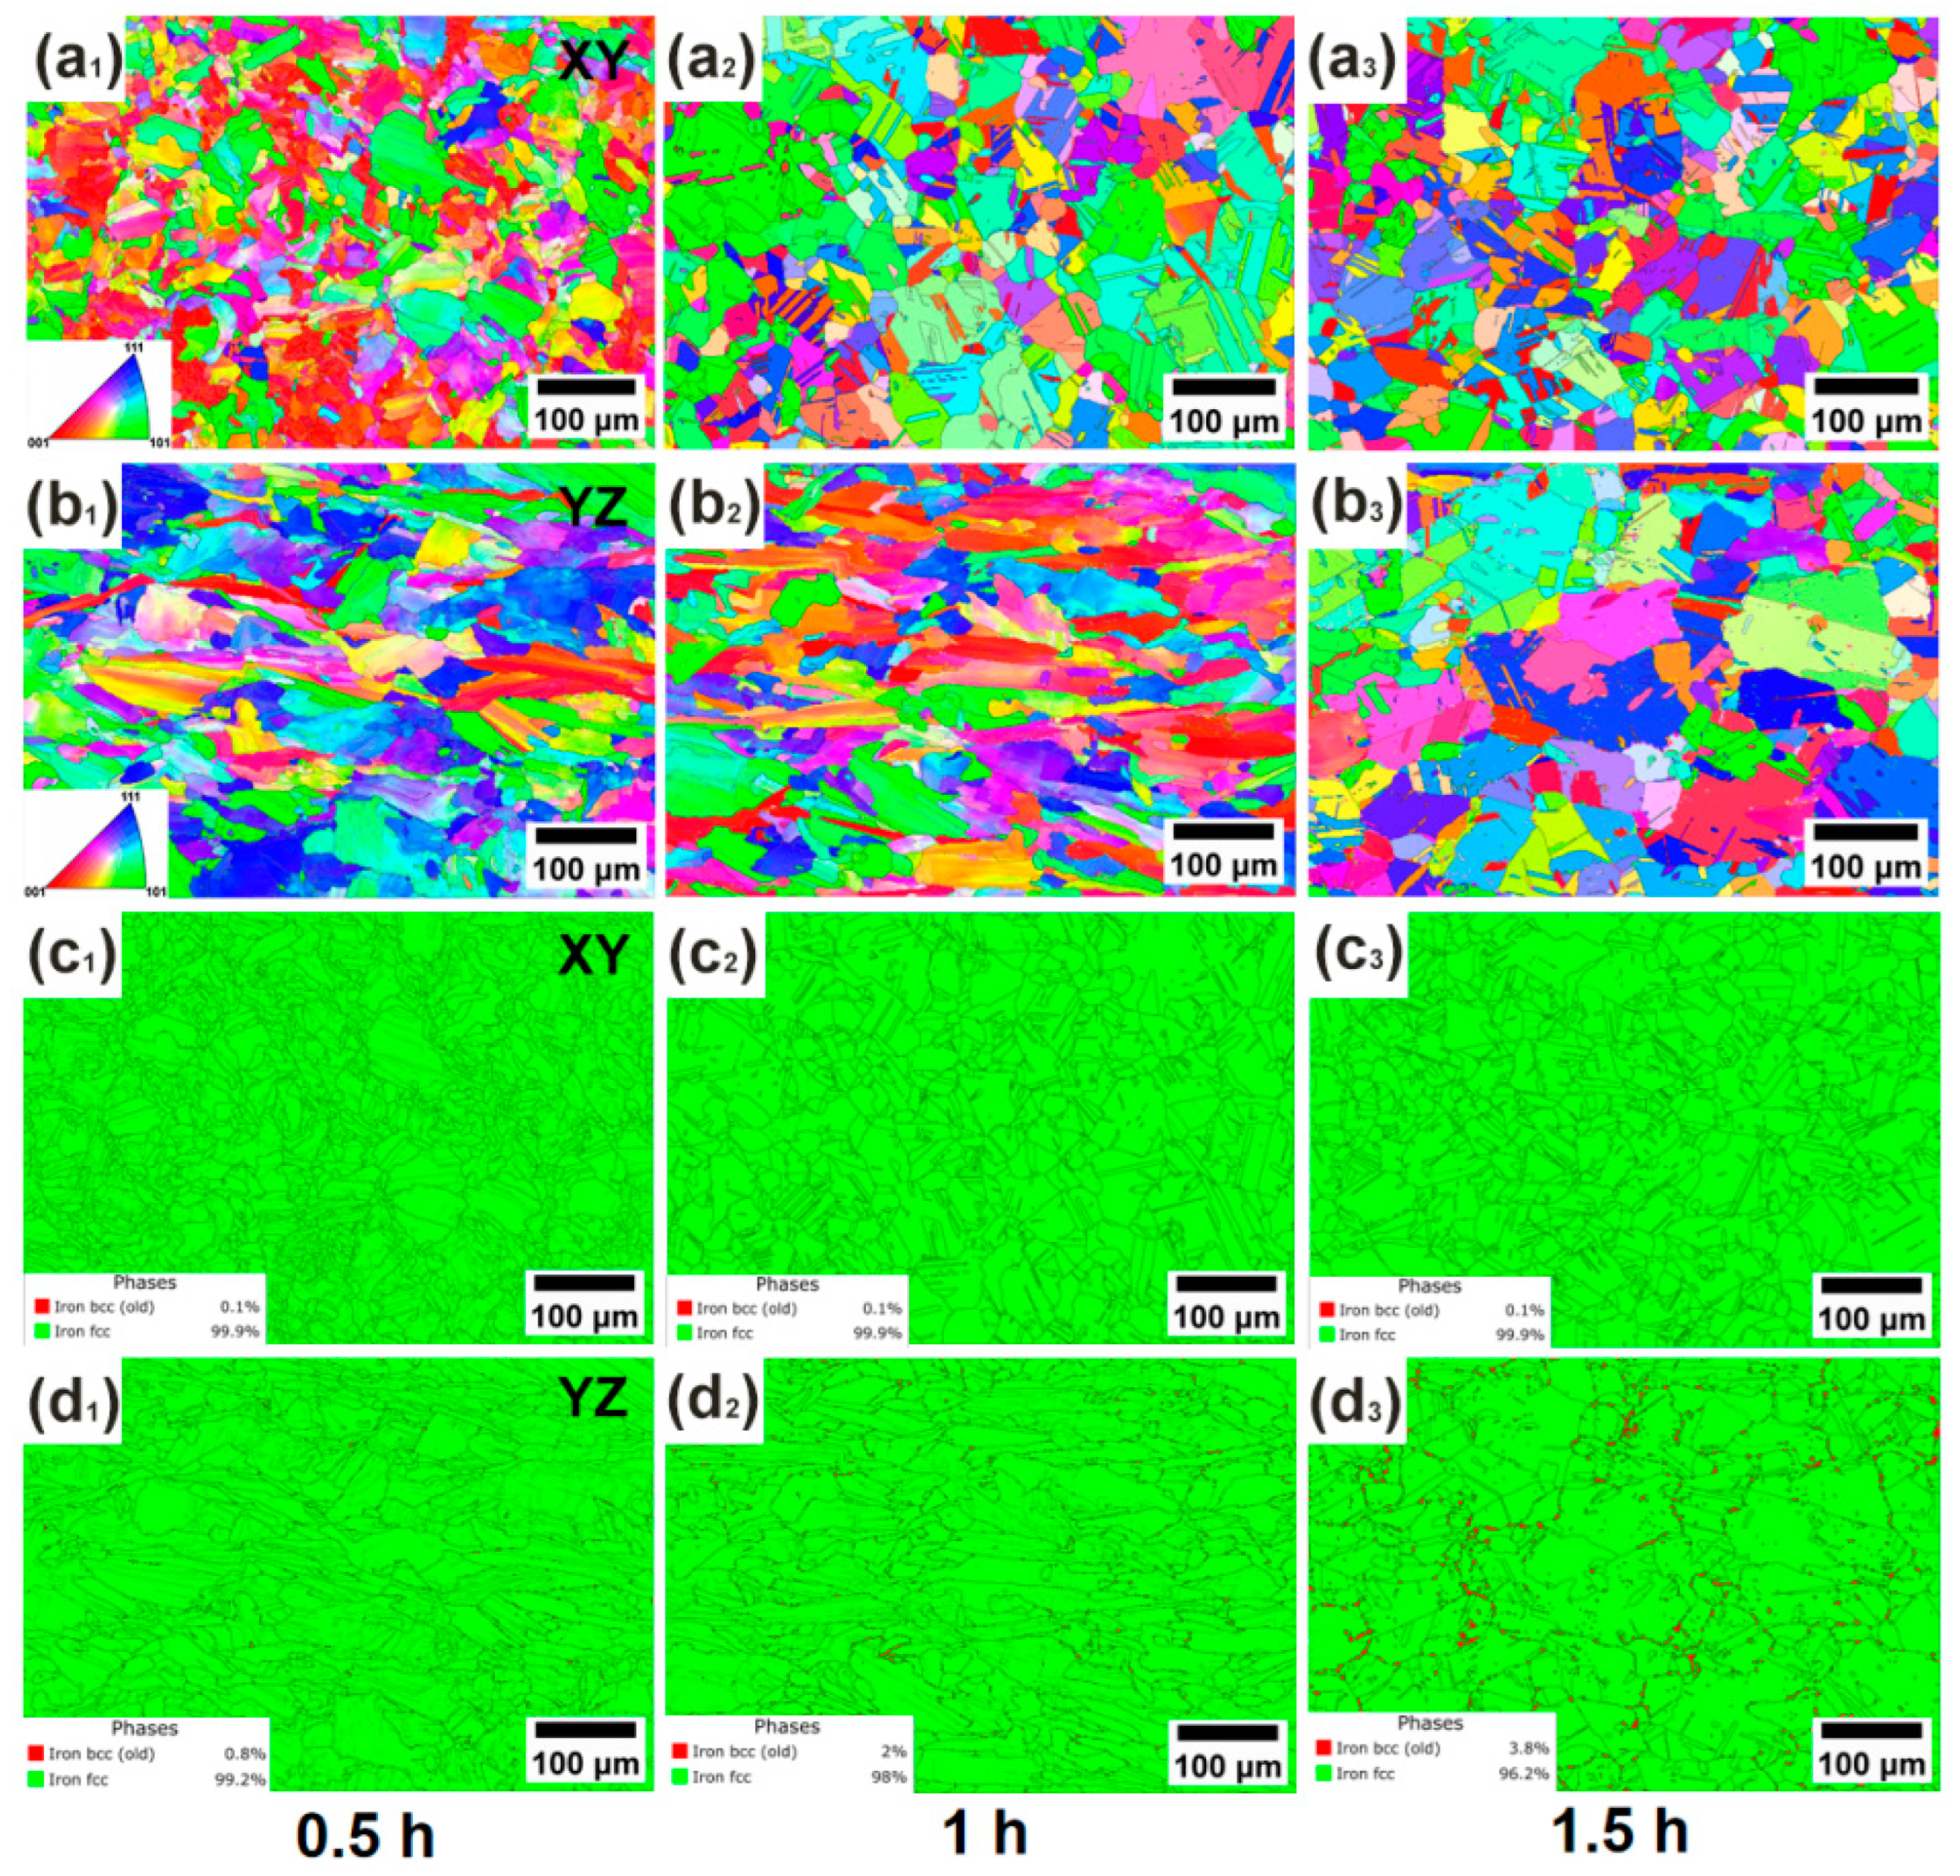
Figure 6 shows the IPF maps and phase composition maps of the XY and YZ planes of the samples after solution treatment at 1050 °C for different holding times. It can be seen from the figure that the microstructure of the SLM-formed lightweight steel after solution treatment at 1050 °C shows anisotropy and time dependence. Figure 6(a1–a3,c1–c3) shows that the XY plane presents equiaxed γ austenite grains after holding for 0.5 h, 1 h and 1.5 h, and the phase content is FCC and does not change. Figure 6(b1–b3,d1–d3) shows that the microstructure and phase composition of the YZ plane change with holding time: after holding for 0.5 h, the microstructure is composed of long columnar grains, with 99.2% FCC and 0.8% BCC; after holding for 1 h, the columnar grain morphology is maintained but the BCC content increases to 2% and the FCC content decreases to 98%; when the holding time is extended to 1.5 h, the columnar grains transform into equiaxed grains, with 96.2% FCC and 3.8% BCC. This phenomenon shows that the evolution of grain morphology and phase composition is strictly limited to the YZ plane, while the XY plane maintains an equiaxed γ single-phase state throughout.
The essence of maintaining 100% FCC in the XY plane of SLM-formed lightweight steel lies in its ultra-high cooling rate and uniform thermal flow history. The B2 phase is completely dissolved within 0.5 h, unable to provide the nucleation barrier for α-ferrite, ultimately achieving the stabilization of the γ-austenite single phase. The increasing BCC content in the YZ plane is driven by the coupling of solidification genetic segregation and diffusion shear: the cooling rate in the YZ plane is slower compared to the XY plane, leading to the formation of Mn/Ni enrichment bands at the columnar grain boundaries. These segregation bands not only hinder the dissolution of the B2 phase but also reduce the local stacking fault energy, triggering the γ→α transformation in the later stage of holding (>1 h). The newly formed α-ferrite and the remaining B2 phase together constitute the total BCC content, and their evolution is strictly controlled by the unique composition-defect gradient field in the YZ plane. When the solution treatment is held for 1.5 h, the transformation of columnar grains to equiaxed grains in the YZ plane is essentially the release of grain boundary migration degrees of freedom driven by thermal activation. The high dislocation density and small-angle grain boundary network inherited from solidification within the columnar grains are reorganized and reduced through the climb mechanism during continuous holding, and the small-angle grain boundaries gradually transform into large-angle grain boundaries. Meanwhile, the undissolved second-phase particles dissolve over time, reducing their pinning effect on the grain boundaries. Eventually, the grain boundaries migrate under the driving force of interfacial energy, achieving the reorganization of the columnar grain structure to equiaxed grains. This morphological transformation has a fundamental impact on anisotropy: the strong orientation texture characteristic of columnar grains is replaced by random crystal orientations, and the continuous second-phase films at the original columnar grain boundaries are broken, significantly weakening the direction-dependent mechanical response of the material [15]. The formation of equiaxed grains marks the essential transition of anisotropy from geometric scale to near-uniformity, laying the foundation for the engineering application of additively manufactured components.
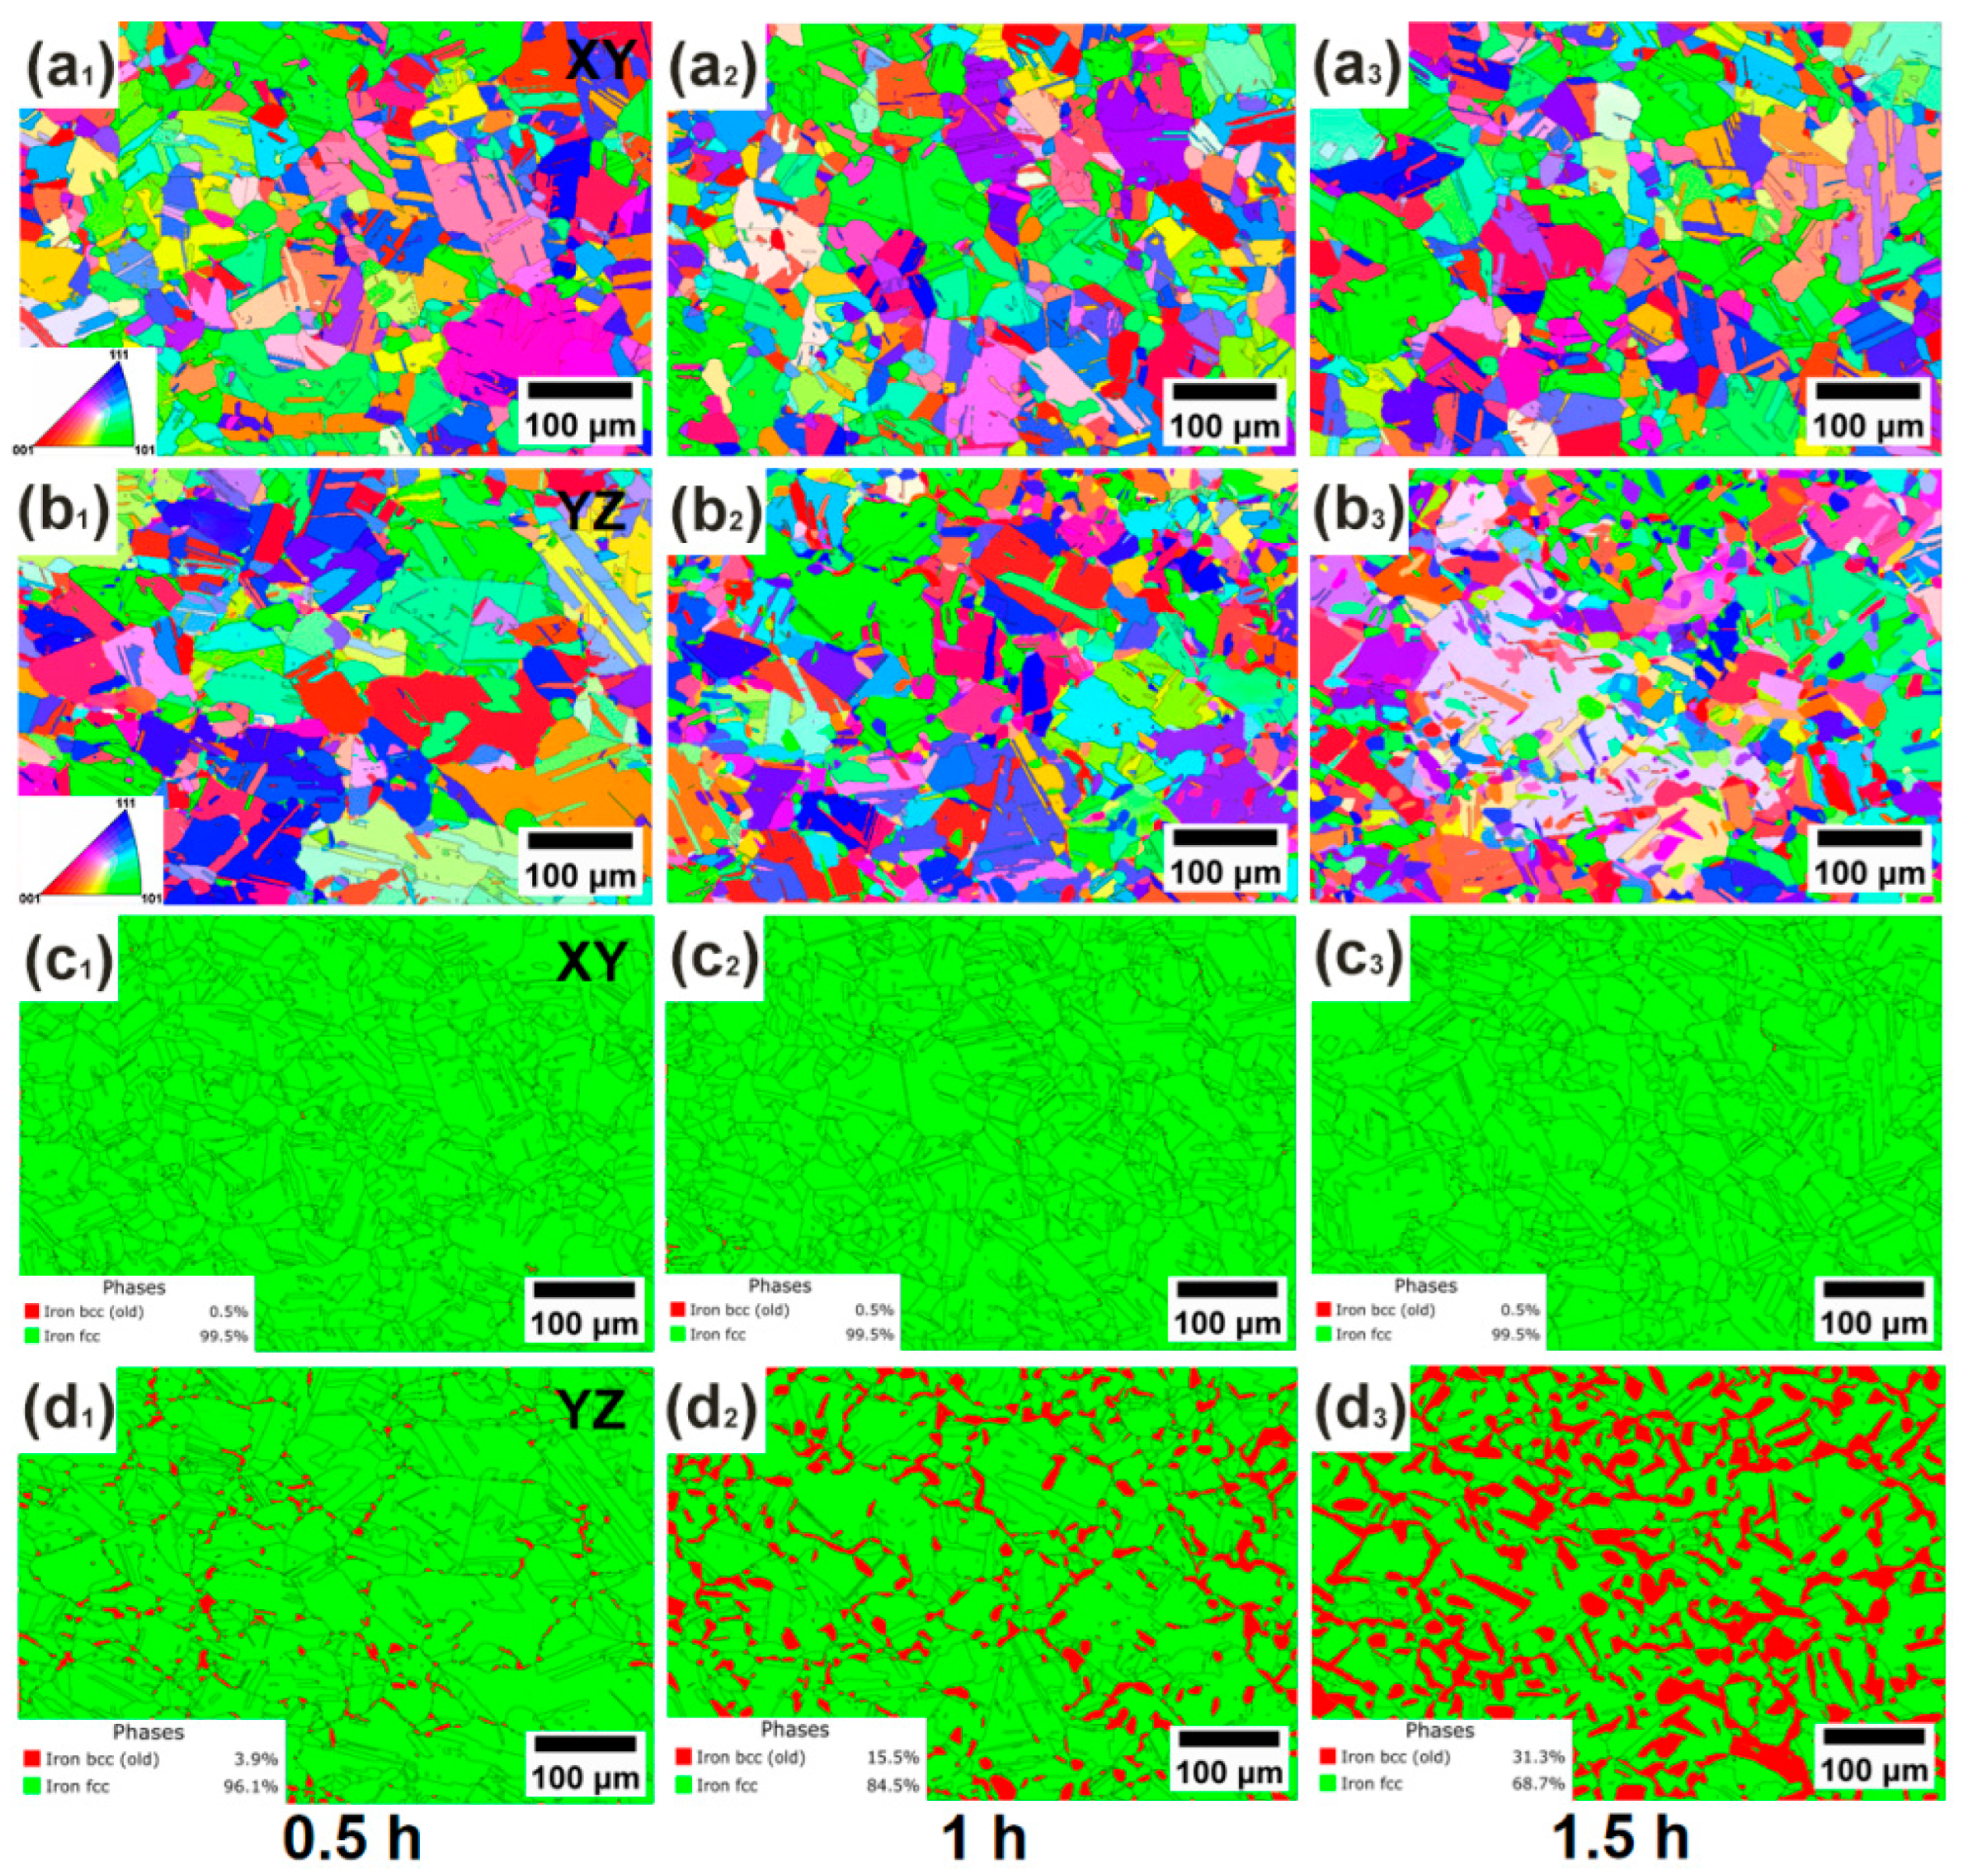
The experimental results above reveal that when the lightweight steel formed by SLM is solution-treated at 1100 °C (Figure 7), it enters the sensitive temperature range for the α-BCC ferrite transformation. However, the XY plane, which has a uniform composition fine-grained structure due to ultra-high cooling rate solidification, remains in the γ-FCC metastable state, maintains 99.5% FCC phase and resists ferrite formation within 0.5 to 1.5 h. In contrast, the YZ plane, affected by slow cooling, experiences continuous reverse transformation in the Al-rich regions between intragranular dendrites due to a significant decrease in the actual phase transformation temperature. At 0.5 h, 3.9% BCC ferrite nucleates in the Al-rich microdomains; at 1 h, Al diffusion drives the phase boundary migration, increasing the BCC content to 15.5%; by 1.5 h, the Al-rich regions are depleted, completing the ferrite transformation (31.3%). This indicates that the thermal history differentiation at 1100 °C, through the preset concentration gradient (uniform state in XY vs. steep segregation in YZ), decisively regulates the ferrite phase transformation kinetics path.
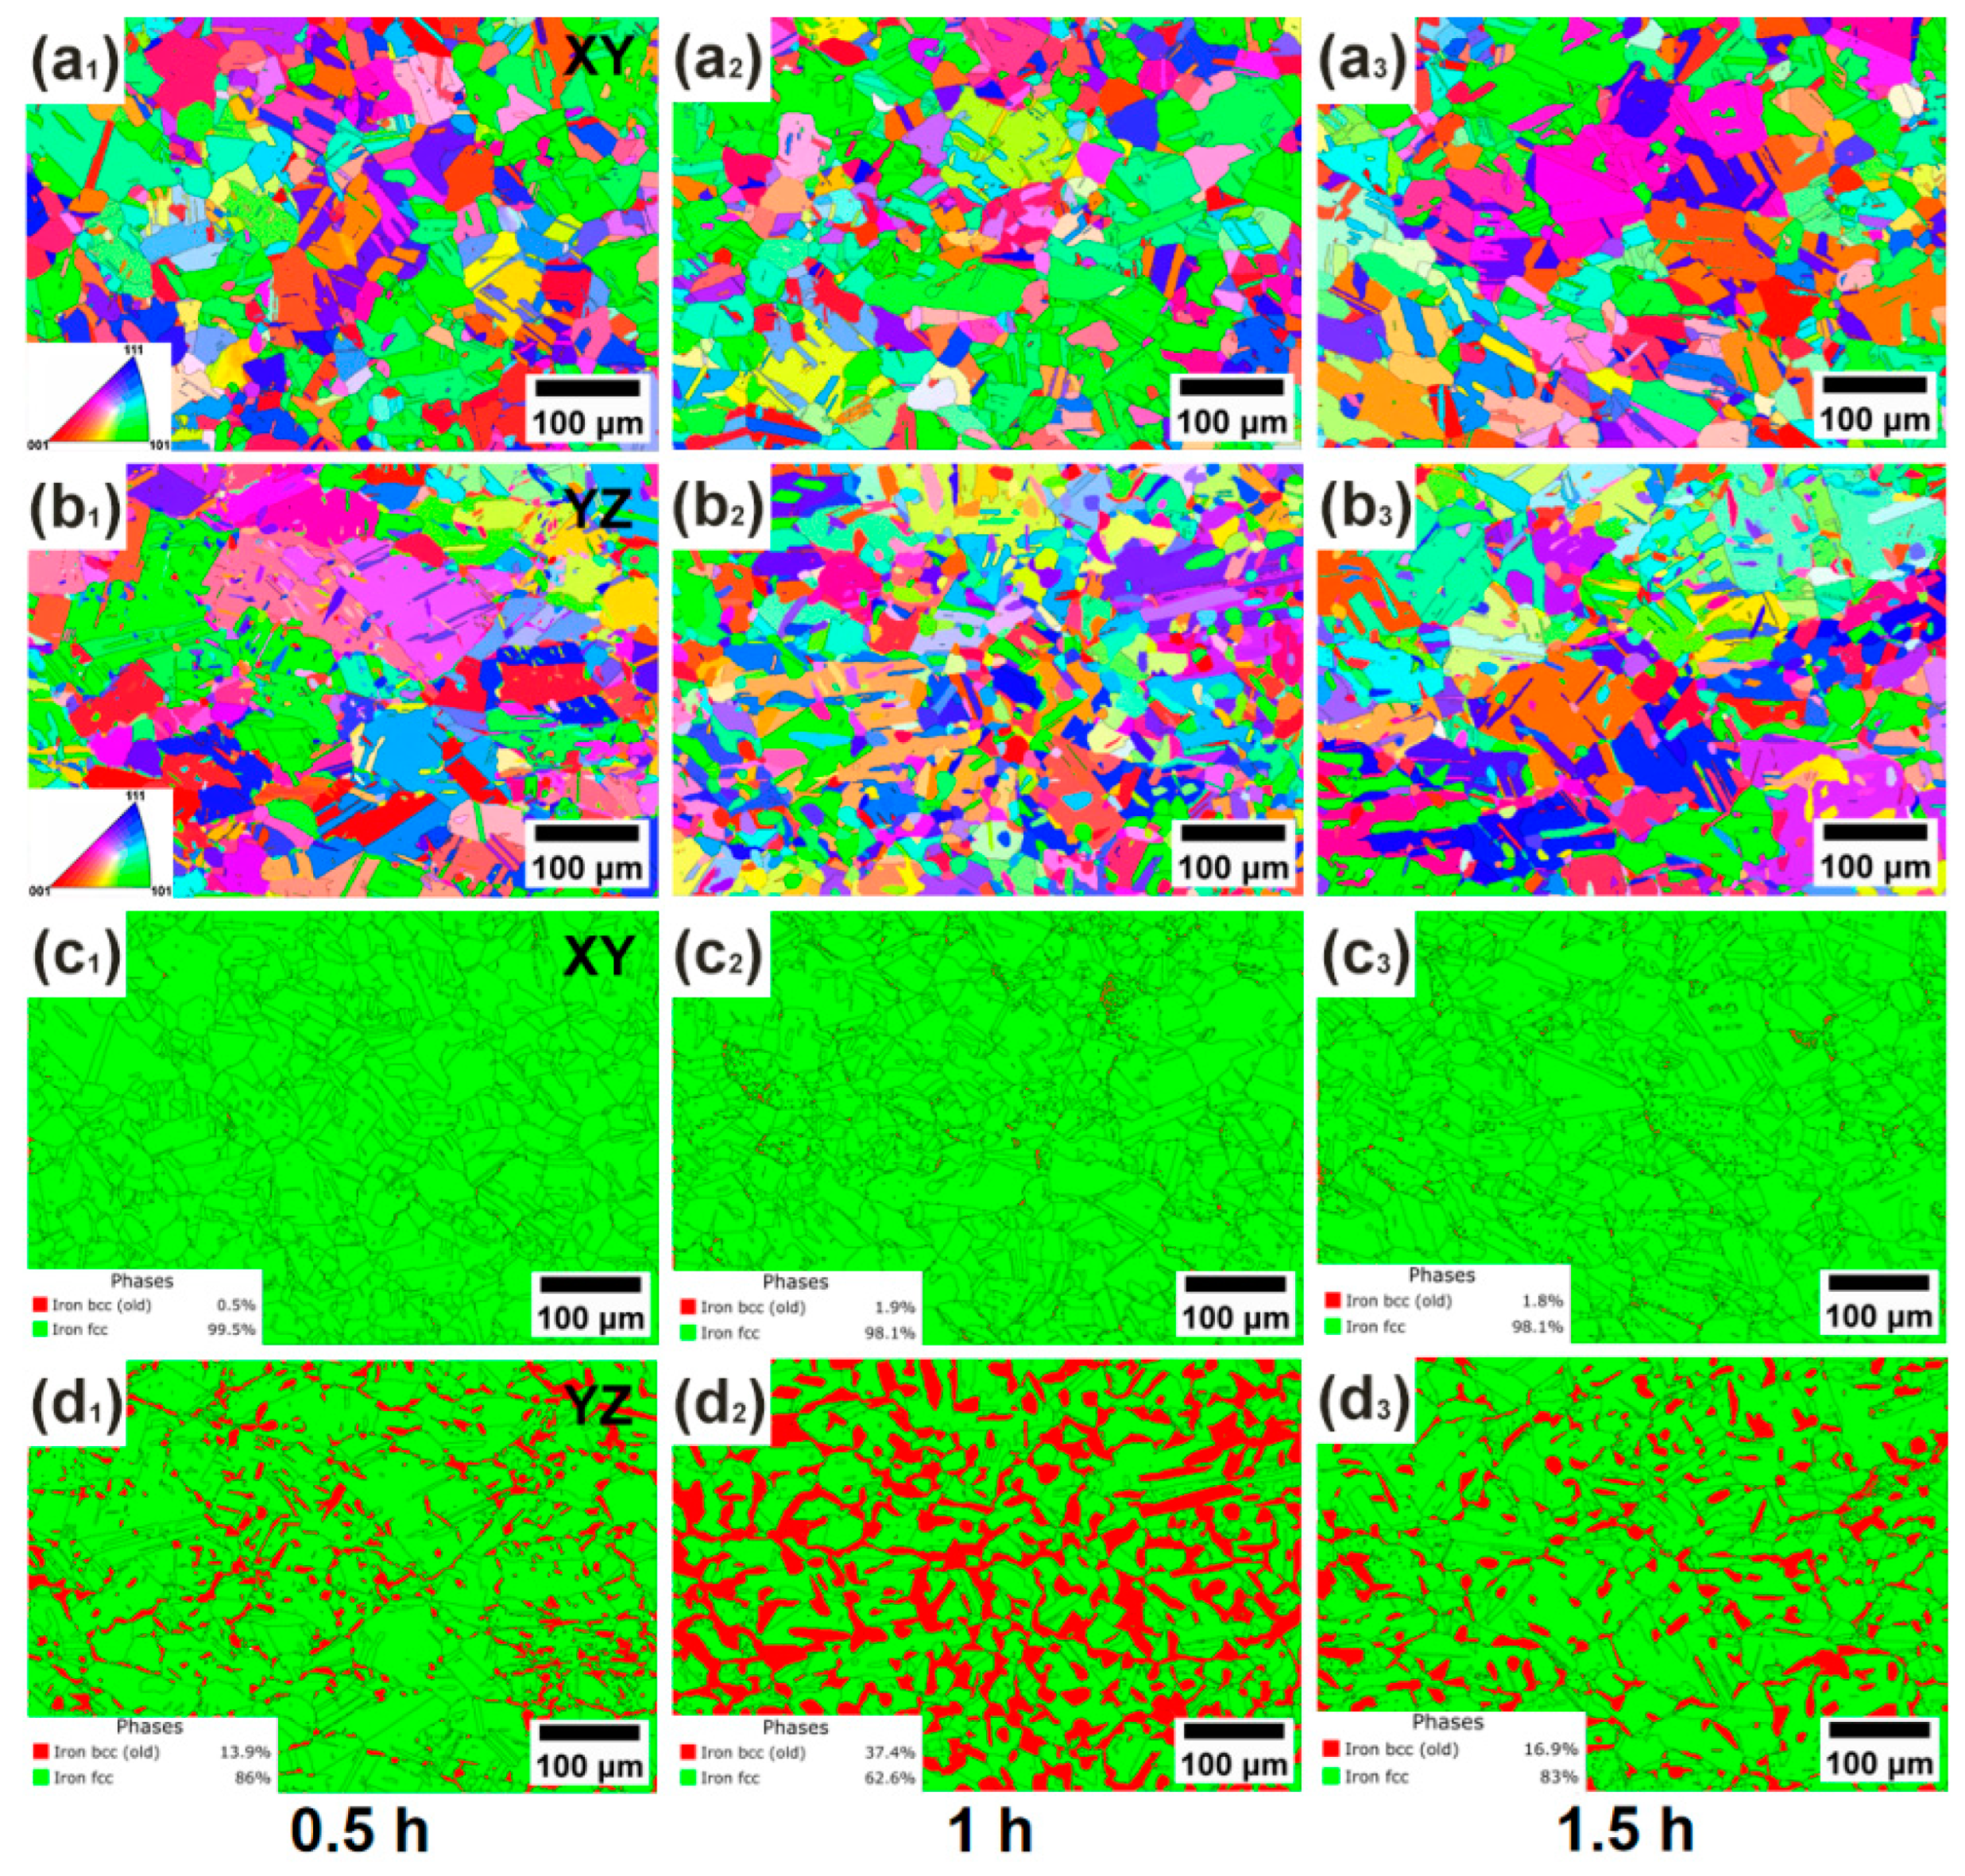
Figure 8 shows the IPF and phase composition maps of the 1150 °C solution-treated samples XY and YZ at different holding times. As seen from Figure 8(a1–a3,c1–c3), the FCC-austenite content of the XY surface of the sample was 99.5%, 98.1%, and 98.1% after holding for 0.5 h, 1 h, and 1.5 h, respectively, and the corresponding BCC-ferrite content was 0.5%, 1.9%, and 1.9%. However, the FCC-austenite content of the YZ surface changed significantly and non-monotonically with time, being 86.0%, 62.6%, and 83.0% after holding for 0.5 h, 1 h, and 1.5 h, respectively, and the corresponding BCC-ferrite content was 14.0%, 37.4%, and 17.0%.
According to the analysis, the reason for the slight increase in BCC-ferrite content on the XY surface is as follows: when the temperature exceeds the critical inflection point of about 1100 °C determined by the phase diagram, the driving force for the equilibrium precipitation of ferrite at the austenite grain boundaries increases significantly, causing the ferrite content to rise from less than 0.5% at the solution temperature of 1100 °C to 1.9%. This process is independent of element segregation and is a unique thermodynamic equilibrium response at high temperatures. The fundamental reason for the significant difference in phase composition between the XY and YZ surfaces is that the XY surface achieves complete element homogenization due to the interlayer laser remelting, which suppresses the driving force for the reverse transformation of ferrite. In contrast, the YZ surface is controlled by the dendritic segregation during unidirectional solidification, forming a localized [Al]/[Mn] ratio gradient [16]. This triggers nucleation through short-range Al diffusion, expands the phase transformation through Mn diffusion delay (37.4% at 1 h), and drives the reversion through reverse C diffusion (16.9% at 1.5 h), resulting in an unbalanced oscillation. In summary, it can be seen that when the temperature of SLM-formed lightweight steel exceeds the inflection point of the BCC-ferrite phase diagram, the holding time needs to be simultaneously controlled to suppress the reoccurrence of anisotropy.

3.2. Tensile Properties

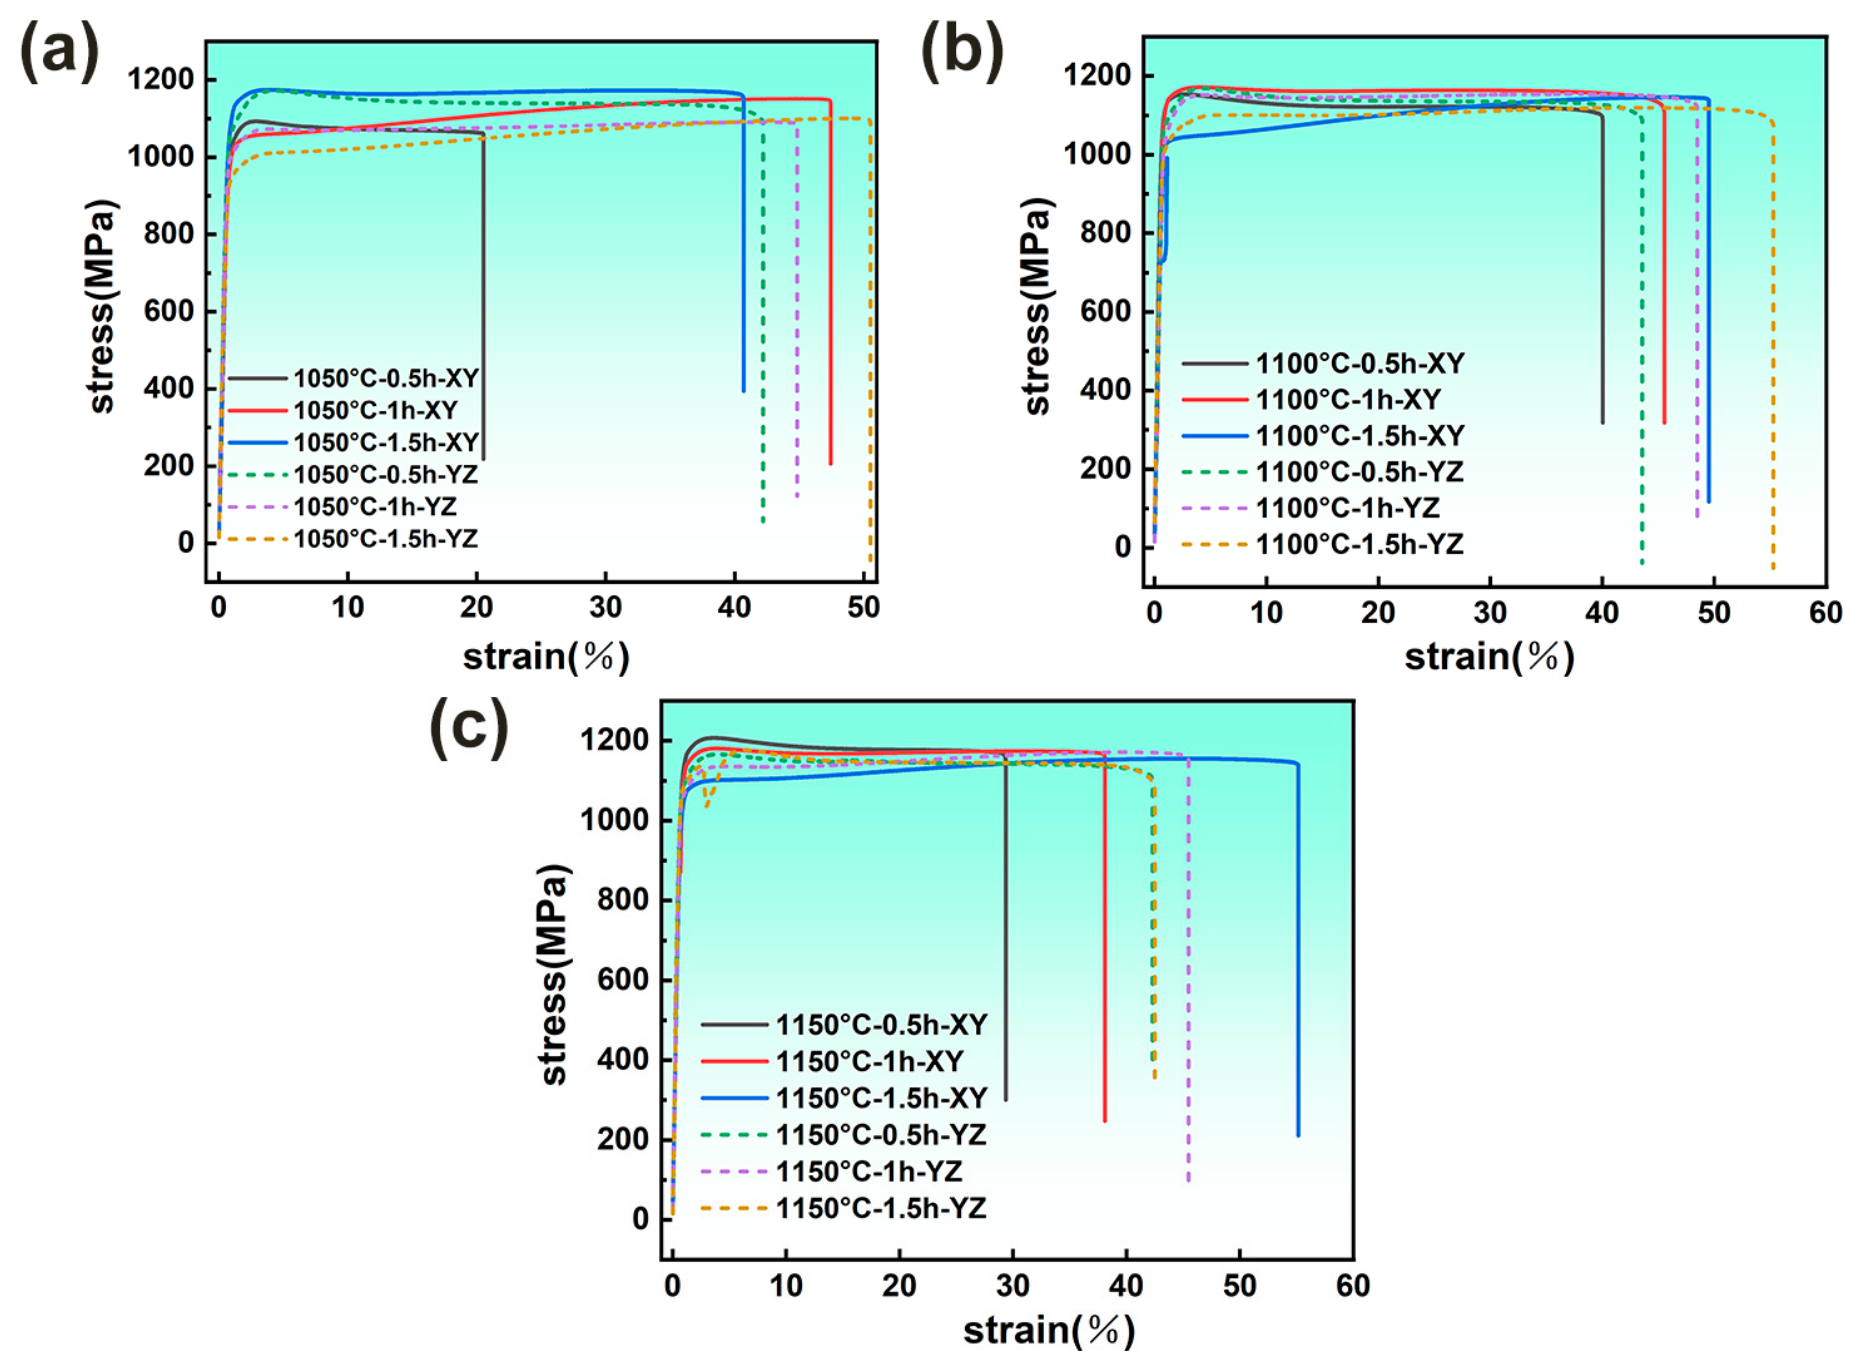
Figure 9 shows the tensile stress–strain curves of SLM-formed Fe-Mn-Al-C lightweight steel under different solution heat-treatment processes. Table 2 summarizes the specific values of tensile strength, yield strength, elongation after fracture, and reduction in area, and the stress–strain curves and the data in the table are obtained by averaging results from three tensile tests. From these experimental results, it can be seen that the anisotropy of mechanical properties is consistent with the EBSD results mentioned above. Among them, Figure 9a indicates that at a solution temperature of 1050 °C and a holding time of 0.5 h, the tensile strength of the XY plane is 1128.1 MPa, the yield strength is 1014.3 MPa, the elongation after fracture is 22.6%, and the reduction in area is 21.2%; while the tensile strength of the YZ plane is 1203.2 MPa, the yield strength is 1082.5 MPa, the elongation after fracture is 35.6%, and the reduction in area is 34.3%. These test data show that the sample has significant anisotropy, and as the holding time increases, the tensile strength and yield strength of the sample continuously decrease, while the elongation after fracture and reduction in area continuously increase. This may be due to the continuous dissolution of the second phase as the holding time increases. The anisotropy of the sample tends to be eliminated after holding for 1.5 h. At this time, the tensile strength of the XY plane is 1144.5 MPa, the yield strength is 1005.2 MPa, the elongation after fracture is 38.6%, and the reduction in area is 37.1%; the tensile strength of the YZ plane is 1104.2 MPa, the yield strength is 997.5 MPa, the elongation after fracture is 39.7%, and the reduction in area is 38.2%. It can be seen from Figure 9b that the sample can obtain the best mechanical properties after solution treatment at 1100 °C for 1 h. For the XY plane, the tensile strength is 1159.9 MPa, the yield strength is 1055.5 MPa, the elongation after fracture is 40.2%, and the reduction in area is 41.3%; for the YZ plane, the tensile strength is 1154.3 MPa, the yield strength is 1049.3 MPa, the elongation after fracture is 41.4%, and the reduction in area is 42.5%. Consistent with the EBSD analysis results, at a solution temperature of 1100 °C, anisotropy exists when holding for 0.5 h, but it is eliminated as the holding time increases to 1 h and 1.5 h. From the mechanical property data in Figure 9c, it can be seen that although the anisotropy of the sample is eliminated when the solution is treated at 1150 °C for 0.5 h and 1 h, the mechanical properties of the sample remain basically unchanged. However, a phenomenon of high tensile strength and yield strength but low elongation after fracture and reduction in area occurs. This may be due to the rapid transformation of austenite to ferrite through hard ferrite dispersion strengthening, but the new two-phase interface hinders the continuity of dislocation slip, resulting in a decrease in plasticity compared to the single-phase austenite matrix. When the holding time is 1.5 h, it can be seen that the tensile strength of the XY plane is 1155.6 MPa, the yield strength is 1016.5 MPa, the elongation after fracture is 38.9%, and the reduction in area is 40.1%; for the YZ plane, the tensile strength is 1142.2 MPa, the yield strength is 1007.3 MPa, the elongation after fracture is 34.8%, and the reduction in area is 35.6%. At this holding time, the mechanical properties are consistent with the EBSD microstructure results mentioned above, and the sample reappears anisotropy.

3.3. The Evolution of Grain Boundary Second-Phase Precipitation Behavior

In the research on SLM-formed lightweight steel, it is of significant scientific value to focus on the influence of the size/distribution of the second phase at the grain boundary and the morphology of the intragranular precipitates on mechanical properties and anisotropy. In studies on traditional manufacturing methods of lightweight steel, the large and continuous precipitates at the grain boundary (such as κ-carbides or B2 phase) directly lead to low plasticity along a specific direction (such as the Z-direction of SLM-formed steel) and intergranular brittle fracture by inducing local stress concentration and hindering the coordinated movement of dislocations across the grain boundary; while the size gradient distribution and spatial density difference in intragranular nanoscale precipitates (L12 ordered structure) dominate the competition between dislocation cutting through and around, regulate the work hardening behavior and amplify the interlayer mechanical response difference. The combined effect of the two constitutes the essential root cause of the inverted strength–ductility and anisotropy of SLM lightweight steel. The following text explores the different influences of the microstructure at the grain boundary and in the matrix on mechanical properties and anisotropy through the TEM characterization of three solution treatment samples of lightweight steel (1050 °C/1100 °C/1150 °C for 1 h), providing a core theoretical basis for breaking through the toughening and isotropic design of SLM-formed lightweight steel through grain boundary engineering (controlling the size and type of the second phase at the grain boundary) and intragranular microstructure optimization (regulating the spatial distribution of the second phase).
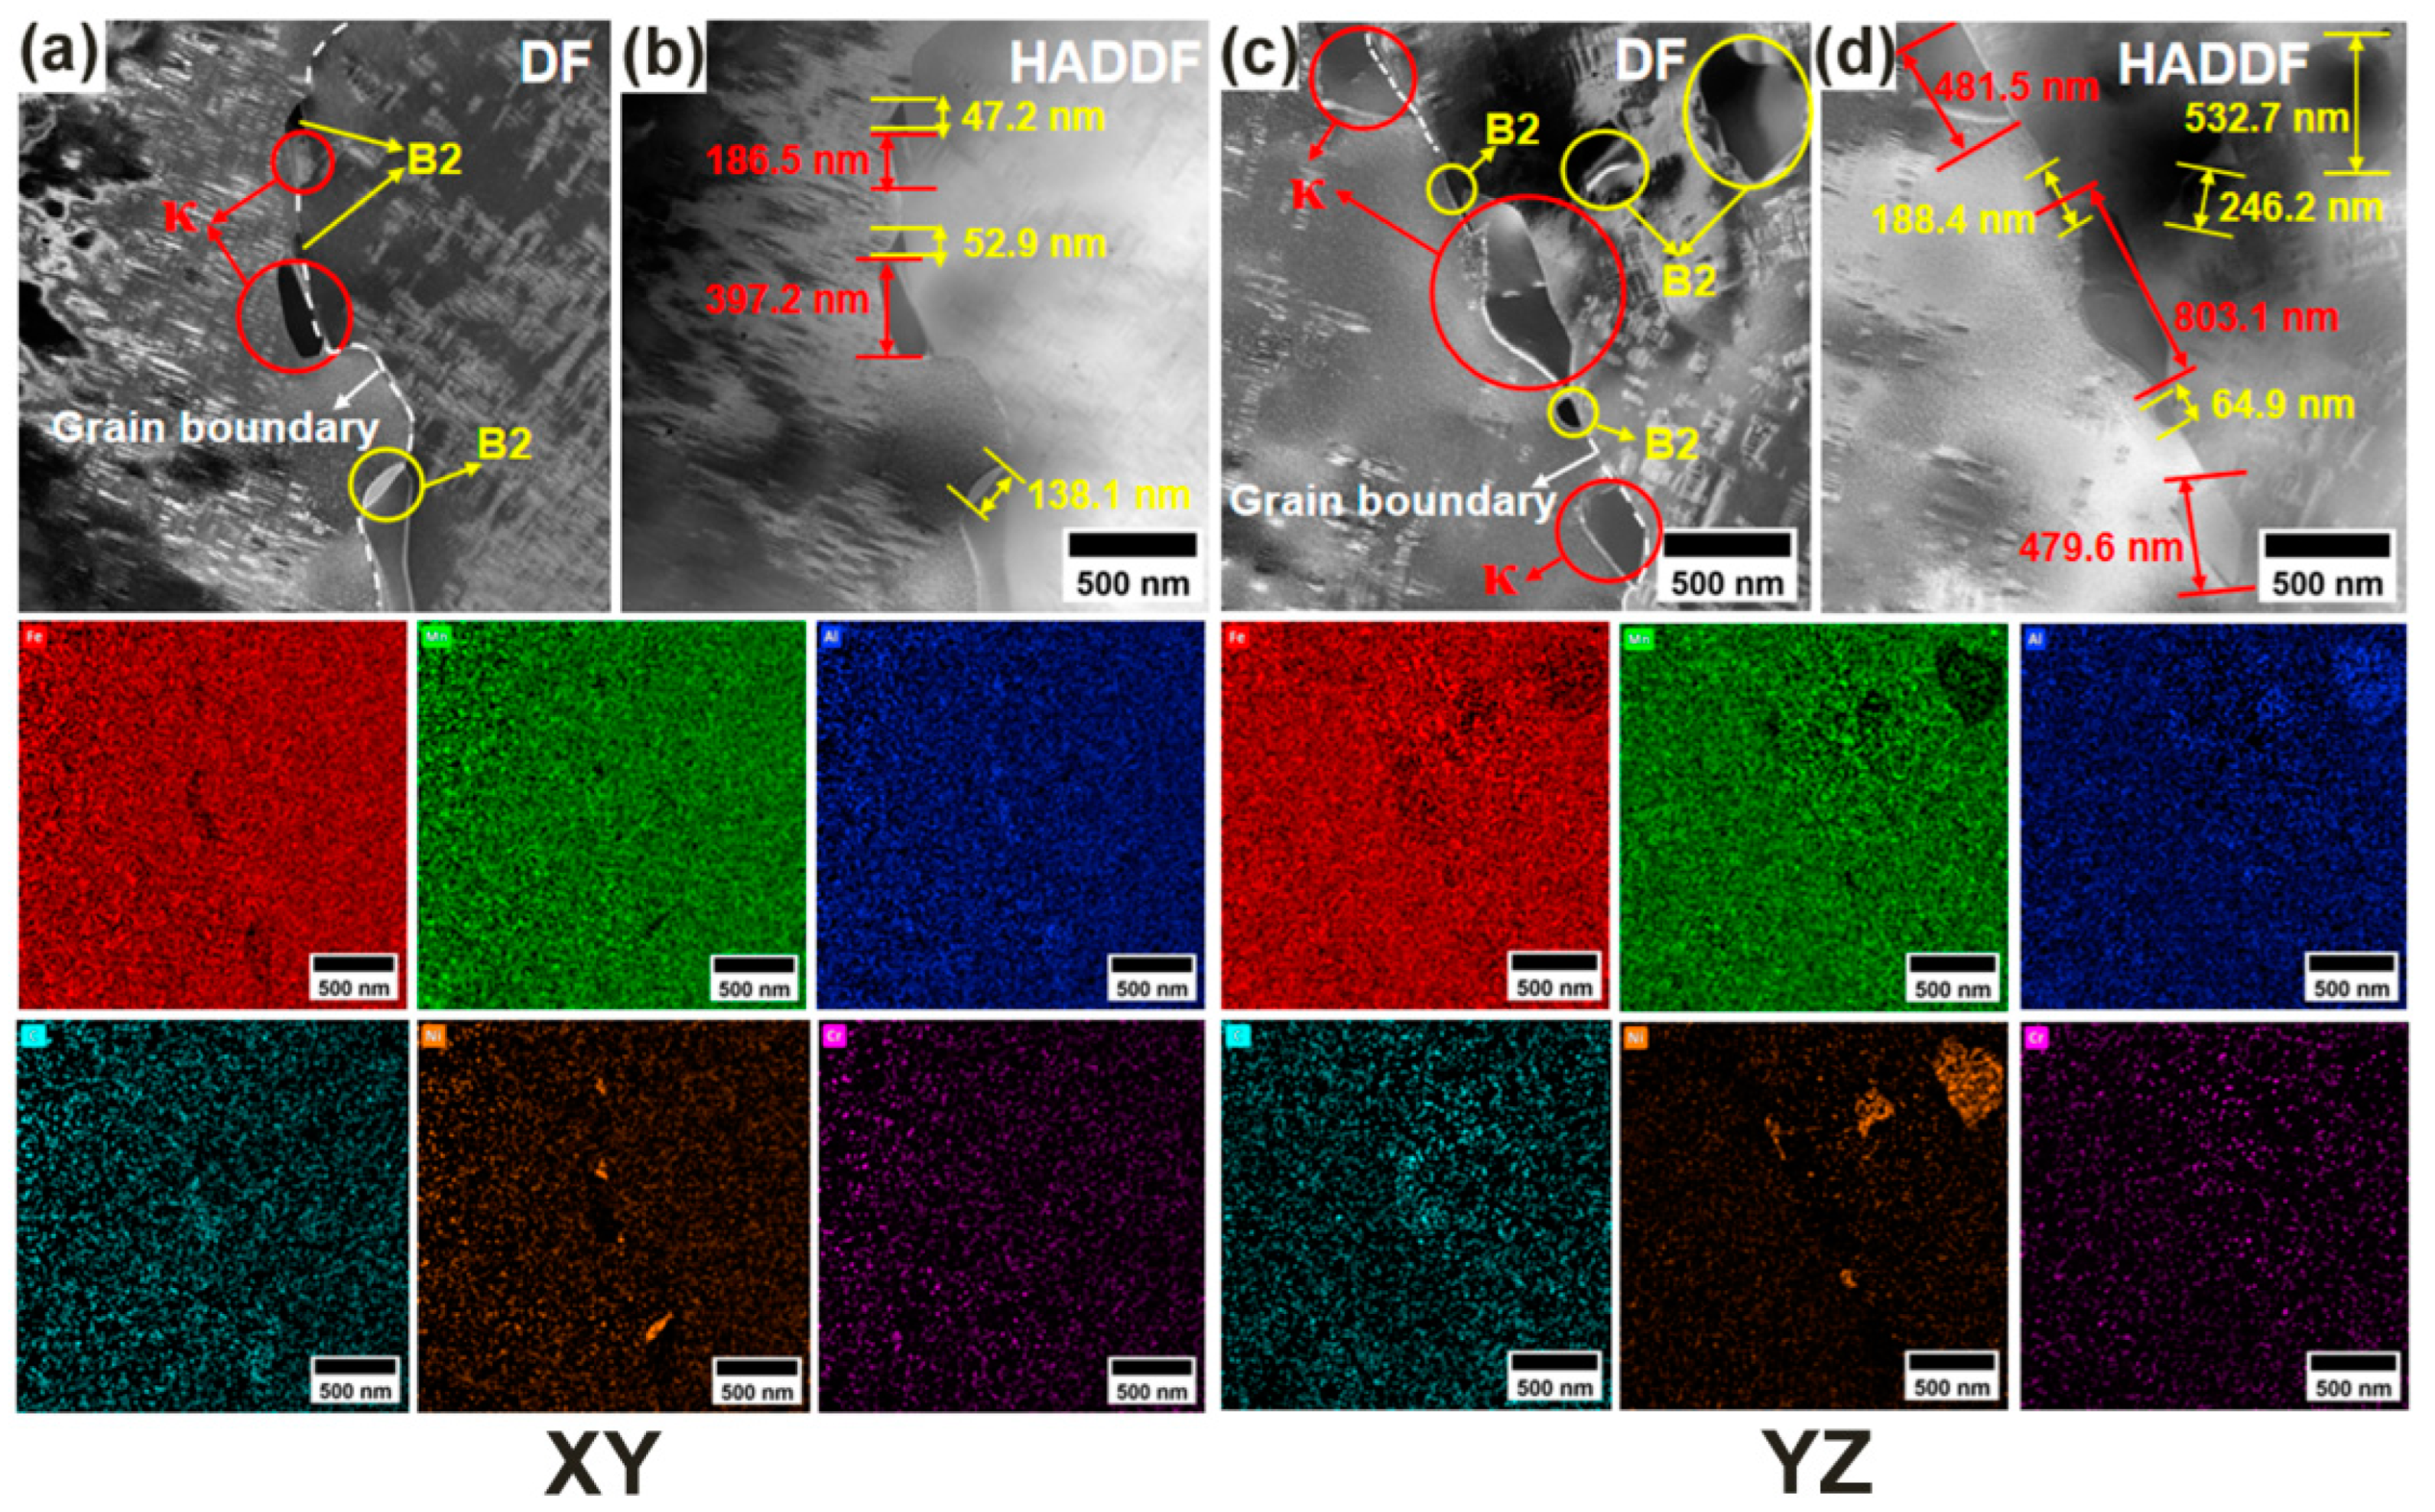
Figure 10 shows the TEM characterization of the grain boundaries in the XY and YZ planes of the lightweight steel formed by SLM after solution treatment at 1050 °C for 1 h. From the dark field images and HAADF in Figure 10a,b, it can be seen that there are two types of second phases at the grain boundaries in the XY plane of the solution-treated sample at this temperature. EDS mapping shows that one type of second phase has Mn/Al enrichment and can be inferred to be κ-carbides, with an average length of about 300 nm. The other type of second phase has Ni/Al enrichment and can be inferred to be the B2 phase, with an average length of about 70 nm. From the dark field images and HADDF in Figure 10c,d, it can be seen that there are also two types of second phases in the YZ plane of the sample, and the second phases are larger in size compared to those in the XY plane. Moreover, large-sized (about 400 nm in length) B2 phases precipitate towards the grain interior near the grain boundaries.
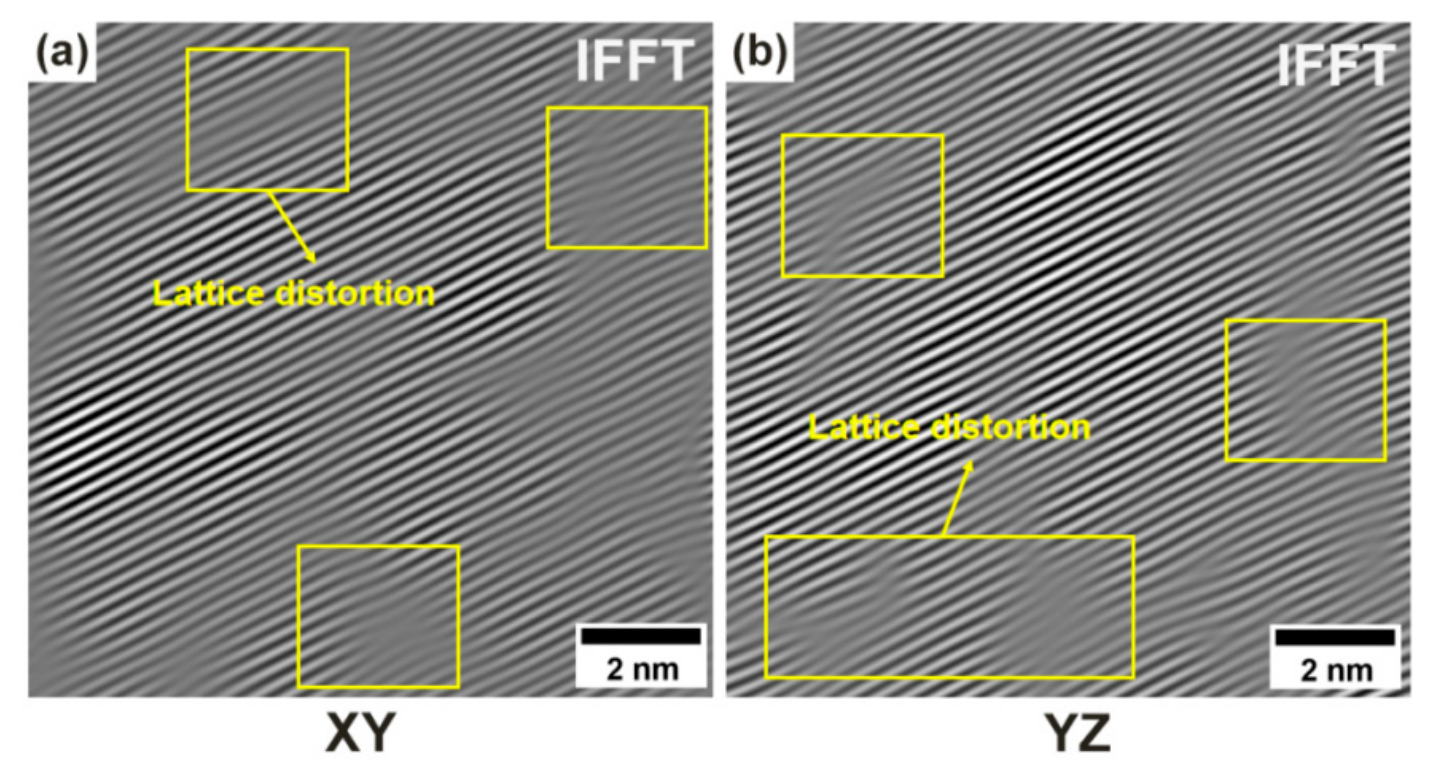
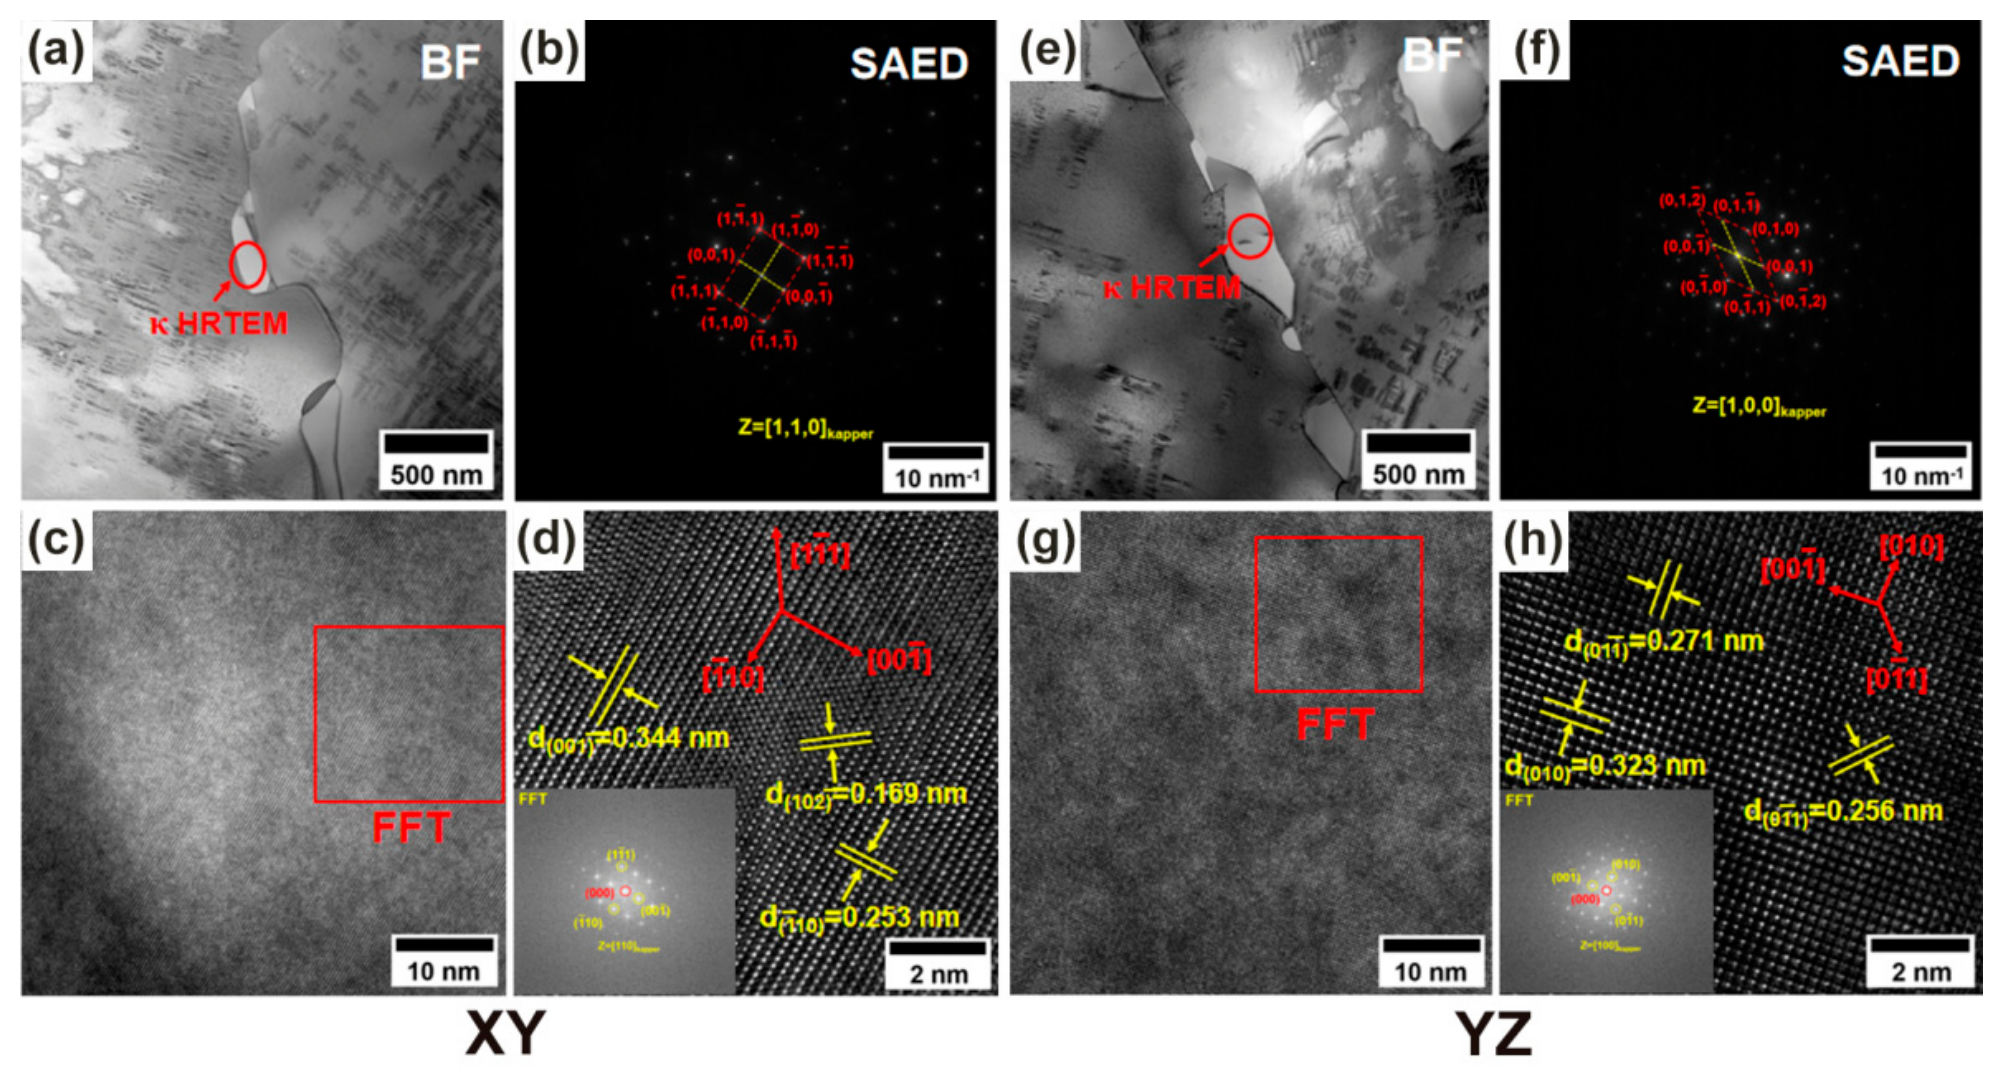
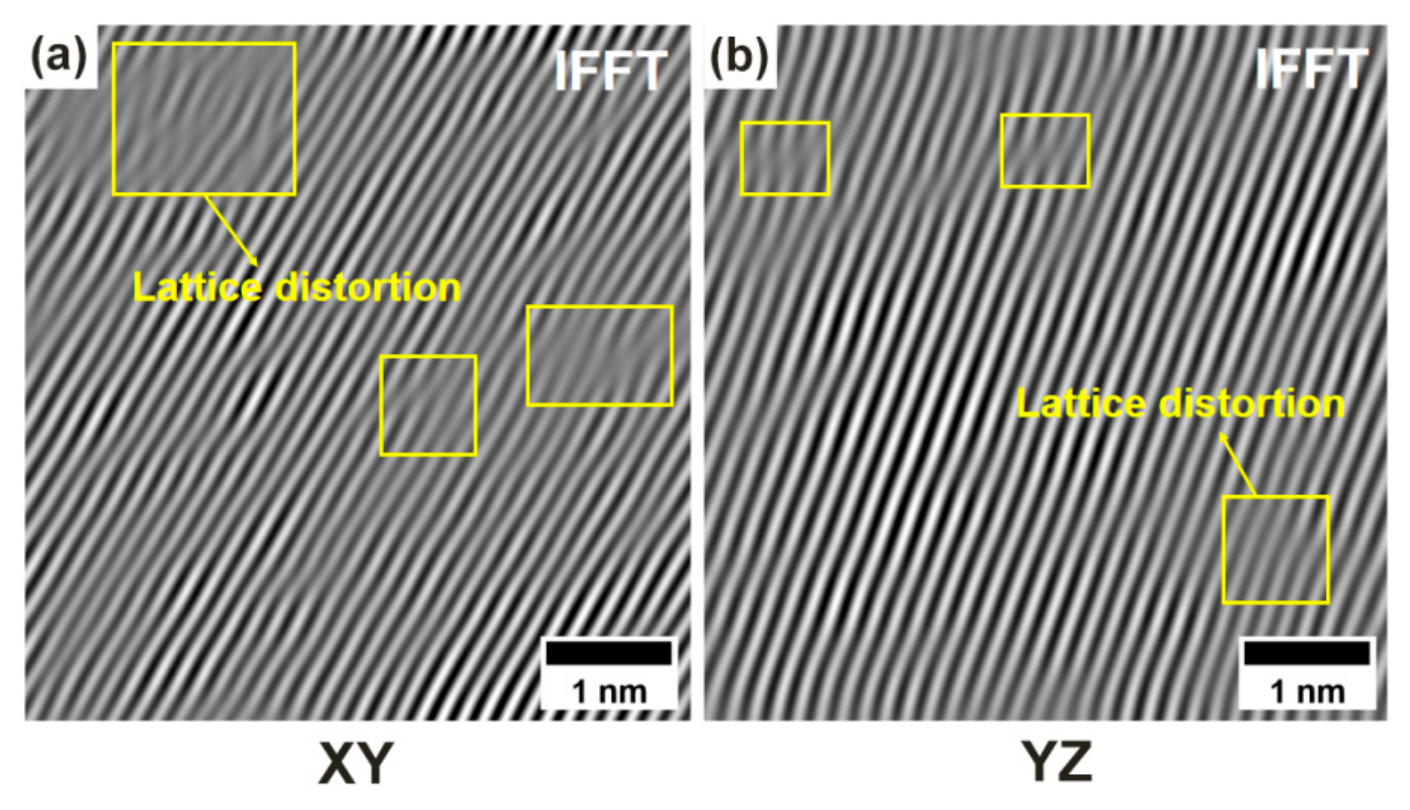
To verify the speculation of the existence of two types of second phases, the selected area electron diffraction (SAED) patterns and high-resolution TEM (HRTEM) images of the regions in the XY and YZ planes of the sample that were speculated to be κ-carbides are presented in Figure 11a–h. On the XY plane of the sample, the SAED pattern clearly detected 1/2{002} superlattice diffraction spots along the [110] zone axis, indicating the presence of an L12-ordered structure. Quantitative analysis of the high-resolution atomic images revealed three sets of measured interplanar spacings: d(0, 0, −1) = 0.344 nm, which is 10.4% smaller than the theoretical value of 0.384 nm for κ-carbides; d(−1, 1, 0) = 0.253 nm, which is 6.8% smaller than the theoretical value of 0.271 nm; and d(1, 0, −2) = 0.169 nm, which is 1.6% smaller than the theoretical value of 0.172 nm. This non-uniform lattice distortion is evident in multiple regions of the inverse FFT image in Figure 12. This is because in the layered crystal structure of κ-carbides, the {100} family of crystal planes is parallel to the alternating stacking direction of Mn/Al atoms, and their low elastic modulus makes them highly sensitive to vertical thermal stress, resulting in significant compressive strain in this crystal direction. On the YZ plane of the sample, under the [100] zone axis, d(0, 1, −1) = 0.271 nm perfectly matches the theoretical value of the {110} plane of κ-carbides, while d(0, −1, 1) = 0.256 nm is contracted by 5.5% and d(0, 1, 0) = 0.323 nm is contracted by 15.9%. This is because d(0, 1, −1) belongs to the {110} family of crystal planes, and its normal direction has a small angle with the thermal stress direction, with a low shear component, so the lattice parameter remains normal. However, d(0, −1, 1) and d(0, 1, 0) have a larger angle with the thermal stress direction, resulting in a greater shear stress and thus significant lattice contraction. In summary, the unique anisotropic distortion mechanism of κ-carbides is as follows: the {100} planes contract due to sensitivity to vertical thermal stress, and the {110} planes contract due to differences in shear components. This gradient distortion pattern, coupled with the layered elastic modulus of κ-carbides, serves as a basis for distinguishing it from other second phases [17,18].
Figure 13a–h presents the selected area electron diffraction (SAED) patterns and high-resolution TEM (HRTEM) images of the regions in the XY and YZ planes of the sample that are predicted to be B2 phase. It can be seen on the XY plane of the sample that under the [111] zone axis, the 1/2{110} superlattice spots confirm the CsCl-type ordered structure. However, d(−1, 0, −1) = 0.221 nm and d(0, 1, −1) = 0.214 nm, both belonging to the {101} crystal plane family, split into two different values. This abnormal splitting of the {101} interplanar spacing is attributed to the lattice shear distortion induced by the atomic size mismatch of Ni/Al in the B2 phase (Figure 14). This phenomenon never occurs in κ-carbides and serves as a unique thermodynamic basis for distinguishing the B2 phase from the L12 structure. Similarly, on the YZ plane of the sample, under the [111] zone axis, d(0, 1, −1) = 0.204 nm ({101} plane) contracts by 1.0% compared to the theoretical value of 0.206 nm, while d(1, 1, 0) = 0.214 nm ({110} plane) expands by 3.9% compared to the theoretical value of 0.206 nm. This reverse deviation in the interplanar spacing of the same crystal plane (coexistence of contraction of the {101} plane and expansion of the {110} plane) is due to the shear-type lattice distortion induced by the strict ordered occupation of Ni/Al atoms in the B2 structure, resulting in the breaking of cubic symmetry and the generation of opposite strains on the {101} and {110} planes. This behavior once again proves that it is different from the uniform contraction behavior of κ-carbides in the corresponding crystal direction [19,20].
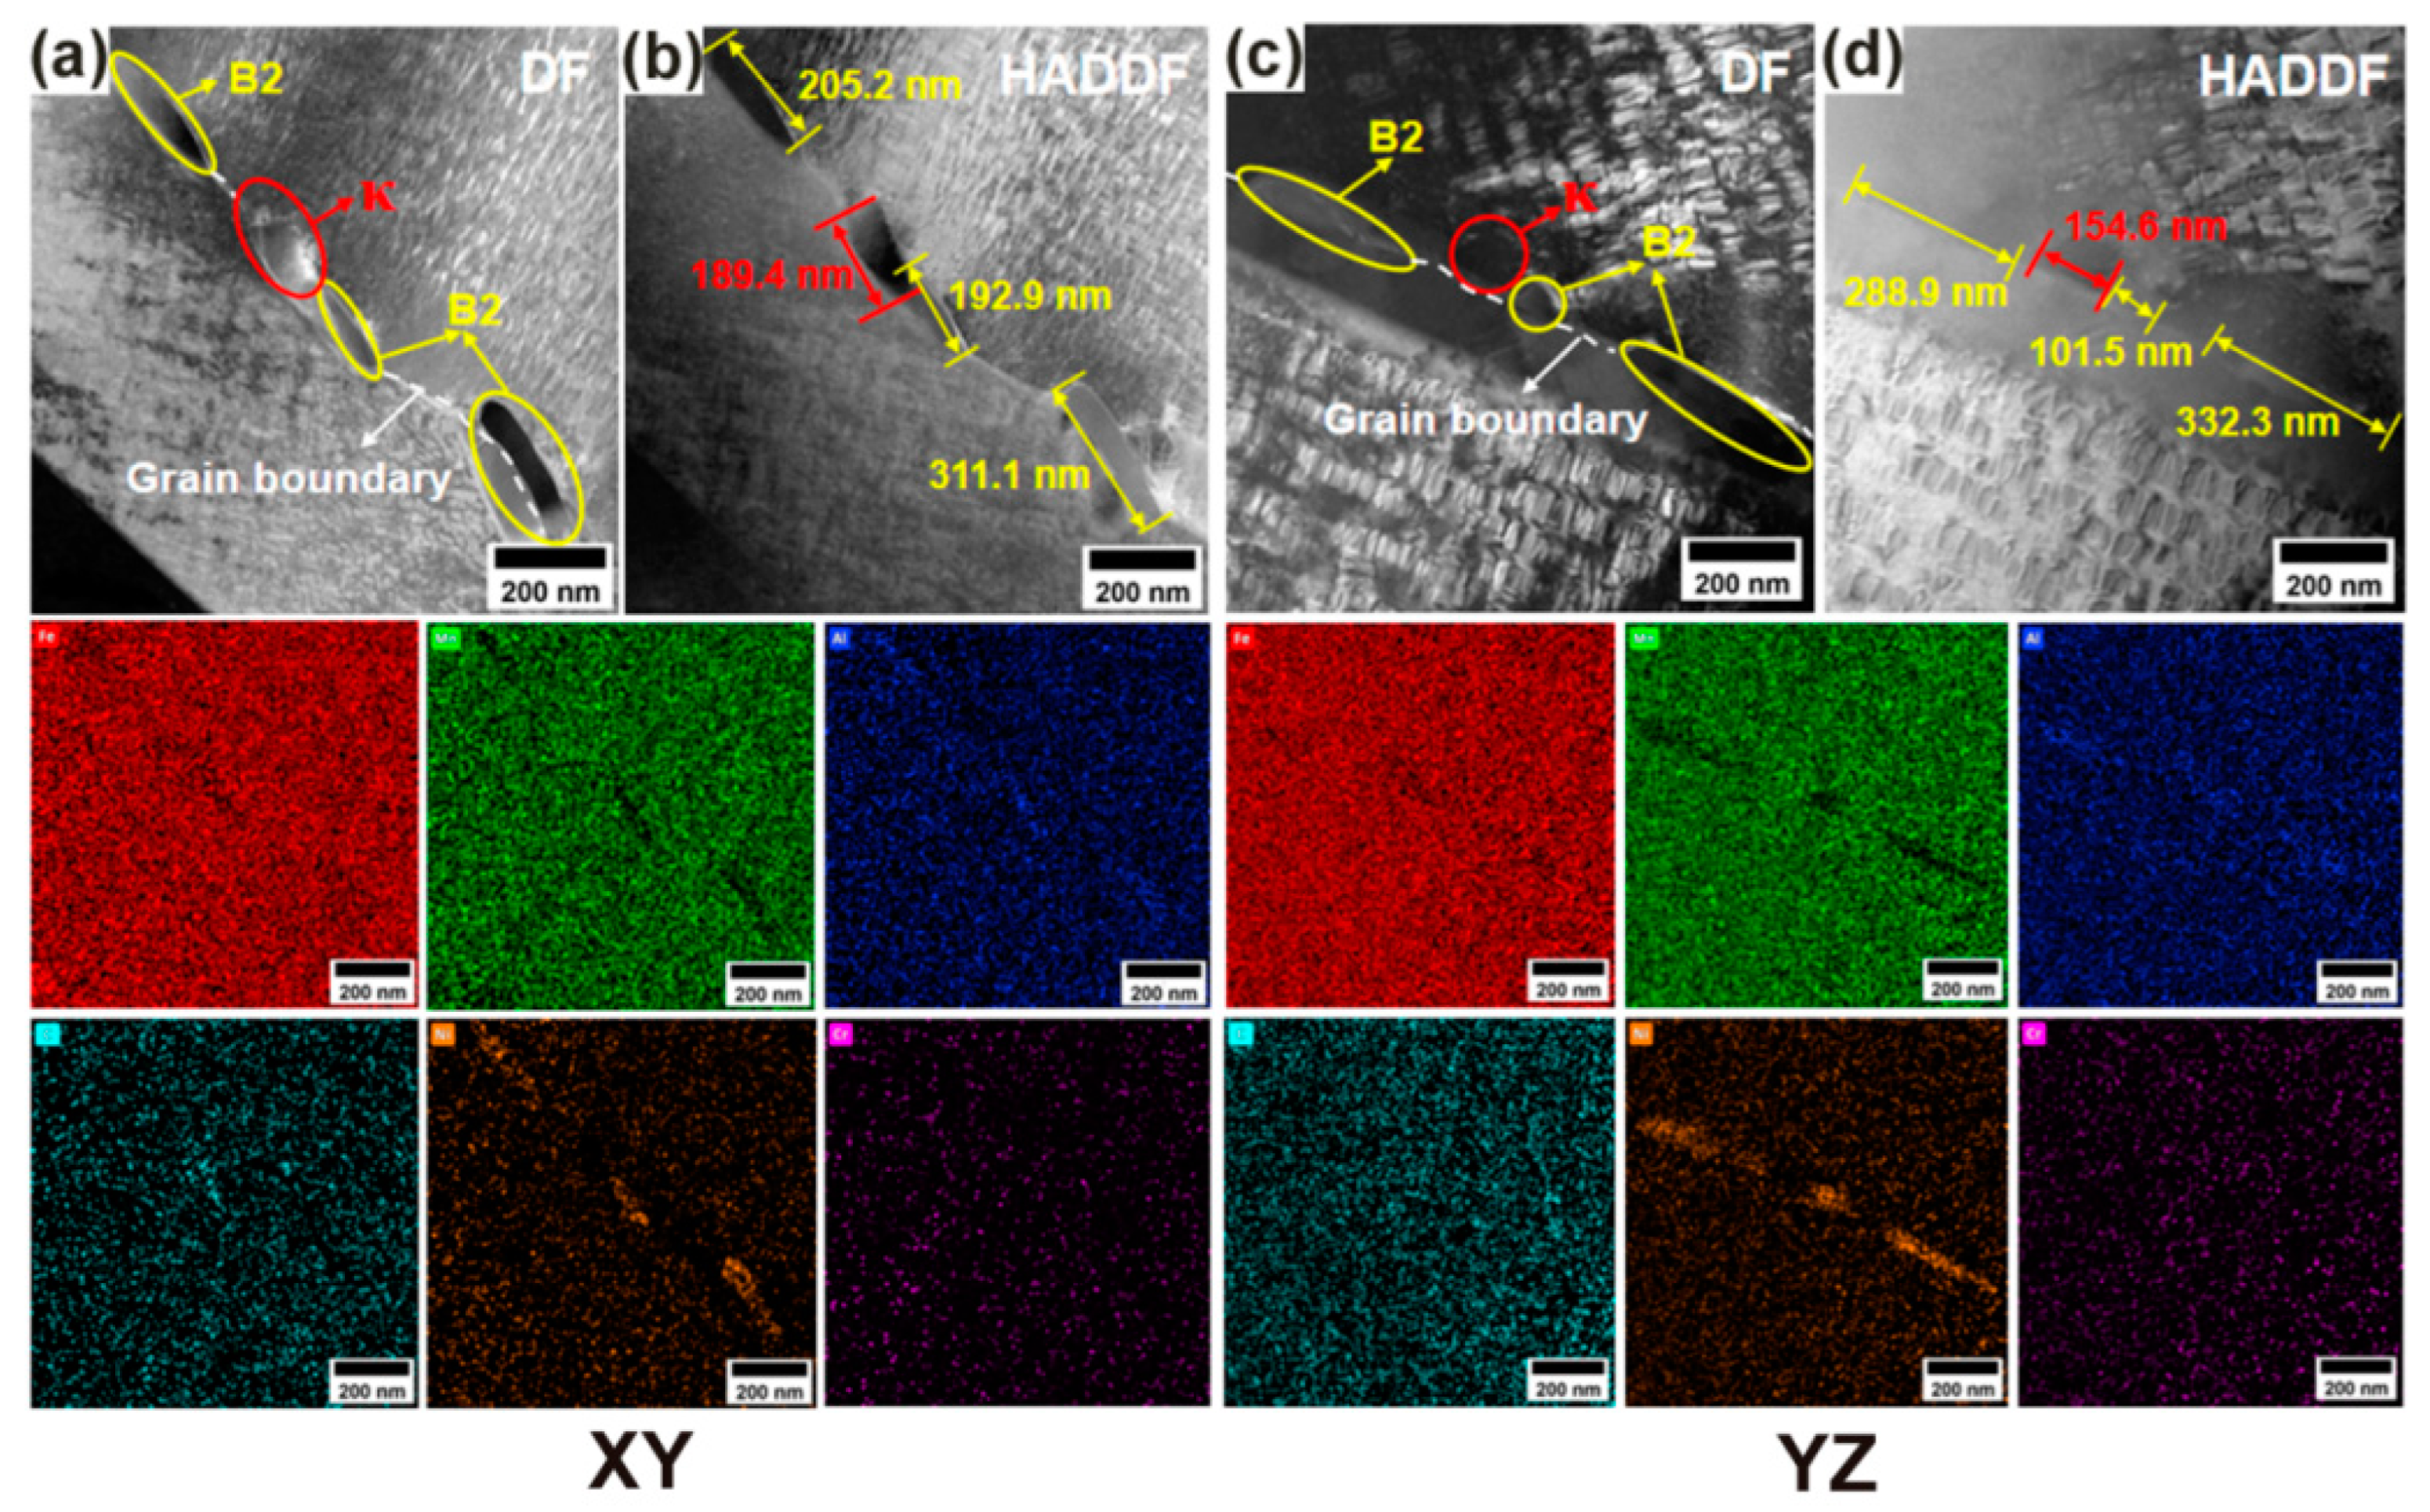
Figure 15 shows the TEM characterization of the microstructure at the grain boundaries of the XY and YZ planes of the lightweight steel formed by SLM after solution treatment at 1100 °C for 1 h. From the dark field images and HAADF in Figure 15a,b, it can be seen that there are still two second phases at the grain boundaries of the XY plane of the sample at this temperature. EDS mapping shows that κ-carbides and B2 phase still exist at the grain boundaries after solution treatment at this temperature, but unlike at 1050 °C, the quantity and size of κ-carbides are significantly reduced, while the size of the B2 phase increases. Similarly, from the dark field images and HADDF in Figure 15c,d, it can be seen that the quantity and size of κ-carbides at the YZ plane of the sample are reduced compared to those at 1050 °C, and the size of the B2 phase increases. Moreover, no large plate-like B2 phase is found in the grains near the grain boundaries.
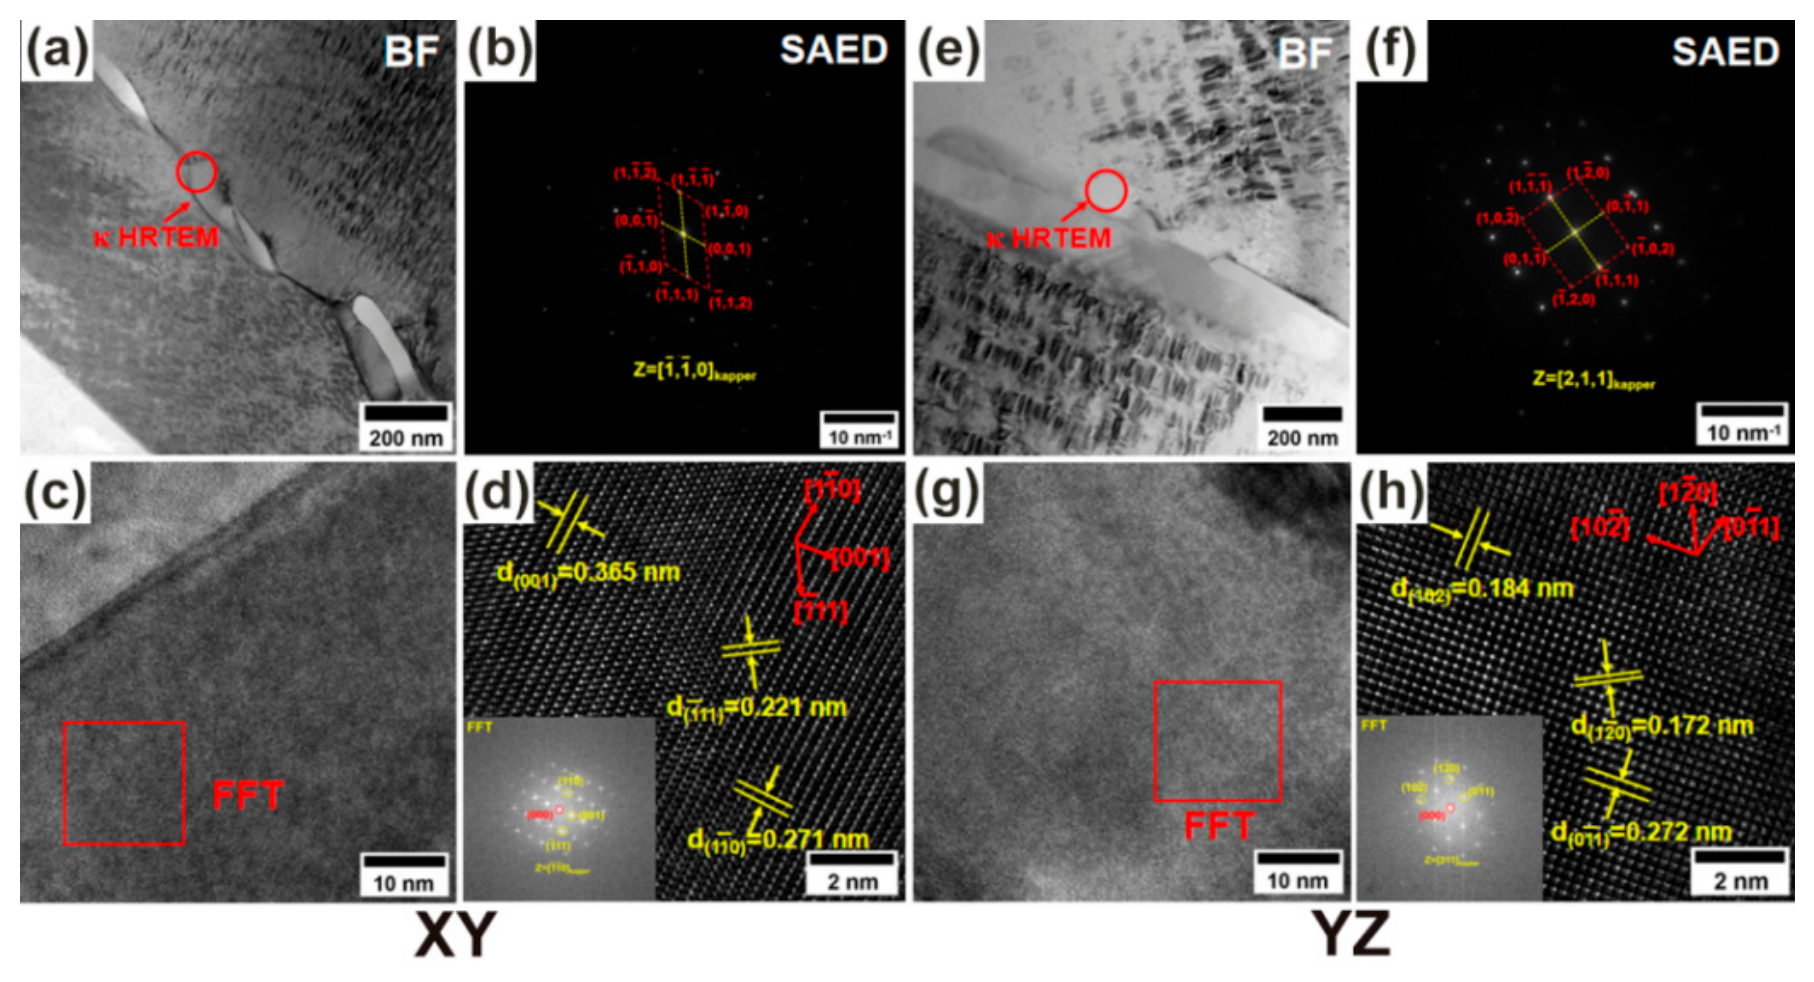
Figure 16a–h presents the SAED and HRTEM images of the κ-carbides regions on the XY and YZ planes of the samples. On the XY plane of the sample, three sets of interplanar spacing data were measured along the [−1–10] zone axis: d(0, 0, 1) = 0.365 nm, which is 5% smaller than the theoretical value; d(−1, 1, 1) = 0.221 nm, which is 0.5% smaller than the theoretical value; and d(1, −1, 0) = 0.271 nm, which is 0.4% smaller than the theoretical value. On the YZ plane of the sample, three sets of interplanar spacing data were measured along the [211] zone axis: d(1, 0, −2) = 0.184 nm, which is 7% larger than the theoretical value; d(1, −2, 0) = 0.172 nm, which is in line with the theoretical value; and d(0, −1, 1) = 0.272 nm, which is also in line with the theoretical value. The above distortion data show a smaller distortion compared to that at 1050 °C and a more random distribution. This indicates that the solution treatment at 1100 °C, by altering the directional coupling ability of the κ-carbides layer modulus, transforms the systematic distortion that leads to performance splitting into local fluctuations that do not harm performance, which plays a key role in eliminating anisotropy [21,22,23].
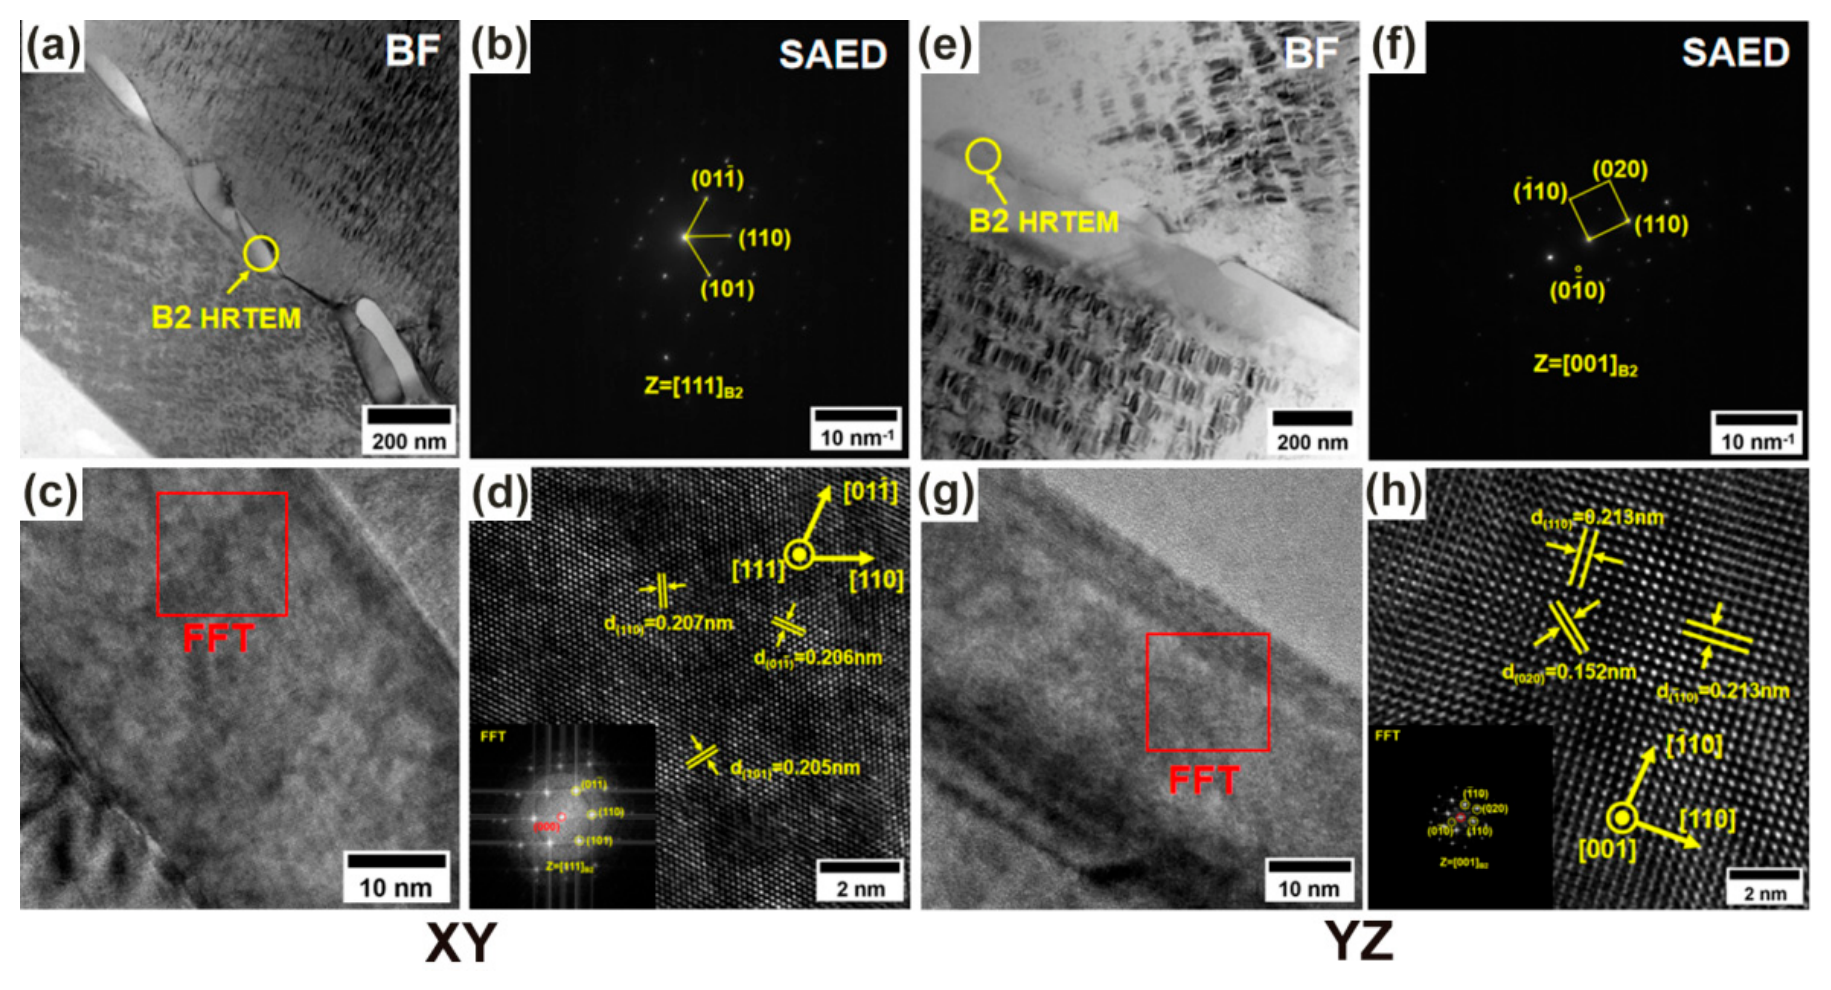
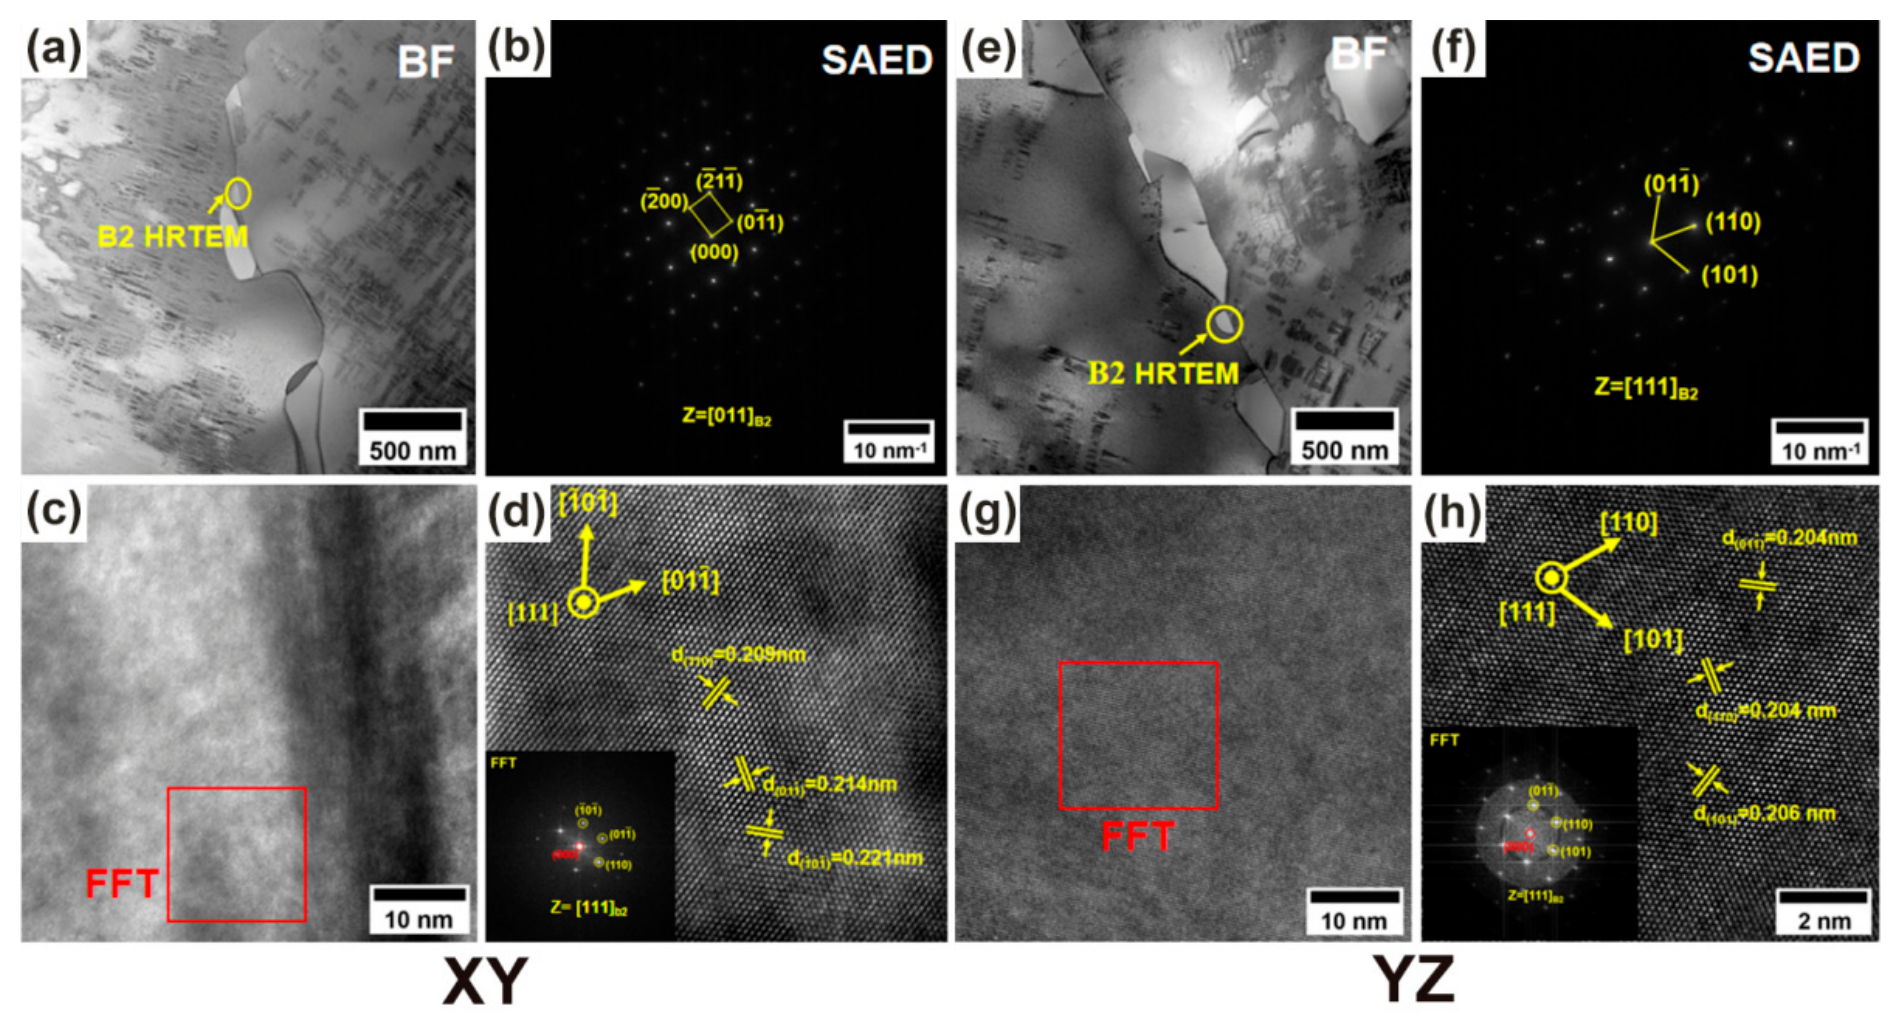
Figure 17a–h presents the SAED and HRTEM images of the B2 phase regions on the XY and YZ planes of the sample. On the XY plane of the sample, the three sets of interplanar spacing data measured along the [111] zone axis are as follows: d(0, −1, 1) = 0.206 nm, which is 1.5% larger than the theoretical value; d(1, 1, 0) = 0.207 nm, which is 2% larger than the theoretical value; and d(1, 0, 1) = 0.205 nm, which is 1% larger than the theoretical value. On the YZ plane of the sample, the three sets of interplanar spacing data measured along the [001] zone axis are as follows: d(1, 1, 0) = 0.213 nm, which is 0.5% larger than the theoretical value; d(0, 2, 0) = 0.152 nm, which is 1.3% larger than the theoretical value; and d(−1, 1, 0) = 0.213 nm, which is 0.5% larger than the theoretical value. It can be seen that the crystallographic parameters of the B2 phase on the XY and YZ planes are highly convergent after solution treatment at 1100 °C. The reason for this might be that the formation of large B2 phase strips eliminates the modulus anisotropy. This phenomenon is consistent with the isotropic transformation of B2 phase and κ-carbides confirmed in the previous text at 1100 °C.
In summary, after solution treatment at 1100 °C, the cooperative evolution of κ-carbides and B2 phase in the grain boundary region plays a decisive role in eliminating anisotropy in SLM-formed lightweight steel. The increase in solution temperature promotes the complete dissolution of undissolved κ-carbides and its reprecipitation as uniform and small nanoparticles, simultaneously driving the B2 phase to form large particles through Ostwald ripening and completely inhibiting intragranular lamellar precipitation. This process eliminates the hereditary effect of thermal stress through a two-stage mechanism [24]: (1) the homogenization of κ-carbides size blocks the anisotropy of dislocation slip related to the deposition direction; (2) the coarsening of B2 phase eliminates the stress concentration source at the grain boundary, transforming the residual thermal strain energy from long-range ordered accumulation (1050 °C) to short-range random distribution. The cross-scale homogenization of microstructure ultimately leads to strict isotropy in macroscopic mechanical properties, as evidenced by the minimal strength and plasticity deviations on the XY and YZ planes, demonstrating the elimination of deposition direction anisotropy in SLM components.
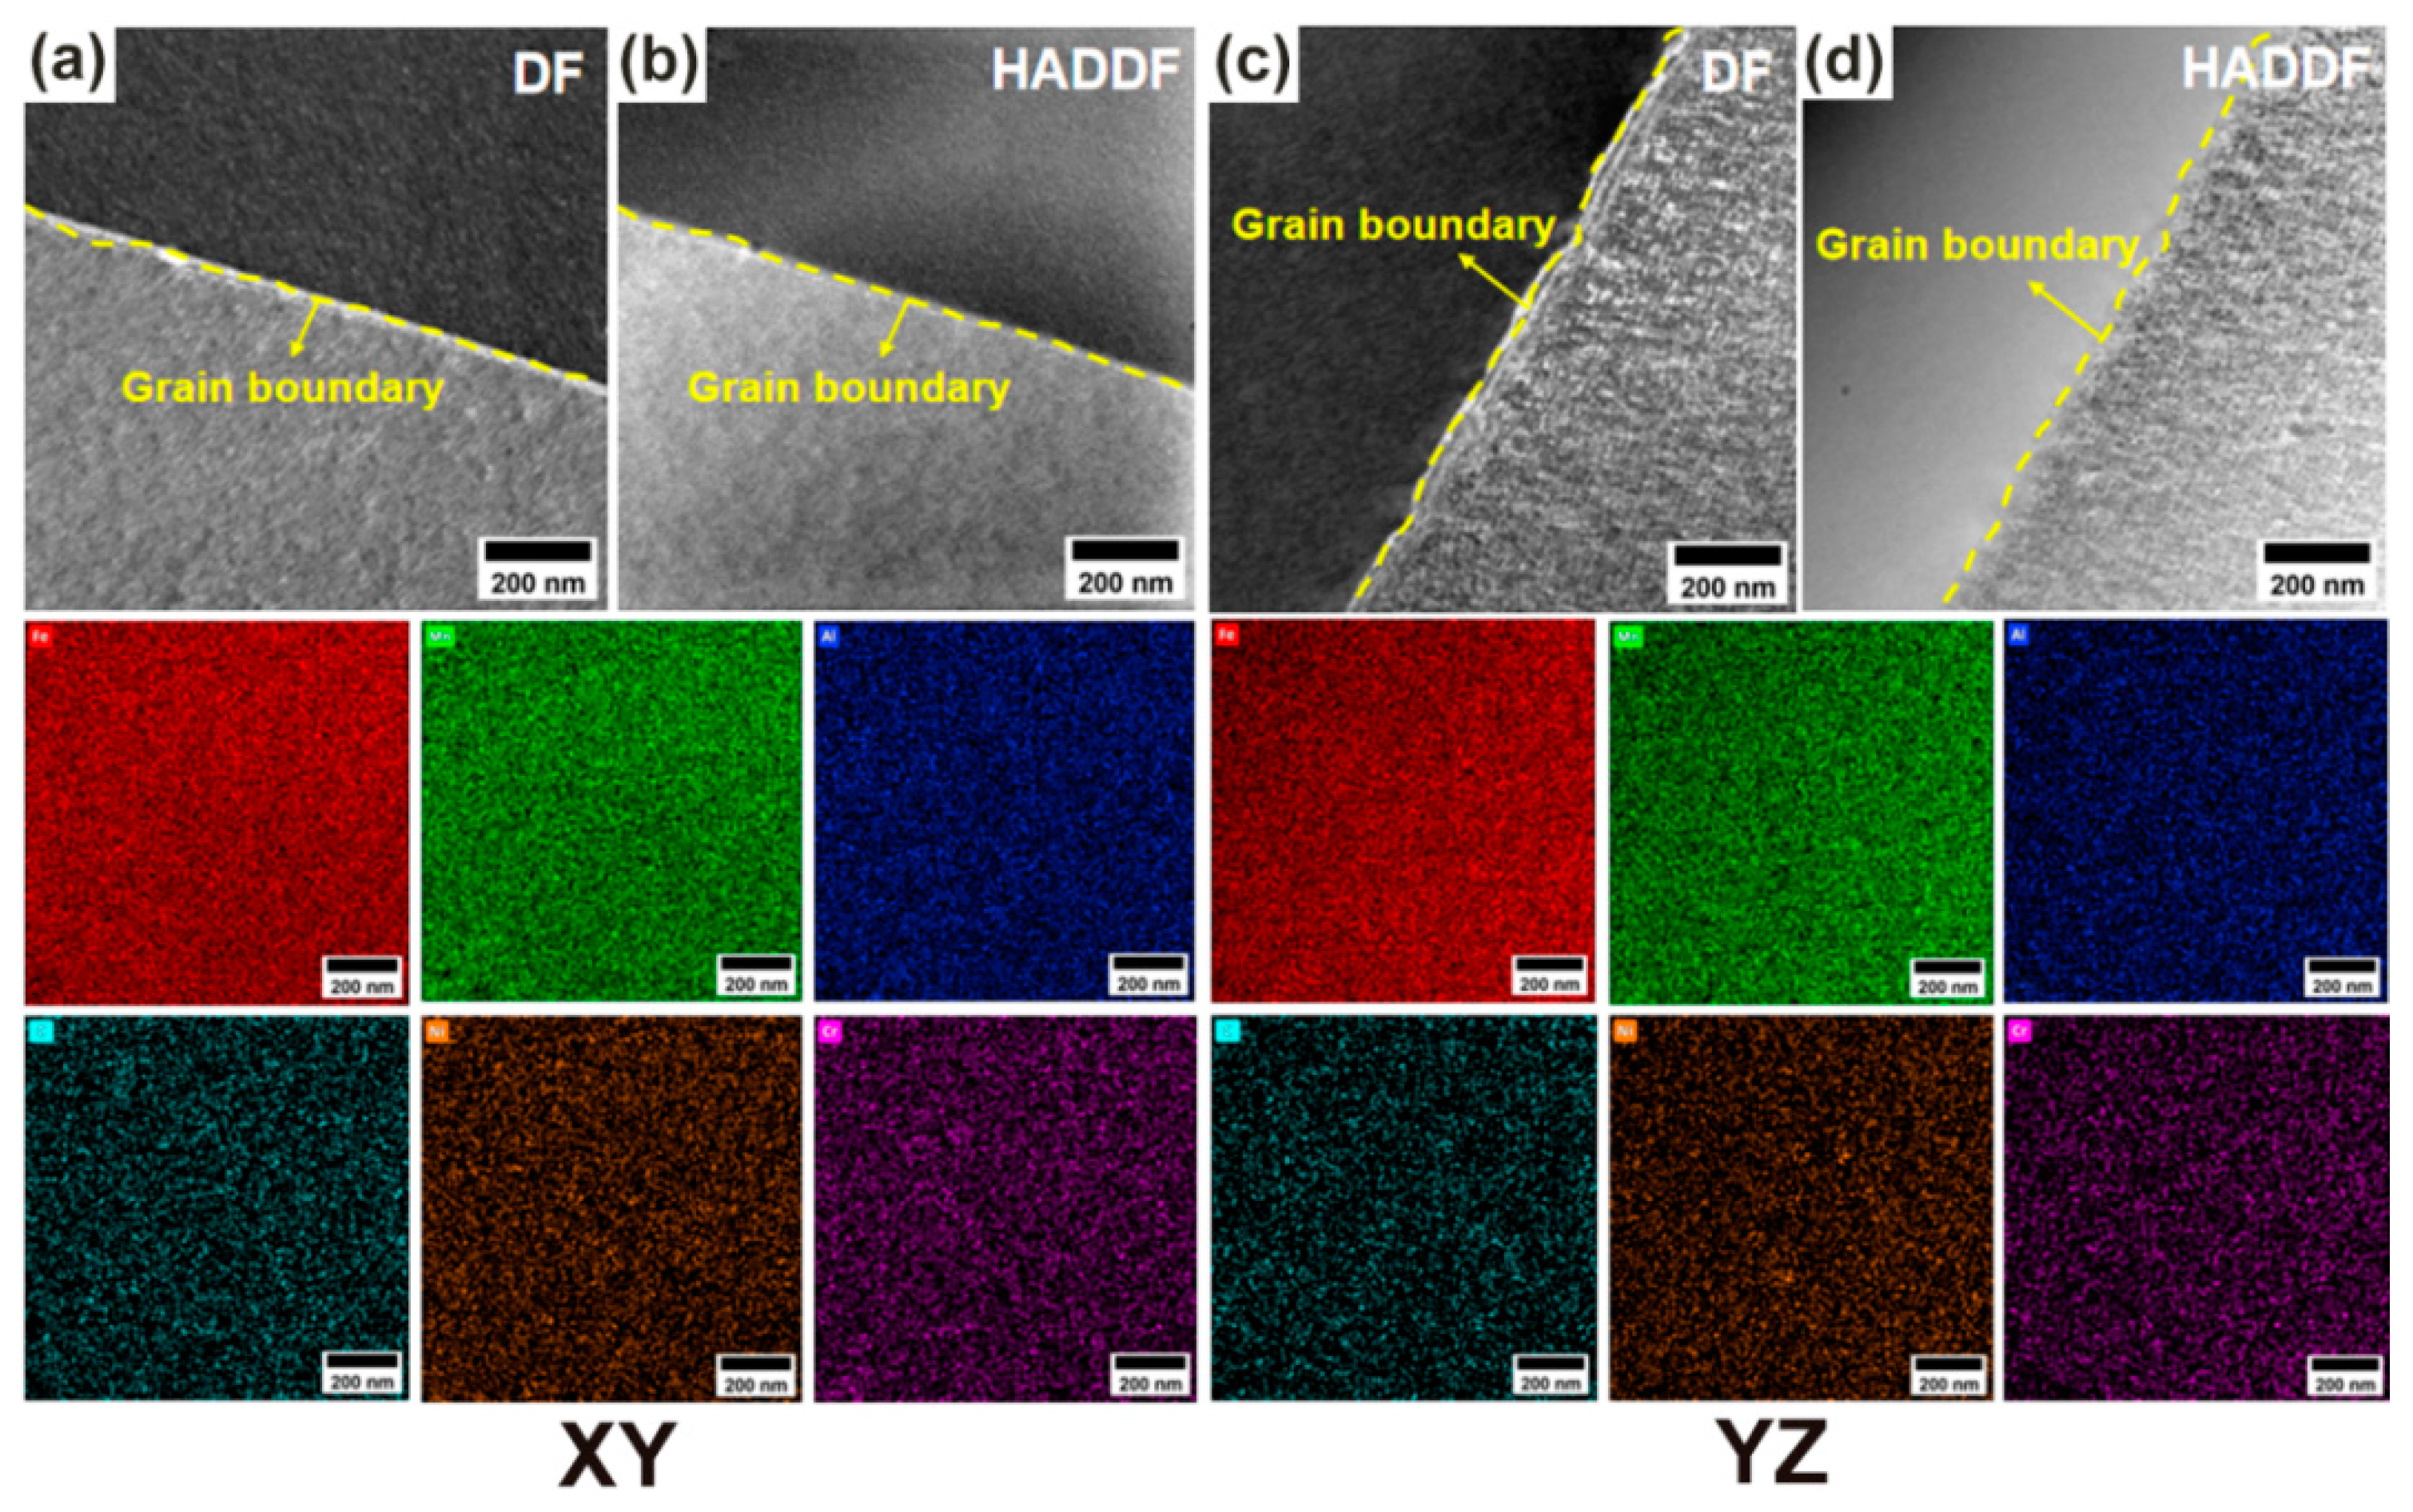
Figure 18 shows the TEM characterization of the microstructure at the grain boundaries of the lightweight steel formed by SLM after solution treatment at 1150 °C for 1 h on the XY and YZ planes of the sample. From the dark field image and HAADF, it can be seen that there is no second-phase aggregation at the grain boundaries of the XY and YZ planes of the solution-treated sample at this temperature. This is because the solution temperature of 1150 °C exceeds the κ-carbide dissolution temperature and the B2 phase solid solubility line. The rapid migration of the grain boundaries removes the residual solutes, and the sudden drop in the grain boundary energy inhibits the driving force for segregation, completely eliminating the second-phase aggregation at the grain boundaries.

3.4. Evolution of Matrix Microstructure Morphology

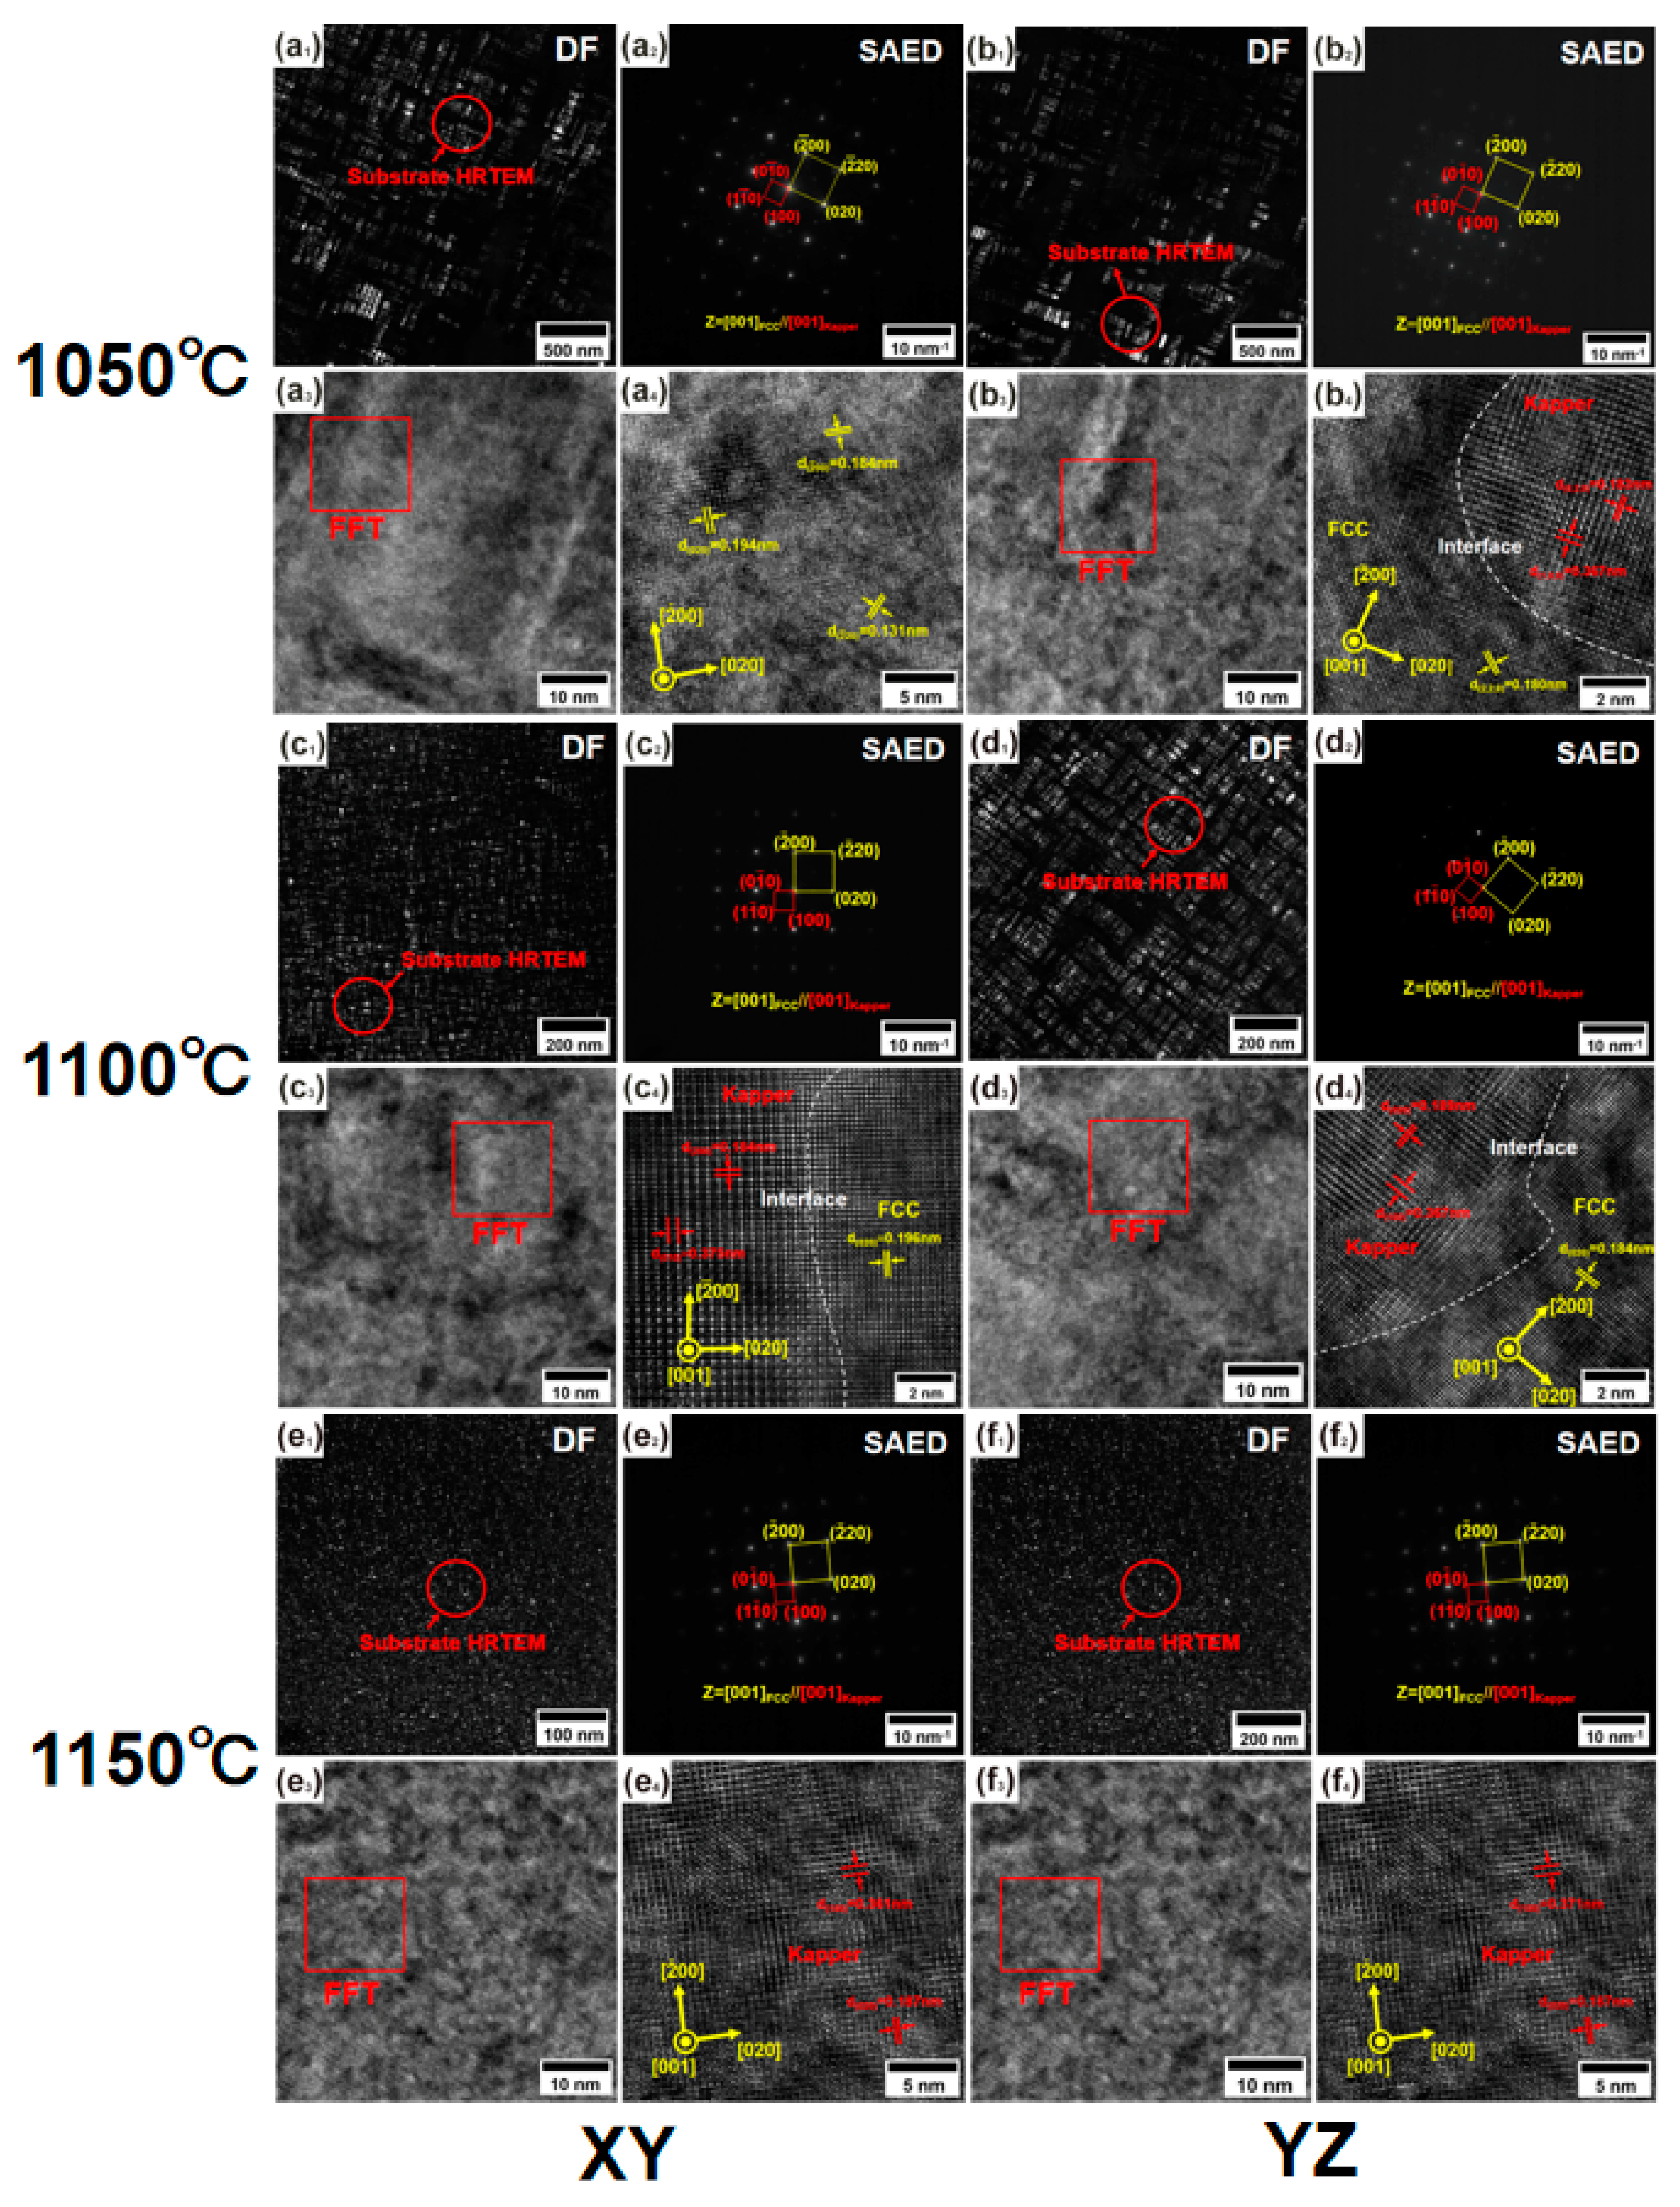
Figure 19(a1–a4) and Figure 19(b1–b4), respectively, show the TEM microstructure of the intragranular matrix of the XY and YZ planes of the sample after solution treatment at 1050 °C for 1 h. It can be seen from Figure 19(a1–a4) that the XY plane matrix of the sample is composed of γ-austenite matrix and κ-carbides. The dark field image shows that the κ-carbides in the γ-austenite matrix is distributed in a few strips along the <001> direction, and the SAED confirms the coherent relationship of [001]γ//[001]κ. The measured interplanar spacing of the austenite in the high-resolution image is d(−2, 0, 0) = 0.184 nm (theoretical value 0.182 nm, with 1.1% expansion), d(0, 2, 0) = 0.194 nm (theoretical value 0.182 nm, with 6.6% expansion), and d(−2, 2, 0) = 0.131 nm (theoretical value 0.182 nm, with 1.1% expansion). The abnormal expansion of the {020} crystal plane within this plane dominates the strain, confirming that the strip-shaped κ-carbides applies a transverse tensile stress on the XY plane, inducing preferential deformation of the matrix lattice along the [010] crystal direction. It can be seen from the microstructure of the YZ plane matrix shown in Figure 19(b1–b4) that the κ-carbides in the dark field image is still distributed in a strip-like morphology, but the κ-carbide phase spots in the SAED are significantly enhanced. In the high-resolution image, the austenite d(2, 2, 0) = 0.180 nm (theoretical value 0.182 nm, with 1.1% contraction), and the measured κ-carbides d(0, 2, 0) = 0.183 nm (theoretical value 0.271 nm, with 32.5% contraction), while d(1, 0, 0) = 0.367 nm (theoretical value 0.384 nm, with 4.4% contraction). The severe contraction of the {020} κ-carbides and the microshrinkage of the {220}γ phase in this plane reveal that the thermal stress is concentratedly loaded on the κ-carbides along the deposition axis and the compressive strain is transferred to the adjacent austenite {220} plane through the coherent interface. In summary, the differences between the XY and YZ plane matrices confirm that the spatially oriented distribution of the strip-shaped κ-carbides locks the direction of thermal stress transfer, elongating the matrix along the long axis direction and compressing itself along the short axis direction, forming the core mechanism of mechanical anisotropy.
Figure 19(c1–c4) and Figure 19(d1–d4), respectively, show the TEM microstructure of the intragranular matrix of samples after solution treatment at 1100 °C for 1 h on the XY and YZ planes. As seen from Figure 19(c1–c4), in the dark field image on the XY plane, the typical microstructure of γ-austenite matrix and κ-carbides is observed, where the κ-carbides present a fine strip-like morphology and is uniformly distributed within the γ grains. SAED under the Z = [001]γ//[001]κ zone axis confirms the coherent relationship of the cubic lattice of the γ/κ two phases. High-resolution measurements show that the d(0, 2, 0) of the γ matrix {020} crystal plane is 0.196 nm (7.7% expansion from the theoretical value), while the d(2, 0, 0) of the κ-carbides {200} plane is 0.184 nm (4.2% contraction from the theoretical value) and the d(0, 1, 0) of the superlattice {010} plane is 0.375 nm (2.3% contraction from the theoretical value), indicating that the γ matrix is under tensile stress while the κ-carbides are under compressive distortion. As seen from Figure 19(d1–d4), in the dark field image on the YZ plane, the κ-carbides present a coarse strip-like morphology, larger than that on the XY plane. SAED under the same Z = [001]γ//[001]κ zone axis verifies the consistency of crystallographic orientation. High-resolution data reveal that the d(0, 2, 0) of the γ matrix {020} plane is 0.184 nm (1.1% contraction from the theoretical value), the d(0, 2, 0) of the κ-carbides {020} plane is 0.189 nm (1.6% contraction from the theoretical value), and the d(1, 0, 0) of the {100} plane is 0.367 nm (4.4% contraction from the theoretical value). Notably, the number of regularly arranged strip-like κ-carbides on the XY and YZ planes after solution treatment at 1100 °C is increased compared to that at 1050 °C.
The bidirectional proliferation of regularly arranged strip-like κ-carbides phases is attributed to the non-equilibrium phase transformation kinetics triggered by the temperature approaching the complete dissolution temperature of κ-carbides at 1100 °C [25]: the incomplete dissolution of undissolved κ-carbides at high temperature leaves cores as heterogeneous nucleation sites, while the rapid cooling process inhibits the equilibrium precipitation of equiaxed phases, forcing the κ-carbides to selectively epitaxially grow along the γ matrix {100} plane as strips. The interfacial size difference (YZ plane > XY plane) is driven by the residual anisotropy of the thermal stress field during deposition, with the Z-direction tensile stress promoting the preferential growth of κ-carbides along the direction perpendicular to the stress axis. However, despite the direction-dependent morphology of κ-carbides, no significant difference in macroscopic mechanical properties is observed between the XY and YZ planes, and the anisotropy is eliminated. This is because the difference in κ-carbides is at the nanoscale, and their lattice distortions are almost homogenized. Additionally, although the κ-carbides have size differentiation, the face density is approaching, combined with its nanoscale discrete distribution, which enables the thermal strain energy to be randomly dissipated at the nanocluster scale, blocking the formation of long-range ordered strain fields (phase distribution entropy increase effect). Finally, although the size of the κ-carbides is different on the XY and YZ planes, its size is smaller than the critical size for dislocation bowing, and the resistance for dislocation bypassing only depends on particle spacing. The decay length of the distortion field around the κ-carbides is extremely short, preventing the superposition of directional deformation into long-range strain and blocking the transmission of microscopic morphology differences to macroscopic properties.
Figure 19(e1–e4) and Figure 19(f1–f4), respectively, show the TEM microstructure of the intragranular matrix of samples after solution treatment at 1150 °C for 1 h in the XY and YZ planes. As seen from Figure 19(e1–e4), κ-carbides can still be observed in the dark field image of the XY plane, but unlike at 1100 °C, they are distributed diffusely. SAED under the Z = [001]γ//[001]κ zone axis confirmed the coherent relationship of the cubic lattice of the γ/κ two phases. High-resolution measurements revealed that the d(0, 2, 0) of the γ matrix {020} plane was 0.189 nm (5.5% expansion from the theoretical value), while the d(0, 1, 0) of the κ-carbides {010} plane was 0.371 nm (1.6% expansion from the theoretical value), and the d(0, 2, 0) of the {020} plane was 0.187 nm (2.4% expansion from the theoretical value). As seen from Figure 19(f1–f4), in the dark field image of the YZ plane, κ-carbides are also distributed diffusely, but their quantity is significantly greater than that in the XY plane. SAED analysis under the Z = [001]γ//[001]κ zone axis shows that the diffraction spots of κ-carbides in the YZ plane are brighter. High-resolution data reveal that the d(1, 0, 0) of the κ-carbides {100} plane is 0.371 nm (1.6% expansion from the theoretical value), and the d(0, 2, 0) of the {020} plane is 0.187 nm (2.2% expansion from the theoretical value). It can be seen that the expansion degree of κ-carbides in the XY and YZ planes after solution treatment at 1150 °C is greater than that at 1100 °C. This is due to the increase in temperature, which leads to more Al atoms being squeezed into the lattice during high-temperature solution treatment, but the lag in bulk diffusion results in an uneven distribution of Al within the grains in a short time, causing more severe local distortion.
From the perspective of macroscopic mechanical properties, although the number of κ-carbides in the XY and YZ planes after solution treatment at 1150 °C is different, anisotropy has not been re-generated. This is because the uniformity of coherent distortion and the purification at the grain boundaries have weakened the anisotropy. After solution treatment at 1150 °C, the tensile strength does not change much compared to 1100 °C, but the plasticity has decreased significantly. This is because the B2 phase at the grain boundaries is completely dissolved at 1150 °C, irreversibly losing the pinning inhibition ability of the B2 phase on grain boundary migration and the micro-region stress buffering function. At the same time, the intragranular κ-carbides have changed from the regular strip-like arrangement at 1100 °C to a diffuse distribution, forcing the dislocation cutting mechanism to dominate the plasticity process, inducing the early nucleation of microvoids and accelerated crack propagation, ultimately resulting in a decrease in tensile elongation compared to the peak state at 1100 °C. The essence of this plasticity degradation is the combined effect of the failure of the grain boundary constraint mechanism and the hardening of the intragranular deformation mode [26,27,28].
4. Discussion
The present study demonstrates that post-SLM solution treatment at 1100 °C for 1 h effectively eliminates the mechanical anisotropy of Fe–Mn–Al–C lightweight steel by homogenizing the grain morphology, phase composition, and second-phase precipitation behavior between the XY and YZ planes. These findings are consistent with earlier reports on solution-treated additively manufactured steels, where high-temperature holding promotes recrystallization and texture weakening. However, our results reveal two unique features that have not been systematically addressed in previous works.
First, the anisotropic response is not solely governed by grain shape (columnar vs. equiaxed) or phase fraction, but is critically modulated by the spatial uniformity and distortion state of grain boundary second phases (κ-carbides and B2). At 1050 °C, the size and distribution of both phases differ significantly between the two planes, leading to directional strain partitioning and retained anisotropy. At 1100 °C, the coarsening of B2 and the refinement of κ-carbides into uniformly distributed fine strips suppress long-range ordered strain fields, effectively decoupling the microscopic morphological differences from macroscopic property deviations. This mechanistic insight extends the classical view that simply equiaxing grains suffices for isotropy; it highlights the need for boundary-engineered precipitate control.
Second, the non-monotonic phase transformation on the YZ plane at 1150 °C (BCC content rising to 37.4% at 1 h and then dropping to 17.0% at 1.5 h) reveals a complex interplay between Al diffusion, Mn segregation kinetics, and reverse transformation, which has not been previously documented in SLM-formed lightweight steels. This oscillatory behavior suggests that the conventional thermodynamic equilibrium phase diagram alone is insufficient to predict phase evolution under non-equilibrium SLM conditions, and that the segregation gradient inherited from solidification plays a dominant role in determining the local transformation path.
Looking forward, several research directions merit further investigation. (1) In situ or high-temporal-resolution characterization (e.g., synchrotron XRD during heating) is needed to capture the transient dissolution–reprecipitation dynamics of κ-carbides and B2, especially at temperatures approaching the critical boundaries (∼1070 °C for B2 and ∼773 °C for κ-carbides). Such data would enable more accurate kinetic models that incorporate the effect of initial segregation and defect density. (2) The role of cooling rate after solution treatment—oil quenching was used here—should be systematically varied (e.g., air cooling, water quenching, or controlled furnace cooling) to determine whether the observed isotropy can be preserved or further optimized, and whether the size/morphology of intragranular κ-carbides can be tailored for enhanced ductility without sacrificing strength. (3) Thermomechanical processing (e.g., post-solution aging or cold rolling followed by annealing) could be explored to refine the grain size and promote additional precipitation strengthening, while maintaining the isotropic response achieved at 1100 °C. (4) Given that the optimal condition yields ultra-high elongation (∼40%) with tensile strength above 1150 MPa, fatigue and impact properties should be evaluated under both planar orientations to confirm the practical reliability of isotropically processed SLM components. (5) From a computational perspective, phase-field modeling coupled with CALPHAD databases could be employed to simulate the competitive growth of γ and α phases during solution treatment, explicitly accounting for the initial compositional gradients from SLM, thereby guiding the design of heat-treatment schedules tailored to specific build geometries and powder chemistries. Lastly, (6) the scalability of the present findings to other SLM-fabricated high-alloy steels (e.g., Fe–Mn–Al–C with varying Mn/Al ratios or minor additions of Ti/Nb) remains an open question; comparative studies would help establish a generalized framework for anisotropy elimination via boundary-phase engineering in additively manufactured lightweight steels. These future efforts will collectively bridge the gap between laboratory-scale optimization and industrial adoption, where both isotropic performance and process robustness are paramount.

5. Conclusions

To address the anisotropy of Fe-Mn-Al-C lightweight steel components after SLM processing and achieve batch stability and engineering service safety, this paper systematically investigated the evolution of the second-phase precipitation at the grain boundaries and the microstructure of the matrix of SLM-formed Fe-Mn-Al-C lightweight steel under different solution treatments, and the following conclusions were drawn:
(1)
The solution treatment temperature and holding time significantly affect the anisotropy of phase composition and grain morphology: After solution treatment at 1050 °C, the XY plane always maintains a single γ-FCC phase, while the YZ plane undergoes a γ→α phase transformation with increasing holding time, accompanied by the transition from columnar grains to equiaxed grains. When the temperature is raised to 1100 °C, the XY plane remains predominantly γ phase, whereas the α phase content on the YZ plane increases markedly. At 1150 °C, the α phase appears on both planes, but the differences in grain morphology and phase content between the two planes become more pronounced, indicating that the elimination of anisotropy relies on the synergistic control of temperature and time.
(2)
The evolution of grain boundary second phases (κ-carbides and B2 phase) is the key to eliminating anisotropy: At 1050 °C, both κ-carbides and B2 phase exist at the grain boundaries on the XY and YZ planes, with larger second-phase particles on the YZ plane, leading to significant mechanical anisotropy. After solution treatment at 1100 °C, the size and number of κ-carbides decrease, while the B2 phase coarsens via Ostwald ripening. The distribution of grain boundary second phases becomes more uniform, eliminating the long-range ordered strain field induced by thermal stress and thereby effectively suppressing anisotropy.
(3)
The morphology and lattice distortion of intragranular κ-carbides govern the evolution of mechanical anisotropy: At 1050 °C, κ-carbides on the XY plane exhibit a strip-like morphology along the <001> direction, inducing abnormal expansion of the {020} crystal plane; on the YZ plane, κ-carbides suffer severe compressive distortion, generating an anisotropic strain field. At 1100 °C, κ-carbides on both planes display a regular strip-like morphology with uniform distribution, and the degree of lattice distortion decreases and becomes consistent, inhibiting directional strain transfer and thus eliminating the directional dependence of mechanical properties.
(4)
An optimized solution treatment enables the simultaneous elimination of anisotropy and good mechanical properties: The optimal process is solution treatment at 1100 °C for 1 h. Under this condition, the tensile strengths of the XY and YZ planes are 1159.9 MPa and 1154.3 MPa, and the elongations after fracture are 40.2% and 41.4%, respectively, demonstrating high isotropy in both strength and ductility. Although solution treatment at 1150 °C completely dissolves the grain boundary second phases, the intragranular κ-carbides become diffusely distributed and the grain boundary constraint mechanism is lost, leading to a significant decrease in ductility. Therefore, the precise control of solution temperature and the time to achieve moderate coarsening and uniform distribution of second phases is the core strategy for regulating anisotropy in SLM-formed Fe-Mn-Al-C lightweight steel.

Author Contributions

Conceptualization, J.Z. and T.X.; methodology, J.Z., T.X. and C.F.; software, X.G. and W.J.; validation, C.W. and W.J.; Formal analysis, C.W.; Investigation, C.F., C.W. and X.G.; Resources, C.F.; data curation, X.G., J.Z. and C.W.; writing—original draft, J.Z. and T.X.; writing—review and editing, J.Z. and T.X.; Visualization, C.W. and X.G.; Project administration, C.F.; Funding acquisition, C.F. All authors have read and agreed to the published version of the manuscript.

Funding

This research received no external funding.

Data Availability Statement

The original contributions presented in this study are included in the article; further inquiries can be directed to the corresponding author.

Conflicts of Interest

Author Jiaxiang Zheng, Chuangliang Wu and Wei Jiang were employed by the company Chengdu Holy Aviation Science & Technology Co., Ltd. The remaining authors declare that the research was conducted in the absence of any commercial or financial relationships that could be construed as a potential conflict of interest.

References

  1. Zhao, C.; Song, R.; Zhang, L.; Yang, F.; Kang, T. Effect of annealing temperature on the microstructure and tensile properties of Fe–10Mn–10Al–0.7C lightweight steel. Mater. Des. 2016, 91, 348–360. [Google Scholar] [CrossRef] [Scilit]
  2. Wu, Z.Q.; Ding, H.; Li, H.Y.; Huang, M.L.; Cao, F.R. Microstructural evolution and strain hardening behavior during plastic deformation of Fe–12Mn–8Al–0.8C steel. Mater. Sci. Eng. A 2013, 584, 150–155. [Google Scholar] [CrossRef] [Scilit]
  3. Yang, M.X.; Yuan, F.P.; Xie, Q.G.; Wang, Y.D.; Ma, E.; Wu, X.L. Strain hardening in Fe–16Mn–10Al–0.86C–5Ni high specific strength steel. Acta Mater. 2016, 109, 213–222. [Google Scholar] [CrossRef] [Scilit]
  4. Zhang, L.; Song, R.; Zhao, C.; Yang, F. Work hardening behavior involving the substructural evolution of an austenite-ferrite Fe–Mn–Al–C steel. Mater. Sci. Eng. A 2015, 640, 225–234. [Google Scholar] [CrossRef] [Scilit]
  5. Herrmann, J.; Inden, G.; Sauthoff, G. Deformation behavior of iron-rich iron-aluminum alloy at low temperatures. Acta Mater. 2003, 51, 2847–2857. [Google Scholar] [CrossRef] [Scilit]
  6. Shao, C.W.; Zhang, P.; Liu, R.; Zhang, Z.J.; Pang, J.C.; Duan, Q.Q.; Zhang, Z.F. A remarkable improvement of low-cycle fatigue resistance of high-Mn austenitic TWIP alloys with similar tensile properties: Importance of slip mode. Acta Mater. 2016, 118, 196–212. [Google Scholar] [CrossRef] [Scilit]
  7. An, Y.F.; Chen, X.P.; Ren, P.; Cao, W.Q. Ultrastrong and ductile austenitic lightweight steel via ultra-fine grains and heterogeneous B2 precipitates. Mater. Sci. Eng. A 2022, 860, 144330. [Google Scholar] [CrossRef] [Scilit]
  8. Eskandari, M.; Zarei-Hanzaki, A.; Kamali, A.R.; Mohtadi-Bonab, M.A.; Szpunar, J.A. Strain hardening during hot compression through planar dislocation and twin-like structure in a lightweight high-Mn steel. J. Mater. Eng. Perform. 2014, 23, 3567–3576. [Google Scholar] [CrossRef] [Scilit]
  9. Falat, L.; Schneider, A.; Sauthoff, G.; Frommeyer, G. Mechanical properties of Fe–Al–M–C (M=Ti, V, Nb, Ta) alloys with strengthening carbides and Laves phase. Intermetallics 2005, 13, 1256–1262. [Google Scholar] [CrossRef] [Scilit]
  10. Zhang, J.L.; Jiang, Y.S.; Zheng, W.S.; Liu, Y.X.; Ahmed, A.; Gang, J.; Song, C.J.; Zhai, Q.J. Revisiting the formation mechanism of intragranular κ-carbide in austenite of a Fe-Mn-Al-Cr-C low-density steel. Scr. Mater. 2021, 199, 113836. [Google Scholar] [CrossRef] [Scilit]
  11. Zargaran, A.; Kim, H.S.; Kwak, J.H.; Kim, N.J. Effects of Nb and C additions on the microstructure and tensile properties of lightweight ferritic Fe–8Al–5Mn alloy. Scr. Mater. 2014, 89, 37–40. [Google Scholar] [CrossRef] [Scilit]
  12. Lu, Y.; Wu, S.; Gan, Y.; Zhang, S.; Guo, S.; Lin, J.; Lin, J. Microstructure, mechanical property and metal release of as-SLM CoCrW alloy under different solution treatment conditions. J. Mech. Behav. Biomed. Mater. 2015, 55, 179–190. [Google Scholar] [PubMed]
  13. Morita, T.; Oka, Y.; Tsutsumi, S.; Takesue, S.; Higuchi, N.; Sakai, H. Short-time heat treatment for Ti–6Al–4V alloy produced by selective laser melting. Mater. Trans. 2022, 63, 854–863. [Google Scholar] [CrossRef] [Scilit]
  14. Springer, H.; Raabe, D. Rapid alloy prototyping: Compositional and thermo-mechanical high throughput bulk combinatorial design of structural materials based on the example of 30Mn–1.2C–xAl triplex steels. Acta Mater. 2012, 60, 4950–4959. [Google Scholar] [CrossRef] [Scilit]
  15. Kunze, K.; Etter, T.; Geiger, F.; Cloots, M. Texture, microstructure and mechanical anisotropy in SLM processed superalloys. In Proceedings of the European Microscopy Congress 2016: Proceedings, Lyon, France, 28 August–2 September 2016; Wiley-VCH: Weinheim, Germany, 2016. [Google Scholar]
  16. Agius, D.; Kourousis, K.I.; Wallbrink, C.; Song, T. The influence of build direction on the plastic anisotropy of SLM Ti–6Al–4V subjected to strain-controlled cyclic loading. In Proceedings of the SES 2017 ASME-AMD Joint Conference, Chicago, IL, USA, 9–11 July 2017. [Google Scholar]
  17. Wang, H.; Jiang, P.; Yang, G.; Yan, Y. An investigation of the anisotropic mechanical properties of additive-manufactured 316L SS with SLM. Materials 2024, 17, 2017. [Google Scholar] [CrossRef] [Scilit] [PubMed]
  18. Jiang, Z.; Xu, P.; Liang, Y.; Liang, Y. Deformation effect of melt pool boundaries on the mechanical property anisotropy in the SLM AlSi10Mg. Mater. Today Commun. 2023, 36, 106879. [Google Scholar] [CrossRef] [Scilit]
  19. Lan, L.; Wang, W.; Cui, Z.; Hao, X.; Qiu, D. Anisotropy study of the microstructure and properties of AlCoCrFeNi2.1 eutectic high entropy alloy additively manufactured by selective laser melting. J. Mater. Sci. Technol. 2022, 34, 228–239. [Google Scholar] [CrossRef] [Scilit]
  20. Karnati, S.; Khiabhani, A.; Flood, A.; Liou, F.; Newkirk, J. Anisotropy in impact toughness of powder bed fused AISI 304L stainless steel. Mater. Des. Process. Commun. 2021, 3, 8. [Google Scholar]
  21. Wen, S.; Hu, H.; Zhou, Y.; Chen, Z.; Wei, Q.; Shi, Y. Microstructure and property of S136 mould steel fabricated by selective laser melting. J. Huazhong Univ. Sci. Technol. (Nat. Sci. Ed.) 2018, 46, 51–55. [Google Scholar]
  22. Pal, S.; Velay, X.; Saleem, W.; Rathore, M.F. Investigating the anisotropic effects on machining behavior and performance of as-built selective laser melting processed Ti6Al4V alloy. Prog. Addit. Manuf. 2025, 10, 7141–7153. [Google Scholar] [CrossRef] [Scilit]
  23. Liu, T.; Wang, Q.; Cai, X.; Pan, L.; Li, J.; Zong, Z.; Cheng, Z.; Tian, Z.; Luo, L.; Su, Y. Effect of laser power on microstructures and properties of Al–4.82Mg–0.75Sc–0.49Mn–0.28Zr alloy fabricated by selective laser melting. J. Mater. Res. Technol. 2022, 18, 3612–3625. [Google Scholar] [CrossRef] [Scilit]
  24. Dingye, Y.; Weixing, Z.; Yuli, M.B.H. Numerical prediction and experimental analysis of the anisotropy of laser powder bed fusion produced Ti–6Al–4V body-centered cubic lattice structure. J. Mater. Eng. Perform. 2023, 32, 2963–2972. [Google Scholar]
  25. Kim, T.S.; Lee, J.; Roh, Y.S.; Sung, J.H.; Lim, S.G. Influence of variation of aging heat treatment condition on phase transformation and mechanical properties of 15-5PH stainless steel. J. Korean Soc. Heat Treat. 2019, 32, 212–223. [Google Scholar]
  26. Kunze, K.; Etter, T.; Grässlin, J.; Shklover, V. Texture, anisotropy in microstructure and mechanical properties of IN738LC alloy processed by selective laser melting (SLM). Mater. Sci. Eng. A 2015, 620, 213–222. [Google Scholar] [CrossRef] [Scilit]
  27. Ishida, K.; Ohtani, H.; Satoh, N.; Kainuma, R.; Nishizawa, T. Phase equilibria in Fe–Mn–Al–C alloys. ISIJ Int. 1990, 30, 680–686. [Google Scholar] [CrossRef] [Scilit]
  28. Gutierrez-Urrutia, I.; Raabe, D. Influence of Al content and precipitation state on the mechanical behavior of austenitic high-Mn lightweight steels. Scr. Mater. 2013, 68, 343–347. [Google Scholar] [CrossRef] [Scilit]
Figure 1. (a) Schematic of the 3D printer; (b) SEM image of the Fe-Mn-Al-C lightweight steel powder and distribution characteristic of their diameter.
Metals 16 00801 g001
Figure 2. Phase formation as a function of temperature under equilibrium conditions.
Metals 16 00801 g002
Figure 3. SLM-formed Fe-Mn-Al-C lightweight steel solution heat-treatment process diagram.
Metals 16 00801 g003
Figure 4. XRD patterns of the XY plane of SLM-formed lightweight steel samples under different solution heat-treatment processes. (a) 2θ = 20°~90°; (b) 2θ = 42°~44°; (c) 2θ = 72°~74°.
Metals 16 00801 g004
Figure 5. XRD patterns of the YZ plane of SLM-formed lightweight steel samples under different solution heat-treatment processes. (a) 2θ = 10°~90°; (b) 2θ = 42°~44°; (c) 2θ = 72°~74°.
Metals 16 00801 g005
Figure 6. IPF and phase distribution maps of XY and YZ planes of 1050 °C solution-treated samples at different holding times. (a1a3): IPF map of the XY plane; (b1b3): IPF map of the YZ plane; (c1c3): Phase composition diagram of the XY plane; (d1d3): Phase composition diagram of the YZ plane.
Metals 16 00801 g006
Figure 7. IPF and phase distribution maps of XY and YZ planes of 1100 °C solution-treated samples at different holding times. (a1a3): IPF map of the XY plane; (b1b3): IPF map of the YZ plane; (c1c3): Phase composition diagram of the XY plane; (d1d3): Phase composition diagram of the YZ plane.
Metals 16 00801 g007
Figure 8. IPF and phase distribution maps of XY and YZ planes of 1150 °C solution-treated samples at different holding times. (a1a3): IPF map of the XY plane; (b1b3): IPF map of the YZ plane; (c1c3): Phase composition diagram of the XY plane; (d1d3): Phase composition diagram of the YZ plane.
Metals 16 00801 g008
Figure 9. Stress–strain curves of SLM-formed lightweight steel under different solid solution heat-treatment processes. (a) 1050 °C; (b) 1100 °C; (c) 1150 °C.
Metals 16 00801 g009
Figure 10. TEM images of the microstructure morphology of the grain boundaries on the XY and YZ surfaces of the sample after solution treatment at 1050 °C for 1 h: (a) dark field image of the grain boundary on the XY surface; (b) HADDF image of the grain boundary on the XY surface; (c) dark field image of the grain boundary on the YZ surface; (d) HADDF image of the grain boundary on the YZ surface.
Metals 16 00801 g010
Figure 11. TEM micrographs of κ-carbides microstructure at grain boundaries on the XY and YZ planes of the sample after 1 h of solution treatment at 1050 °C: (a) bright-field image of grain boundaries on the XY plane; (b) SAED pattern of κ-carbides on the XY plane; (c) high-resolution image of κ-carbides on the XY plane; (d) partially magnified high-resolution image and FFT image of κ-carbides on the XY plane; (e) bright-field image of grain boundaries on the YZ plane; (f) SAED pattern of κ-carbides on the YZ plane; (g) high-resolution image of κ-carbides on the YZ plane; (h) partially magnified high-resolution image and FFT image of κ-carbides on the YZ plane.
Metals 16 00801 g011
Figure 12. Anti-FFT images of κ-carbides on the XY and YZ planes of the sample after solution treatment at 1050 °C for 1 h. (a) XY; (b) YZ.
Metals 16 00801 g012
Figure 13. TEM images of the microstructure of the B2 phase at the grain boundaries on the XY and YZ planes of the sample after 1 h of solution treatment at 1050 °C: (a) bright-field image of the grain boundary on the XY plane; (b) SAED image of the B2 phase on the XY plane; (c) high-resolution image of the B2 phase on the XY plane; (d) partially magnified high-resolution image and FFT image of the B2 phase on the XY plane; (e) bright-field image of the grain boundary on the YZ plane; (f) SAED image of the B2 phase on the YZ plane; (g) high-resolution image of the B2 phase on the YZ plane; (h) partially magnified high-resolution image and FFT image of the B2 phase on the YZ plane.
Metals 16 00801 g013
Figure 14. Anti-FFT images of B2 on the XY and YZ planes of the sample after solution treatment at 1050 °C for 1 h. (a) XY; (b) YZ.
Metals 16 00801 g014
Figure 15. TEM images of the microstructure morphology of the grain boundaries on the XY and YZ surfaces of the sample after solution treatment at 1100 °C for 1 h: (a) dark field image of the grain boundary on the XY surface; (b) HADDF image of the grain boundary on the XY surface; (c) dark field image of the grain boundary on the YZ surface; (d) HADDF image of the grain boundary on the YZ surface.
Metals 16 00801 g015
Figure 16. TEM micrographs of κ-carbides microstructure at grain boundaries on the XY and YZ planes of the sample after 1 h of solution treatment at 1100 °C: (a) bright-field image of grain boundaries on the XY plane; (b) SAED pattern of κ-carbides on the XY plane; (c) high-resolution image of κ-carbides on the XY plane; (d) partially magnified high-resolution image and FFT image of κ-carbides on the XY plane; (e) bright-field image of grain boundaries on the YZ plane; (f) SAED pattern of κ-carbides on the YZ plane; (g) high-resolution image of κ-carbides on the YZ plane; (h) partially magnified high-resolution image and FFT image of κ-carbides on the YZ plane.
Metals 16 00801 g016
Figure 17. TEM images of the microstructure of the B2 phase at the grain boundaries on the XY and YZ planes of the sample after 1 h of solution treatment at 1100 °C: (a) bright-field image of the grain boundary on the XY plane; (b) SAED image of the B2 phase on the XY plane; (c) high-resolution image of the B2 phase on the XY plane; (d) partially magnified high-resolution image and FFT image of the B2 phase on the XY plane; (e) bright-field image of the grain boundary on the YZ plane; (f) SAED image of the B2 phase on the YZ plane; (g) high-resolution image of the B2 phase on the YZ plane; (h) partially magnified high-resolution image and FFT image of the B2 phase on the YZ plane.
Metals 16 00801 g017
Figure 18. TEM images of the microstructure morphology of the grain boundaries on the XY and YZ surfaces of the sample after solution treatment at 1150 °C for 1 h: (a) dark field image of the grain boundary on the XY surface; (b) HADDF image of the grain boundary on the XY surface; (c) dark field image of the grain boundary on the YZ surface; (d) HADDF image of the grain boundary on the YZ surface.
Metals 16 00801 g018
Figure 19. TEM micrographs of the matrix of the samples after solution treatment at different temperatures for 1 h on the XY and YZ planes.
Metals 16 00801 g019
Table 1. Chemical composition of novel Fe-Mn-Al-C lightweight steel powder (wt%).
ElementMnAlCNiCrFe
weight ration
(wt%)
28.529.321.113.50.53Bal.
Table 2. Mechanical properties of lightweight steel formed by SLM under different solid solution heat-treatment processes.
SampleTS/MPaYS/MPaZ/%EL/%
1050 °C-0.5 h-XY1104.2997.521.222.6
1050 °C-1 h-XY1174.61058.930.931.2
1050 °C-1.5 h-XY1144.51005.238.637.1
1050 °C-0.5 h-YZ1128.11014.335.634.3
1050 °C-1 h-YZ1116.51008.937.236.8
1050 °C-1.5 h-YZ1203.21082.539.738.2
1100 °C-0.5 h-XY1160.71062.830.229.6
1100 °C-1 h-XY1159.91055.540.241.3
1100 °C-1.5 h-XY1146.51016.340.440.7
1100 °C-0.5 h-YZ1168.91064.337.636.5
1100 °C-1 h-YZ1154.31049.341.442.5
1100 °C-1.5 h-YZ1119.61005.341.842.9
1150 °C-0.5 h-XY1198.41093.430.130.5
1150 °C-1 h-XY1153.11048.634.535.2
1150 °C-1.5 h-XY1155.61016.538.940.1
1150 °C-0.5 h-YZ1176.41083.635.236.1
1150 °C-1 h-YZ1151.11067.335.836.4
1150 °C-1.5 h-YZ1142.21007.934.835.6
Disclaimer/Publisher’s Note: The statements, opinions and data contained in all publications are solely those of the individual author(s) and contributor(s) and not of MDPI and/or the editor(s). MDPI and/or the editor(s) disclaim responsibility for any injury to people or property resulting from any ideas, methods, instructions or products referred to in the content.