Article

Plasma Transferred Arc Deposition of Ni–Cr–B–Si–WC Composite Coatings on Steel 45: Effect of Arc Current on Microstructure, Phase Composition, Hardness, and Tribological Performance for Roller Mill Roll Restoration


by
Aibek Shynarbek
1,2,*,
Zarina Satbayeva
1,
Duman Orynbekov
1,2,
Bauyrzhan Rakhadilov
3 and
Kuanysh Ormanbekov
1,2
1
Engineering Center, Non-Profit Joint-Stock Company, Shakarim University, Glinka Street, 20A, Semey 071412, Kazakhstan
2
Department of Bioengineering Systems, Shakarim University NPJSC, Glinka Street, 20A, Semey 071412, Kazakhstan
3
PlasmaScience LLP, Ust-Kamenogorsk 070000, Kazakhstan
*
Author to whom correspondence should be addressed.
Metals 2026, 16(6), 642; https://doi.org/10.3390/met16060642
Submission received: 20 April 2026 / Revised: 26 May 2026 / Accepted: 28 May 2026 / Published: 10 June 2026
(This article belongs to the Section Welding and Joining)

Abstract

Worn roller mill roll shafts made of Steel 45 require cost-effective surface restoration; plasma transferred arc (PTA) deposition of Ni–Cr–B–Si + WC composite coatings is a promising approach, yet the effect of arc current on coating quality remains insufficiently characterised for this substrate. Six coatings were deposited from PS-12NVK-01 powder (65 wt.% PG-10N-01 + 35 wt.% WC) at arc currents of 50–100 A on Steel 45 substrates using a ZTW3501DC PTA system; coatings were characterised by SEM, EDS mapping, XRD (HighScore Plus, PDF-2), Vickers microhardness profiling, and ball-on-flat tribological testing. EDS analysis revealed that compositional dilution increases from 18.1% at 60 A to 46.6% at 100 A; XRD identified WC + Cr3C2 + Ni3B + Ni2B + (Fe,Ni)γ at 50 A, transitioning through Cr7C3 + W2C dominance at 80 A to an Fe0.64Ni0.36 matrix at 100 A; and coating thickness peaked at 2.70 mm at 80 A. The 60 A coating yielded the highest surface hardness (887 ± 76 HV, >4× the substrate), the lowest specific wear rate (4.00 × 10⁻⁶ mm3/(N·m), ~22× lower than uncoated Steel 45), and minimum dilution (18.1%), identifying 60 A as the most favourable deposition current for the restoration of roller mill roll shafts under the process parameters employed.

1. Introduction

Roller mills constitute critical processing equipment in the agro-industrial sector, where roll shafts are subjected to intensive abrasive wear under sliding conditions and high radial loads during rotation in the bearing assemblies of the mill frame [1,2]. Degradation of the shaft surfaces leads to dimensional loss, increased radial clearance in the bearing unit, and ultimately unplanned downtime with significant economic consequences for flour and feed production facilities. Replacement of worn shafts with new components is costly and time-consuming; therefore, surface engineering approaches that enable restoration of damaged shafts in maintenance workshops while simultaneously enhancing wear resistance represent a strategically important research direction [3,4,5].
Among the available overlay welding technologies, plasma transferred arc (PTA) welding has emerged as one of the most versatile and controllable methods for depositing thick, metallurgically bonded hard coatings onto ferrous substrates [6,7]. The PTA process utilises a constricted plasma arc to melt a powder feedstock and the substrate surface simultaneously, producing coatings with low porosity (typically < 1%), high adhesion strength, and minimal oxidation compared with flame spraying or conventional gas-tungsten arc hardfacing [6,8]. The ability to precisely modulate arc current, traverse speed, powder feed rate, and gas flows enables the independent control of heat input and dilution, making PTA particularly suitable for depositing composite powders in which thermally sensitive reinforcing phases must be preserved [9,10].
Self-fluxing Ni–Cr–B–Si alloys reinforced with tungsten carbide (WC) particles represent a well-established material system for wear-critical applications [7,9]. The nickel-based matrix provides ductility, oxidation resistance up to 700 °C, and eutectic melting behaviour that facilitates fusing at relatively low temperatures, while the WC reinforcement contributes extreme hardness (>2400 HV) and abrasion resistance [9,11]. In the PS-12NVK-01 system investigated in the present work, the powder consists of 65 wt.% PG-10N-01 self-fluxing alloy and 35 wt.% WC, yielding deposited layers with hardness in the range of 40–62 HRC and excellent resistance to abrasive wear [7,11]. However, the behaviour of WC particles during PTA deposition is highly sensitive to thermal history: excessive heat input promotes dissolution and decarburisation of WC, leading to the formation of brittle W2C and η-carbide phases, reduced hardness, and deteriorated toughness [9,12]. A similar effect of increased heat input, leading to degradation of strengthening phases and reduced wear resistance, has been reported for PTA coatings in previous studies [13].
The substrate material selected in this investigation is Steel 45 (GOST 1050-2013 [14]), a medium-carbon structural steel widely used for the manufacture of roller mill roll shafts in agricultural processing equipment. Its nominal composition (0.42–0.50 wt.% C, 0.50–0.80 wt.% Mn, Fe balance) and ferritic–pearlitic microstructure in the normalised condition make it representative of the shaft material encountered in restoration and surface hardening practice. The moderate as-received hardness of Steel 45 (210–220 HV) and its susceptibility to softening in the heat-affected zone during overlay welding necessitate careful control of heat input during PTA deposition.
Arc current is the primary energy input variable in PTA welding and governs the thermal conditions experienced by both the powder stream and the substrate [10,15]. Increasing current raises the plasma temperature, accelerates powder melting, and deepens substrate penetration, thereby increasing dilution and potentially degrading the functional properties of the deposited layer [10,16]. Conversely, insufficient current results in poor inter-particle bonding, incomplete fusion at the coating–substrate interface, and elevated porosity [6,17]. Despite the recognised importance of current control, systematic studies correlating arc current with microstructural evolution and tribological response of Ni–WC coatings on structural steel substrates remain scarce in the open literature.
Several authors have characterised Ni–WC PTA coatings on carbon and tool steels and reported hardness values between 45 and 60 HRC at WC fractions of 30–40 wt.% [7,11]. Studies on current-dependent dilution in self-fluxing alloy systems have confirmed that dilution increases non-linearly with arc current and that an optimal process window exists where hardness and adhesion are jointly maximised [6,10,15,18,19]. Research on the tribological performance of PTA Ni–WC coatings under abrasive sliding conditions has demonstrated significantly improved wear resistance compared with uncoated carbon steel, with the specific wear rate strongly correlated with WC retention and microhardness distribution [6,20]. Nevertheless, the combined effect of current variation on phase stability and tribological performance of coatings deposited onto Steel 45 has not been systematically addressed [6,16,21,22].
The present work addresses this gap by investigating six PTA-deposited Ni–Cr–B–Si + 35 wt.% WC coatings produced at arc currents of 50, 60, 70, 80, 90, and 100 A on Steel 45 specimens with all other process parameters held constant. The coatings are characterised by SEM, EDS, and XRD to elucidate the effect of current on phase composition and elemental distribution, and by Vickers microhardness measurement and ball-on-flat tribological testing to quantify mechanical properties and sliding wear resistance. This test configuration was selected for comparative evaluation of the relative wear resistance of the coatings; full reproduction of the operating conditions of roll shafts in bearing assemblies is beyond the scope of the present work. The primary objective is to identify the deposition current that yields the most favourable combination of hardness and sliding wear resistance for the restoration of worn roller mill roll shafts made of Steel 45, thereby providing practical process recommendations for agricultural machinery maintenance workshops.

2. Materials and Methods

2.1. Substrate Material

Substrates were prepared from plates of structural carbon steel grade 45 (GOST 1050-2013 [14]) with dimensions of 50 mm × 25 mm × 7 mm. The nominal chemical composition of the steel is as follows: C 0.42–0.50 wt.%, Mn 0.50–0.80 wt.%, Si 0.17–0.37 wt.%, Cr ≤ 0.25 wt.%, Ni ≤ 0.25 wt.%, S ≤ 0.04 wt.%, p ≤ 0.04 wt.%, and Fe balance. The phase composition of the substrate, determined by X-ray diffraction analysis, corresponds to a ferritic structure (α-Fe, BCC), and the initial hardness of the substrate is 210–220 HV. Prior to coating deposition, the substrate surfaces were ground using SiC paper up to a grit size of 600, ultrasonically cleaned in acetone for 10 min, and then dried.

2.2. Powder Feedstock

As a feedstock material, PS-12NVK-01 powder was used, representing a mechanical mixture of 65 wt.% self-fluxing alloy PG-10N-01 (Ni–Cr–B–Si system) and 35 wt.% tungsten carbide (WC). The powder was sieved to a particle size fraction of 45–150 μm and dried at 120 °C for 2 h prior to deposition.
The chemical composition of the powder, determined by energy-dispersive X-ray spectroscopy (EDS), was as follows (normalized values, wt.%): Ni—32.4, W—19.5, Cr—10.7, Fe—8.0, Si—2.3, Co—2.1, and B—2.0. The powder particles exhibited a mixed morphology, consisting of spherical particles (self-fluxing component) and angular particles (WC), which is typical for mechanical mixtures of this type.

2.3. PTA Deposition System and Process Parameters

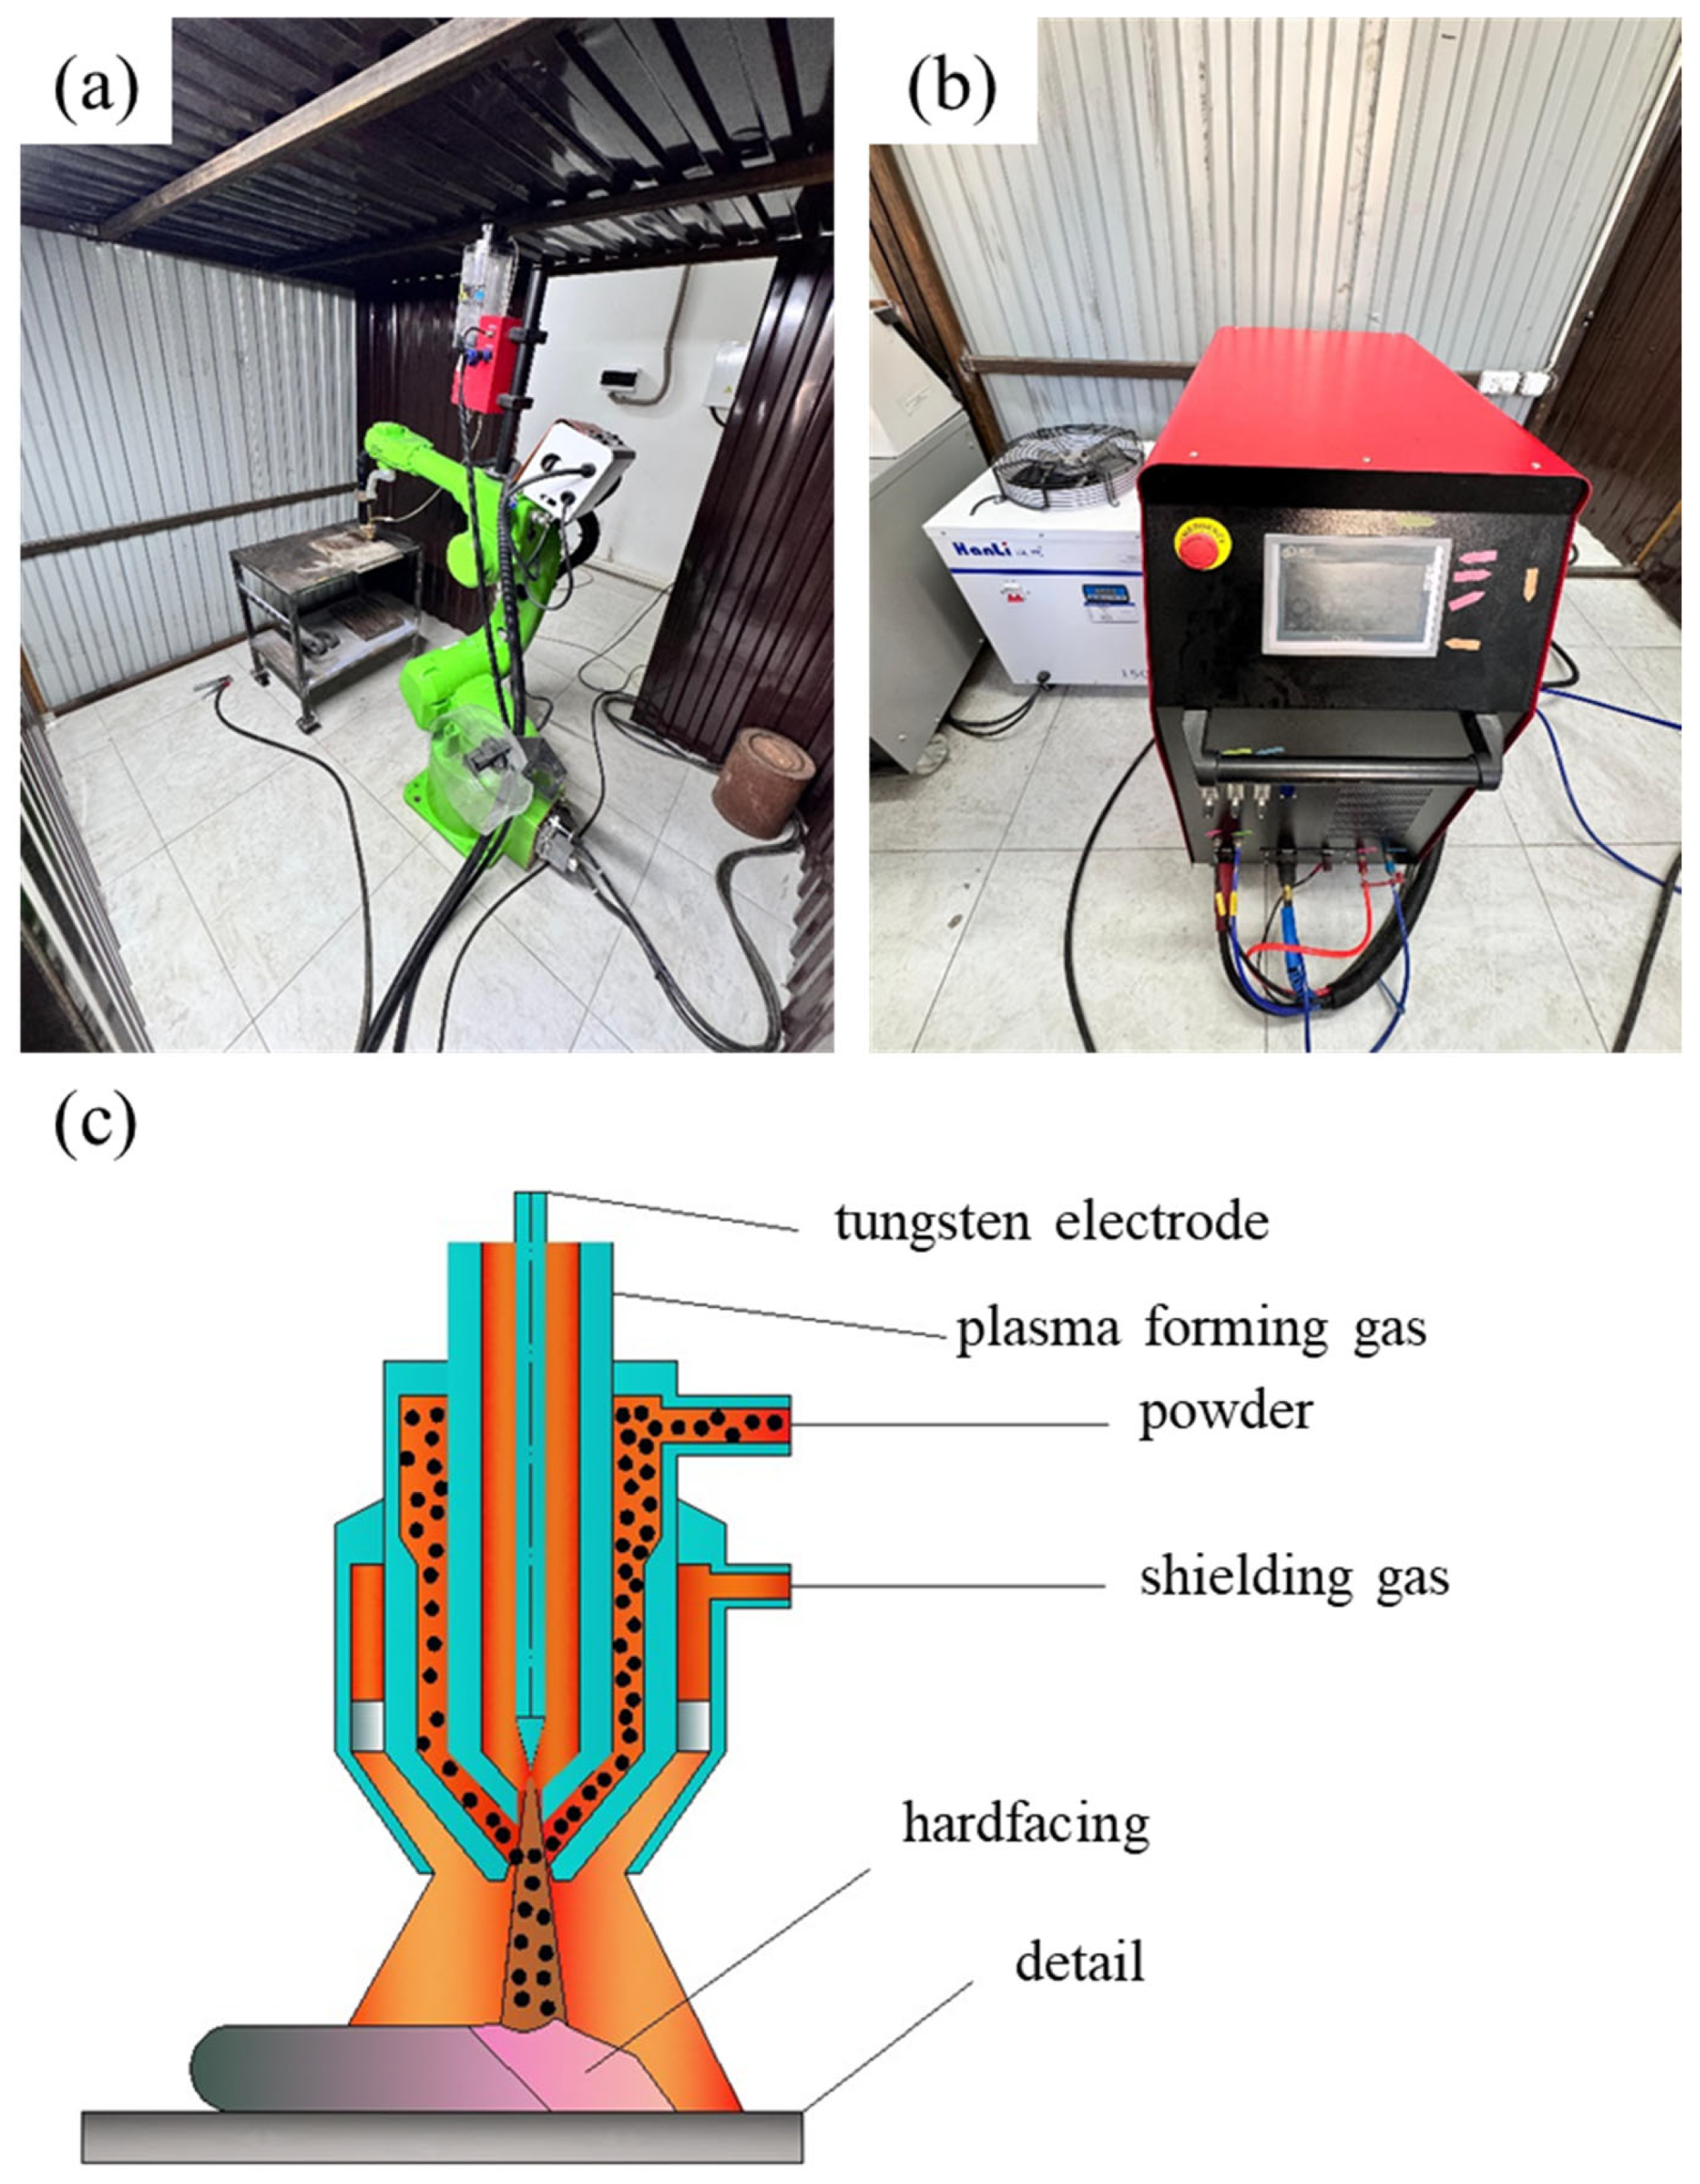
The cladding process was carried out using a plasma transferred arc (PTA) system ZTW3501DC (ZhenTuo Automatic Equipment (Shanghai) Co., Ltd., Shanghai, China) (Figure 1). The torch movement was controlled by a six-axis industrial robot SZHN. Six samples were produced by sequentially varying the arc current in the range of 50–100 A with a step of 10 A, while keeping all other process parameters constant. The constant parameters and the calculated heat input values are presented in Table 1.
The heat input Q was calculated using the following equation:
Q = η × U × I/υ,
where U is the arc voltage (V), I is the arc current (A), v is the cladding speed (mm/min), and η is the thermal efficiency coefficient of the PTA process, taken as 0.7.

2.4. Characterisation Methods

Metallographic Preparation. Cross-sectional samples were cut perpendicular to the cladding direction, mounted in epoxy resin, ground using SiC papers, and polished to a surface roughness of 1 μm using diamond suspension. To reveal microstructural features, the samples were etched in a 10% oxalic acid (H2C2O4) solution in distilled water for 15–30 s prior to microscopic examination.
Scanning Electron Microscopy and EDS Analysis. The microstructure of the coatings was examined using a SEM3200 scanning electron microscope (CIQTEK Co., Ltd., Hefei, China) at an accelerating voltage of 15 kV in secondary electron (SE) and backscattered electron composition (BSED-COMP) modes. Imaging was performed at magnifications of 30×, 100×, and 500×. The coating thickness was measured using cross-sectional images obtained on an SM-32 microscope (BSED-COMP detector, 15 kV).
The elemental composition of the coatings was determined by EDS mapping using a Bruker detector (Bruker AXS GmbH, Ettlingen, Germany) at an accelerating voltage of 15 kV and a working distance of 8.7 mm. Measurements were performed at a magnification of 100× to obtain a representative average composition of the entire coating and at 500× to analyze the local distribution of elements across the coating thickness. Since the samples were pre-etched with oxalic acid prior to EDS analysis, the obtained concentration values are considered semi-quantitative; however, the relative trends between samples are regarded as reliable.
X-ray Diffraction Analysis. The phase composition of the coatings was determined by X-ray diffraction (XRD) using Cu Kα radiation (λ = 1.5406 Å) on a Bruker D6 PHASER diffractometer (Bruker AXS GmbH, Ettlingen, Germany). The measurements were carried out in the 2θ range of 25–100° with a step size of 0.02° and a counting time of 0.8 s per step. Prior to analysis, the sample surfaces were ground to a flat state and ultrasonically cleaned to remove contaminants. Phase identification was performed by comparing the experimental interplanar spacings with reference data from the PDF-2 and ICSD databases. Due to significant peak overlap in this multicomponent system, the analysis is qualitative; phase identification is supported by EDS data.
Microhardness Measurements. Vickers microhardness was measured on polished cross-sections at a load of 2 N (HV0.2) with a step of approximately 100 μm along the coating thickness. Additional hardness measurements were performed on the polished coating surface (n = 7 indentations per sample).
Tribological Testing. Tribological properties were evaluated using a TRB3 tribometer (Anton Paar, Graz, Austria, serial number 1000097304) in a ball-on-flat reciprocating sliding configuration. A 100Cr6 steel ball with a diameter of 3.00 mm was used as the counterbody and was cleaned with ethanol before each test. The test parameters were as follows: normal load—10.00 N, sliding speed—3.00 cm/s, track radius—1.00 mm, total sliding distance—100 m, atmosphere—air at a temperature of 25.0–29.8 °C and relative humidity—26.6–32.9%. The specific wear rate K was calculated using the following equation:
K = V/(F × L),
where V is the wear volume (mm3), F is the normal load (N), and L is the sliding distance (m). The morphology of the wear tracks was examined by SEM in SE and BSED-COMP modes.

3. Results

3.1. Coating Microstructure

3.1.1. Overview Cross-Sectional Images

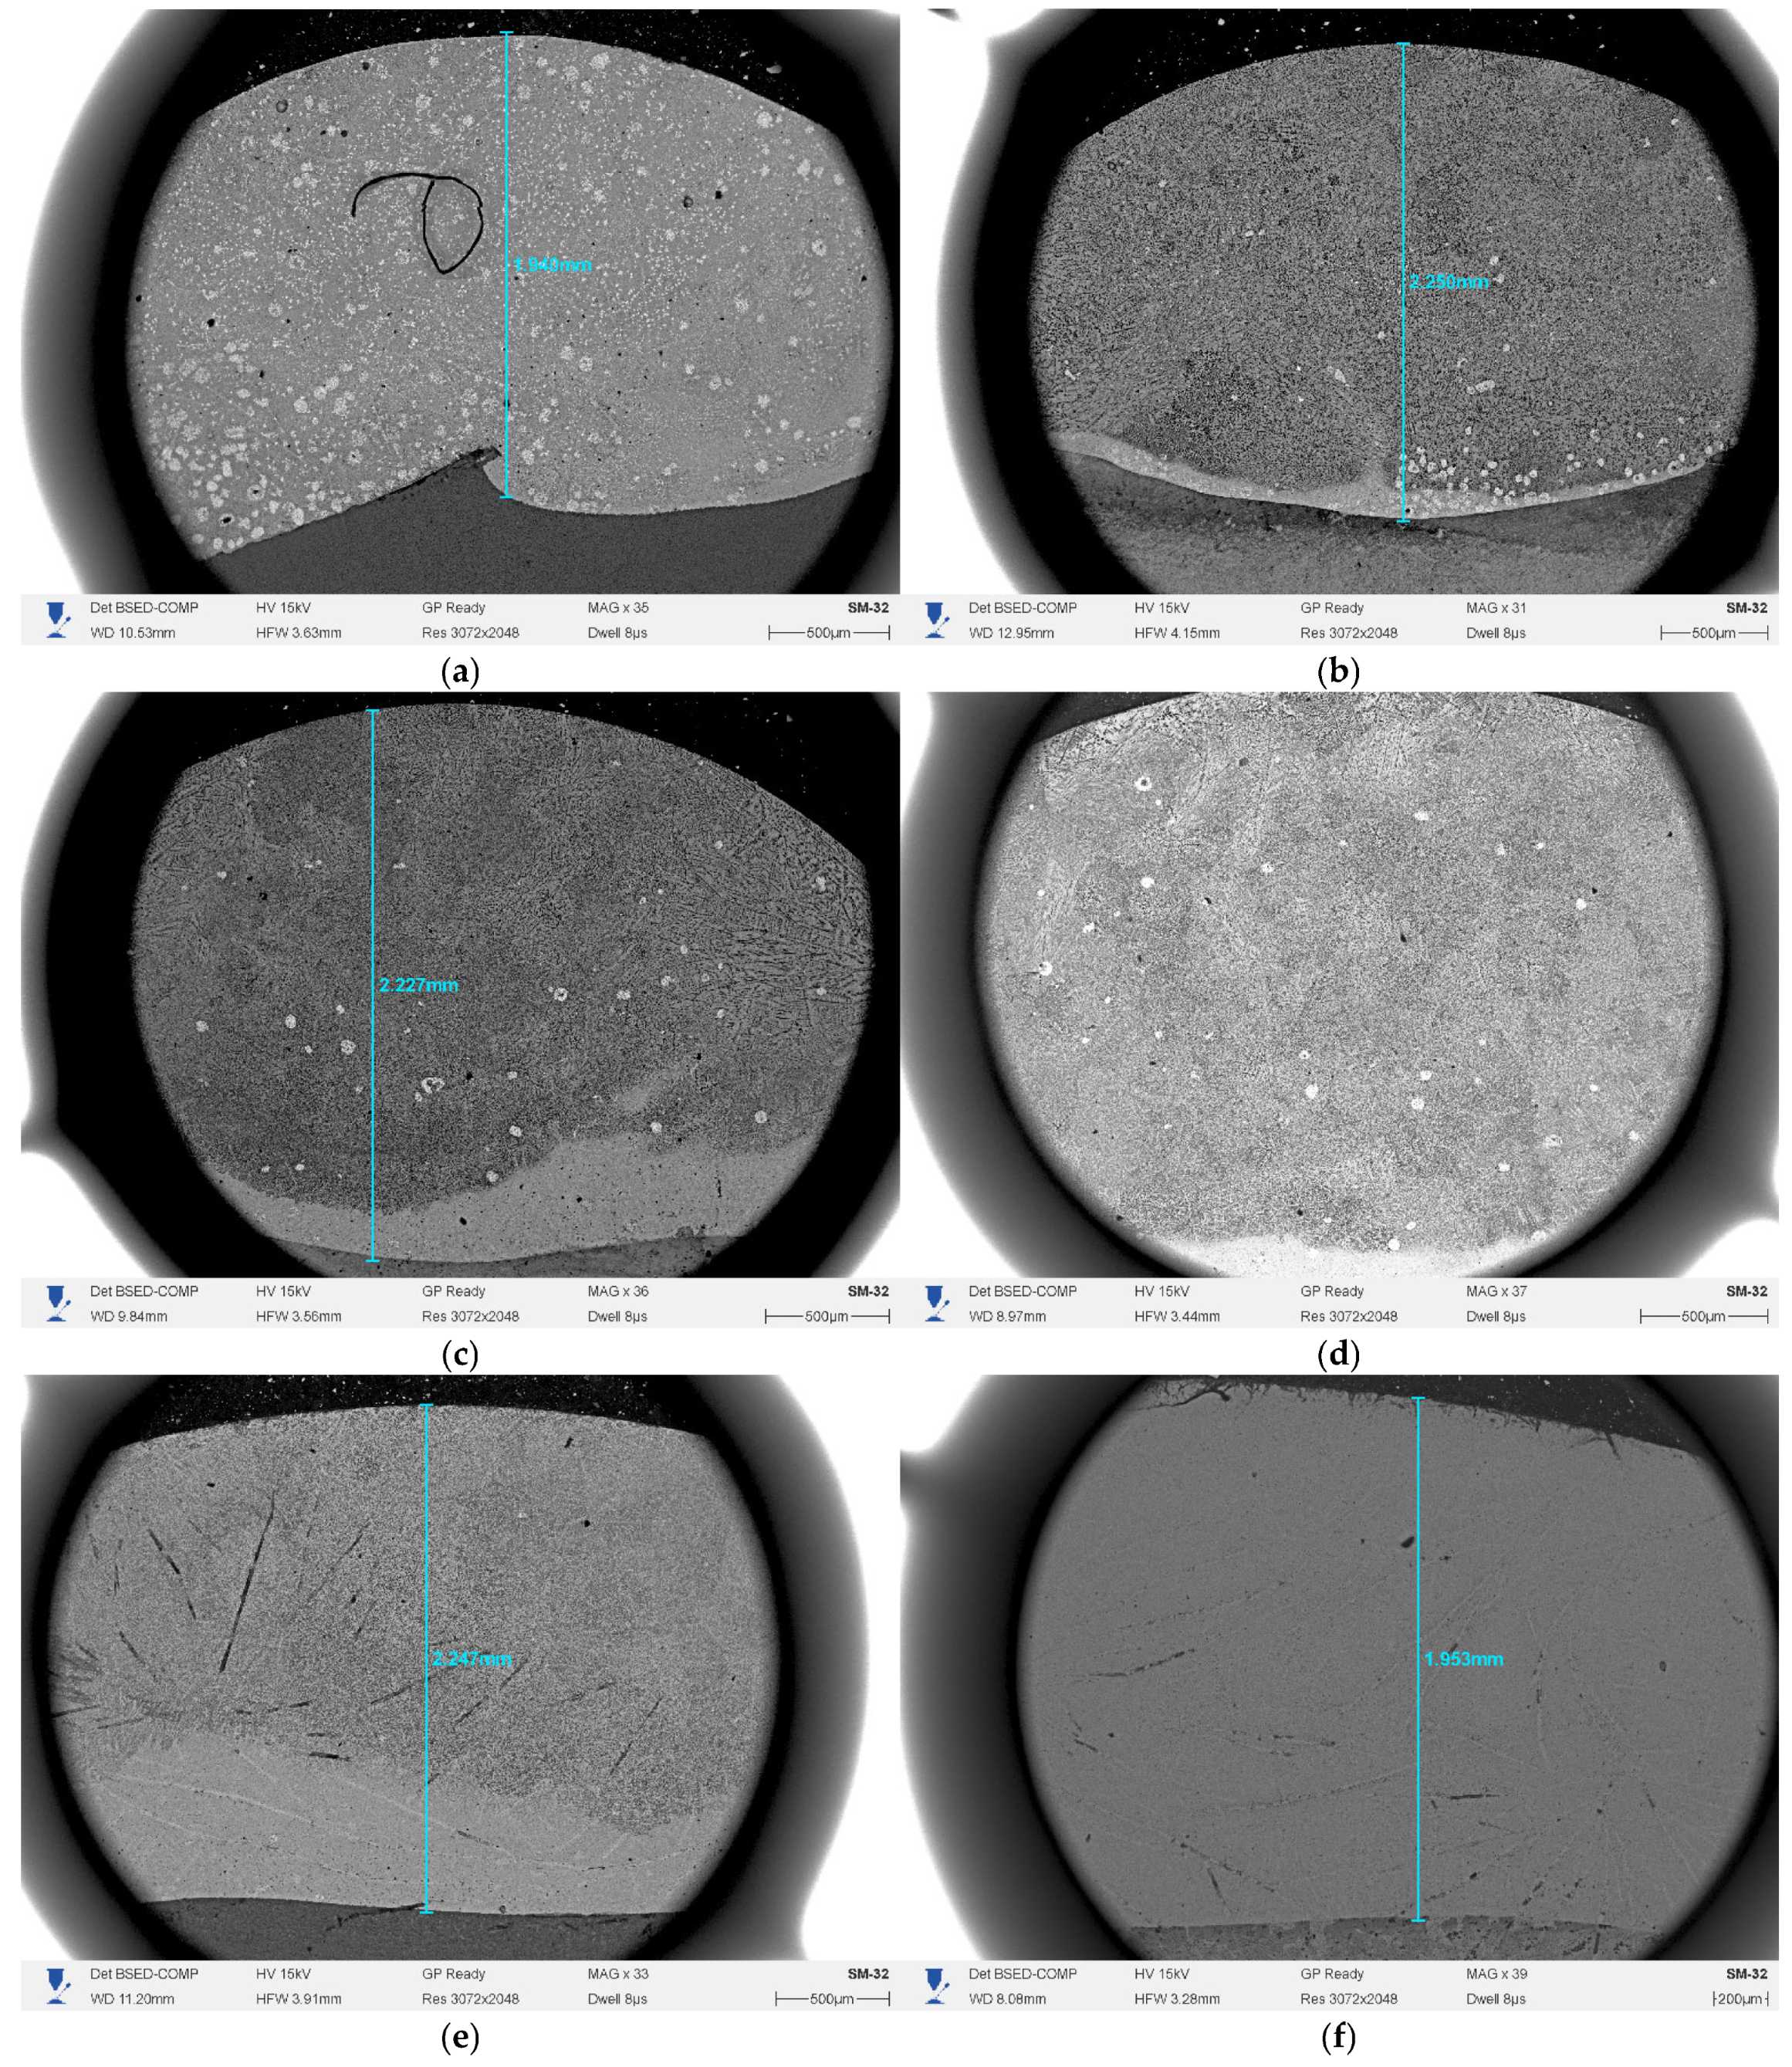
Figure 2 presents overview BSE images of the cross-sections of coatings S1–S6 obtained at magnifications of 30–40×. All coatings exhibit a characteristic semi-circular cross-sectional shape typical of single-pass PTA cladding [6,7]. The measured coating thickness increases with increasing arc current from 1.94 mm at 50 A to a maximum of 2.70 mm at 80 A, followed by a decrease to 1.95 mm at 100 A (Table 2). The coating/substrate interface is most clearly defined for samples S1 and S2 (50 and 60 A) and becomes more diffuse at currents of 90–100 A, which is qualitatively consistent with increased dilution from the substrate at higher heat input.

3.1.2. Microstructure at High Magnification

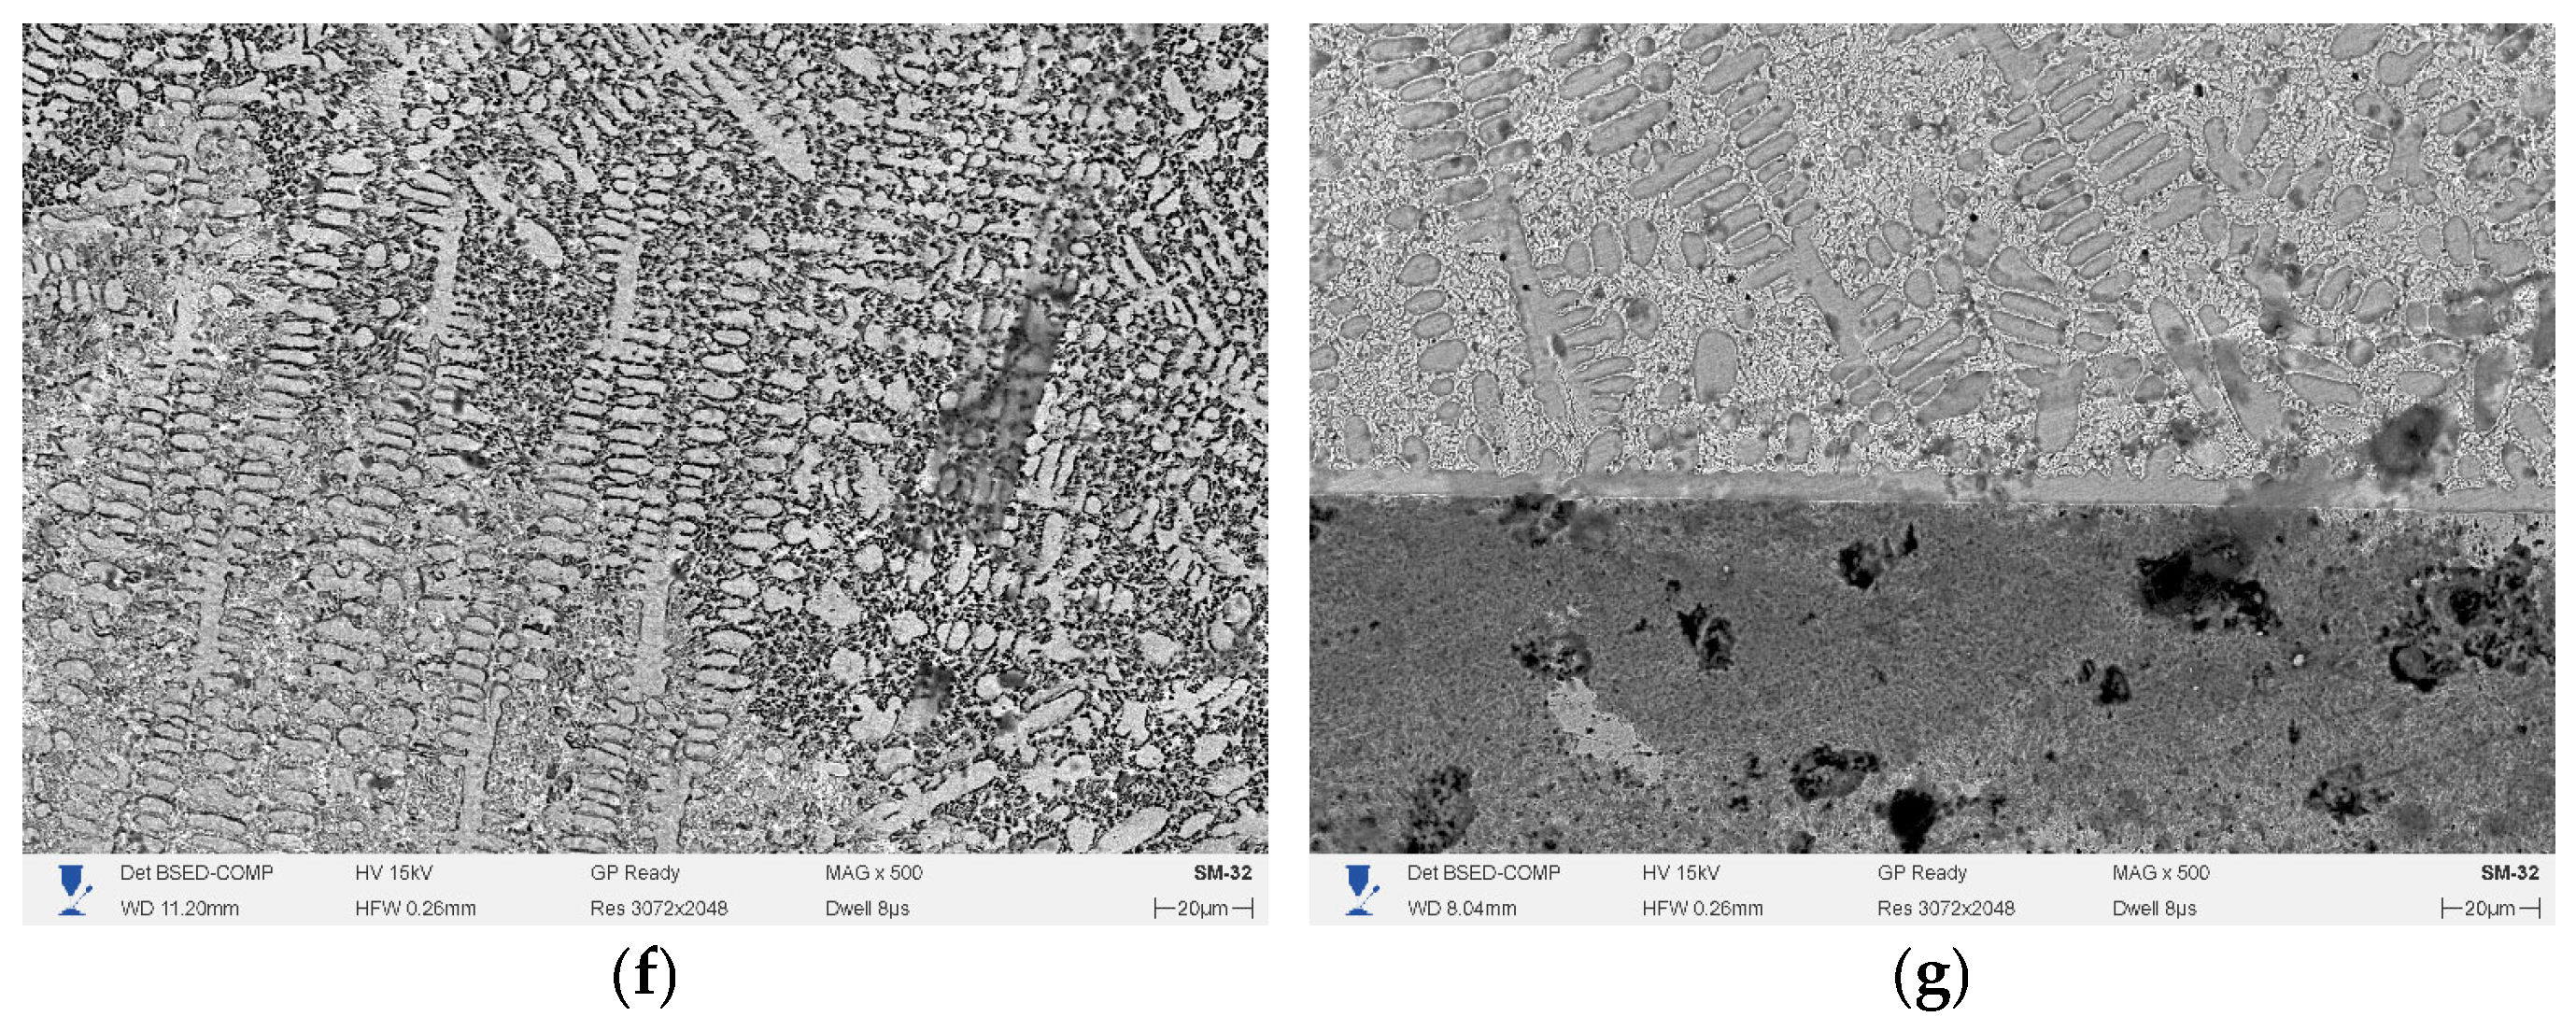
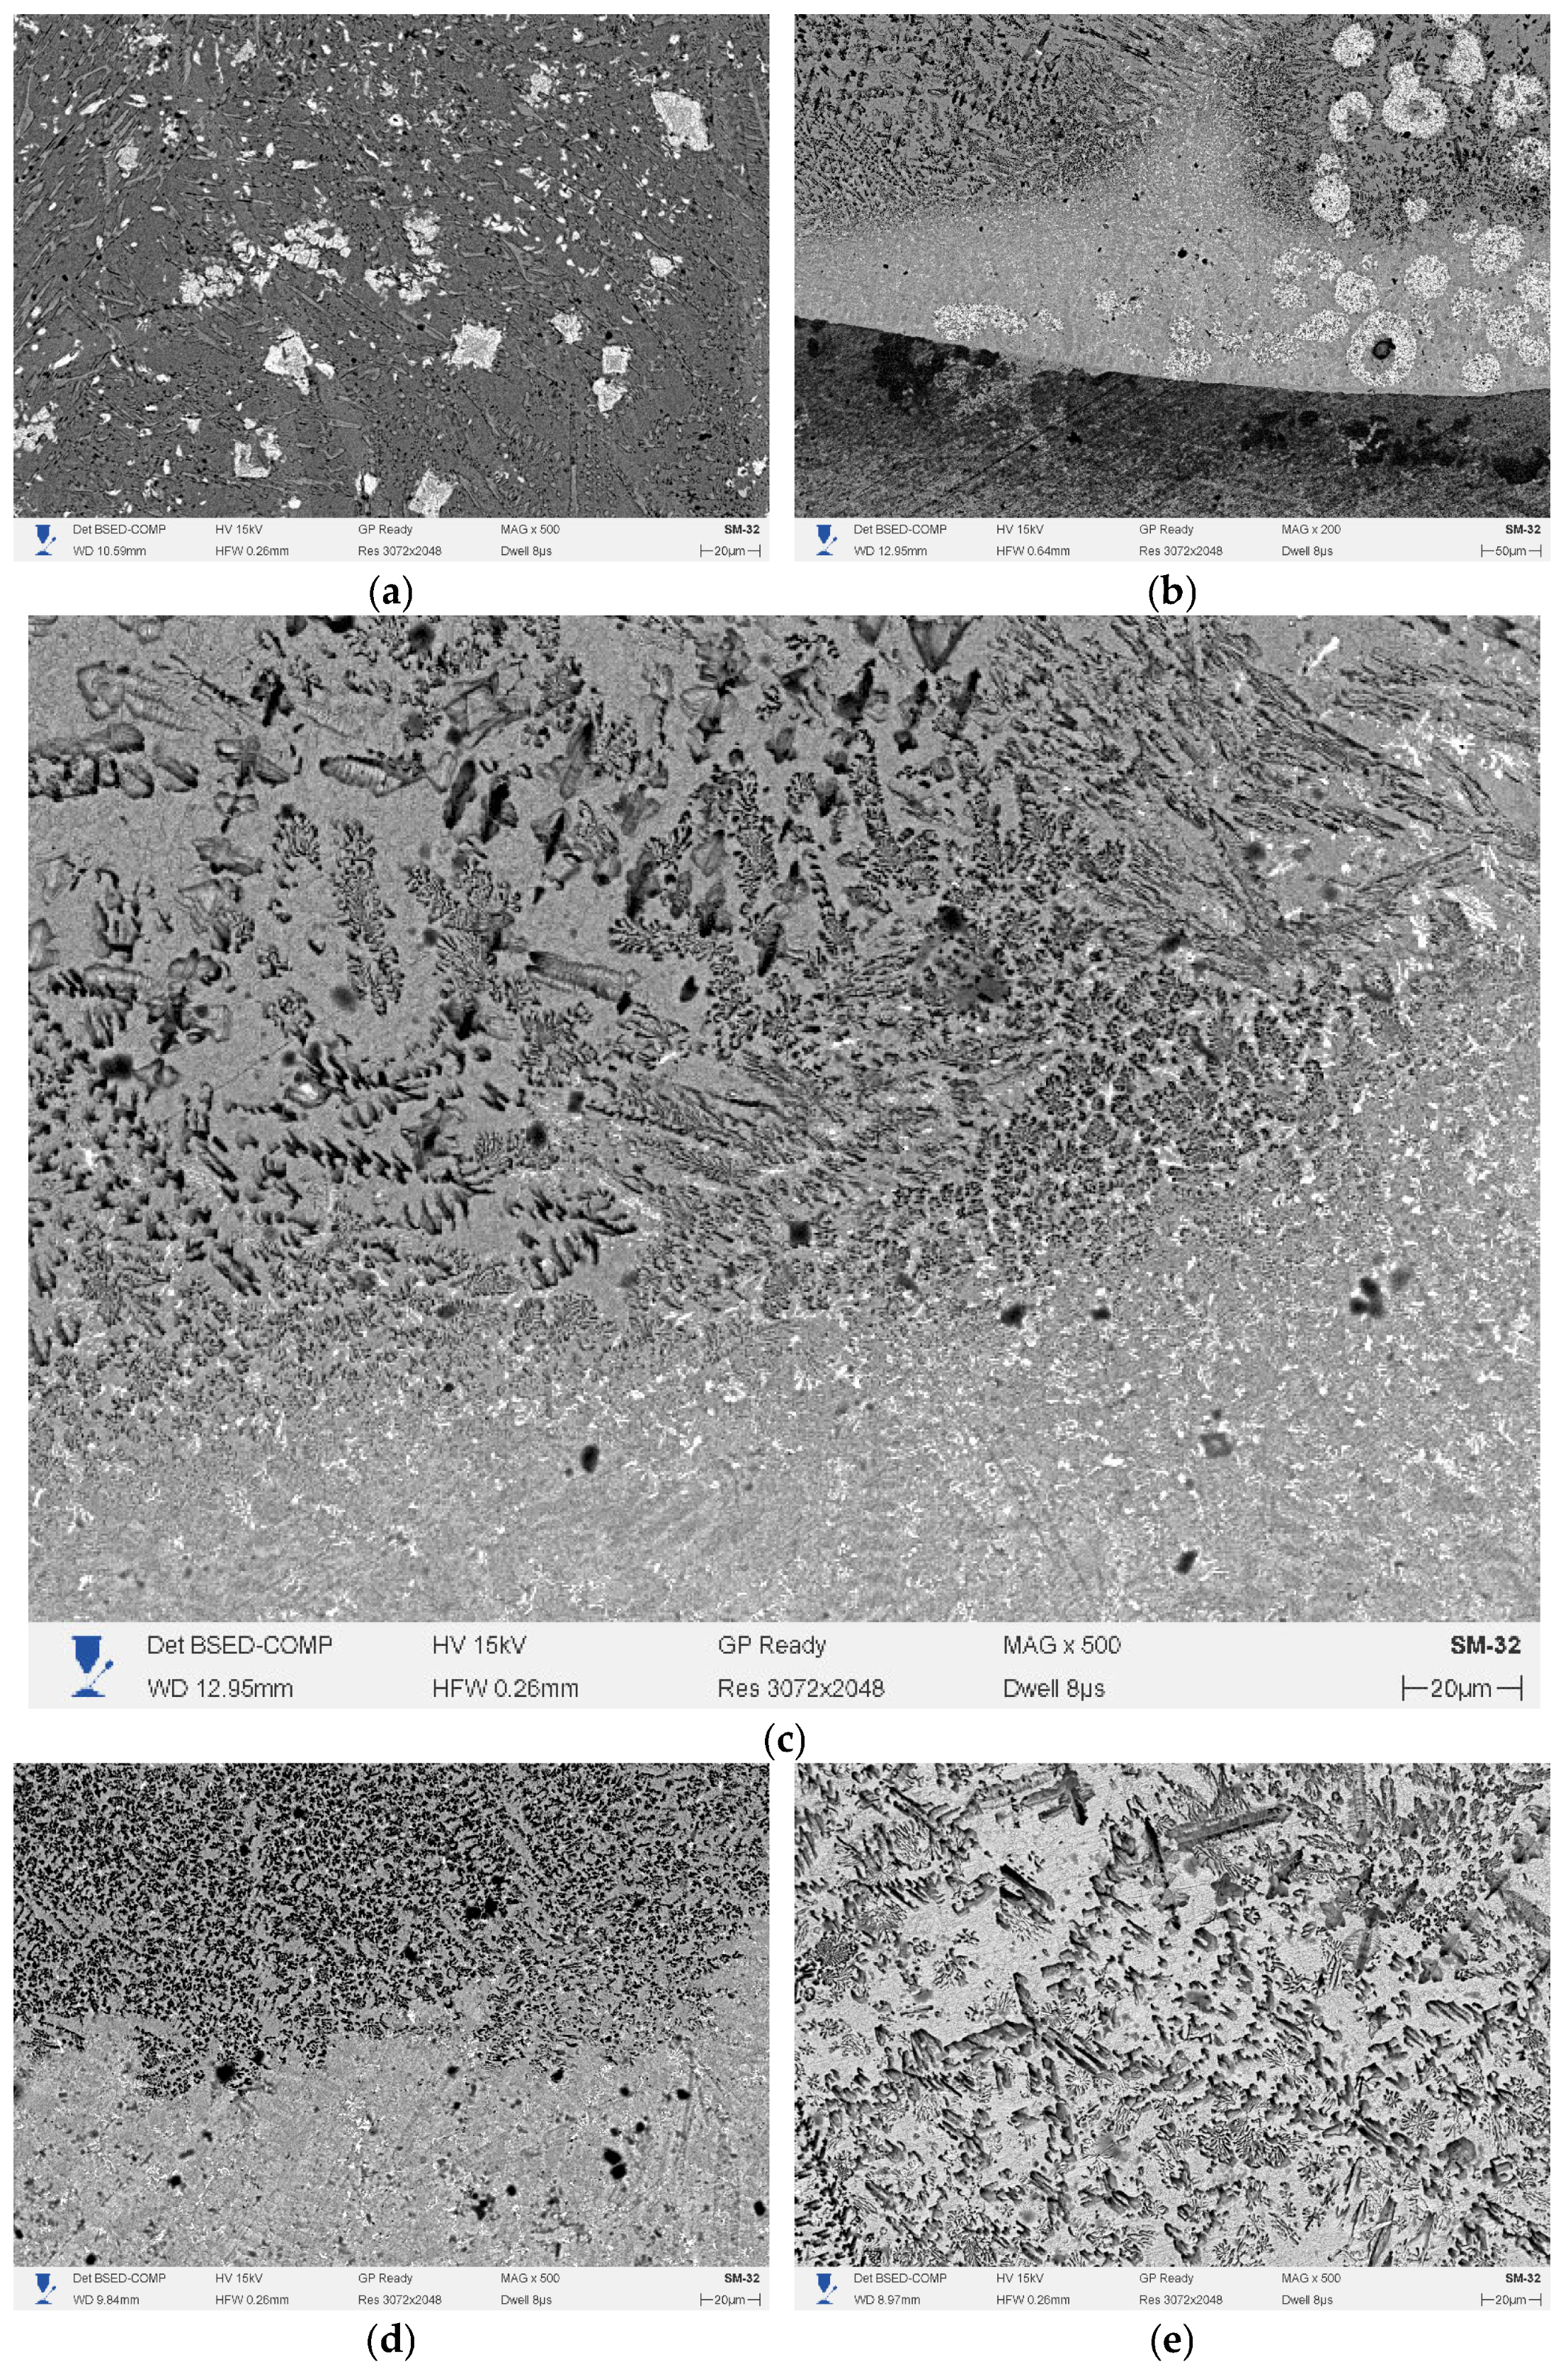
Detailed BSE micrographs at magnifications of 200–500× are presented in Figure 3a–g.
Sample S1 (50 A, Figure 3a). The coating matrix contains rounded and angular bright particles, corresponding in BSE contrast to phases with a high average atomic number. These particles are distributed non-uniformly, with a tendency to concentrate in the upper part of the coating, which is consistent with EDS data showing an increased W content in the top region (13.6 wt.%). The bright particles are identified as partially retained WC, as confirmed by XRD analysis. The matrix exhibits a relatively uniform gray BSE contrast with occasional dark pores.
Sample S2 (60 A, Figure 3b,c). At 200× magnification (Figure 3b), the coating/substrate interface exhibits a wavy morphology, and characteristic ring-like structures are observed near the interface, formed around partially dissolved WC agglomerates [23]. At 500× magnification (Figure 3c), a well-developed network of needle-like and plate-like precipitates is observed within the matrix, predominantly oriented along solidification directions. According to EDS and XRD data, these precipitates correspond to Ni2B, Ni3B, and Cr7C3 phases. The Ni content in the matrix reaches the highest value among all samples (51.9 wt.% by EDS), while the dilution level is minimal (18.1%). The microstructure of S2 is the most developed among all studied samples.
Sample S3 (70 A, Figure 3d). Bright particles with high BSE contrast are almost absent, which agrees with EDS data indicating a decrease in W content to 0.42 wt.% and XRD results showing no WC reflections. The matrix contains relatively coarse dark precipitates compared to S2, presumably corresponding to Cr7C3 and Cr3C2 according to XRD data.
Sample S4 (80 A, Figure 3e). The coating matrix contains characteristic snowflake-like precipitates of Cr-rich phases with well-defined crystallographic morphology. Bright WC particles are not observed, which is consistent with EDS (W = 0.74 wt.%) and XRD results. Based on combined EDS and XRD data, these precipitates are identified as Cr7C3, which becomes the dominant phase at this arc current [24,25,26].
Sample S5 (90 A, Figure 3f). A lamellar structure with alternating bright and dark regions is observed. The dark lamellae are presumably associated with Cr7C3 and Cr3C2 according to XRD data, while the brighter regions correspond to the (Fe,Ni)γ matrix. The Fe content in the coating reaches 45.5 wt.% (EDS), indicating significant dilution from the substrate.
Sample S6 (100 A, Figure 3g). The coating/substrate interface becomes diffuse and extended. The matrix exhibits a uniform gray BSE contrast with a minimal amount of secondary phase precipitates, which is characteristic of a high dilution level. According to EDS data, the Fe content reaches a maximum of 49.5 wt.%, while the Ni content decreases to 21.2 wt.%, indicating the predominance of an (Fe,Ni)γ solid solution in the coating matrix. This conclusion is supported by the identification of the Fe0.64Ni0.36 phase by XRD analysis.

3.2. Energy-Dispersive X-Ray Analysis of the Coatings

3.2.1. Overall Elemental Composition of the Coatings

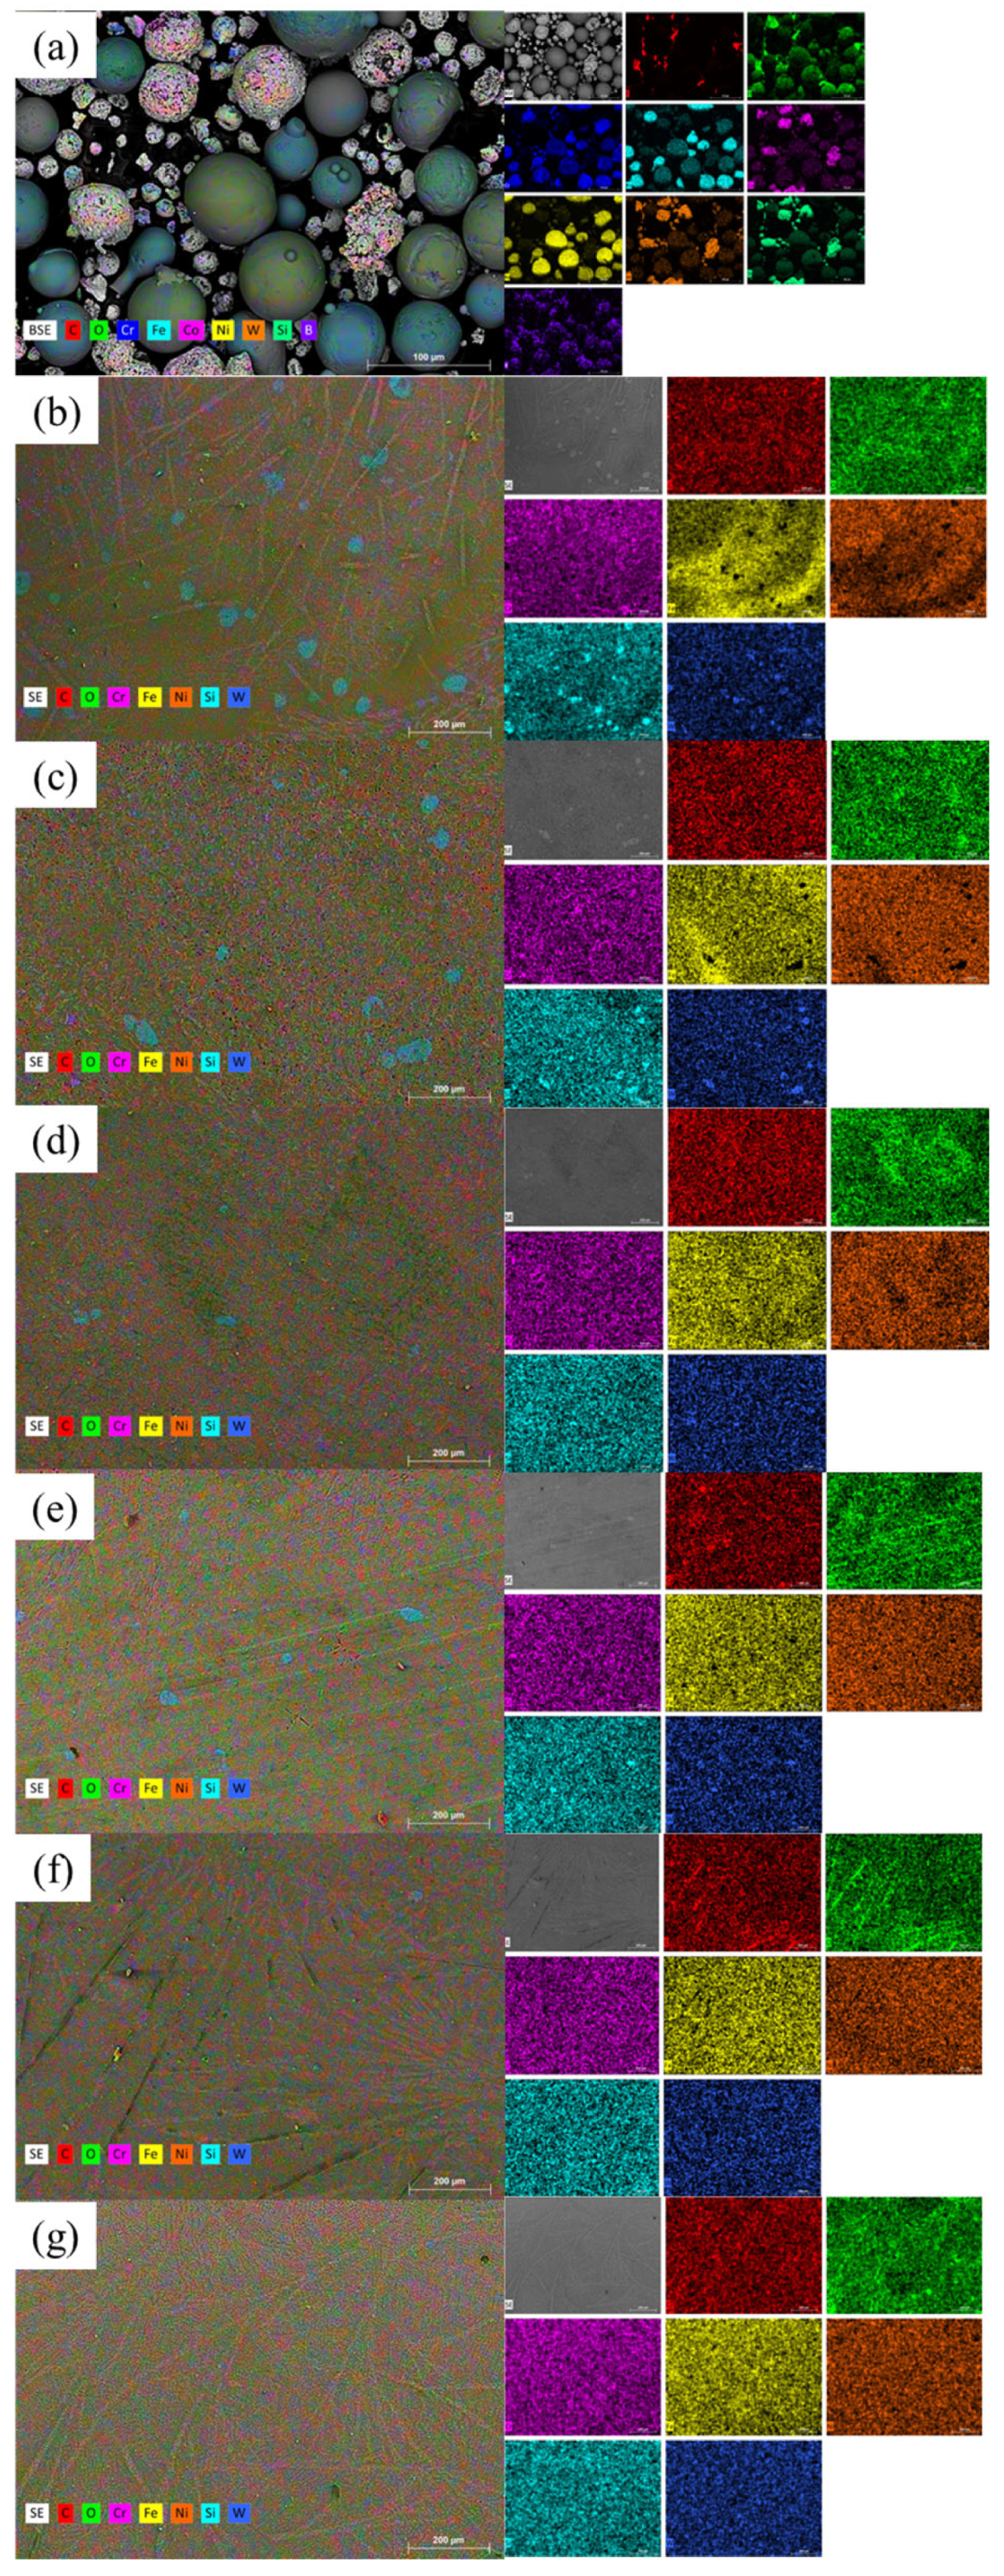
The elemental composition of coatings S1–S6 was determined by EDS mapping at a magnification of 100× to obtain a representative average composition over the entire cross-section. The results are presented in Table 3, while the elemental distribution maps are shown in Figure 4.
The dilution degree D was calculated based on the Fe content using the following equation:
D = F e c o a t F e p o w d e r F e s u b s t r a t e F e p o w d e r × 100 %
where Fecoat is the Fe content in the coating determined by EDS, Fepowder = 8.0 wt.% is the Fe content in the initial powder, and Fesubstrate = 97 wt.% is the Fe content in the substrate (steel 45).

3.2.2. Composition Evolution with Increasing Arc Current

Tungsten. The W content decreases monotonically from 6.9 wt.% at 50 A to 0.4–0.7 wt.% in the range of 70–80 A, indicating almost complete dissolution of the carbide phase into the coating matrix with increasing heat input. At higher currents of 90 and 100 A, the W content slightly increases (up to 1.5 and 5.6 wt.%, respectively), which may be attributed to remelting of the lower regions of the coating and redistribution of dissolved W under conditions of critical dilution with the substrate, consistent with the WC bottom-concentration phenomenon reported for PTA Ni–WC systems at elevated heat input [23]. The contribution of incomplete powder melting as an alternative explanation appears unlikely, as the uniform BSE contrast of the S6 cross-section argues against the presence of partially unmelted WC agglomerates.
Nickel. The Ni content reaches its maximum in sample S2 (60 A) at 51.9 wt.%, corresponding to the most Ni-rich matrix among all investigated coatings. With further increases in arc current, the Ni content decreases monotonically to 21.2 wt.% at 100 A due to increasing dilution by Fe from the substrate.
Iron and dilution. The Fe content and the calculated dilution degree reach their minimum in sample S2 (Fe = 24.1 wt.%, D = 18.1%) and increase monotonically at currents above 60 A, reaching maximum values in sample S6 (Fe = 49.5 wt.%, D = 46.6%). Thus, at 60 A, the lowest dilution of the coating by the substrate material is achieved under the given process conditions.
Chromium. The Cr content decreases sharply from 8.4 wt.% in S1 to 1.9–2.2 wt.% in S2–S4 and slightly increases at higher currents of 90–100 A (up to 3.0–6.6 wt.%). The higher Cr content in S1 compared to the other samples is associated with the non-uniform distribution of Cr-rich precipitates in the matrix at the lowest arc current.

3.2.3. Elemental Distribution Across the Coating Thickness

For samples S1–S3, additional EDS analysis was performed at a magnification of 500× in three regions of the cross-section: the top, central, and bottom zones adjacent to the substrate. The results are presented in Table 4.
In all three samples, the Fe content consistently increases from the top to the bottom region, reflecting the dilution gradient across the coating thickness. The most pronounced gradient is observed in sample S3, where the Fe content increases from 30.3 wt.% in the top region to 45.5 wt.% in the bottom region (ΔFe = 15.2 wt.%).
In sample S1, the W content in the top region (13.6 wt.%) significantly exceeds that in the central (6.6 wt.%) and bottom (7.5 wt.%) regions, indicating a non-uniform distribution of WC agglomerates across the coating thickness at the lowest arc current. In contrast, in samples S2 and S3, W is distributed relatively uniformly across all regions, suggesting more homogeneous melt mixing at higher heat input.

3.3. X-Ray Diffraction Analysis

3.3.1. Phase Composition of the Initial Powder and Substrate

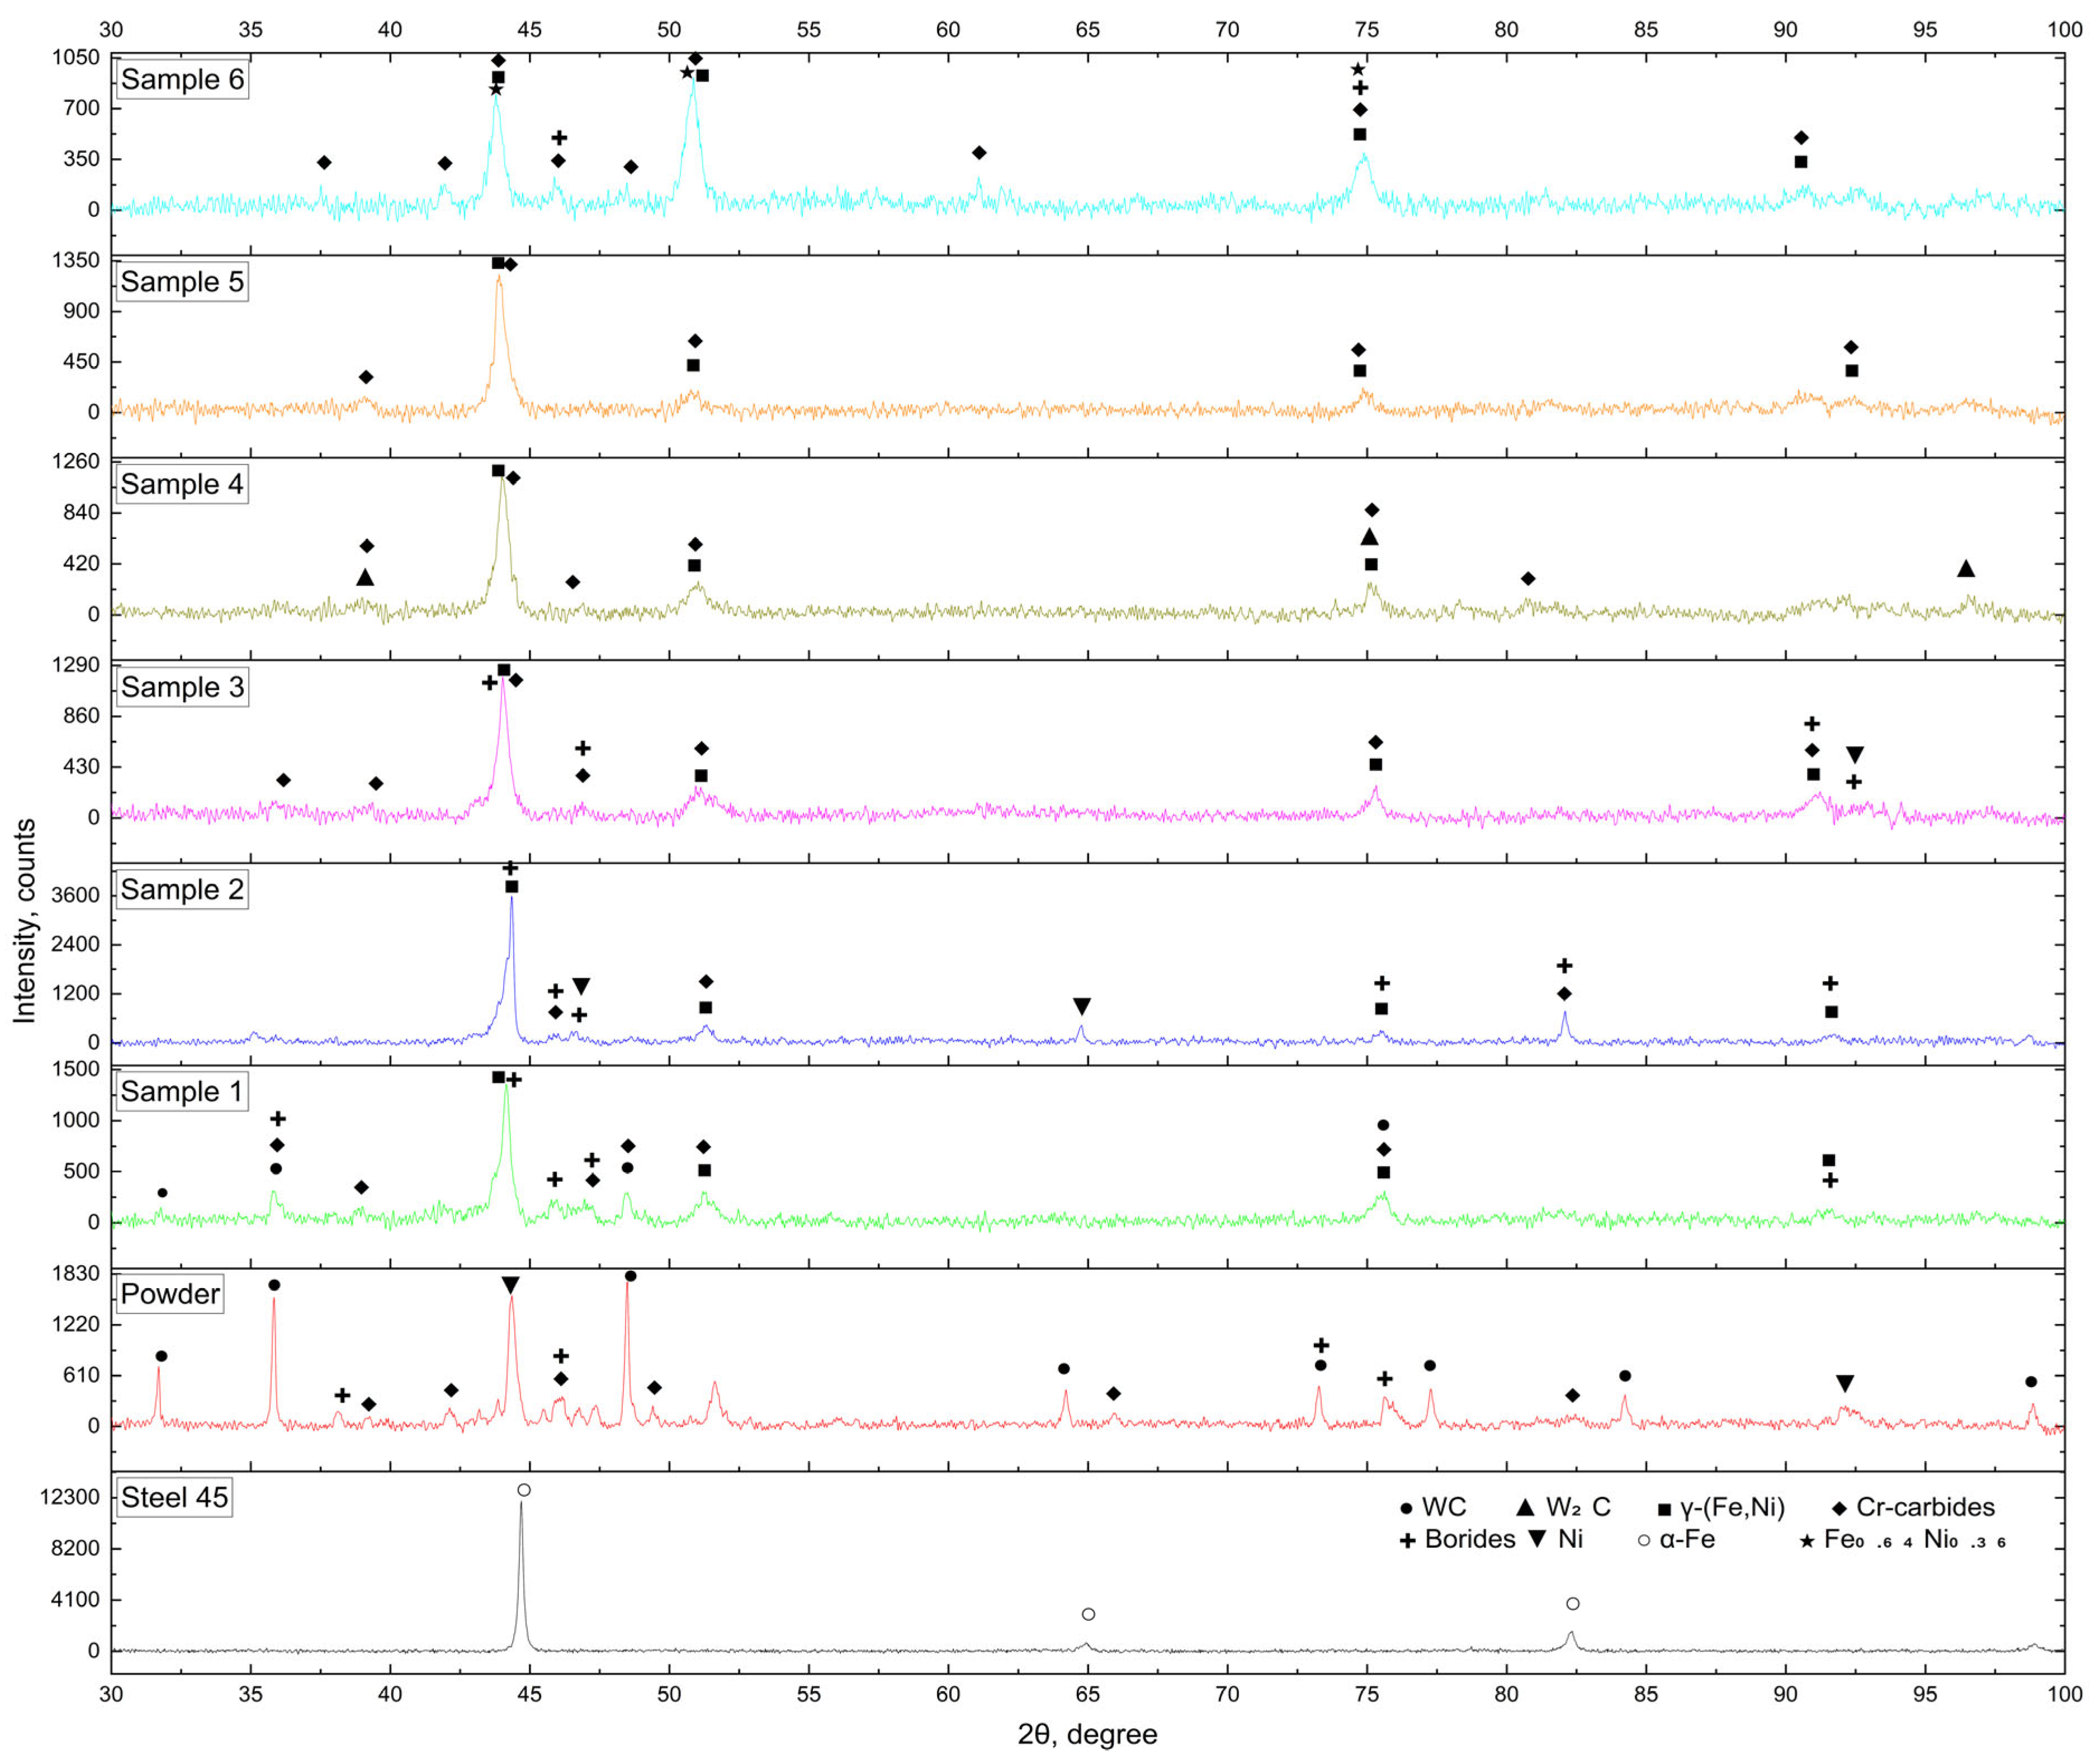
The XRD patterns of the initial powder and substrate are shown in Figure 5. The XRD pattern of the PS-12NVK-01 powder exhibits reflections corresponding to WC (JCPDS 51-0939), metallic Ni (JCPDS 04-0850), CrB (JCPDS 06-0686), Cr7C3 (JCPDS 36-1482), and NiSi (JCPDS 65-4828). The presence of crystalline WC indicates that the carbide component does not undergo thermal degradation prior to cladding. The Cr7C3 and CrB phases are components of the self-fluxing PG-10N-01 matrix formed during gas atomization [7]. A detailed correspondence between the reflections and phases is presented in Table 5.
The XRD pattern of the steel 45 substrate only contains reflections of α-Fe (BCC, JCPDS 06-0696), which corresponds to the ferritic structure of normalized carbon steel.

3.3.2. Phase Composition of Coatings S1–S6

The XRD patterns of coatings S1–S6 are shown in Figure 5. Phase identification was performed using the PDF-2 database in HighScore Plus software (3.0.0). Due to significant peak overlap in this multicomponent system, the analysis is qualitative; all phase assignments are supported by EDS data (Section 3.2). The complete list of reflections is presented in Table 5.
S1 (50 A). WC (JCPDS 51-0939), Cr3C2 (JCPDS 35-0804), Ni3B (JCPDS 82-1699), Ni2B (JCPDS 73-1894), and the (Fe,Ni)γ solid solution (JCPDS 47-1417) were identified. Partial retention of WC at the lowest current is consistent with the W content of 6.9 wt.% from EDS data. The reflection at 2θ ≈ 44.1° corresponds to the overlap of (Fe,Ni)γ (111) and Ni3B, making their separation without Rietveld refinement difficult.
S2 (60 A). WC is not detected, which agrees with EDS data (W = 1.6 wt.%). Cr7C3 (JCPDS 36-1482), Ni3B, Ni2B, (Fe,Ni)γ, metallic Ni, and iron silicide FeSi (JCPDS 38-1397) are identified. The formation of FeSi indicates interaction between Fe from the substrate and Si from the matrix. The Ni content reaches a maximum (51.9 wt.% by EDS), and the dilution level is minimal (18.1%).
S3 (70 A). WC reflections are absent (W = 0.4 wt.% by EDS). The simultaneous presence of Cr3C2 and Cr7C3 indicates a phase transformation Cr3C2  Cr7C3 under these thermal conditions. Ni3B and (Fe,Ni)γ are also identified.
S4 (80 A). Cr7C3 becomes the dominant phase. The tungsten subcarbide W2C (JCPDS 35-0776) is identified for the first time, indicating partial decomposition of WC via the reaction WC W2C + [C] [27]. The released carbon contributes to the formation of chromium carbides. Cr3C2 and (Fe,Ni)γ remain present.
S5 (90 A). The XRD pattern contains the smallest number of reflections among all coatings. Cr3C2, Cr7C3, and (Fe,Ni)γ are identified. The increased W content from EDS (1.5 wt.%) in the absence of tungsten carbide reflections suggests dissolution of W in the (Fe,Ni)γ matrix [24].
S6 (100 A). The phase composition differs significantly from S1–S5. Cr7C3 is the dominant phase. The matrix is represented by the Fe0.64Ni0.36 solid solution (JCPDS 47-1417), consistent with EDS data (Fe = 49.5 wt.%, Ni = 21.2 wt.%). Cr23C6 (JCPDS 35-0783) and Ni2B are also identified. The increased W content (5.6 wt.% by EDS) in the absence of crystalline tungsten carbide reflections indicates dissolution of W in the (Fe,Ni)γ matrix at maximum heat input [24].

3.3.3. Evolution of Phase Composition with Increasing Arc Current

Based on the combined XRD and EDS data, three characteristic ranges of cladding current can be distinguished (Table 5).
At 50 A, partial retention of WC is observed in the coating along with Ni3B and Ni2B borides, Cr3C2 carbide, and the (Fe,Ni)γ matrix. At 60 A, WC is no longer detected; the dilution level reaches its minimum (18.1%), while the Ni content in the matrix is at its maximum (51.9 wt.%). At 70 A, the phase transformation Cr3C2  Cr7C3 occurs [20]. At 80 A, Cr7C3 becomes the dominant phase, and W2C appears as an intermediate product of WC decomposition. At 90–100 A, the matrix is predominantly represented by the (Fe,Ni)γ solid solution, with the dilution level increasing to 42–47%.
The reduced Cr content in the matrix of coatings S2–S4 (1.9–2.2 wt.% according to EDS) is explained by the binding of chromium into carbide and boride phases. Overall, the EDS results are in good agreement with the phase composition determined by XRD analysis.

3.4. Microhardness

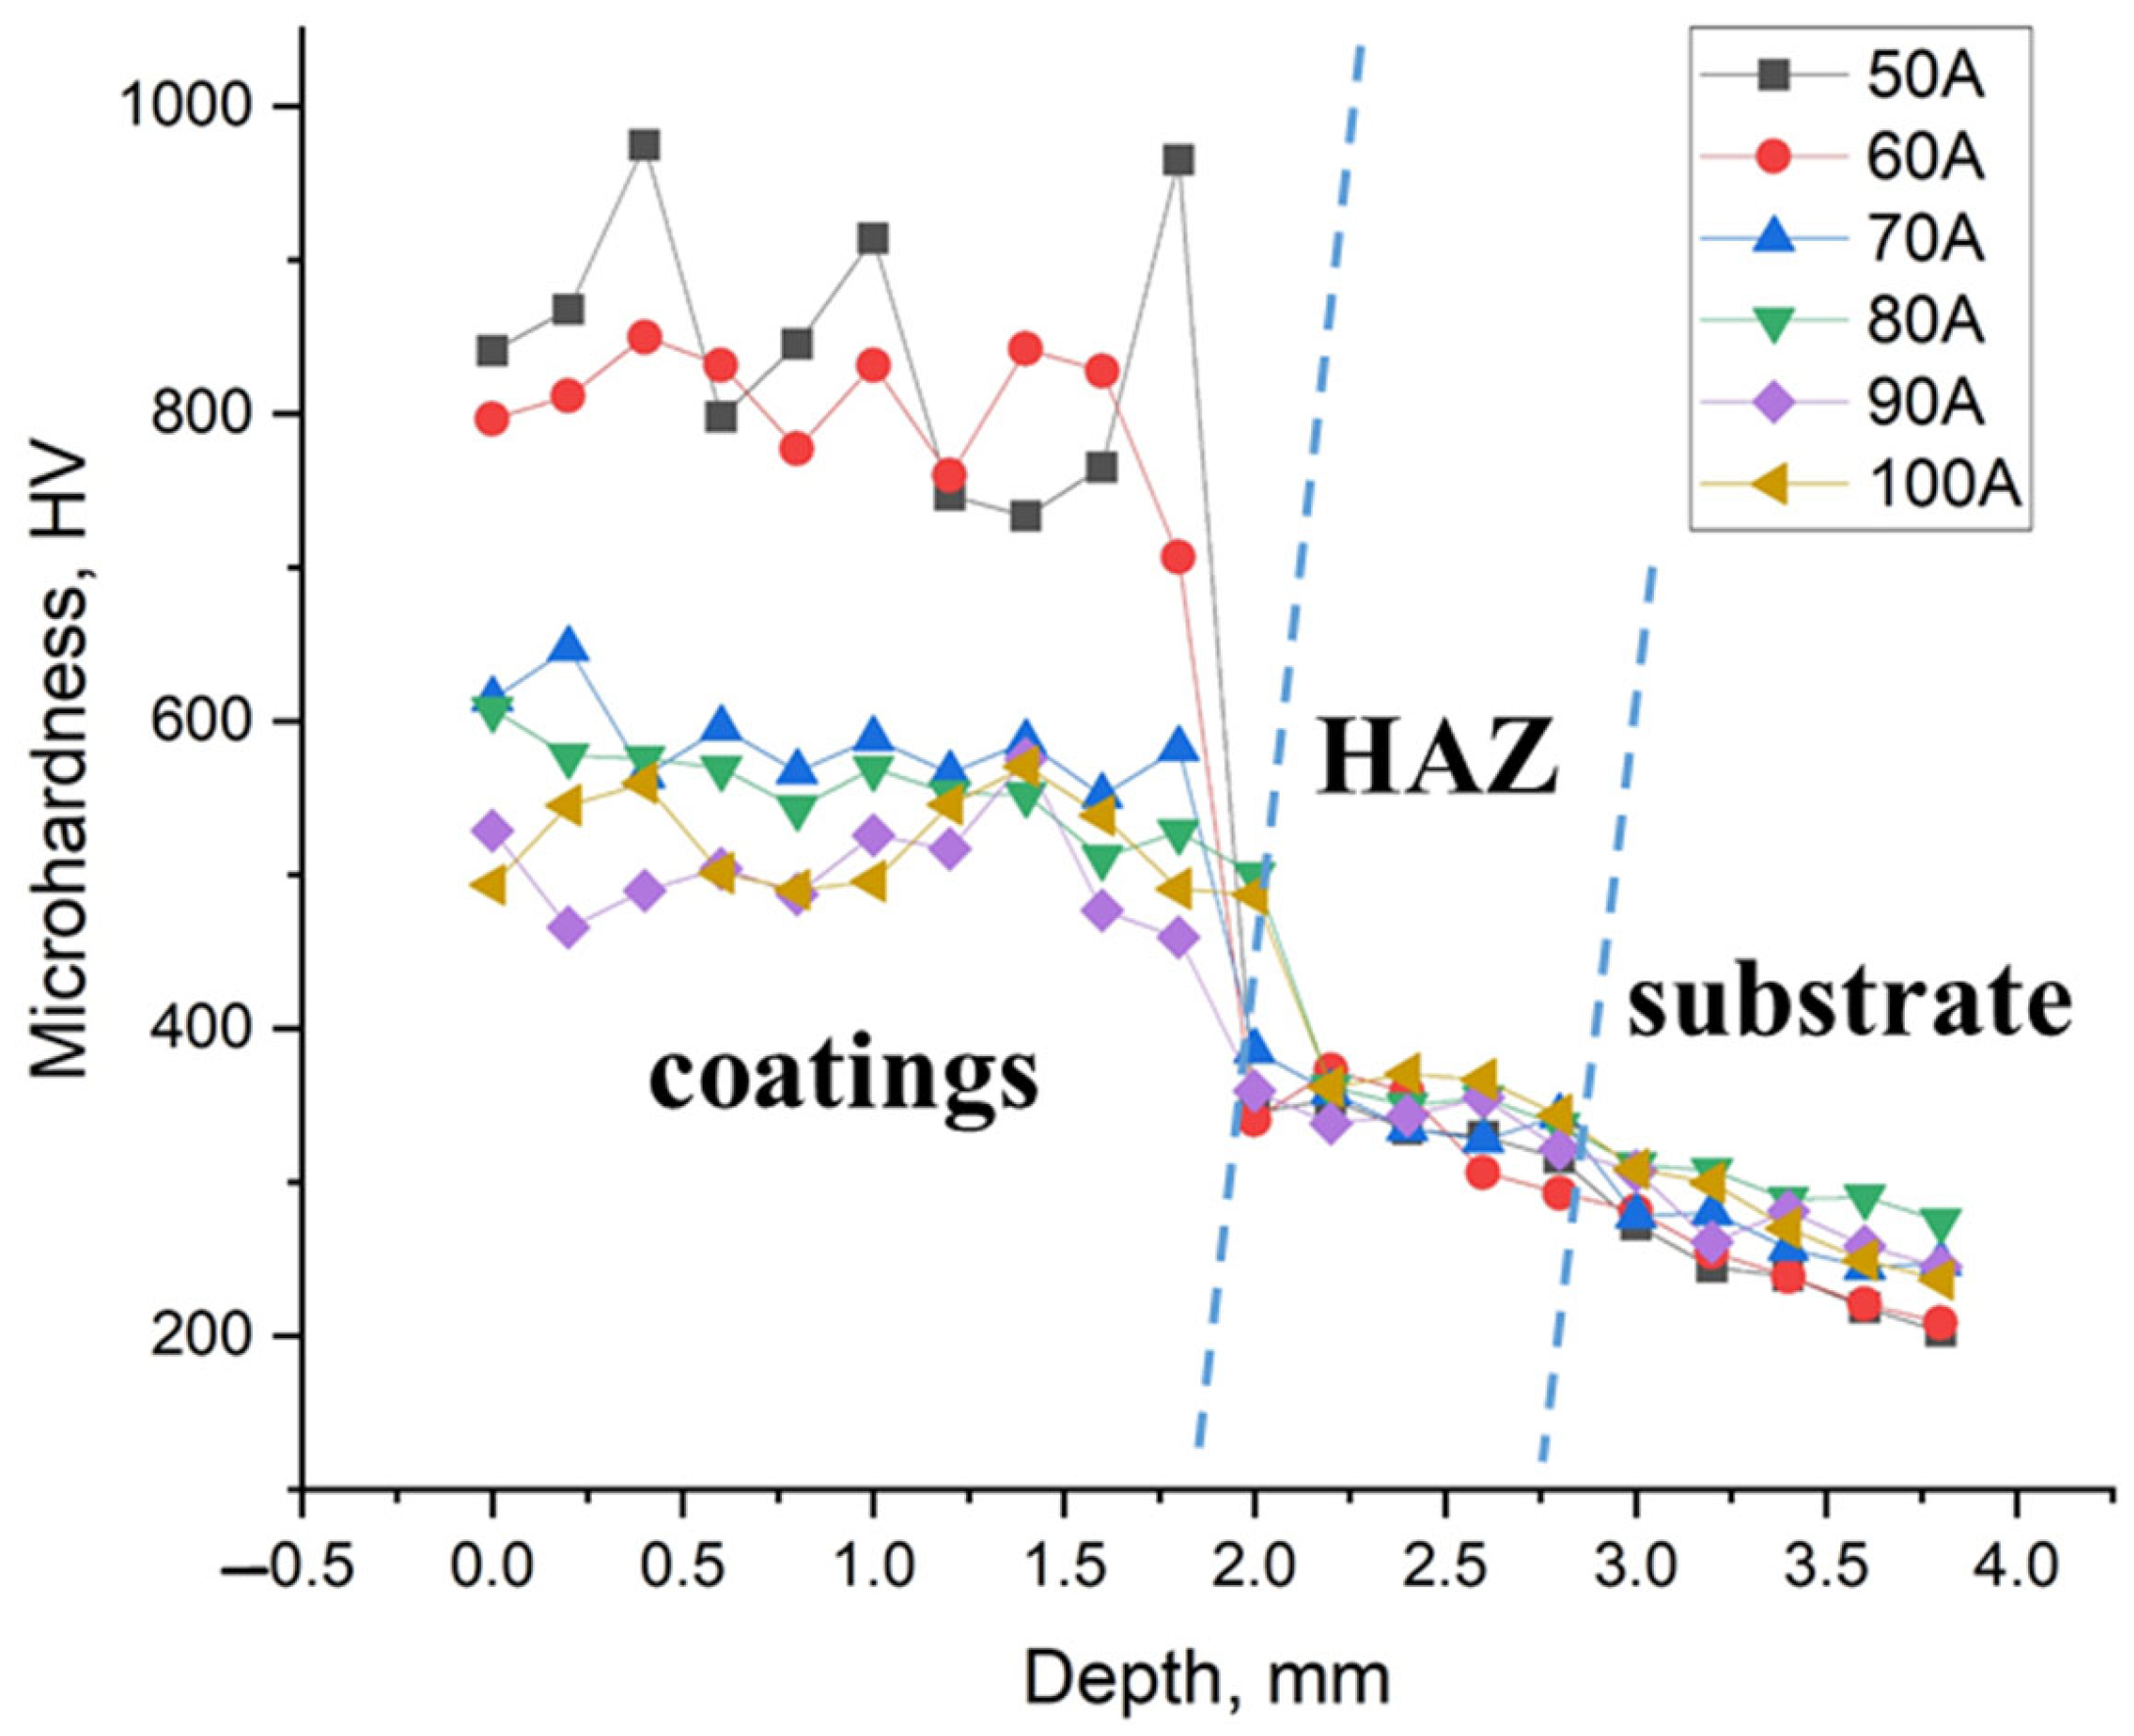
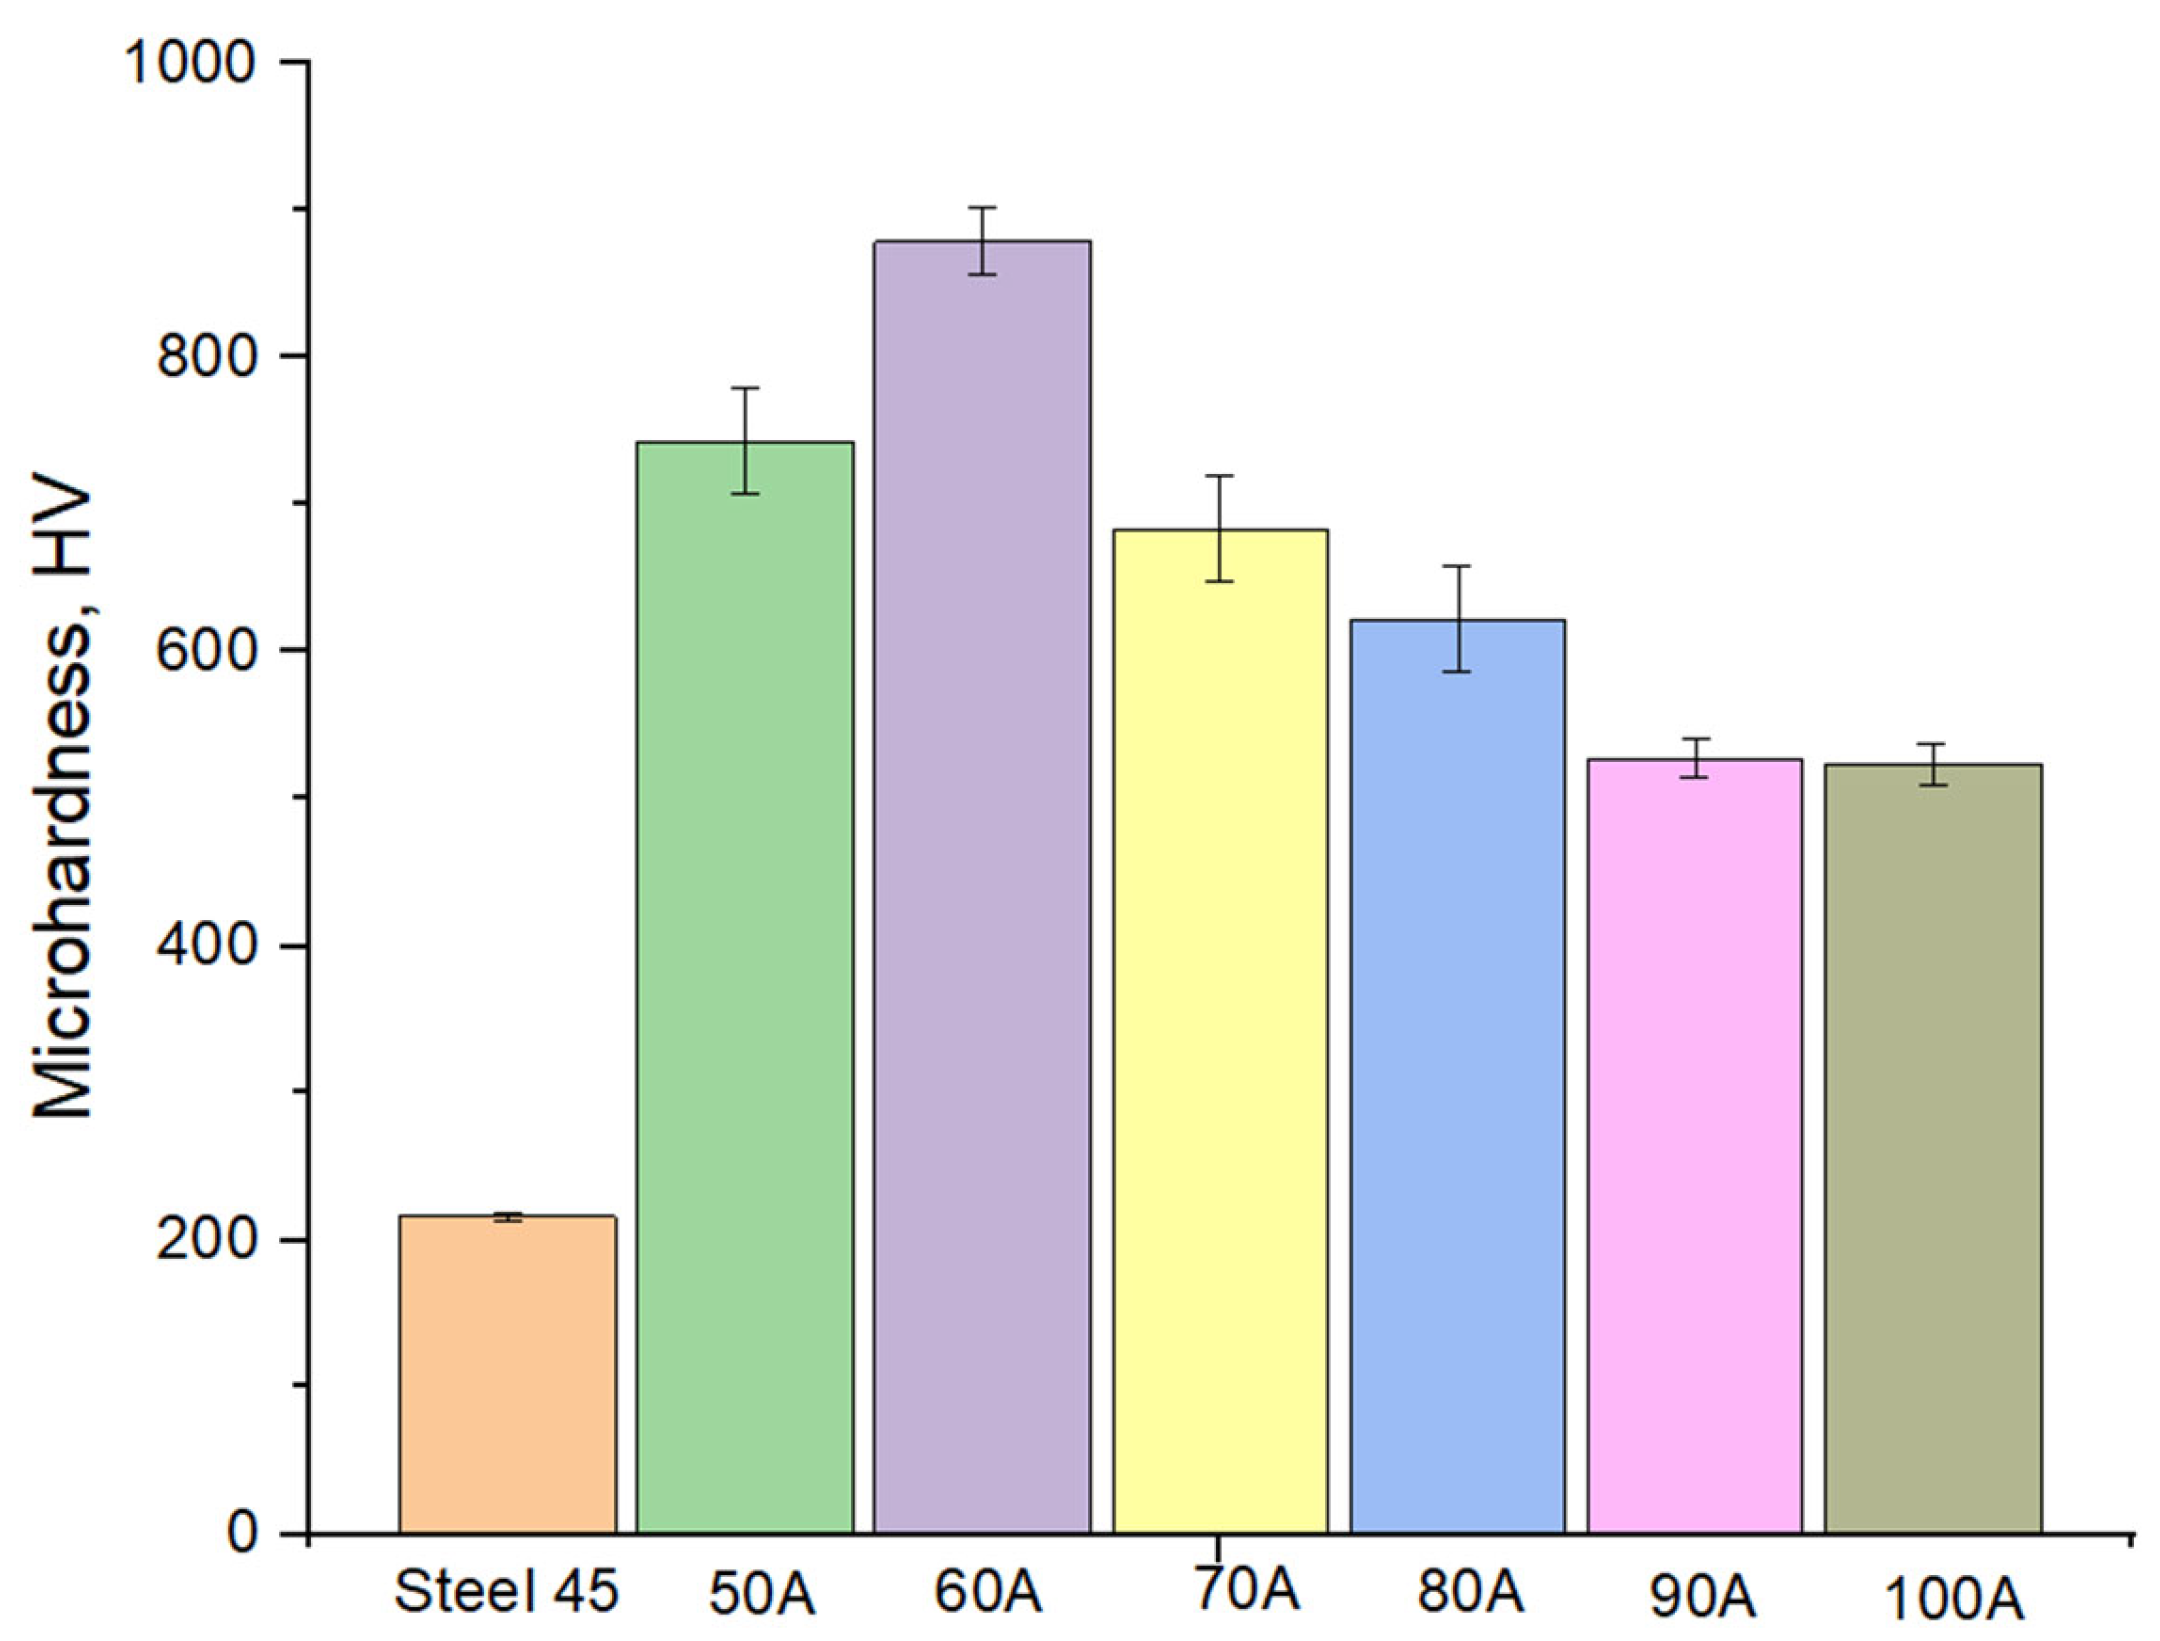
Vickers microhardness measurement results are presented as cross-sectional hardness profiles (Figure 6) and average surface hardness values with error bars (Figure 7). The obtained data demonstrate a pronounced dependence of hardness on arc current, which is consistent with the trends in phase composition and microstructure established by XRD and EDS analyses.
The cross-sectional profiles (Figure 6) reveal three characteristic regions for each sample: the coating region with high and relatively stable hardness values, the heat-affected zone (HAZ), and the substrate region. The coating/HAZ boundary is located at a depth of approximately 1.8–2.0 mm from the surface for all samples; the hardness sharply decreases to approximately 340–390 HV at the beginning of the HAZ and then gradually decreases to approximately 200–250 HV, corresponding to the initial hardness of Steel 45. All six profiles converge in the substrate region, confirming the identical substrate material for all samples.
In the coating region, the profiles can be divided into two characteristic clusters. The first cluster, samples S1 (50 A) and S2 (60 A), is characterized by high hardness values in the range of 730–975 HV throughout the coating thickness. The second cluster, samples S3–S6 (70–100 A), shows significantly lower values in the range of 460–650 HV. This separation reflects the transition from partial WC retention to its dissolution, as described in Section 3.1, Section 3.2 and Section 3.3.
Sample S1 (50 A) has an average cross-sectional hardness of 845 ± 86 HV (CV = 10.2%), with a considerable scatter from 734 to 975 HV. Locally high values (974 and 965 HV) are attributed to indentation directly on undissolved WC agglomerates, whereas lower values (734–748 HV) correspond to γ-Ni matrix regions. The high coefficient of variation results from structural heterogeneity caused by insufficient heat input for homogenization, which is consistent with EDS data showing non-uniform W distribution across the coating thickness [7].
Sample S2 (60 A) has an average cross-sectional hardness of 804 ± 45 HV (CV = 5.5%), indicating a more homogeneous hardness distribution compared with S1. The surface hardness of S2 is the highest in the series, 887 ± 76 HV (CV = 8.6%), which is 19.9% higher than that of S1 and more than four times higher than that of the Steel 45 substrate. This combination of high hardness and relatively low scatter is explained by the uniform distribution of boride and carbide phases in the γ-Ni matrix [6].
Increasing the current from 60 to 70 A causes the most pronounced decrease in hardness: from 804 ± 45 to 586 ± 30 HV in cross-section and from 887 ± 76 to 690 ± 42 HV on the surface. This sharp decrease indicates a threshold-like WC dissolution process in the 60–70 A range [20].
Samples S4 (80 A) and S5 (90 A) continue the decreasing trend, showing 552 ± 33 HV and 503 ± 35 HV in cross-section, and 619 ± 38 HV and 526 ± 19 HV on the surface, respectively. The monotonic decrease in standard deviation with increasing current reflects progressive microstructural homogenization due to WC dissolution and formation of a more uniform (Fe,Ni)γ solid solution.
Samples S5 (90 A) and S6 (100 A) show similar hardness values: 503 ± 35 HV and 520 ± 32 HV in cross-section, and 526 ± 19 HV and 522 ± 17 HV on the surface. The hardness plateau at 90–100 A indicates that the strengthening potential of the system is largely exhausted under these cladding conditions; critical dilution with the substrate leads to the formation of an (Fe,Ni)γ solid solution, whose hardness is mainly governed by the substrate-derived chemical composition rather than the initial coating composition [6,16].

3.5. Tribological Properties

The results of tribological tests performed using a ball-on-flat configuration are presented in Table 6. For samples S1 (50 A) and S2 (60 A), two independent measurements were carried out in different surface regions; the reported values represent the mean values with the scatter between repetitions. For samples S3–S6, a single measurement was performed; therefore, the corresponding conclusions are preliminary and require confirmation with an increased number of repetitions.
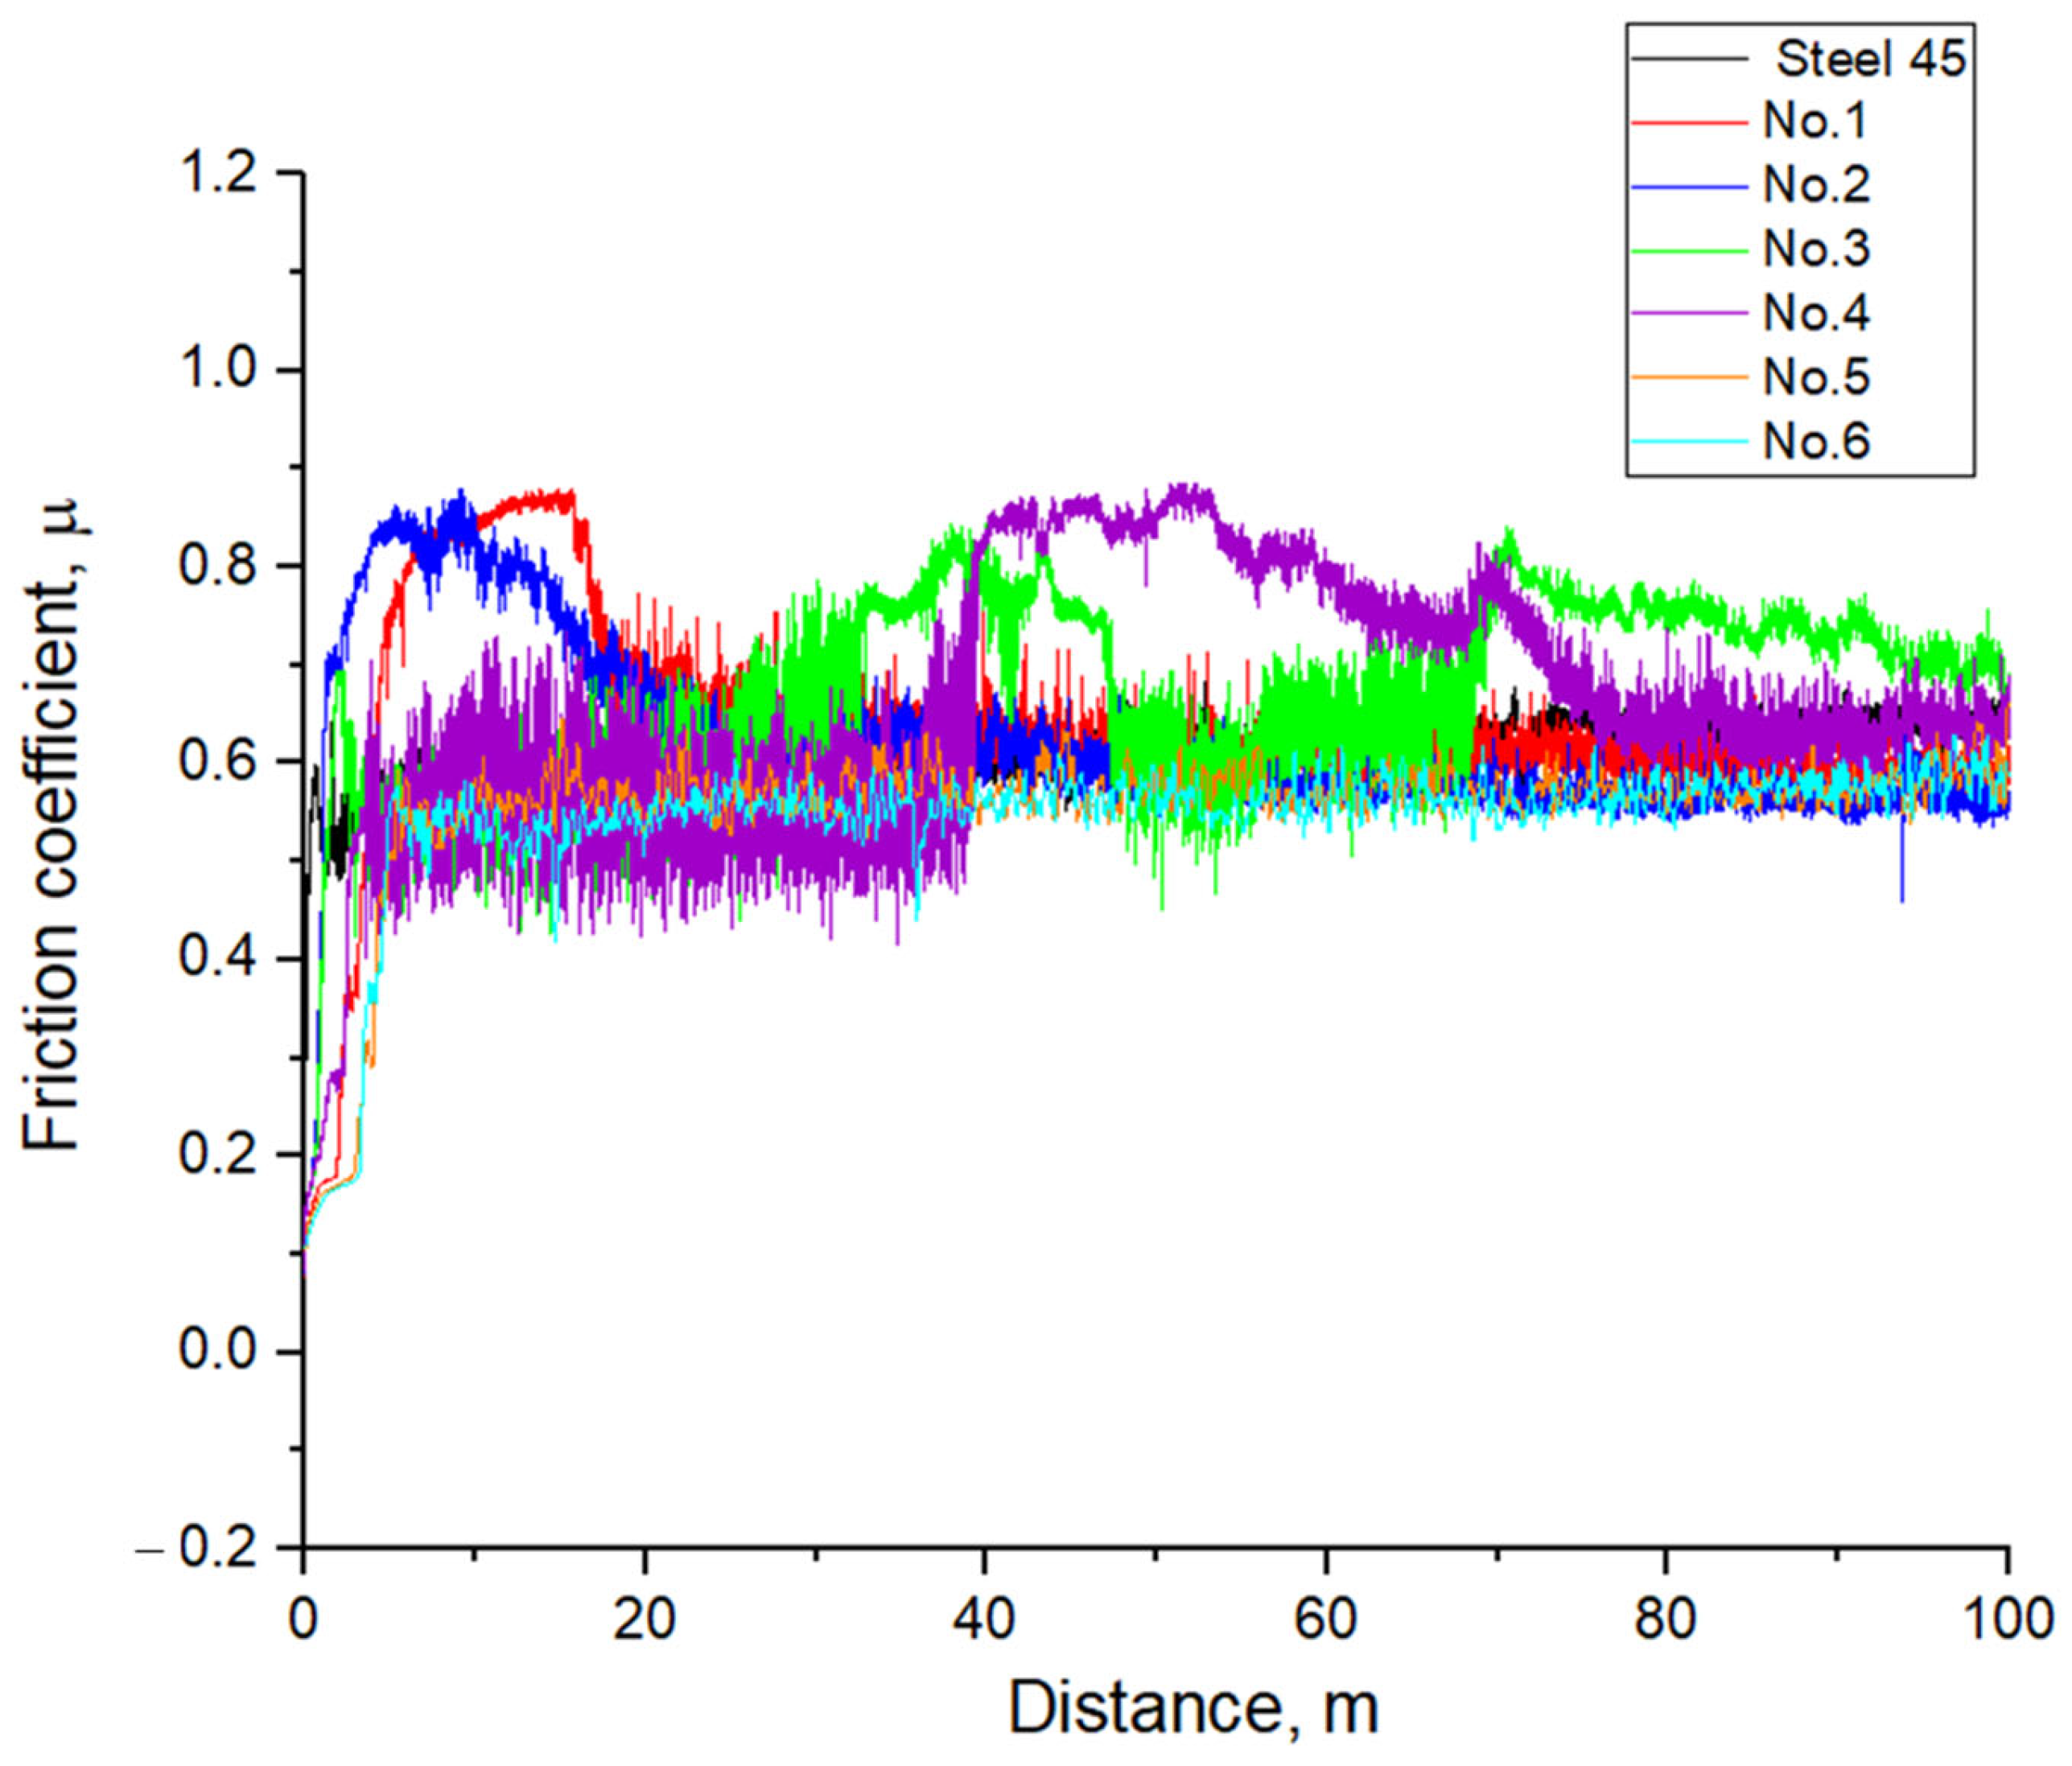
The analysis of the data presented in Table 6 allows two distinct regimes of tribological behavior to be identified. Samples S1 (50 A) and S2 (60 A) exhibit the highest wear resistance in the series, with average specific wear rates of (4.80 ± 4.37) × 10−6 and (4.00 ± 2.39) × 10−6 mm3/(N·m), respectively, which are 18–22 times lower than that of the Steel 45 substrate (8.858 × 10⁻⁵ mm3/(N·m)). The significant scatter between repeated measurements for S1 (≈21×) and S2 (≈4×) reflects microstructural heterogeneity of the coating surface: depending on whether the wear track passes through regions enriched with hard phases or matrix-dominated areas, the local tribological response varies considerably, whereas the coefficient of friction remains relatively stable.
The evolution of the coefficient of friction with sliding distance is shown in Figure 8. For samples S1–S4, the steady-state friction coefficient lies within the range of 0.615–0.673 (σ = 0.087–0.127), which is typical for sliding involving hard carbide and boride phases. Samples S5 (90 A) and S6 (100 A) exhibit a decrease in the average friction coefficient to 0.555 and 0.544, respectively, accompanied by a reduction in σ to 0.081. This decrease in μ does not necessarily indicate improved tribological performance; rather, it is likely associated with a change in the nature of the contacting material. At 90–100 A, the coating matrix is predominantly represented by an (Fe,Ni)γ solid solution, which is characterized by a lower friction coefficient but a higher wear rate.
The transition from the 50–60 A range to 70–80 A is accompanied by a sharp increase in wear rate. For sample S3 (70 A), K = 3.591 × 10⁻⁵ mm3/(N·m), which is approximately nine times higher than the average value for S2 (60 A); however, since only a single measurement is performed for S3, this ratio should be considered indicative. This transition correlates with significant WC dissolution at 70 A, as confirmed by XRD and EDS data. The somewhat lower wear rate of sample S4 (80 A) compared to S3 (70 A) (2.016 × 10⁻⁵ vs. 3.591 × 10⁻⁵ mm3/(N·m)) is likely associated with the formation of snowflake-like Cr7C3 precipitates, which may provide partial dispersion strengthening of the matrix. This conclusion is also based on single measurements and requires statistical validation.
At 90 and 100 A, the wear rate increases to 1.096 × 10⁻⁴ and 9.134 × 10⁻⁵ mm3/(N·m), respectively, reaching values comparable to the uncoated Steel 45 substrate, indicating a significant reduction in the protective performance of the coatings at these cladding currents.
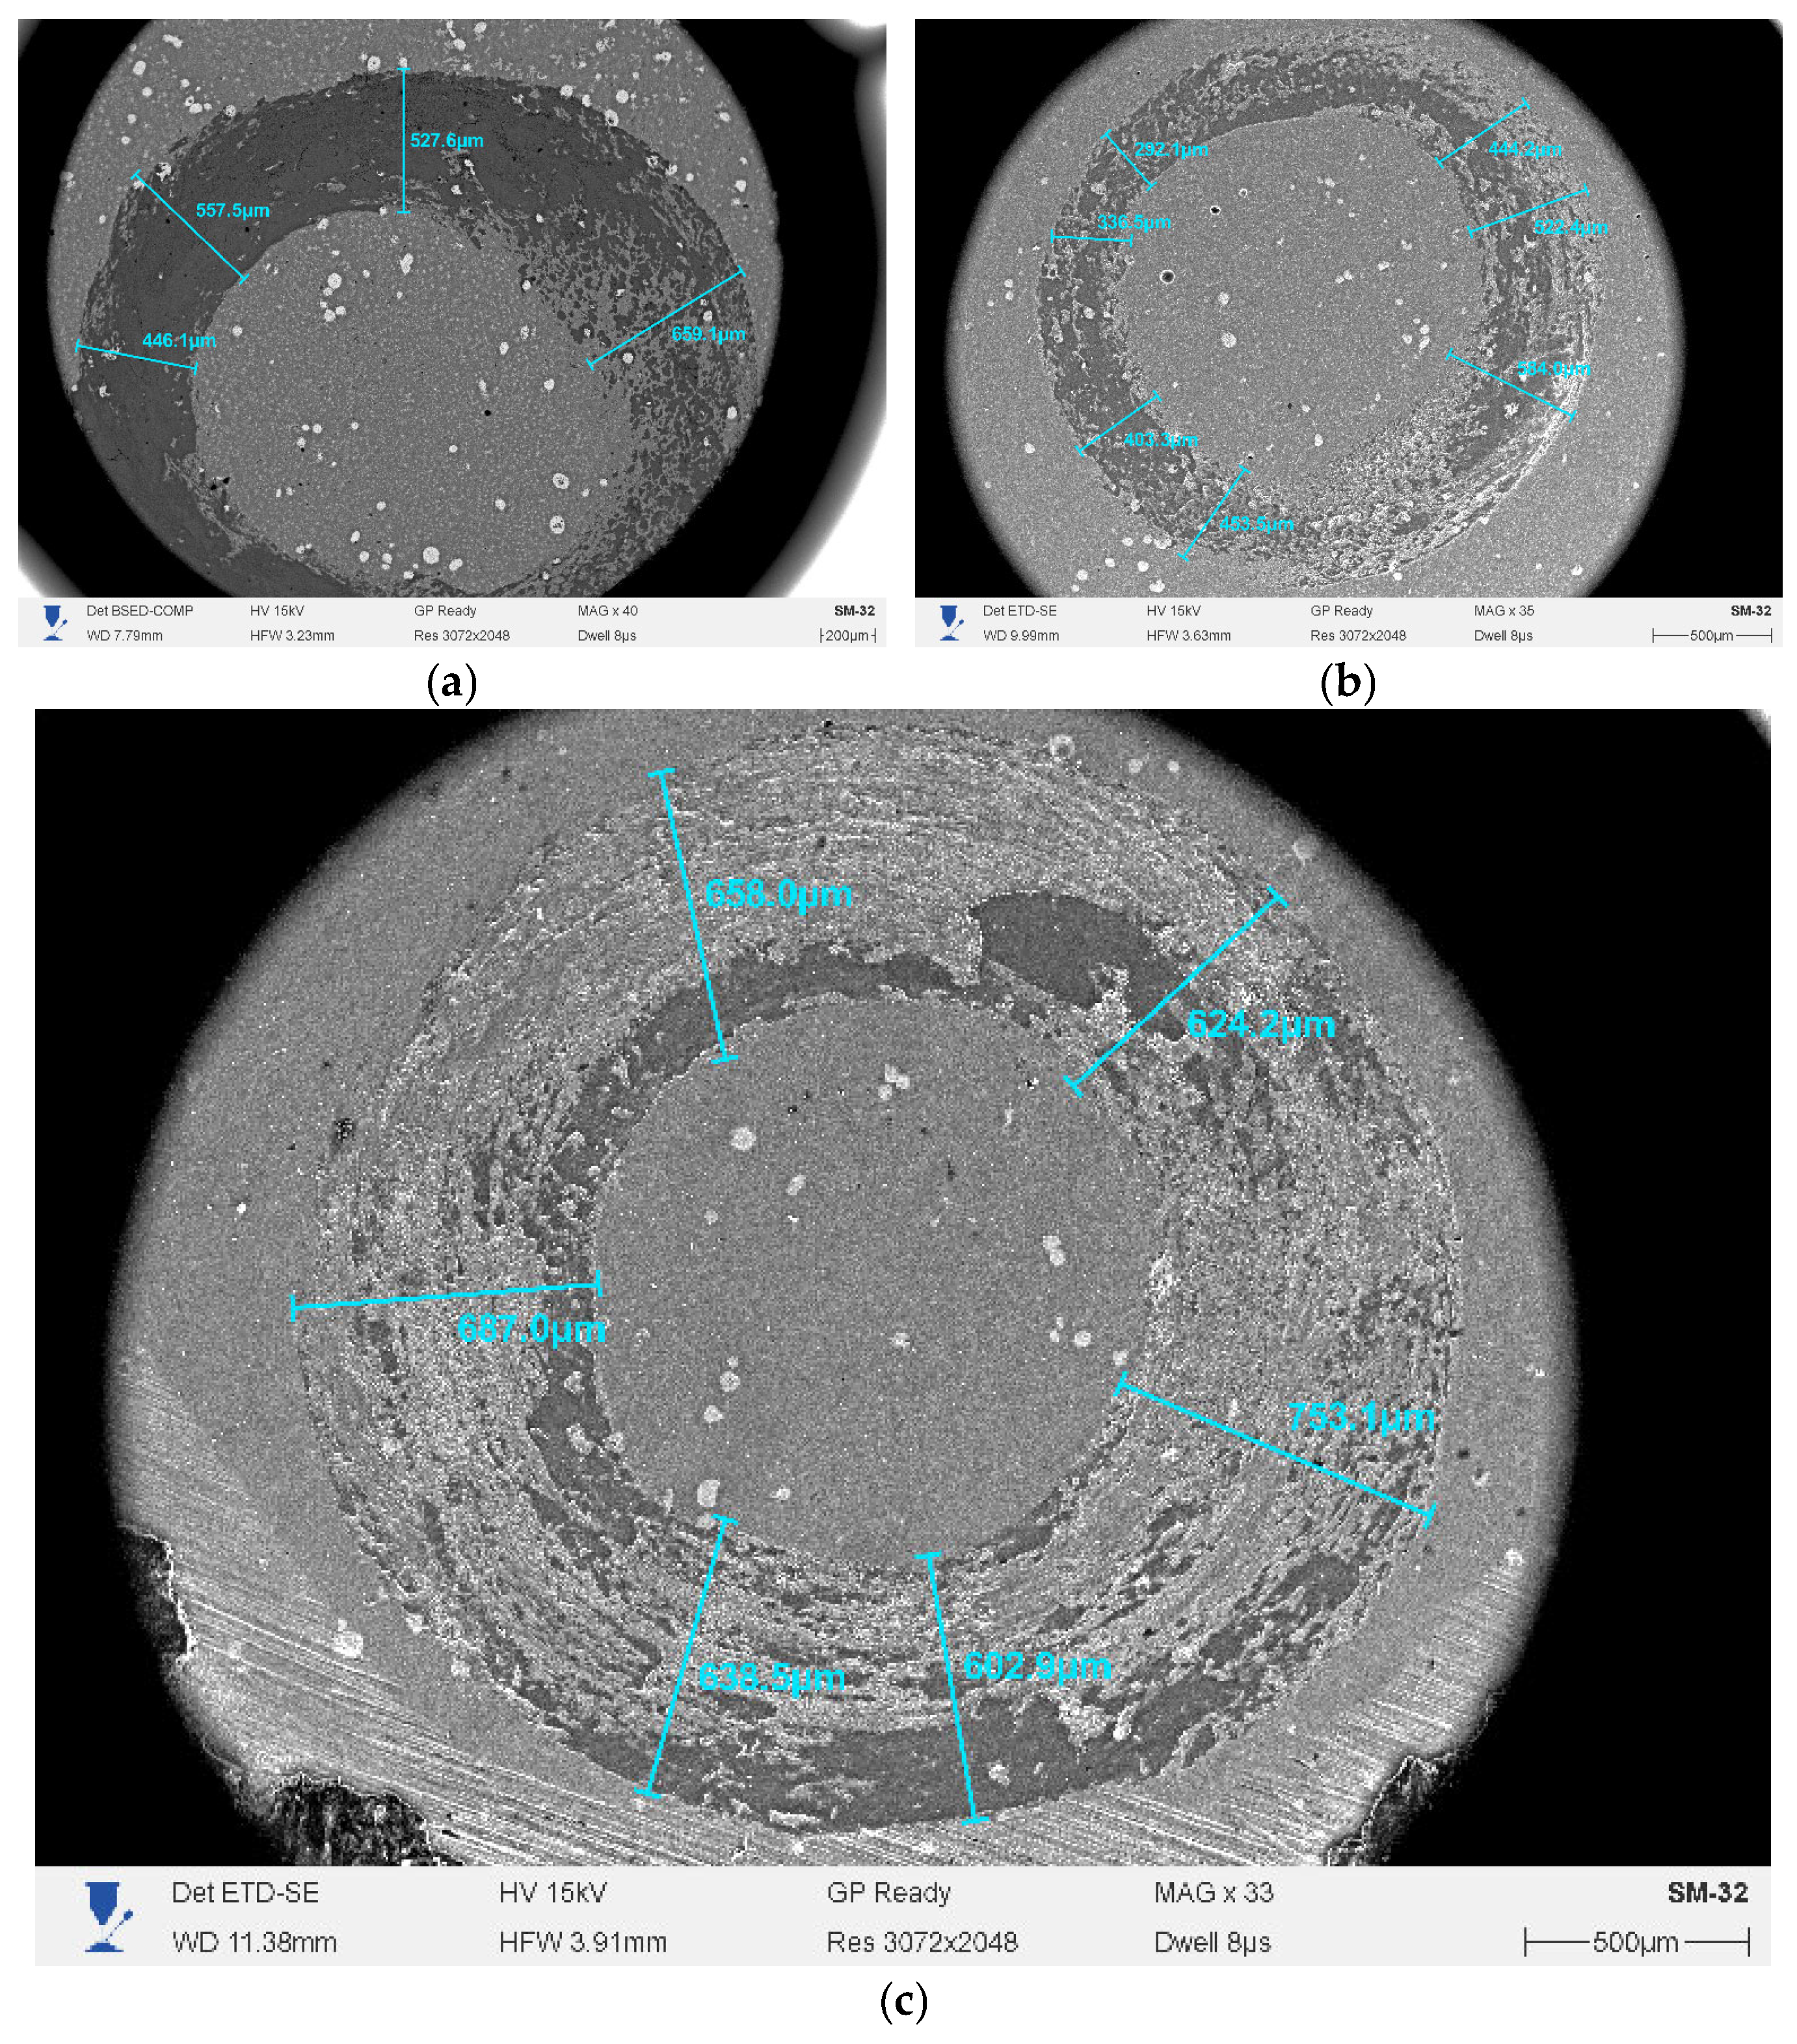
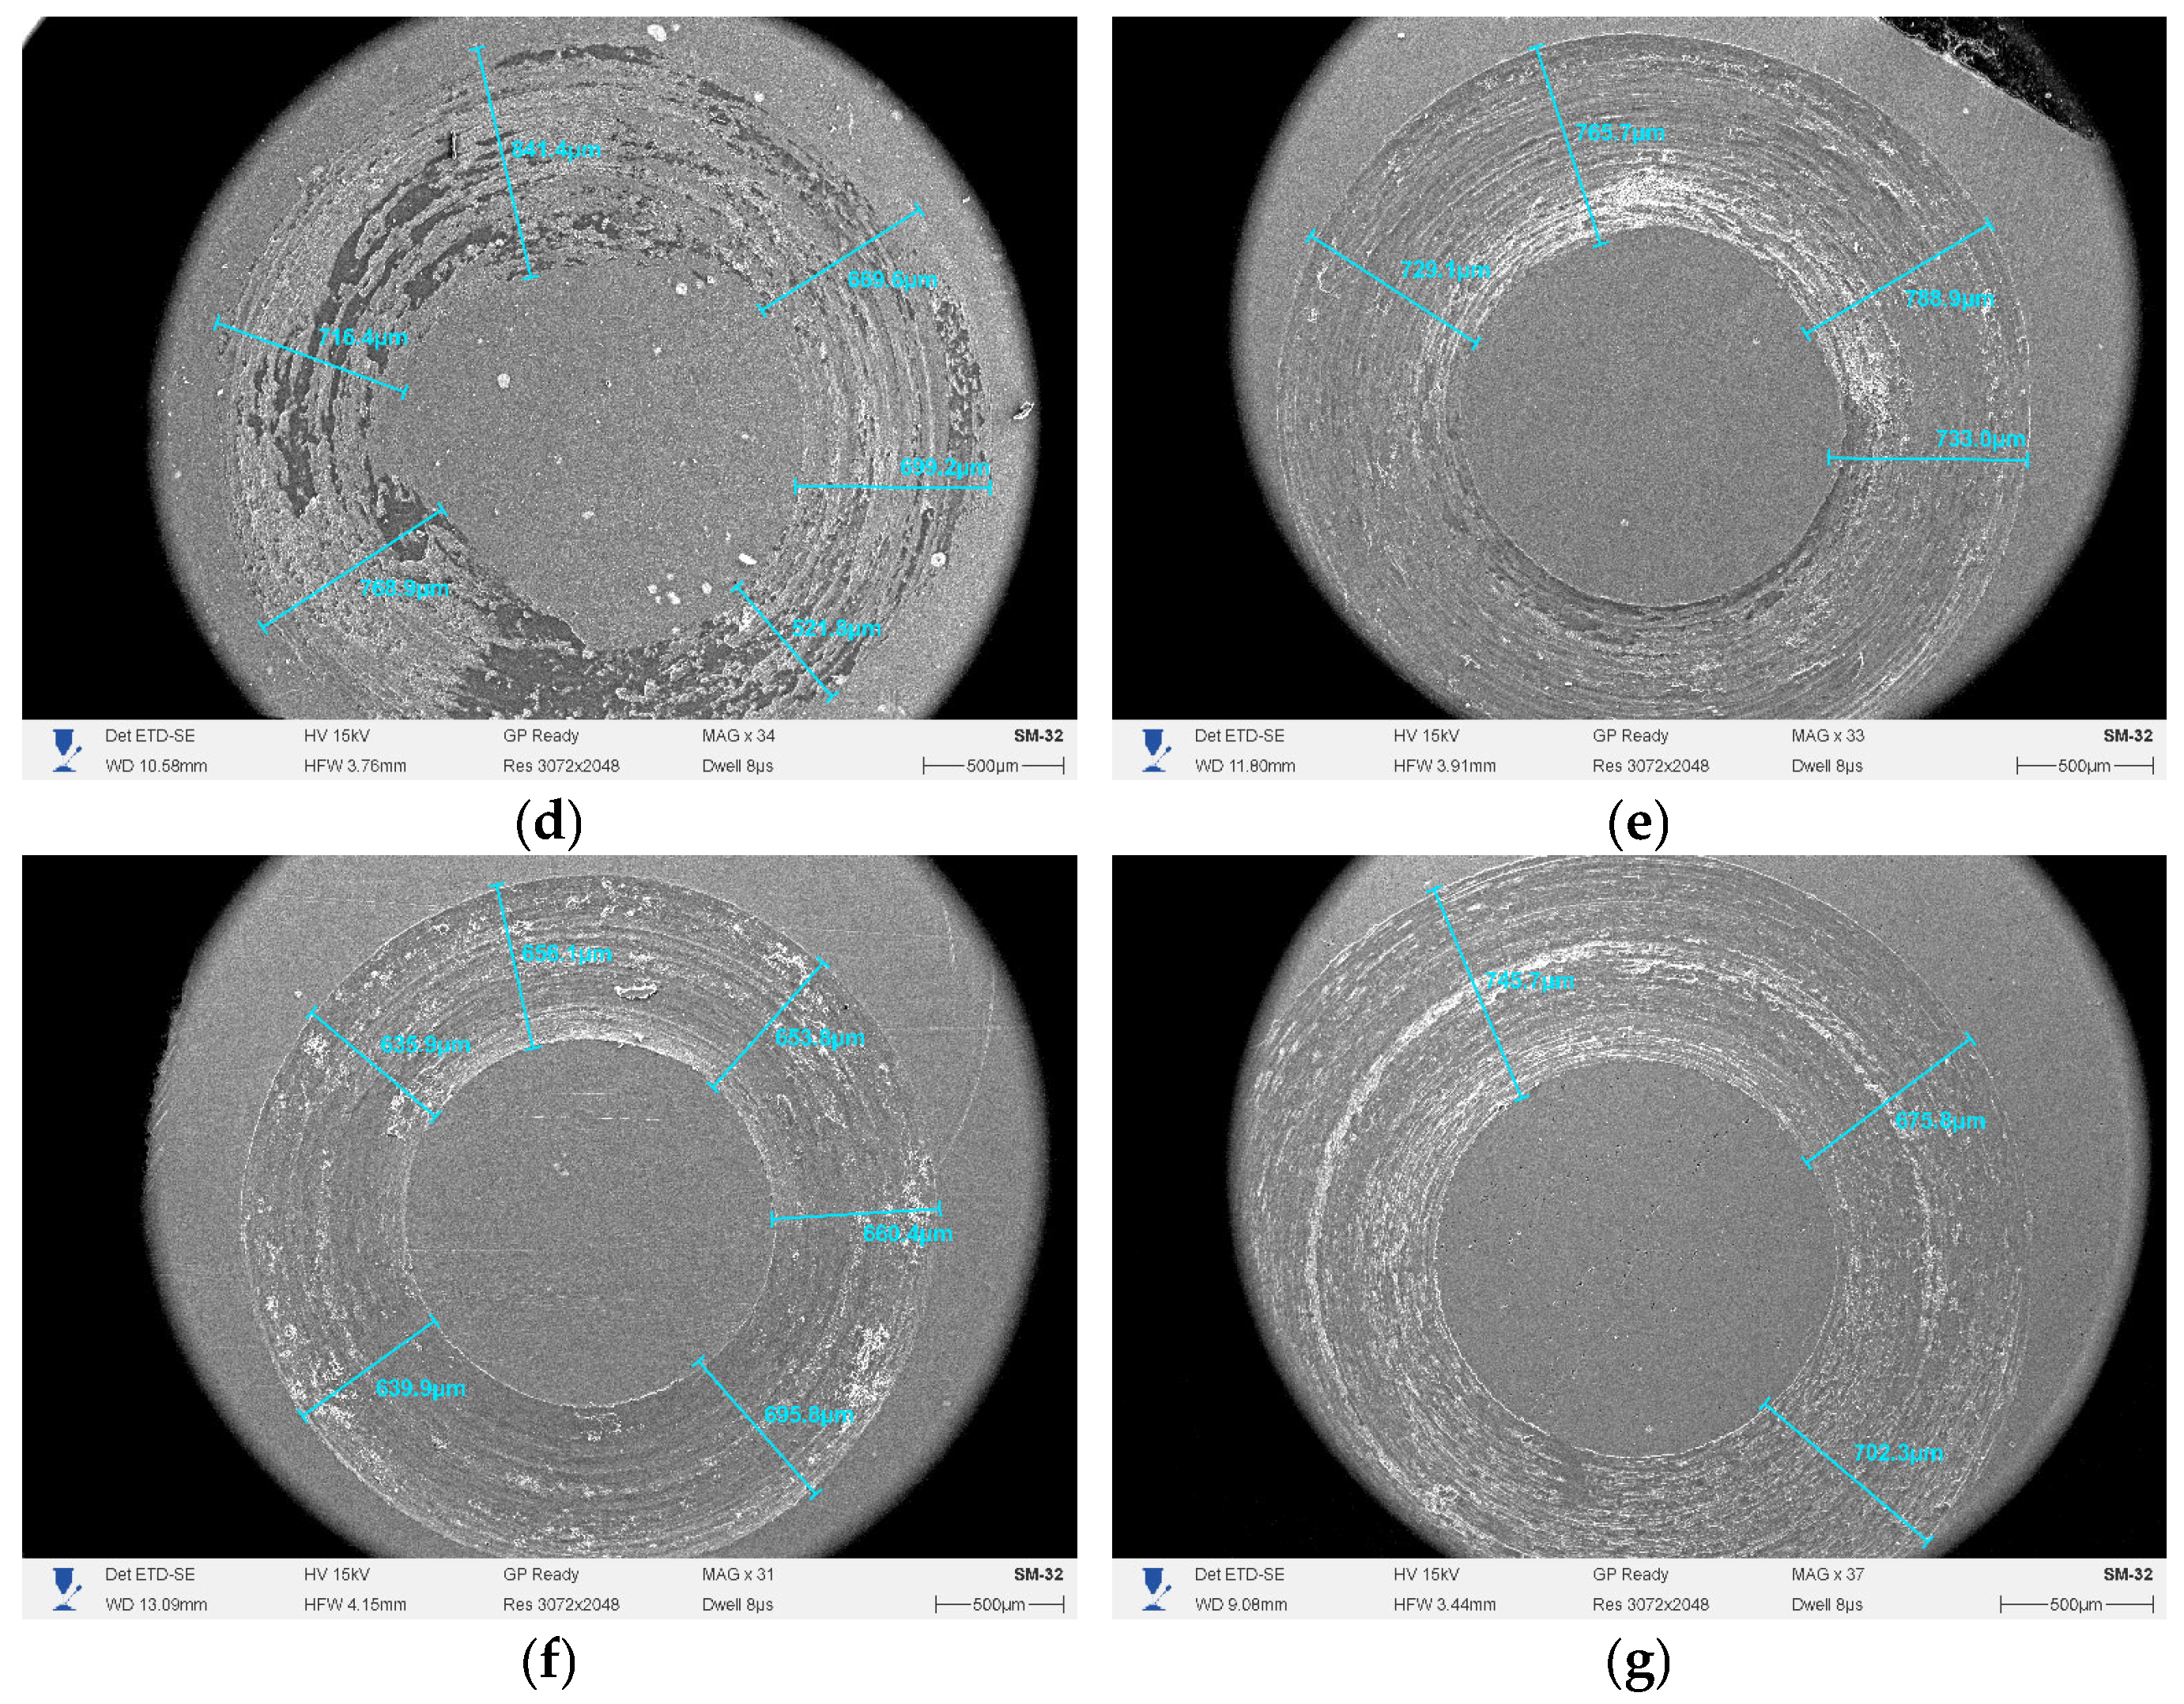
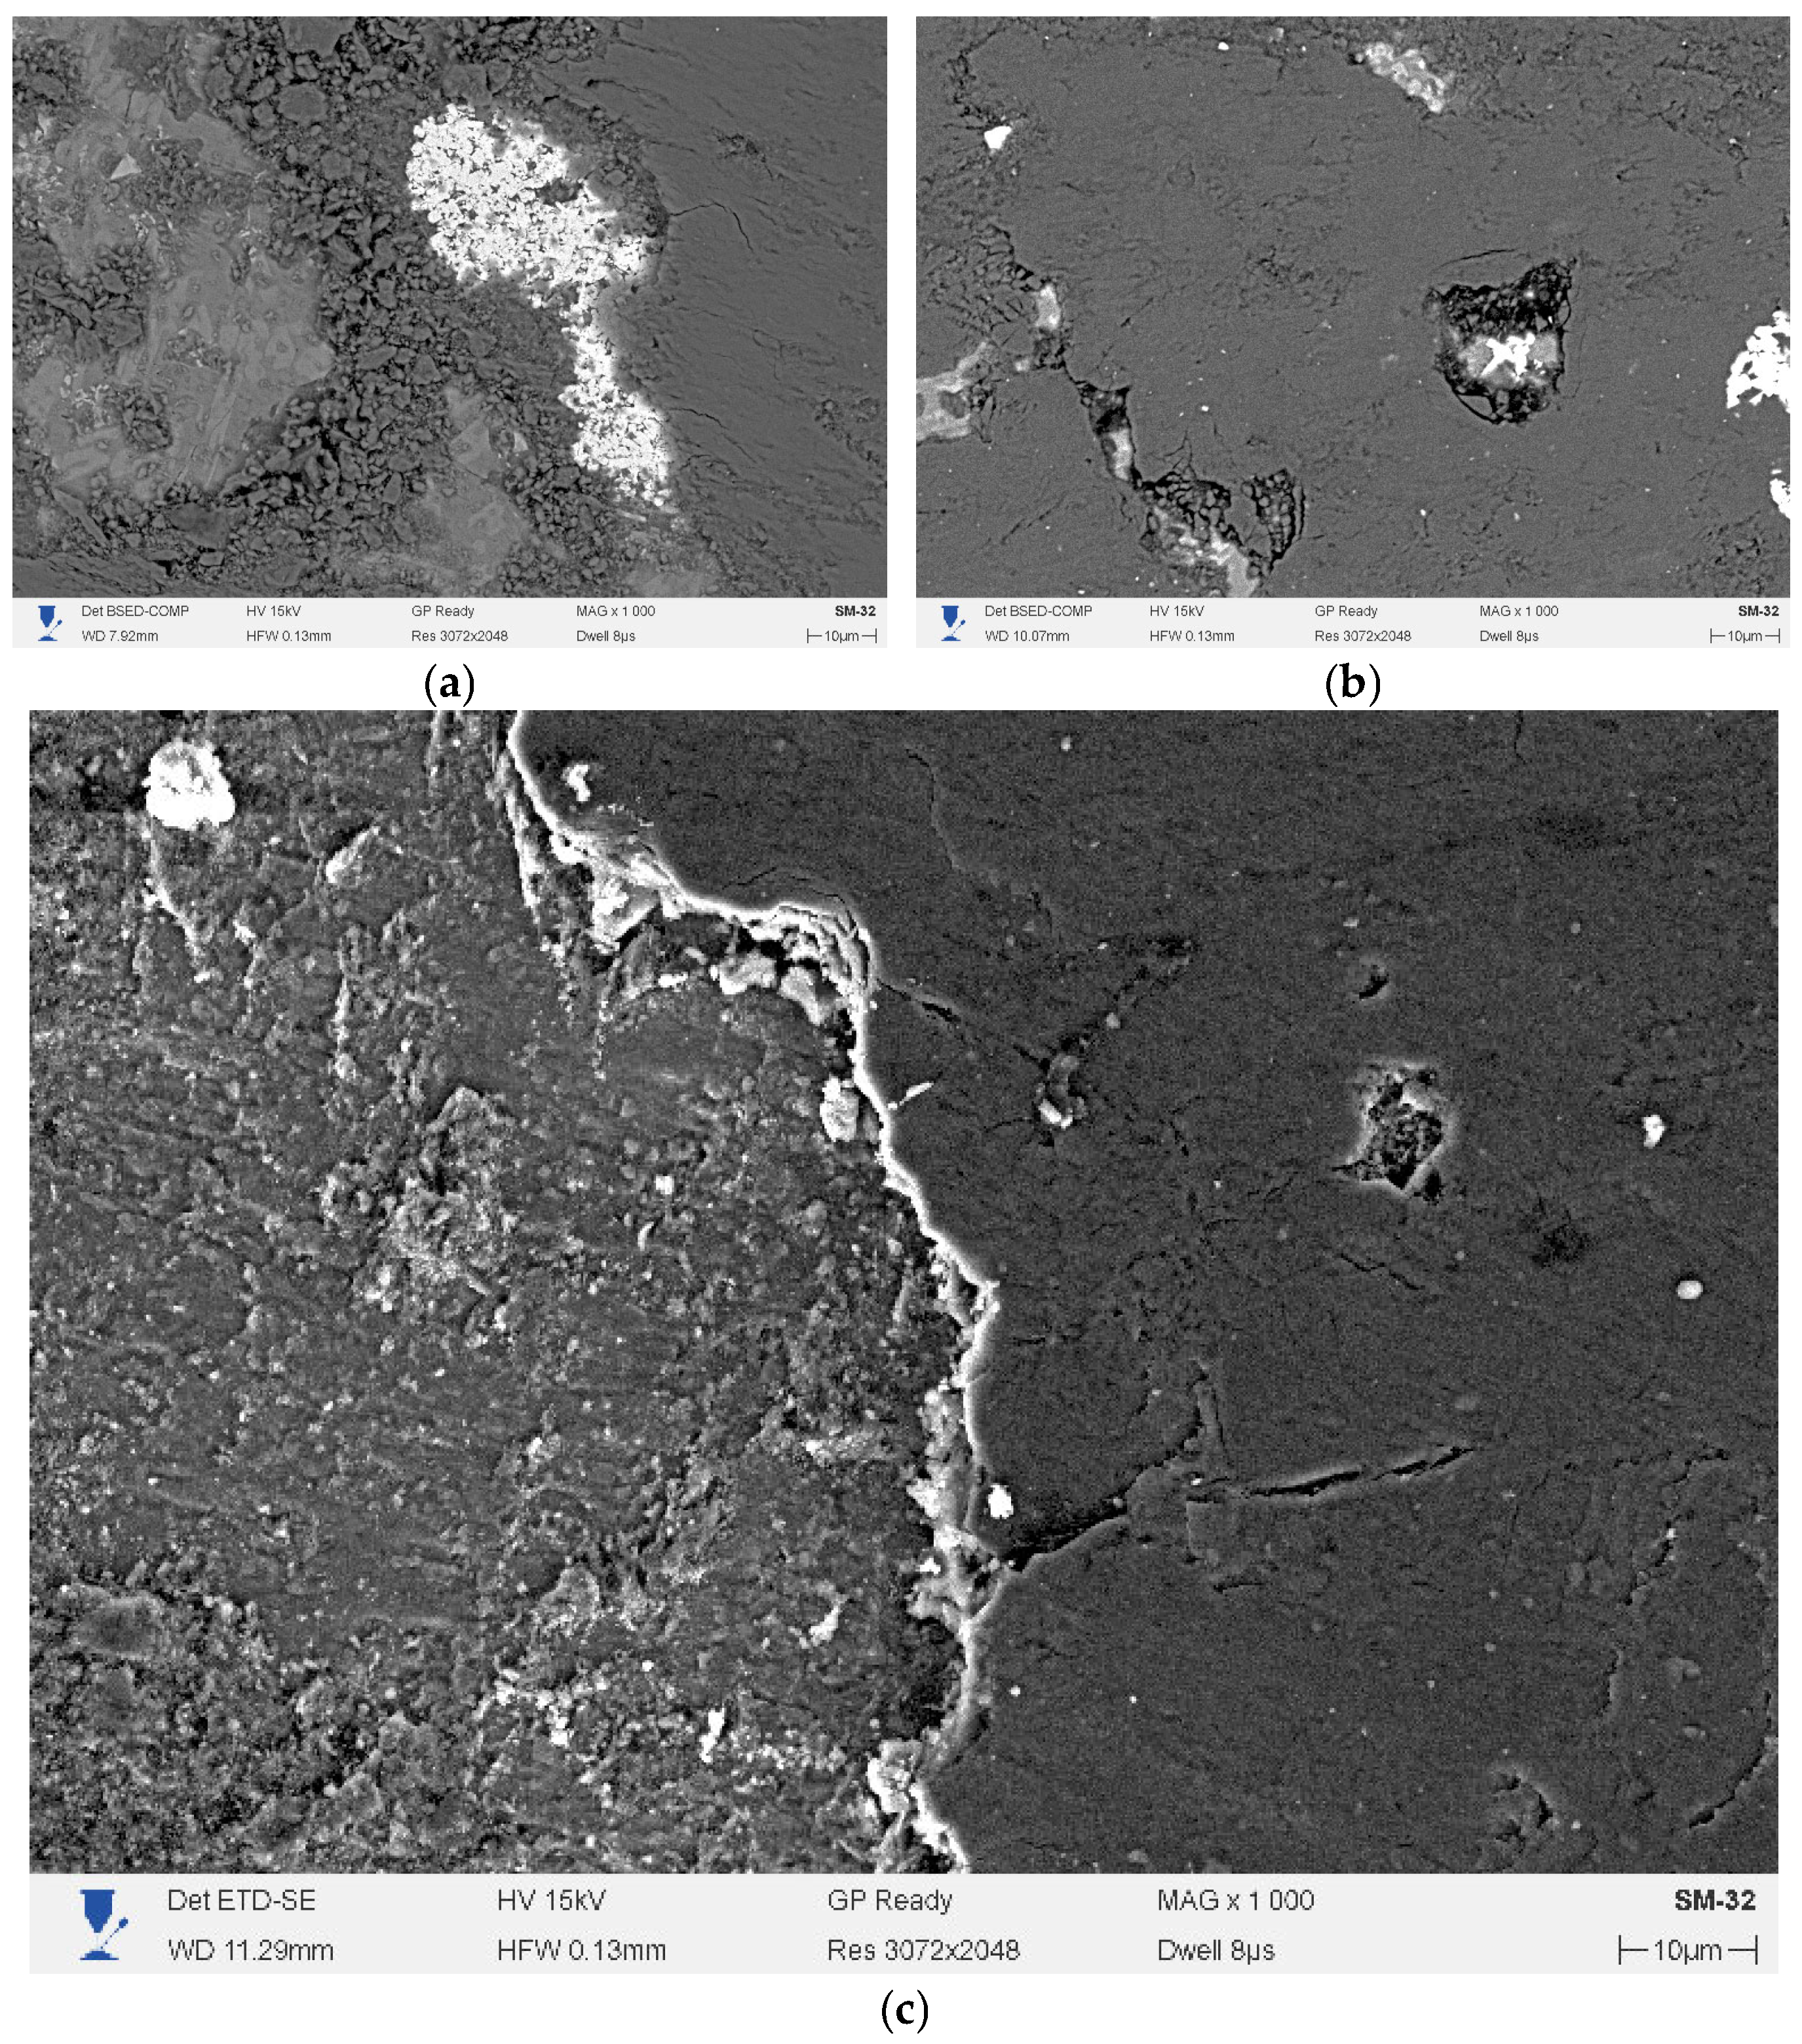
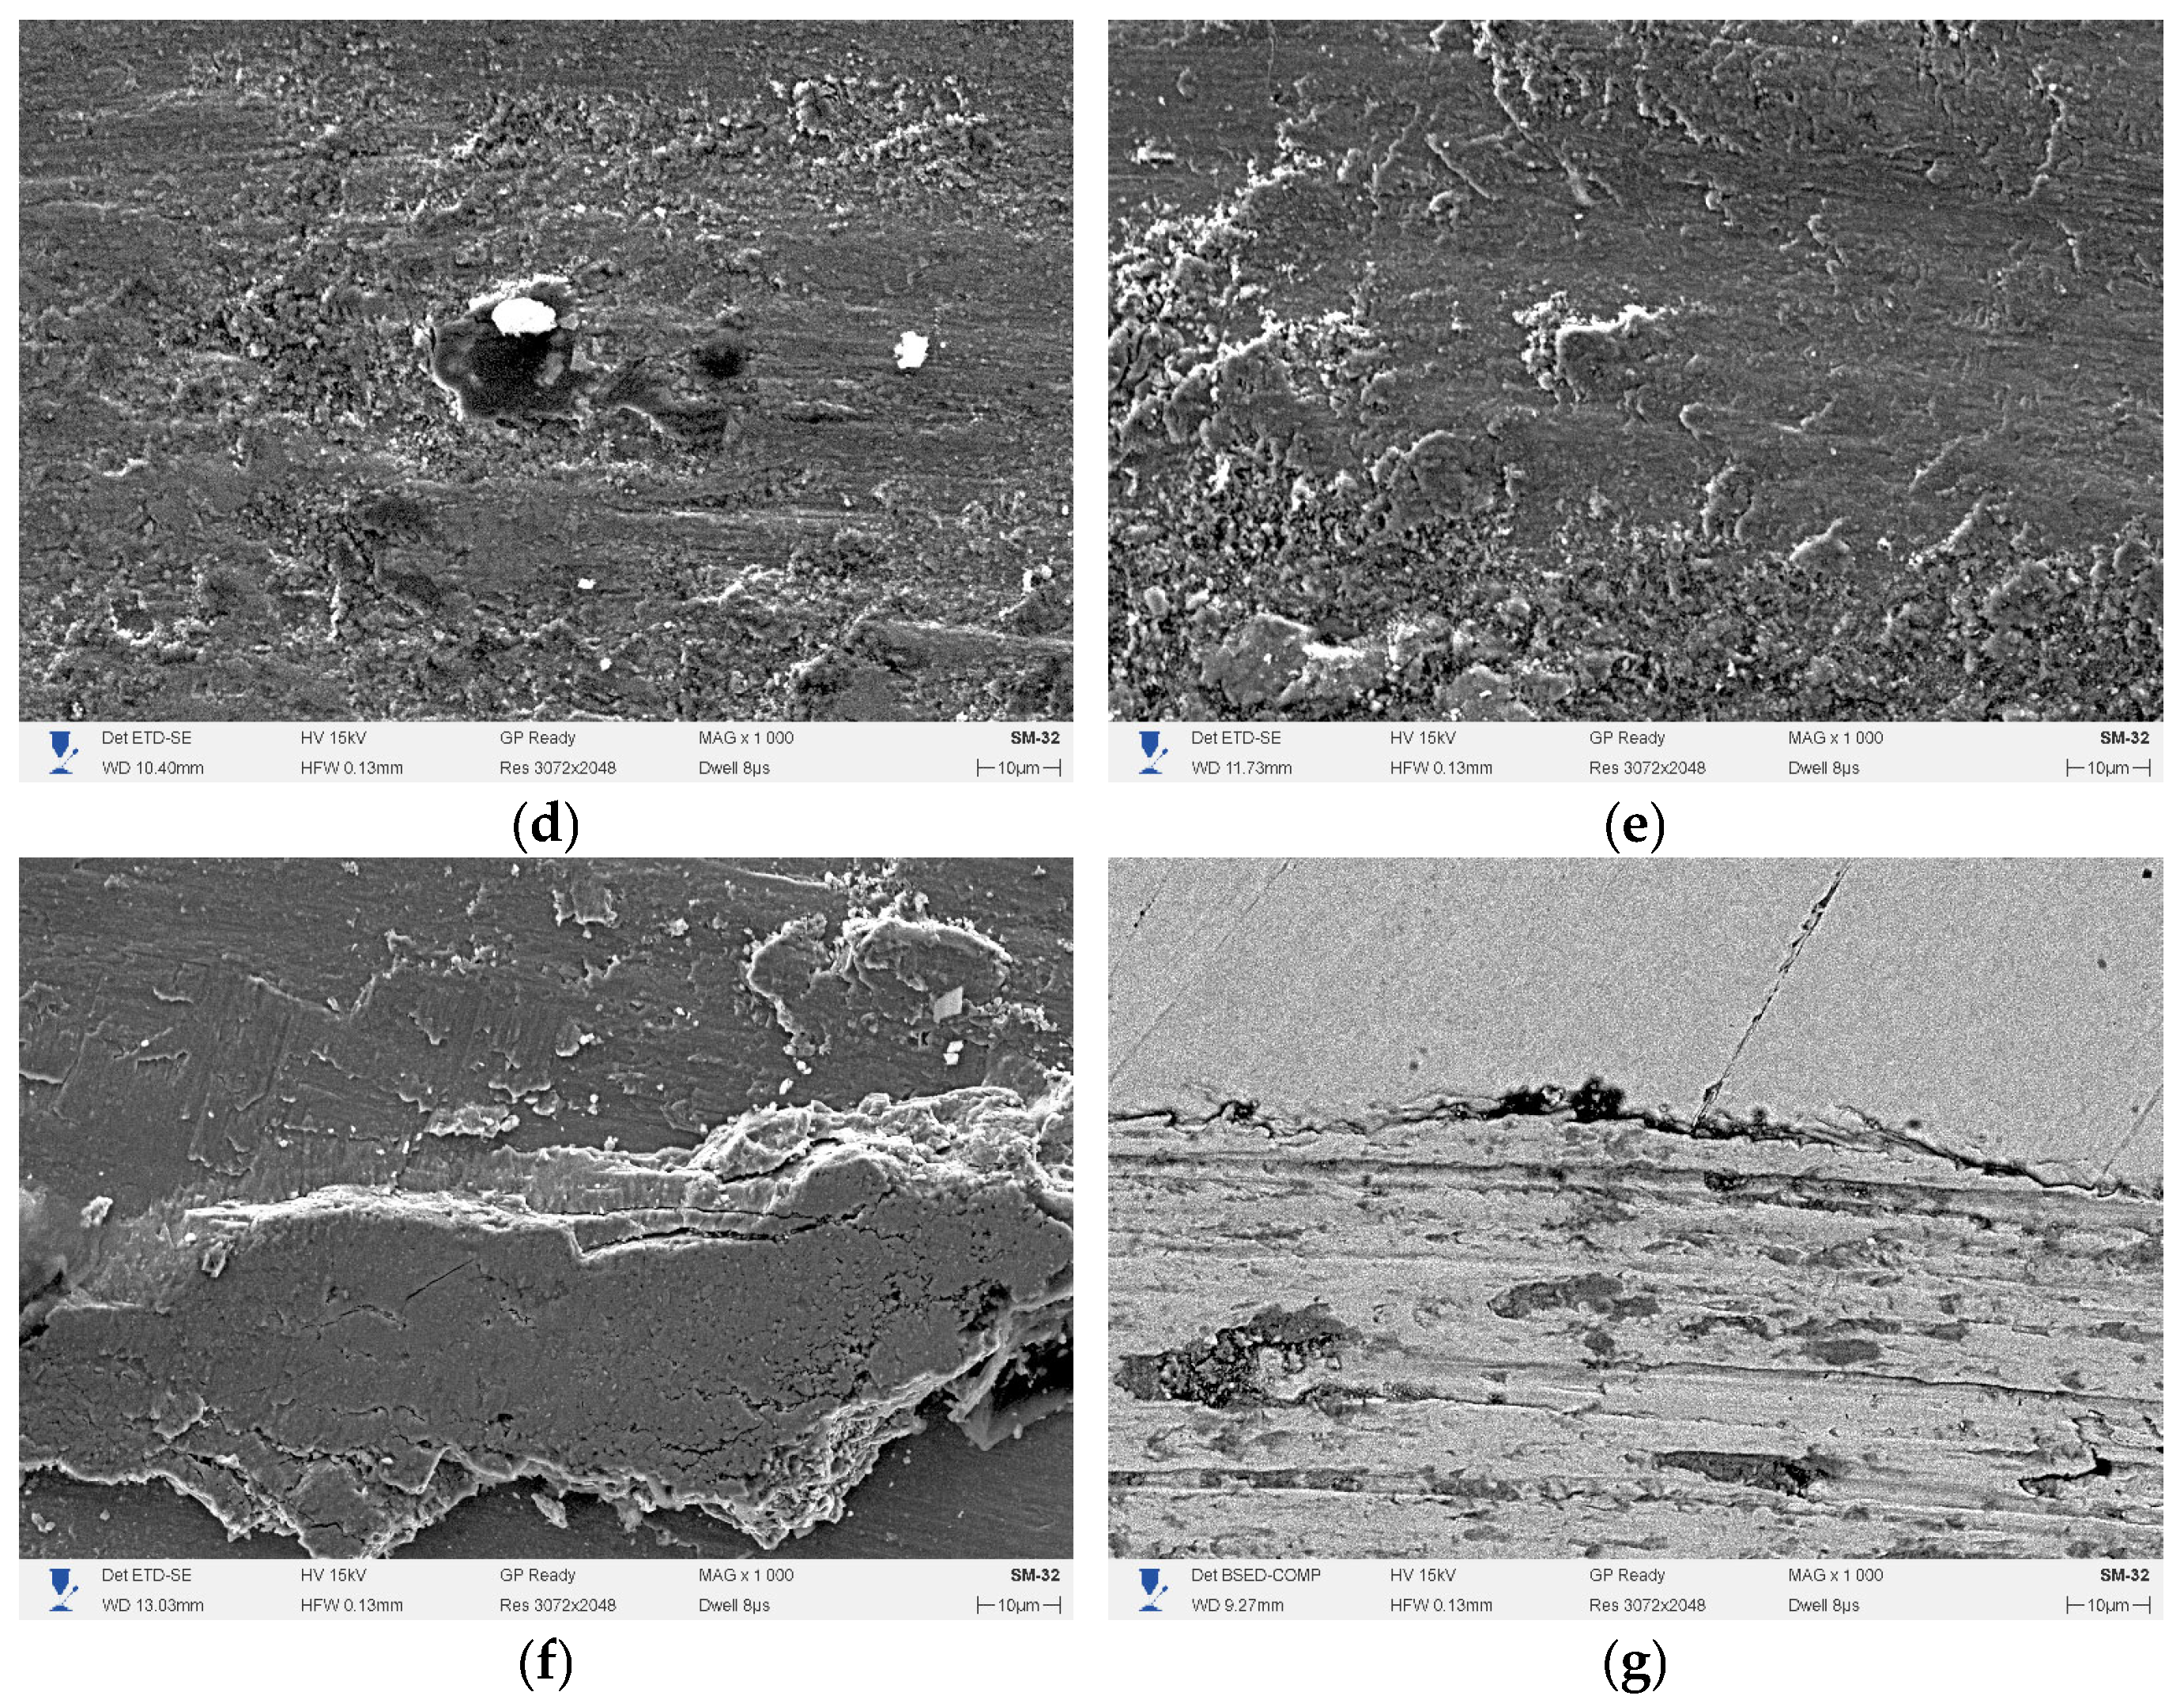
SEM analysis of wear tracks (Figure 9 and Figure 10) confirms these trends and enables identification of the dominant wear mechanisms for each cladding regime. Low-magnification overview images (Figure 9a–g) show a systematic increase in wear track width from S2 to samples produced at higher heat input, with S2 exhibiting the narrowest track.
In sample S1 (50 A, Figure 10a), the wear track contains numerous angular WC fragments (2–10 μm), a network of surrounding cracks, and a dark tribochemical film along the track edges. This morphology corresponds to a mixed wear mechanism combining third-body abrasive wear with an adhesive component in the γ-Ni matrix regions [26,27].
Sample S2 (60 A, Figure 10b) exhibits a distinctly different morphology: the dominant defects are isolated crater-like pull-outs (5–20 μm) with remnants of W-containing phases inside. This morphology is consistent with a fatigue-driven pull-out mechanism under cyclic loading, while the matrix between the craters shows relatively low wear, in agreement with the low overall wear volume [28,29].
In sample S3 (70 A, Figure 10c), a two-zone surface is formed: one region is covered with regular parallel grooves (~0.5–1 μm wide), while the adjacent region consists of smooth areas of intense plastic deformation separated by a step of ~1–2 μm. This morphology indicates a mixed abrasive–adhesive mechanism with significant plastic deformation of the γ-Ni matrix, which has lost carbide reinforcement [26].
For sample S4 (80 A, Figure 10d), predominantly abrasive wear is observed: the surface is covered with regular parallel grooves (~0.5–2 μm wide) with characteristic ridges of plastically displaced material. Isolated rounded pits (~5–10 μm) containing bright phase remnants are likely associated with Cr7C3 precipitates identified in cross-sectional analysis.
The wear surfaces of samples S5 (90 A, Figure 10e) and S6 (100 A, Figure 10f) differ fundamentally from those at lower currents. Sample S5 exhibits a combination of dense parallel grooves (~0.5–1 μm) and fatigue delamination zones (~30–40 μm), indicating a mixed abrasive–fatigue mechanism. Sample S6 shows the most homogeneous wear surface: uniform parallel grooves across the surface interrupted by isolated large delamination defects (~35 × 15 μm) with multilayer cracks and lamellar fragments (~2–3 μm thick). This morphology corresponds to a fatigue-delamination mechanism typical of homogeneous matrix alloys with a limited content of strengthening phases.
The wear track morphology of the Steel 45 substrate (Figure 10g) is similar to that of samples S5 and S6: regular grooves (~0.5–1 μm wide) alternate with fatigue delamination regions, and the most prominent feature being a horizontal crack of ~50 μm length. This morphological similarity, together with comparable wear rates, confirms the significant degradation of protective properties for coatings deposited at 90–100 A [28,29].

4. Discussion

The combined analysis of XRD, EDS, microhardness, and tribological data allows four characteristic structural-phase states of the coatings to be distinguished depending on the arc current.
At 50 A, partial retention of WC is observed together with Ni3B and Ni2B borides, Cr3C2 carbide, and the (Fe,Ni)γ matrix. The non-uniform distribution of WC agglomerates across the coating thickness (W = 13.6 wt.% in the top region vs. 6.6 wt.% in the central region, according to EDS) leads to a high hardness variation (CV = 10.2%) and significant scatter in tribological properties.
At 60 A, the most favorable combination of properties is achieved. No WC reflections are detected by XRD; the matrix consists of well-crystallized Ni3B, Ni2B, and Cr7C3 phases within the (Fe,Ni)γ solid solution. The dilution degree is minimal (18.1%), while the Ni content in the matrix reaches its maximum (51.9 wt.%). This combination results in the highest surface hardness (887 ± 76 HV) and the lowest wear rate (4.00 × 10⁻⁶ mm3/(N·m)) among all samples.
At 70–80 A, a transition regime is observed. WC is no longer detected; at 80 A, W2C is identified as an intermediate product of WC decomposition via the reaction WC W2C + [C] [25]. The released carbon contributes to the formation of chromium carbides (Cr7C3 and Cr3C2). The dilution increases to 27.5–33.9%, and the hardness decreases to 552–586 HV. The slightly lower wear rate of S4 compared to S3 is likely associated with partial dispersion strengthening due to Cr7C3 precipitates.
At 90–100 A, the coating matrix is predominantly represented by the (Fe,Ni)γ solid solution; at 100 A, a specific composition of Fe0.64Ni0.36 is identified by XRD. The dilution increases to 42–47%, and the hardness reaches a plateau of approximately 503–522 HV. The wear rate approaches that of the uncoated substrate, indicating a significant degradation of the protective performance of the coatings at these arc currents.
The increased W content in S5–S6 (1.5 and 5.6 wt.% according to EDS), in the absence of crystalline tungsten carbide reflections, indicates dissolution of W into the (Fe,Ni)γ matrix at high heat input; the mechanism underlying the W enrichment at 100 A is discussed in Section 3.2.2. The reduced Cr content in the matrix of S2–S4 (1.9–2.2 wt.% by EDS) is explained by the binding of chromium into carbide and boride phases.
The results of this study are consistent with general trends reported for PTA Ni–WC coatings on steels: the existence of an optimal cladding current at which maximum hardness and wear resistance are achieved is governed by the balance between the retention of strengthening phases and matrix homogenization [6,21,24]. It should be noted that the tribological conclusions for samples S3–S6 are based on single measurements and are therefore preliminary; statistically reliable conclusions require an increased number of repetitions.

5. Conclusions

The effect of arc current (50–100 A) on the microstructure, phase composition, microhardness, and tribological properties of Ni–Cr–B–Si + 35 wt.% WC (PS-12NVK-01) composite coatings deposited by plasma transferred arc (PTA) cladding on a Steel 45 substrate was investigated. The following conclusions can be drawn:
(1)
Combined EDS and XRD analysis of polished cross-sections reveals three distinct regimes of compositional evolution depending on the arc current. At 50 A, partial retention of WC is observed along with Cr3C2, Ni3B, Ni2B, and (Fe,Ni)γ, with a dilution degree of 26.6%. At 60 A, no WC reflections are detected; the coating matrix consists of Ni3B, Ni2B, Cr7C3, and (Fe,Ni)γ, with the lowest dilution (18.1%) and the highest Ni content (51.9 wt.%). At 70–100 A, progressive dissolution of carbide phases and increasing Fe incorporation from the substrate lead to the formation of an (Fe,Ni)γ matrix; at 100 A, the dilution reaches 46.6%, and the matrix composition approaches Fe0.64Ni0.36.
(2)
According to BSE cross-sectional images, the coating thickness increases from 1.94 mm at 50 A to a maximum of 2.70 mm at 80 A, followed by a decrease to 1.95 mm at 100 A, which correlates with increasing substrate melting depth at higher heat input. The coating/substrate interface is clearly defined at 50–60 A and becomes progressively more diffuse at 90–100 A, in agreement with EDS data indicating increased dilution.
(3)
The maximum surface hardness of 887 ± 76 HV (CV = 8.6%) is achieved at 60 A, exceeding the hardness of the Steel 45 substrate (~213 HV) by more than four times. The most significant hardness reduction occurs in the 60–70 A range (−22.2% at the surface and −27.0% in cross-section), indicating a threshold transition associated with the loss of carbide strengthening. At 90–100 A, the hardness reaches a plateau (~503–522 HV), suggesting that the strengthening potential is governed primarily by substrate dilution.
(4)
The coating produced at 60 A exhibits the best tribological performance, with a wear rate of 4.00 × 10⁻⁶ mm3/(N·m), approximately 22 times lower than that of the uncoated Steel 45 substrate (8.858 × 10⁻⁵ mm3/(N·m)). The transition from 60 to 70 A results in an approximately ninefold increase in wear rate, consistent with the loss of carbide reinforcement observed by XRD and EDS. At 90–100 A, the wear rate approaches that of the uncoated substrate, indicating a significant deterioration in protective performance. Tribological conclusions for samples S3–S6 are based on single measurements and should be considered preliminary.
(5)
Based on the combined microstructural, compositional, mechanical, and tribological results, an arc current of 60 A is identified as the optimal cladding condition for PS-12NVK-01 powder on a Steel 45 substrate under the applied processing parameters. This regime provides the highest surface hardness, the lowest wear rate, and minimal dilution, making it promising for the restoration and strengthening of worn roller mill shafts in agricultural machinery applications.

Author Contributions

Conceptualization, A.S. and K.O.; methodology, A.S. and Z.S.; software, D.O.; validation, A.S., Z.S. and D.O.; formal analysis, A.S. and D.O.; investigation, A.S. and Z.S.; resources, B.R. and K.O.; data curation, Z.S.; writing—original draft preparation, A.S.; writing—review and editing, A.S., K.O. and B.R.; visualization, D.O.; supervision, K.O. and B.R.; project administration, K.O.; funding acquisition, B.R. All authors have read and agreed to the published version of the manuscript.

Funding

This research has been funded by the Committee of Science of the Ministry of Science and Higher Education of the Republic of Kazakhstan (Grant No. BR24992870).

Data Availability Statement

The original contributions presented in this study are included in the article. Further inquiries can be directed to the corresponding author.

Acknowledgments

The authors would like to express their sincere gratitude to Vladislav Kots (Shakarim University NPJSC) for his valuable contributions to data analysis, interpretation of results, and manuscript revision.

Conflicts of Interest

Author Bauyrzhan Rakhadilov was employed by the company PlasmaScience LLP. The remaining authors declare that the research was conducted in the absence of any commercial or financial relationships that could be construed as a potential conflict of interest.

References

  1. Varela, L.B.; Tressia, G.; Masoumi, M.; Bortoleto, E.M.; Regattieri, C.; Sinatora, A. Roller crushers in iron mining, how does the degradation of Hadfield steel components occur? Eng. Fail. Anal. 2021, 122, 105295. [Google Scholar] [CrossRef]
  2. Machado, P.C.; Pereira, J.I.; Sinatora, A. Abrasion wear of austenitic manganese steels via jaw crusher test. Wear 2021, 476, 203726. [Google Scholar] [CrossRef]
  3. Appiah, A.N.S.; Bialas, O.; Żuk, M.; Czupryński, A.; Sasu, D.K.; Adamiak, M. Hardfacing of mild steel with wear-resistant Ni-based powders containing tungsten carbide particles using powder plasma transferred arc welding technology. Mater. Sci. 2022, 40, 42–63. [Google Scholar] [CrossRef]
  4. Appiah, A.N.S.; Bialas, O.; Czupryński, A.; Adamiak, M. Powder Plasma Transferred Arc Welding of Ni-Si-B+60 wt%WC and Ni-Cr-Si-B+45 wt%WC for Surface Cladding of Structural Steel. Materials 2022, 15, 4956. [Google Scholar] [CrossRef]
  5. Buitkenov, D.; Nabioldina, A.; Alibekov, A.; Molbossynov, Y. The Influence of Air Pressure in Electric Arc Spraying on the Properties of 30KhGSA/20Kh13 Bilayer Coatings. Materials 2026, 19, 232. [Google Scholar] [CrossRef] [PubMed]
  6. Appiah, A.N.S.; Wyględacz, B.; Matus, K.; Reimann, Ł.; Bialas, O.; Batalha, G.F.; Czupryński, A.; Adamiak, M. Microstructure and performance of NiCrBSi coatings prepared by modulated arc currents using powder plasma transferred arc welding technology. Appl. Surf. Sci. 2024, 648, 159065. [Google Scholar] [CrossRef]
  7. Rose, D.; Wolfe, T.; Henein, H. Microstructural Characterization of 70 Wt Pct WC-NiBSi Deposited by PTA-AM. Metall. Mater. Trans. A 2024, 55, 447–465. [Google Scholar] [CrossRef]
  8. Yaedu, A.E.; D’Oliveira, A.S.C.M. Cobalt based alloy PTA hardfacing on different substrate steels. Mater. Sci. Technol. 2005, 21, 459–466. [Google Scholar] [CrossRef]
  9. Bartkowski, D.; Bartkowska, A.; Piasecki, A.; Jurči, P. Influence of laser cladding parameters on microstructure, microhardness, chemical composition, wear and corrosion resistance of Fe–B composite coatings reinforced with B4C and Si particles. Coatings 2020, 10, 809. [Google Scholar] [CrossRef]
  10. Deuis, R.L.; Yellup, J.M.; Subramanian, C. Metal-matrix composite coatings by PTA surfacing. Compos. Sci. Technol. 1998, 58, 299–309. [Google Scholar] [CrossRef]
  11. Ding, Y.; Liu, R.; Yao, J.; Zhang, Q.; Wang, L. Stellite alloy mixture hardfacing via laser cladding for control valve seat sealing surfaces. Surf. Coat. Technol. 2017, 329, 97–108. [Google Scholar] [CrossRef]
  12. Nurminen, J.; Näkki, J.; Vuoristo, P. Microstructure and properties of hard and wear resistant MMC coatings deposited by laser cladding. Int. J. Refract. Met. Hard Mater. 2009, 27, 472–478. [Google Scholar] [CrossRef]
  13. Shynarbek, A.; Satbayeva, Z.; Rakhadilov, B.; Orynbekov, D.; Zhassulan, A.; Ormanbekov, K.; Kadyrbolat, N.; Askerzhanov, D. Effect of PTA Current on Microstructure, Phase Constitution, Hardness and Dry-Sliding Wear of Fe–Cr–C Layers Deposited on 35L Cast Steel. Metals 2026, 16, 308. [Google Scholar] [CrossRef]
  14. GOST 1050-2013; High-Quality Structural Carbon and Alloy Steel: General Technical Conditions. Standartinform: Moscow, Russia, 2014.
  15. Kou, S. Welding Metallurgy, 2nd ed.; Wiley-Interscience: Hoboken, NJ, USA, 2003; pp. 223–225. [Google Scholar]
  16. Suthar, F.V.; Shah, H.N.; Mandal, D.; Chaudhury, S.K. Effect of deposition current on microstructure, hardness and residual stress distribution of NiCrBSiC hardfacing alloy. J. Mater. Eng. Perform. 2025, 34, 10080–10092. [Google Scholar] [CrossRef]
  17. Chakraborty, G.; Kumar, N.; Das, C.R.; Albert, S.K.; Bhaduri, A.K.; Dash, S.; Tyagi, A.K. Study on microstructure and wear properties of different nickel base hardfacing alloys deposited on austenitic stainless steel. Surf. Coat. Technol. 2014, 244, 180–188. [Google Scholar] [CrossRef]
  18. Tahaei, A.; Vanani, B.B.; Abbasi, M.; Arizmendi-Morquecho, A. A different attempt to investigate the influence of PTA parameters on microstructure evolution and mechanical characteristics of nickel base powder (Ni-WC) deposited tool steel. J. Mater. Res. Technol. 2023, 27, 7970–7985. [Google Scholar] [CrossRef]
  19. Passos, T.A.; Costa, H.; Luz, F.K.C.; Pintaude, G. The effect of the dilution level on microstructure and wear resistance of Fe-Cr-CV hardfacing coatings deposited by PTA-P. Coatings 2022, 12, 1835. [Google Scholar] [CrossRef]
  20. Luo, K.; He, J.; Ma, H.; Wang, C.; Lu, J.; Li, C.; Peng, Y.; Wu, N.; Luo, F. Dissolution behaviour of WC particles and evolution of precipitated phases in the plasma transfer arc Ni-based composite coating reinforced by 30 wt% WC particles. Ceram. Int. 2024, 50, 35065–35078. [Google Scholar] [CrossRef]
  21. Chen, F.R.; Li, Z.L.; Shan, Q.; Jiang, Y.H.; Zhang, Y.F.; Zhang, F. Effects of different matrix on interface and compression fracture behavior of WC particles reinforced iron matrix composites. In Materials Science Forum; Trans Tech Publications Ltd.: Schwyz, Switzerland, 2018; Volume 913, pp. 480–489. [Google Scholar] [CrossRef]
  22. Luo, K.; Luo, Z.; Li, C.; Li, G.; Lu, J.; He, J.; Wu, Z.; Wang, C.; Luo, F. High-temperature tribological and oxidation behaviour of PTAW-deposited NiCrBSi coating in steel-on-coating contact up to 800 °C. Tribol. Int. 2025, 215, 111503. [Google Scholar] [CrossRef]
  23. Chen, B.; Zhang, B.; Zhao, D.; Gao, P.; Naumov, A.; Li, Q.; Li, F.; Yang, Z.; Guo, Y.; Li, J.; et al. Microstructure and Properties of FeAlC-x (WC-Co) Composite Coating Prepared through Plasma Transfer Arc Cladding. Coatings 2024, 14, 128. [Google Scholar] [CrossRef]
  24. Zhang, C.; Zhang, L.; Wang, Y.; Li, S.; Li, J.; Xie, Z. Microstructural evolution and dissolution mechanisms of hard WC particles reinforced nickel based composite coatings fabricated by plasma transferred arc welding. J. Alloys Compd. 2025, 1019, 179293. [Google Scholar] [CrossRef]
  25. Yuan, J.; Huang, Y.; Wang, L.; Jia, C.; Zhang, F.; Yang, L. Effect of the dissolution characteristic of tungsten carbide particles on microstructure and properties of Ni-WC/W2C reinforcement coating manufactured by TIG cladding. Int. J. Refract. Met. Hard Mater. 2023, 110, 106047. [Google Scholar] [CrossRef]
  26. Feng, L.; Li, C.; Han, X.; Luo, F.; Sun, H. Experimental Study on Preparation of Tungsten-Carbide-Particle-Reinforced Nickel-Based Alloy Plasma Surfacing Layer on Descaling Roller Surface. Coatings 2024, 14, 729. [Google Scholar] [CrossRef]
  27. Vidaković, I.; Šimunović, K.; Heffer, G.; Špada, V. Microstructural analysis of flame-sprayed and PTA-deposited nickel-based self-fluxing alloy coatings. Weld. World 2024, 68, 2819–2836. [Google Scholar] [CrossRef]
  28. Zhang, W.; Gong, W.; Chen, Y.; Li, M. A New Dual-Mode Wear Model of Abrasion–Fatigue for Plane (100Cr6)-Cylinder (C45E4) Steel Pairs with Fractal Surfaces. Tribol. Trans. 2021, 64, 1095–1107. [Google Scholar] [CrossRef]
  29. Jojith, R.; Sam, M.; Radhika, N. Recent advances in tribological behavior of functionally graded composites: A review. Eng. Sci. Technol. An. Int. J. 2022, 25, 100999. [Google Scholar] [CrossRef]
Figure 1. Plasma transferred arc (PTA) deposition system and operating principle: (a) six-axis robotic manipulator equipped with PTA torch; (b) PTA power source and control unit; (c) schematic illustration of the PTA cladding process and plasma torch configuration.
Metals 16 00642 g001
Figure 2. Overview BSE images of cross-sections of PTA coatings S1–S6 deposited at different arc currents: (a) S1, 50 A; (b) S2, 60 A; (c) S3, 70 A; (d) S4, 80 A; (e) S5, 90 A; (f) S6, 100 A.
Metals 16 00642 g002
Figure 3. Detailed BSE micrographs at higher magnifications (200–500×) for coatings deposited at different arc currents: (a) 50 A; (b) 60 A (200×); (c) 60 A (500×); (d) 70 A; (e) 80 A; (f) 90 A; (g) 100 A.
Metals 16 00642 g003aMetals 16 00642 g003b
Figure 4. SEM images and corresponding EDS elemental mapping of coatings S1–S6 deposited at different arc currents. (a) powder; (b) S1; (c) S2; (d) S3; (e) S4; (f) S5; (g) S6.
Metals 16 00642 g004
Figure 5. XRD patterns of the coatings deposited at different currents.
Metals 16 00642 g005
Figure 6. Vickers microhardness (HV0.2) depth profiles at different arc currents.
Metals 16 00642 g006
Figure 7. Mean surface microhardness (HV0.2) at different arc currents with standard deviation.
Metals 16 00642 g007
Figure 8. Evolution of the coefficient of friction with sliding distance for PTA coatings at arc currents of 50–100 A and Steel 45 substrate. Test conditions: 100Cr6 ball, 3 mm diameter; load 10 N; sliding speed 3 cm/s; total distance 100 m; ambient air.
Metals 16 00642 g008
Figure 9. Overview of SEM (ETD-SE) images of wear tracks of coatings and Steel 45 substrate: (a) S1, 50 A; (b) S2, 60 A; (c) S3, 70 A; (d) S4, 80 A; (e) S5, 90 A; (f) S6, 100 A; (g) Steel 45.
Metals 16 00642 g009aMetals 16 00642 g009b
Figure 10. High-magnification SEM images of wear track surfaces: (a) S1—BSED-COMP, 1000×; (b) S2—BSED-COMP, 1000×; (c) S3—ETD-SE, 1000×; (d) S4—ETD-SE, 1000×; (e) S5—ETD-SE, 1000×; (f) S6—ETD-SE, 1000×; (g) Steel 45—BSED-COMP, 1000×. Accelerating voltage: 15 kV; SEM3200 (CIQTEK Co., Ltd., Hefei, China).
Metals 16 00642 g010aMetals 16 00642 g010b
Table 1. Fixed PTA process parameters and resulting heat input for specimens deposited at arc currents from 50 to 100 A.
SpecimenVoltage, VCurrent, AHeat Input kJ/mm, η = 0,7Shielding Gas (Ar), L/minPlasma Gas (Ar), L/minPowder Carrier Gas (Ar), L/minPowder Feed Rate, g/minTraverse Speed, mm/min
S125500.26121.51.412200
S2600.32
S3700.37
S4800.42
S5900.47
S61000.53
Table 2. Coating thickness of S1–S6 based on BSE cross-sectional images.
SampleS1S2S3S4S5S6
Current, A5060708090100
Thickness, mm1.942.252.232.702.251.95
Table 3. Elemental composition of coatings S1–S6 based on EDS analysis (100×, normalized values, wt.%, excluding C and O).
SampleCurrent, ANiFeWCrSiDilution, %
S15032.631.76.98.42.726.6
S26051.924.11.62.25.018.1
S37041.732.50.41.93.927.5
S48042.938.20.71.94.033.9
S59031.645.51.53.03.342.1
S610021.249.55.66.62.146.6
Table 4. Elemental distribution across the thickness of coatings S1–S3 (EDS, 500×, wt.%).
SampleZoneNiFeWCr
S1 (50 A)Top37.821.813.69.1
Middle40.822.96.69.4
Bottom27.137.87.57.1
S2 (60 A)Top53.826.00.21.6
Middle54.222.11.22.0
Bottom45.531.00.62.7
S3 (70 A)Top44.230.30.61.8
Table 5. XRD reflection identification based on HighScore Plus (PDF-2) data for PTA Ni–Cr–B–Si + WC coatings deposited on Steel 45 substrate.
MaterialPhaseCrystal StructureJCPDS2θ (°)
Powder (PS-12NVK-01)WCHexagonal51-093931.67; 35.80; 48.44; 64.14; 73.18; 77.19; 84.11; 98.71
NiFCC04-085044.34; 51.58; 92.18
CrBOrthorhombic06-068638.12; 46.14; 73.18; 75.54
Cr7C3Hexagonal36-148239.20; 42.10; 46.14; 49.41; 65.94; 82.40
NiSiOrthorhombic65-482831.67; 47.35; 51.58
S1 (50 A)WCHexagonal51-093931.79; 35.79; 48.49
Cr3C2Orthorhombic35-080435.79; 38.88; 47.10; 48.49; 51.24; 75.55
Ni3BOrthorhombic82-169944.14; 45.89; 47.10; 91.34
Ni2BTetragonal73-189435.79; 45.89
(Fe,Ni)γFCC47-141744.14; 51.24; 75.55; 91.34
S2 (60 A)FeSiCubic38-139735.13
Cr7C3Hexagonal36-148245.88; 51.32; 81.99
Ni3BOrthorhombic82-169944.31; 45.88; 46.58; 81.99; 91.63
Ni2BTetragonal73-189445.88; 75.47; 81.99
(Fe,Ni)γFCC47-141744.31; 51.32; 75.47; 91.63
NiFCC04-085044.31; 46.58; 64.73
S3 (70 A)Cr3C2Orthorhombic35-080435.97; 39.08; 46.91; 51.02; 75.29; 91.13
Cr7C3Hexagonal36-148239.08; 44.02; 51.02; 75.29
Ni3BOrthorhombic82-169944.02; 46.91; 91.13; 92.65
(Fe,Ni)γFCC47-141744.02; 51.02; 75.29; 91.13
NiFCC04-085044.02; 51.02; 92.65
S4 (80 A)Cr7C3Hexagonal36-148239.19; 44.00; 51.03; 75.14; 80.75
Cr3C2Orthorhombic35-080439.19; 46.83; 51.03; 75.14; 80.75
W2CHexagonal35-077639.19; 75.14; 80.75; 96.55
(Fe,Ni)γFCC47-141744.00; 51.03; 75.14
NiFCC04-085039.19; 44.00
S5 (90 A)Cr3C2Orthorhombic35-080439.13; 43.95; 50.86; 74.92; 92.36
Cr7C3Hexagonal36-148239.13; 43.95; 50.86; 74.92
(Fe,Ni)γFCC47-141743.95; 50.86; 74.92; 92.36
S6 (100 A)Cr7C3Hexagonal36-148241.92; 43.80; 45.96; 50.81; 61.02; 74.85
Fe0.64Ni0.36FCC47-141743.80; 50.81; 74.85; 90.64
(Fe,Ni)γFCC47-141743.80; 50.81; 74.85; 90.64
Cr23C6Cubic35-078337.53; 48.35; 90.64
Ni2BTetragonal73-189445.96; 74.85
Steel 45 (substrate)α-FeBCC06-069644.69; 64.95; 82.30; 98.86
Table 6. Tribological characteristics of PTA Ni–Cr–B–Si + WC coatings at different arc currents and Steel 45 substrate.
SpecimenCurrent,
A
Wear Track Area,
μm2
K, mm3/(N·m)Coefficient of Friction μ (Mean)σ of μ
Steel 45-14,100.88.858 × 10−50.6120.030
S150763.7 ± 695.64.80 × 10−6 ± 4.37 × 10−60.6250.098
S260637.1 ± 380.54.00 × 10−6 ± 2.39 × 10−60.6180.095
S3705716.83.591 × 10−50.6730.093
S4803208.52.016 × 10−50.6620.127
S59017,448.51.096 × 10−40.5550.081
S610014,539.29.134 × 10−50.5440.081
Disclaimer/Publisher’s Note: The statements, opinions and data contained in all publications are solely those of the individual author(s) and contributor(s) and not of MDPI and/or the editor(s). MDPI and/or the editor(s) disclaim responsibility for any injury to people or property resulting from any ideas, methods, instructions or products referred to in the content.