Article

Realizing quasi-VPSC and quasi-Taylor Model by Varying the Boundary Conditions in Submodel of Crystal Plasticity FEM

1
School of Mechanical Engineering, Nantong University, Nantong 226019, China
2
School of Mechanical, Materials, Mechatronic and Biomedical Engineering, University of Wollongong, Wollongong, NSW 2522, Australia
*
Author to whom correspondence should be addressed.
Metals 2026, 16(6), 621; https://doi.org/10.3390/met16060621
Submission received: 5 February 2026 / Revised: 27 May 2026 / Accepted: 2 June 2026 / Published: 5 June 2026

Abstract

The uniform-field Taylor model, mean-field visco-plastic self-consistent (VPSC), and full-field crystal plasticity finite element method (CPFEM) are three typical and inherently different crystal plasticity (CP) models. In this report, these three CP models were realized within the CPFEM framework via Submodel modeling techniques. In the full-constraint Taylor model, the strain history from the Wholemodel was applied to all finite element method (FEM) nodes, while the strain from the Wholemodel was placed only on the boundaries of the Submodel in the VPSC model. The predicted textures with the Taylor, VPSC, and CPFEM models were compared, and the rolling textures at macroscopic scale were acceptably captured, and the micro-bands were also predicted by the CPFEM and VPSC. Finally, the contribution and limitations of this integrated modeling method were discussed.

1. Introduction

Crystal plasticity (CP) has become a well-established and powerful method for predicting grain-scale deformation [1,2], which takes the microstructural features into account [3,4]. This method has been successfully used to predict texture evolution, microstructure refinement, and dislocation density, etc., during different processes [1,2,5,6]. The phase field method [7] and damage mechanics [8] have been introduced into CP for predicting thermally related phenomena and microstructure-related fractures, respectively. Various open-source CP software has been proposed for different applications [9,10]. Originally, the development of the CP model can be traced back to 1938, when the Taylor model was proposed. In the full-constraint Taylor model [11], the deformation of a grain is the same as the imposed strain at the sample scale. The stress balance at grain boundaries and grain interaction are disregarded. Five slip systems are necessary to be activated to accommodate the imposed deformation, and based on the full-constraint Taylor model, relaxed Taylor models were developed and fewer activated slip systems are required [12]. Originating from Eshelby‘s theory, the visco-plastic self-consistent (VPSC) model [13] was proposed in the 1950s by Kröner et al., and then the VPSC code was developed and widely used by Tomé & Lebensohn [14]. In the VPSC model, grains are treated as inclusions within a homogeneous effective medium (HEM) that represents the whole sample. The stress and strain compatibility are properly addressed, but the grain interaction is not ensured. With the advancement of computer science and FEM software, the CP constitutive model was incorporated into the FEM, where the FEM served as the solver for the constitutive law considered at each single FEM integration point [15]. In the CPFEM, the stress equilibrium and strain compatibility are guaranteed, and grain interaction is allowed. The microstructure/texture evolution and plastic deformation are mutually influenced, and they are fully coupled in the CPFEM.
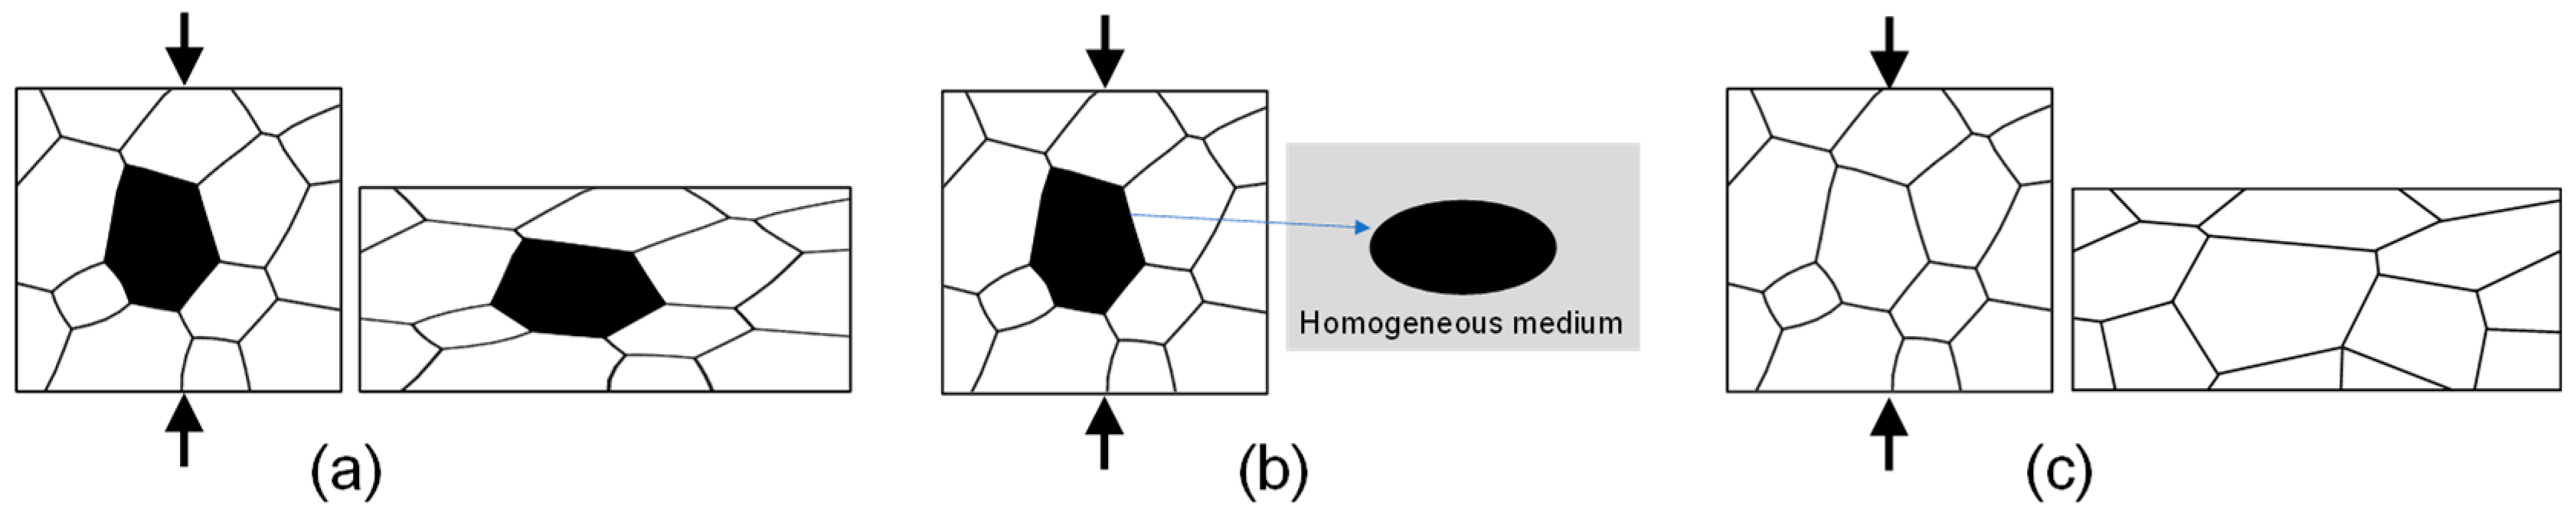
Though more advanced CP models have been proposed, the CP models can be mainly categorized into three types according to the assumed homogenization [16], where the Taylor model is also called the uniform-field method (Figure 1a), the VPSC model is called the mean-field method (Figure 1b), and the CPFEM is called the full-field method (Figure 1c); the deformation pattern and assumed homogenization are schematically shown in Figure 1. These three types of CP models have been extensively investigated. The Taylor and VPSC models are able to statistically predict texture evolution [12], and the computation time is relatively small due to the adopted deformation assumption. In contrast, the coupling between microstructure/texture and plastic deformation in the CPFEM enables it to accurately predict local heterogeneity [16], but the required computation time is huge. These three CP models were used in different areas in consideration of application purposes, prediction accuracy, and computation cost. Researchers usually use different CP codes when applying them into practical simulations, which is inconvenient. Unifying these three CP models has not been reported, since the assumed homogenization behind these three typical categories of CP models is distinctly different.
Realizing these three CP models within the framework of the CPFEM is the purpose of this study. The quasi-Taylor and quasi-VPSC models were realized by combining the CPFEM and Submodel method. This way, only the CPFEM formulation is enough to perform quasi-Taylor, quasi-VPSC, and CPFEM simulations, where the only difference between them is the applied boundary conditions in the Submodel. The predictions of these three CP models are compared and validated, and finally the applicability and limitations of this method are discussed.

2. Modeling Method

In this study, a two-scale modeling technique was used. The Wholemodel with conventional elastic–plastic constitutive law was first developed at the macroscopic scale, which represented the whole geometry and global deformation behavior. At the microscopic scale, the Submodel with CP constitutive law was then constructed, which refers to a local region of interest using boundary conditions transferred from the Wholemodel. The VPSC and Taylor models were integrated by varying the boundary conditions in the Submodel. The realization of the VPSC and Taylor models is different from the theoretically assumed homogenization, but the applied strain was based on the theoretical assumption, and these two CP models were called quasi-VPSC and quasi-Taylor.

2.1. Wholemodel: FEM Modeling

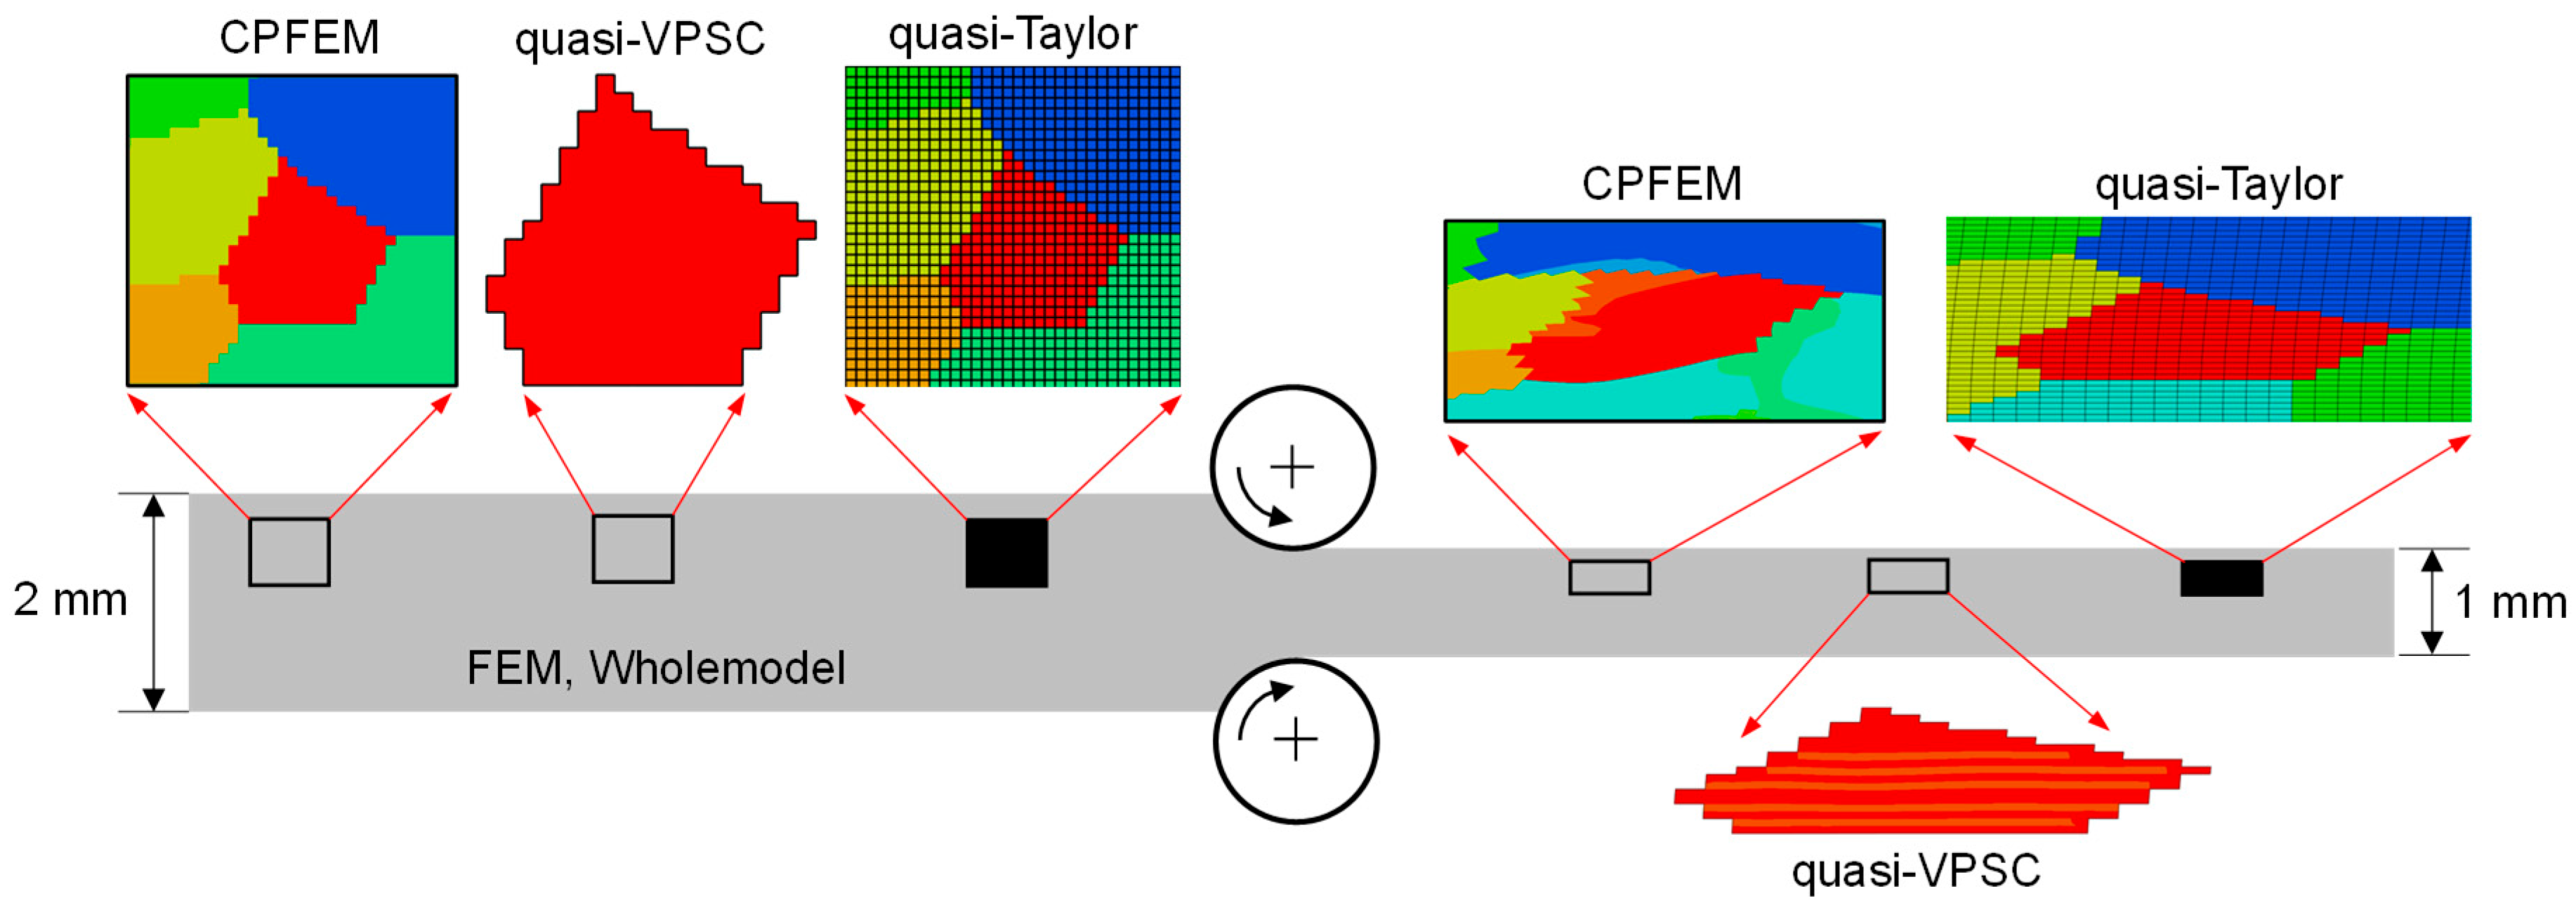
Rolling was chosen to demonstrate the modeling method, since rolling is one of the most widely used processing techniques and the rolling texture has been extensively reported. Additionally, both compression and shear strain are imposed during processing, and this complex strain state makes rolling a good option for use as the demonstration. The 2D plane strain deformation was assumed, and the element type was CPE4R (Figure 2). The roll diameter was 125 mm, the sample thickness was 2 mm, and the nominal reduction was 50%. The coefficient of friction between the sheet surface and the rolls was 0.1. The elastic–plastic constitutive law was used in the Wholemodel, and the stress–strain curve obtained by fitting the experimental measurement was used as the constitutive law [17]. The tabulated stress–strain curve was assigned to all integration points. Abaqus/Standard 2018 (a commercial FEM package) was used to perform the FEM simulations. The FEM simulations acted as the Wholemodel for the CPFEM, quasi-VPSC, and quasi-Taylor models (Figure 2).

2.2. Submodel: CPFEM, quasi-VPSC, and quasi-Taylor Modeling

In the CP modeling (Figure 2), a representative volume element (RVE) was constructed in the Submodel, in which polycrystalline microstructures were generated. This two-scale modeling method is similar to the FE2 approach [18], while the emphasis of the current study is to integrate the three distinctly different CP models into one approach. The sample size of RVE is 2 mm × 16 mm in this study (Table 1), covering the whole thickness. The CP constitutive law was assigned to all integration points of the Submodel. In the polycrystalline microstructure, each FEM element was assigned by an initial crystallographic orientation, and the integration points within one grain had the same initial orientation. The initial orientations are different from grain to grain, and the initial orientations were randomly generated. A grain contains a number of FEM elements, and these elements rotate in different directions and result in in-grain subdivision. Five microstructures were generated to evaluate the effect of mesh resolution and the grain number on the texture, as listed in Table 1. In these microstructures, the sample size was kept at 2 mm × 16 mm, but the number of elements, number of grains, and the average number of elements in one grain varied. The RVE was used for the quasi-Taylor, quasi-VPSC, and CPFEM models. The RVE configuration, starting microstructural and textural features, and assigned CP constitutive law were the same for all three CP models. The only difference between these three CP models was the applied boundary conditions.
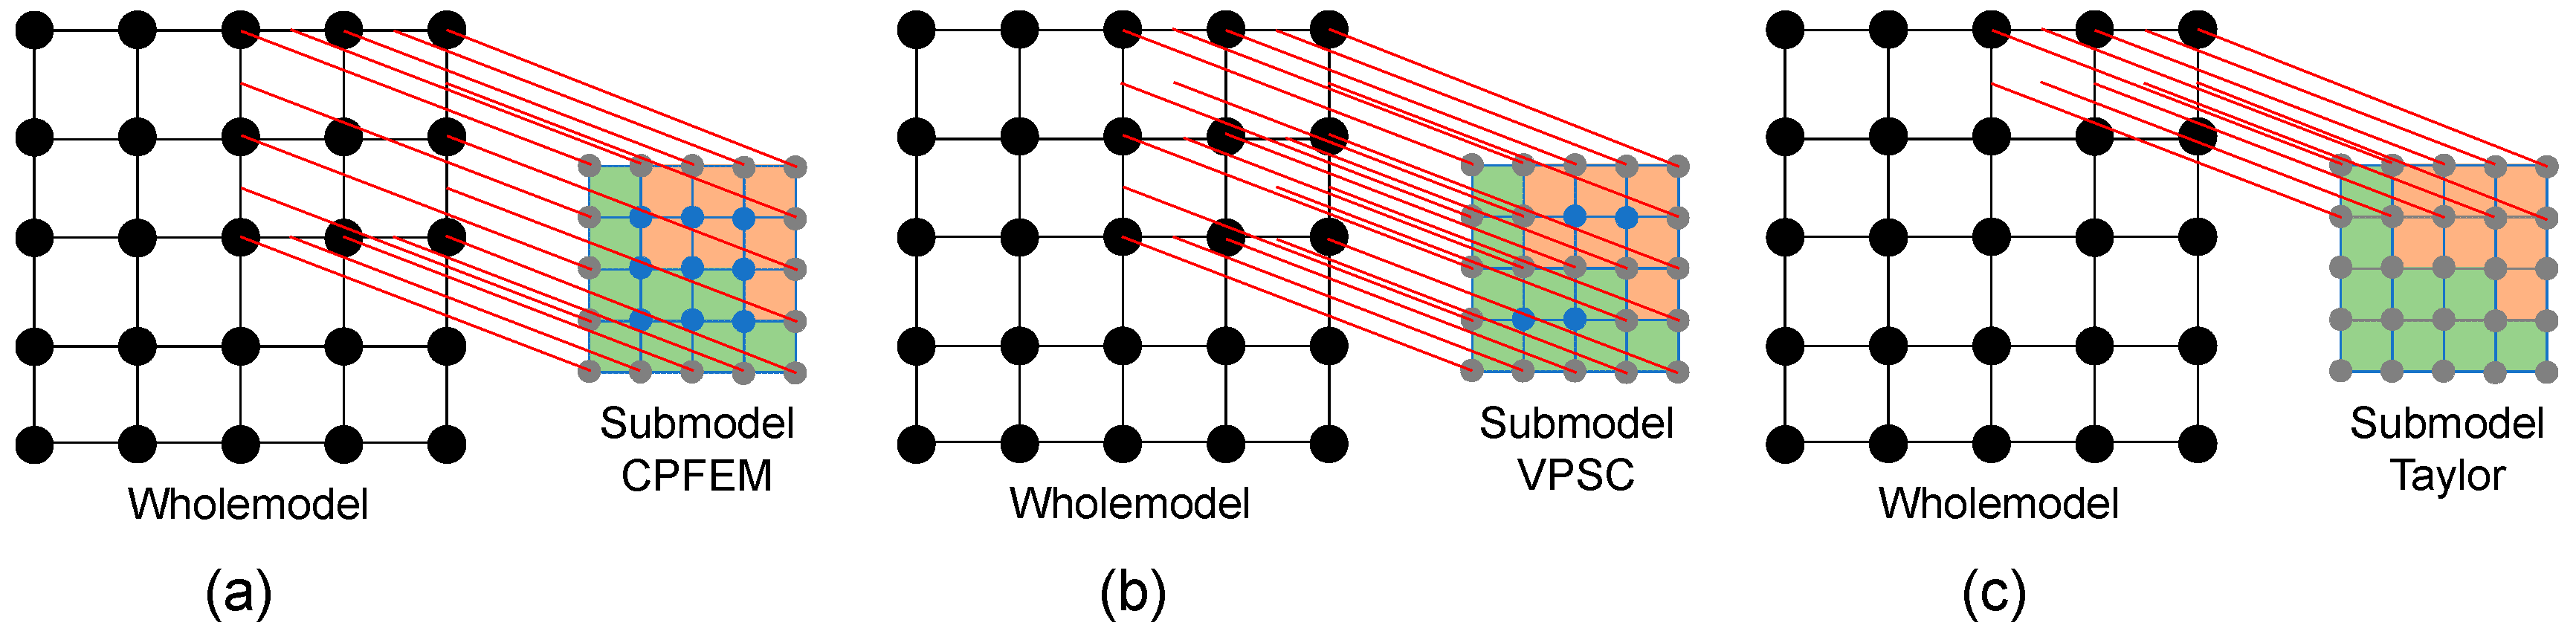
Figure 2 and Figure 3 schematically present how the strain history obtained from the Wholemodel was applied to the Submodel, and how the CPFEM, quasi-VPSC, and quasi-Taylor model were realized via varying boundary conditions in the Submodel. In the CPFEM modeling (Figure 2), an RVE of polycrystalline microstructures was firstly constructed in the Submodel. As schematically shown in Figure 3a, the strain history extracted from the FEM Wholemodel was applied to the boundary of the Submodel, i.e., all the nodes on the Submodel boundaries, and the strain history drove the Submodel to deform. When applying the Submodel, the strain at nodes of the Submodel was obtained by interpolating the strain at neighboring nodes of the Wholemodel when the element sizes in the Wholemodel and Submodel were different (Figure 3a). Similarly, the values at integration points were also interpolated from the adjacent integration points.
In the quasi-VPSC model (Figure 3b), each grain was treated as an inclusion in the homogeneous effective medium, where the homogeneous medium represents the averaged properties of all grains in the polycrystalline microstructure. This indicates that the whole microstructure can be reasonably considered as an isotropic sample when the number of grains is large, i.e., the FEM Wholemodel in this study. In each quasi-VPSC simulation, a grain was constructed in the Submodel, and the strain history obtained from the FEM Wholemodel was applied to the boundary of the Submodel, or more specifically, to the grain boundary. The applied boundary condition in the quasi-VPSC is similar to that in the CPFEM, but the microstructures within the Submodel are different.
As for the quasi-Taylor model (Figure 3c), the imposed deformation into grains is the same as the sample deformation, as previously mentioned in Section 1. Based on this assumption, the strain history obtained from the FEM Wholemodel was applied to all the nodes in the Submodel of polycrystalline microstructures, where the polycrystalline microstructures in the Submodel were the same as those in the CPFEM. The only difference between the CPFEM and Taylor model is how the strain history was applied, where it was applied to the nodes on the boundaries and all the nodes of the Submodel in the former and latter, respectively.
In the Submodel of the CPFEM, quasi-VPSC, and quasi-Taylor, the strain history extracted from the Wholemodel was used as the boundary condition to drive the Submodel to deform, and the CP constitutive law was used in the Submodel. In the CPFEM (Figure 2 and Figure 3a), the outer boundary of the deformed RVE is the same as that region in the Wholemodel, while the intra-grain subdivision and inter-grain interaction are allowed. In the quasi-Taylor model (Figure 2 and Figure 3b), the displacement of each node in the Submodel was the same as the FEM Wholemodel. In the quasi-VPSC model (Figure 2 and Figure 3c), the distortion of the grains was the same as the macroscopic strain, while the interior was determined by the local strain and the local crystal orientation. The microstructure in the Submodel is the same in the CPFEM and quasi-Taylor models, but the difference between these two models is how the strain history was applied. In contrast, the strain history was applied to the boundaries of the Submodel in both the CPFEM and quasi-VPSC models, but the only difference between these two models is the microstructure in the Submodel. It is an RVE in CPFEM modeling, while it is a grain in the quasi-VPSC model.

2.3. CP Constitutive Law and Material Parameters

The CPFEM framework was initially developed by Huang [19]. The kinematic framework was developed by Asaro [20], and the Bassani–Wu hardening model [21], a rate-dependent hardening model, was used. The material parameters were obtained by fitting the experimental stress–strain and texture of pure aluminum under plane strain compression [22]. The CP formulation and hardening model were implemented into Abaqus/Standard Ver 2018 [16]. Twelve {1 1 1} <1 1 0> slip systems were assumed in the FCC structured aluminum. The CP theory, CPFEM implementation, hardening model, and material parameters are given in detail in Appendix A.

3. Numerical Predictions

3.1. Predicted Strain in the FEM Wholemodel

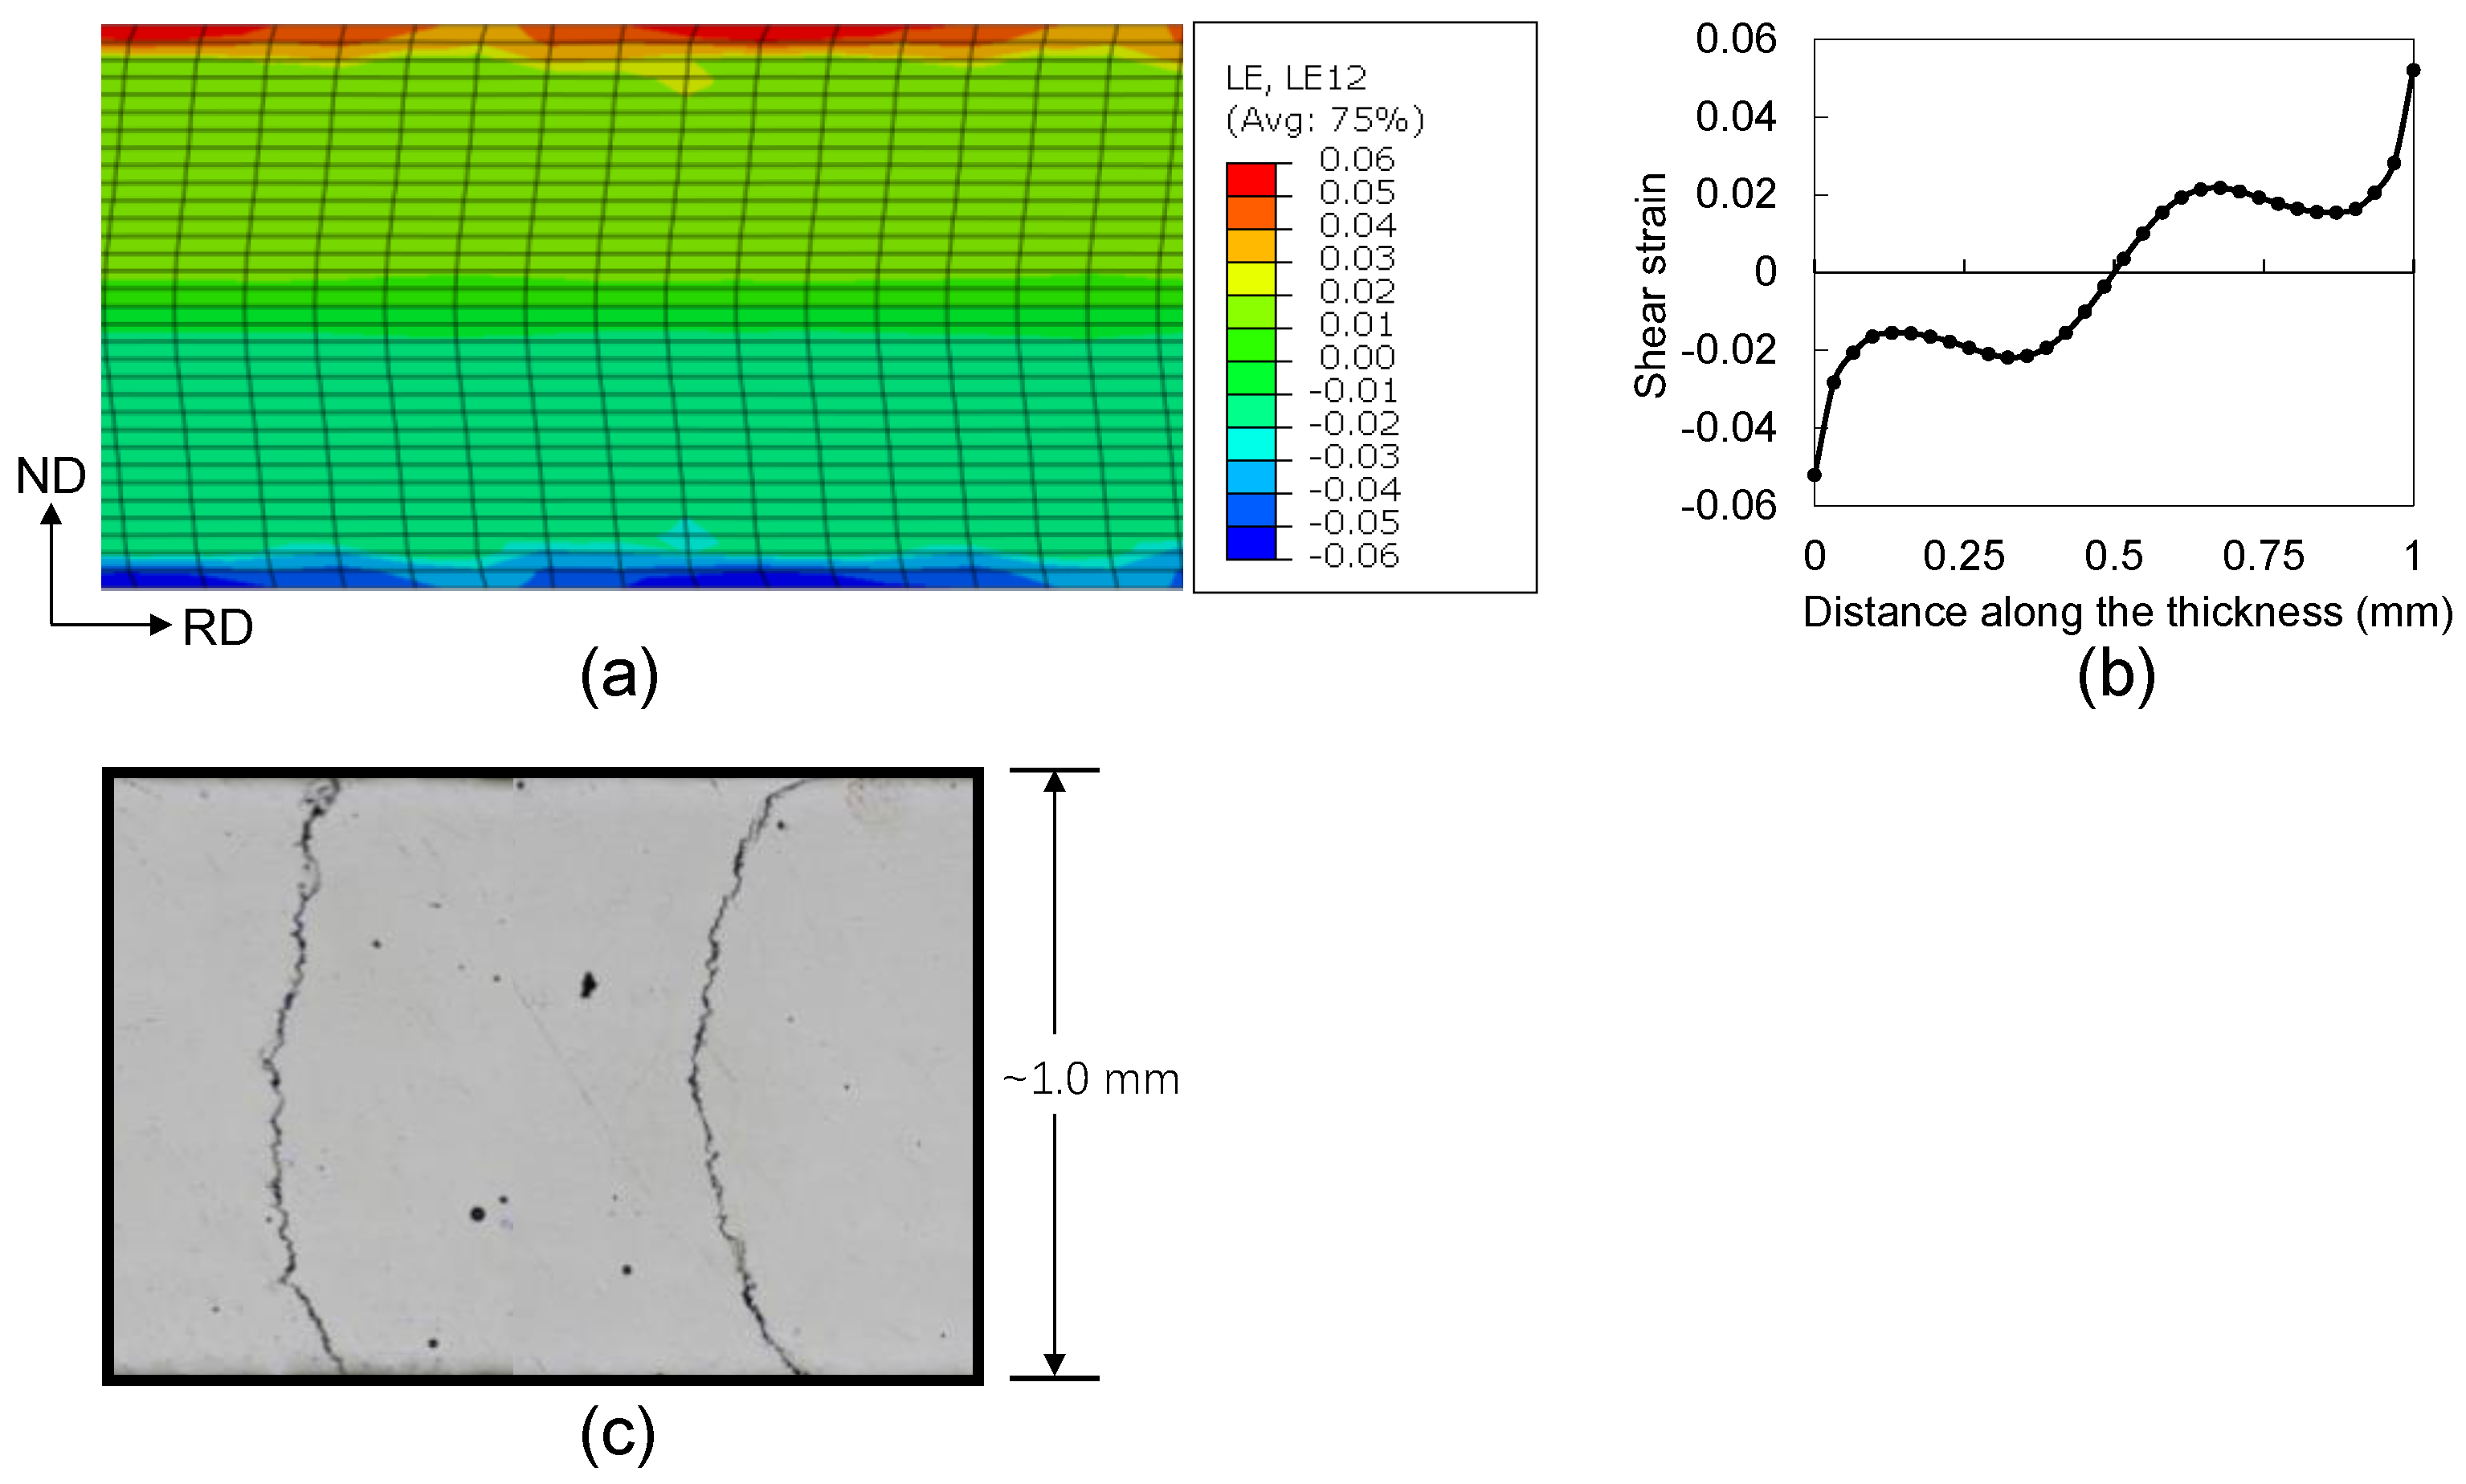
The conventional elastic–plastic FEM simulation was first conducted, and then this simulation was used as the Wholemodel. Figure 4 shows the FEM predictions of the rolling process, where the shear strain on the surfaces is larger than the center region. The FEM predictions agree well with the experimental observations in our previous report [23].

3.2. Effect of Mesh Resolution and Grain Number on Texture Prediction

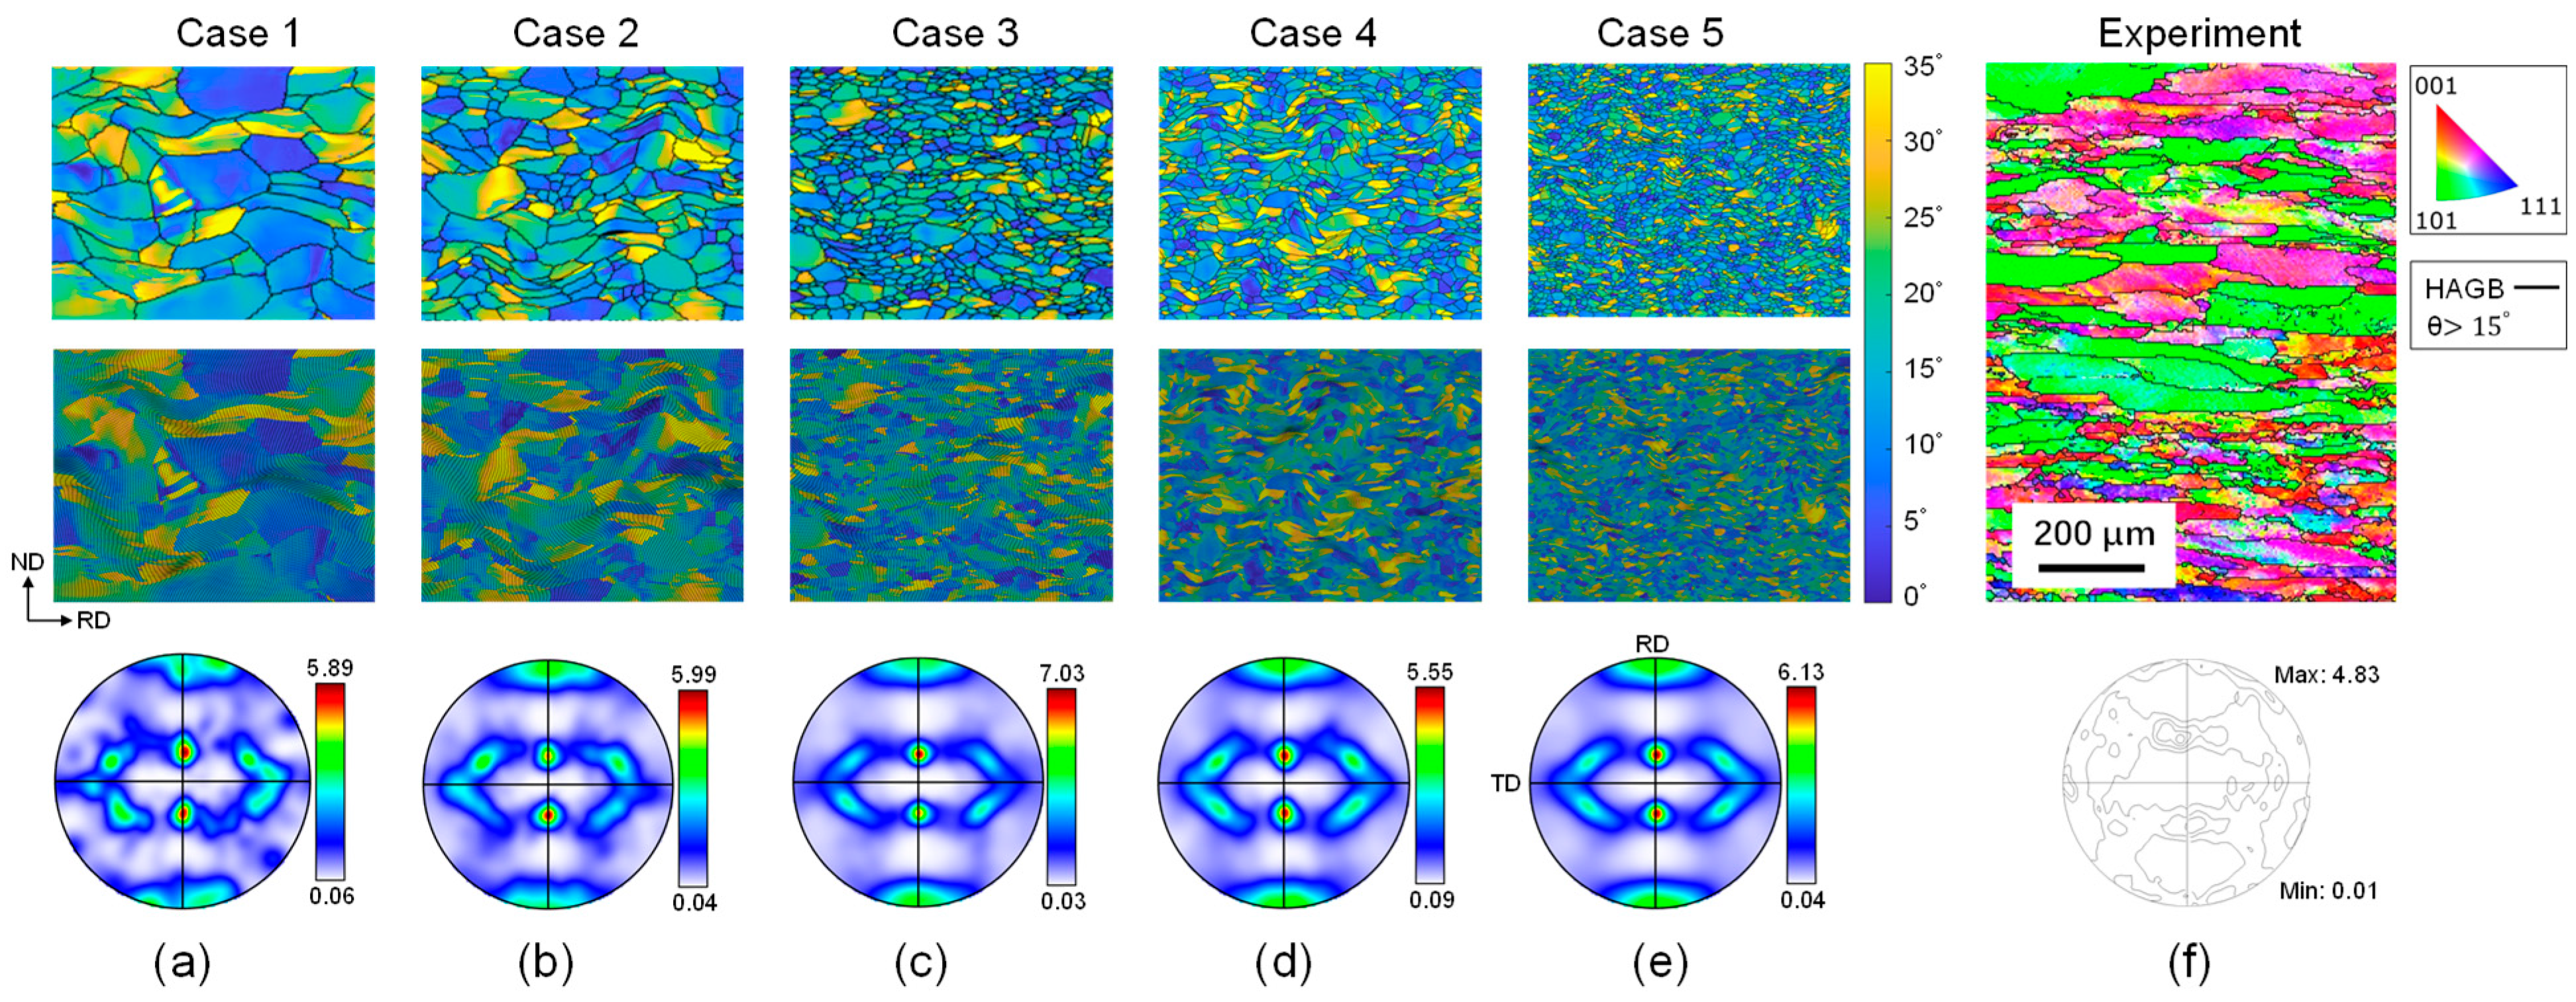
The CPFEM modeling of all five cases in Table 1 was performed, and Figure 5 shows the CPFEM predicted plastic deformation and texture evolution. The black lines in the upper panel of Figure 5a–e are the initial grain boundaries before rolling, while the distorted FEM meshes are shown in the lower panel of Figure 5a–e. It is clear that the distribution of crystal rotation angles varies greatly from grain to grain, where the crystal rotation angle was defined as the misorientation angle between the initial and final crystal orientations. The crystal rotation angles are strongly dependent on the initial crystal orientation, and in-grain subdivision occurred due to the grain interaction. Additionally, macroscopic and microscopic shear bands can also be observed. The distortion of FEM meshes in the middle panel of Figure 5a–e evidently shows the heterogeneity of plastic deformation, especially in Case 1. The {1 1 1} pole figures in the lower panel of Figure 5a–e show that the rolling texture developed and texture intensities are close in all five cases. The CPFEM predicted plastic deformation and texture in Figure 5a–e agree well with the experimental observations in our previous study [23] (Figure 5f). As the number of elements and grains increased, the macroscopic heterogeneity became small, and the pole figures became more symmetric. This implies that the microstructure tends to be isotropic when increasing the number of grains and elements. This validated the use of the conventional FEM simulation to act as the Wholemodel for quasi-VPSC and quasi-Taylor simulations.

3.3. Macro-Scale Predictions Between CPFEM, quasi-VPSC, and quasi-Taylor Models

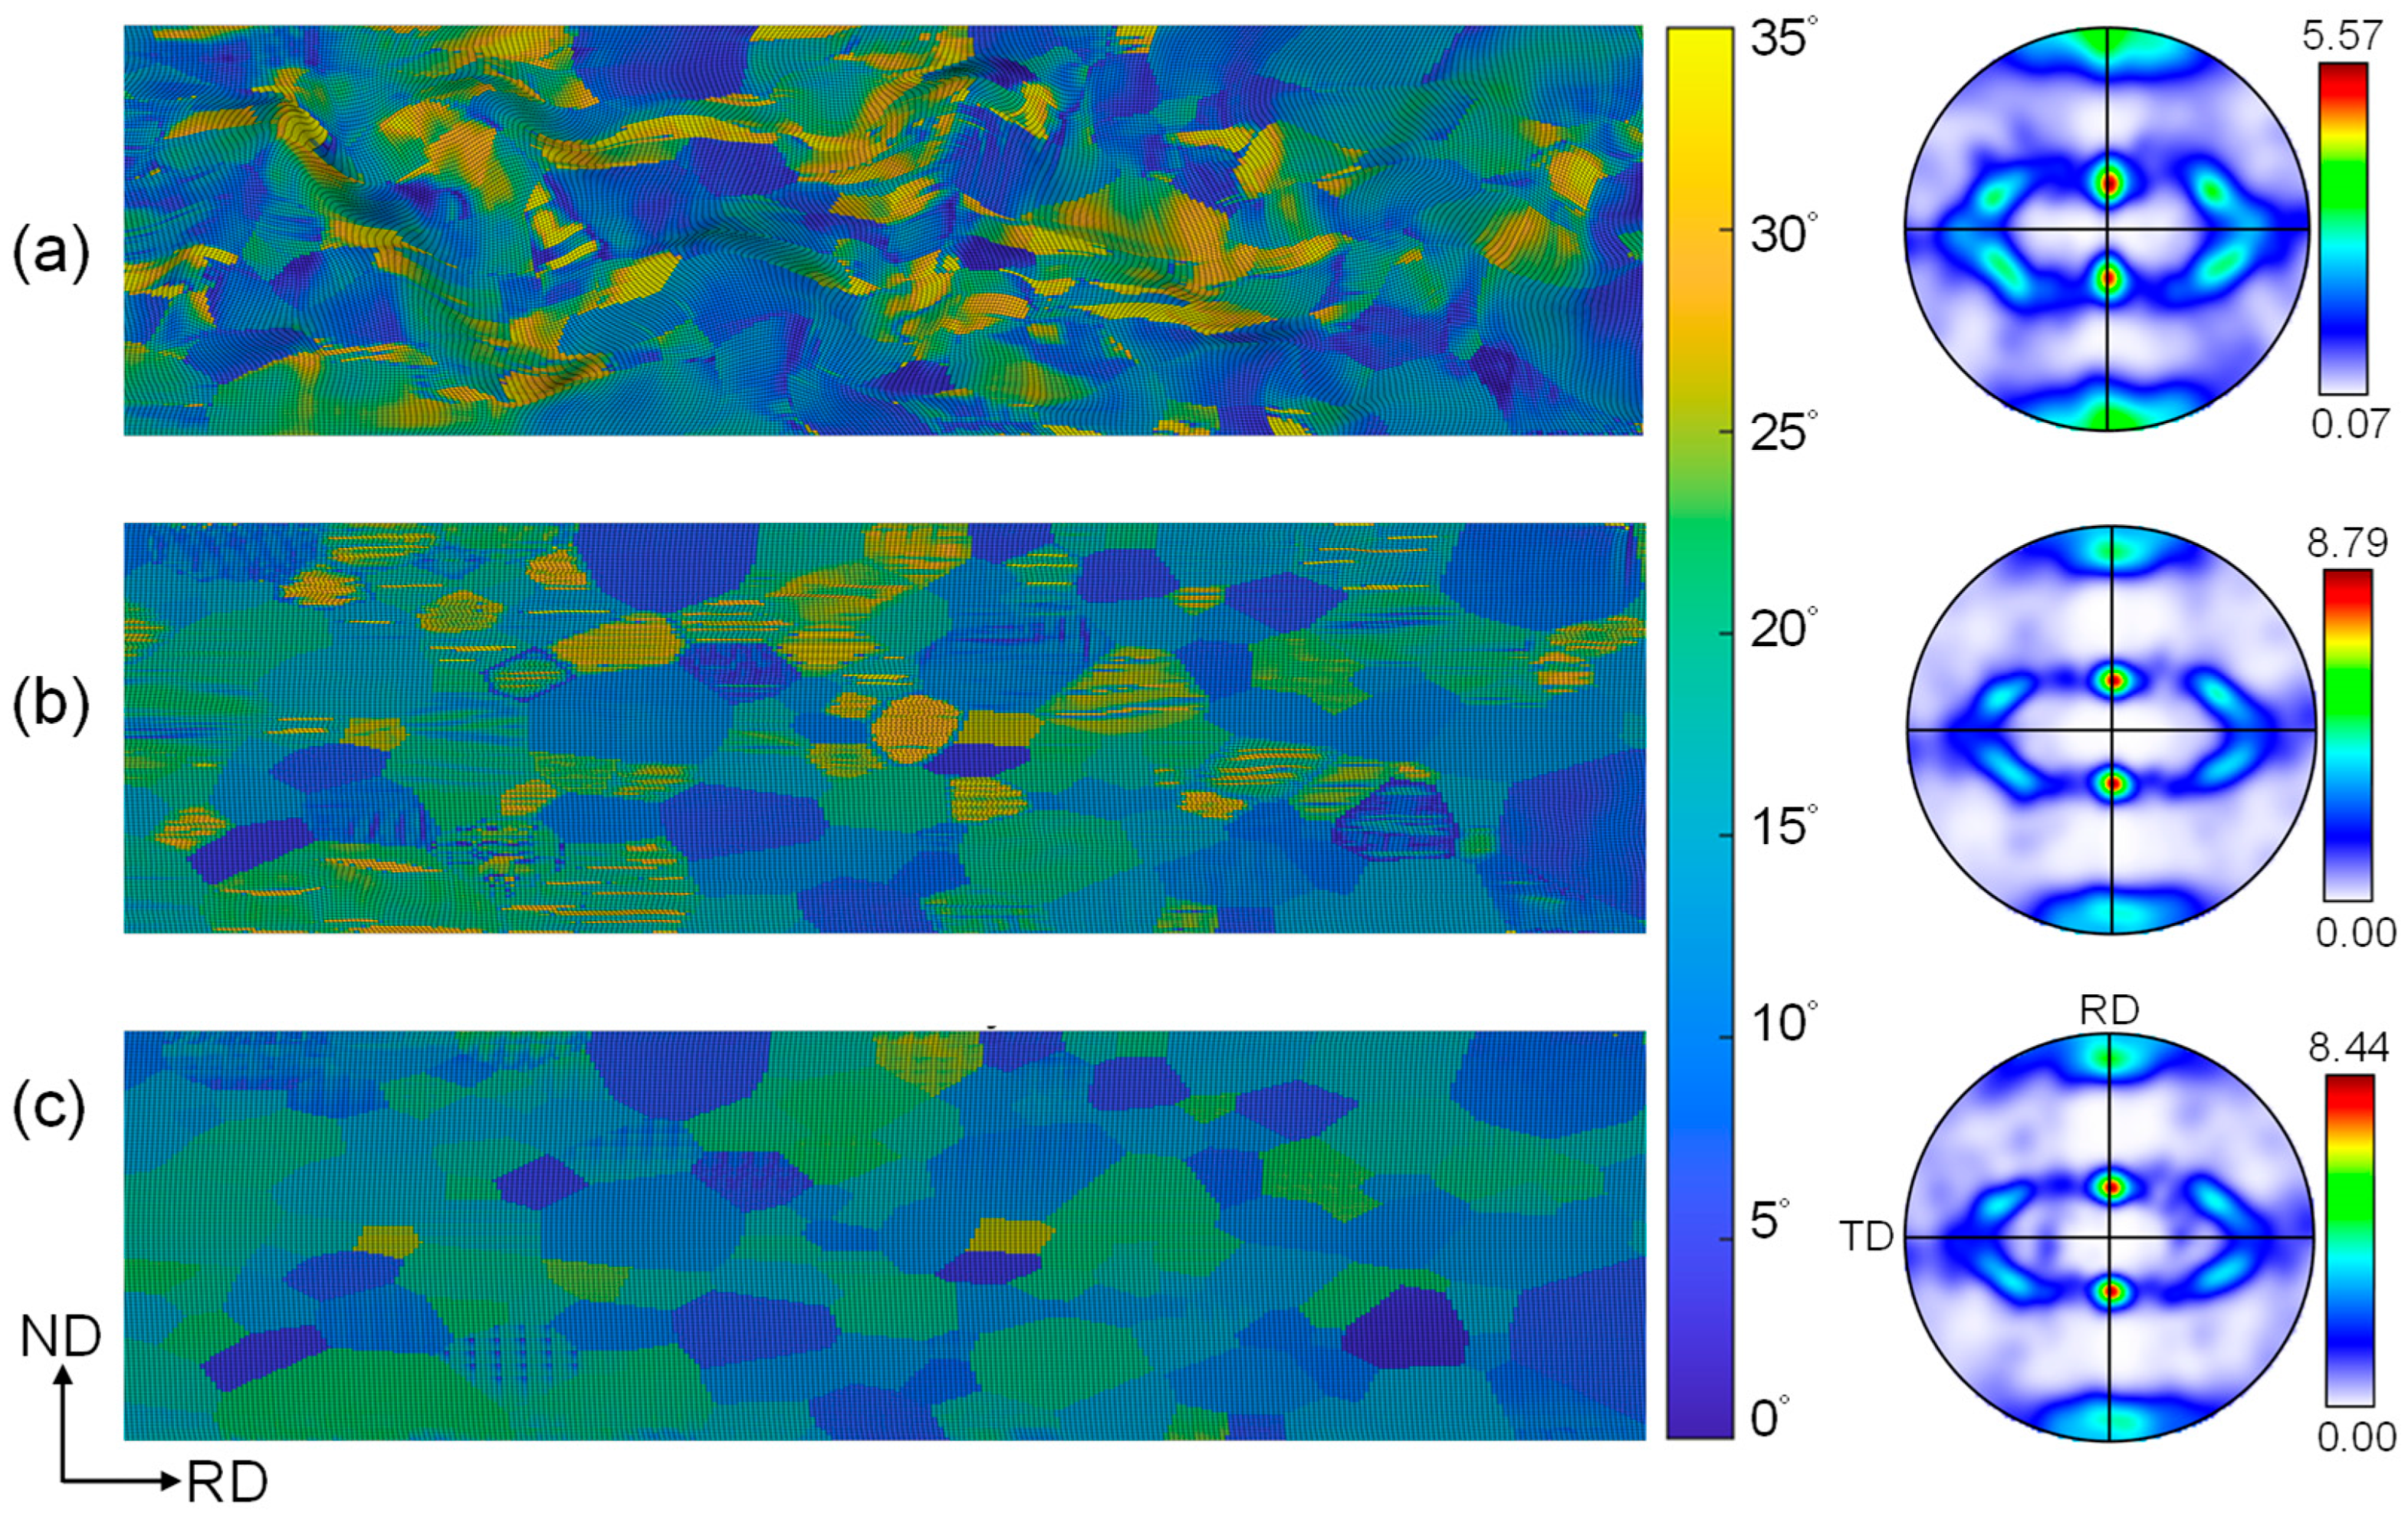
Figure 6 compares the predictions of plastic deformation and texture between the CPFEM, quasi-VPSC, and quasi-Taylor models using Case 1 in Table 1. The CPFEM predictions in Figure 6a show local heterogeneity of plastic deformation and crystal rotation angles, which clearly reflects the full coupling between plastic deformation and texture evolution. Additionally, the in-grain subdivision and inter-grain interaction were successfully revealed. In the quasi-VPSC (Figure 6b), each grain served as a Submodel and the strain history from the Wholemodel was imposed on the boundary of the Submodel, and all the deformed grains are plotted in Figure 6b. The distribution of distorted FEM meshes are relatively uniform, though in-grain distortion and micro-shear bands can be seen after a closer inspection. As for the quasi-Taylor model in Figure 6c, the FEM meshes are uniform at both the macroscopic and grain scale, since in this model the imposed strain was applied to all FEM nodes.
The three {1 1 1} pole figures in the right column in Figure 6 demonstrate that all three models (CPFEM, quasi-VPSC, quasi-Taylor models) successfully reproduced the rolling texture. The texture intensity in the CPFEM is the lowest, indicating the weakest grain interaction [24]. The quasi-VPSC and quasi-Taylor models produced similar texture intensities, obviously higher than the CPFEM.
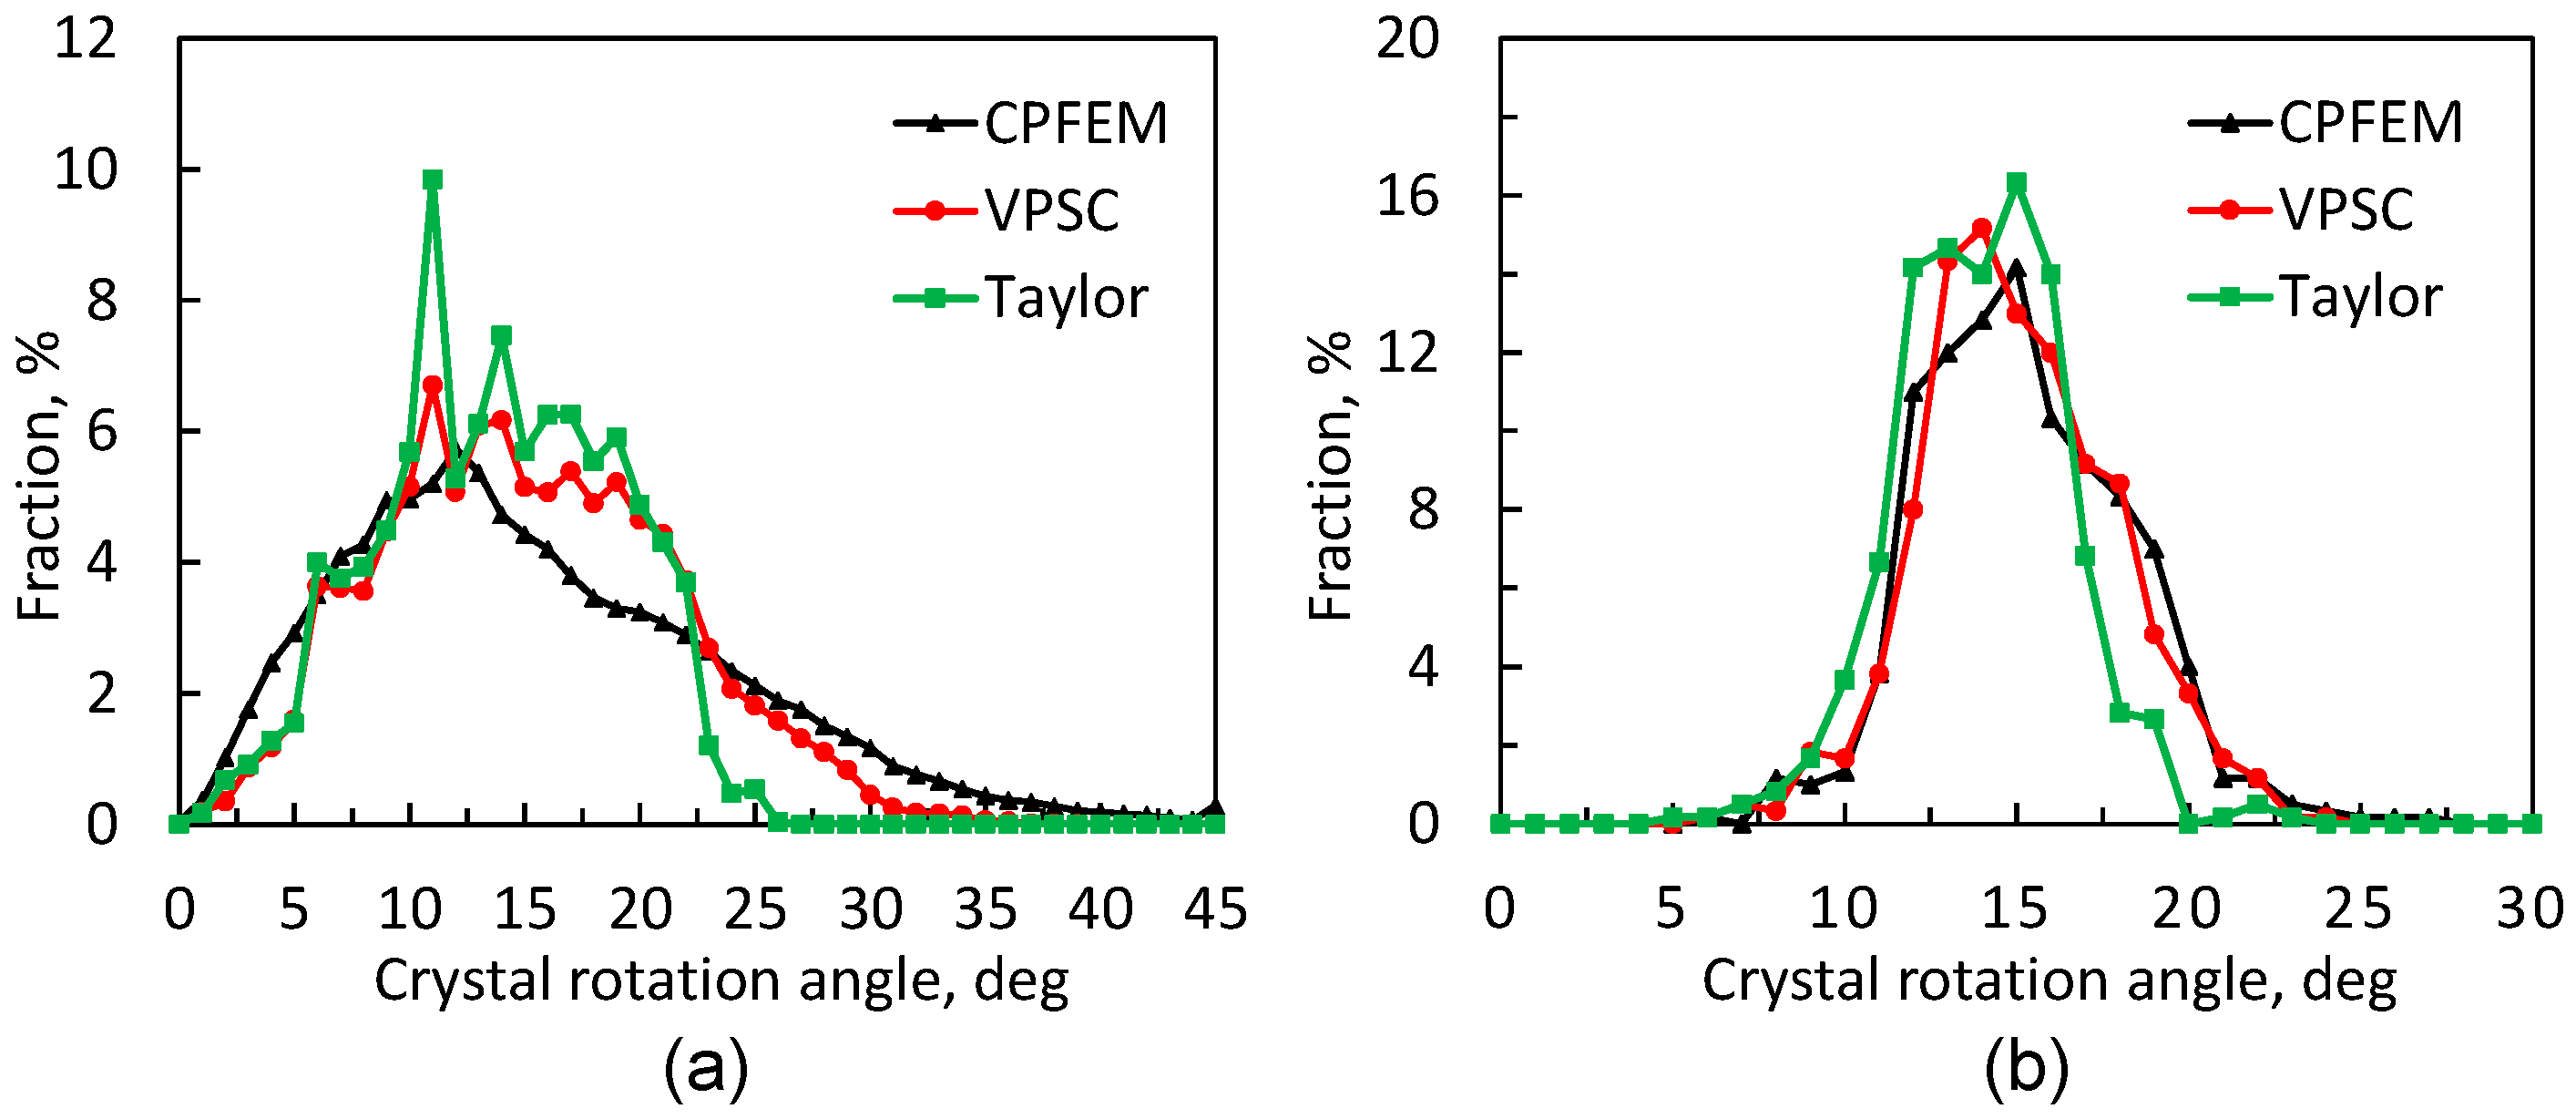
Figure 7a presents the distribution of crystal rotation angles for individual FEM elements, while the averaged distribution among all elements within one grain is shown in Figure 7b. Large crystal rotation angles (≥22.5°) developed in the CPFEM and quasi-VPSC, while the fraction of medium rotation angles (12°~22.5°) in the CPFEM is obviously lower than the other two models. Though the distribution of crystal rotation angles in Figure 7a between these three models is different, the three models produced similar results in Figure 7b. This is probably due to the reason that the imposed strain was applied to the grain boundaries in the quasi-VPSC model; as can be seen in Figure 8, the distortion of the grain boundaries is the same for the quasi-VPSC and quasi-Taylor models. The relatively small rotation angles in the CPFEM are probably due to the weak grain interaction [24].

3.4. Grain-Scale Predictions Between CPFEM, quasi-VPSC, and quasi-Taylor Models

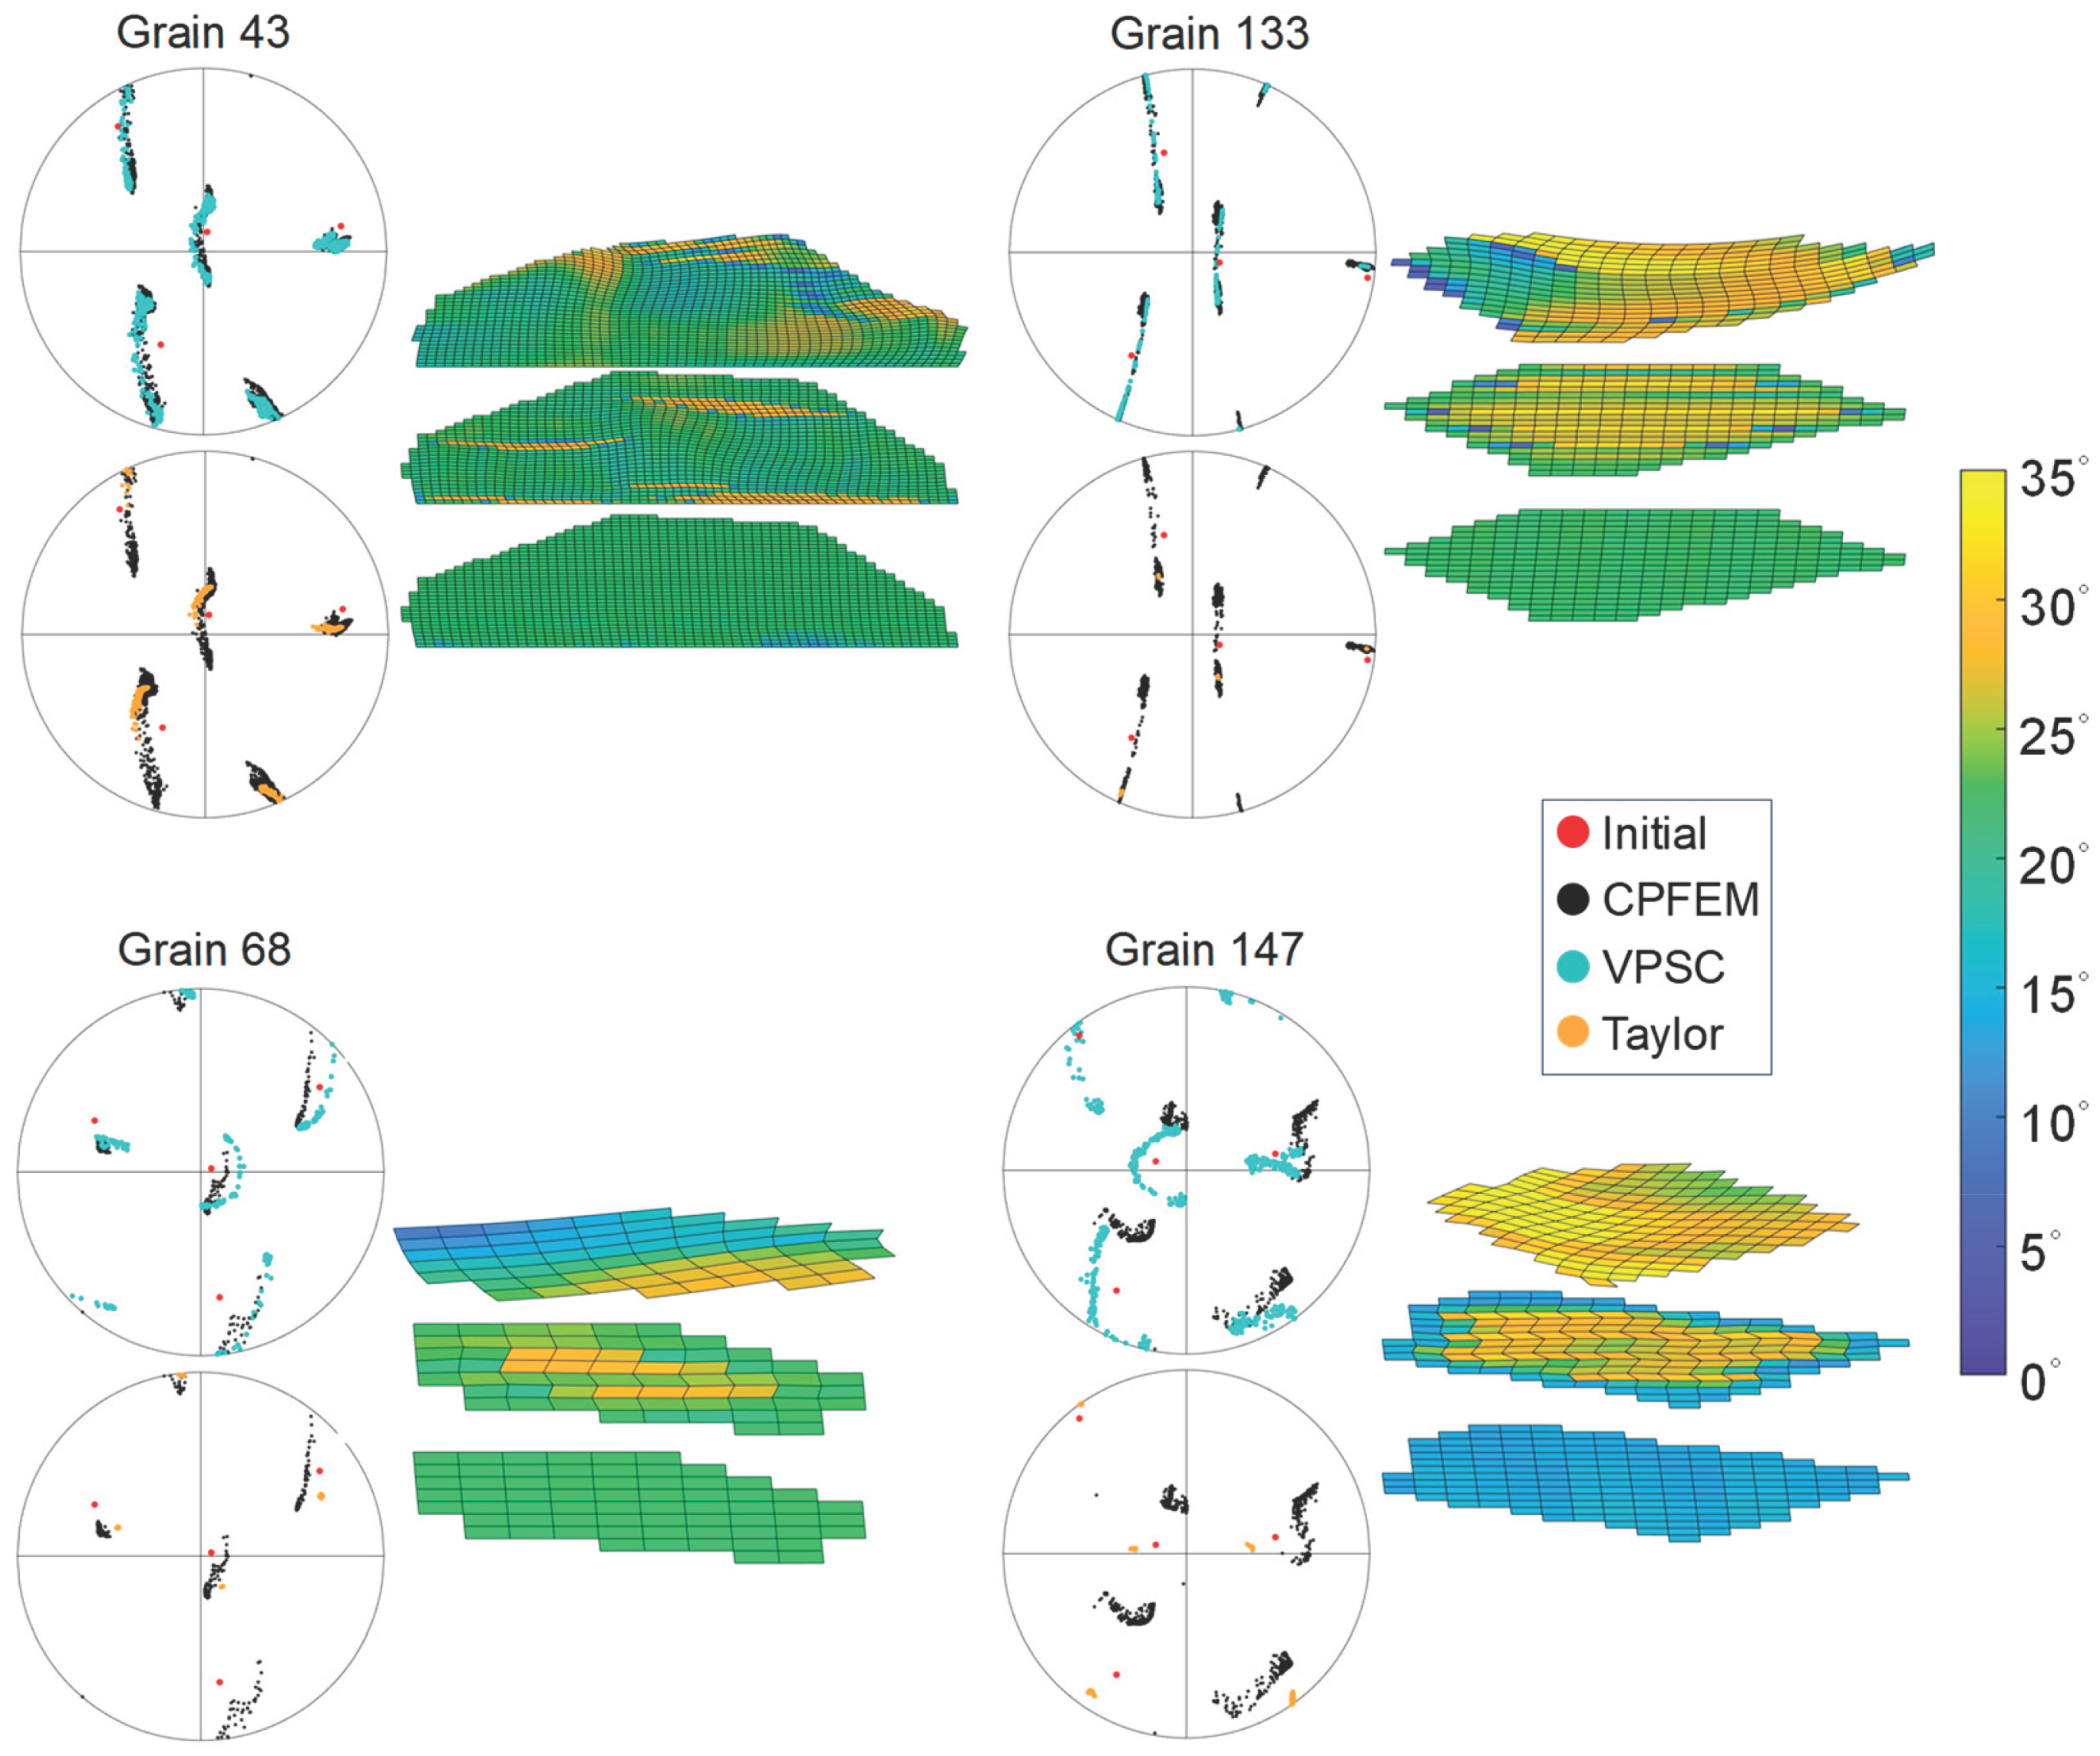
Figure 8 shows the in-grain heterogeneity of plastic deformation in four representative grains, and also the evolved texture in all three CP models. Definitely, the shape of the grain boundaries after rolling in the quasi-VPSC and quasi-Taylor is the same, since the imposed strain on the grain boundaries was identical. In-grain FEM mesh distortion can be seen in the quasi-VPSC model, while the in-grain FEM meshes are identical in the uniform-field quasi-Taylor model. The crystal rotation angles in the quasi-Taylor model are lower than the other two.
In Grain 43, the CPFEM and quasi-VPSC predicted a similar texture, and they are slightly different from the quasi-Taylor model prediction. This similarity is due to the similar grain contour after deformation. In Grain 133, the CPFEM predictions are close to the quasi-VPSC ones, though the deformed grain shape is different. It is interesting that the grain shape in the quasi-VPSC and quasi-Taylor is similar, but the textures are obviously dissimilar. In Grains 68 and 147, the grain in the CPFEM was tilted after rolling, and texture scatter developed. In-grain heterogeneous deformation in the quasi-VPSC model results in texture evolution, while the uniform distribution of plastic deformation and crystal rotation angles within the grain in the quasi-Taylor model led to small texture development. Micro-shear bands are also captured in Figure 8.

4. Discussion

In this study, the quasi-VPSC and quasi-Taylor models were realized within the CPFEM framework by varying the boundary conditions in the Submodel. The strain history was extracted from the conventional FEM, while the CP constitutive law was taken into account at each integration point of the Submodel. Therefore, as long as the deformation/strain can be accurately predicted by the FEM and the CP constitutive law is applicable, this Submodel-based CP modeling method can be applied to other materials and different processes. No inherent length scale was assumed in the adopted CP constitutive law, and thus no explicit constraint was posed on the RVE (or Submodel) size.
During plastic deformation, the grain refinement occurred due to the in-grain subdivision, where different regions of the grain rotated into different directions according to the imposed strain and grain crystal orientation [25]. In this study, the grain interaction is allowed in the CPFEM, and thus the grain subdivision in this case is the most obvious (Figure 8). In contrast, the in-grain subdivision is the weakest in the quasi-Taylor model, since the deformation in all the elements are the same. The slight scattered deformation texture predicted by the quasi-Taylor model was due to the difference in strain between the upper and lower surface of the grains, where the through-thickness is non-uniform.
Single crystals are strongly texturally anisotropic [26]. In contrast, polycrystals can be almost texturally isotropic when the number of grains is large and the initial crystal orientations are random [27,28], since the role the initial orientation in each grain plays becomes weak. In this study (Figure 3), the macroscopic strain of the CPFEM became more uniform when increasing the mesh resolution and grain number, toward the prediction from the conventional FEM, since the CPFEM microstructure became more isotropic with more randomly generated textures.
As stated in Section 1, the plastic deformation and texture evolution are fully coupled in the CPFEM, and this is to say the two are mutually influenced. In contrast, the imposed strain determines the texture evolution in the quasi-VPSC and quasi-Taylor models [16], while the evolved texture does not influence plastic deformation. This is the reason why the Taylor and VPSC models are able to be applied to polycrystals with weak initial texture, but they are unsuitable for single crystals. When applying the quasi-Taylor and quasi-VPSC to single crystals or polycrystals with strong texture, the CPFEM, instead of the FEM, can be used as the Wholemodel. The CPFEM can be used to predict the macroscopic texture and micro-bands (Figure 8), while the quasi-VPSC and quasi-Taylor models can be used to statistically predict the macroscopic texture. In the VPSC model, the grain interaction is high for microstructures that have a strong texture, but small for weak textures. In the current study, the initial crystal orientations were randomly generated, which means the grain interaction is weak and thus it is not considered. This also explains why in this study the elastic–plastic FEM Wholemodel in the quasi-VPSC and quasi-Taylor models resulted in acceptable results.

5. Conclusions

The Taylor model, VPSC model, and CPFEM are three typical and inherently different CP models due to the difference in assumed homogenization. In this study, these three CP models were realized within the framework of the CPFEM using the Submodel method, and the only difference was the applied boundary conditions in the Submodel. The following conclusions can be drawn:
  • In the quasi-Taylor model, the strain history from the Wholemodel was applied to all FEM nodes of the Submodel, and thus the deformation within grains was the same as the sample deformation. In the VPSC model, the strain from the Wholemodel was placed on the grain boundaries, which is consistent with the assumed homogenization in the VPSC that each grain was treated as an inclusion in the homogeneous medium.
  • The predicted textures at the sample scale and grain scale from these three CP models were qualitatively and acceptably similar, and agreed well with the experimental observations.
  • The mesh resolution was assessed. As the mesh resolution and grain number in the CPFEM increased, the macroscopic deformation of the sample became more uniform. This demonstrated that it is reasonable to use the elasto-plastic constitutive law in conventional FEM simulations.
  • The mutual coupling between plastic deformation and texture in the CPFEM makes it suitable for single crystals and polycrystals, while the quasi-VPSC and quasi-Taylor models are applicable to polycrystals with weak textures.

Author Contributions

Conceptualization, R.W., Y.Z.; software, R.W. and S.W.; validation, Z.W., Y.Z. and S.X.; formal analysis, R.W., S.W. and S.X.; writing—original draft preparation, R.W., S.W., H.W. and X.H.; writing—review and editing, R.W., Z.W., H.W., Y.Z. and X.H.; visualization, R.W., S.X. and X.H.; supervision, H.W. and Y.Z.; project administration, Y.Z.; funding acquisition, Y.Z. All authors have read and agreed to the published version of the manuscript.

Funding

This research received no external funding.

Data Availability Statement

The data presented in this study are available on request from the corresponding author. The data are not publicly available, as the data are being used for an ongoing study.

Conflicts of Interest

The authors declare no conflicts of interest.

Appendix A. Crystal Plasticity FEM Modeling and Predictions

Appendix A.1. Kinematics in CPFEM

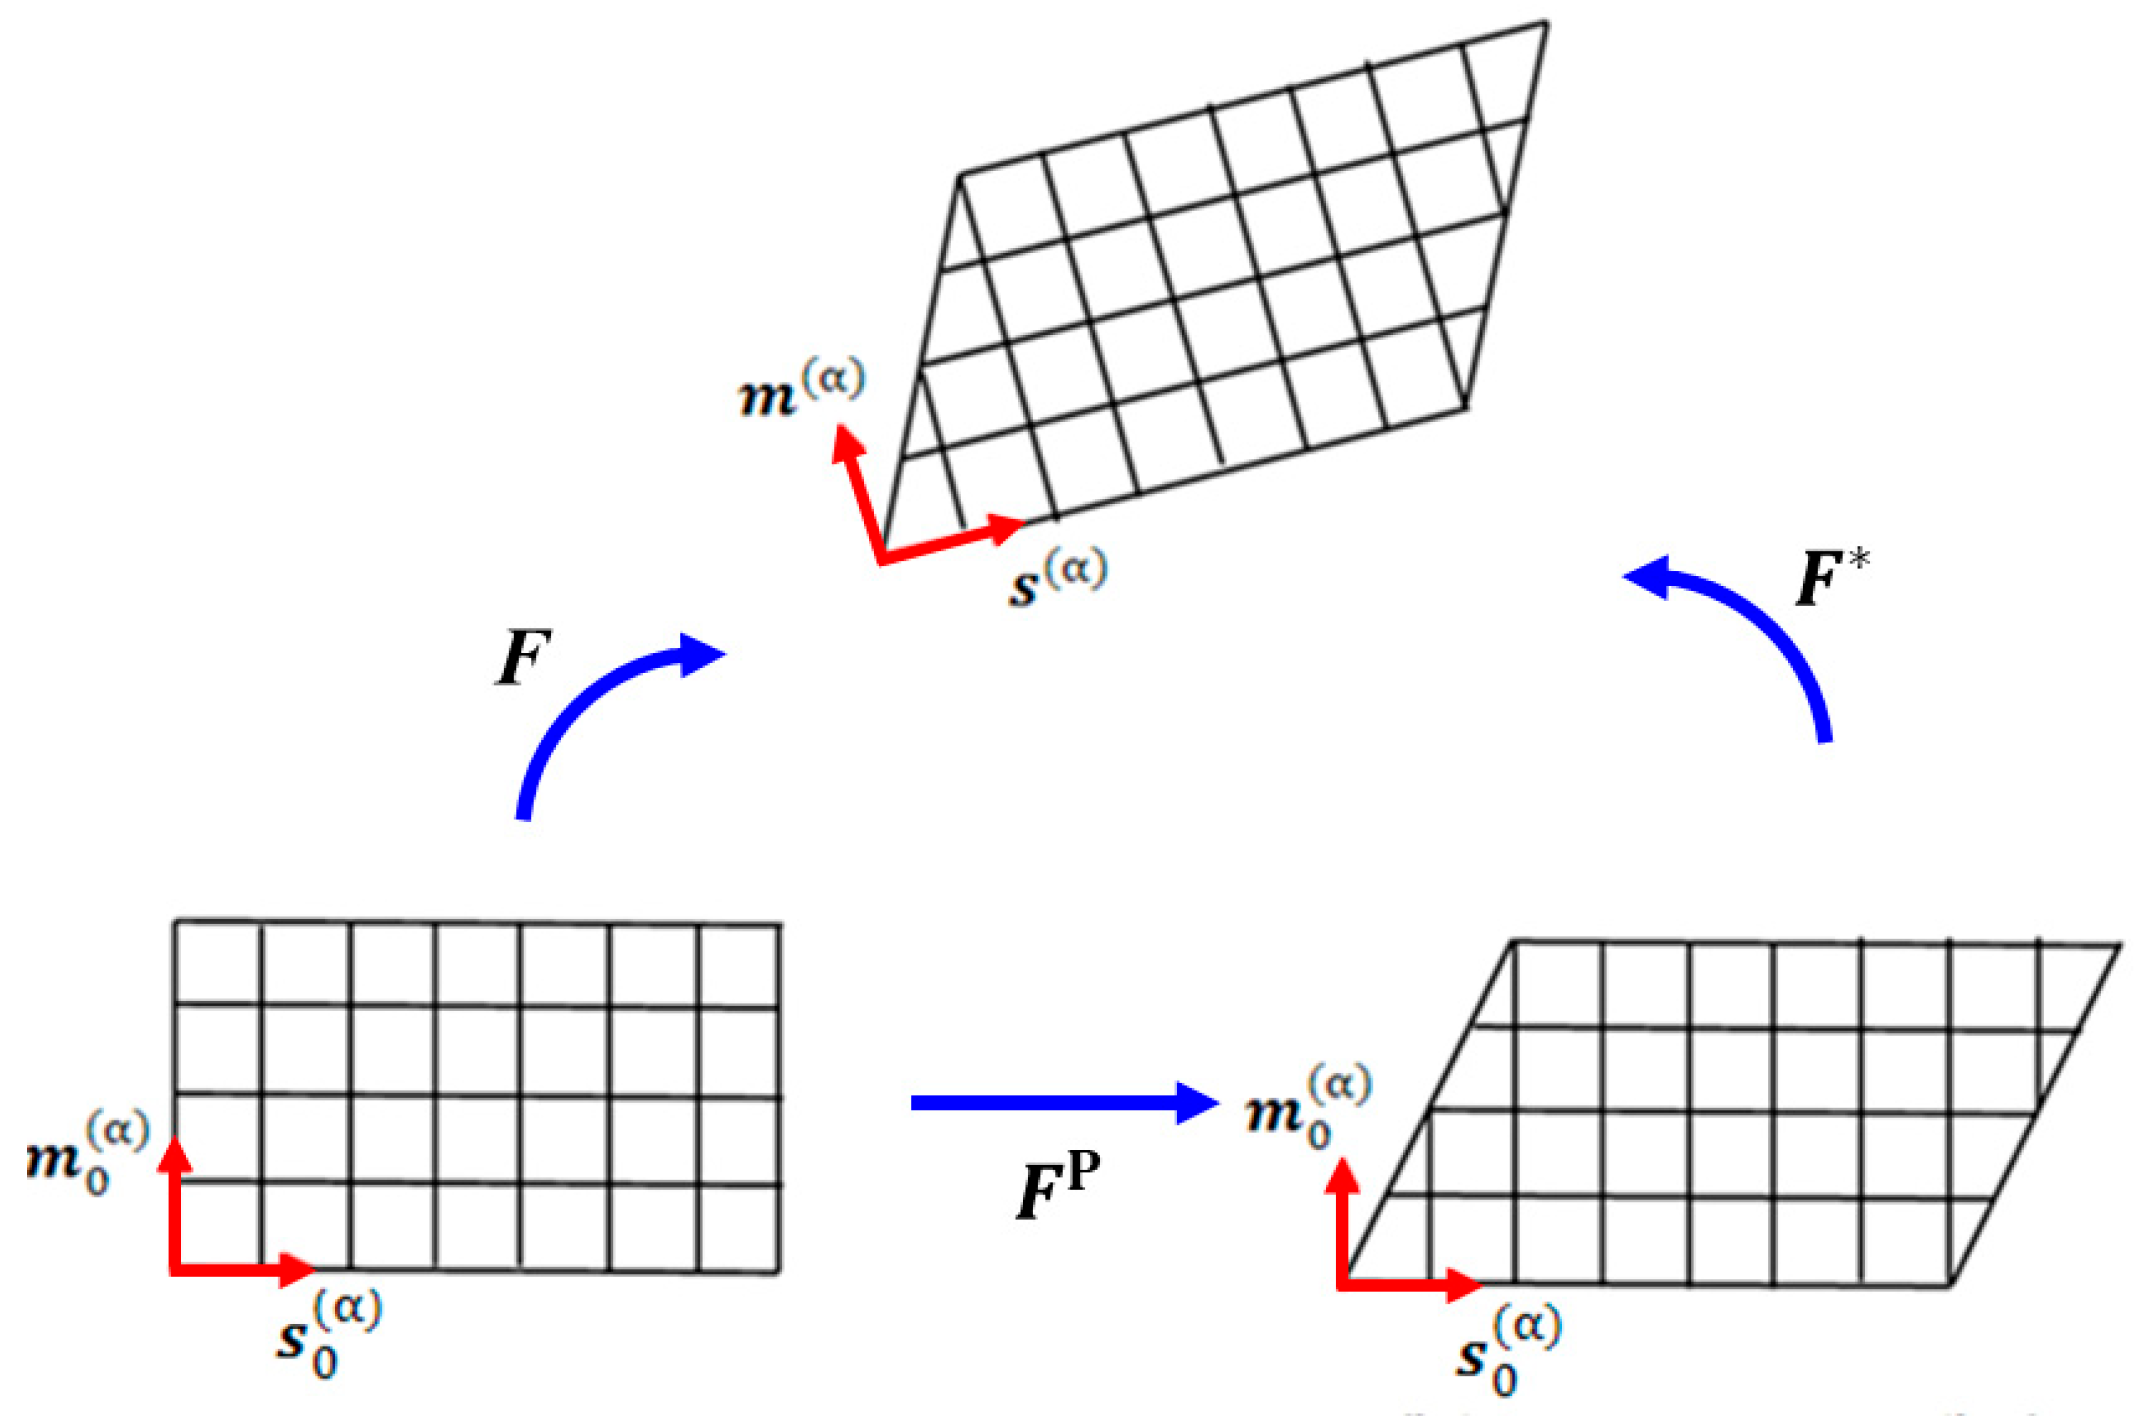
The crystal plasticity model follows the kinematical scheme developed by Asaro [29] and Peirce [20,30]. As illustrated in Figure A1, the deformation gradient F in this scheme is decomposed into two components as:
F = F * · F P
where F * embodies the elastic deformation and rigid body rotation, and F P consists of the crystallographic slip on slip systems.
Figure A1. Decomposition of the deformation gradient F .
Metals 16 00621 g0a1
The velocity gradient L is evaluated from the deformation gradient by
L = F ˙ F 1 = L * + L P
The velocity gradient can be uniquely decomposed into a symmetrical part and a skew-symmetrical part as
L = D + Ω
D = 1 2 L + L T
Ω = 1 2 L L T
where D and Ω are called the stretch rate tensor and spin tensor, respectively. Ω can be represented by the rigid rotation of a finite region or redundant shear strain, and it can also be decomposed into the elastic stretching and lattice rotation part Ω * and plastic part Ω P , namely
Ω = Ω * + Ω P
Ω * is due to distortion and rotation of the crystal lattice, which is the reason for texture evolution. The plastic spin Ω P is caused by the motion of dislocations on slip planes and along slip directions, which is calculated according to
Ω P = α = 1 12 1 2 s ( α ) · m ( α ) m ( α ) · s ( α ) γ ˙ ( α )
where s ( α ) and m ( α ) are the slip direction and slip plane normal, respectively.
In FCC structured aluminum, the slip plane is {1 1 1} and the slip direction is <1 1 0>. Combining them gives rise to 12 slip systems, as listed in Table A1. The four potentially activated slip systems in {1 1 2} <1 1 1> oriented single crystals are a1, a2, c3, and d3.
Table A1. Notation of 12 slip systems.
Slip Plane(1 1 1)(1 1 1 ¯ )( 1 ¯ 1 1)(1 1 ¯ 1)
Slip Direction[0 1 ¯ 1][1 0 1 ¯ ][ 1 ¯ 1 0][0 1 1][1 0 1][ 1 ¯ 1 0][0 1 ¯ 1][1 0 1][1 1 0][0 1 1][1 0 1 ¯ ][1 1 0]
Slip Systema1a2a3b1b2b3c1c2c3d1d2d3

Appendix A.2. Hardening Model of CPFEM

The Bassani–Wu hardening model [21,31], a rate-dependent hardening model, could better describe the work-hardening of FCC crystals [32]. In this hardening model, the shear strain rate γ ˙ ( α ) is determined by the resolved shear stress τ ( α ) on slip system α , as expressed by Equation (A6), where γ ˙ 0 α is the reference value of the shear strain rate, n is the rate-sensitive exponent, and τ c ( α ) is the critical resolved shear stress of the slip system α . The values of γ ˙ 0 α , n , and τ c ( α ) are listed in Table A1.
γ ˙ ( α ) = γ ˙ 0 α s g n ( τ ( α ) ) | τ ( α ) τ c ( α ) | n for     τ ( α ) τ c ( α )
γ ˙ ( α ) = 0 for     τ ( α ) < τ c ( α )
The   s g n x = 1 for   x 0 1 for   x < 0
The τ c ( α ) represents the strength of activating the slip system α , and its rate of increase, i.e., τ ˙ c ( α ) , is determined by:
τ ˙ c ( α ) = β = 1 N h α β | γ ˙ ( β ) |
where h α β is the hardening modulus. As expressed in Equation (A8), the activation of all slip systems would affect the hardening of each slip system. This corresponds to self-hardening, i.e., h α α , when α is equal to β , while it corresponds to latent hardening h α β when α is not equal to β . The h α α and h α β are expressed as:
h α α = h 0 h s s e c h 2 h 0 h s γ ( α ) τ 1 τ 0 + h s 1 + β = 1 β α N f α β t a n h ( γ ( β ) γ 0 ) , α = β
h α β = q h α α , α β
where h 0 is the hardening modulus after initial yield, h s is the hardening modulus of easy slip, τ 1 is the critical stress when plastic flow begins, τ 0 is the initial critical resolved shear stress, q is the ratio between the latent hardening modulus and self-hardening modulus, and f α β means the interaction between slip system α and β . The value of f α β is determined by the relative position of the two slip systems, and thus five constants of f α β are defined. The parameter f α β is chosen as: a 1 = a 2 = a 3 = 1.75 , a 4 = 2 and a 5 = 2.25 according to the study in Ref. [33].
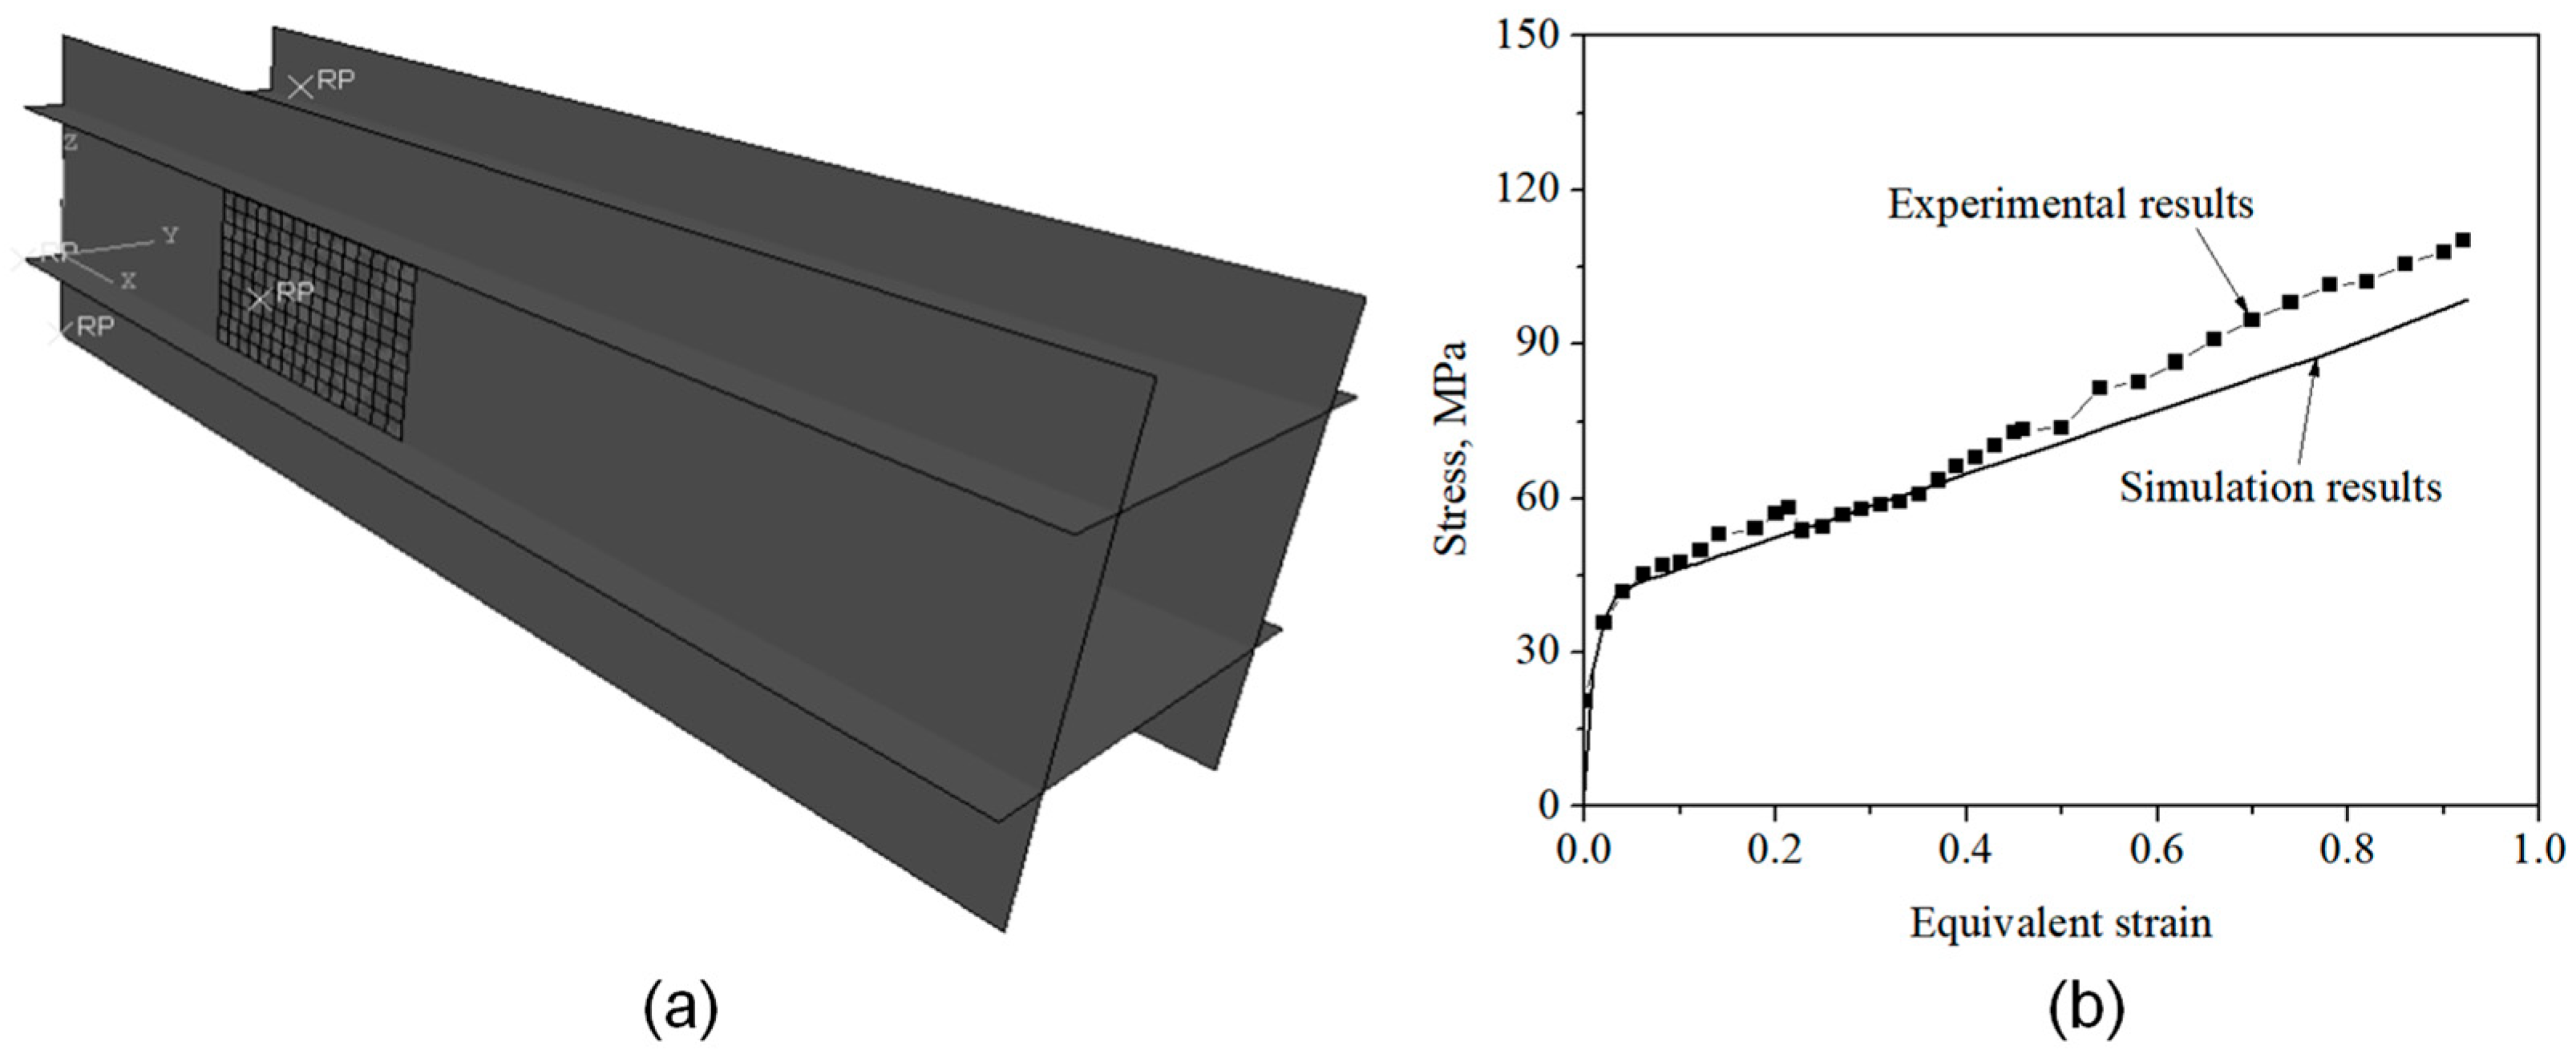
Other material parameters in Equations (A6) and (A8) are listed in Table A2, which were evaluated by fitting the simulated stress–strain curve with the experimental results of an aluminum single crystal under plane strain compression [22], as shown in Figure A2. These material parameters have been applied to different processes, e.g., rolling [34] and equal channel angular pressing [35], etc. The parametric analysis was performed in Ref. [36].
Figure A2. (a) CPFEM model of plane strain compression, and (b) experimental and predicted stress–strain curves.
Metals 16 00621 g0a2
Table A2. Model parameters of AARB model and material parameters in the hardening model.
ItemsValues
Elastic moduli C 11 [Mpa]112,000
Elastic moduli C 12 [Mpa]66,000
Elastic moduli C 44 [Mpa]28,000
Hardening modulus after initial yield h 0 [Mpa]100
Hardening modulus of easy slip h s [Mpa]0.01
Critical stress when plastic flow begins τ 1 [Mpa]6.3
Initial critical resolved shear stress τ 0 [Mpa]6
Ratio between latent hardening modulus and self-hardening modulus q [-]1
Hardening rate exponent n [-]300
Reference shear strain rate γ 0 ˙ [ s 1 ]0.0001 s 1

Appendix A.3. Simulation Results

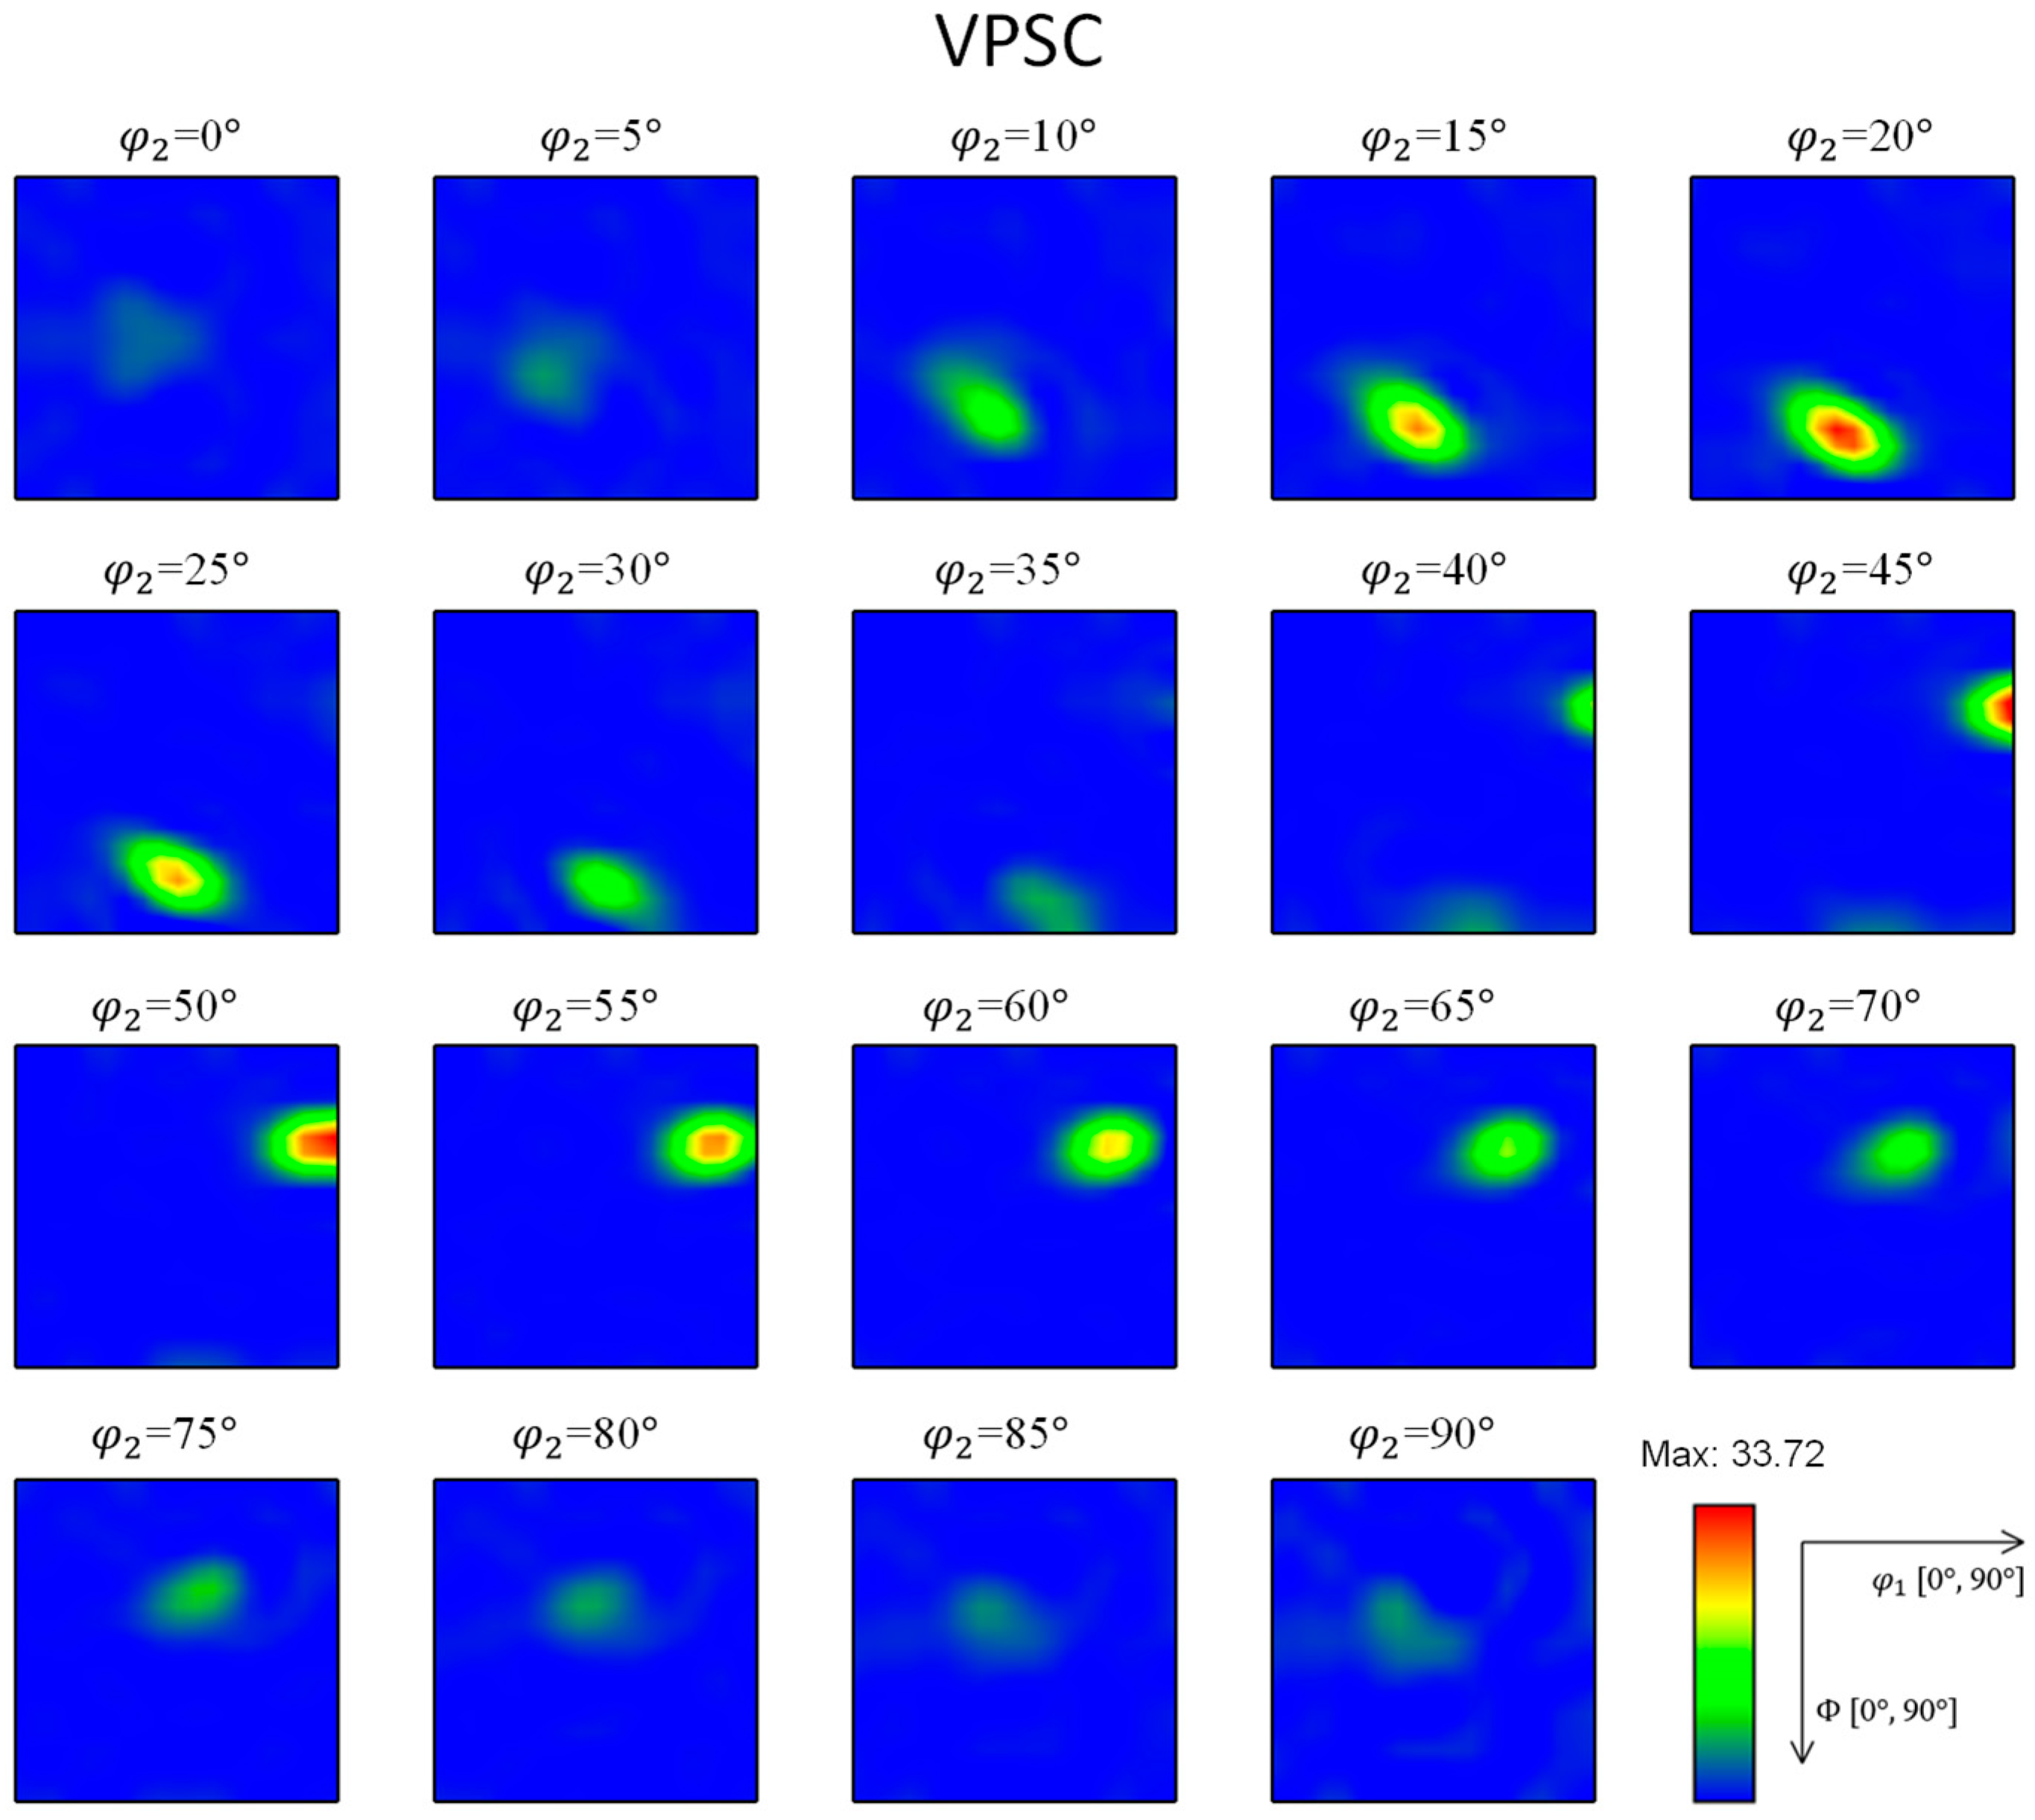
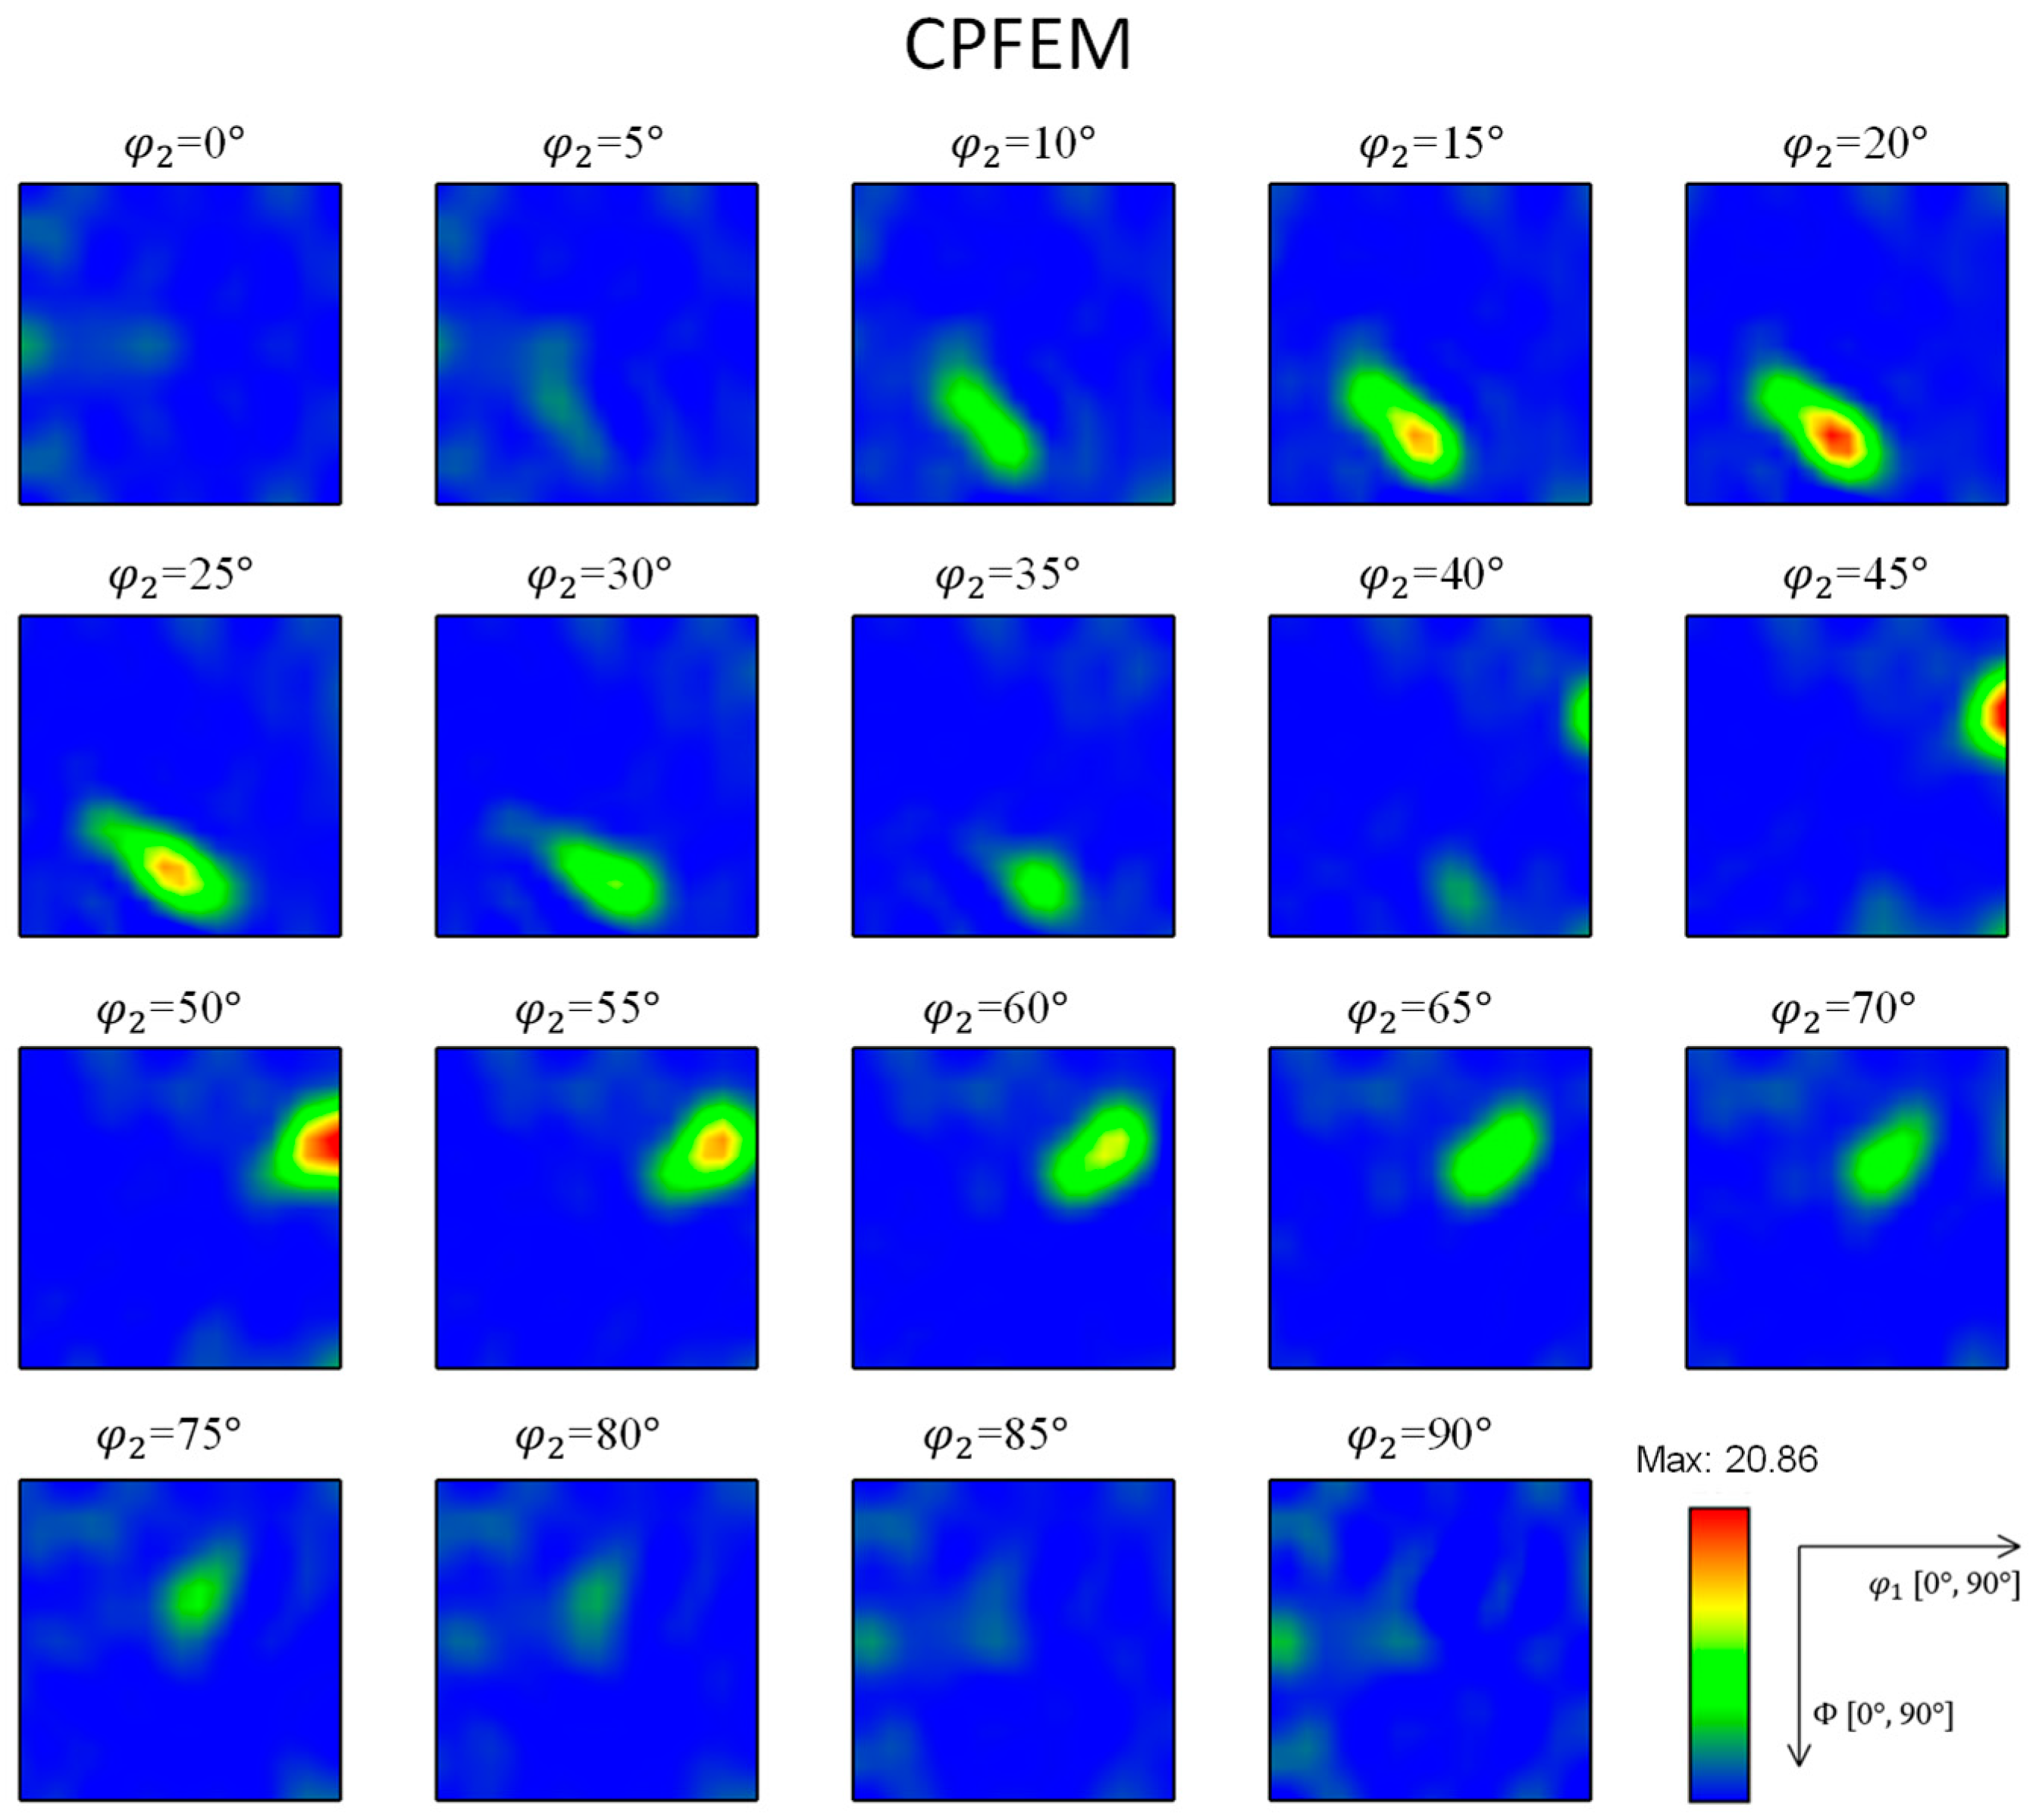
Figure A3. ODF of the CPFEM predictions.
Metals 16 00621 g0a3
Figure A4. ODF of the quasi-VPSC predictions.
Metals 16 00621 g0a4
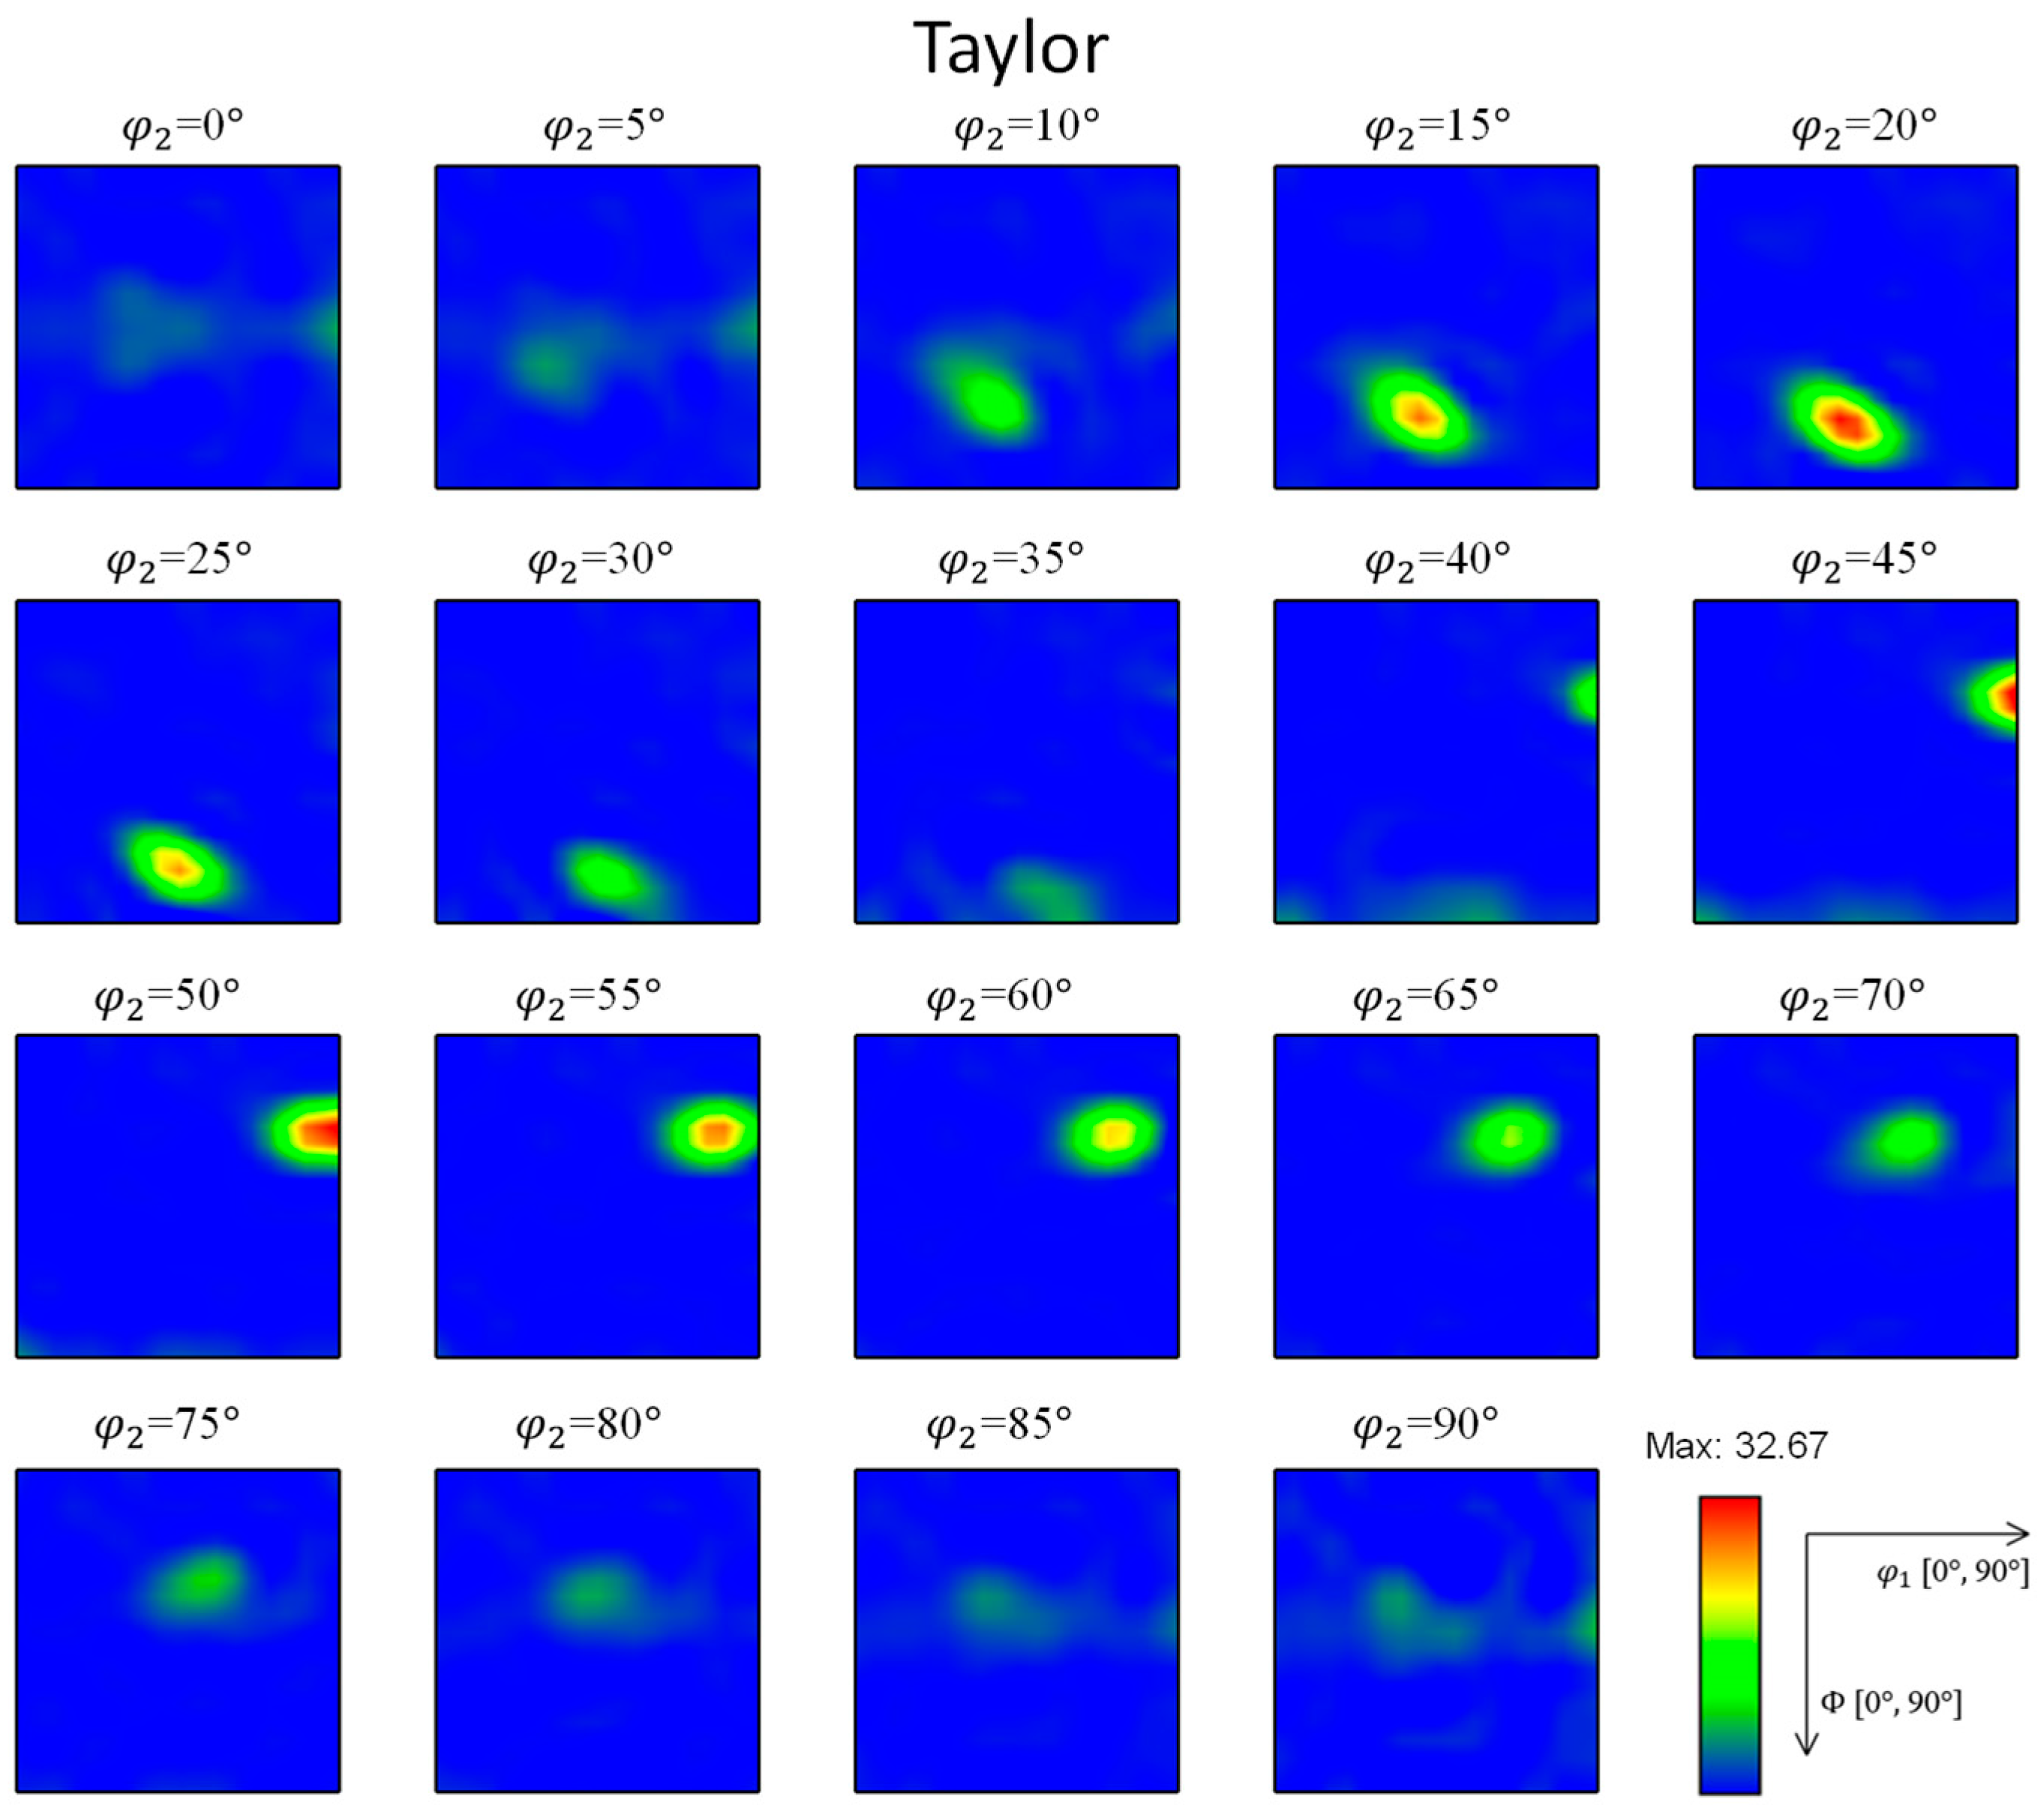
Figure A5. ODF of the quasi-Taylor predictions.
Metals 16 00621 g0a5
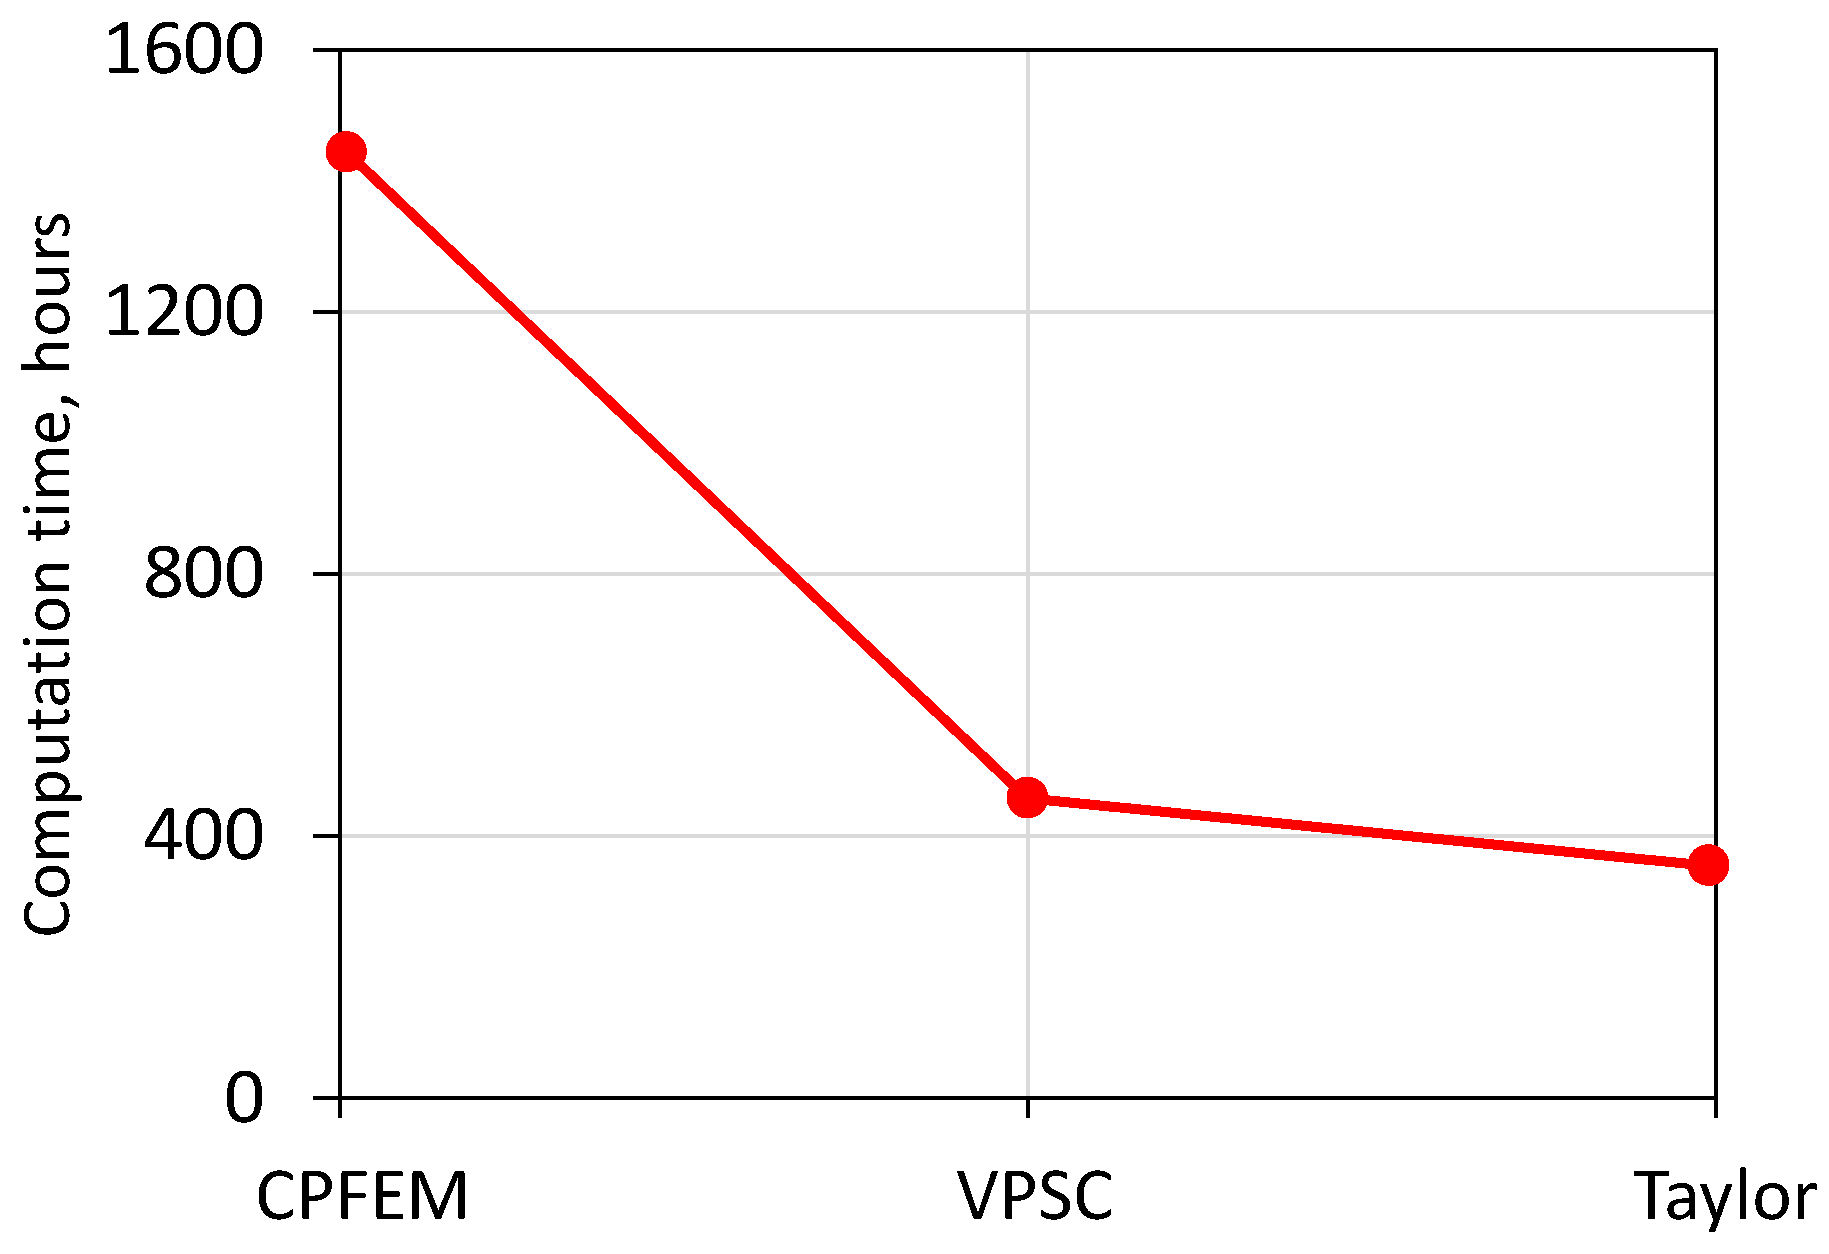
Figure A6. Computation time for three CP models.
Metals 16 00621 g0a6

References

  1. Patra, A.; Chaudhary, S.; Pai, N.; Ramgopal, T.; Khandelwal, S.; Rao, A.; McDowell, D.L. ρ-CP: Open Source Dislocation Density Based Crystal Plasticity Framework for Simulating Temperature-and Strain Rate-Dependent Deformation. Comput. Mater. Sci. 2023, 224, 112182. [Google Scholar] [CrossRef] [Scilit]
  2. Zhang, X.; Zhao, J.; Kang, G.; Zaiser, M. Geometrically Necessary Dislocations and Related Kinematic Hardening in Gradient Grained Materials: A Nonlocal Crystal Plasticity Study. Int. J. Plast. 2023, 163, 103553. [Google Scholar] [CrossRef] [Scilit]
  3. Xin, H.; Zheng, Z.; Zhan, M.; Lei, Y.; Zhao, P.; Wang, Y.; Ma, F.; Yuan, G.; Fu, M.W. Investigation of Twin-Dislocation Interactions Using a Novel Discrete Dislocation Plasticity Framework. Int. J. Plast. 2025, 194, 104465. [Google Scholar] [CrossRef] [Scilit]
  4. Liu, Y.; Su, J.; He, D.; Hao, P.; Liu, Y.; Wang, Z.; Wang, T. Analytical Model for Corrugated Rolling of Composite Plates Considering the Shear Effect. J. Manuf. Process. 2025, 134, 1069–1081. [Google Scholar] [CrossRef] [Scilit]
  5. Siddharth, S.; Singh, S.; Kazim, S.M.; Chakraborty, P. Coupled Crystal Plasticity and Damage Model for Micro Crack Propagation in Polycrystalline Microstructures. Int. J. Fract. 2024, 247, 183–201. [Google Scholar] [CrossRef] [Scilit]
  6. Renversade, L.; Quey, R. Intra-Grain Orientation Distributions in Deformed Aluminium: Synchrotron X-Ray Diffraction Experiment and Crystal-Plasticity Finite-Element Simulation. Acta Mater. 2024, 262, 119419. [Google Scholar] [CrossRef] [Scilit]
  7. Xiong, Y.; Zhao, J.; Zeng, Q.; Yuan, F.; Zhang, X. Crack Propagation Behavior in Metal Matrix Composites: A Coupled Nonlocal Crystal Plasticity and Phase Field Modelling. J. Mech. Phys. Solids 2025, 200, 106164. [Google Scholar] [CrossRef] [Scilit]
  8. Cappola, J.; Wang, J.; Li, L. A Dislocation-Density-Based Crystal Plasticity Model for FCC Nanocrystalline Metals Incorporating Thermally-Activated Depinning from Grain Boundaries. Int. J. Plast. 2024, 172, 103863. [Google Scholar] [CrossRef] [Scilit]
  9. Yaghoobi, M.; Ganesan, S.; Sundar, S.; Lakshmanan, A.; Rudraraju, S.; Allison, J.E.; Sundararaghavan, V. PRISMS-Plasticity: An Open-Source Crystal Plasticity Finite Element Software. Comput. Mater. Sci. 2019, 169, 109078. [Google Scholar] [CrossRef] [Scilit]
  10. Demir, E.; Martinez-Pechero, A.; Hardie, C.; Tarleton, E. OXFORD-UMAT: An Efficient and Versatile Crystal Plasticity Framework. Int. J. Solids Struct. 2025, 307, 113110. [Google Scholar] [CrossRef] [Scilit]
  11. Taylor, G.I. Plastic Strain in Metals. J. Inst. Met. 1938, 62, 307–324. [Google Scholar]
  12. Van Houtte, P.; Li, S.; Seefeldt, M.; Delannay, L. Deformation Texture Prediction: From the Taylor Model to the Advanced Lamel Model. Int. J. Plast. 2005, 21, 589–624. [Google Scholar] [CrossRef] [Scilit]
  13. Hill, R. Continuum Micro-Mechanics of Elastoplastic Polycrystals. J. Mech. Phys. Solids 1965, 13, 89–101. [Google Scholar] [CrossRef] [Scilit]
  14. Lebensohn, R.A.; Tomé, C.N. A Self-Consistent Anisotropic Approach for the Simulation of Plastic Deformation and Texture Development of Polycrystals: Application to Zirconium Alloys. Acta Metall. Mater. 1993, 41, 2611–2624. [Google Scholar] [CrossRef] [Scilit]
  15. Roters, F.; Eisenlohr, P.; Hantcherli, L.; Tjahjanto, D.D.; Bieler, T.R.; Raabe, D. Overview of Constitutive Laws, Kinematics, Homogenization and Multiscale Methods in Crystal Plasticity Finite-Element Modeling: Theory, Experiments, Applications. Acta Mater. 2010, 58, 1152–1211. [Google Scholar] [CrossRef] [Scilit]
  16. Wang, H.; Lu, C.; Tieu, K.; Liu, Y. A Crystal Plasticity FE Study of Macro-and Micro-Subdivision in Aluminium Single Crystals {001}<110> Multi-Pass Rolled to a High Reduction. J. Mater. Sci. Technol. 2021, 76, 231–246. [Google Scholar] [CrossRef] [Scilit]
  17. Wang, H.; Su, L.; Yu, H.; Lu, C.; Tieu, A.K.; Liu, Y.; Zhang, J. A New Finite Element Model for Multi-Cycle Accumulative Roll-Bonding Process and Experiment Verification. Mater. Sci. Eng. A 2018, 726, 93–101. [Google Scholar] [CrossRef] [Scilit]
  18. Liu, K.; Tian, L.; Gao, T.; Wang, Z.; Li, P. An Explicit D-FE2 Method for Transient Multiscale Analysis. Int. J. Mech. Sci. 2025, 285, 109808. [Google Scholar] [CrossRef] [Scilit]
  19. Huang, Y. A User-Material Subroutine Incroporating Single Crystal Plasticity in the ABAQUS Finite Element Program; Harvard University: Cambridge, MA, USA, 1991. [Google Scholar]
  20. Peirce, D.; Asaro, R.J.; Needleman, A. An Analysis of Nonuniform and Localized Deformation in Ductile Single Crystals. Acta Metall. 1982, 30, 1087–1119. [Google Scholar] [CrossRef] [Scilit]
  21. Wu, T.-Y.; Bassani, J.L.; Laird, C. Latent Hardening in Single Crystals I. Theory and Experiments. Proc. R. Soc. Lond. A Math. Phys. Sci. 1991, 435, 1–19. [Google Scholar]
  22. Liu, Q.; Hansen, N.; Maurice, C.; Driver, J. Heterogeneous Microstructures and Microtextures in Cube-Oriented Al Crystals after Channel Die Compression. Metall. Mater. Trans. A 1998, 29, 2333–2344. [Google Scholar]
  23. Nie, N.; Yuan, C.; Shi, L.; Liu, Y.; Wang, H. Role of Strain Path Change on Texture and Microstructure of Accumulative Roll-Bonding (ARB) Processed Aluminum: A Comparative Study of Unidirectional and Reverse ARB. Met. Mater. Int. 2025, 31, 1805–1814. [Google Scholar]
  24. Raabe, D.; Roters, F. Using Texture Components in Crystal Plasticity Finite Element Simulations. Int. J. Plast. 2004, 20, 339–361. [Google Scholar] [CrossRef] [Scilit]
  25. Jabłońska, M.B. Effect of the Conversion of the Plastic Deformation Work to Heat on the Behaviour of TWIP Steels: A Review. Arch. Civ. Mech. Eng. 2023, 23, 135. [Google Scholar] [CrossRef] [Scilit]
  26. Gurtin, M.E.; Reddy, B.D. Some Issues Associated with the Intermediate Space in Single-Crystal Plasticity. J. Mech. Phys. Solids 2016, 95, 230–238. [Google Scholar] [CrossRef] [Scilit]
  27. Harewood, F.; McHugh, P. Investigation of Finite Element Mesh Independence in Rate Dependent Materials. Comput. Mater. Sci. 2006, 37, 442–453. [Google Scholar] [CrossRef] [Scilit]
  28. Beaudoin, A.J.; Acharya, A.; Chen, S.; Korzekwa, D.; Stout, M. Consideration of Grain-Size Effect and Kinetics in the Plastic Deformation of Metal Polycrystals. Acta Mater. 2000, 48, 3409–3423. [Google Scholar] [CrossRef] [Scilit]
  29. Asaro, R.J. Crystal Plasticity. J. Appl. Mech. 1983, 50, 921–934. [Google Scholar] [CrossRef] [Scilit]
  30. Peirce, D.; Asaro, R.J.; Needleman, A. Material Rate Dependence and Localized Deformation in Crystalline Solids. Acta Metall. 1983, 31, 1951–1976. [Google Scholar] [CrossRef] [Scilit]
  31. Bassani, J.L.; Wu, T. Latent Hardening in Single Crystals. II. Analytical Characterization and Predictions. Proc. R. Soc. Lond. A Math. Phys. Sci. 1991, 435, 21–41. [Google Scholar] [CrossRef] [Scilit]
  32. Lin, G.; Havner, K.S. A Comparative Study of Hardening Theories in Torsion Using the Taylor Polycrystal Model. Int. J. Plast. 1996, 12, 695–718. [Google Scholar] [CrossRef] [Scilit]
  33. Franciosi, P.; Berveiller, M.; Zaoui, A. Latent Hardening in Copper and Aluminium Single Crystals. Acta Metall. 1980, 28, 273–283. [Google Scholar] [CrossRef] [Scilit]
  34. Deng, G.Y.; Tieu, A.K.; Si, L.Y.; Su, L.H.; Lu, C.; Wang, H.; Liu, M.; Zhu, H.T.; Liu, X.H. Influence of Cold Rolling Reduction on the Deformation Behaviour and Crystallographic Orientation Development. Comput. Mater. Sci. 2014, 81, 2–9. [Google Scholar] [CrossRef] [Scilit]
  35. Lu, C.; Deng, G.Y.; Tieu, A.K.; Su, L.H.; Zhu, H.T.; Liu, X.H. Crystal Plasticity Modeling of Texture Evolution and Heterogeneity in Equal Channel Angular Pressing of Aluminum Single Crystal. Acta Mater. 2011, 59, 3581–3592. [Google Scholar] [CrossRef] [Scilit]
  36. Wang, H.; Lu, C.; Tieu, K.; Wei, P.; Yu, H. Texture Modeling of Accumulative Roll-Bonding Processed Aluminum Single Crystal {1 2 3} <6 3 4> by Crystal Plasticity FE. Adv. Eng. Mater. 2019, 21, 1800827. [Google Scholar] [CrossRef] [Scilit]
Figure 1. Schematics show the deformation in (a) Taylor model, (b) VPSC model, and (c) CPFEM.
Metals 16 00621 g001
Figure 2. Schematics show the relation between Wholemodel (FEM) and CPFEM, quasi-VPSC, and quasi-Taylor models. The three black rectangles represent the Submodel.
Metals 16 00621 g002
Figure 3. The strain history obtained from the Wholemodel was applied to (a) all the FEM nodes on the boundary of the Submodel, (b) all the FEM nodes on the boundary of the grain, and (c) all the FEM nodes in the Submodel. In the Submodel, the nodes that the strain was applied to are in gray.
Metals 16 00621 g003
Figure 4. (a) Distribution of deformed FEM meshes and shear strain, and (b) distribution of through-thickness shear strain. (c) An optical microscopy image shows the deformation of the embedded-pin after rolling with 50% nominal reduction.
Metals 16 00621 g004
Figure 5. Distribution of crystal rotation angles and initial grain boundaries, distribution of crystal rotation angles and distorted FEM meshes, and {1 1 1} pole figures in (a) Case 1, (b) Case 2, (c) Case 3, (d) Case 4, and (e) Case 5. (f) An EBSD image and corresponding pole figure of the 50% rolled aluminum sheet.
Metals 16 00621 g005
Figure 6. Distribution of deformed FEM configuration and crystal rotation angles of the whole thickness in (a) CPFEM, (b) quasi-VPSC, and (c) quasi-Taylor model.
Metals 16 00621 g006
Figure 7. (a) Distribution of crystal rotation angles of all elements, and (b) distribution of crystal rotation angles averaged within grains.
Metals 16 00621 g007
Figure 8. In-grain texture and plastic heterogeneity of four representative grains predicted using CPFEM, quasi-VPSC, and quasi-Taylor models.
Metals 16 00621 g008
Table 1. Five microstructures used in the CP simulations.
Sample Size ND × RD (mm2)Element Number
(ND × RD)
Grain Number
(ND × RD)
Element Size
(µm2)
Grain Size
(µm2)
Case 12 mm × 16 mm160 × 12808 × 6412.5 × 12.5250 × 250
Case 22 mm × 16 mm160 × 128016 × 12812.5 × 12.5125 × 125
Case 32 mm × 16 mm160 × 128032 × 25612.5 × 12.562.5 × 62.5
Case 42 mm × 16 mm320 × 256032 × 2566.25 × 6.2562.5 × 62.5
Case 52 mm × 16 mm320 × 256064 × 5126.25 × 6.2531.25 × 31.25
Disclaimer/Publisher’s Note: The statements, opinions and data contained in all publications are solely those of the individual author(s) and contributor(s) and not of MDPI and/or the editor(s). MDPI and/or the editor(s) disclaim responsibility for any injury to people or property resulting from any ideas, methods, instructions or products referred to in the content.