1. Introduction
In engineering practice, knowledge of the mechanisms of fatigue crack initiation and propagation is extremely important, because they directly affect the reliability and service life of the structure. The timely understanding and prediction of a crack’s behaviour allow sudden breaks to be prevented and reduce the risk of expensive repairs or the replacement of structural parts [
1,
2,
3,
4,
5].
The fatigue crack problem becomes even more important when it comes to armoured steels. Structures such as combat vehicles (tanks and infantry armoured vehicles) are made of armoured steel, and such structures must be designed to preserve their integrity even under extreme load conditions. Any occurrence of uncontrolled breakage can have consequences for the safety and functionality of combat vehicles. The presence of cracks, most often initiated by the impacts of ballistic projectiles, can shorten the service life of the structure and endanger the crew. By testing fatigue crack growth and determining the parameters that can be obtained from this type of testing, particularly the threshold stress intensity factor range (ΔKth), it is possible to define the loading level below which crack propagation will not occur and assess how rapidly a crack will grow once this threshold is exceeded. Nevertheless, to assess the remaining service life, the measurement of loads under real service conditions must be conducted. In particular, the load defines the stress intensity factor at the crack tip, which is the deciding factor for crack propagation before it reaches the critical length where the crack becomes unstable.
Particularly critical points in such structures are welded joints and all their zones (base material, heat-affected zone and weld metal). Due to their heterogeneous microstructure and residual stresses introduced by the welding process, welded joints often represent initial fracture sites. Therefore, knowledge of fatigue crack initiation and propagation in the welded joints of armour steels is of crucial importance for a reliable assessment of structural safety [
6,
7,
8,
9,
10].
Numerous studies confirm that extensive experimental studies have been conducted on various types of steels, as well as their welded joints, with the aim of understanding crack behaviour under fatigue loading. In the literature, special attention should be paid to high-strength (HSS) and armour steels, for which the fatigue crack growth rate is stated as crucial for the reliability of the structure and where the behaviour of all zones of the welded joint is often compared. A. Xu et al. [
11] investigated the fatigue crack growth rate in high-strength HG785D steel with and without a “soft + hard + soft” composite welded metal, demonstrating that the heterogeneous weld structure significantly influences FCG behaviour and enhances fatigue resistance through a combination of increased strength and toughness, which is particularly important for the reliability and safety assessment of welded structures. Y. A. Moe et al. [
12] investigated the fatigue crack growth behaviour of butt-welded ultra-high-strength steels (S700, S960, and S1100), showing that crack propagation resistance varies significantly across the base metal, weld metal, and heat-affected zone, with the welding method playing a key role, where laser welding provides superior fatigue performance compared to gas metal arc welding, highlighting its importance for the accurate fatigue life prediction of welded UHSS structures. Y. Ma et al. [
13] investigated the fatigue crack growth behaviour of Q550E high-strength steel welded joints, demonstrating that the stress ratio significantly influences crack growth parameters and fatigue performance, with welded joints showing higher sensitivity and distinct behaviour compared to the base material. Zhang et al. [
14] investigated the fatigue crack growth behaviour of weld-repaired high-strength low-alloy steel, showing that the introduction of a buffer layer significantly improves crack growth resistance, with the tri-metal system (base metal + buffer layer + weld metal) exhibiting better fatigue performance than the bi-metal configuration. X. Shen et al. [
15] conducted a study of the fatigue crack’s growth behaviour in different zones of the welded joint of the HSS steel EH690 used in shipbuilding. A comparison of experimentally obtained
da/dN − Δ
K curves on the welded joints (made of GMAW and EBW) of HSS S960QL was made by R.P.S. Sisodia et al. [
16]. The research of A. Čabrilo et al. [
17] can be highlighted as the closest to this research, since it was conducted on armour steel Protac 500, which belongs to the same hardness class as the steel used in the present study. The researchers used a GMAW welding process using austenitic stainless steel as a filler material. They achieved comparable metallurgical conditions in the welded joint and experimentally determined the parameters of the fatigue crack growth test and drew the necessary conclusions.
The welding of armour steels is an exceptional technological challenge due to their specific chemical composition and complex heat treatment that achieves strong mechanical properties. As the most critical zone of the welded joint, the HAZ stands out precisely because of its excessive heat input during welding, which leads to the degradation of the base material (microstructural changes and reduction in hardness). Special attention, when discussing reduced hardness, is given to the subcritical HAZ (SCHAZ), which is usually not visible in macroscopic observations but is still affected by the heat from the welding process. It exhibits negligible differences in microstructure and reduced hardness compared to the base material. Such a region, typically 6–10 mm in width, is referred to as the degraded zone [
18,
19]. One such produced steel is the subject of this article, which is armour steel SA 500. It belongs to the group of ultra-high-strength steels in the hardness class 500 HB. The most common welding process for these steels is the GMAW process with the use of austenitic stainless steels as filler materials with the aim of improving the toughness of the welded joint [
20,
21]. This paper presents a study on welding using high-strength welding wire, which attempted to approximate the mechanical properties of the base material and the welded joint. By optimizing the welding parameters and controlling the welding speed and heat input, we attempted to minimize the degradation of the HAZ. The goal was also to show that by using such a filler material, it is possible to create a high-quality welded joint in armour steel without compromising its primary function, i.e., impenetrability.
In addition to the mechanical tests performed on the welded joint (microstructural analysis, hardness measurement and tensile test), this work also included the testing of fatigue crack growth. For this purpose, specimens of the base material, the HAZ and the weld metal were analyzed, which enabled a comparison of the fatigue crack growth mechanism in different zones of the welded joint. Based on the obtained experimental parameters and the fatigue crack growth curves according to the Paris and McEvily laws, comprehensive insight into the influence of welding using the aforementioned wire on the fatigue behaviour of SA 500 armour steel was provided.
4. Discussion
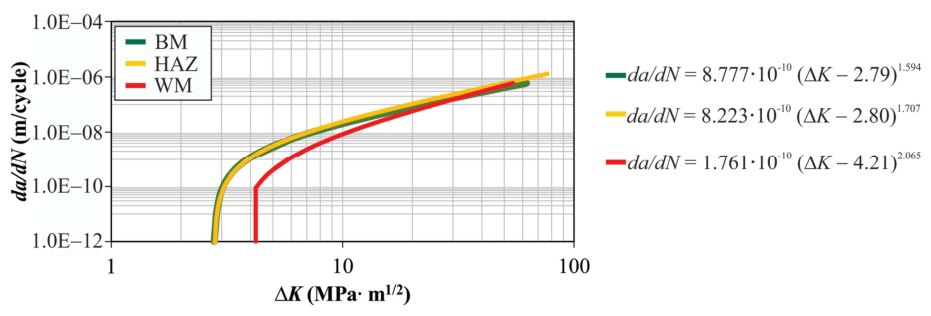
In this section, the results of the fatigue crack growth test were analyzed, where a comparison was made of both the fatigue crack growth curves and the thresholds for the start of crack propagation (Δ
Kth) for the base material (BM), the heat-affected zone (HAZ) and the weld metal (WM). The comparison is shown in
Figure 17.
The Δ
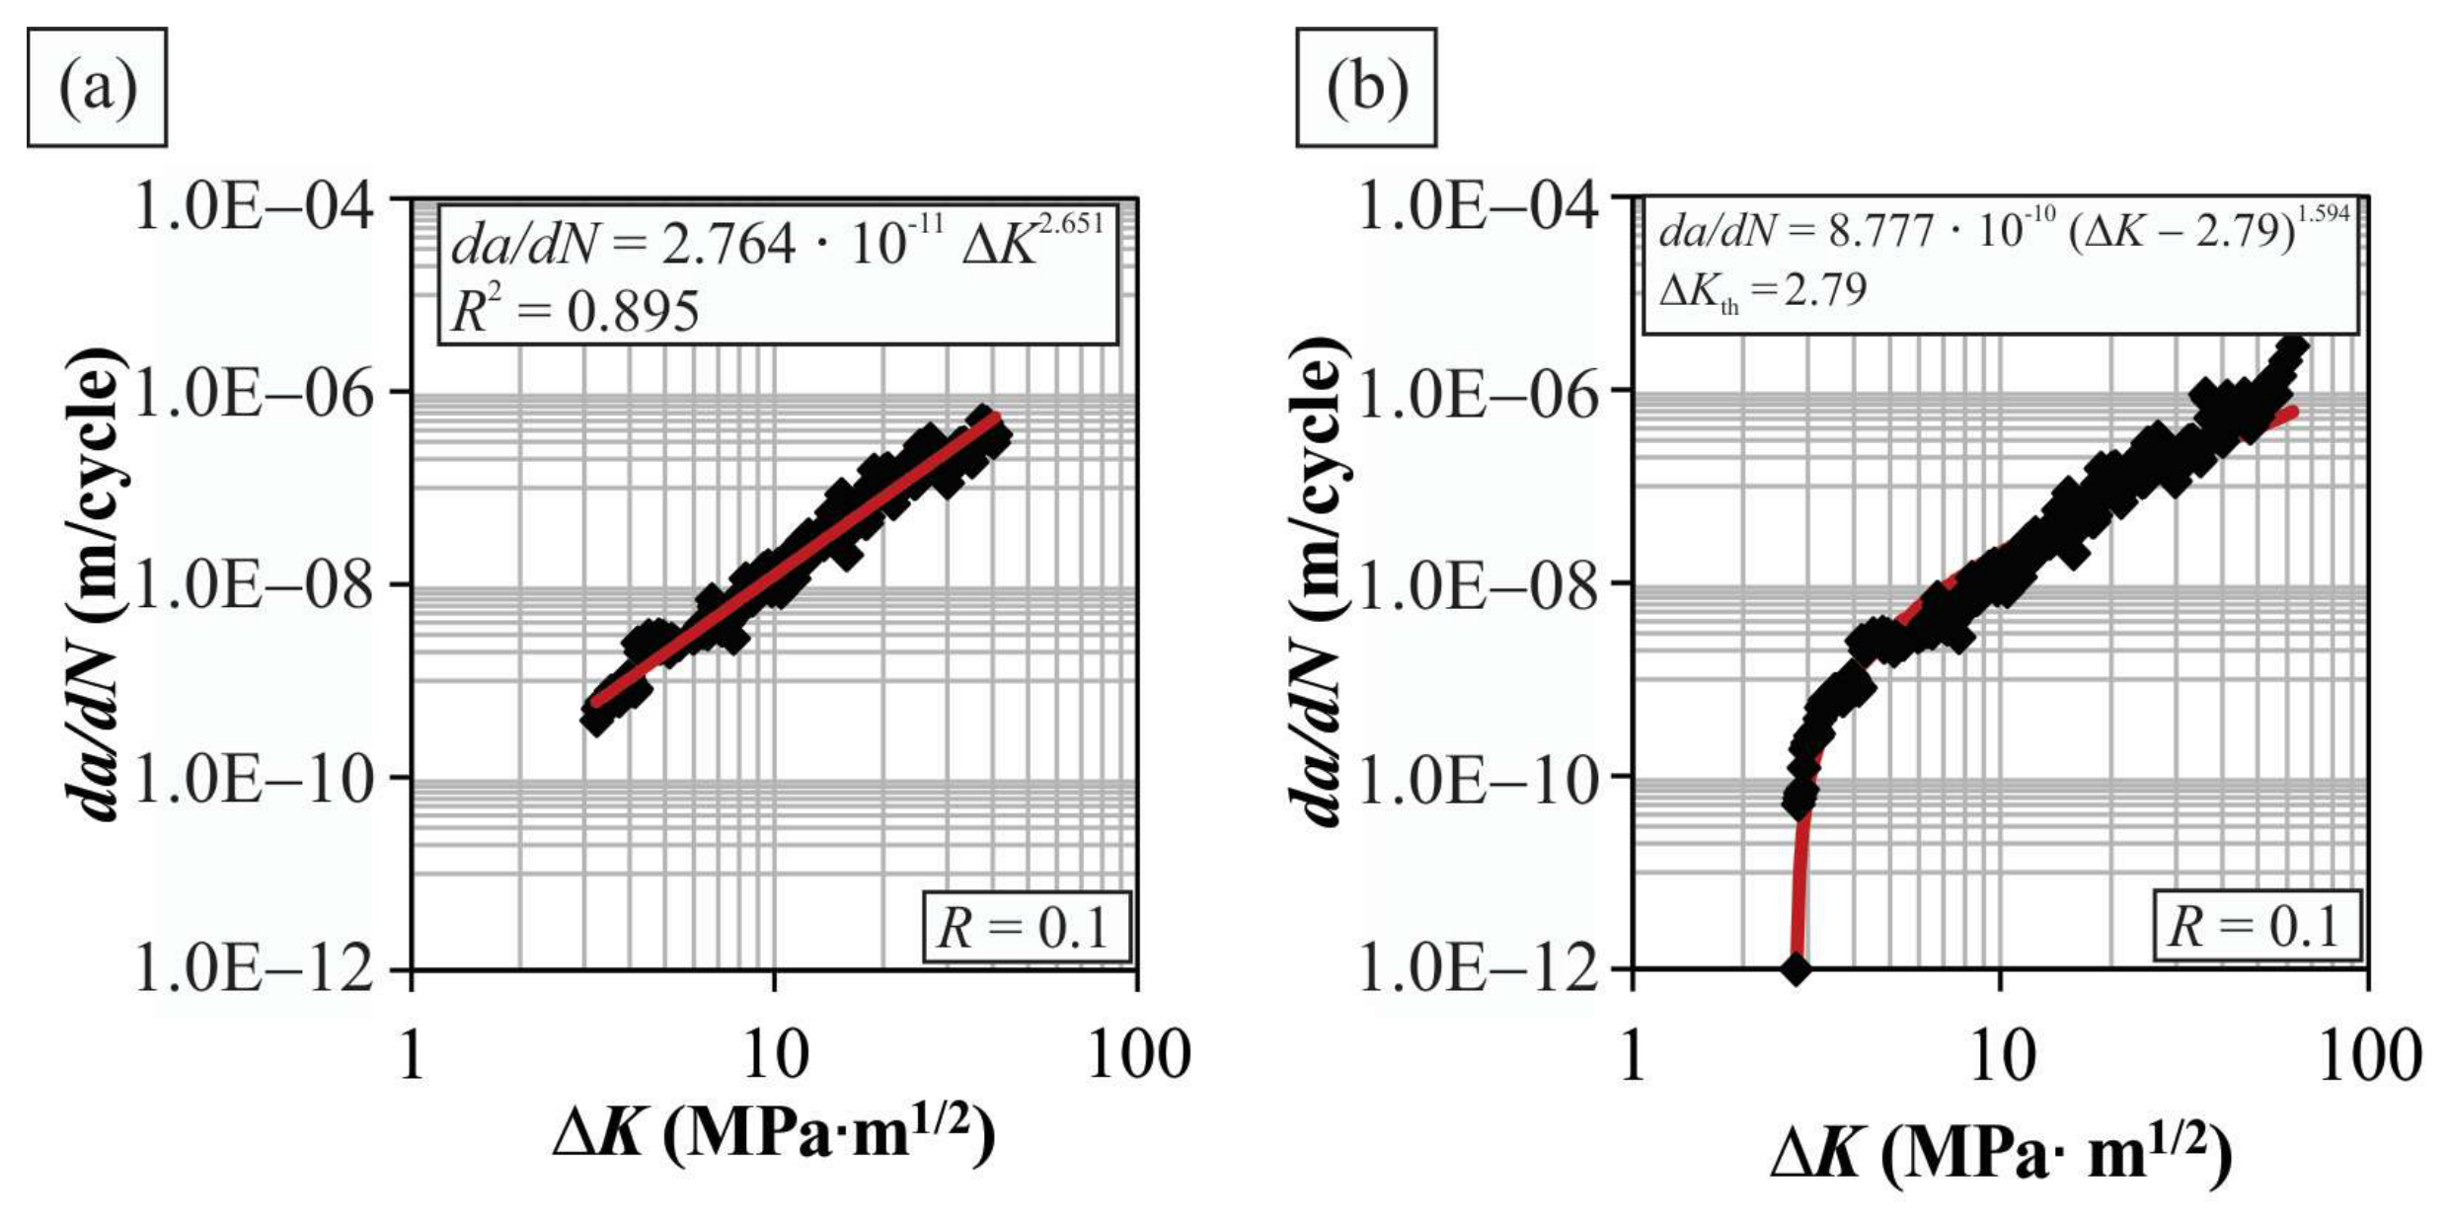
Kth threshold value for the base material is 2.79 MPa∙m
1/2, while for the HAZ, it is 2.80 MPa∙m
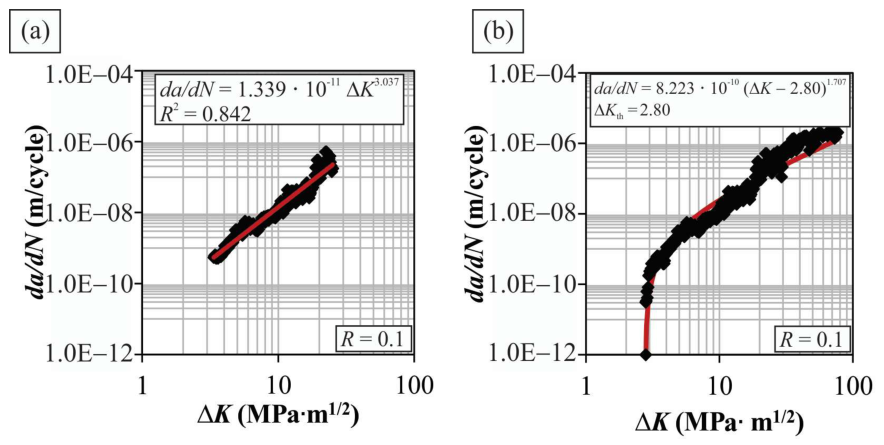
1/2, which indicates almost identical resistance to initiation and early crack growth in these zones. This coincidence represents a very favourable result, considering the fact that the HAZ is often the most critical point of the welded joint due to the microstructural changes caused by the welding thermal cycle. The obtained results confirm that the chosen welding procedure and the filler material enabled the preservation of the fatigue properties of the base material in the HAZ, which was one of the main goals of this research. By comparing the fatigue crack growth curves for the base material and HAZ, very similar behaviour can be observed in the region of stable crack growth, which additionally confirms that the thermal influence of welding did not lead to a significant deterioration of the resistance of the HAZ to crack propagation. In contrast, the weld metal shows a significantly higher value of the threshold Δ
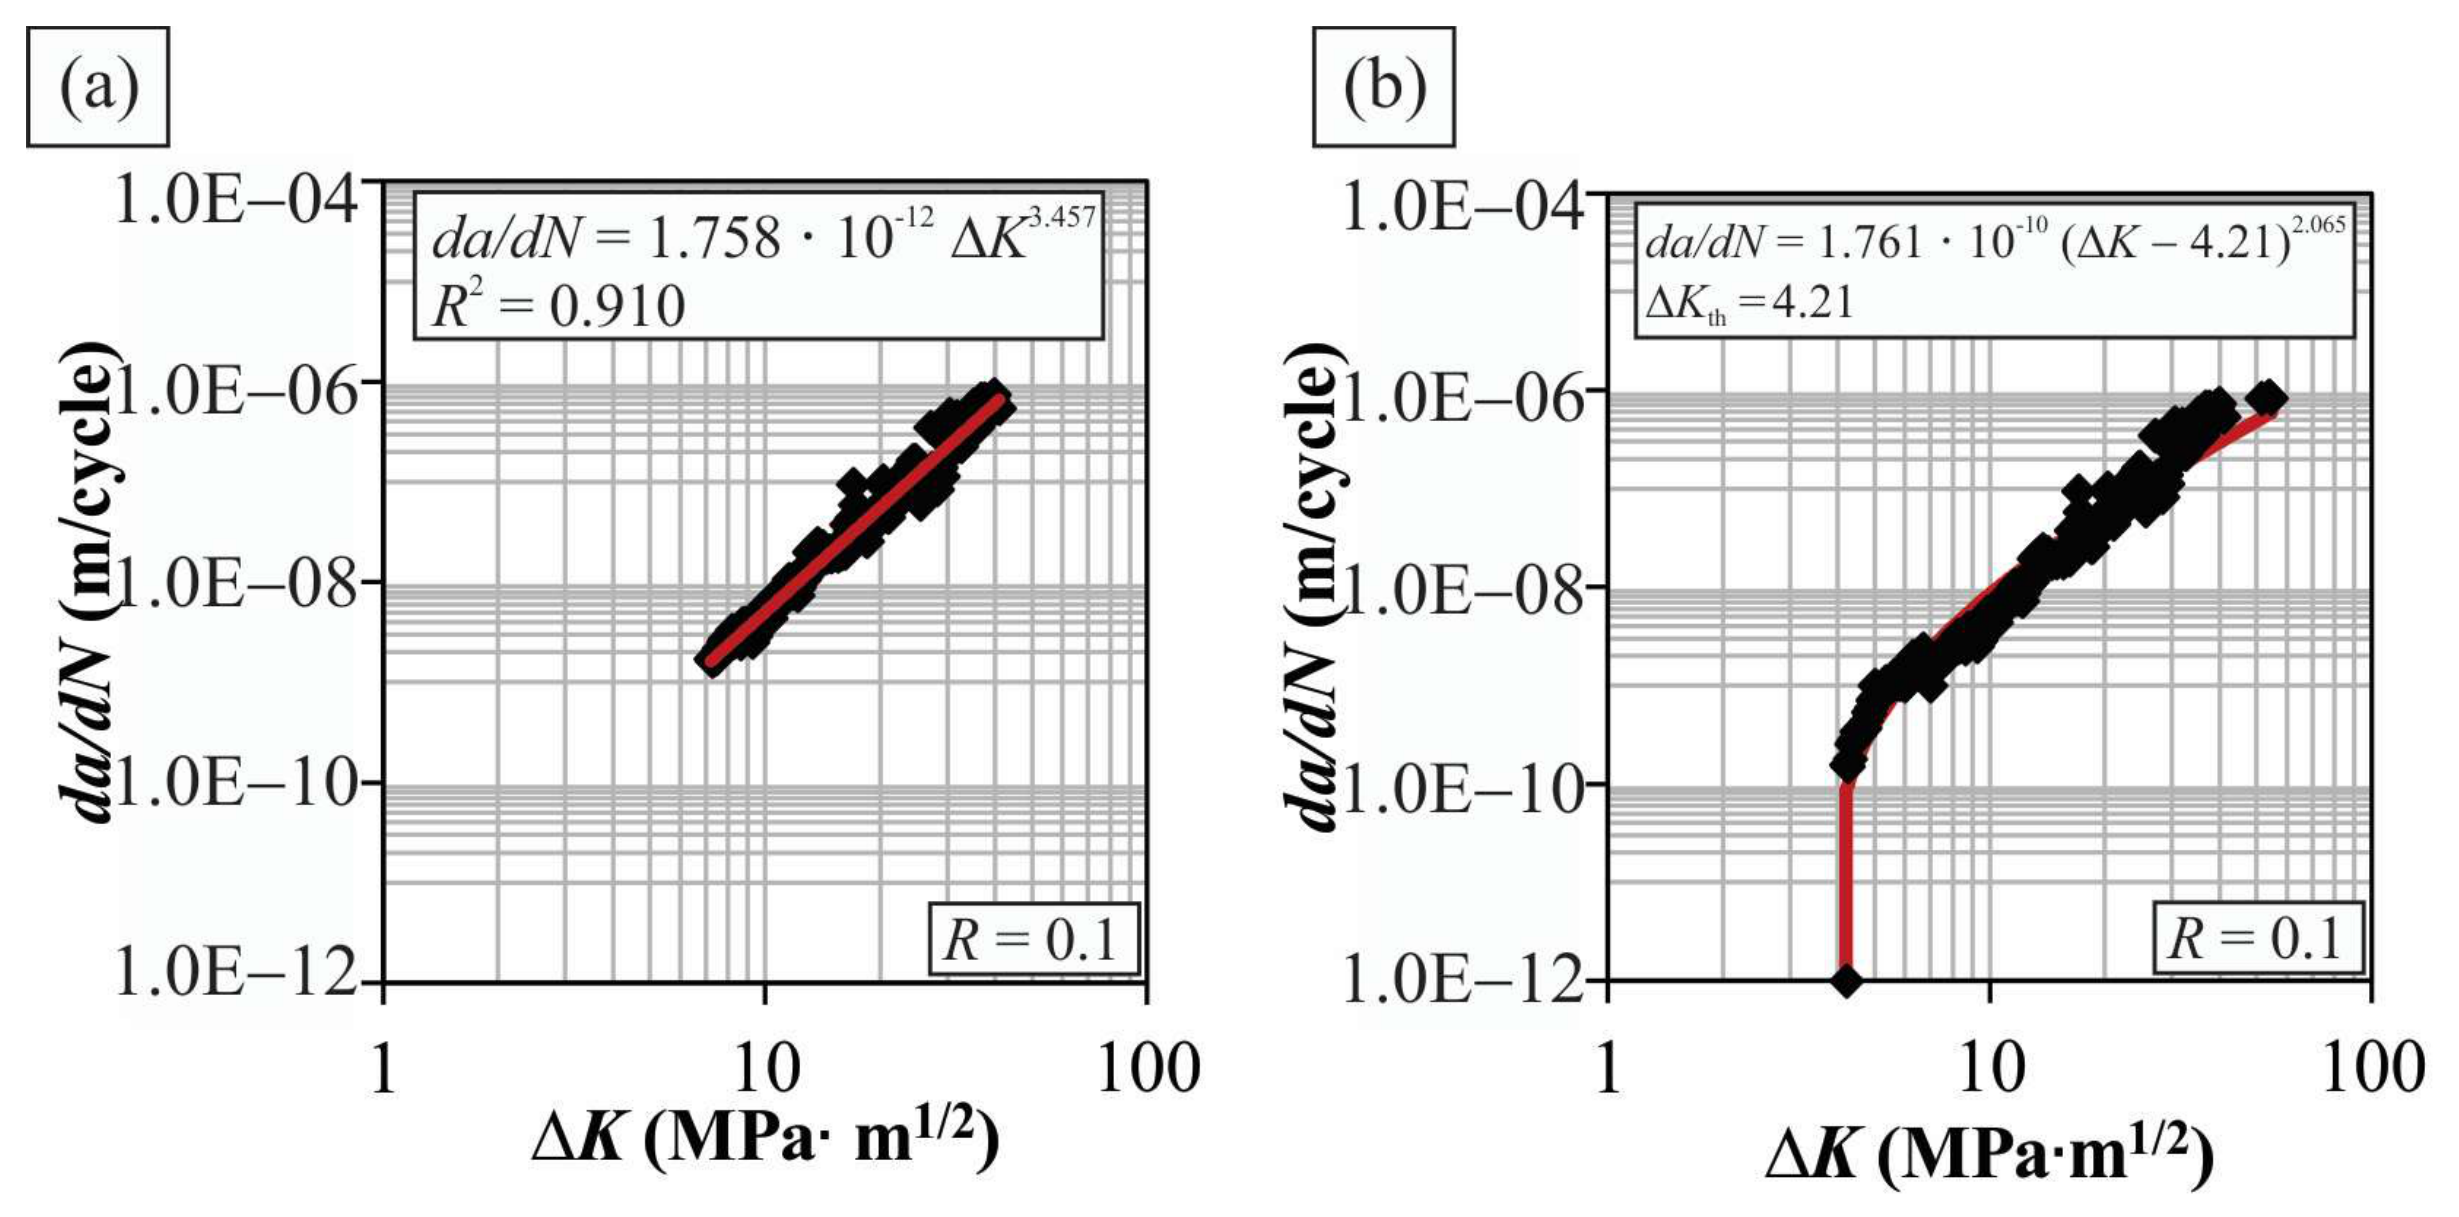
Kth of 4.21 MPa∙m
1/2, which indicates better resistance to crack formation compared to the base material and HAZ. This behaviour of the weld metal can be attributed to its relatively homogeneous fine-grained martensitic–bainitic microstructure and corresponding mechanical properties. As shown in
Table 7 of this study, the weld metal (i.e., the deposited filler material—high-strength welding wire) exhibits the finest grain size among all zones of the welded joint. Small grain size is known to contribute to higher Δ
Kth values, thereby improving resistance to fatigue crack growth. In addition, the filler material, due to its lower alloying level, exhibits lower hardness compared to the base material, which further contributes to an increased Δ
Kth. In the comparison between the base material and the HAZ, only minor differences in grain size were observed (between BM and ICHAZ), which explains the nearly identical Δ
Kth values obtained for these regions. Residual stresses, which can also influence fatigue crack growth behaviour, were not the primary focus of this study. The welding technology was designed to make residual stress as small as possible. Therefore, all passes were welded with very low heat input (below 0.7 kJ/mm), and double-side welding was applied. However, the residual stresses were measured using three different methods, and only their average values are reported here for completeness. The measured residual stress ranges (difference between longitudinal and transverse stresses) were approximately −50 MPa to 70 MPa in the base material, 115 MPa to 300 MPa in the HAZ, and −50 MPa to 140 MPa in the weld metal. It should be noted that specimen preparation leads to the partial relaxation of residual stresses; therefore, their direct influence on fatigue crack growth behaviour in the tested specimens is considered limited. A more detailed analysis of residual stresses will be presented in a separate publication. By analyzing the fatigue crack growth curves, it can be concluded that the weld metal, in addition to a higher crack initiation threshold, also exhibits more favourable behaviour in the region of stable crack growth (lower curve on the diagram), which additionally confirms that the applied welding procedure did not negatively affect the fatigue resistance of the welded joint. Overall, the results of the fatigue crack growth test clearly indicate that the properties of the base material in the HAZ are successfully preserved, while the weld metal even shows improved resistance to fatigue crack initiation.
A comparison with previous studies, particularly the work of Čabrilo et al. [
17] on Protac 500 armour steel, shows that significantly higher Δ
Kth values were obtained for the base material (13.4 MPa·m
1/2), indicating a higher resistance to fatigue crack growth compared to the base material investigated in the present study. However, their results also revealed a reduction in Δ
Kth in both the HAZ (12.6 MPa·m
1/2) and especially the weld metal (10.1 MPa·m
1/2), which was associated with the use of an austenitic filler material. In contrast, although the absolute Δ
Kth values obtained in this study are lower, the applied controlled welding procedure with reduced heat input enabled the preservation of fatigue crack growth resistance in the HAZ, maintaining values comparable to the base material. Moreover, the use of a high-strength filler material resulted in improved Δ
Kth in the weld metal, which is particularly important since the weld region is generally considered the most critical part of armour steel structures. These results emphasize the significant influence of welding parameters and filler material selection on fatigue crack growth behaviour, especially in achieving improved performance in the weld metal while maintaining the integrity of the HAZ.
5. Conclusions
According to numerous studies, the welded joint is considered the most critical point in structures made of armour steels, given the pronounced microstructural changes and reduction in mechanical and fatigue properties due to the thermal cycle of welding. For this reason, the presented study was conducted on SA 500 armour steel with the aim of assessing the influence of the applied welding process on mechanical properties and resistance to fatigue crack growth.
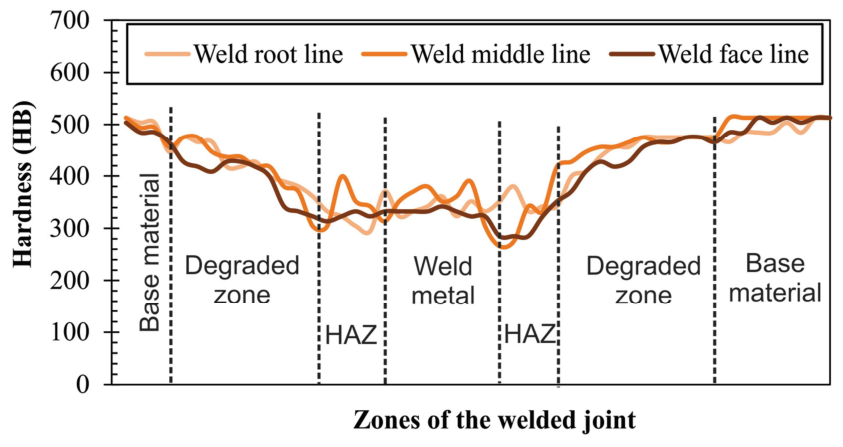
The applied welding procedure, which includes the introduction of a high-strength filler wire and optimized welding parameters, showed extremely favourable results in terms of preserving the mechanical properties of the base material. Hardness measurements showed that the base material has a hardness of 505 HB, while in the heat-affected zone (HAZ) and in the weld metal, values of 325 HB and 347 HB were measured, respectively. This corresponds to a hardness reduction of approximately 36% in the HAZ and 31% in the weld metal compared to the base material, which, considering the nature of armour steels and their sensitivity to welding, can be considered a relatively small and technically acceptable decrease.
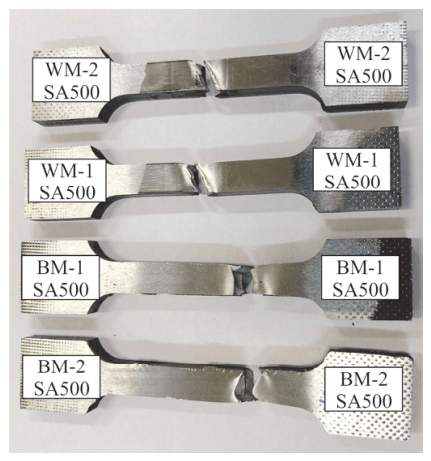
The tensile test results further confirm the efficiency of the applied welding process. The base material showed a tensile strength of 1555 MPa, while in the welded joint, a tensile strength of 1006 MPa was measured, which corresponds to a reduction of about 35%. Although a drop in tensile strength is inevitable in the welded joints of ultra-high-strength steels, the achieved tensile strengths indicate that the optimized parameters and high-strength wire significantly contributed to the reduction in mechanical property degradation.
Fatigue crack growth analysis showed that the behaviour of the base material in the HAZ was successfully preserved. The threshold values for crack initiation and early growth (ΔKth) for the base material and the HAZ are 2.79 MPa∙m1/2 and 2.80 MPa∙m1/2, respectively, indicating the almost identical behaviour of these zones in terms of resistance to crack initiation. This result represents a very significant achievement, since the HAZ is usually the most sensitive zone of a welded joint.
At the same time, the weld metal shows improved fatigue behaviour, with a significantly higher ΔKth threshold value of 4.21 MPa∙m1/2, which indicates a higher resistance to crack formation compared to the base material and HAZ. This can be related to the relatively homogeneous martensitic–bainitic microstructure of the weld metal, as well as the fine grain size measured in the weld metal, which contributes to a higher ΔKth, as well as the favourable mechanical properties resulting from the chemical composition of the filler material and the cooling conditions.
Based on the obtained results, it can be concluded that the applied welding procedure, with the use of high-strength wire and optimized parameters, enables the preservation of the fatigue behaviour of the base material in the HAZ, as well as the achievement of the even better behaviour of the weld metal in terms of resistance to fatigue crack growth. By employing this welding procedure and the obtained fatigue crack growth parameters, it is possible to evaluate the service life of such a welded joint (including all its zones) in the presence of cracks, which represent the most common type of defect in armour steel structures and typically arise under impact loading in real service conditions. This approach represents a very promising solution for welding armour steel in constructions where safety, reliability and resistance to damage are of crucial importance.
Author Contributions
Conceptualization, T.V., J.B., and M.M.; methodology, M.M., M.A., G.L., and T.V.; validation, T.V., G.L., and J.B.; formal analysis, M.M. and M.A.; investigation, M.M., M.A., G.L., J.B., and T.V.; resources, J.B.; data curation, M.M., G.L., M.A., and T.V.; writing—original draft preparation, M.M.; writing—review and editing, T.V. and G.L.; visualization, G.L., and M.A.; supervision, T.V. and J.B. All authors have read and agreed to the published version of the manuscript.
Funding
This research was funded by Federal Ministry of Education and Science, Bosnia and Herzegovina, grant no. 05-35-2393-2/25.
Data Availability Statement
The data presented in this study are available on request from the corresponding author due to privacy.
Acknowledgments
The authors of this paper would like to express their gratitude to the Federal Ministry of Education and Science, Bosnia and Herzegovina, for supporting their work.
Conflicts of Interest
Author Jure Bernetič was employed by SAAT d.o.o. The remaining authors declare that the research was conducted in the absence of any commercial or financial relationships that could be construed as a potential conflict of interest.
References
- Manjunatha, M.; Gorash, Y.; Comlekci, T.; Milne, L.; Mackenzie, D. Very High Cycle Fatigue and Fatigue Crack Growth of Steels: A Review. Appl. Sci. 2026, 16, 1737. [Google Scholar] [CrossRef] [Scilit]
- Hohenwarter, A.; Leitner, T.; Pippan, R. Fatigue Crack Propagation Across the Multiple Length Scales of Technically Relevant Metallic Materials. Annu. Rev. Mater. Res. 2024, 54, 223–246. [Google Scholar] [CrossRef] [Scilit]
- Sangid, M.D. The Physics of Fatigue Crack Propagation. Int. J. Fatigue 2025, 197, 108928. [Google Scholar] [CrossRef] [Scilit]
- Magudeeswaran, G.; Balasubramanian, V.; Madhusudhan Reddy, G. Effect of welding processes and consumables on fatigue crack growth behaviour of armour grade quenched and tempered steel joints. Def. Technol. 2014, 10, 47–59. [Google Scholar] [CrossRef] [Scilit]
- Fasun, G.; Predan, J.; Gubeljak, N. A Fracture-Mechanics-Based Approach to the Analysis of the Structural Integrity of a Howitzer Cannon Barrel. Trans. Famena 2024, 48, 37–52. [Google Scholar] [CrossRef] [Scilit]
- Li, C.X.; Ji, B.H.; Wang, Q.D.; Yao, Y. Critical distance-based fatigue evaluation of welded joints in steel bridge under bending loading. Eng. Fail. Anal. 2024, 162, 108445. [Google Scholar] [CrossRef] [Scilit]
- Tavares, S.M.O.; Castro, J.T.P.; Meggiolaro, M.A. Fatigue Crack Growth Thresholds and Load Effects in Metallic Materials. Int. J. Fatigue 2022, 155, 106604. [Google Scholar] [CrossRef] [Scilit]
- Fustar, B.; Lukacevic, I.; Dujmovic, D. Review of Fatigue Assessment Methods for Welded Steel Structures. Adv. Civ. Eng. 2018. [Google Scholar] [CrossRef] [Scilit]
- Zerbst, U.; Ainsworth, R.A.; Beier, H.-T.; Pisarski, H.; Zhang, Z.L.; Nikbin, K.; Nitschke-Pagel, T.; Münstermann, S.; Kucharczyk, P.; Klingbeil, D. Review on Fracture and Crack Propagation in Weldments—A Fracture Mechanics Perspective. Eng. Fract. Mech. 2014, 132, 200–276. [Google Scholar] [CrossRef] [Scilit]
- Qin, Y.X.; den Besten, H.; Palkar, S.; Kaminski, M.L. Mid- and High-Cycle Fatigue of Welded Joints in Steel Marine Structures: Effective Notch Stress and Total Stress Concept Evaluations. Int. J. Fatigue 2021, 142, 105822. [Google Scholar] [CrossRef] [Scilit]
- Xu, A.; Wan, Y.; Ye, M.; Song, X. Assessment of the fatigue crack growth behavior of HG785D steel welded joints. Mater. Today Commun. 2025, 42, 111130. [Google Scholar] [CrossRef] [Scilit]
- Moe, Y.A.; Hasib, M.T.; Paul, J.; Amraei, M.; Ahola, A.; Kruzic, J.; Heidarpour, A.; Zhao, X.L. Experimental study on the fatigue crack growth rates of welded ultra-high strength steel plates. Adv. Struct. Eng. 2023, 26. [Google Scholar] [CrossRef] [Scilit]
- Ma, Y.; Cheng, E.; Wu, X.; He, Y.; Wang, L. Fatigue crack growth of Q550E high strength steel and welded joint. J. Civ. Environ. Eng. 2025, 47, 142–151. [Google Scholar] [CrossRef]
- Zhang, C.; van der Vyver, S.; Hu, X.; Lu, P. Fatigue crack growth behavior in weld-repaired high-strength low-alloy steel. Eng. Fract. Mech. 2011, 78, 1862–1875. [Google Scholar] [CrossRef] [Scilit]
- Shen, X.K.; Gao, X.D.; Shao, Y.B.; He, W.T.; Yu, Z.B. Investigation on the fatigue crack growth behavior of welded joints in EH690 high-strength marine steel. Int. J. Fatigue 2024, 189, 108572. [Google Scholar] [CrossRef] [Scilit]
- Sisodia, R.P.S.; Gaspár, M.; Lukács, J. Comparison of fatigue crack growth design curves on GMAW and EBW joints of high strength steels. Weld. World 2024, 68, 2167–2185. [Google Scholar] [CrossRef] [Scilit]
- Cabrilo, A.; Sedmak, A.; Burzic, Z.; Perkovic, S. Fracture mechanics and fatigue crack propagation in armor steel welds. Eng. Fail. Anal. 2019, 106, 104155. [Google Scholar] [CrossRef] [Scilit]
- Gürol, U.; Çelik, C.; Çoban, O.; Göçmen, M.; Koçak, M. Mechanical and ballistic performance of high-hardness armor steels welded with ASS-LHF sandwich joint design. Mater. Today Commun. 2025, 42, 111209. [Google Scholar] [CrossRef] [Scilit]
- Hanhold, B.; Babu, S.S.; Cola, G. Investigation of heat affected zone softening in armour steels Part 1-Phase transformation kinetics. Sci. Technol. Weld. Joi 2013, 18, 247–252. [Google Scholar] [CrossRef] [Scilit]
- Bircan, M.; Pan, K.Y.; Zhao, H.S.; Fan, J.W.; Dong, H. Microstructural Evolution and Mechanical Performance of A500 Bulletproof Steel Joints Welded with Austenitic and Ferritic Filler Materials. Materials 2025, 18, 929. [Google Scholar] [CrossRef] [Scilit]
- de Vasconcelos, C.H.M.; Le Sénéchal, N.V.; Loayza, C.R.L.; Castro, A.A.; Braga, E.D.; Paula, A.D.; Weber, R.P. Effects of Welding Parameters on Percentage Dilution and Mechanical Properties in Welded Joints of Ultra-High Hardness Armour Steels. J. Min. Met. B 2025, 61, 293–302. [Google Scholar] [CrossRef] [Scilit]
- SWEBOR. SWEBOR ARMOR™ 500 BALLISTIC PROTECTION STEEL. Available online: www.swebor.se (accessed on 16 February 2026).
- Hermann Fliess & Co. GmbH. ED-FK1000 MIG (GMAW) Wires for High Strength Structural Steels (X90). Available online: https://fliess.com/en/products/mig-gmaw-wires/ed-fk1000/ (accessed on 16 February 2026).
- DIN EN ISO 16834; Welding Consumables—Wire Electrodes, Wires, Rods and Deposits for Gas Shielded Arc Welding of High Strength Steels—Classification. International Organization for Standardization (ISO): Geneva, Switzerland, 2012.
- EN ISO 9015-2:2016; Destructive Tests on Welds in Metallic Materials-Hardness Testing-Part 2: Microhardness Testing of Welded Joints. European Committee for Standardization: Brussels, Belgium, 2016; p. 15.
- EN ISO 15614-1:2017; Specification and Qualification of Welding Procedures for Metallic Materials-Welding Procedure Test-Part 1: Arc and Gas Welding of Steels and Arc Welding of Nickel and Nickel Alloys. European Committee for Standardization: Brussels, Belgium, 2017; p. 46.
- EN ISO 6892-1:2019; Metallic Materials-Tensile Testing-Part 1: Method of Test at Room Temperature. European Committee for Standardization: Brussels, Belgium, 2016; p. 87.
- EN ISO 5178:2019; Destructive Tests on Welds in Metallic Materials-Longitudinal Tensile Test on Weld Metal in Fusion Welded Joints. European Committee for Standardization: Brussels, Belgium, 2019; p. 24.
- ASTM E647-24; Standard Test Method for Measurement of Fatigue Crack Growth Rates. ASTM: West Conshohocken, PA, USA, 2024.
- Halfpenny, A.; Bagni, C.; Chabod, A.; Vervoort, S. A comprehensive review of Fatigue Crack Growth laws and models. Procedia Struct. Integr. 2025, 75, 219–233. [Google Scholar] [CrossRef] [Scilit]
- Hellum, V.; Gabrielsen, O.; Ås, S.K. Fatigue crack growth in mooring chain steel at different mean load levels. Mar. Struct. 2023, 92, 103507. [Google Scholar] [CrossRef] [Scilit]
- Duarte, L.; Schönherr, J.A.; Madia, M.; Zerbst, U.; Geilen, M.B.; Klein, M.; Oechsner, M. Recent Developments in the Determination of Fatigue Crack Propagation Thresholds. Int. J. Fatigue 2022, 164, 107131. [Google Scholar] [CrossRef] [Scilit]
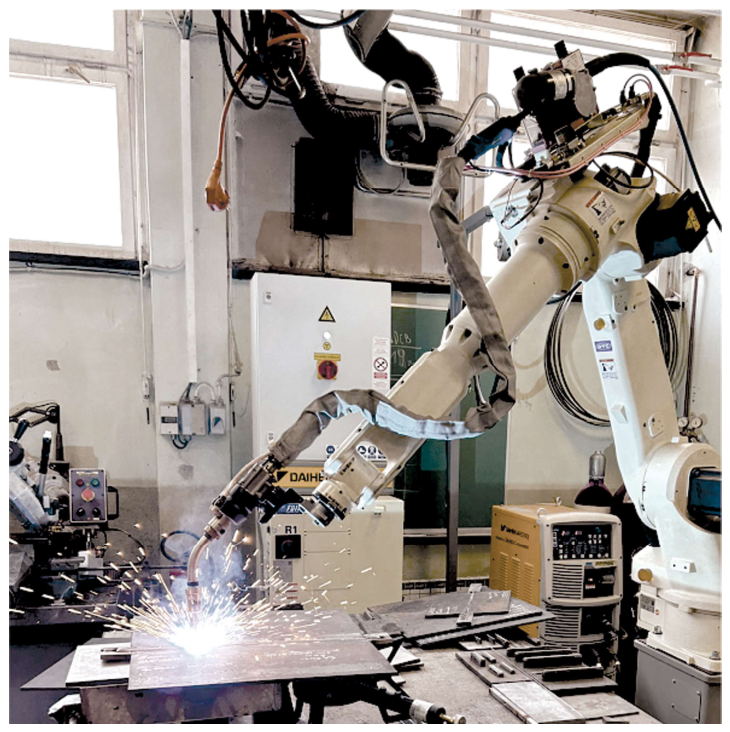
Figure 1.
OTC robot during welding process.
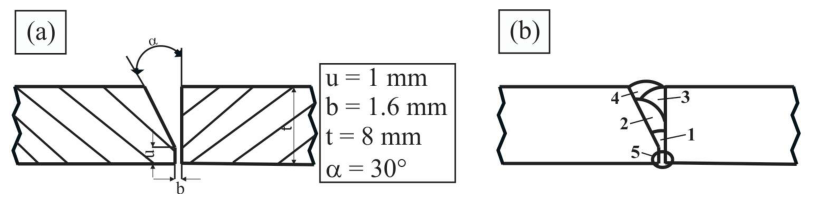
Figure 2.
Preparation of welded joint: (a) geometry of butt joint; (b) welding passes.
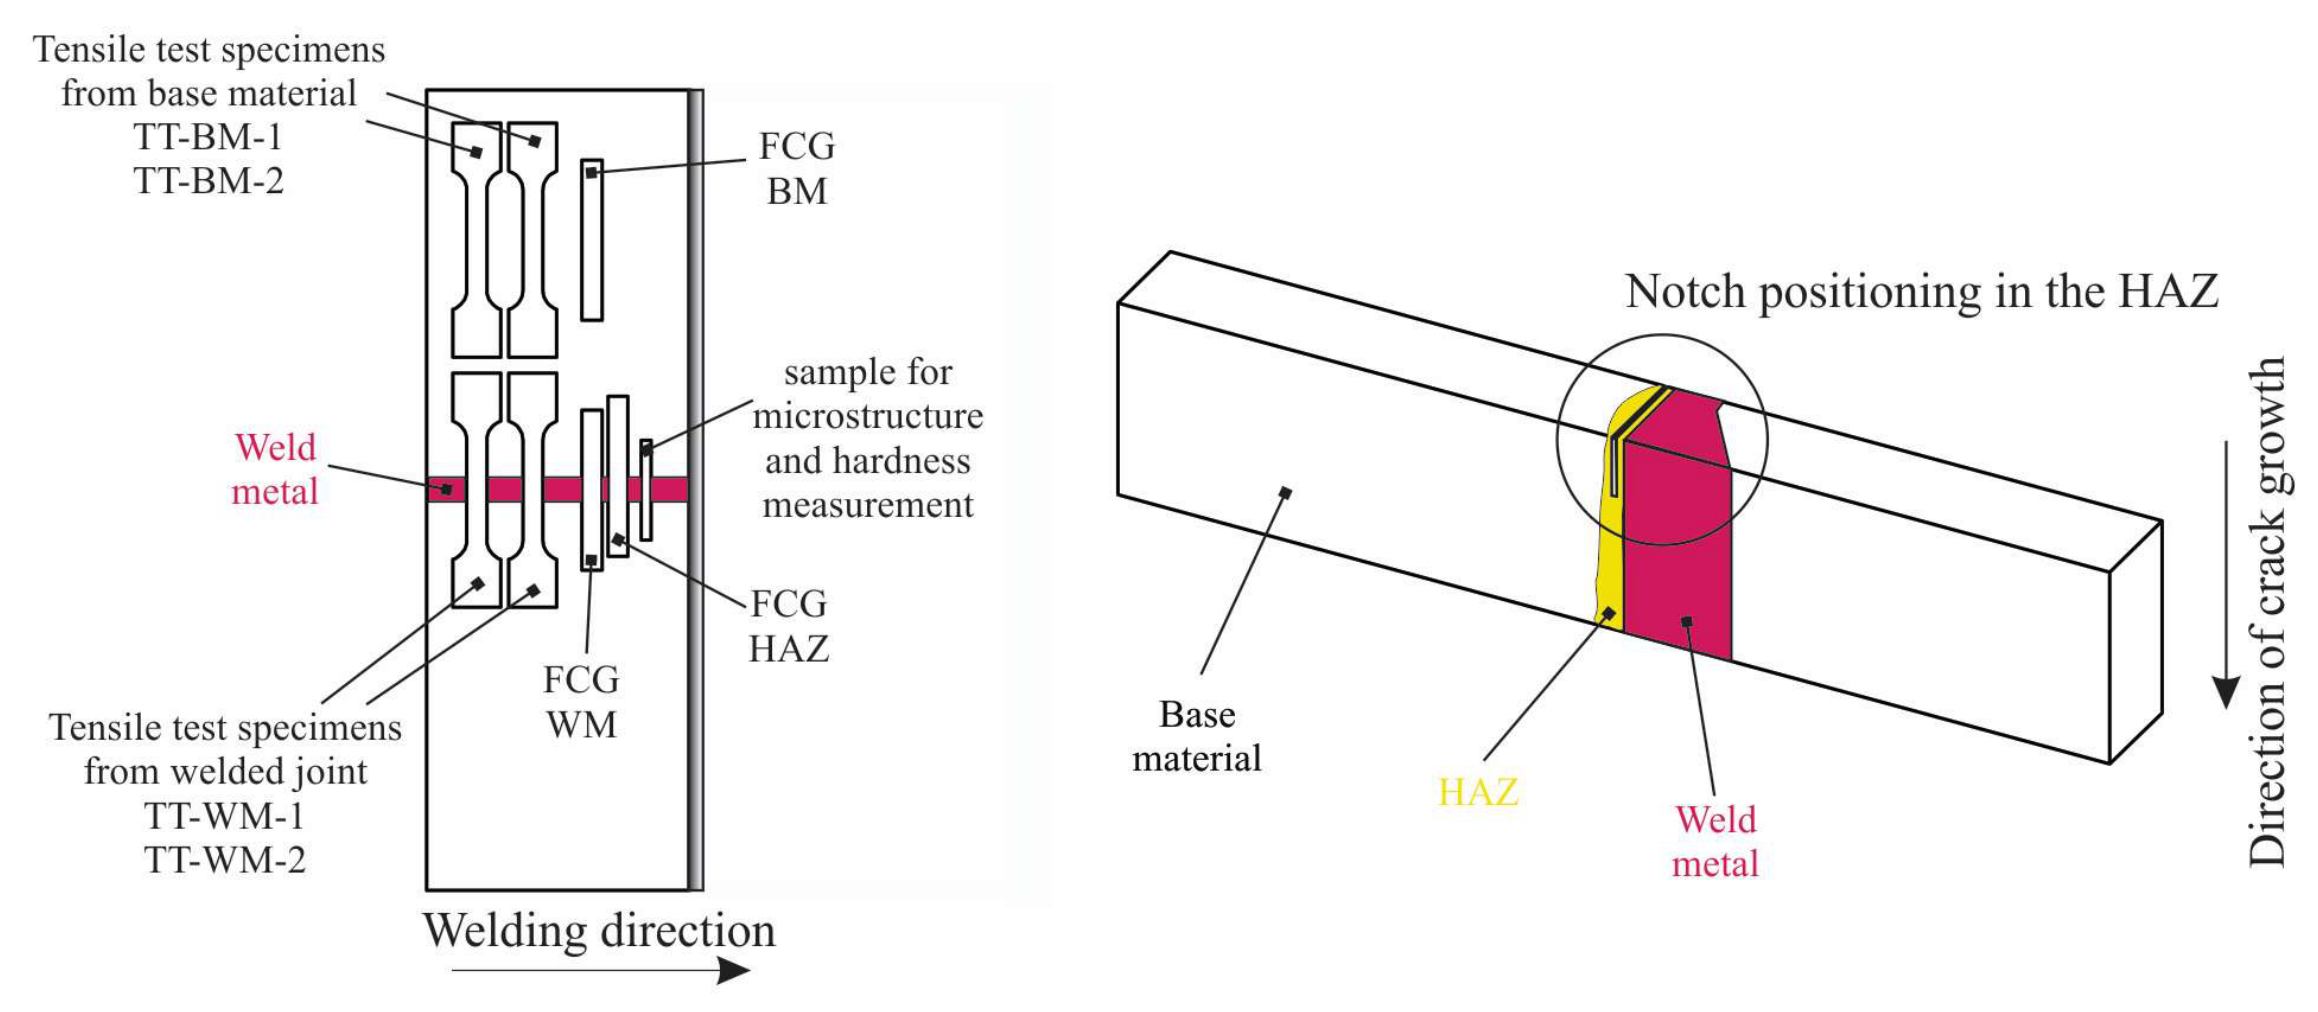
Figure 3.
Position of specimens from welded plate.
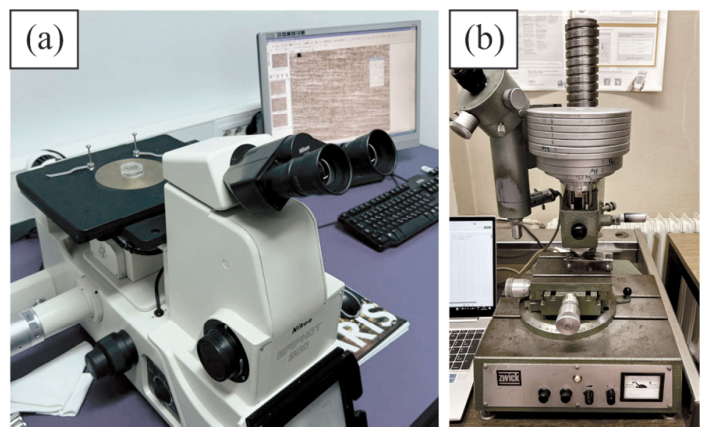
Figure 4.
Experimental equipment: (a) Nikon Epiphot 300 microscope; (b) Roell-Zwick Z600 machine.
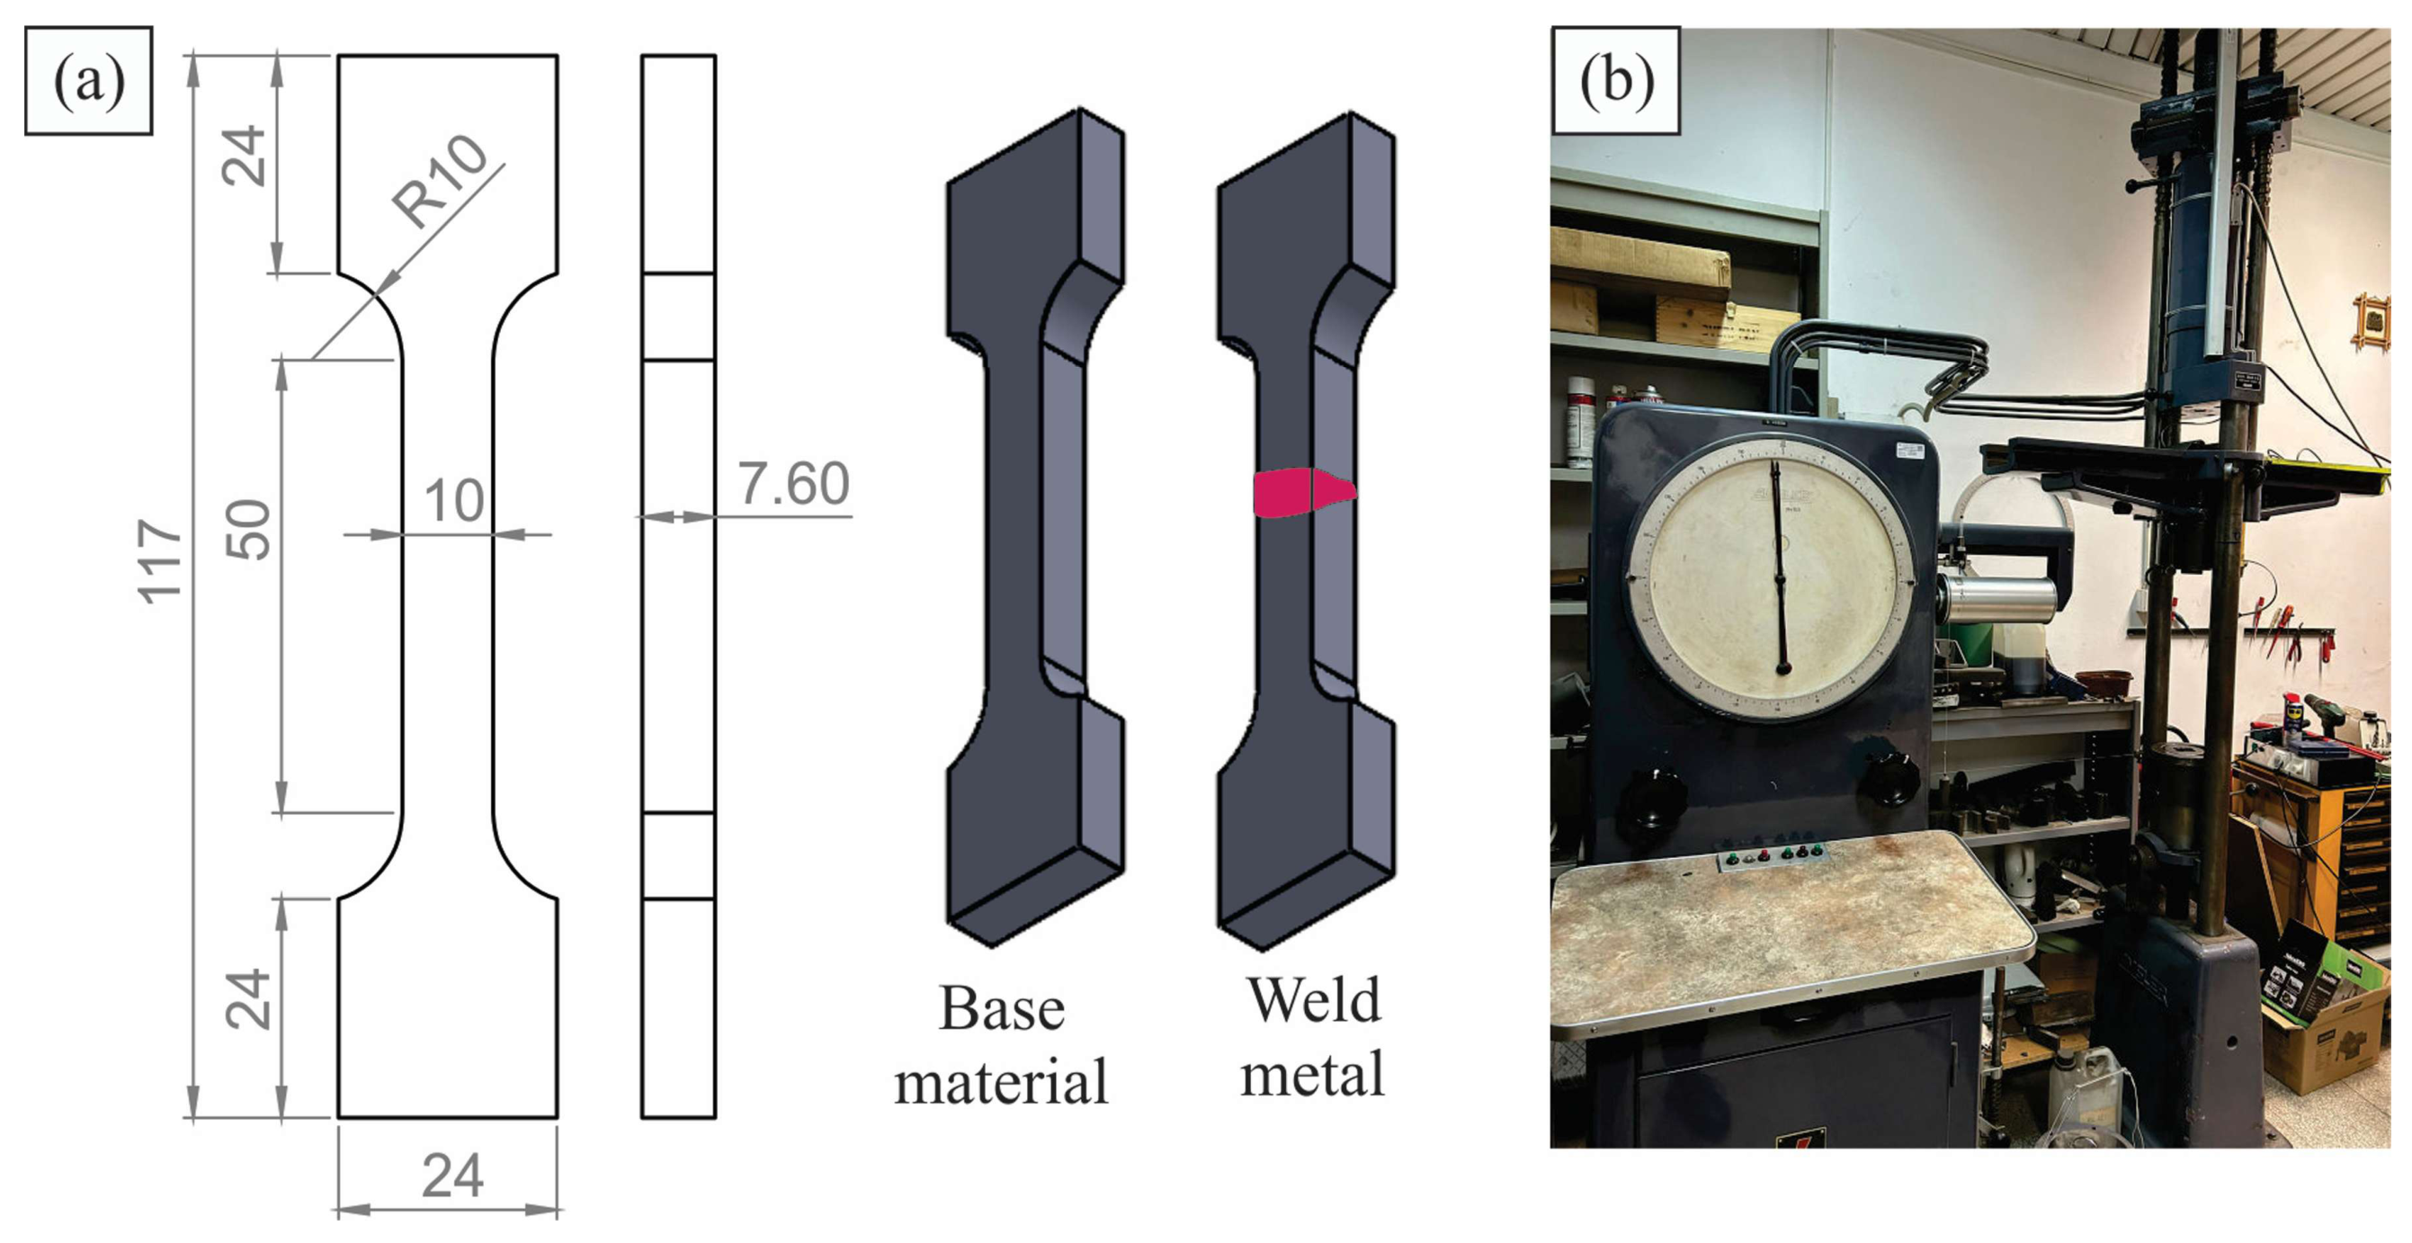
Figure 5.
Tensile test: (a) unit: mm, geometry of specimens; (b) Amsler 559/554 tensile machine.
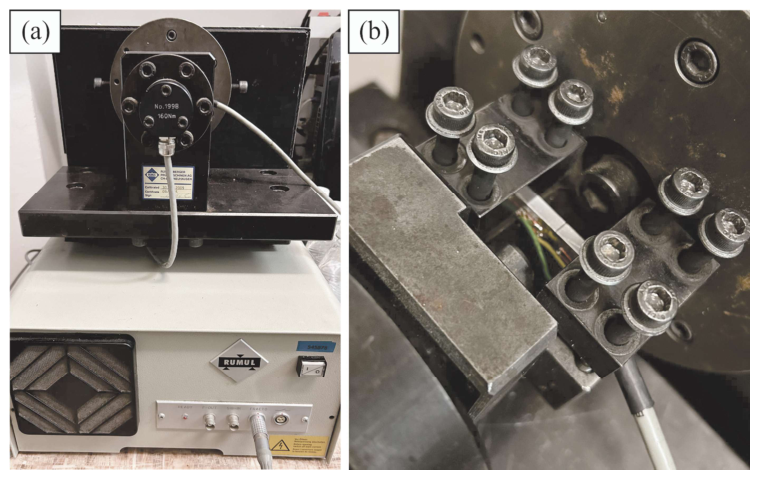
Figure 6.
Experimental setup for fatigue crack growth test: (a) Rumul Cracktronic testing device; (b) specimen positioned for testing.
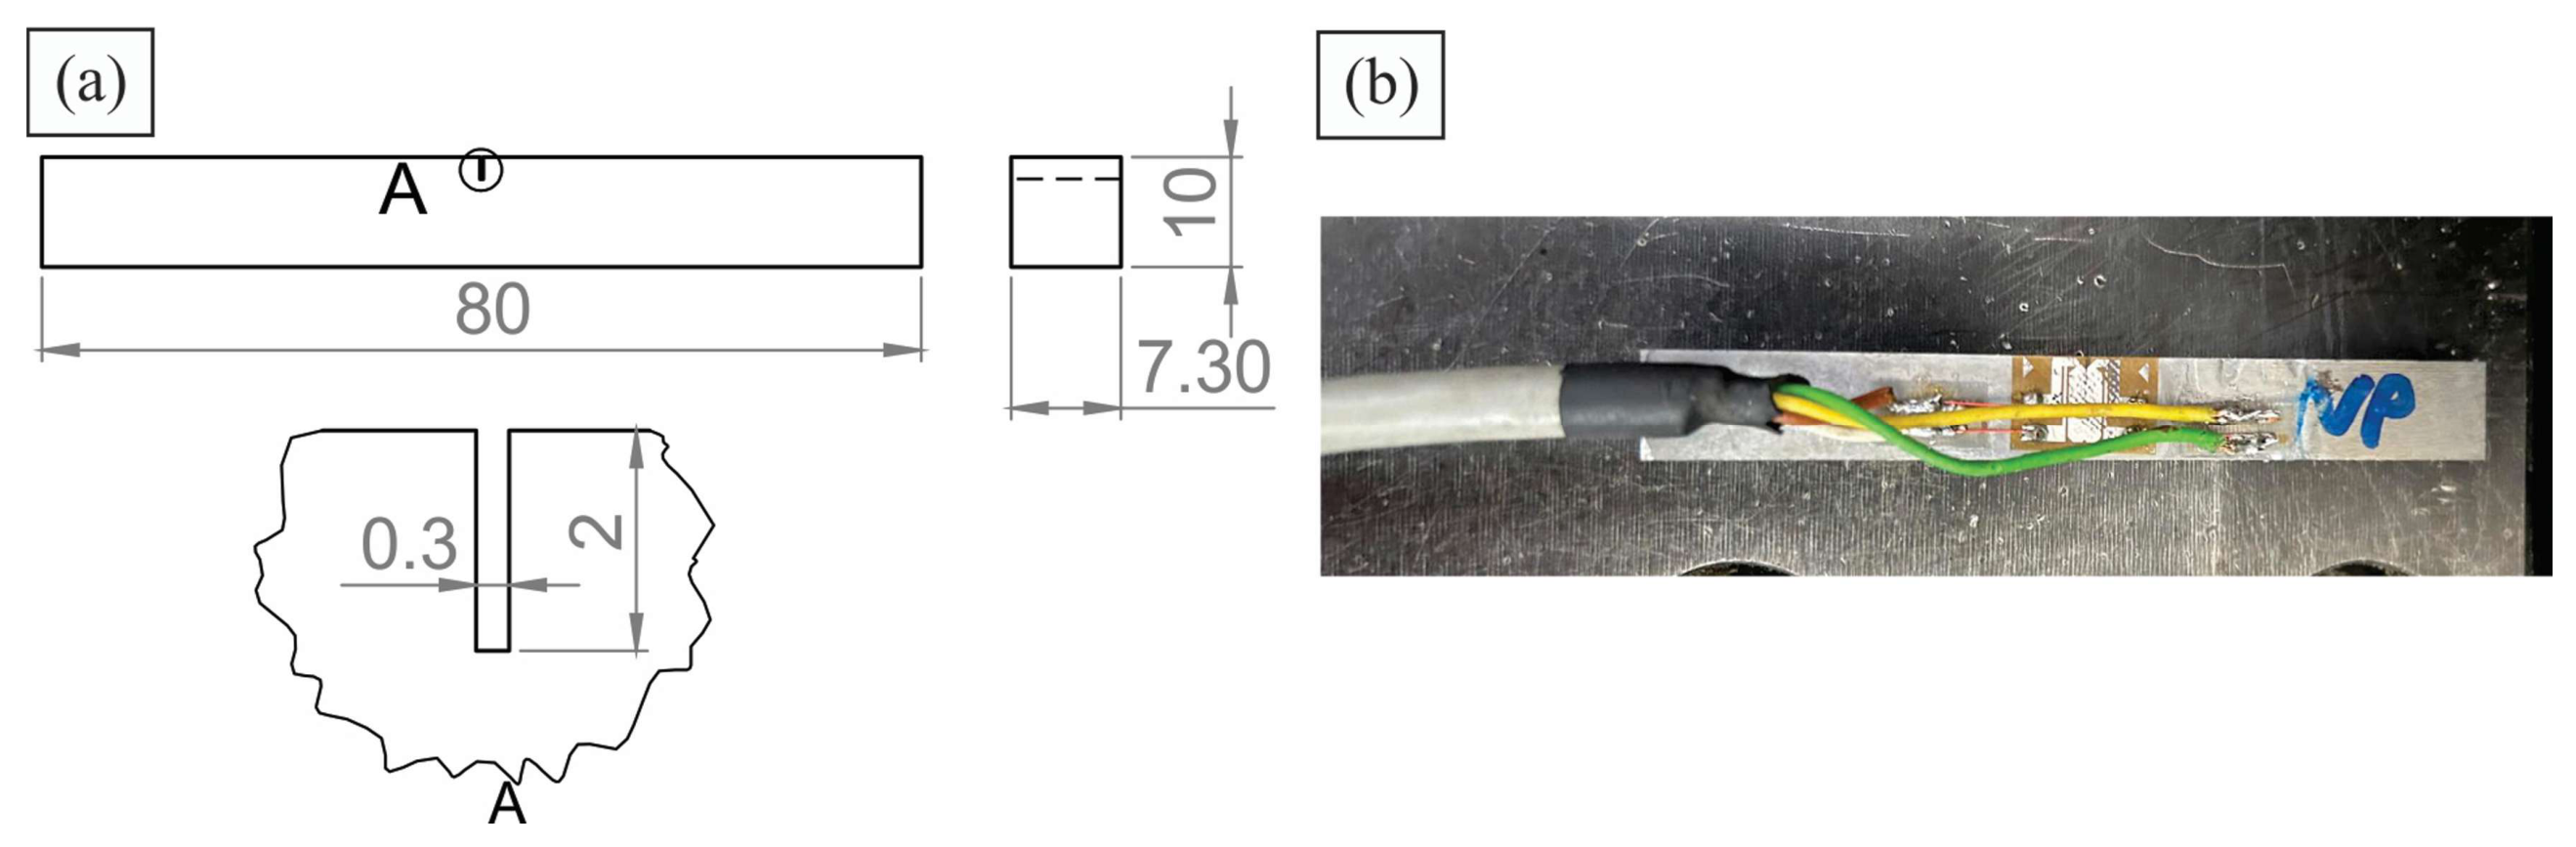
Figure 7.
SENB specimen used for testing: (a) unit: mm, SENB specimen geometry; (b) RMF-A5 crack gauge.
Figure 8.
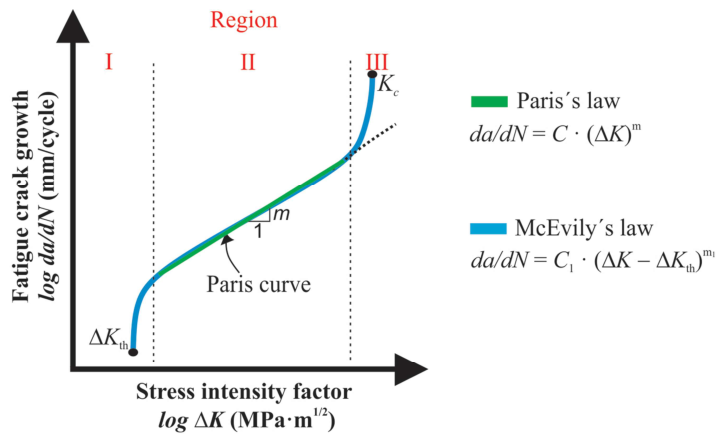
Paris curve with clearly defined regions.
Figure 9.
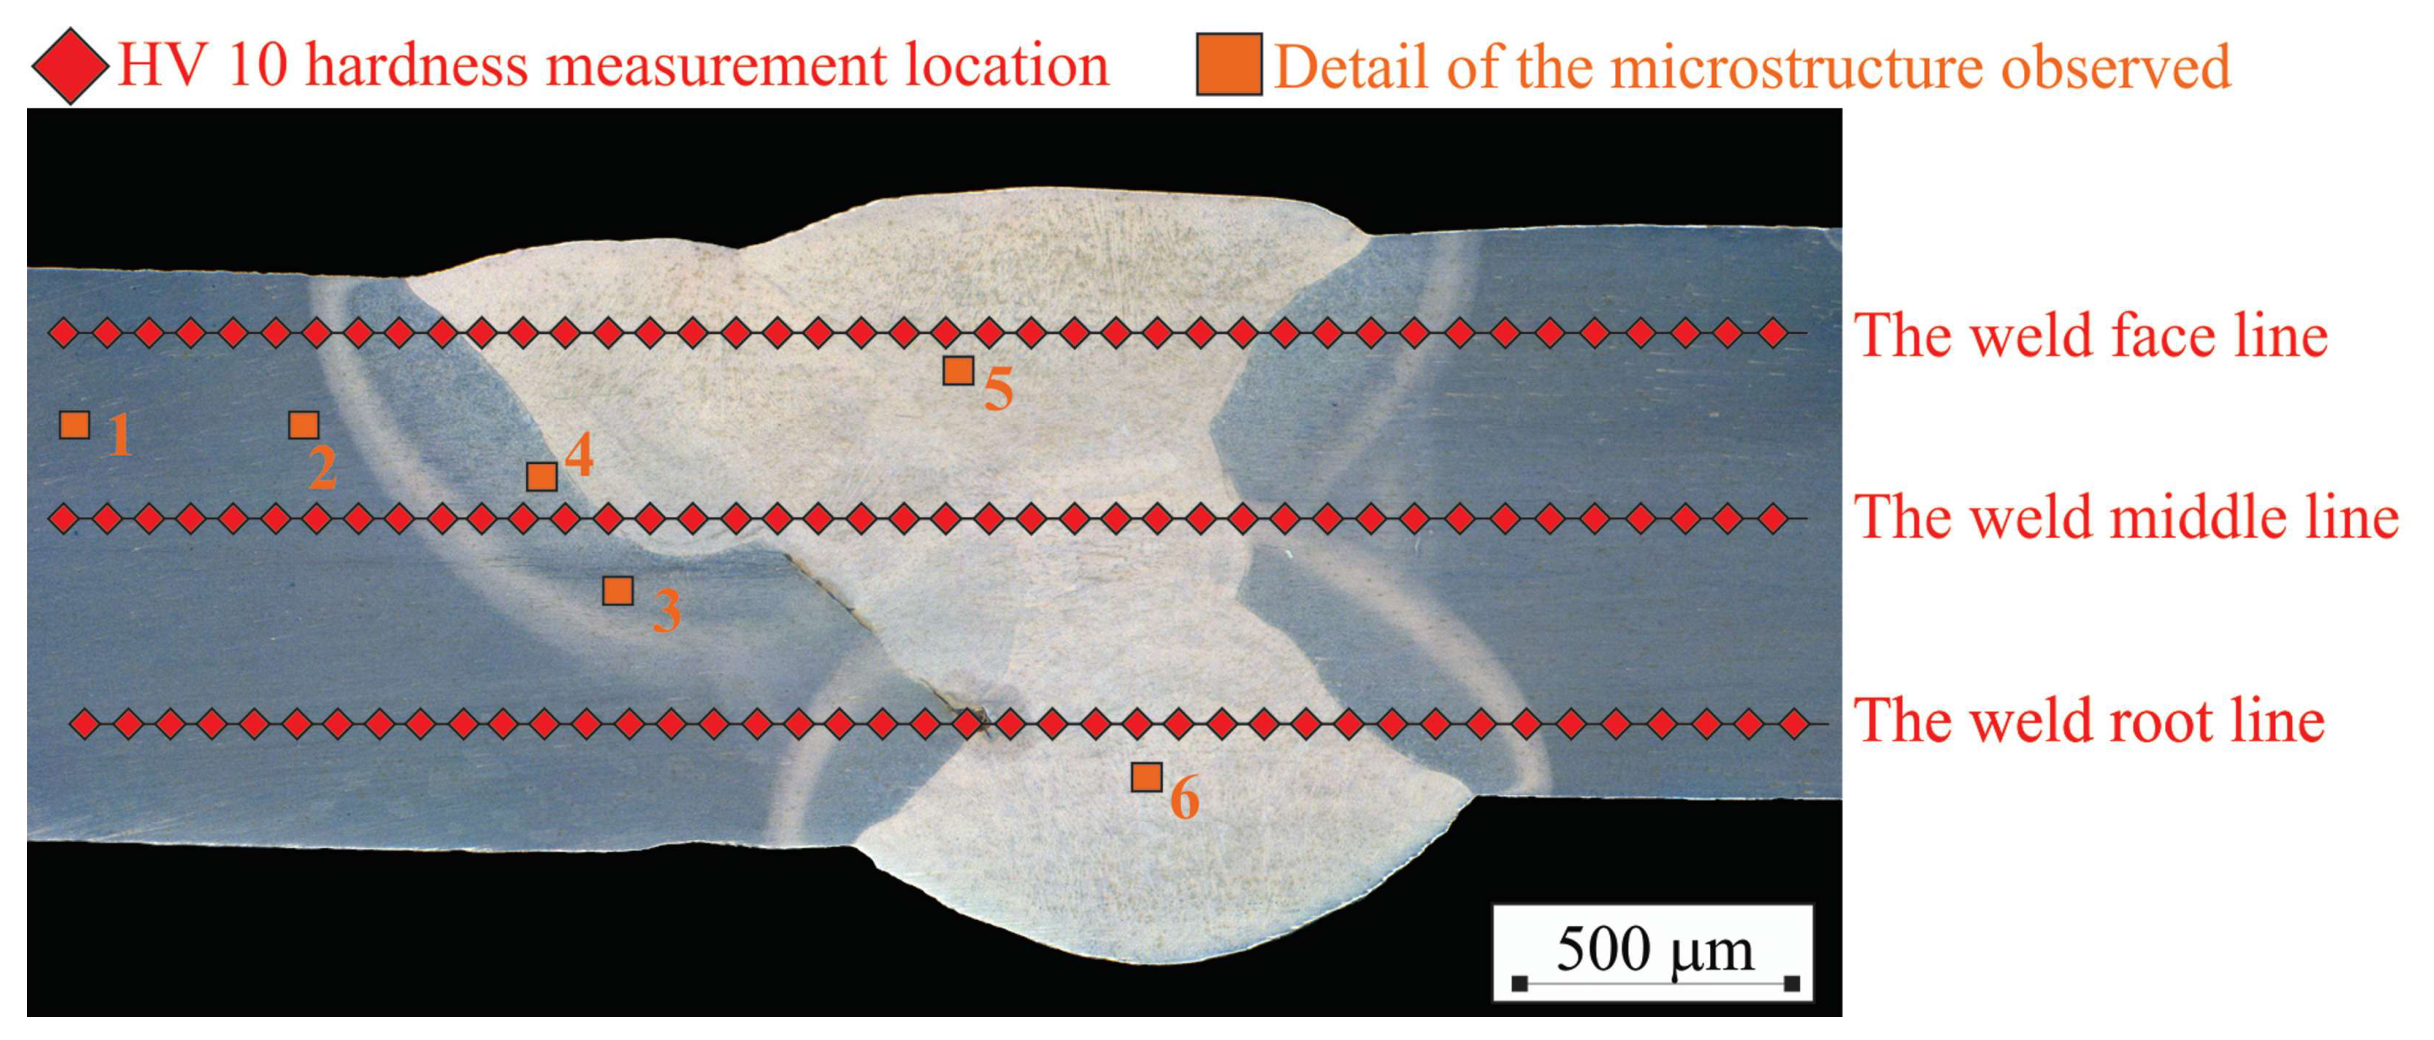
Macroscopic image of welded joint, indicating details of microstructure analysis and location of hardness measurement.
Figure 10.
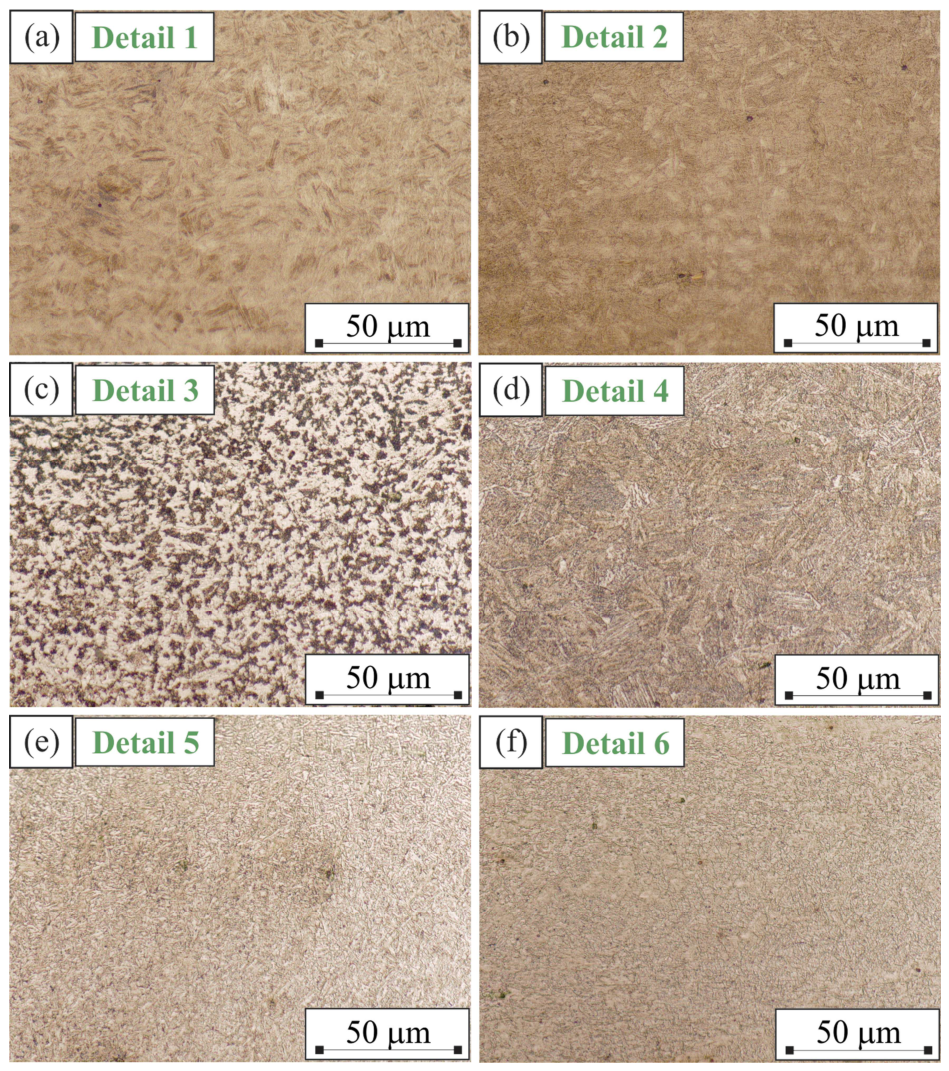
Microstructure of all zones in welded joint (magnification 500×): (a) base material; (b) degraded zone; (c) intercritical HAZ (ICHAZ); (d) coarse-grained HAZ (CGHAZ); (e) weld metal in crown; (f) weld metal in root.
Figure 11.
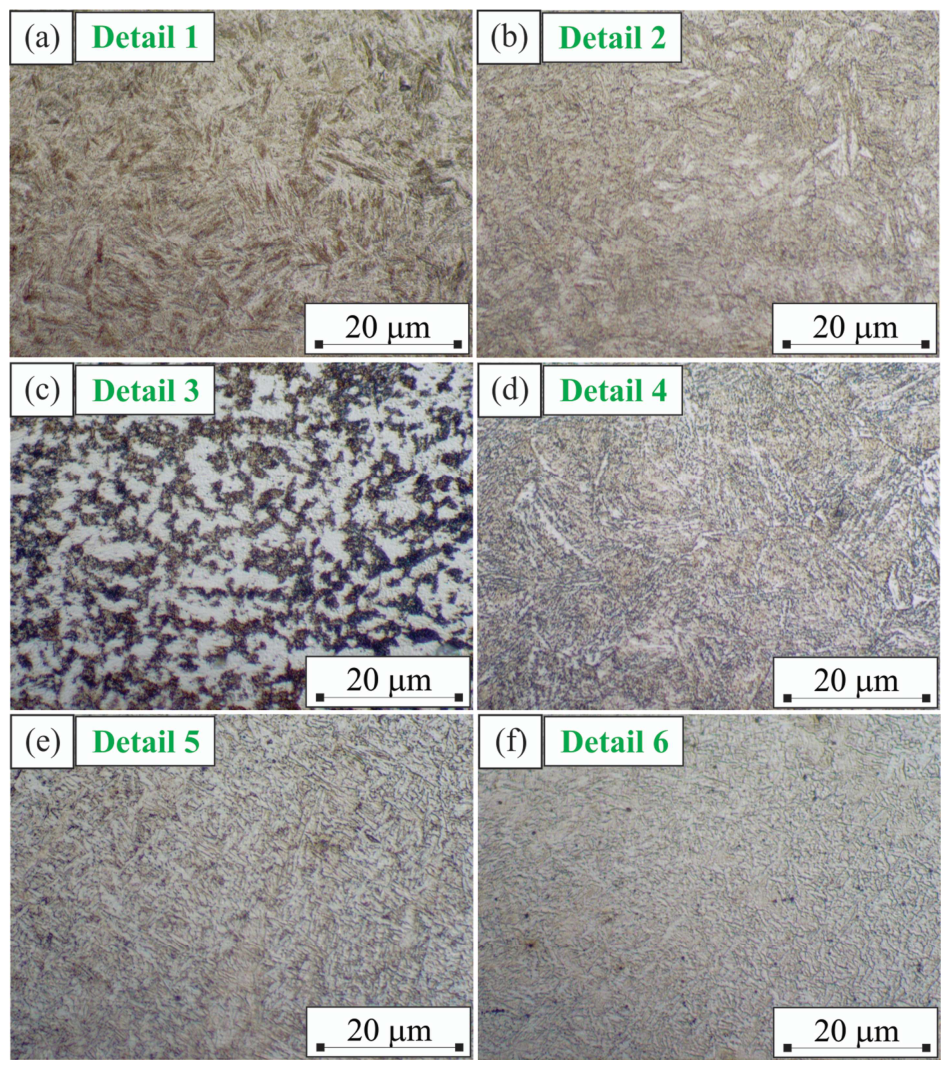
Microstructure of all zones in welded joint (magnification 1000×): (a) base material; (b) degraded zone; (c) intercritical HAZ (ICHAZ); (d) coarse-grained HAZ (CGHAZ); (e) weld metal in crown; (f) weld metal in root.
Figure 12.
The hardness distribution across all zones of the welded joint.
Figure 13.
Fractured specimens of tensile test.
Figure 14.
Results of fatigue crack growth test for specimen from base material: (a) Paris’s law; (b) McEvily’s law.
Figure 15.
Results of fatigue crack growth test for specimen from HAZ: (a) Paris’s law; (b) McEvily’s law.
Figure 16.
Results of fatigue crack growth test for specimen from weld metal: (a) Paris’s law; (b) McEvily’s law.
Figure 17.
Comparison of fatigue crack growth test results.
Table 1.
Chemical composition of armour steel SA 500.
| Element | C | Si | Mn | S + P | Mo | Cr | Cu | Ni | Ti |
|---|
| wt.% | 0.30 | 0.50 | 0.40 | 0.02 | 0.20 | 0.89 | 0.03 | 0.05 | 0.03 |
Table 2.
Minimum mechanical properties of armour steel SA 500.
Yield Strength
Rp0.2 (MPa) | Tensile Strength
Rm (MPa) | Elongation
A5 (%) | Impact Strength
KV −40 °C (J) |
|---|
| 1200 | 1670 | 9.5 | 25 |
Table 3.
Chemical composition of filler material ED-FK 1000.
| ED-FK 1000 | DIN EN ISO 16834 [24]–A G 89 M21 Mn4Ni2CrMo
AWS A5.28 ER120S–G |
|---|
|
Element
|
C
|
Si
|
Mn
|
S + P
|
Mo
|
Cr
|
B
|
Ni
|
Ti
|
|---|
| wt.% | 0.10 | 0.78 | 1.79 | 0.10 | 0.57 | 0.36 | 0.01 | 2.29 | 0.08 |
Table 4.
Mechanical properties of filler material ED-FK 1000.
Yield Strength
Rp0.2 (MPa) | Tensile Strength
Rm (MPa) | Elongation
A5 (%) | Impact Strength
KV −60 °C (J) |
|---|
| 960 | 1000 | 15.0 | 47 |
Table 5.
Applied welding parameters.
| Pass | Welding Current
I (A) | Arc Voltage
U (V) | Welding Speed
Vw (cm/min) | Heat Input
Q (kJ/mm) |
|---|
| 1 | 110 | 17.2 | 25 | 0.45 |
| 2 | 117 | 16.5 | 25 | 0.46 |
| 3 | 193 | 17.1 | 36 | 0.55 |
| 4 | 210 | 19.4 | 36 | 0.68 |
| 5 | 210 | 19.1 | 36 | 0.67 |
| Shielding gas: 18 L/min M21 (82% Ar + 18% CO2) |
Table 6.
Results of hardness measurements.
| Zone of the Welded Joint | Average Hardness (HB) | Minimum Value of Hardness (HB) | Maximum Value of Hardness (HB) | Standard
Deviation
(HB) |
|---|
| Base material | 505 | 485 | 513 | 12.12 |
| Degraded zone | 430 | 304 | 475 | 44.36 |
| HAZ | 325 | 266 | 399 | 33.77 |
| Weld metal | 347 | 323 | 390 | 19.83 |
Table 7.
Correlation between microstructure, grain size and hardness of all zones of welded joint.
| Zone of the Welded Joint | Microstructure | Grain Size
(μm) | Hardness
(HB) |
|---|
| Base material | tempered martensite | 20–27 | 505 |
| SCHAZ | tempered martensite | 21–26 | 430 |
| ICHAZ | freshly formed martensite from intercritical austenitic regions
+
retained tempered martensite from the base material | 35–52 | 339 |
| CGHAZ | coarse-grained freshly formed martensite | 140–230 | 321 |
| Weld metal | martensite–bainite | 12–19 | 347 |
Table 8.
Results of tensile test.
| Specimen | Yield Strength
Rp0.2 (MPa) | Tensile Strength
Rm (MPa) | Elongation
A5 (%) | Cross-Section Contraction Z (%) |
|---|
| TT-BM-1 | 1427 | 1578 | 7.5 | 21.0 |
| TT-BM-2 | 1415 | 1532 | 7.3 | 23.0 |
| Average BM | 1421 | 1555 | 7.4 | 22.0 |
| TT-WM-1 | 1022 | 1063 | 4.0 | 13.0 |
| TT-WM-2 | 904 | 950 | 4.4 | 13.0 |
| Average WM | 963 | 1006 | 4.2 | 13.0 |
Table 9.
Results of Paris’s and McEvily’s laws.
| Specimen From | Paris’s Law | McEvily’s Law |
|---|
| C (-) | m (-) | R2 | C1 (-) | m1 (-) | ΔKth (MPa∙m1/2) |
|---|
| Base material | 2.764 ∙ 10−11 | 2.651 | 0.895 | 8.777 ∙ 10−10 | 1.594 | 2.79 |
| HAZ | 1.339 ∙ 10−11 | 3.037 | 0.842 | 8.223 ∙ 10−10 | 1.707 | 2.80 |
| Weld metal | 1.758 ∙ 10−12 | 3.457 | 0.910 | 1.761 ∙ 10−10 | 2.065 | 4.21 |
| Disclaimer/Publisher’s Note: The statements, opinions and data contained in all publications are solely those of the individual author(s) and contributor(s) and not of MDPI and/or the editor(s). MDPI and/or the editor(s) disclaim responsibility for any injury to people or property resulting from any ideas, methods, instructions or products referred to in the content. |