Skip to Content
MetalsMetals
  • Article
  • Open Access

17 April 2026

A Correlation with the Deformation Stored Energy and Self-Annealing Behavior of ETP-Cu

,
and
1
Department of Advanced Components and Materials Engineering, Sunchon National University, Suncheon-si 57922, Republic of Korea
2
Department of Mechanical Engineering, Galgotias University, Greater Noida 203201, India
3
School of Materials Science and Engineering, Yeungnam University, Gyeongsan 38541, Republic of Korea
*
Authors to whom correspondence should be addressed.

Abstract

In the present study, room temperature (RTR) and cryogenic (CR) rolling of electrolytic tough pitch copper (ETP-Cu) was performed to elucidate how deformation temperature and reduction ratio (40% and 80% thickness reductions) control dislocation storage, local stored energy (SE), and self-annealing. Correlated SEM/EDS and EBSD analyses were used to (i) locate Cu2O particles, (ii) quantify local misorientation, and (iii) map the SE for self-annealing. Point EDS confirms that the intermetallic particles are copper oxides (Cu2O), with apparent O content varying with particle size and EDS interaction volume. RTR80 (80% rolled) exhibits systematically higher KAM values and a larger area fraction of high SE than RTR40 (40% rolled), explaining the greater frequency and spatial density of self-annealed grains at higher reduction. Cryogenic rolling produces more severe fragmentation and a higher fraction of subgrains than RTR at equivalent reductions. CR80 shows the high KAM structures and locally highest SE regions among all conditions, and a higher fraction of self-annealed grains. Nevertheless, the mapped average SE for CR80 (2.93 × 10⁶ J/m3) was lower than for RTR80 (3.34 × 10⁶ J/m3) due to rapid post-deformation dislocation annihilation/self-annealing upon warming at RT. In all conditions, Cu2O particles and bulged/irregular grain boundaries concentrate dislocations and SE and act as dominant particle-stimulated nucleation (PSN) sites and RT recrystallization, respectively. These results demonstrate that deformation temperature and reduction jointly determine the spatial distribution of SE and hence the propensity for self-annealing in ETP Cu.

1. Introduction

Electrolytic tough pitch copper (ETP-Cu) is a widely used commercial high-conductivity copper grade employed in electrical conductors, connectors, busbars, and thermal management components because of its excellent electrical and thermal conductivities combined with good formability [1,2]. For advanced structural–electrical applications where strength must be improved without excessive loss of conductivity, severe plastic deformation routes have been explored. Among these, cryogenic deformation has emerged as an effective, scalable thermomechanical approach to increase dislocation density and refine the microstructure by suppressing dynamic recovery (DRV) during deformation at very low temperatures [3,4]. Cryogenic rolling (CR) of Cu and Cu alloys produces elongated ultrafine substructures, high stored (deformation) energy and localized features such as shear bands. Subsequent low-temperature annealing or natural aging can then tune strength–ductility and conductivity by modifying dislocation arrangements and precipitate evolution [5,6]. Moreover, this altered defect state (including low-temperature vacancy clustering) changes the rolling texture (tendency toward brass-type components), provides abundant nucleation sites and enhanced boundary mobility during subsequent RT annealing. This accelerates the self-annealing process (often producing heterogeneous/bimodal microstructures of nanograins embedded in coarser grains) [7], and thus reduces as-rolled strength. This could also impact the post-roll heat-treatment route, which is critical for recovering ductility and tuning electrical conductivity [3,8].
A notable softening phenomenon in heavily deformed Cu-based materials is RT self-annealing (static recrystallization/recovery at RT), whereby regions of very high stored energy (SE), i.e., shear bands, deformation band intersections or heavily deformed grain boundaries, act as preferential sites for nucleation of dislocation-free grains [9,10]. Self-annealing converts highly strained subgrain structures into new recrystallized grains without external heating, producing bimodal or heterogeneous microstructures (coarse elongated matrix + fine recrystallized pockets). Because recrystallized nuclei commonly form with distinct orientations relative to their parents [10], self-annealing can alter the crystallographic texture: plane-strain rolling components (Copper, S, Brass) may be modified or weakened locally while Rotated-cube, Cube or Goss-type components can emerge in the nucleated grains [9]. The net effect on crystallographic texture depends on the spatial fraction and orientations of self-annealed grains, their size distribution, and whether nucleation proceeds by continuous (subgrain rotation) or discontinuous (grain-boundary/pulse nucleation) mechanisms.
Mechanical strength and ductility of ETP-Cu depend sensitively on dislocation density, subgrain/grain size and the presence of obstacles (oxide particles and precipitates), while electrical conductivity is degraded mainly by solute/dislocation scattering [11,12,13]. Cryo-rolling raises SE and strengthens copper but also promotes conditions for spontaneous RT recovery/recrystallization that can soften the material and change texture [14,15]. In the literature, it has been discussed that cryogenic deformation yielded higher grain fragmentation, dislocation density, local misorientations, and SE than RT deformation [7,16]. However, self-annealing can alter these trends because it is governed by the local SE. Therefore, it is essential to understand how reduction level, deformation temperature (room vs. cryogenic), and microstructural heterogeneities control SE and thus determine the likelihood and extent of self-annealing. The present study addresses this need by comparing ETP-Cu rolled at room temperature (RTR) and cryogenic temperature (CR) to two thickness reductions, quantitatively characterizing SE, mapping self-annealed microstructures, and correlating these with the mechanisms that govern self-annealing.

2. Materials and Methods

ETP-Cu sheets (≈1.5 mm thick, 99.9+ wt.% Cu) were cold-rolled to nominal thickness reductions of 40% and 80% using a 4-high rolling mill with 10% reduction per pass to ensure uniform strain. Two processing routes were used for the current investigation: rolling at room temperature (RTR) and rolling of sheets at cryogenic conditions (CR). During CR, sheet specimens were immersed in liquid N2 for ≈8–10 min prior to each pass to ensure a low-temperature atmosphere. After rolling, the specimens were sectioned on the RD–ND plane, mounted and metallographically prepared. The deformed samples were sequentially polished (up to 2400 SiC grit), diamond polished (3 μm, 1 μm), and finally polished with ethanol-based colloidal silica. SEM secondary-electron imaging was used to examine surface morphology and oxide/particle features. For SEM measurement, all the deformed samples were etched with the etchant (5 gm FeCl3 + 10 mL HCl + 100 mL H2O) for 7–10 s. EBSD scans were acquired on the RD–ND plane (JEOL FE-SEM, (Tokyo, Japan)) at 20 kV and ≈15 mm working distance, with step sizes of 60 nm for both the deformed conditions. EBSD data were post-processed to remove spurious points (neighbor CI correlation < 0.3), and indexed maps were used to extract grain orientations, IQ, and KAM information. The particle analysis was studied on the polished samples using JEOL (JSM-7100 F (Tokyo, Japan)) equipment assisted with energy-dispersive X-ray analysis (EDAX). No other characterization methods were employed for this short communication. For ease in naming, the samples performed at 40% and 80% RTR are abbreviated to RTR40 and RTR80, respectively. Similarly, the CR samples rolled to 40% and 80% are named CR40 and CR80, respectively.
Stored energy (SE) of deformation was calculated for both RTR and CR samples using the subgrain method [17,18]. Subgrain microstructures (which indirectly refer to dislocations) were used to calculate the SE. The dislocation structures in the deformed grains were evaluated by measuring the misorientation and subgrain sizes from EBSD pixels using MATLAB R2021a. The subgrains were reconstructed using a critical resolution angle of 1°. Only boundaries with a misorientation greater than the critical resolution angle were recognized as subgrain boundaries. If a dislocation substructure could be simplified to the form of a subgrain of diameter (D) with average grain-boundary energy (γavg), then the stored energy, Si, of each lattice site could be given by Equation (1).
S i j P γ S G B , j / p A S G
S i = α γ a v g 4 . A S G π 1 2 = α γ a v g D
In Equation (1), ASG is the subgrain area, α is the geometric constant related to the dislocation cell structure, γ S G B , j is the subgrain boundary energy of the jth pixel neighboring each subgrain, and p is the total number of pixels neighboring each subgrain. Further details regarding the calculations are mentioned elsewhere [17,18].

3. Results and Discussions

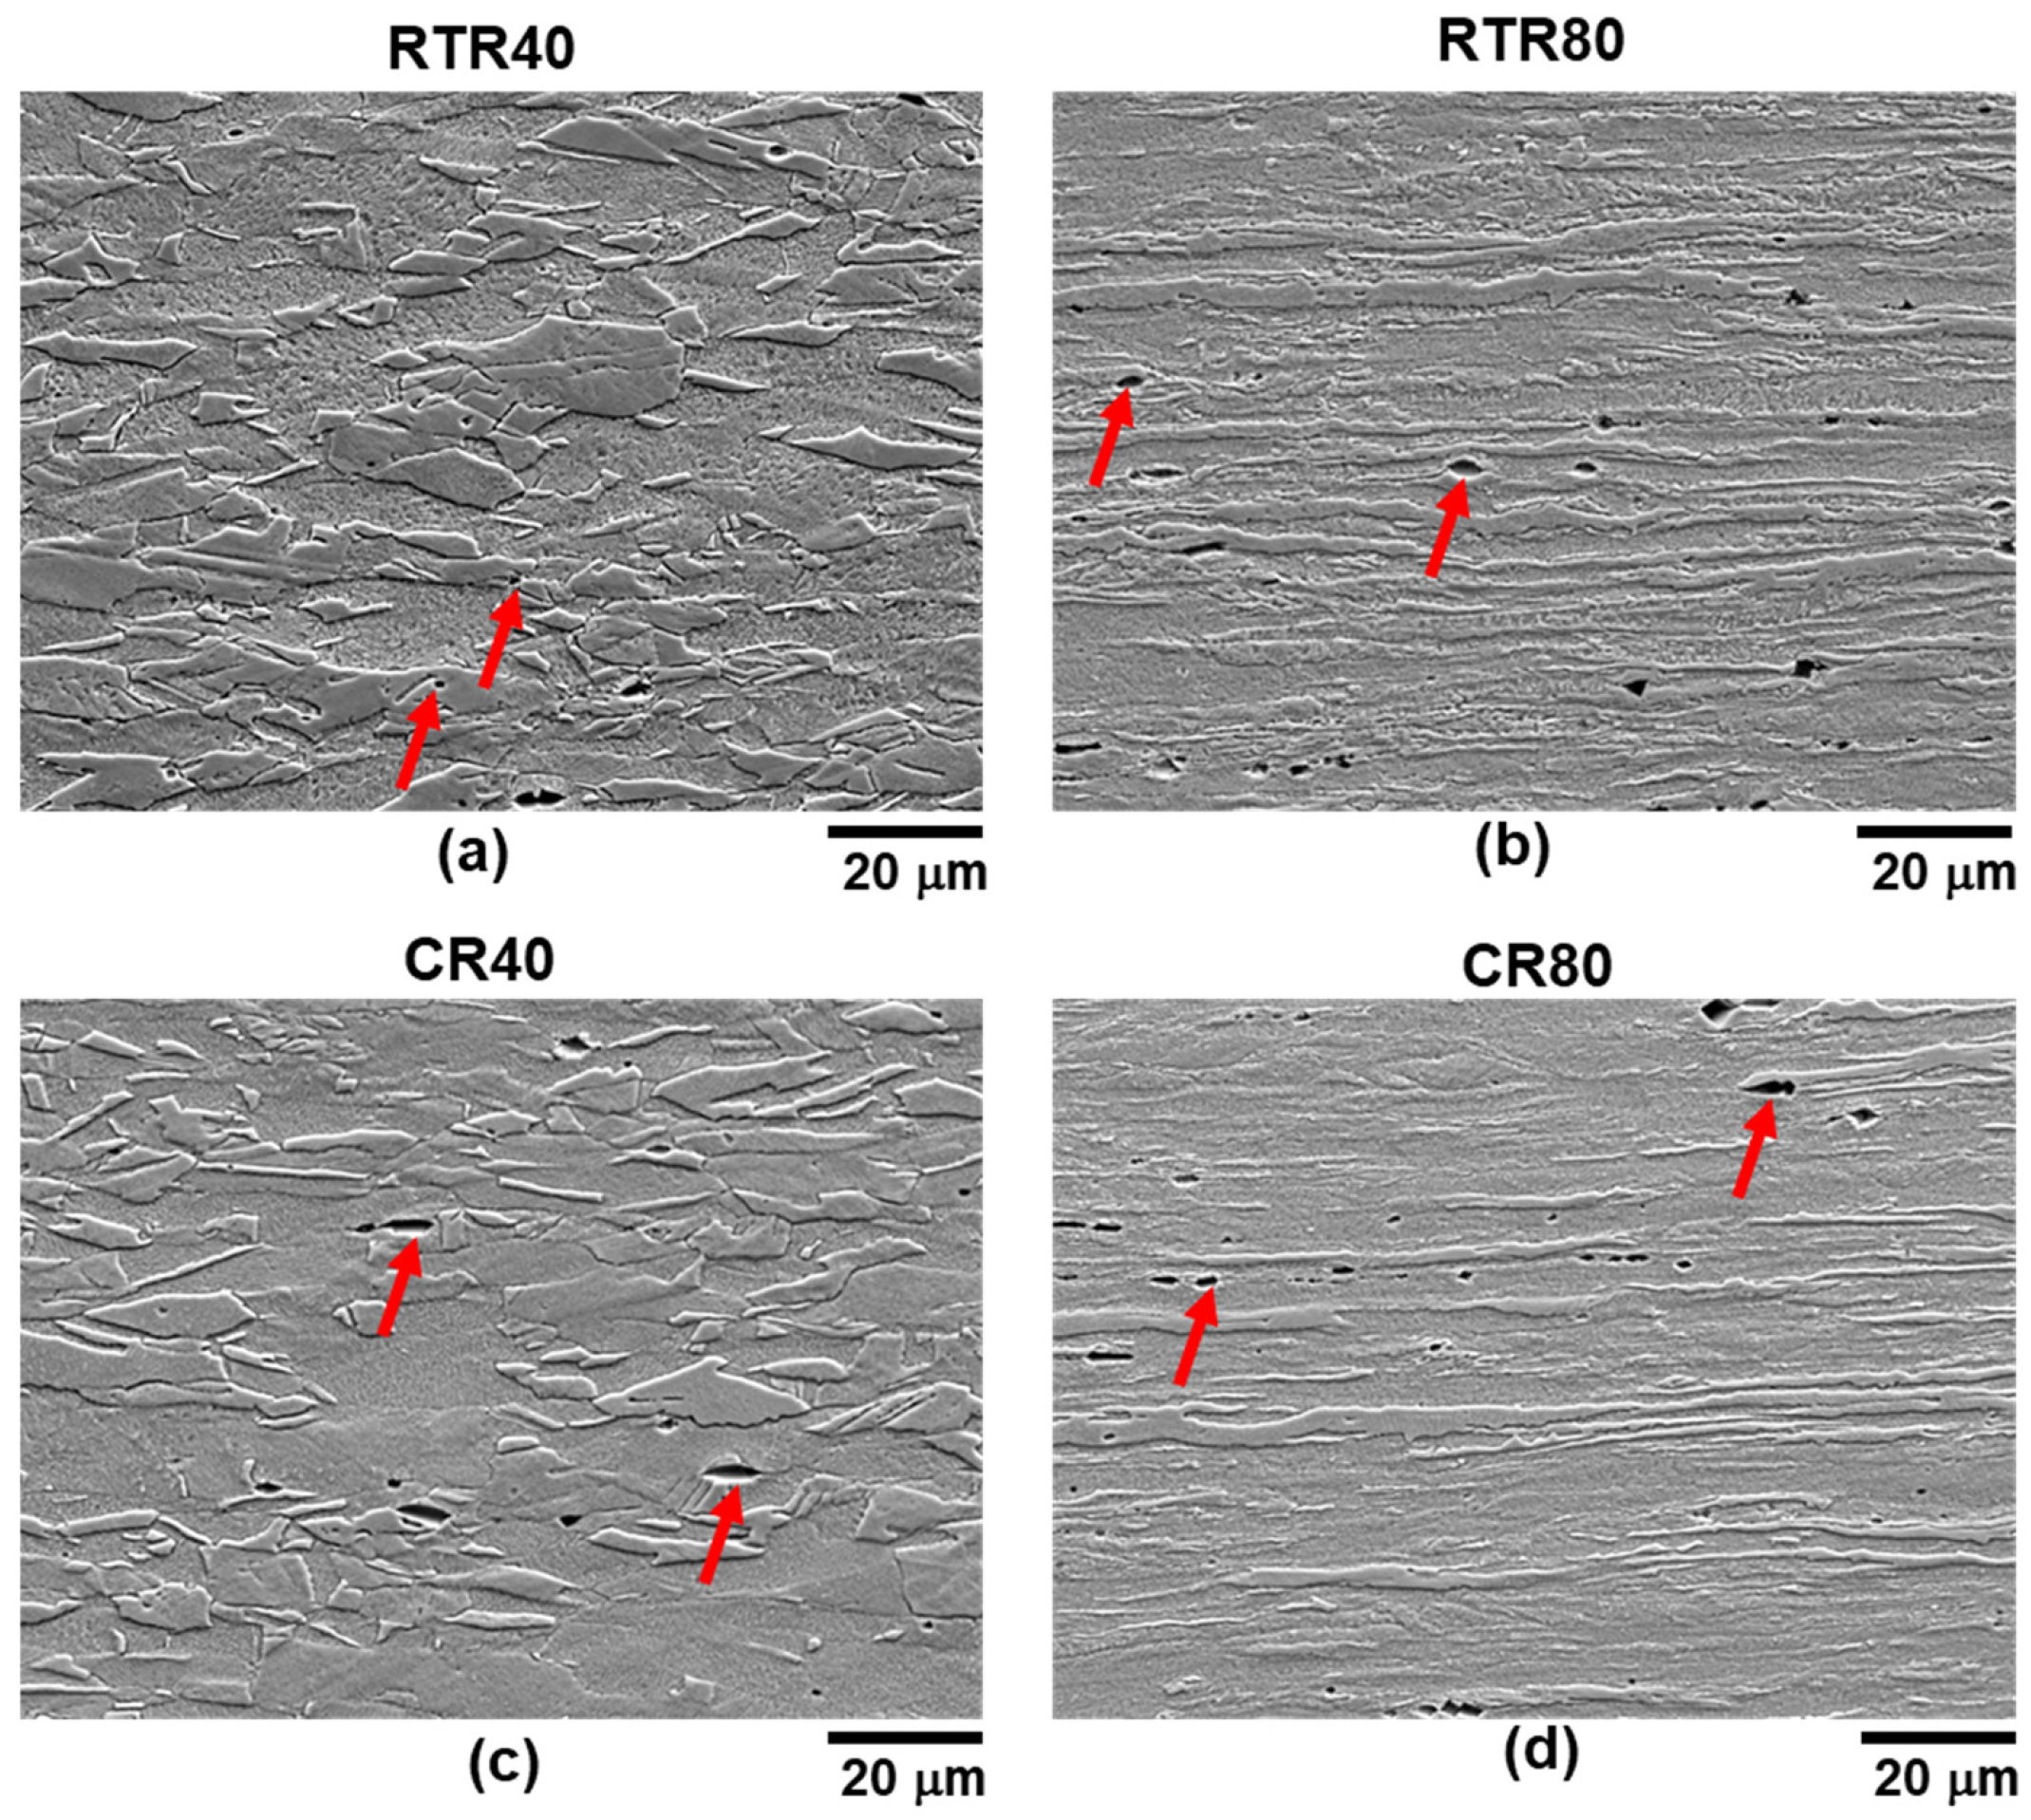
Figure 1 presents representative SEM micrographs showing the deformed features developed in ETP-Cu after rolling under different conditions and reductions. The micrographs highlight the deformation morphology and microstructural heterogeneities that are responsible for the variation in SE and the subsequent self-annealing behavior. At a low reduction ratio, Figure 1a,c shows that the microstructures are fragmented, and elongated grains are formed. The grains appear distorted and subdivided into smaller lamellar segments, indicating an increased dislocation density introduced during plastic deformation. The as-received ETP-Cu sample (before deformation) consists of the coarse grain structure with an average grain size of 11.5 ± 7.5 μm. Moreover, after the deformation, the coarse grain structure elongated along the RD and fragmented based on the severity of deformation. Such deformation structures store significant internal energy in the form of dislocation networks and subgrain boundaries [19]. The red arrows indicate oxide particles (likely Cu2O), which act as strong obstacles to dislocation motion. As deformation proceeds, dislocations accumulate around these particles, forming localized regions of very high SE [20]. An increase in the reduction ratio to 80% shows parallel deformation lines features aligned along the RD (Figure 1b,d). Severity in the deformation could be identified via thinning of the grains, as most of the grains are thin and elongated. The accumulation of dislocations within these bands further increases the SE locally, which is discussed further using EBSD analysis.
Figure 1. Scanning electron microscopy (SEM) of 40% and 80% (a,b) room temperature (RTR) and (c,d) cryogenic temperature (CR) rolled ETP-Cu samples. Red arrows show the positions of the Cu2O particles, which were removed during the etching process.
The arrows in these images indicate small voids formed at particle sites where strain localization is pronounced. During the etching, the particles were removed from their respective location, and hence, a void formed. These microstructural features are particularly important for the self-annealing phenomenon observed in heavily deformed copper. Regions with high SE, such as deformation band intersections, particle–matrix interfaces, and shear bands, serve as preferential sites for the nucleation of dislocation-free recrystallized grains at RT [21,22]. This mechanism is consistent with particle-stimulated nucleation (PSN), where larger particles promote localized recrystallization due to the high dislocation density surrounding them [23].
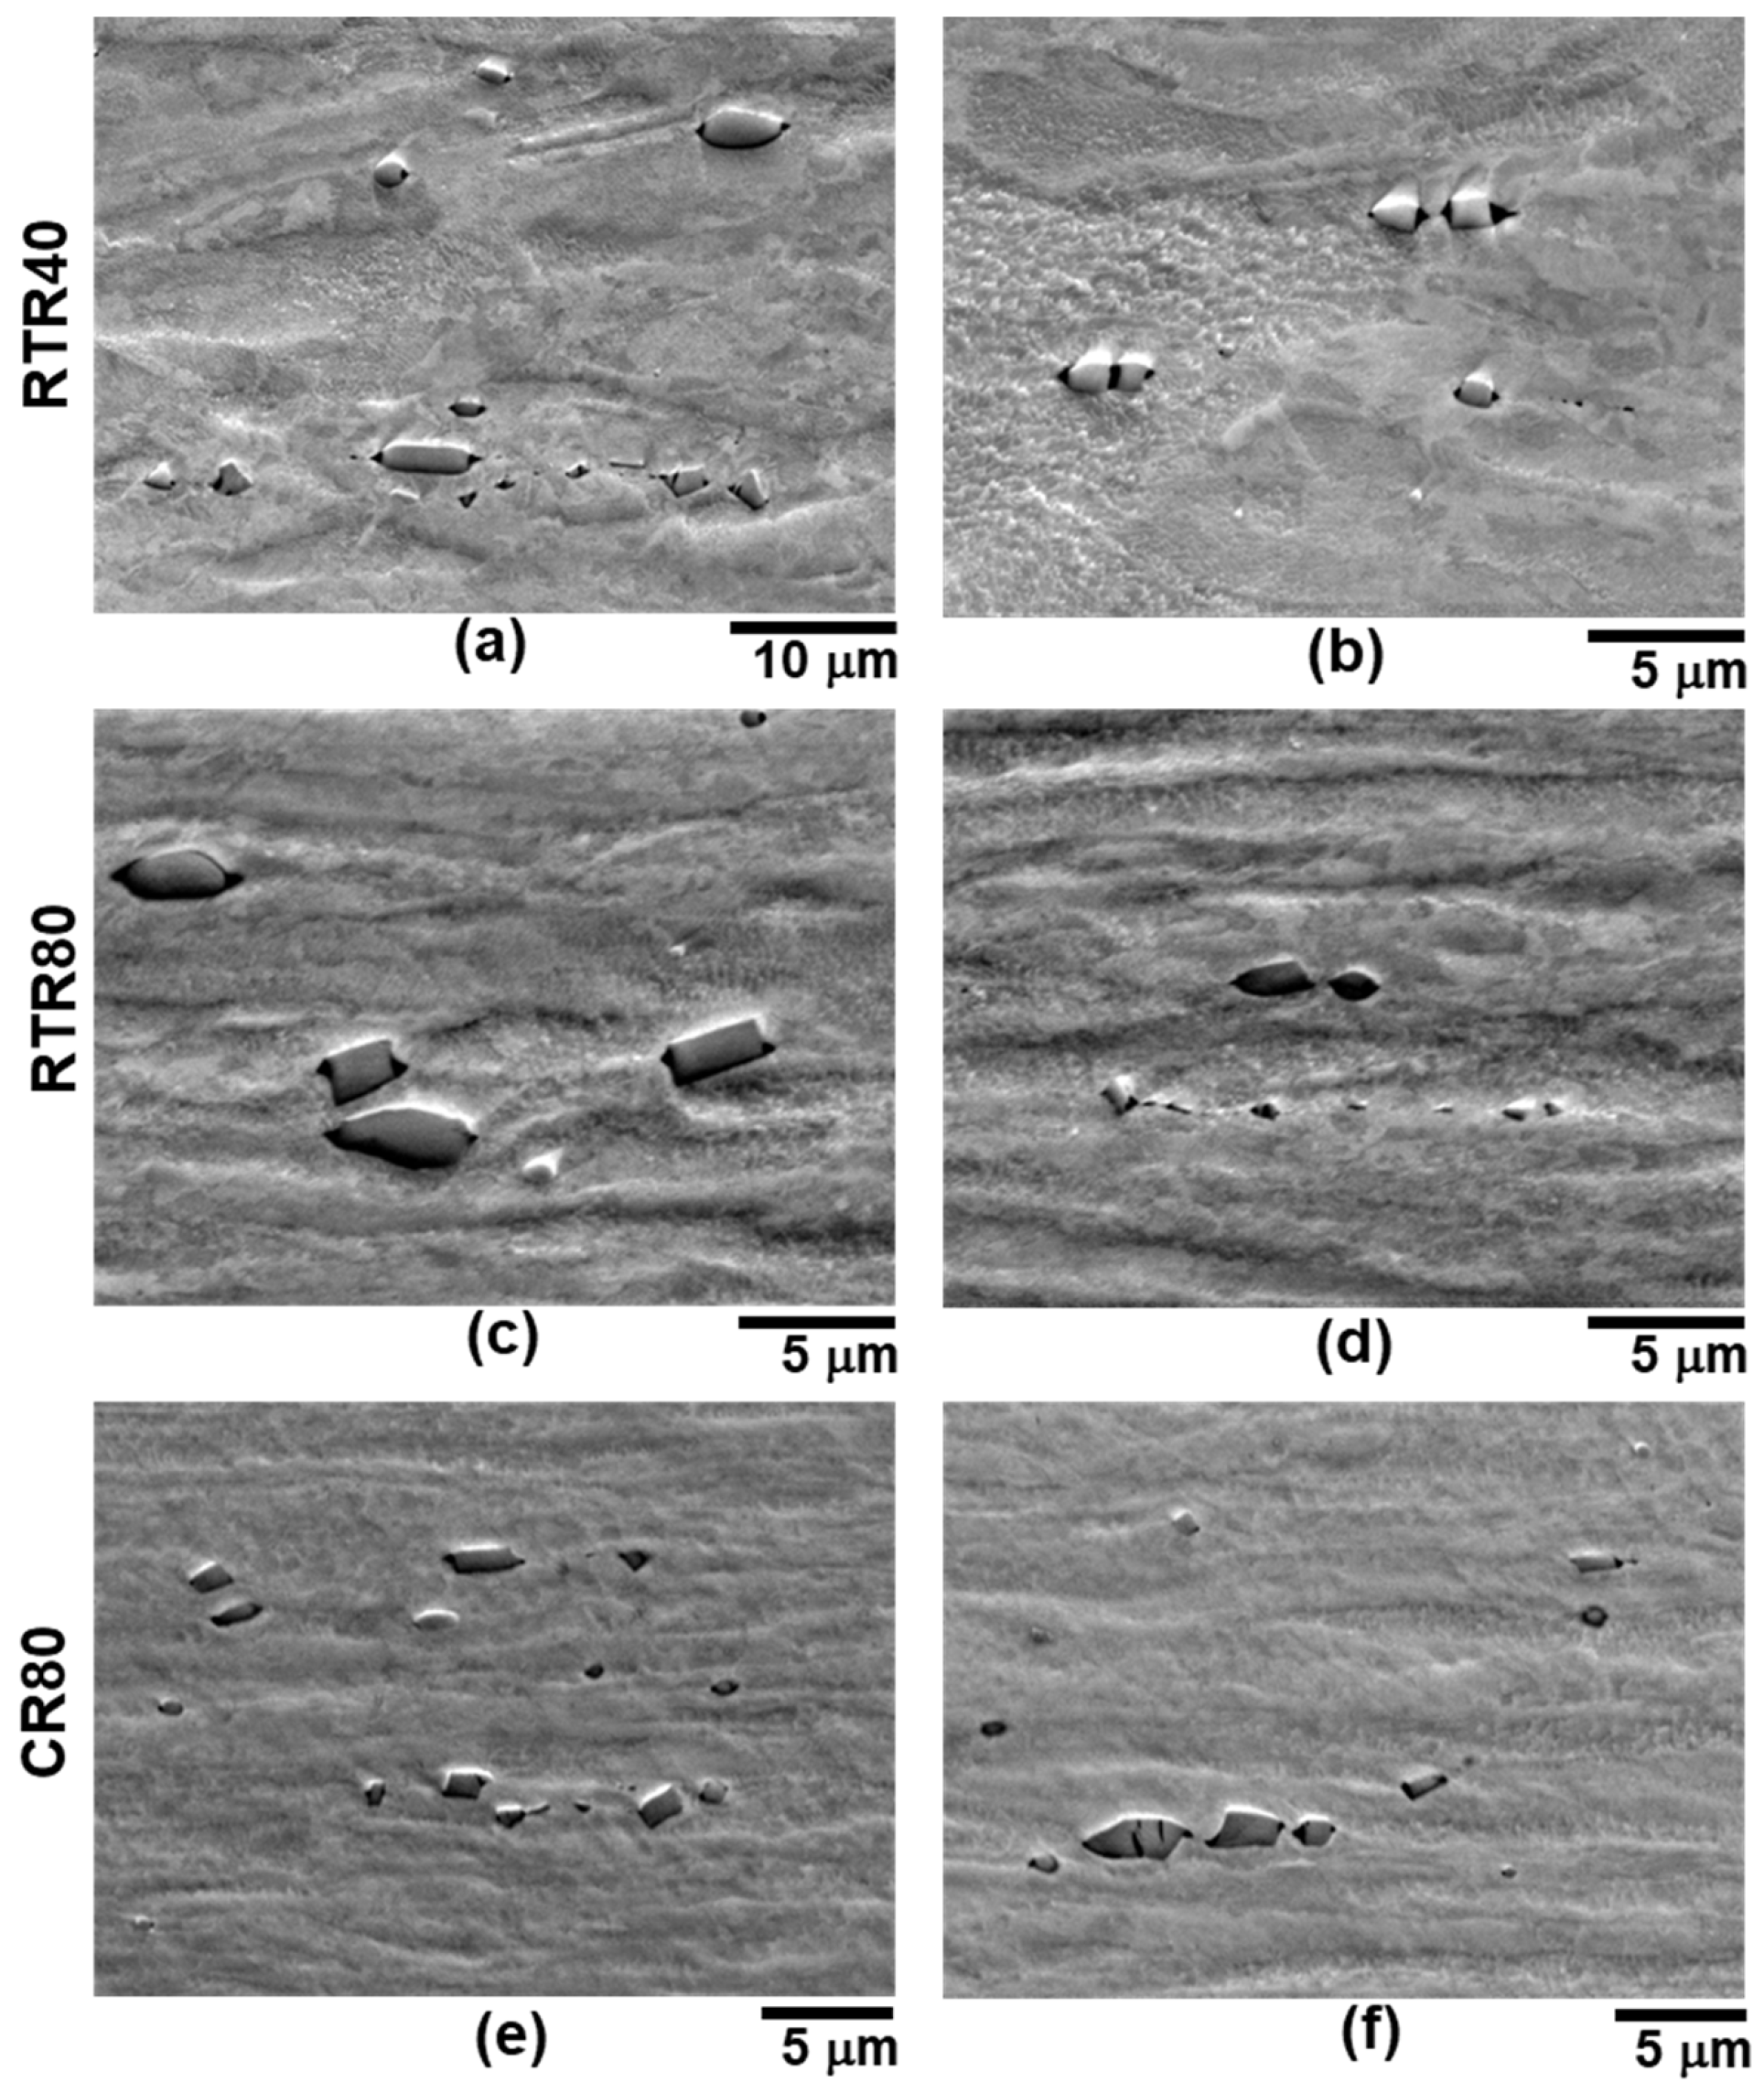
Figure 2 presents SEM micrographs illustrating the morphology, size, and spatial distribution of Cu2O particles in ETP-Cu processed under different rolling conditions (RTR40, RTR80, and CR80). The micrographs reveal elongated surface features aligned along the RD, indicating the strong plastic deformation introduced during rolling. In the RTR40 sample, relatively coarser and irregularly shaped particles were observed, which appear sparsely distributed within the matrix (Figure 2a,b). These particles exhibit faceted or angular morphologies, suggesting fragmented inclusions that have undergone partial deformation during rolling. Zasadzińska et al. [24] reported the microstructural behavior of Cu2O hard particles during the wire drawing operation. Cu2O formed during the copper solidification process, which led to high oxygen concentrations in interdendritic spaces. It was observed that Cu2O particles can be regular or elongated, and their size can reach several micrometers. During the drawing process, the fragmentation of oxides and the change in the shape from angular to more oval occurred to a degree depending on the drawing ratio. Microcracks, fissures and local tensile stress fields in the reinforced copper matrix arise around the oxide particles [24].
Figure 2. SEM micrographs show the variation in size and morphology of Cu2O particles in the (a,b) RTR40, (c,d) RTR80, and (e,f) CR80 ETP-Cu samples. During the sample preparation, no etching was performed to retain the Cu2O particles.
However, there was no fragmentation and particle shape change observed in the present condition, as only the compressive stress was acting around the Cu2O particles during the rolling deformation. With increasing rolling reduction (RTR80 and CR80), no fragmentation in the particles was observed. The matrix exhibits more pronounced elongated grains, reflecting the higher strain accumulation and enhanced plastic deformation. The particles appear smaller at some places and coarser at others, indicating the heterogeneous size distribution in the ETP-Cu samples (Figure 2e,f). Additionally, the surface features become more continuous and elongated, highlighting the strong directional deformation imposed by the prior rolling process. These particles are the main sites for dislocation accumulation during deformation and show the high SE [20]. Overall sizes of the particles vary from 1 to 5 μm. A bimodal distribution of size was observed for the hard particles, in which some Cu2O particles were smaller in size, and some were coarser in nature.
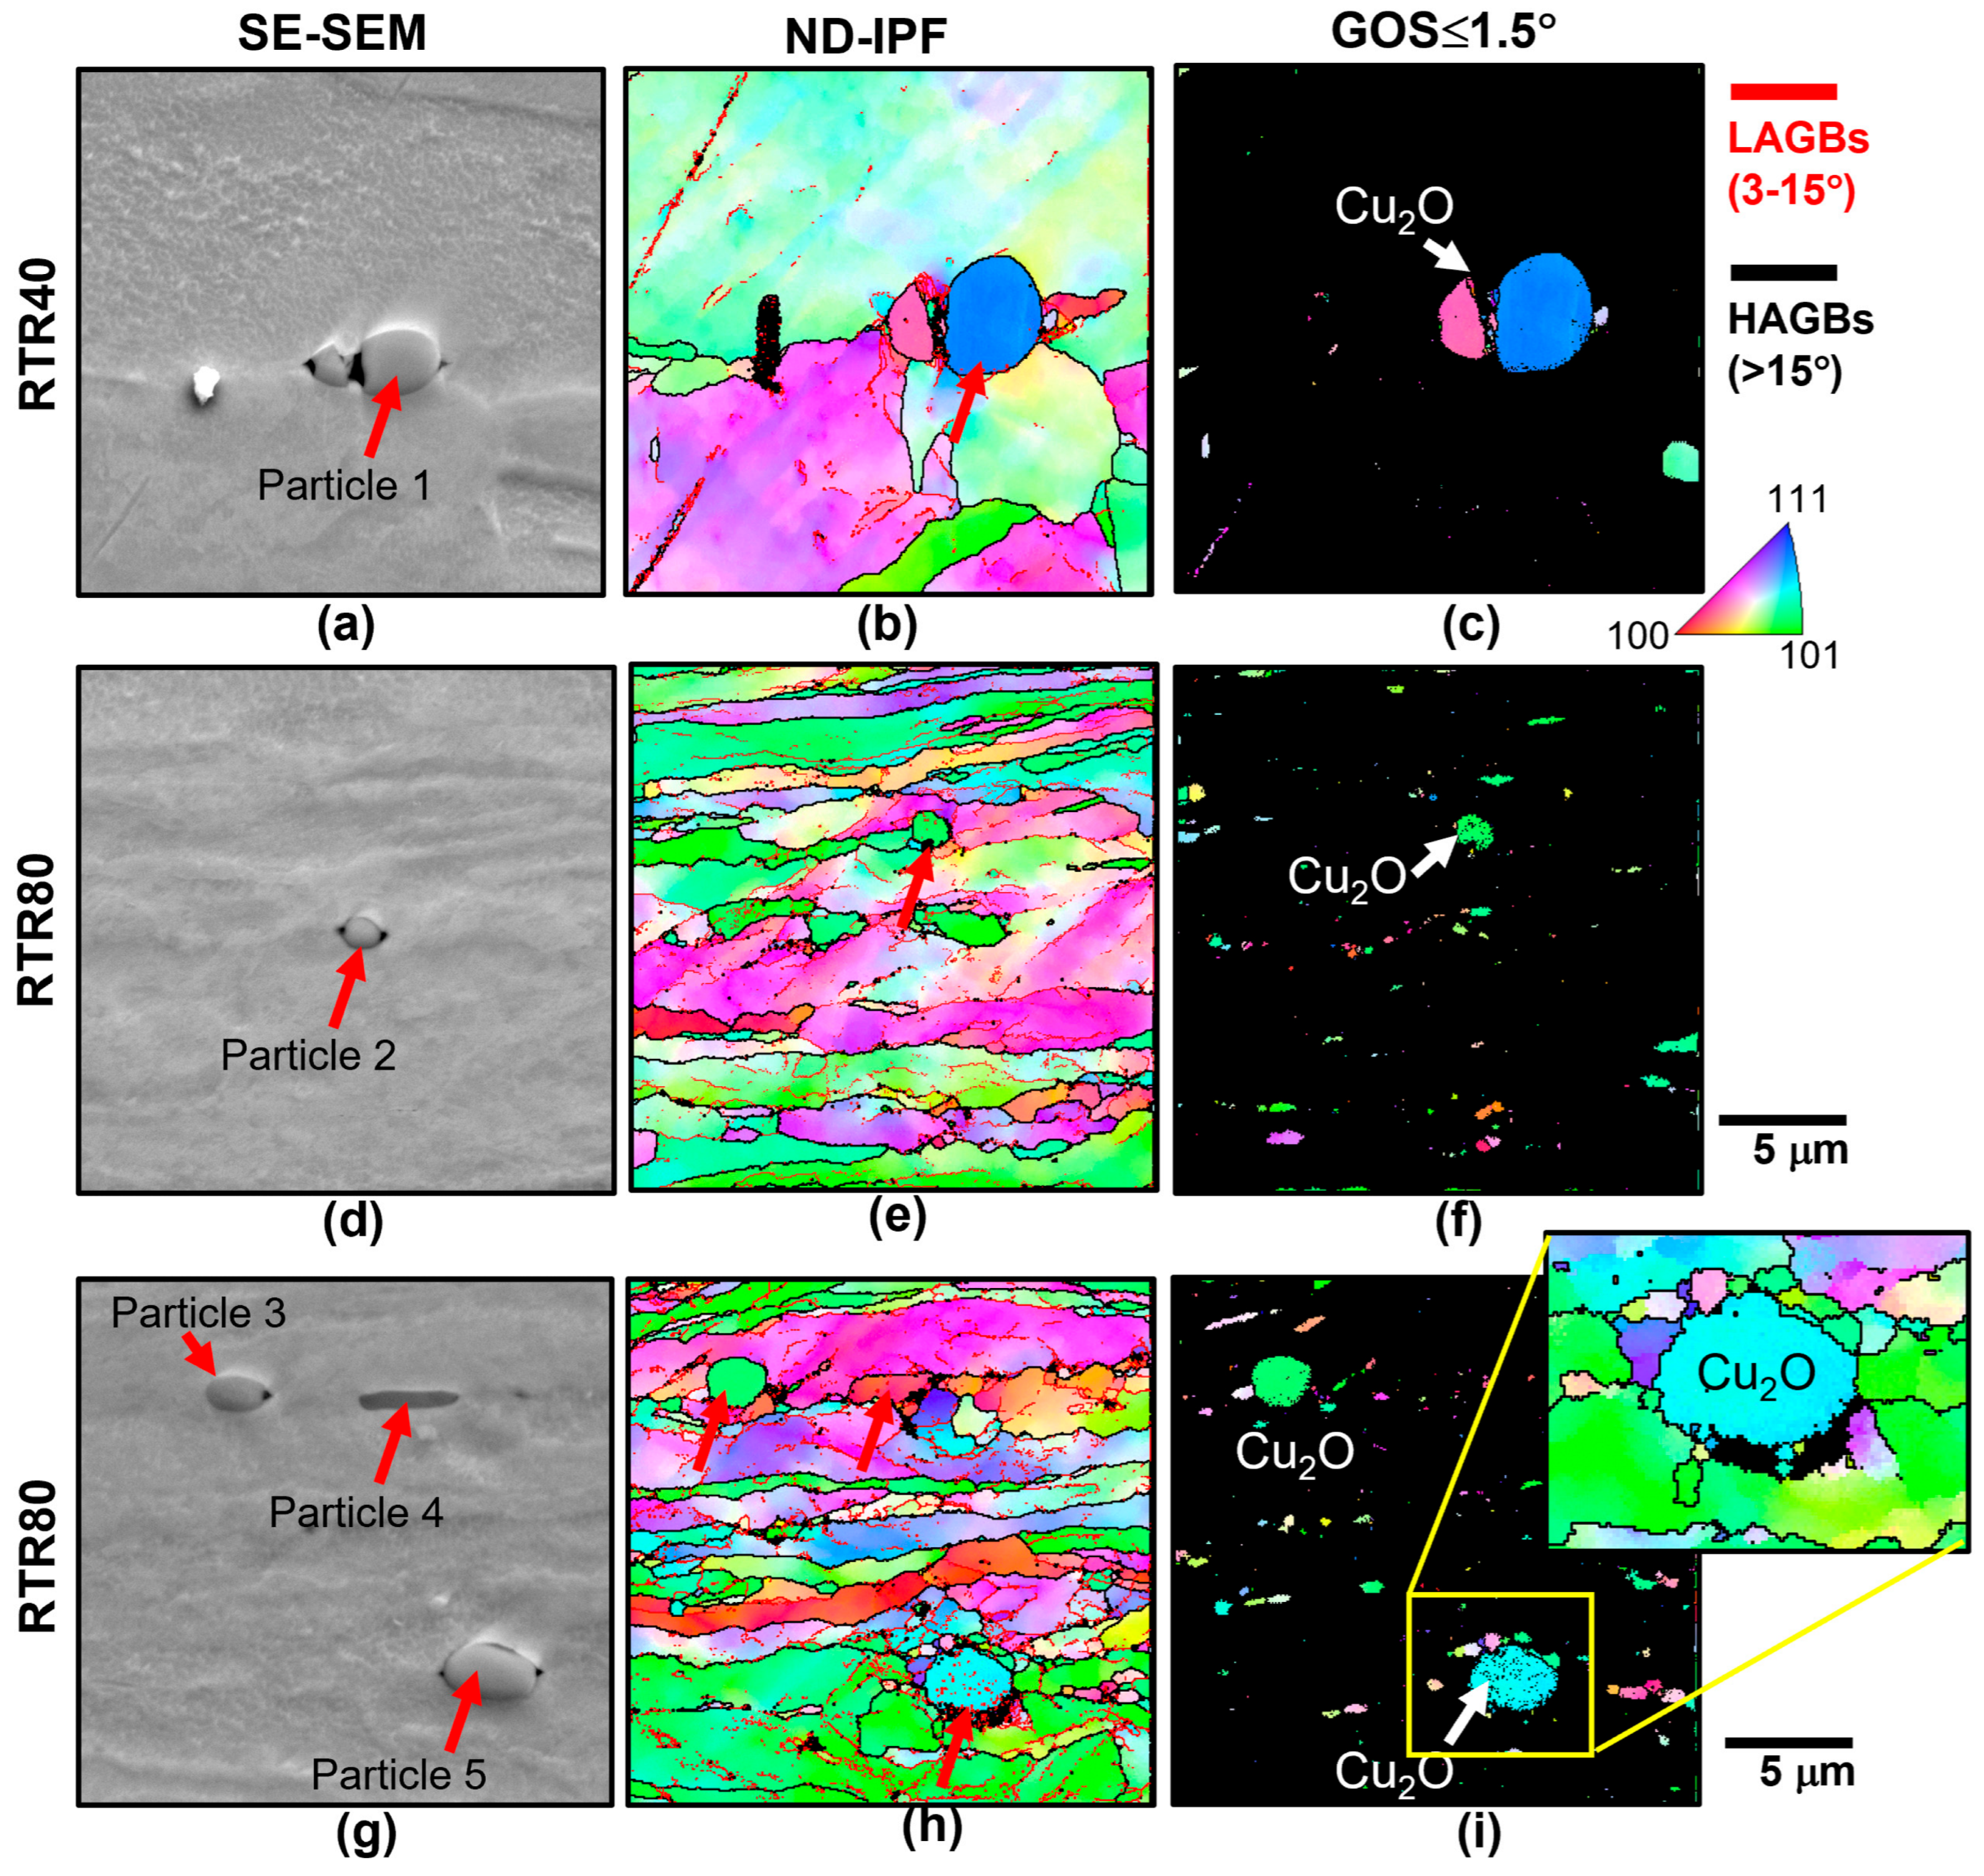
Figure 3 illustrates the correlated SEM, EBSD (ND-IPF) and GOS-partition maps used to identify self-annealed grains in RTR ETP-Cu. For each case, the surface region was first imaged by SEM and then scanned by EBSD so that particle locations, deformation features, and recrystallized grains/locations can be directly compared. In all SEM panels, the Cu2O particles are marked with red arrows; these particles are visible as gray inclusions and serve as clear reference points between the SEM and EBSD images. Black contrast features around these particles are the voids, which are formed due to incompatible deformation between the soft matrix and hard particles [24]. The mismatch between the Cu and Cu2O produces characteristic voids and “comet-tail” features aligned with the drawing/rolling direction, insufficient contact pressure, and an increasingly strong matrix, leaving empty spaces at the leading and trailing edges of precipitates. For the RTR40 condition (Figure 3a–c), the SEM shows isolated oxide particles at the interfacial boundaries. It was observed that particle 1 was located at the triple boundary junction (see IPF). It is important to mention that the scans were captured at very high magnification (5000×); hence, the complete grain has not been captured. In the corresponding IPF map, only 3–4 grains can be seen with a lower fraction of LAGBs (red boundaries, 3–15°). The GOS-partition (self-annealed) map highlights a small but distinct population of low-GOS (near-dislocation-free) grains located adjacent to grain boundaries and around the larger oxide particles. Oxide particles can also be seen in the IPF map (Figure 4c), as the orientation spread in the Cu2O particles is minimum. The fraction of self-annealed grains is negligible in RTR40 due to low deformation level and low SE.
Figure 3. Self-annealing phenomena in the RTR samples: (a) SEM image shows the approximate EBSD scanned location, (b) inverse pole figure (IPF) map, and (c) self-annealed grains in the RTR40 sample. (d,g) SEM images show the approximate EBSD scanned locations, (e,h) IPF maps, and (f,i) self-annealed grains in the RTR80 sample, respectively. The self-annealed grains were partitioned from the deformed grains using the grain orientation spread (GOS) criteria of 1.5°. The scale bar is shared among all micrographs.
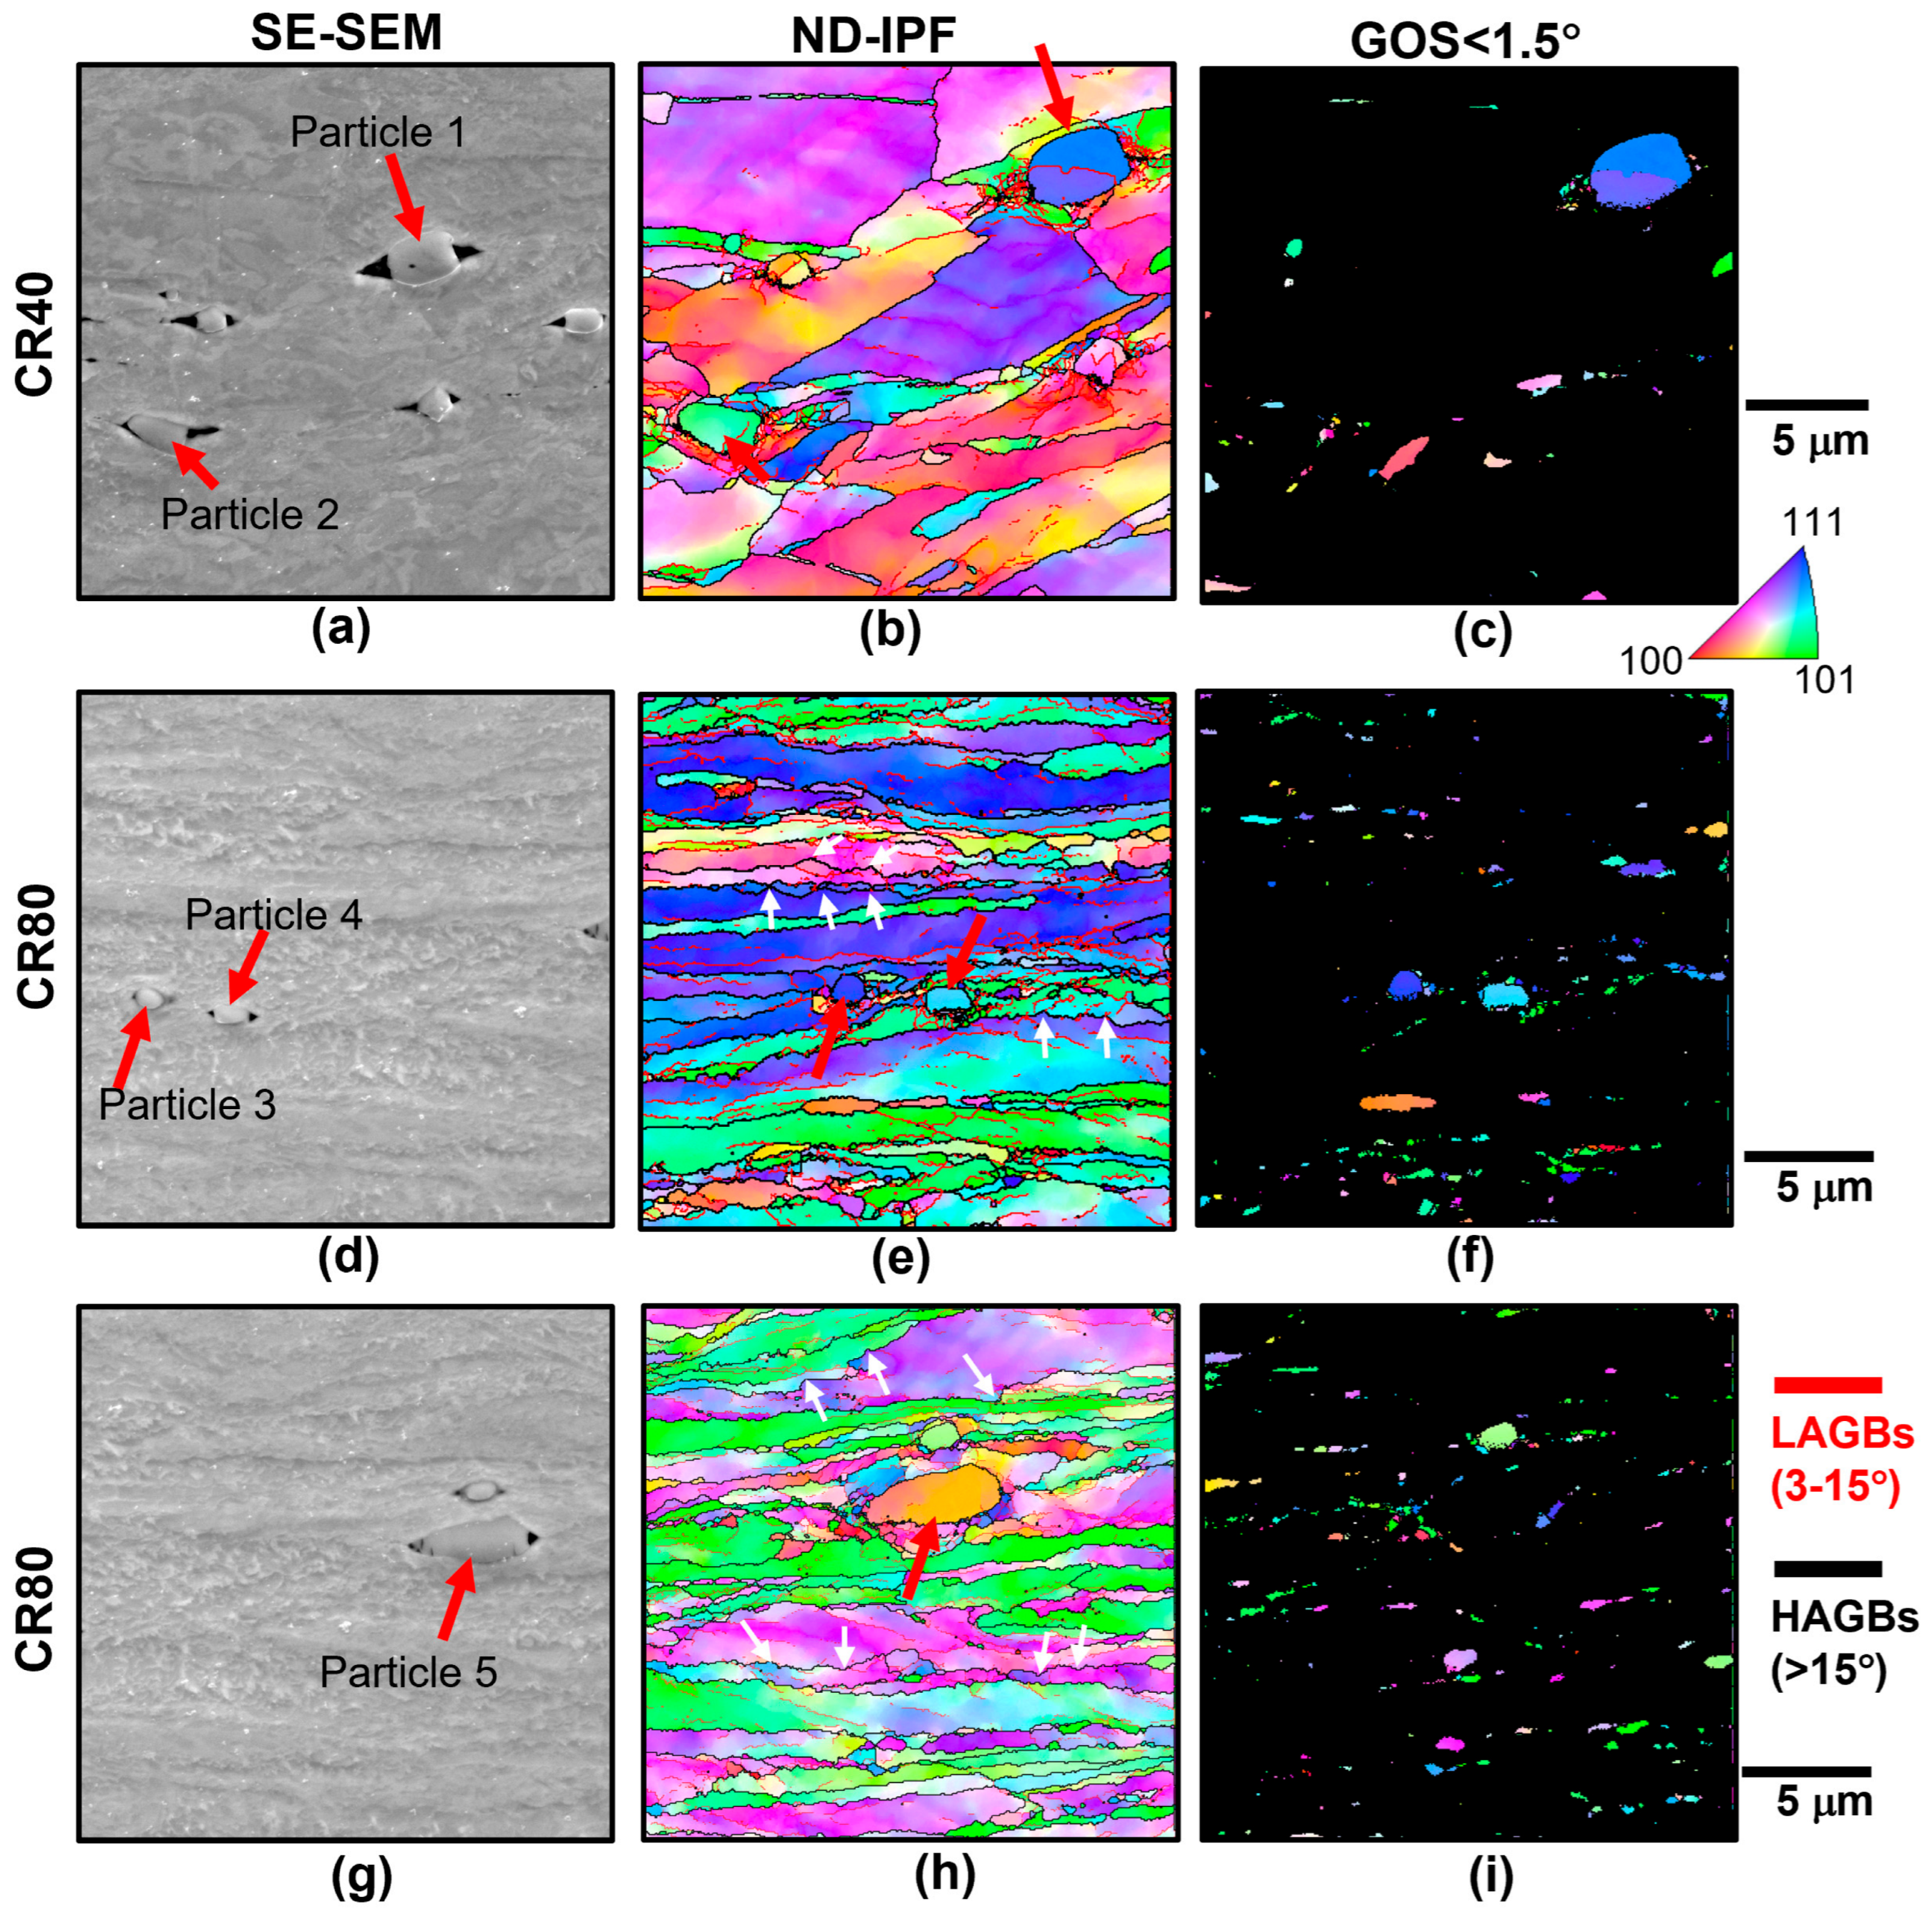
Figure 4. Self-annealing phenomena in the CR samples: (a) SEM image shows the approximate EBSD scanned region, (b) IPF map, and (c) self-annealed grains in the CR40 sample. (d,g) SEM images show the approximate EBSD scanned regions, (e,h) IPF maps, and (f,i) self-annealed grains in the CR80 sample, respectively. Grain-boundary bulging can be seen in the CR80 samples marked with white arrows. The self-annealed grains were partitioned from the deformed grains using the GOS criteria of 1.5°. The scale bar is common for all micrographs.
At 80% reduction (two separate RTR80 locations shown in Figure 3d–i), the SEMs display much stronger grain elongation or deformation bands and a higher density of deformed features (bulge grain boundaries, subgrain formation, orientation gradient). In the present study, the elongated grains are termed the deformation bands [25]. The IPF maps were superimposed with the LAGBs (3–15°) and HAGBs (>15°), which show the misorientation accumulation at specific locations. The IPF maps for RTR80 contain denser subgrain networks and larger orientation gradients than RTR40, indicating markedly higher dislocation accumulation and therefore higher SE. The GOS partitioned maps for RTR80 show a substantially larger area fraction of self-annealed grains (GOS ≤ 1.5°) than RTR40. These recrystallized grains are frequently clustered around Cu2O particles and at locations where grain-boundary bulging or irregular boundary segments are visible. The paired RTR80 scans demonstrate that the incidence of self-annealing is spatially heterogeneous (Figure 3f); some zones show intense nucleation and small grain clusters, while nearby areas remain heavily deformed. Three different particles (3, 4, and 5) can be seen in the SEM image (Figure 3g), whose corresponding IPF map shows the accumulation of subgrains around particle 5. Particles 3 and 4 do not show the accumulated subgrains/LAGBs, which means less chance of PSN around these particles. Orientation effects could also be considered along with the presence of these particles, as particle 5 is situated in a (101) oriented grain, whereas particles 3 and 4 are positioned in (100) grains [26]. The magnified image in Figure 3i shows the PSN phenomena around particle 5. Multiple small-sized equiaxed grains evolved with time around the hard Cu2O particles in RTR80. Mechanistically, the images and maps together indicate that increasing the reduction from 40% to 80% raises the SE (via greater dislocation density and subgrain formation), which in turn increases the likelihood and extent of RT recrystallization. Non-deformable Cu2O particles act as stress concentrators and PSN sites because the particle–matrix mismatch accumulates geometrically necessary dislocations (GNDs) [27]. Larger particles and strongly bulged boundaries correlate with higher local nucleation fractions.
Figure 4 presents correlated SEM, ND-IPF and GOS-partition maps for CR ETP-Cu. For each row/condition, the same surface region was first imaged by SEM and then scanned by EBSD so that particle positions, deformation features and self-annealed locations can be directly compared. Cu2O particles are marked by red arrows whose compositional data are given in Table 1. The SEM of the CR40 region shows the presence of multiple particles along with the comet tail structure (Figure 4a). These are the voids formed at the head and tail positions during the rolling deformation. As these oxide particles are very hard to deform, the equilibrium is maintained between the Cu matrix and Cu2O particles by forming the voids at the ends (Figure 4a). The ND-IPF map reveals pronounced lamellar/kinked features and more extensive fragmentation than observed for RTR40 (Figure 4b). Although the deformation level is similar for RTR and CR, the CR40 sample showed more grain fragmentation, as many small-sized grains were seen at 5000× magnification. The corresponding GOS-partition map identifies a relatively larger fraction of low-GOS (near-dislocation-free) grains in CR40 than in RTR40 (Figure 4c). These recrystallized grains are frequently located adjacent either to Cu2O particles or at highly deformed boundary segments, consistent with PSN and localized grain-boundary bulging. Two spatially separated scans of CR80 are shown to emphasize microstructural heterogeneity at high reduction (Figure 4d–i). Both CR80 locations exhibit stronger grain fragmentation, higher orientation gradients, and denser subgrains than CR40, indicative of substantially higher SE. Grain-boundary bulging is more prevalent in CR80, as marked with the white arrows. Grain-boundary bulging is an important phenomenon for nucleation via discontinuous recrystallization [28,29]. IPF maps are spatially correlated with nucleated low-GOS grains.
Table 1. EDS compositions of the hard Cu2O particles observed in Figure 3 and Figure 4.
The IPF maps for CR80 show a markedly increased area fraction of self-annealed grains relative to CR40, with many nuclei clustered around Cu2O particles and bulged/irregular boundary segments (Figure 4f,g). The paired scans demonstrate that, while CR enhances the overall propensity for RT recrystallization, nucleation remains highly site-specific and controlled by the local distribution of SE and non-deformable particles. The CR results confirm that cryogenic deformation increases dislocation accumulation and promotes microstructural fragmentation compared with RTR at equivalent reductions [30]. Because self-annealing is driven by SE, regions of high local energy, i.e., particle–matrix interfaces, bulging grain boundaries and strain-localized bands act as preferential nucleation sites, and their increased prevalence in CR specimens accounts for the higher fraction of self-annealed grains observed in CR40 and CR80 compared to their counterparts.
Table 1 reports point-EDS analyses collected from representative oxide particles observed in the SEM/EBSD regions for RTR and CR sample conditions. The measured compositions are consistent with copper oxides (dominant Cu + measurable O), supporting identification of these inclusions as Cu2O-type oxides. The oxygen concentration shows scatter between particles; this variability reflects particle size and the inherent limitations of SEM-EDS quantification rather than different chemistries. For small particles, the incident electron interaction volume extends into the surrounding Cu matrix, producing a stronger Cu signal and lowering the apparent oxygen at.%. Conversely, larger particles yield spectra with a higher relative O signal and therefore approach the expected oxide stoichiometry. Given these factors, the EDS data support the qualitative conclusion that the inclusions are cuprous oxides that act as non-deformable obstacles during rolling. Their size-dependent apparent oxygen content is consistent with the interpretation that larger oxide particles provide stronger particle–matrix incompatibility and thus more effective PSN sites in the self-annealing process. It is to be noted that minute Fe and P (<0.3%) were observed in the matrix and particles. That is why the overall compositions of the particles are slightly less than 100%. Garcia et al. [31] reported the effect of oxygen levels (26 ppm, 46 ppm, and 62 ppm) on the mechanical properties of pure copper. During hot deformation (600–950 °C), the fine Cu2O particles caused precipitation hardening through an Orowan looping mechanism, where dislocations bypass obstacles rather than cutting through them. The flow stresses during the hot compressions increased from 6.1 MPa (46 ppm) to 35.6 MPa (62 ppm) [31]. Hence, it could be understood that higher oxygen content could lead to more hardness than the low oxygen content particles. This could also be related to the accumulation of dislocations around Cu2O particles.
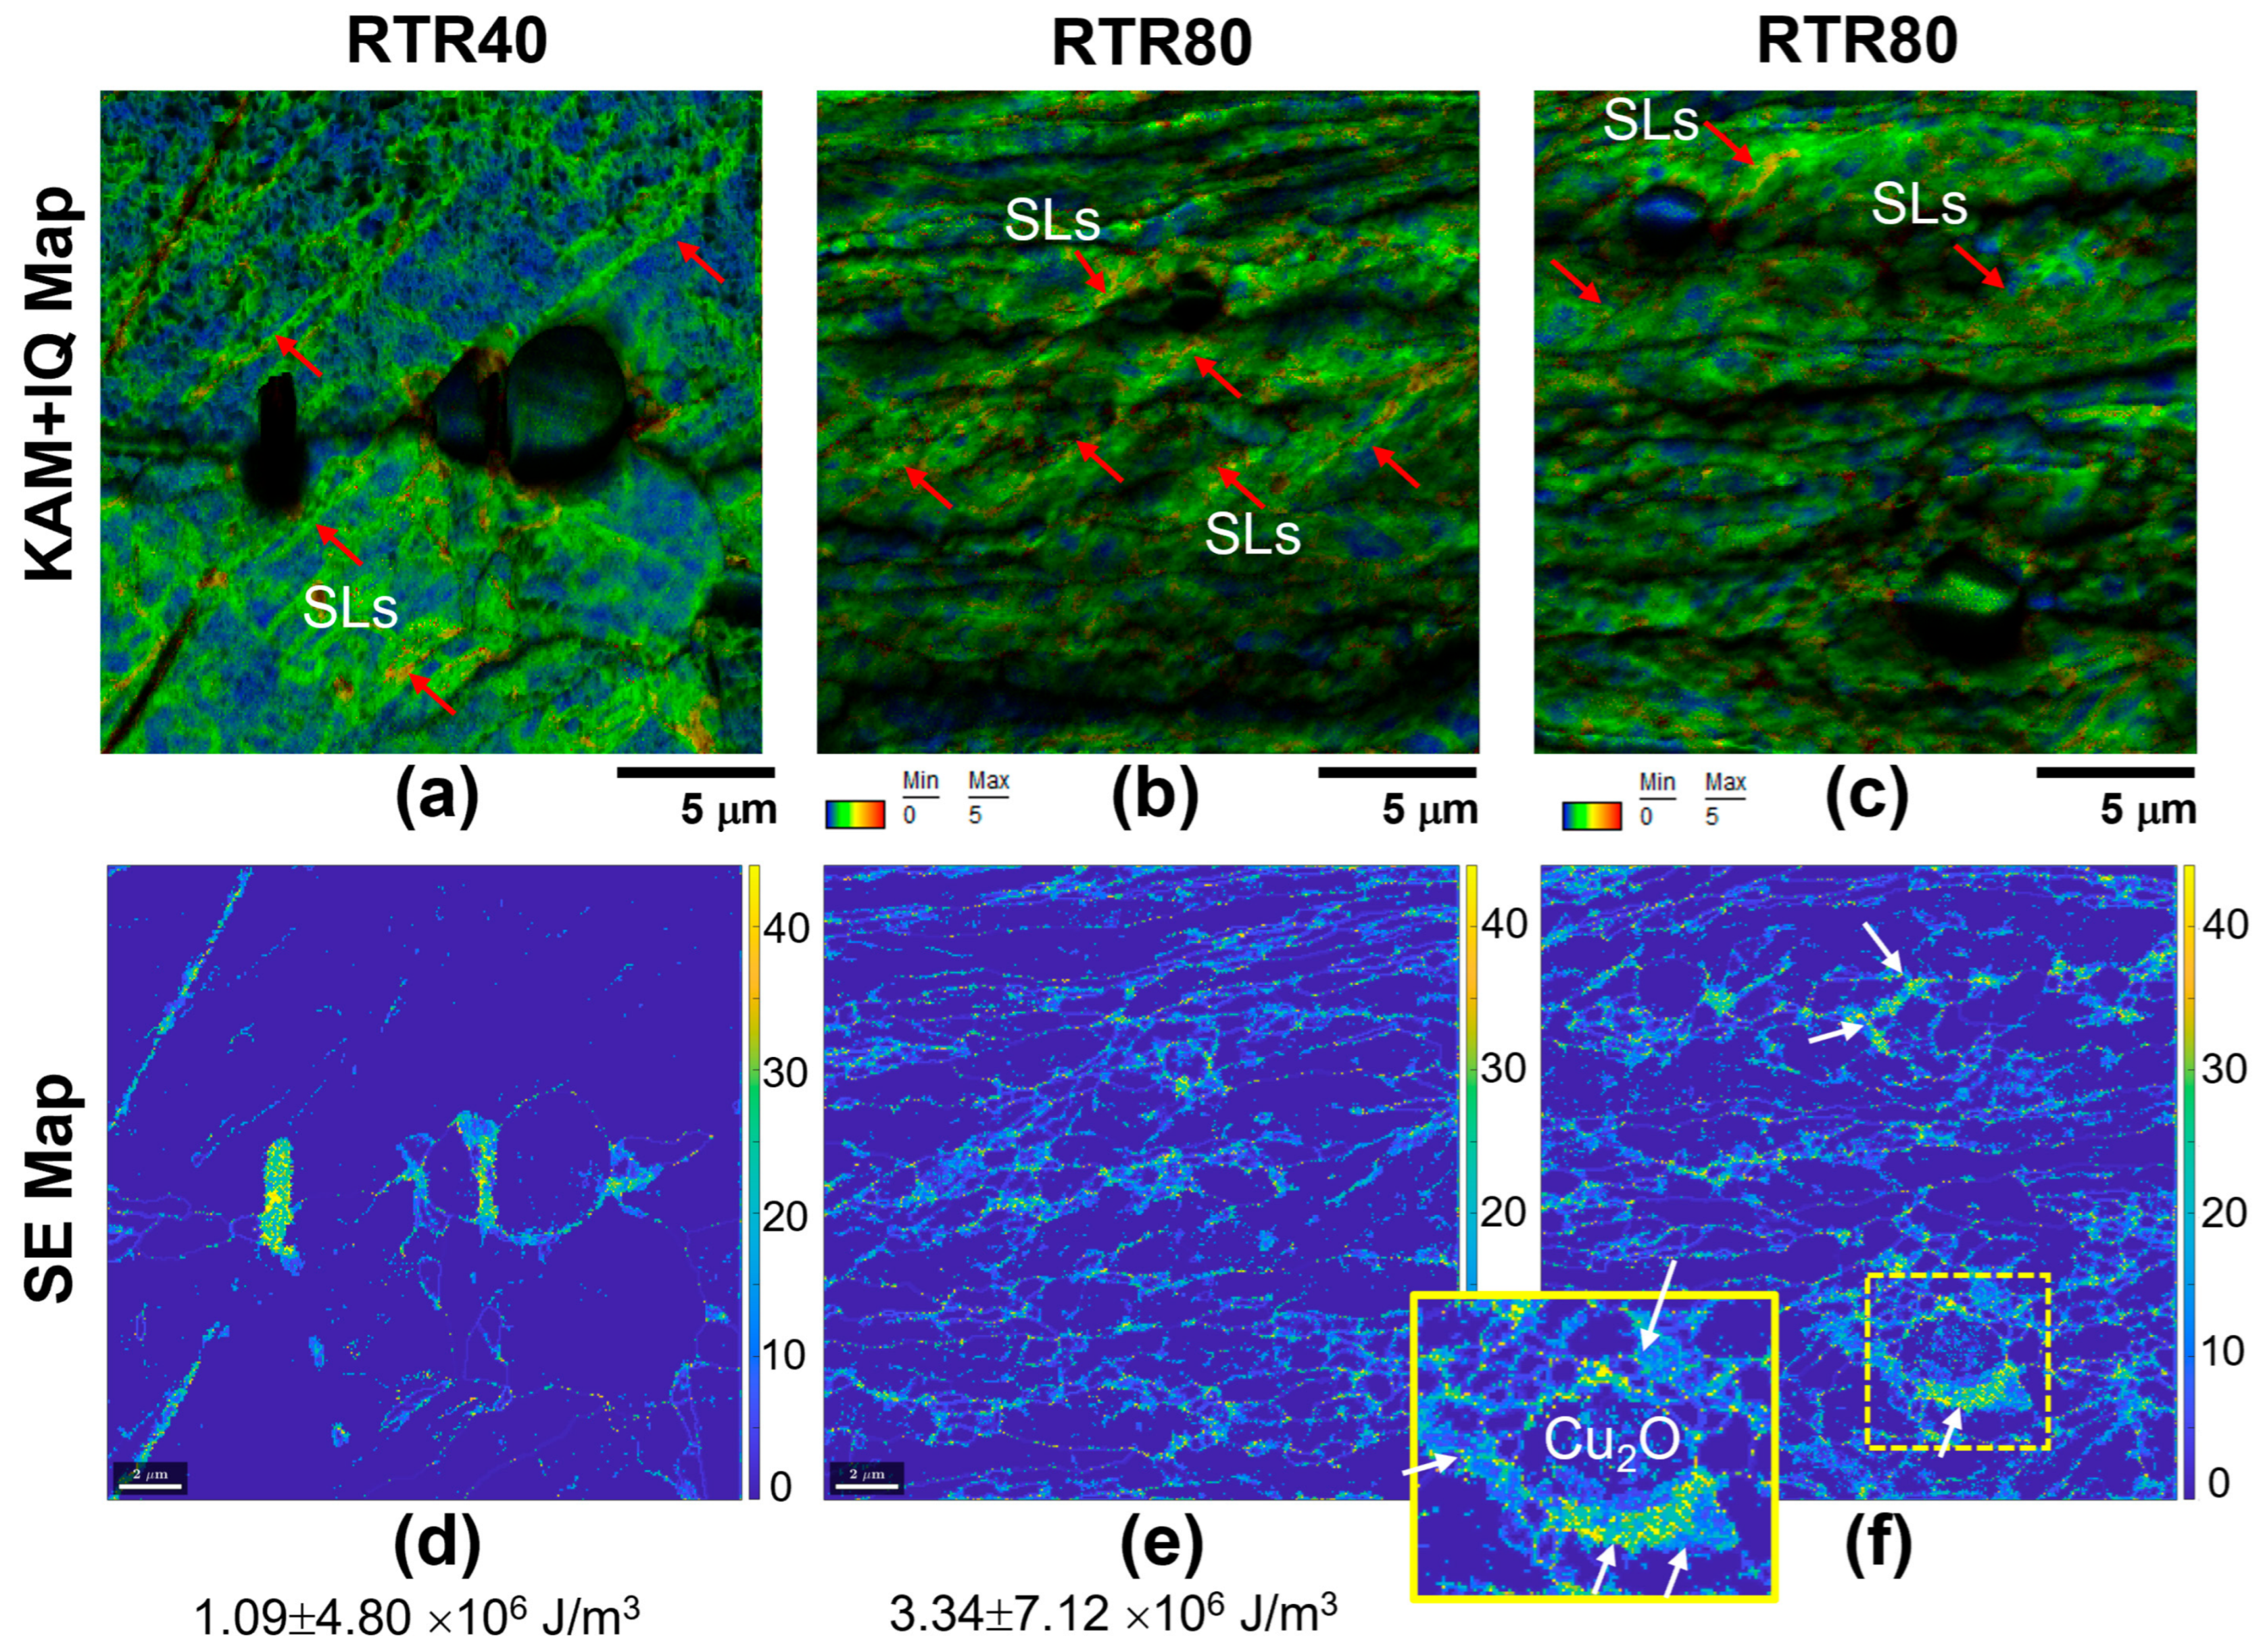
Figure 5 compares kernel average misorientation (KAM) maps and SE maps for the RTR ETP-Cu specimens and links local misorientation, SE, and particle locations to the observed self-annealing behavior. The KAM maps were calculated using the third nearest-neighbor kernel to provide a spatially resolved, semi-quantitative indicator of local orientation gradients and therefore of GND accumulation. To correlate high-misorientation grains with particle sites, KAM images were overlapped with image-quality (IQ) maps. Low-IQ contrast reliably identifies Cu2O inclusions and damaged surface regions, so the KAM/IQ overlay permits visualizing how high-KAM regions interact with the oxide particles. Qualitatively, the KAM distributions show a pronounced increase in local misorientation with increasing thickness reduction. The RTR40 map contains localized high-KAM regions concentrated at inclined features known as strain localization (marked with red arrows) and particle–matrix interfaces (Figure 5a). In RTR80, these high-KAM features are far more widespread and interconnected. Strain localizations show the high KAM values (marked with red arrows), which are the inclined features in the respective maps (Figure 5b). The KAM value increased from 1° ± 0.67 (RTR40) to 1.41° ± 0.69 (RTR80), respectively. This progression demonstrates that higher reduction produces higher dislocation density, stronger subgrain formation and larger orientation gradients, conditions that elevate the local driving force for recovery and recrystallization.
Figure 5. Distribution of dislocations in the RTR ETP-Cu samples. Kernel average misorientation maps (KAM, 3rd nearest neighbor) of (a) RTR40 and (b,c) RTR80 ETP-Cu samples. Stored energy (SE) distribution maps of (d) RTR40 and (e,f) RTR80 ETP-Cu samples. Red arrows in the KAM maps show the strain localizations (SLs). White arrows in the SE maps show the high SE regions. SE maps were calculated for the 1° critical resolution angle. The legend value in KAM maps is in degrees (0–5°). Average SE values are mentioned below the respective SE maps.
SE maps, computed from the EBSD orientation field using the chosen subgrain criterion (1°) and standard grain-boundary energy approximations, offer a complementary and more physical measure of the local thermodynamic driving force for static recovery and recrystallization. The SE maps reproduce the principal high-energy features identified by KAM but present them as energetically weighted fields. RTR40 shows the low SE values and their distribution (Figure 5d), as already observed in the respective KAM map. Further increase in the reduction ratio increases the SE. High-SE regions are concentrated around Cu2O inclusions and at severely deformed segments. These high-SE zones correspond to the spatial locations where self-annealed, low-GOS grains were subsequently identified in the GOS-partition maps (Figure 3 and Figure 4), confirming that nucleation of dislocation-free grains is strongly correlated with local SE maxima. The high magnification image in Figure 5f shows high-SE regions marked with white arrows around the hard particles. Two important quantitative and mechanistic points arise from Figure 5. First, the overall level and spatial extent of SE increase from RTR40 to RTR80; the area fraction of map pixels exceeding moderate SE thresholds grows substantially with reduction, consistent with the measured rise in self-annealed grain fraction. Second, high SE values are systematically collocated with Cu2O particles. This supports PSN as an operative mechanism because the particle–matrix incompatibility concentrates dislocations and produces the high local strain energy necessary for nucleation without external heating. Calculations were performed for the SE, in which RTR40 and RTR80 showed 1.09 × 10⁶ and 3.34 × 10⁶ J/m3, respectively.
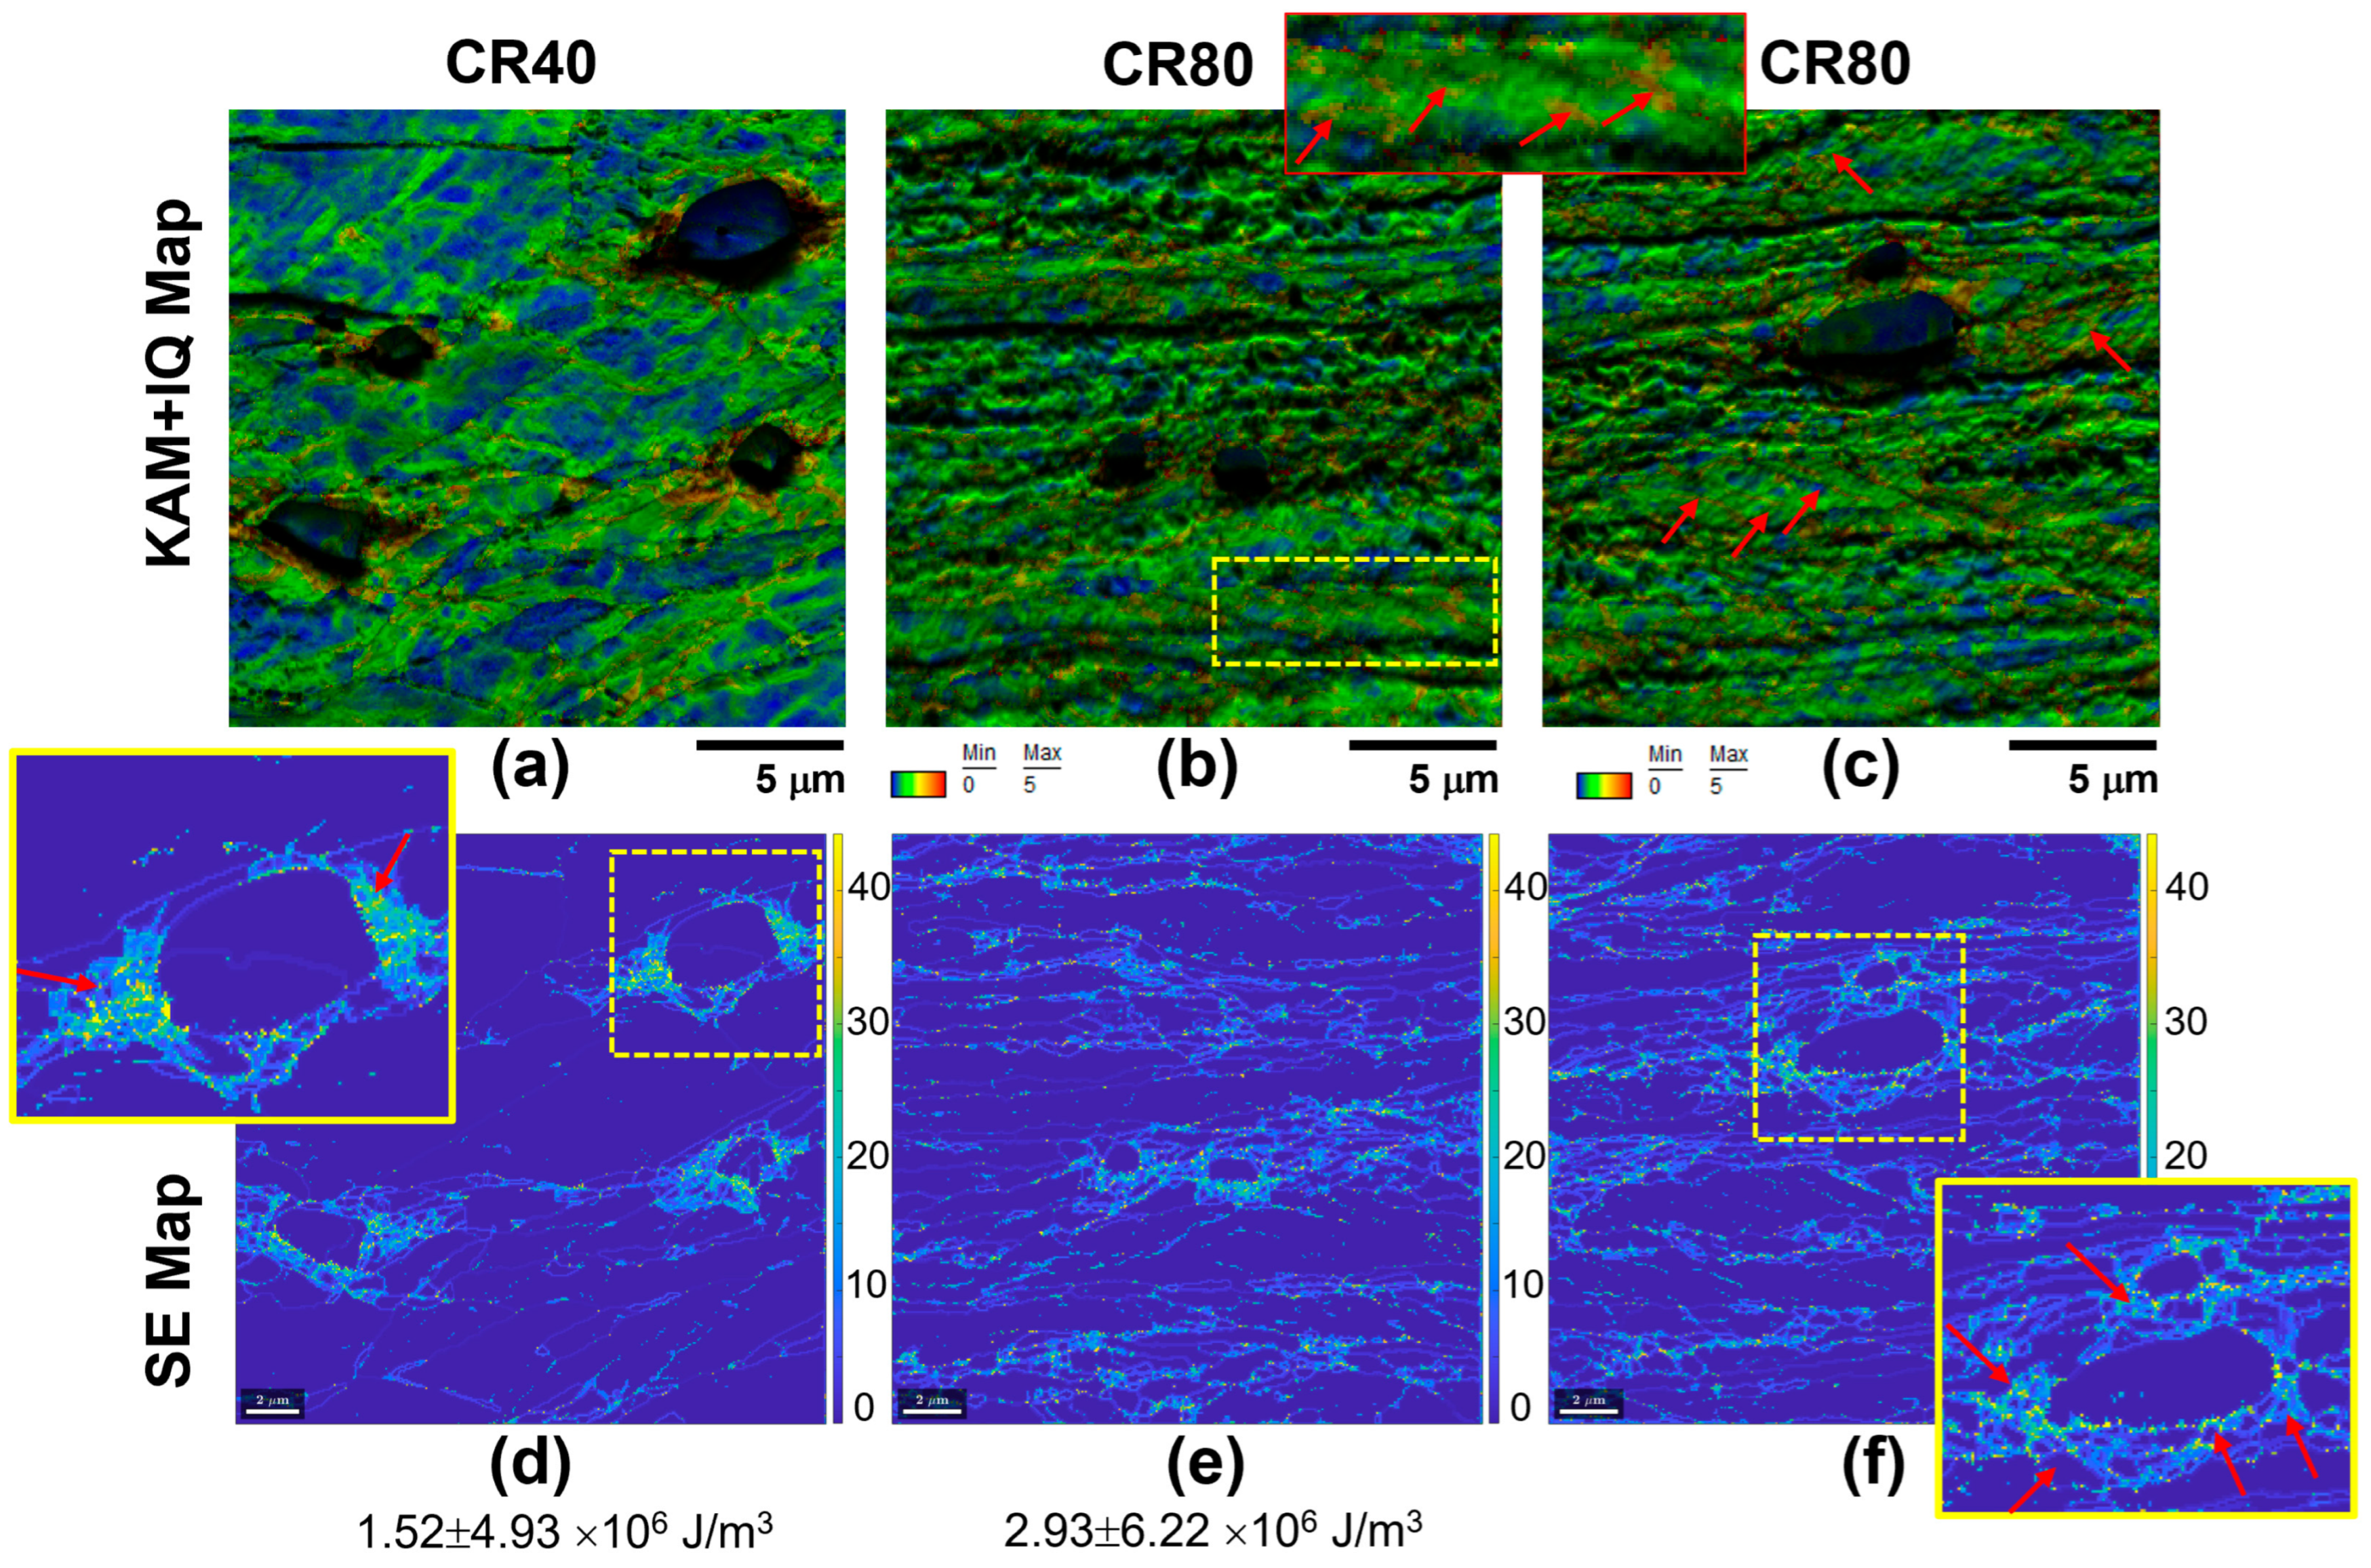
Figure 6 compares KAM and SE maps for the CR ETP-Cu specimens and links the local misorientation field, particle locations and high dislocation regions to the observed self-annealing behavior. KAM maps are used as a semi-quantitative indicator of local orientation gradients and, therefore, of dislocation accumulation. Qualitatively, the KAM distributions show a clear increase in local misorientation with increasing reduction (Figure 6a–c). CR80 maps contain denser and more interconnected high-KAM regions than CR40, reflecting greater dislocation density and more severe subgrain formation produced by CR. The KAM value increased from 1.24° ± 0.76 (CR40) to 1.47° ± 0.78 (CR80), respectively (Figure 6a,b). When comparing with the respective RTR conditions, the CR samples showed higher KAM values due to higher dislocations. The two spatially separated CR80 scans emphasize the microstructural heterogeneity at high reduction; some regions display intense networks of high-KAM bands and fragmented substructures, while adjacent areas remain comparatively less distorted, indicating that dislocation accumulation and the resulting driving force for recovery are strongly site-specific. The strain localizations were marked in a magnified KAM map (red arrows), showing the possible regions for the self-annealing. Although the inclined strain localizations were observed in the 80% deformed RTR and CR samples, the self-annealing can only occur if the SE or dislocation accumulation crosses the critical values. The SE maps (Figure 6d–f) provide a complementary, energetically weighted view of the deformation field and identify the same high-misorientation loci as localized high-energy regions. High SE is concentrated around Cu2O particles and at irregular grain boundaries, precisely the locations where self-annealed, low-GOS grains are observed. Magnified insets for CR40 and CR80 further demonstrate that particle-proximal regions exhibit the largest SE values (marked with red arrows in Figure 6d,f), consistent with PSN and localized discontinuous recrystallization. Quantitatively, the mapped SE increases from CR40 to CR80, confirming that larger reductions during CR promote higher local SE and thus a greater propensity for RT recrystallization. Average stored energy is 1.52 × 10⁶ and 2.93 × 10⁶ J/m3 for CR40 and CR80 samples, respectively. CR40 shows a higher SE than RTR40, but the CR80 sample showed a low SE value compared to its counterpart. This difference is attributed to rapid post-deformation dislocation annihilation/self-annealing that occurs when cryogenically deformed samples are returned to RT prior to EBSD scanning. CR samples initially accumulate very high dislocation densities during deformation, but a portion of that SE can relax quickly at ambient conditions, reducing the mapped SE. Nevertheless, the spatial patterns in KAM and SE maps consistently show that CR intensifies fragmentation and local energy concentration, and that Cu2O particles and bulged boundaries remain the dominant nucleation sites for self-annealing.
Figure 6. Distribution of dislocations in the CR ETP-Cu samples. KAM maps (3rd nearest neighbor) of (a) CR40 and (b,c) CR80 ETP-Cu samples. SE distribution maps of (d) CR40 and (e,f) CR80 ETP-Cu samples. Red arrows in KAM maps show the strain localizations (SLs). Red arrows in the SE maps show the high SE regions around Cu2O. SE maps were calculated for the 1° critical resolution angle. The legend value in KAM maps is in degrees (0–5°). Average SE values are mentioned below the respective SE maps.

4. Conclusions

In the current investigation, RTR and CR ETP-Cu samples showed a variation in the deformation stored energy (SE). EBSD characterization revealed the misorientation development around the hard Cu2O particles as well as along the severely deformed regions, which were the primary locations of the self-annealing. The following conclusions can be drawn:
  • Dislocation distribution and SE in RTR40 vs. RTR80: Increasing rolling reduction from RTR40 to RTR80 produces systematically higher local misorientation (KAM), which corresponds to increased dislocation density and subgrain formation. SE maps corroborate this trend; RTR80 exhibits a greater area fraction and magnitude of high-SE regions than RTR40, explaining the higher fraction of self-annealed (low-GOS) grains at the larger reduction.
  • KAM and SE in CR40 vs. CR80: Cryogenic rolling intensifies grain fragmentation and orientation gradients relative to the corresponding RTR conditions. CR80 shows denser, more pervasive high-KAM regions and larger high-SE regions than CR40, indicating increased local driving force for recrystallization with reduction. However, the mapped average SE for CR80 was lower than RTR80 due to rapid post-deformation self-annealing/dislocation annihilation.
  • Particle-stimulated nucleation (PSN) and RTR vs. CR comparison: Cu2O inclusions act as dominant PSN sites in both RTR and CR samples. High-KAM and high-SE fields consistently localize at particle–matrix interfaces and correlate with the nucleation of low-GOS grains. CR increases the prevalence and intensity of these particle-proximal high-energy loci (and thus PSN activity) compared with RTR at equivalent reductions; however, the kinetics of post-deformation relaxation on warming can reduce the net SE available to drive self-annealing.

Author Contributions

Conceptualization, A.G. and S.-H.C.; methodology, A.G. and S.T.; software and validation, A.G. and S.-H.C.; formal analysis, S.T.; investigation, A.G.; resources, A.G., S.T. and S.-H.C.; data curation, A.G.; writing—original draft preparation, A.G.; writing—review and editing, S.T. and S.-H.C.; visualization, A.G.; supervision, S.T. and S.-H.C.; project administration, S.T.; funding acquisition, A.G., S.T. and S.-H.C. All authors have read and agreed to the published version of the manuscript.

Funding

This research received no external funding.

Data Availability Statement

The original contributions presented in this study are included in the article. Further inquiries can be directed to the corresponding author.

Acknowledgments

AG would like to acknowledge the supporting contributions of Shi-Hoon Choi, from Sunchon National University, South Korea, for the positive discussions about self-annealing in ETP-Cu.

Conflicts of Interest

The authors declare no conflicts of interest.

References

  1. Lapeire, L.; Verbeken, K.; Kestens, L.; Martinez Lombardia, E.; De Graeve, I.; Terryn, H. Copper: A Model Alloy to Understand the Role of Microstructure in Sustainability. Proc.-Eur. Metall. Conf. EMC 2011, 5, 1631–1644. [Google Scholar]
  2. Martinez-Lombardia, E.; Lapeire, L.; De Graeve, I.; Verbeken, K.; Kestens, L.A.I.; Terryn, H. Study of the Influence of the Microstructure on the Corrosion Properties of Pure Copper. Mater. Corros. 2016, 67, 847–856. [Google Scholar] [CrossRef] [Scilit]
  3. Zhang, S.; Li, R.; Kang, H.; Chen, Z.; Wang, W.; Zou, C.; Li, T.; Wang, T. A High Strength and High Electrical Conductivity Cu-Cr-Zr Alloy Fabricated by Cryorolling and Intermediate Aging Treatment. Mater. Sci. Eng. A 2017, 680, 108–114. [Google Scholar] [CrossRef] [Scilit]
  4. Hachet, D.; Gorsse, S.; Godet, S. Microstructure Study of Cold Rolled Al0.32CoCrFeMnNi High-Entropy Alloy: Interactions between Recrystallization and Precipitation. Mater. Sci. Eng. A 2021, 802, 140452. [Google Scholar] [CrossRef] [Scilit]
  5. Anand, G.; Barai, K.; Madhavan, R.; Chattopadhyay, P.P. Evolution of Annealing Texture in Cryo-Rolled Copper. Mater. Sci. Eng. A 2015, 638, 114–120. [Google Scholar] [CrossRef] [Scilit]
  6. Zhang, X.; Yang, X.; Chen, W.; Qin, J.; Fouse, J. Effects of Rolling Temperature and Subsequent Annealing on Mechanical Properties of Ultrafine-Grained Cu-Zn-Si Alloy. Mater. Charact. 2015, 106, 100–107. [Google Scholar] [CrossRef] [Scilit]
  7. Lapeire, L.; Sidor, J.; Verleysen, P.; Verbeken, K.; De Graeve, I.; Terryn, H.; Kestens, L.A.I. Texture Comparison between Room Temperature Rolled and Cryogenically Rolled Pure Copper. Acta Mater. 2015, 95, 224–235. [Google Scholar] [CrossRef] [Scilit]
  8. Chun, Y.B.; Ahn, S.H.; Shin, D.H.; Hwang, S.K. Combined Effects of Grain Size and Recrystallization on the Tensile Properties of Cryorolled Pure Vanadium. Mater. Sci. Eng. A 2009, 508, 253–258. [Google Scholar] [CrossRef] [Scilit]
  9. Gupta, A.; Yoo, T.-H.; Kaushik, L.; Lee, J.W.; Kim, Y.-K.; Choi, S.-H. Unveiling the Room-Temperature Softening Phenomenon and Texture Evolution in Room-Temperature- and Cryogenic-Rolled ETP Copper. Int. J. Plast. 2022, 156, 103340. [Google Scholar] [CrossRef] [Scilit]
  10. Gupta, A.; Choi, S.H. Self-Annealing Phenomena in the Cold-Rolled and Cryo-Rolled Copper Alloys: A Review. J. Phys. Conf. Ser. 2023, 2635, 012015. [Google Scholar] [CrossRef] [Scilit]
  11. Lei, Q.; Li, Z.; Dai, C.; Wang, J.; Chen, X.; Xie, J.M.; Yang, W.W.; Chen, D.L. Effect of Aluminum on Microstructure and Property of Cu-Ni-Si Alloys. Mater. Sci. Eng. A 2013, 572, 65–74. [Google Scholar] [CrossRef] [Scilit]
  12. Xiao, X.; Xu, H.; Chen, J.; Liang, Q.; Wang, J.; Zhang, J. Aging Properties and Precipitates Analysis of Cu-2.3Fe-0.03P Alloy by Thermomechanical Treatments. Mater. Res. Express 2017, 4, 116511. [Google Scholar] [CrossRef] [Scilit]
  13. Wang, W.; Kang, H.; Chen, Z.; Chen, Z.; Zou, C.; Li, R.; Yin, G.; Wang, T. Effects of Cr and Zr Additions on Microstructure and Properties of Cu-Ni-Si Alloys. Mater. Sci. Eng. A 2016, 673, 378–390. [Google Scholar] [CrossRef] [Scilit]
  14. Gupta, A.; Kaushik, L.; Yoo, T.H.; Choi, S.H. Unveiling the Room-Temperature Softening Phenomenon and Texture Evolution in Room-Temperature-Rolled Cu–0.13Sn Alloys. Metall. Mater. Trans. A 2024, 55, 1516–1538. [Google Scholar] [CrossRef] [Scilit]
  15. Gupta, A.; Kumar, R.; Kaushik, L.; Shukla, S.; Tandon, V.; Choi, S.-H. Microstructure and Texture Evolution in Thermomechanically Processed FCC Metals and Alloys: A Review. Korean J. Met. Mater. 2024, 62, 564–592. [Google Scholar] [CrossRef] [Scilit]
  16. Aghamiri, S.M.S.; Zhang, S.H.; Ukai, S.; Oono, N.; Kasada, R.; Noto, H.; Hishinuma, Y.; Muroga, T. Microstructure Development in Cryogenically Rolled Oxide Dispersion Strengthened Copper. Materialia 2020, 9, 100520. [Google Scholar] [CrossRef] [Scilit]
  17. Choi, S.H.; Jin, Y.S. Evaluation of Stored Energy in Cold-Rolled Steels from EBSD Data. Mater. Sci. Eng. A 2004, 371, 149–159. [Google Scholar] [CrossRef] [Scilit]
  18. Kim, J.S.; Kim, S.I.; Choi, S.H. Microstructure Characterization Based on the Type of Deformed Grains in Cold-Rolled, Cu-Added, Bake-Hardenable Steel. Mater. Charact. 2014, 92, 159–170. [Google Scholar] [CrossRef] [Scilit]
  19. Karthik, M.; Abhinav, J.; Shankar, K. V Morphological and Mechanical Behaviour of Cu–Sn Alloys—A Review. Met. Mater. Int. 2021, 27, 1915–1946. [Google Scholar] [CrossRef] [Scilit]
  20. Wang, Y.; Lu, Y.; Zhang, S.; Zhang, H.; Wang, H.; Chen, Z. Characterization and Strengthening Effects of Different Precipitates in Al–7Si–Mg Alloy. J. Alloys Compd. 2021, 885, 161028. [Google Scholar] [CrossRef] [Scilit]
  21. Gupta, A.; Yoo, T.H.; Cho, H.; Lee, B.; Choi, S.H. Unveiling the Self-Annealing Phenomena and Its Effect on Microstructure and Texture Evolution in the Room Temperature Rolled Cu-0.13Sn-0.04Mg Alloy. Philos. Mag. 2024, 104, 723–763. [Google Scholar] [CrossRef] [Scilit]
  22. Paul, H.; Driver, J.H.; Maurice, C.; Piatkowski, A. Recrystallization Mechanisms of Low Stacking Fault Energy Metals as Characterized on Model Silver Single Crystals. Acta Mater. 2007, 55, 833–847. [Google Scholar] [CrossRef] [Scilit]
  23. Afifeh, M.; Hosseinipour, S.J.; Jamaati, R. Nanostructured Copper Matrix Composite with Extraordinary Strength and High Electrical Conductivity Produced by Asymmetric Cryorolling. Mater. Sci. Eng. A 2019, 763, 138146. [Google Scholar] [CrossRef] [Scilit]
  24. Zasadzińska, M.; Knych, T. The Morphology of Eutectic Copper Oxides I (Cu2O) in the Processing of Wire Rod and Wires Made from ETP Grade Copper. Arch. Metall. Mater. 2019, 64, 1611–1616. [Google Scholar] [CrossRef] [Scilit]
  25. Van Houtte, P.; Delannay, L.; Samajdar, I. Quantitative Prediction of Cold Rolling Textures in Low-Carbon Steel by Means of the Lamel Model. Texture Stress Microstruct. 1999, 31, 109–149. [Google Scholar] [CrossRef] [Scilit]
  26. Guiglionda, G.; Borbély, A.; Driver, J.H. Orientation-Dependent Stored Energies in Hot Deformed Al–2.5%Mg and Their Influence on Recrystallization. Acta Mater. 2004, 52, 3413–3423. [Google Scholar] [CrossRef] [Scilit]
  27. Sun, F.; Wang, S.; Xie, Q. Role of Particles and Lattice Rotation in Tension-Compression Asymmetry of Aluminium Alloys. Int. J. Plast. 2022, 159, 103464. [Google Scholar] [CrossRef] [Scilit]
  28. Shi, S.; Ge, J.; Lin, Y.C.; Zhang, X.; Zhou, K. High-Temperature Deformation Behavior and Recrystallization Mechanism of a near Beta Titanium Alloy Ti-55511 in β Phase Region. Mater. Sci. Eng. A 2022, 847, 143335. [Google Scholar] [CrossRef] [Scilit]
  29. Fu, Q.; Lei, M.; Li, B.; Zhang, M.; Song, H.; Guan, R. Hot Deformation Behavior, Processing Map and Dynamic Recrystallization Mechanisms of Cu–Te Alloy. Mater. Charact. 2025, 230, 115765. [Google Scholar] [CrossRef] [Scilit]
  30. Pustovoytov, D.; Pesin, A.; Tandon, P. Asymmetric (Hot, Warm, Cold, Cryo) Rolling of Light Alloys: A Review. Metals 2021, 11, 956. [Google Scholar] [CrossRef] [Scilit]
  31. García, V.G.; Cabrera, J.M.; Prado, J.M. Role of Cu2O during Hot Compression of 99.9% Pure Copper. Mater. Sci. Eng. A 2008, 488, 92–101. [Google Scholar] [CrossRef] [Scilit]
Disclaimer/Publisher’s Note: The statements, opinions and data contained in all publications are solely those of the individual author(s) and contributor(s) and not of MDPI and/or the editor(s). MDPI and/or the editor(s) disclaim responsibility for any injury to people or property resulting from any ideas, methods, instructions or products referred to in the content.

Article Metrics

Citations

Article Access Statistics

Multiple requests from the same IP address are counted as one view.