Article

Thermal, Microstructural, and Morphological Analysis of Co-Ni-Ce Microalloyed SAC305 Lead-Free Solder Solidified at Low Cooling Rate


1
Doctoral School on Materials Sciences and Technologies, Óbuda University, József krt. 6, 1088 Budapest, Hungary
2
Bánki Donát Faculty of Mechanical and Safety Engineering, Óbuda University, József krt. 6, 1088 Budapest, Hungary
*
Author to whom correspondence should be addressed.
Metals 2026, 16(4), 374; https://doi.org/10.3390/met16040374
Submission received: 25 February 2026 / Revised: 20 March 2026 / Accepted: 24 March 2026 / Published: 28 March 2026

Abstract

Microstructural and morphological effects of cobalt (Co), nickel (Ni), and cerium (Ce) microalloying on the SAC305 lead-free solder alloy were investigated, with emphasis on the solidification behavior under slow cooling conditions. Although the individual effects of these elements have been previously reported, their combined influence remains scarcely addressed. Thermal behavior, elemental composition, and surface integrity of the solder joints were analyzed. The addition of Co, Ni, and Ce resulted in a significant shift of the onset temperature during cooling, indicating reduced undercooling. Microalloying led to a transformation of the intermetallic layer (IML) morphology from scalloped to planar, and a 60% reduction in the number of shrinkage voids. The average β-Sn grain size decreased by 37.5%, while the eutectic area increased from 32% to 38%. The substitution of Cu atoms by Co and Ni within the Cu6Sn5 lattice formed thermodynamically stable (Cu,Co,Ni)6Sn5 phases. These findings demonstrate that the synergistic effect of Co, Ni, and Ce microadditives effectively refines the microstructure, suppresses undercooling, and enhances the overall reliability of SAC305 solder joints.

1. Introduction

Among the most widely adopted lead-free solder systems in the automotive and electronic industry are the Sn-Ag-Cu (SAC) alloys [1]. In particular, SAC305 has become the industry standard Pb-free solder over the past decades due to its well-balanced mechanical and thermal properties and performance. In addition to its excellent wettability and mechanical strength, SAC305 exhibits superior thermal fatigue resistance, which ensures high reliability in applications subjected to repeated thermal cycling, such as automotive and aerospace electronics. This superior thermal fatigue performance surpasses that of other competitive alloys, such as Sn-Cu or low-silver SAC variants, and is comparable to high-silver SAC solders, but with significantly lower material cost [2]. Owing to this combination of performance and cost efficiency, the IPC has formally recognized SAC305 as “the lead-free alloy of choice for the electronics industry” [2].
A variety of mechanisms are contributing to the physical and mechanical characteristics of soldering materials. Among these, solid-solution strengthening and precipitation strengthening provide enhancement to the mechanical strength of solders by controlling the distribution of solute atoms and intermetallic compounds (IMC) within the grain structure [3]. Another important mechanism is grain coarsening suppression, which prevents excessive grain growth that can otherwise lead to the deterioration of solder joint integrity and reduced mechanical performance. Furthermore, joint interface reaction control is applied to regulate the chemical interactions between the bulk solder and the contact surface, ensuring the formation of a stable and reliable metallurgical bond [4]. The integration of these strengthening and control mechanisms allows for the precise tailoring of solder alloy properties, thereby optimizing their performance for specific electronic and high-reliability applications.
Despite its widespread application, SAC305 solder exhibits several disadvantages, including rapid Cu dissolution and grain coarsening during service or reflow processes [5]. The Ag content in SAC305 accelerates Cu dissolution at elevated temperatures or during multiple soldering cycles, promoting the formation of brittle IMCs such as Cu6Sn5 and Cu3Sn. These IMCs precipitate both within the Sn-based solder matrix and along the solder–Cu interface. When the IML exceeds a critical thickness, it becomes prone to brittle fracture, thereby weakening the mechanical integrity of the solder joint and increasing the risk of failure. During thermal aging or long-term operation, the microstructure of SAC305 tends to coarsen, resulting in the growth of large β-Sn grains and isolated Ag3Sn and Cu6Sn5 particles. This coarsening process degrades the alloy’s resistance to thermal fatigue, creep, and mechanical stress, thereby reducing its long-term reliability.
Thermal analysis under varying cooling rates has shown that the solidification rate strongly influences the β-Sn grain size and the morphology of Ag3Sn IMCs [6]. At low cooling rates, prolonged solidification allows for greater diffusion and crystallization, leading to the coarsening of β-Sn, Ag3Sn, and Cu6Sn5 phases. As cooling rate decreases, Ag3Sn undergoes morphological transformations from particle-like to needle-like, plate-like, and eventually leaf-like structures [7]. These platelet and leaf-like Ag3Sn IMCs are extremely brittle, with a hardness of approximately 141.9 ± 10 HV (under 100 g load) [8], and may reach lengths of 100–300 μm, facilitating crack propagation along the β-Sn grain boundaries and leading to shrinkage defects [9]. Henderson et al. [10] demonstrated through thermomechanical testing that the mismatch in the coefficients of thermal expansion (CTE) between β-Sn and Ag3Sn phases induces strain localization at their interfaces. This promotes crack initiation and propagation, accelerating grain boundary sliding and fatigue damage, thereby compromising joint reliability. Furthermore, the formation of these plate-like IMCs is more prevalent in high-silver-content alloys [11]. The formation of shrinkage cracks on the surface of SAC305 solder joints is strongly dependent on the cooling rate during solidification. At low cooling rates, extended solidification time leads to coarser β-Sn grains and enhanced IMC formation, particularly of Ag3Sn, which increases the likelihood of crack formation and propagation in the solder joint.
The extent of undercooling is a critical characteristic of SAC305 solder [12]. In traditional eutectic Sn-Pb solders, it is well-established that Sn exhibits a much higher degree of undercooling compared to Pb, as Pb crystals nucleate more readily. Consequently, under typical soldering conditions, primary Pb crystals are often discernible within the eutectic Sn-Pb grain structure [13]. In general, a large undercooling indicates a deficiency of active nucleation sites within the molten solder. When only a few such sites are available, solidification is delayed until the temperature falls significantly below the equilibrium melting point. At that stage, nucleation occurs suddenly and at a limited number of sites, resulting in a rapid release of latent heat, known as recalescence. This abrupt thermal event, coupled with the restricted number of nucleation sites, leads to non-uniform grain growth—some grains become large and irregular, while others remain small. The outcome is an inhomogeneous microstructure with a wide distribution of grain sizes and orientations. Kang et al. [14] reported that in SAC solder systems, Ag3Sn and Cu6Sn5 IMCs nucleate at lower undercooling, whereas β-Sn requires substantially higher undercooling to initiate nucleation. This disparity promotes the formation of large, plate-like Ag3Sn IMCs within the liquid phase during cooling. Conversely, reducing the degree of undercooling minimizes the likelihood of recalescence, enabling solidification to occur closer to the equilibrium temperature. This promotes the formation of a more uniform and refined grain structure, resulting in finer Ag3Sn and Cu6Sn5 IMC phases and improved overall microstructural consistency.
In the development of lead-free solders, the addition of trace micro-alloying elements such as Bi, Co, In, Fe, Sb, Ni, and rare earth elements is a common approach to control solidification behavior, thereby enhancing overall solder performance [15]. These micro-additives frequently serve as heterogeneous nucleation sites for β-Sn, thereby reducing the undercooling required for nucleation and minimizing the occurrence of recalescence. The resulting microstructure is finer and more uniform, with consistent grain initiation. A refined microstructure, in turn, mitigates grain coarsening during thermal cycling, suppresses Cu dissolution, and limits the excessive growth of brittle IMLs—collectively improving the mechanical stability and long-term reliability of lead-free solder joints.
In this work, the microstructural and solidification behavior of the Co-, Ni-, and Ce- microalloyed variant of SAC305 solder were analyzed under slow cooling conditions. The total concentration of micro-additives (Co, Ni, and Ce) is below 500 ppm, although the exact proportions of these elements have not been disclosed [16]. Apart from the reported reduction in Cu and Fe dissolution rates—which extends the operational lifetime of the solder bath and soldering iron tip [17]—no publicly available data have been published regarding this specific alloy system. In the existing literature, the individual effects of Co, Ni, and Ce as microalloying elements in SAC-type solders have been investigated separately; however, limited information is available on their combined influence. This study therefore presents a comprehensive experimental analysis of the combined impact of these three micro-additives on undercooling, grain structure, IML morphology and thickness, as well as the formation of shrinkage cracks on the solder joint surface.

2. Materials and Methods

The microalloyed solder material investigated in this study was SAC305 + CoNiCe (Flowtin), supplied by Stannol (Velbert, North Rhine-Westphalia, Germany) in the form of a 3 mm diameter solid solder wire. As a reference material, conventional SAC305 solder was used, obtained from a 3 mm diameter solid solder wire (Vaculoy) supplied by MacDermid Alpha (Waterbury, CT, USA).

2.1. Chemical Composition

To determine the precise chemical composition of the microalloyed solder sample, a Spectrolab Optical Emission Spectroscopy (OES) at Metalloglobus Fémöntő, Budapest, Hungary was used to measure the Co and Ni contents. The values reported in Table 1 represent the arithmetic mean of four measurements. Since the instrument was not calibrated for Ce, its concentration in the solder could not be measured. Instead, the amount of Ce was estimated based on the reported value of 20 ppm in [18]. As a reference, the standardized composition of SAC305 solder is provided in Table 2 [19], together with the measured values from the Certificate of Analysis.

2.2. Thermal Behavior

Differential scanning calorimetry (DSC) measurements were performed using a Perkin Elmer DSC 8000 at Óbuda University to characterize the thermal behavior during melting and cooling. Samples were prepared by cutting pieces from a 3 mm diameter solder wire and cleaning them with an IPA wipe. The sample weights were 37.4 mg for SAC305 and 39.1 mg for SAC305 + CoNiCe.
The initial chamber temperature was set to 50 °C. The thermal cycle consisted of heating at a rate of 0.4 °C/s (24 °C/min) up to 260 °C, followed by a 1 min isothermal hold. Cooling was then carried out at 0.4 °C/s down to 140 °C, with another 1 min dwell at the end of cooling. The cycle was repeated once, enabling the characteristic transition points of the DSC curves for each alloy to be recorded twice.
Characteristic temperatures were extracted from the measured heat flow data: transformation onset, T o n , peak temperature, T p , transformation end, T e n d , the mushy range, T m u s h y , and the nucleation undercooling, T u c .
Nucleation undercooling, T u c , was calculated as the temperature difference between the melting onset temperature during heating ( T o n h e a t ) and solidification onset temperature during cooling ( T o n c o o l ), using the onset to inset method [12,20]:
T u c = T o n h e a t T o n c o o l
The mushy range, T m u s h y , was defined as the difference between the transformation end temperature and onset temperature during the heating and cooling cycle:
T m u s h y = T e n d T o n

2.3. Solidification Simulations

JMatPro simulation software (ver. 7.0.0) [21] was utilized to predict the prevailing solidification mechanisms during the cooling process. The spontaneity of a reaction is governed by the thermodynamic relationships between the elements. According to the second law of thermodynamics, the Gibbs free energy is expressed for constant temperature as:
G = H T · S
where G is the Gibbs free energy, H is the enthalpy, T is the absolute temperature, and S is the entropy. The driving force of a solidification process is the change in the Gibbs free energy (∆G). The Gibbs free energy of a system can be expressed as:
G = G I + G E
where G I is the ideal molar free energy, and G E is the excessive molar free energy. The latter describes the deviation of the system’s Gibbs free energy from ideal behavior. Both terms in Equation (4) can be calculated using the JmatPro software, according to the expressions defined in Equations (5) and (6):
G I = G 0 + G I = i X i · G i 0 + R · T · i X i · ln X i
G E = i j X i · X j · v Ω v · ( X i X j ) v
where X i is the molar fraction of composition i, G i 0 is the molar free energy of composition i, R is the universal gas constant, and Ω v is the interaction parameter [22,23].
The JMatPro database does not include Co and Ce as microalloying elements, however, the effect of Ni doping on the SAC305 nominal composition can be simulated. The Ni content in a range of 0–0.05 wt% was added to the SAC305 nominal composition, and the solidification sequence was evaluated.

2.4. Low Cooling Rate Experiment

Solder specimens of SAC305 + CoNiCe were prepared by cutting approximately 10 mm long sections of a wire. Prior to soldering, the Cu substrates (1 mm thick and 10 mm wide) were cleaned with isopropyl alcohol (IPA) to remove surface contaminants, and a rosin-based water-soluble flux was applied to the surface. The samples were then placed on the Cu substrates and heated on a laboratory hotplate up to a temperature of 265 °C, while the temperature of the Cu substrate was continuously monitored using a thermal profiler equipped with K-type thermocouples. The selected temperature corresponds to a typical solder bath condition employed in wave soldering processes. Upon complete melting of the solder, the heating was switched off, allowing the specimens to cool naturally together with the hotplate at a cooling rate of 0.4 °C/s within the temperature range of 230 °C to 200 °C. This relatively slow cooling rate was deliberately chosen to promote of CoNiCe microalloying effects on the solidification microstructure, enabling direct comparison with reference data obtained from the base SAC305 solder [7]. Separate solder samples were fabricated for X-ray computed tomography (XCT) and scanning electron microscopy (SEM) analyses.
The SAC305 + CoNiCe solder specimens were examined using XCT to detect and characterize shrinkage-related surface defects, such as shrinkage holes (hot-tears). The scanning parameters and analysis conditions are summarized in Table 3.
For IML thickness, SEM image analyses were performed using the Fiji (ImageJ, version 2.14.0/1.54j) software. The pitch distance between the measurements was 2 μm. Altogether, 40 data points were measured across the 80 μm wide image.
The average grain size of β-Sn was determined from SEM images captured at a magnification of 1000×. Individual grains were manually delineated using the image analysis software. The average grain area was calculated from measurements of 100 grains for both the SAC305 and SAC305 + CoNiCe solders.
The total area of β-Sn grains was also measured within a randomly selected region of an SEM image acquired at 1000× magnification, located near the IML. The analyzed region covered an area of 30,000 μm2 ( A t o t a l ), defined as the sum of the eutectic area ( A e u ) and the β-Sn area ( A β S n ). The eutectic fraction F e u was calculated as the ratio of the eutectic area ( A e u ) to the total β-Sn area ( A t o t a l ), according to Equation (7):
F e u = A e u A t o t a l · 100 % = A e u A e u + A β S n · 100 %

3. Results and Discussion

3.1. Undercooling

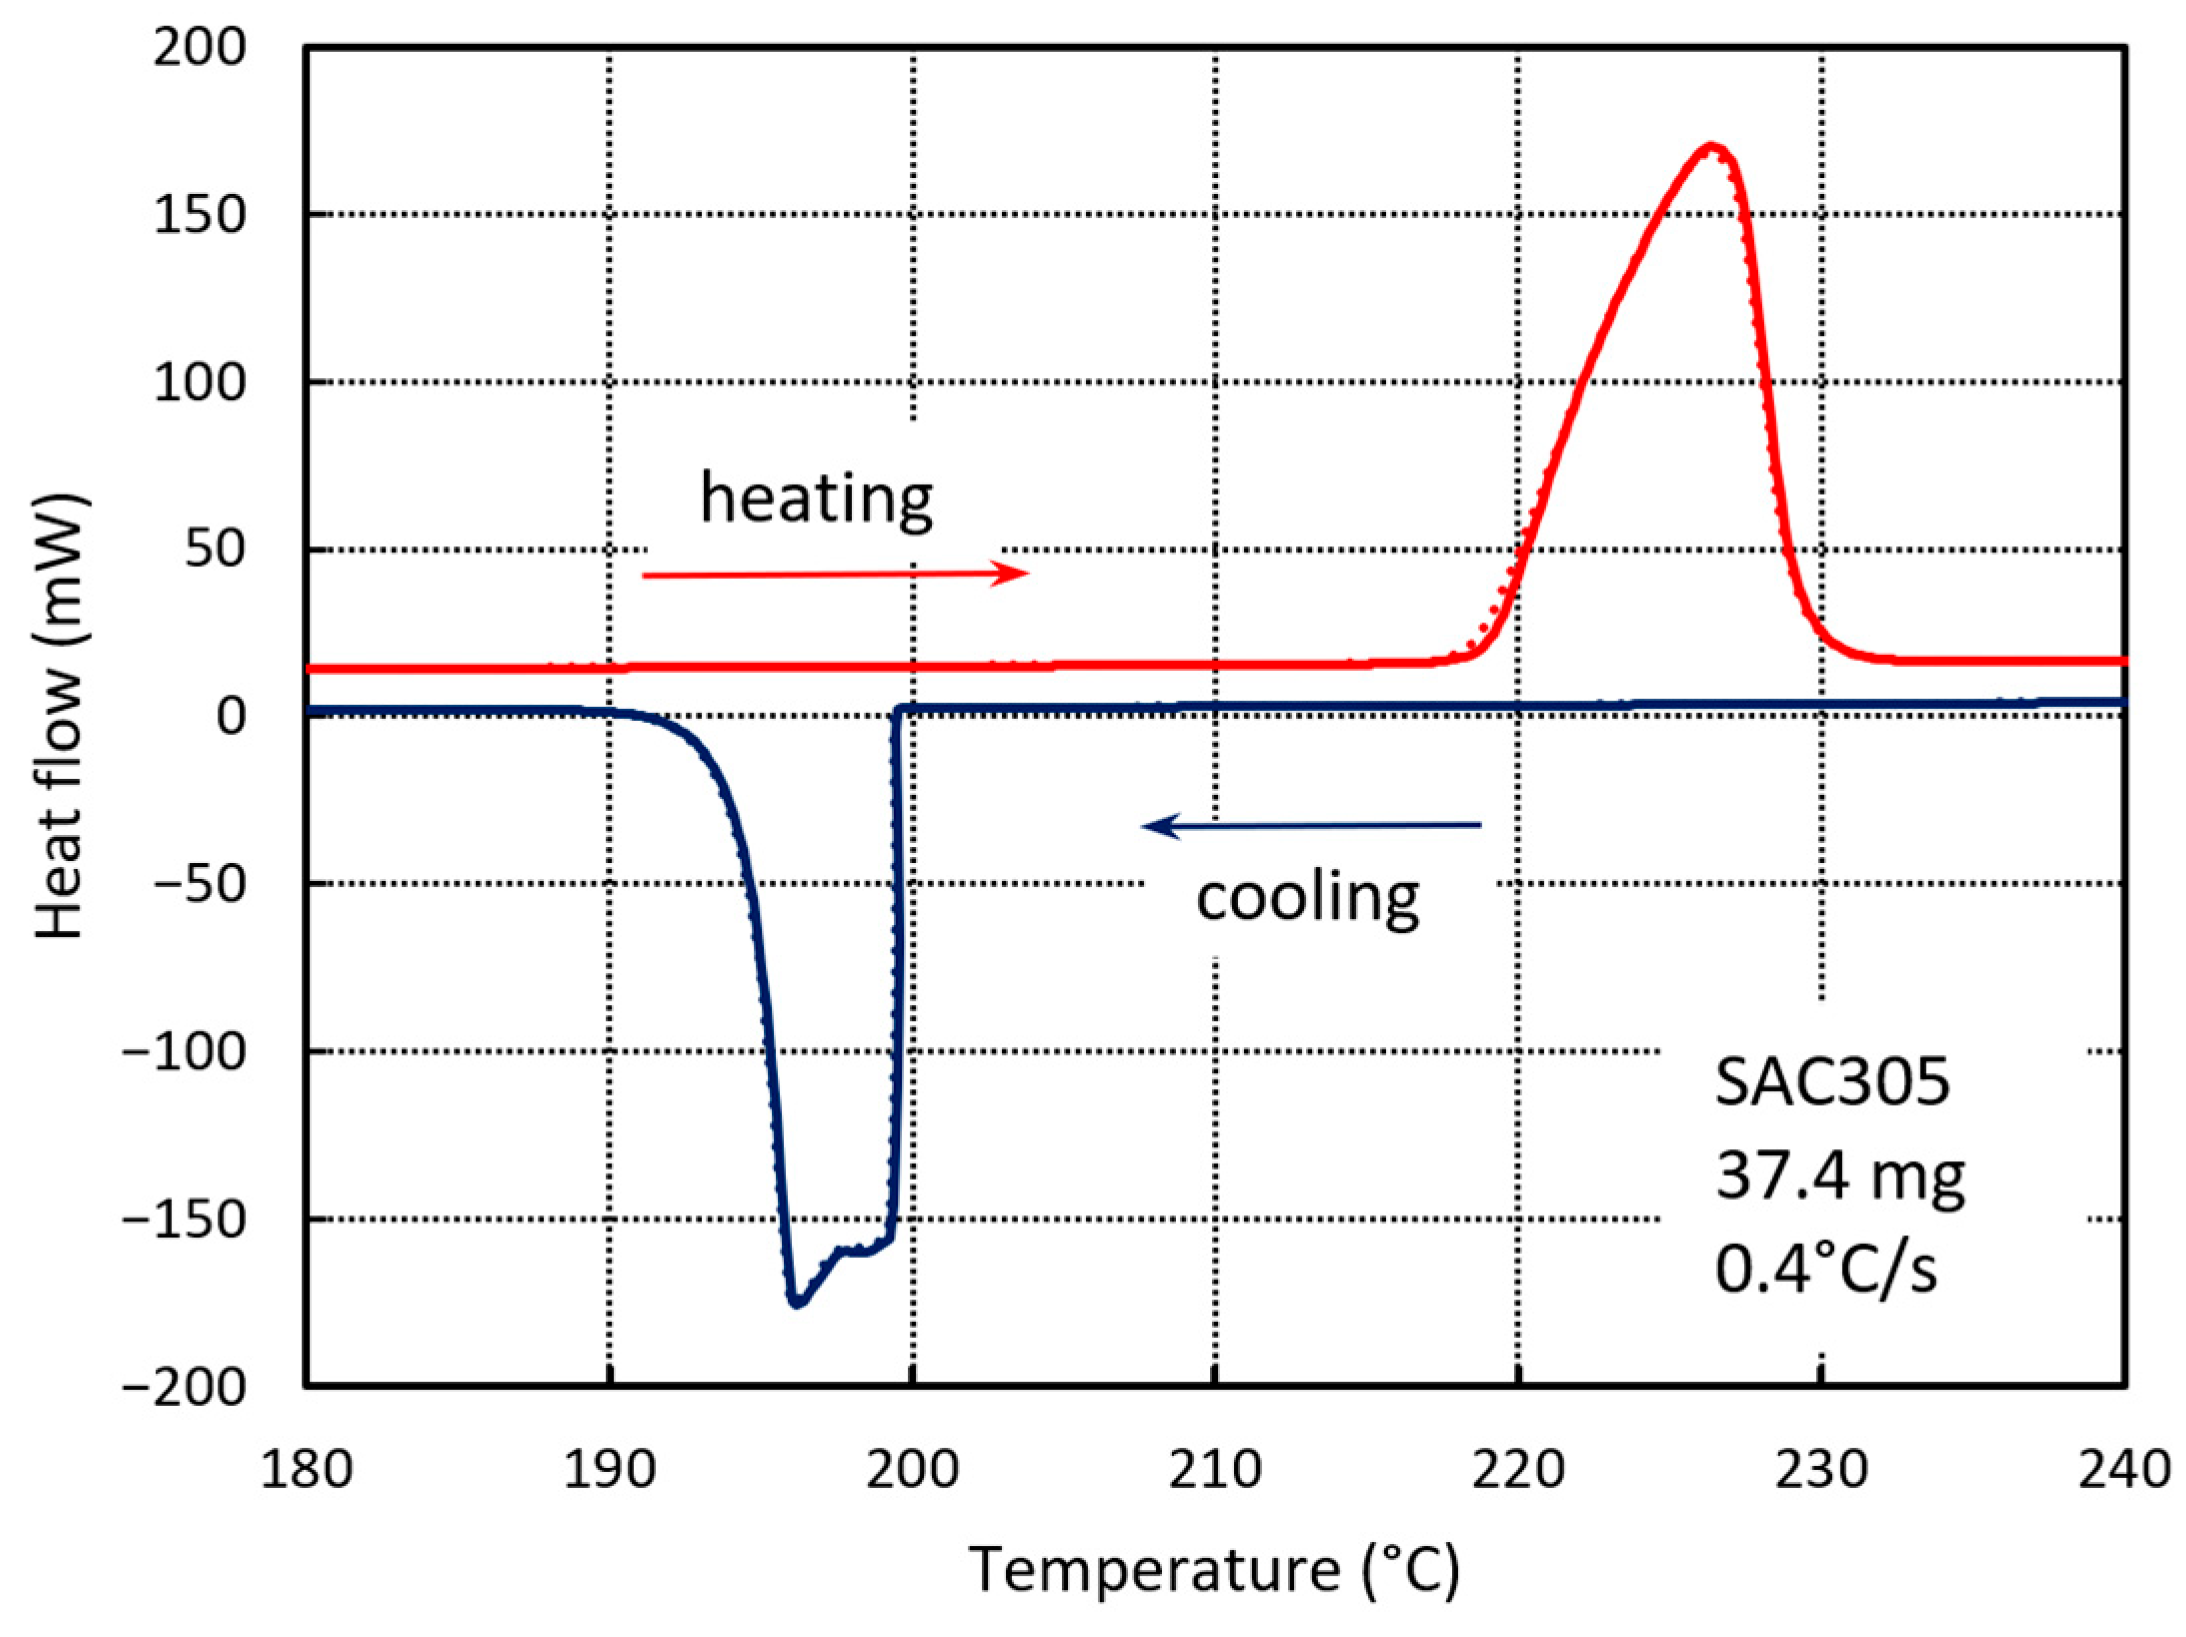
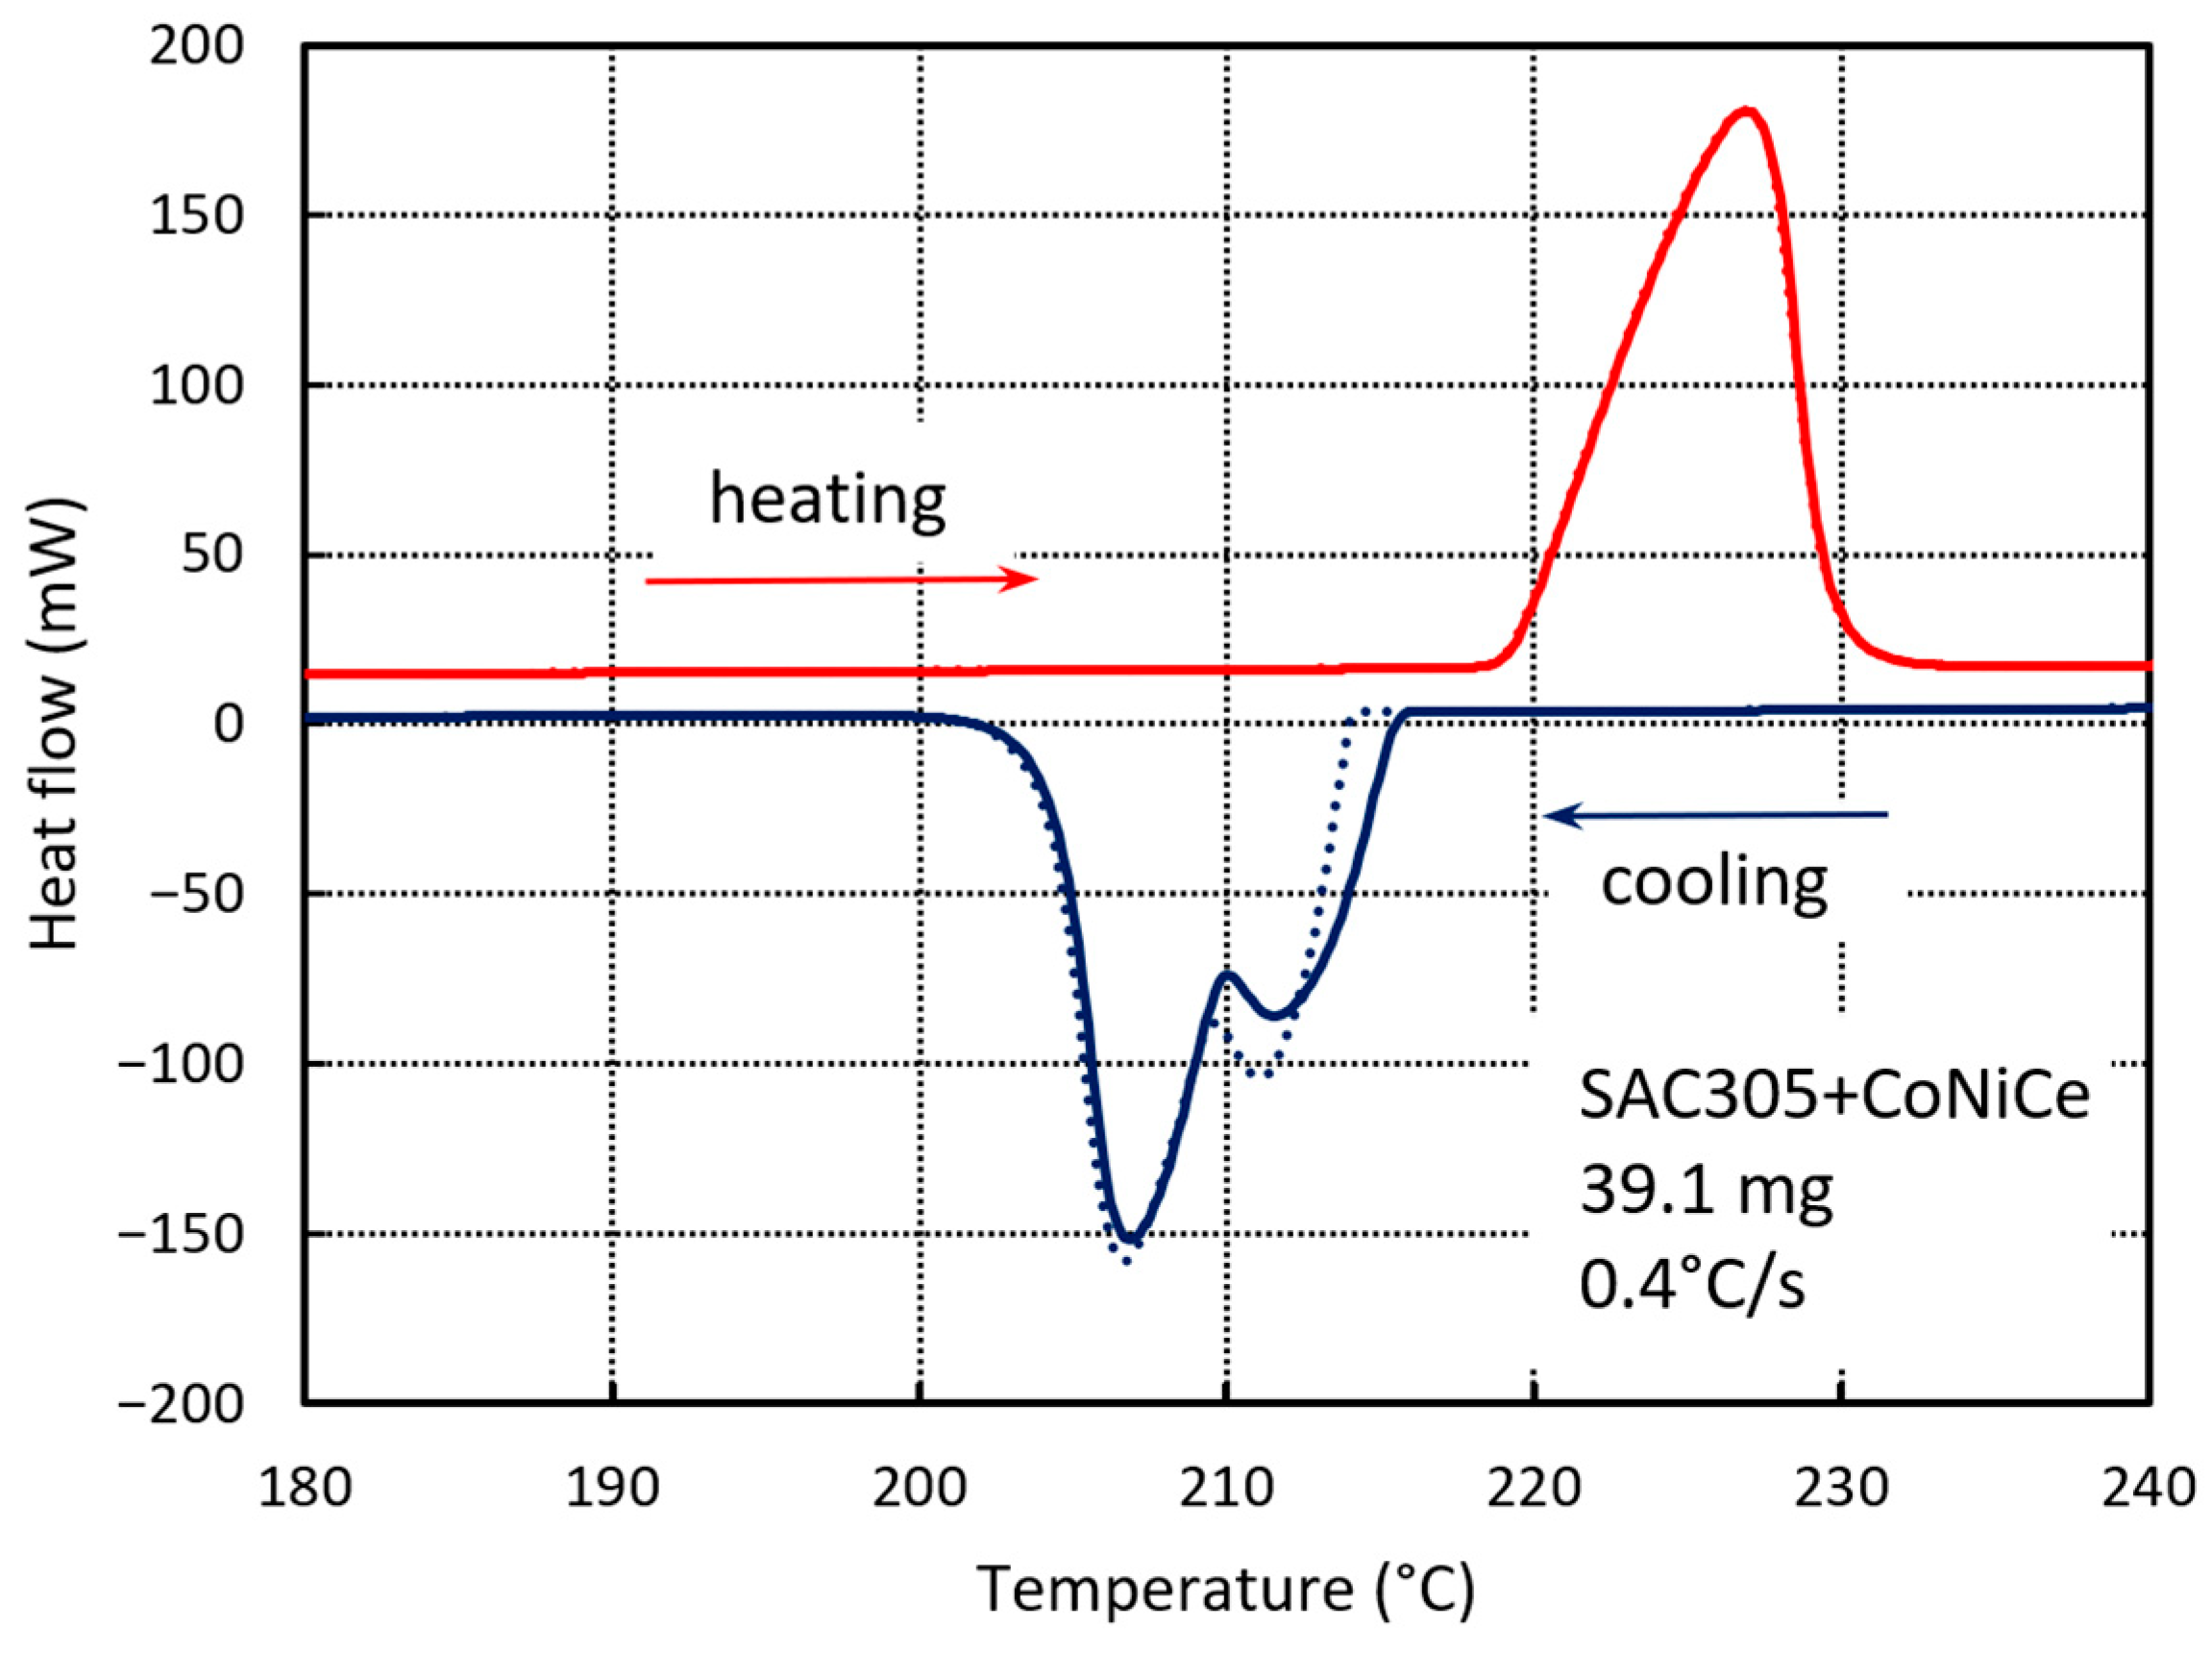
Resulting heat flow curves are shown in Figure 1 and Figure 2 for the SAC305 and SAC305 + CoNiCe solder samples, respectively. Distinct peaks were detected during both heating and cooling. Both alloys exhibited similar endothermic peaks at approximately 226.6 ± 0.3 °C during heating. The mushy range of the SAC305 + CoNiCe alloy was marginally wider—by about 0.5 °C—than that of SAC305, indicating that the addition of Co, Ni, and Ce did not cause significant changes in the melting reactions. In contrast, more pronounced differences appeared during cooling. Both the SAC305 and SAC305 + CoNiCe alloys showed two exothermic peaks with comparable temperature separations of 2.0 °C and 4.5 °C, respectively. However, a notable shift of approximately 15.35 ± 0.75 °C was observed in the T o n c o o l of the SAC305 + CoNiCe alloy toward higher temperatures compared with SAC305. This indicates that the microalloying elements (Co, Ni, and Ce) significantly suppress undercooling. The characteristic temperatures of DSC measurements for both alloys are summarized in Table 4.
Controlling the solidification behavior of the solder is a key factor in ensuring reliable solder joint microstructures, as the excessive formation of large and brittle IMCs must be avoided. The degree of undercooling is directly related to the energy barrier for the nucleation of solid crystallization sites in the molten solder. In general, higher undercooling accelerates grain growth once nucleation begins, which may promote the formation of long β-Sn dendrites and a non-uniform microstructure. Conversely, lower undercooling promotes improved grain morphology by suppressing excessive dendritic growth. This reduction in undercooling also decreases the likelihood of soldering defects such as voids and cracks, thereby ensuring more consistent solder joint quality.
In the present study, two distinct exothermic peaks were observed in the DSC curves of both SAC305 and SAC305 + CoNiCe alloys, corresponding to the sequential crystallization of β-Sn and IMC phases. Since β-Sn typically requires greater undercooling to initiate nucleation compared with Ag3Sn [14], its solidification is associated with a substantial quantity of latent heat release, observed as a pronounced exothermic peak. The solidification sequence of SAC305 at high undercooling can be summarized as follows: dendritic growth of primary β-Sn, followed by the monovariant β-Sn + Ag3Sn reaction, and finally the β-Sn + Ag3Sn + Cu6Sn5 solidification [24]. The first DSC peak therefore corresponds to the formation of primary β-Sn, while the second peak represents the concurrent solidification of β-Sn, Ag3Sn, and Cu6Sn5 phases during the final eutectic reaction.
The measured undercooling of SAC305 was 19.6 °C, whereas for SAC305 + CoNiCe it decreased significantly to 4.35 ± 0.75 °C. As (Cu,Co)6Sn5 and (Cu,Ni)6Sn5 IMCs can act as potent heterogeneous nucleation sites [25,26,27,28] promoting β-Sn nucleation, accelerating solidification, and thereby reducing the time available for β-Sn and IMC growth. This process results in a finer and more uniform grain structure.
Small additions of Co (0.2–0.5 wt%) are highly effective in reducing undercooling [29], whereas Ni alone (0.05–0.1 wt%) has a less pronounced effect. However, when applied simultaneously, Co and Ni exhibit a synergistic effect, enhancing nucleation efficiency and refining β-Sn grain size. The lower undercooling observed in the SAC305 + CoNiCe solder therefore indicates the presence of a greater number of nucleation sites, leading to homogeneous nucleation at a lower growth rate, since the driving force is reduced at smaller undercooling values. These conditions promote the formation of a finer and more uniform microstructure in SAC305 + CoNiCe compared to conventional SAC305 solder. Small additions of Ce at 60–200 ppm can significantly reduce undercooling [30,31] from 26.2 °C to 10 °C in SAC305. In the present study, the Ce microalloying content in SAC305 + CoNiCe was approximately 20 ppm, yet a notable refinement effect was still evident. While Ce does not directly form a distinct Cu-Ce-Sn IMC, its presence influences the nucleation and growth behavior of existing IMCs, thereby contributing to an improved and more homogeneous joint microstructure. Microalloying can explain the decreased undercooling, leading to the presence of two exothermic peaks on the DSC, and the broader mushy range observed for the SAC305 + CoNiCe alloy.

3.2. Solidification Sequence

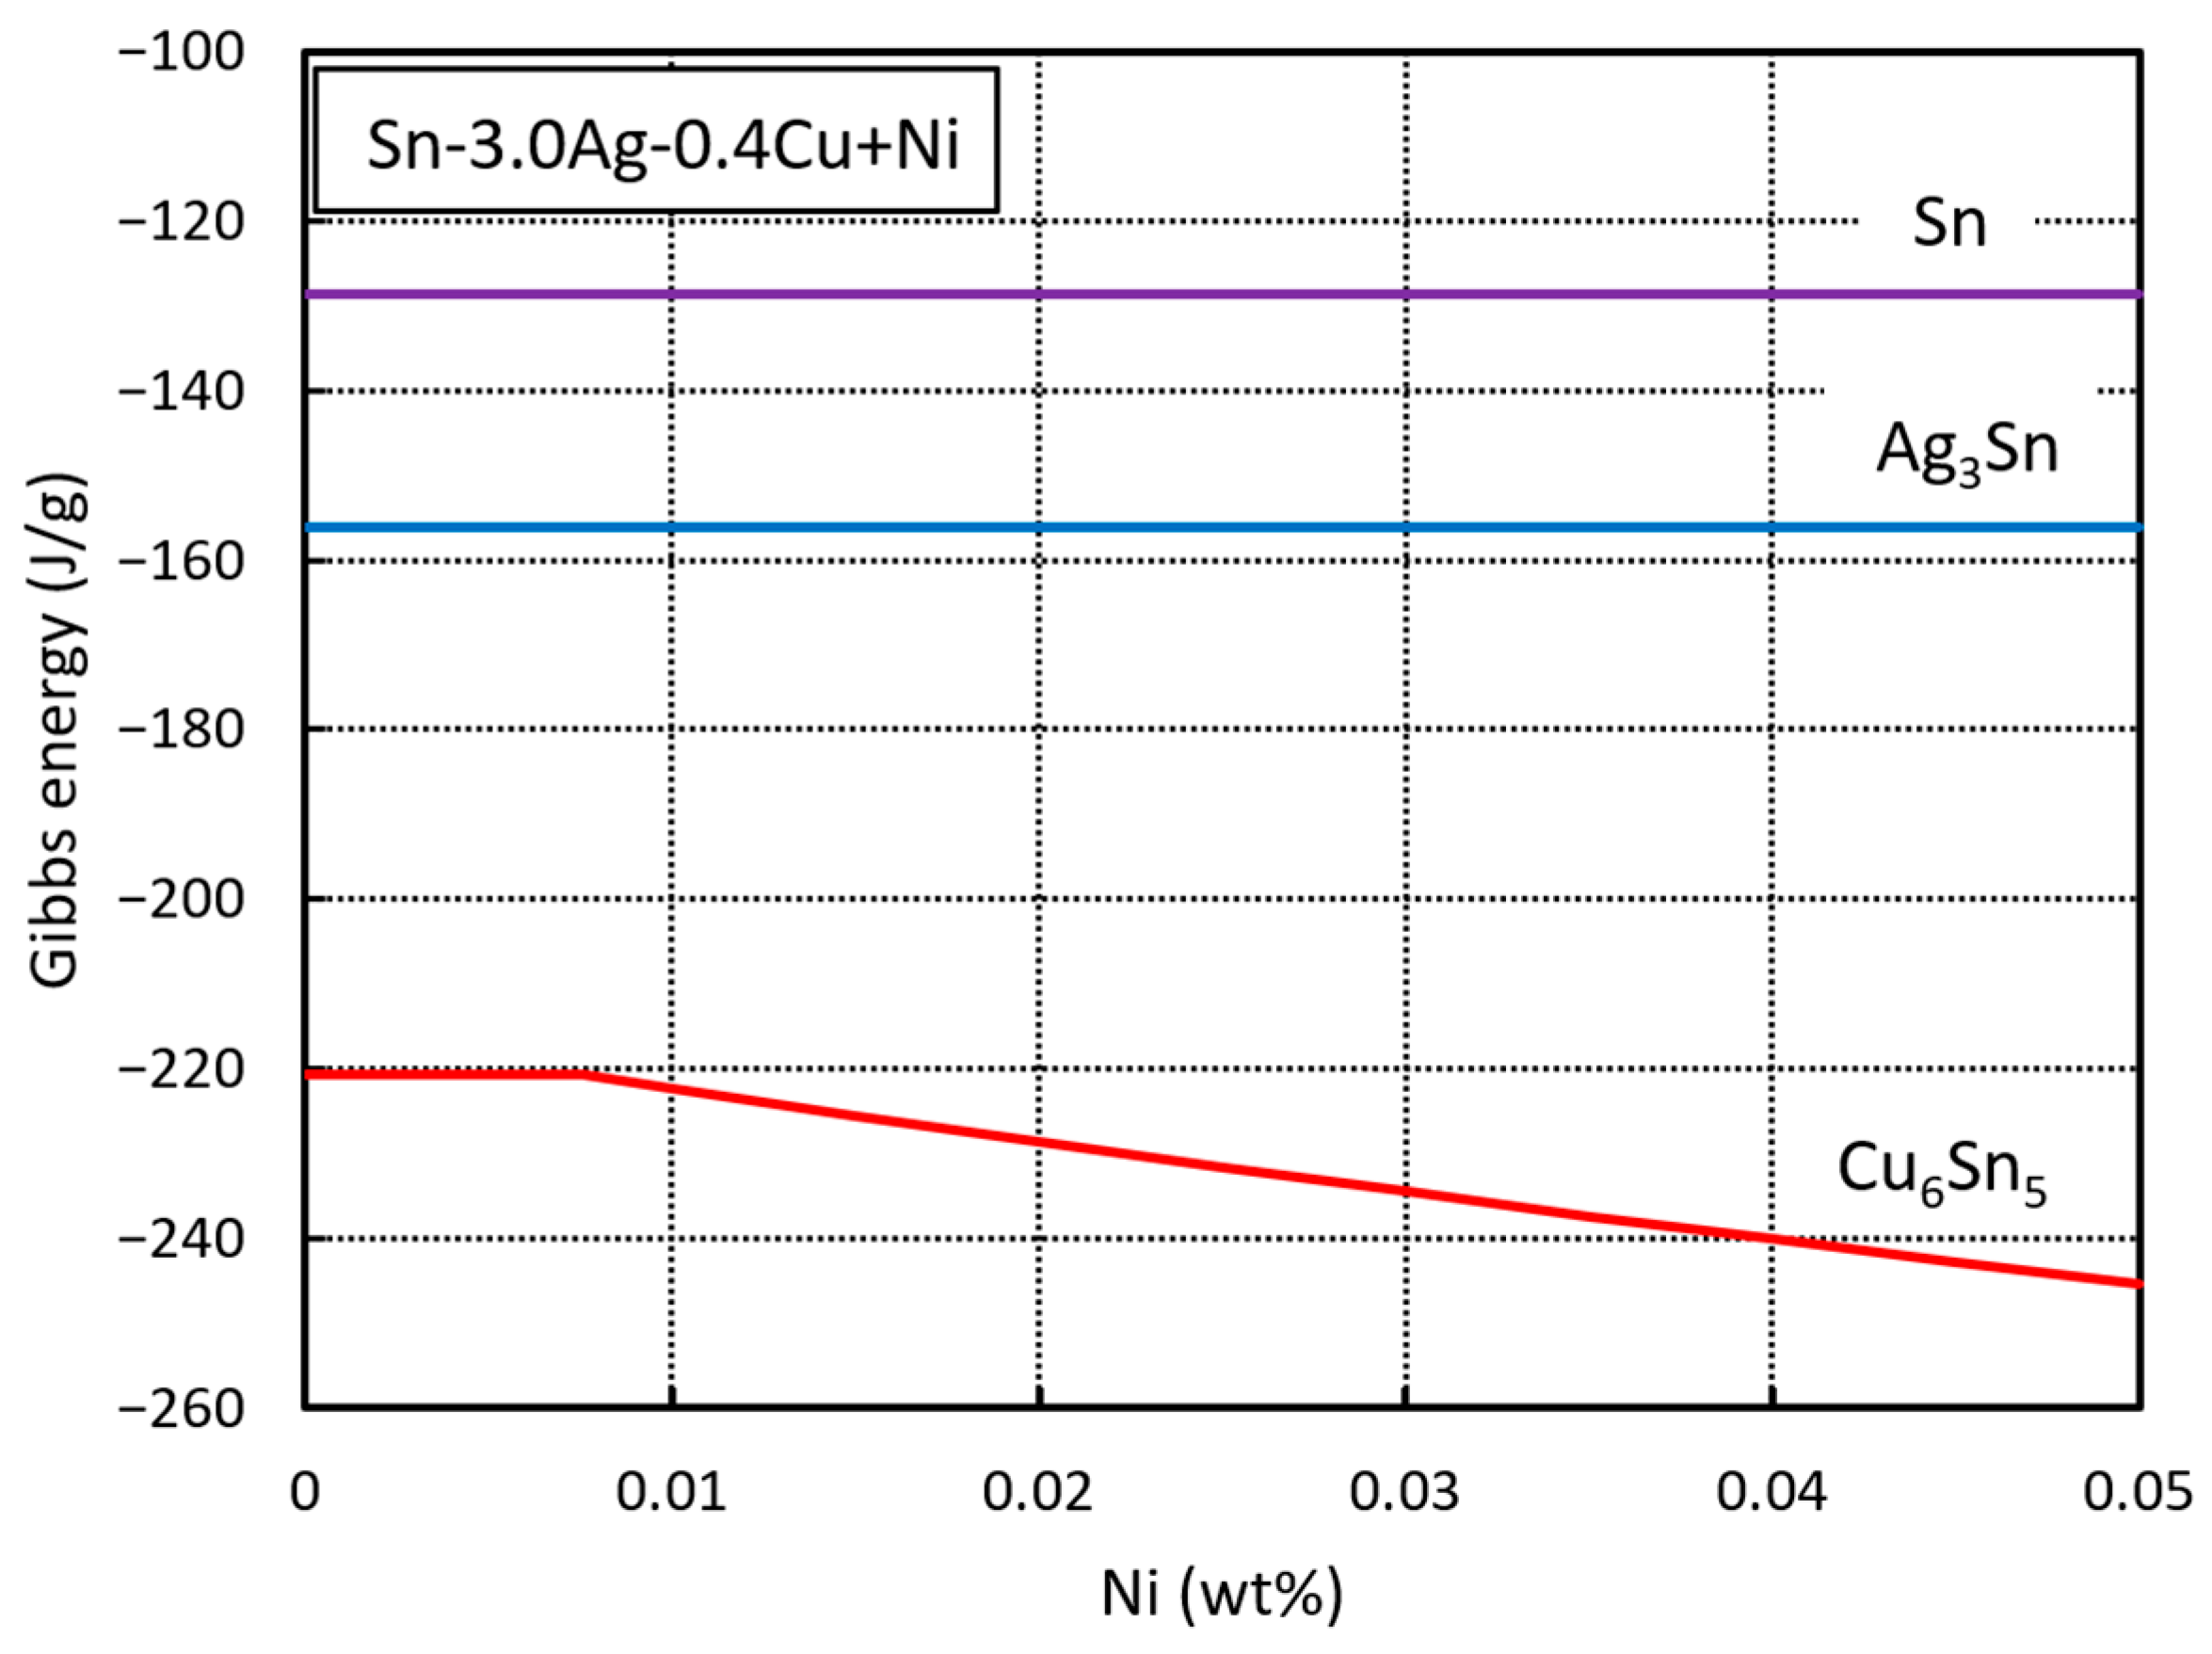
Figure 3 illustrates the Gibbs free energy of the various phases formed during the solidification of the SAC305 + xNi solder alloys, as a function of Ni concentration up to 0.05 wt%. The results are given for 25 °C.
The simulation results indicate that the elemental fraction of β-Sn phase and Ag3Sn IMC exhibits stable Gibbs free energy values of −128.54 J/g, and −156.2 J/g, respectively. Furthermore, the Gibbs free energy of Cu6Sn5 IMC decreases from −220.66 J/g to −245.32 J/g as the Ni concentration increases up to 0.05 wt%. This predicted reduction in Gibbs free energy may be attributed to the ability of Ni atoms to substitute Cu atoms within the Cu6Sn5 lattice. The calculated phase crystallization temperatures are summarized in Table 5 and the primary phase is highlighted with a gray background. The simulation results also show an increasing mushy range with the increasing Ni content.
The simulation provided the phase crystallization sequence during cooling of the undoped SAC305 as primary β-Sn, monovariant β-Sn + Ag3Sn, and finally, the remaining liquid solidifies as a eutectic composition (β-Sn + Ag3Sn + Cu6Sn5). The SAC305 alloy thus exhibits a typical hypoeutectic microstructure characterized by primary β-Sn and varying amounts and types of eutectic structures, consistent with the Sn-Ag-Cu phase diagram [32]. Intermetallic Cu6Sn5 exists in two allotropic forms: the stable high-temperature hexagonal structure (η-phase) above 186 °C, and the stable low-temperature monoclinic structure (η′-phase) below 186 °C [33], both captured by the simulation.
With increasing Ni concentration, the alloy composition shifts toward a hypereutectic region, while the hexagonal lattice structure of Cu6Sn5 becomes stabilized. Simulation results in Table 5 indicate that even low Ni addition (≈100 ppm) is sufficient to stabilize the Cu6Sn5 intermetallic compound and alter its transformation temperature from approximately 186 °C down to −5 °C. Exceeding 250 ppm of Ni, the resulting microstructure consists of primary Cu6Sn5 IMCs and β-Sn + Ag3Sn monovariant phases, with varying types and quantities of eutectics. Since Cu6Sn5 IMCs begin crystallizing at higher temperatures, the mushy range consequently becomes wider.

3.3. Shrinkage Defects

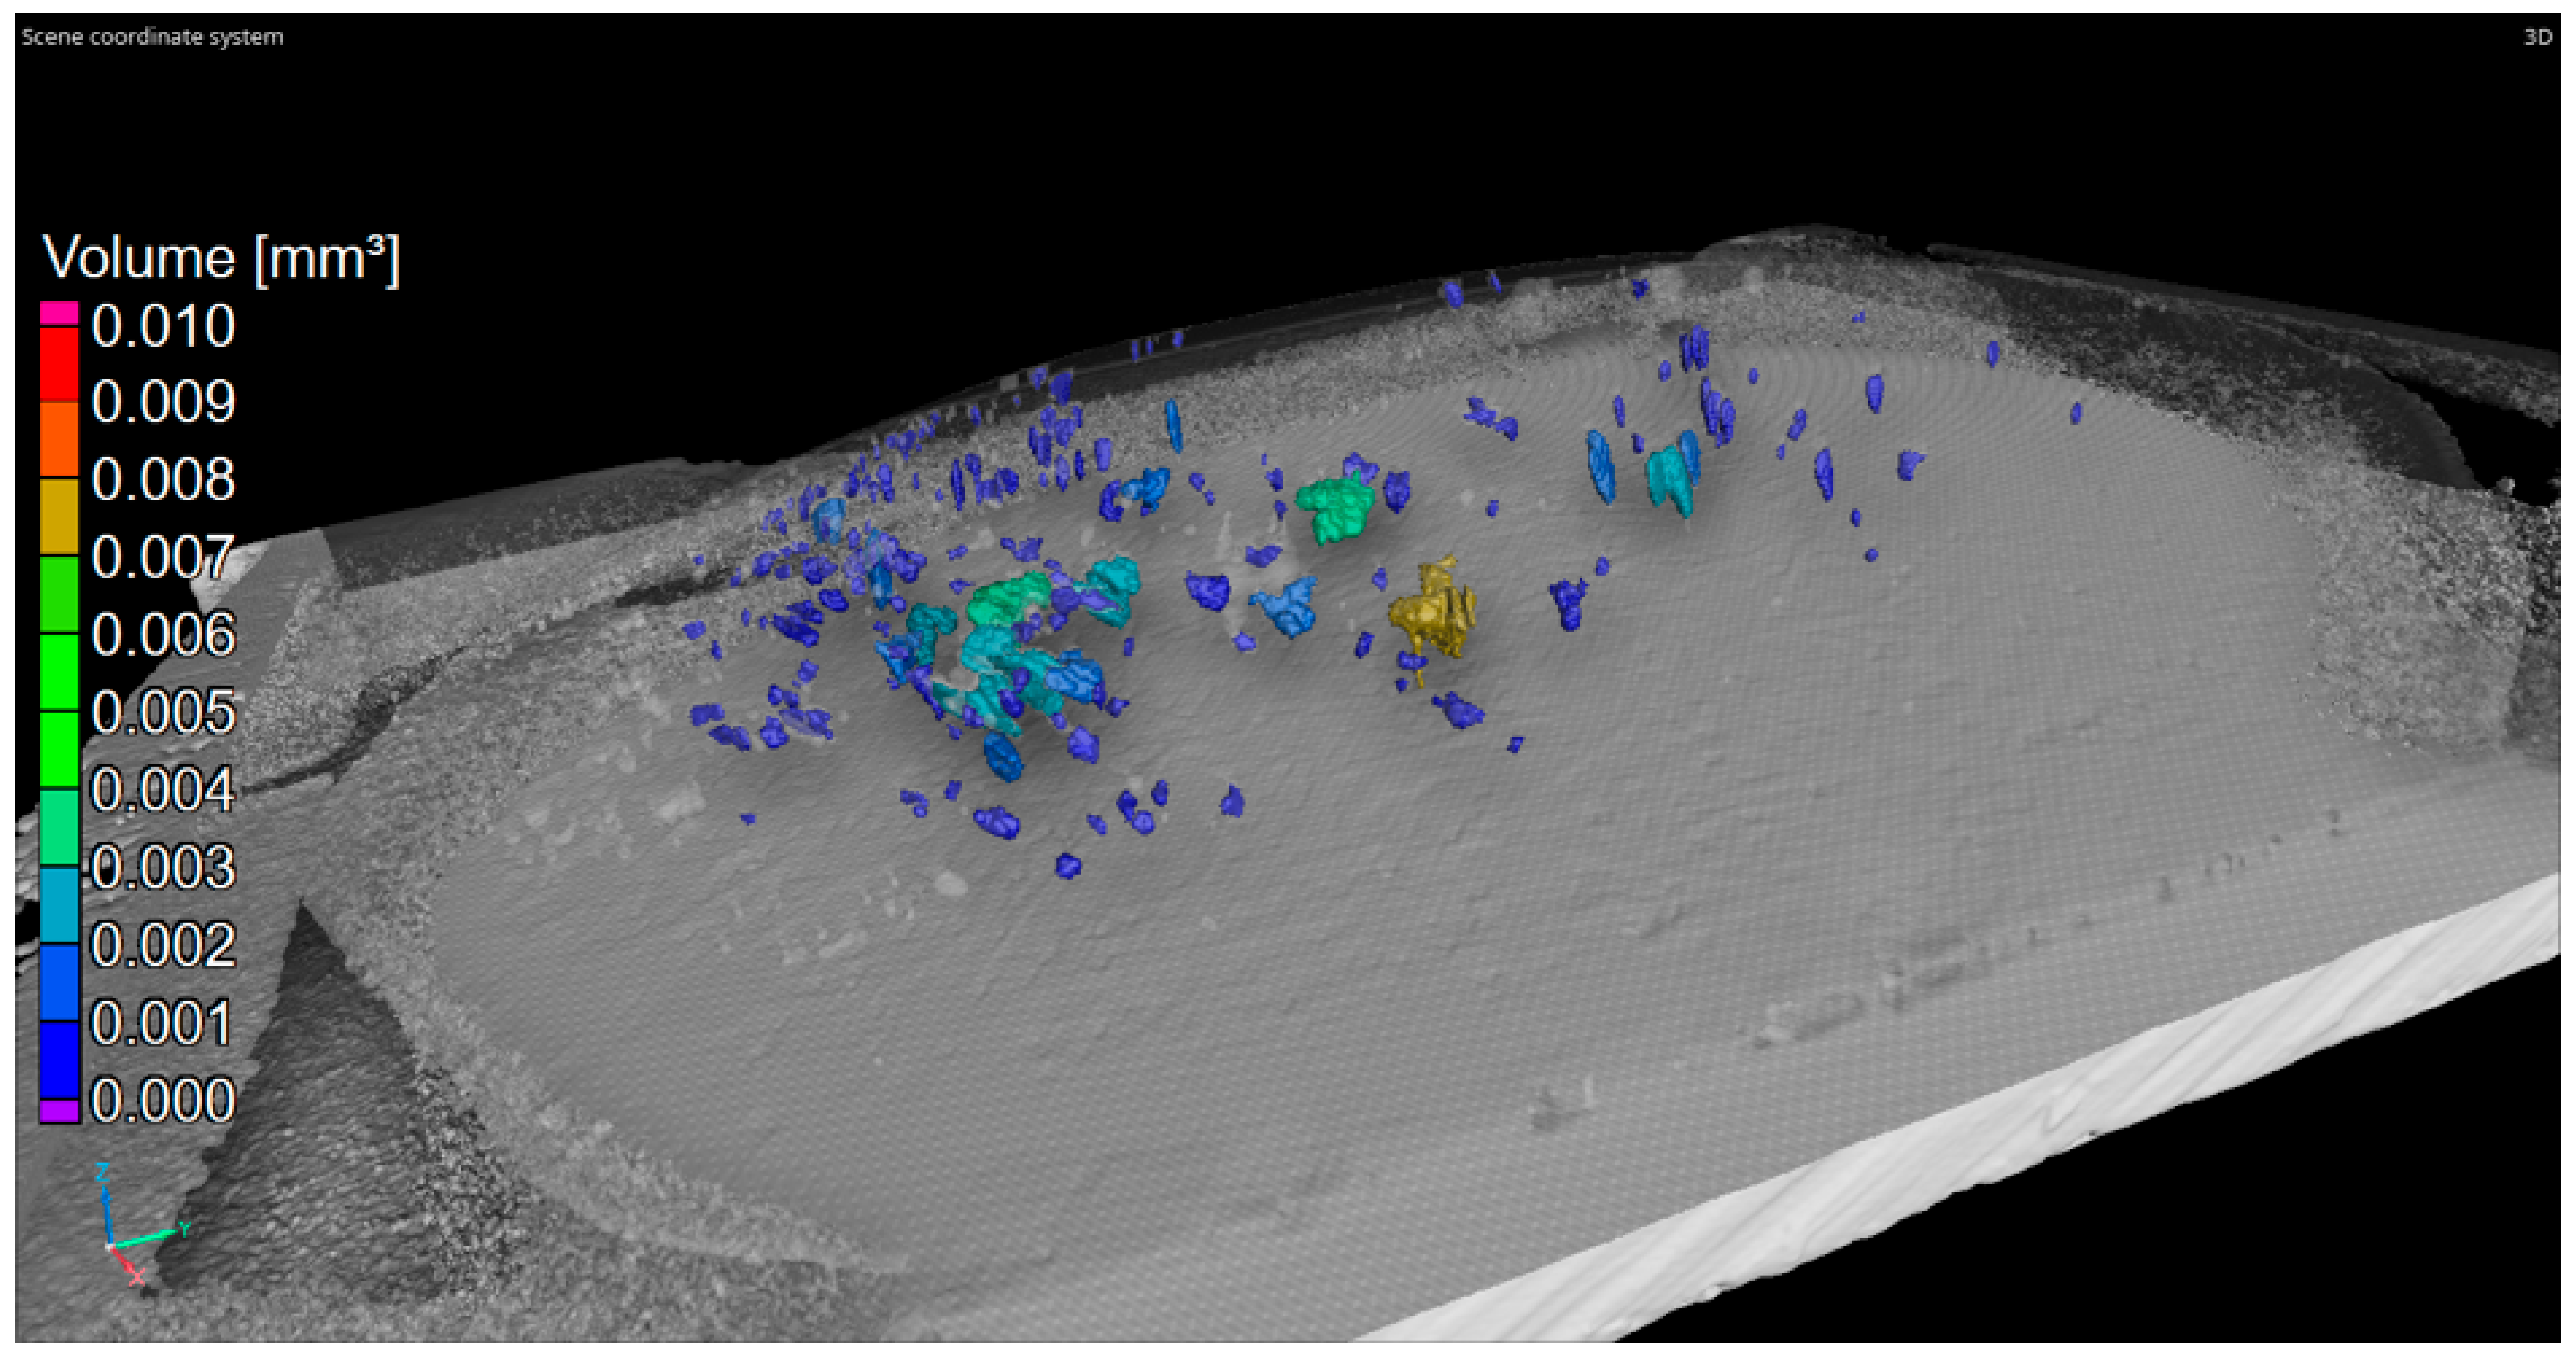
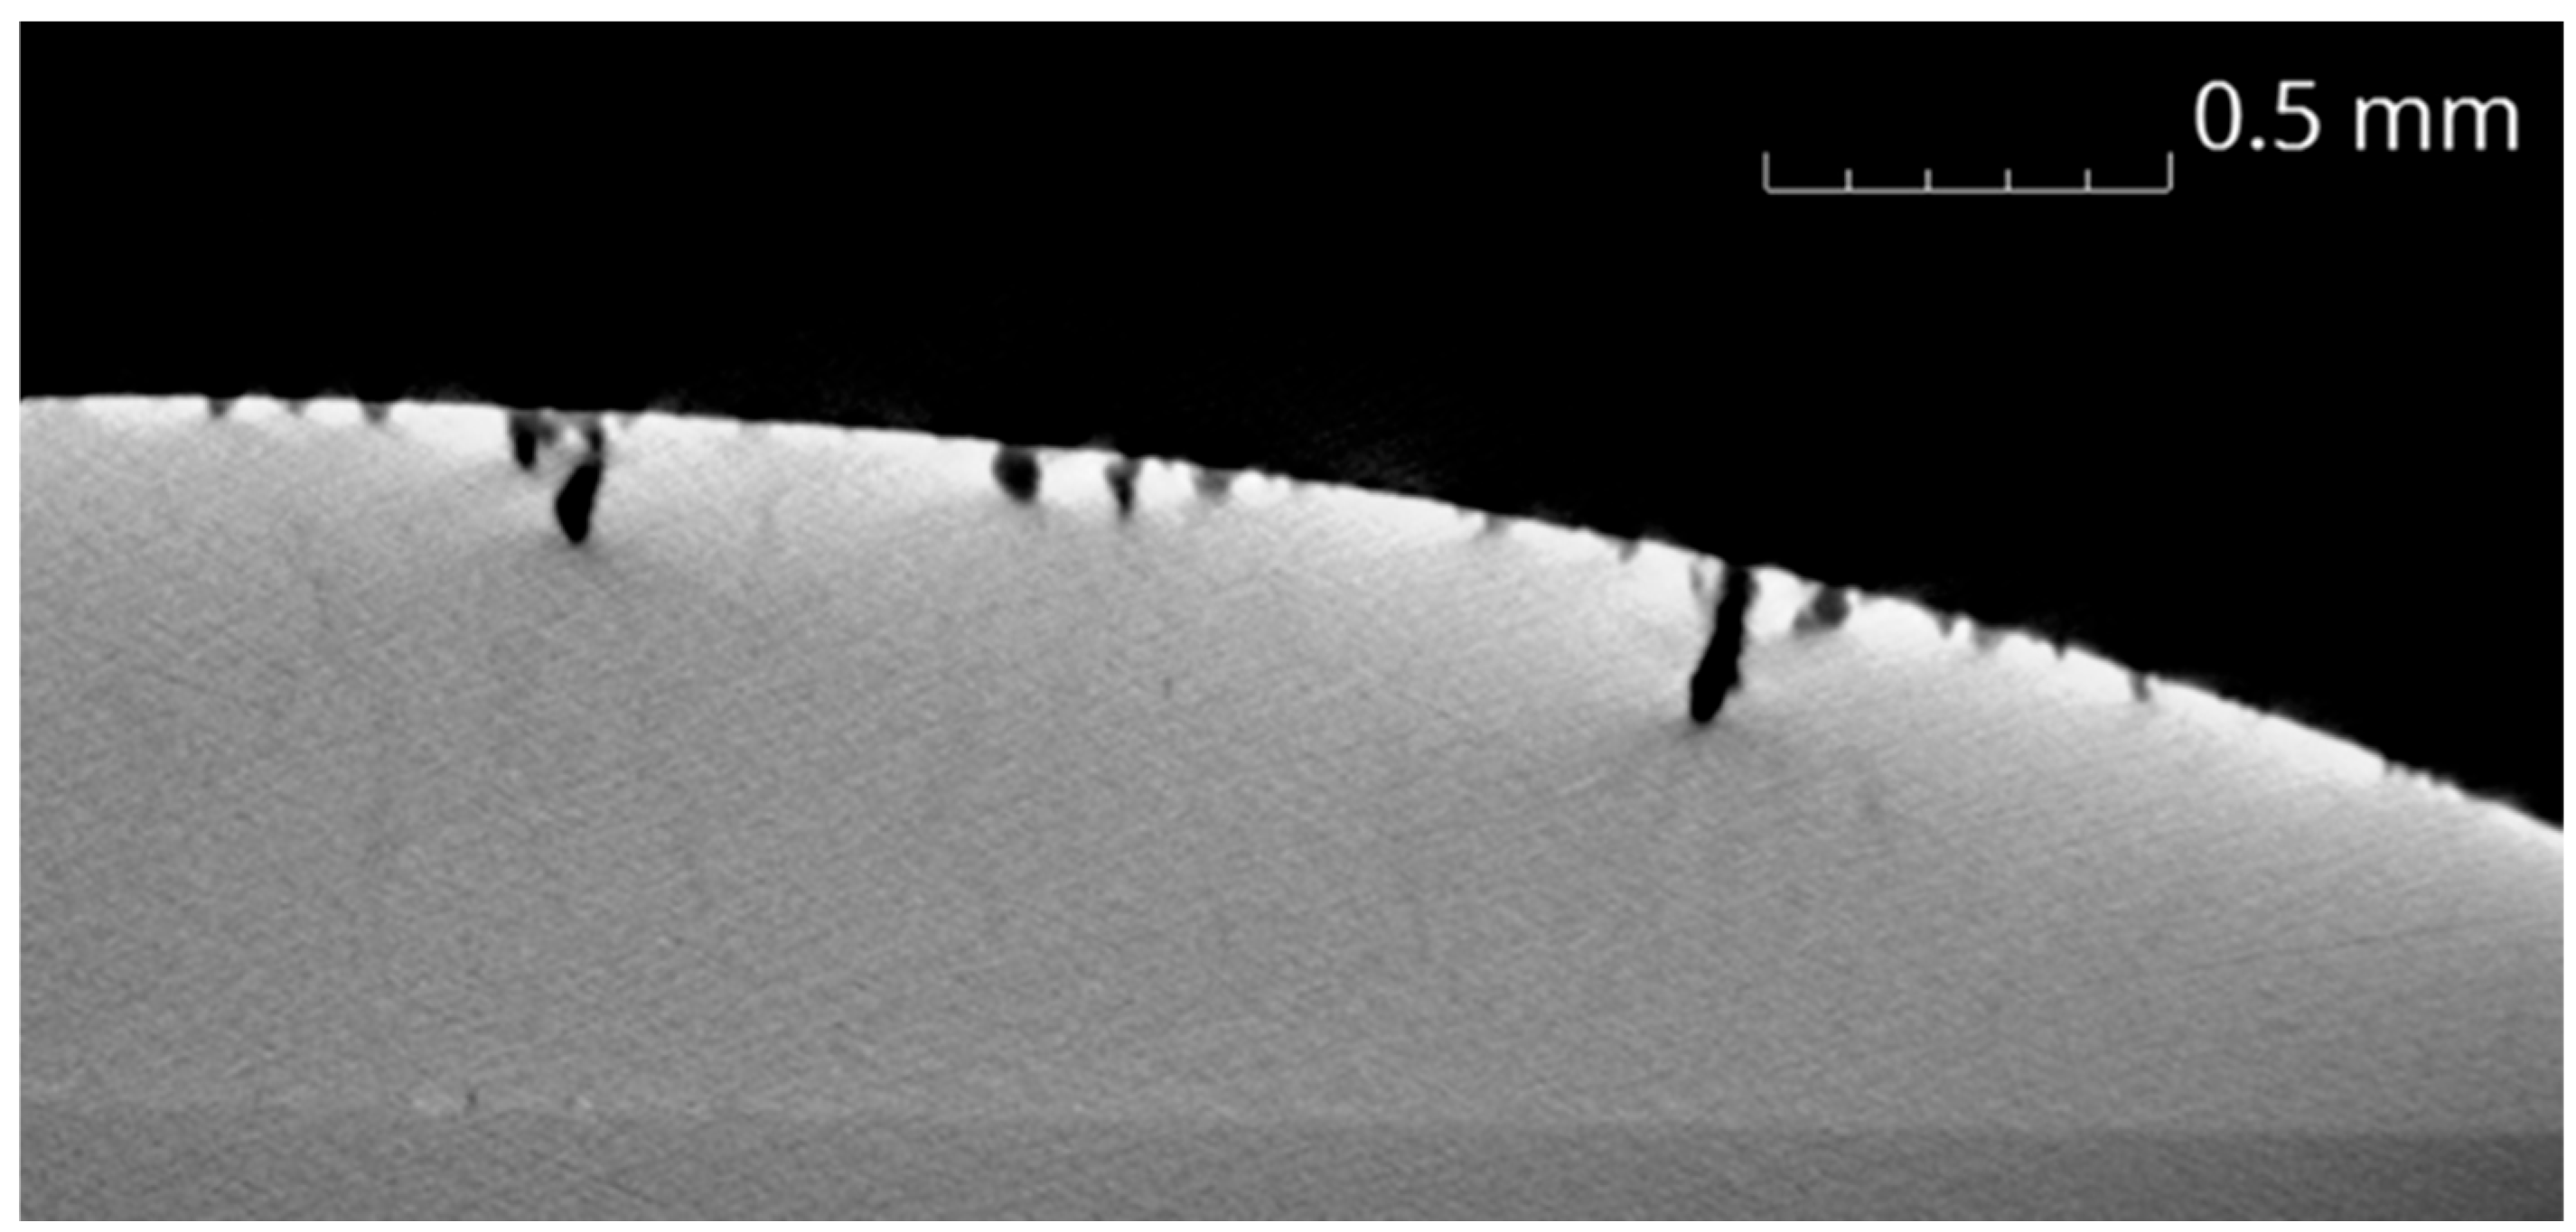
During the quantitative analysis, only surface shrinkage cracks were quantified for the SAC305 + CoNiCe alloy. Internal voids originating from the volatilization of flux constituents were excluded from the calculations. The results of the porosity and inclusion analyses are presented in Figure 4 and Figure 5, and Table 6. The obtained data were directly compared with reference measurements for the microalloy-free SAC305 solder we published in an earlier report [6]. Although approximately 60% more shrinkage cracks were detected on the surface of the CoNiCe-microalloyed solder, the overall shrinkage crack-to-material volume ratio was found to be nearly four times lower than that of the SAC305 reference alloy. This indicates that large shrinkage voids occur significantly less frequently in the SAC305 + CoNiCe solder compared to the base SAC305 composition.
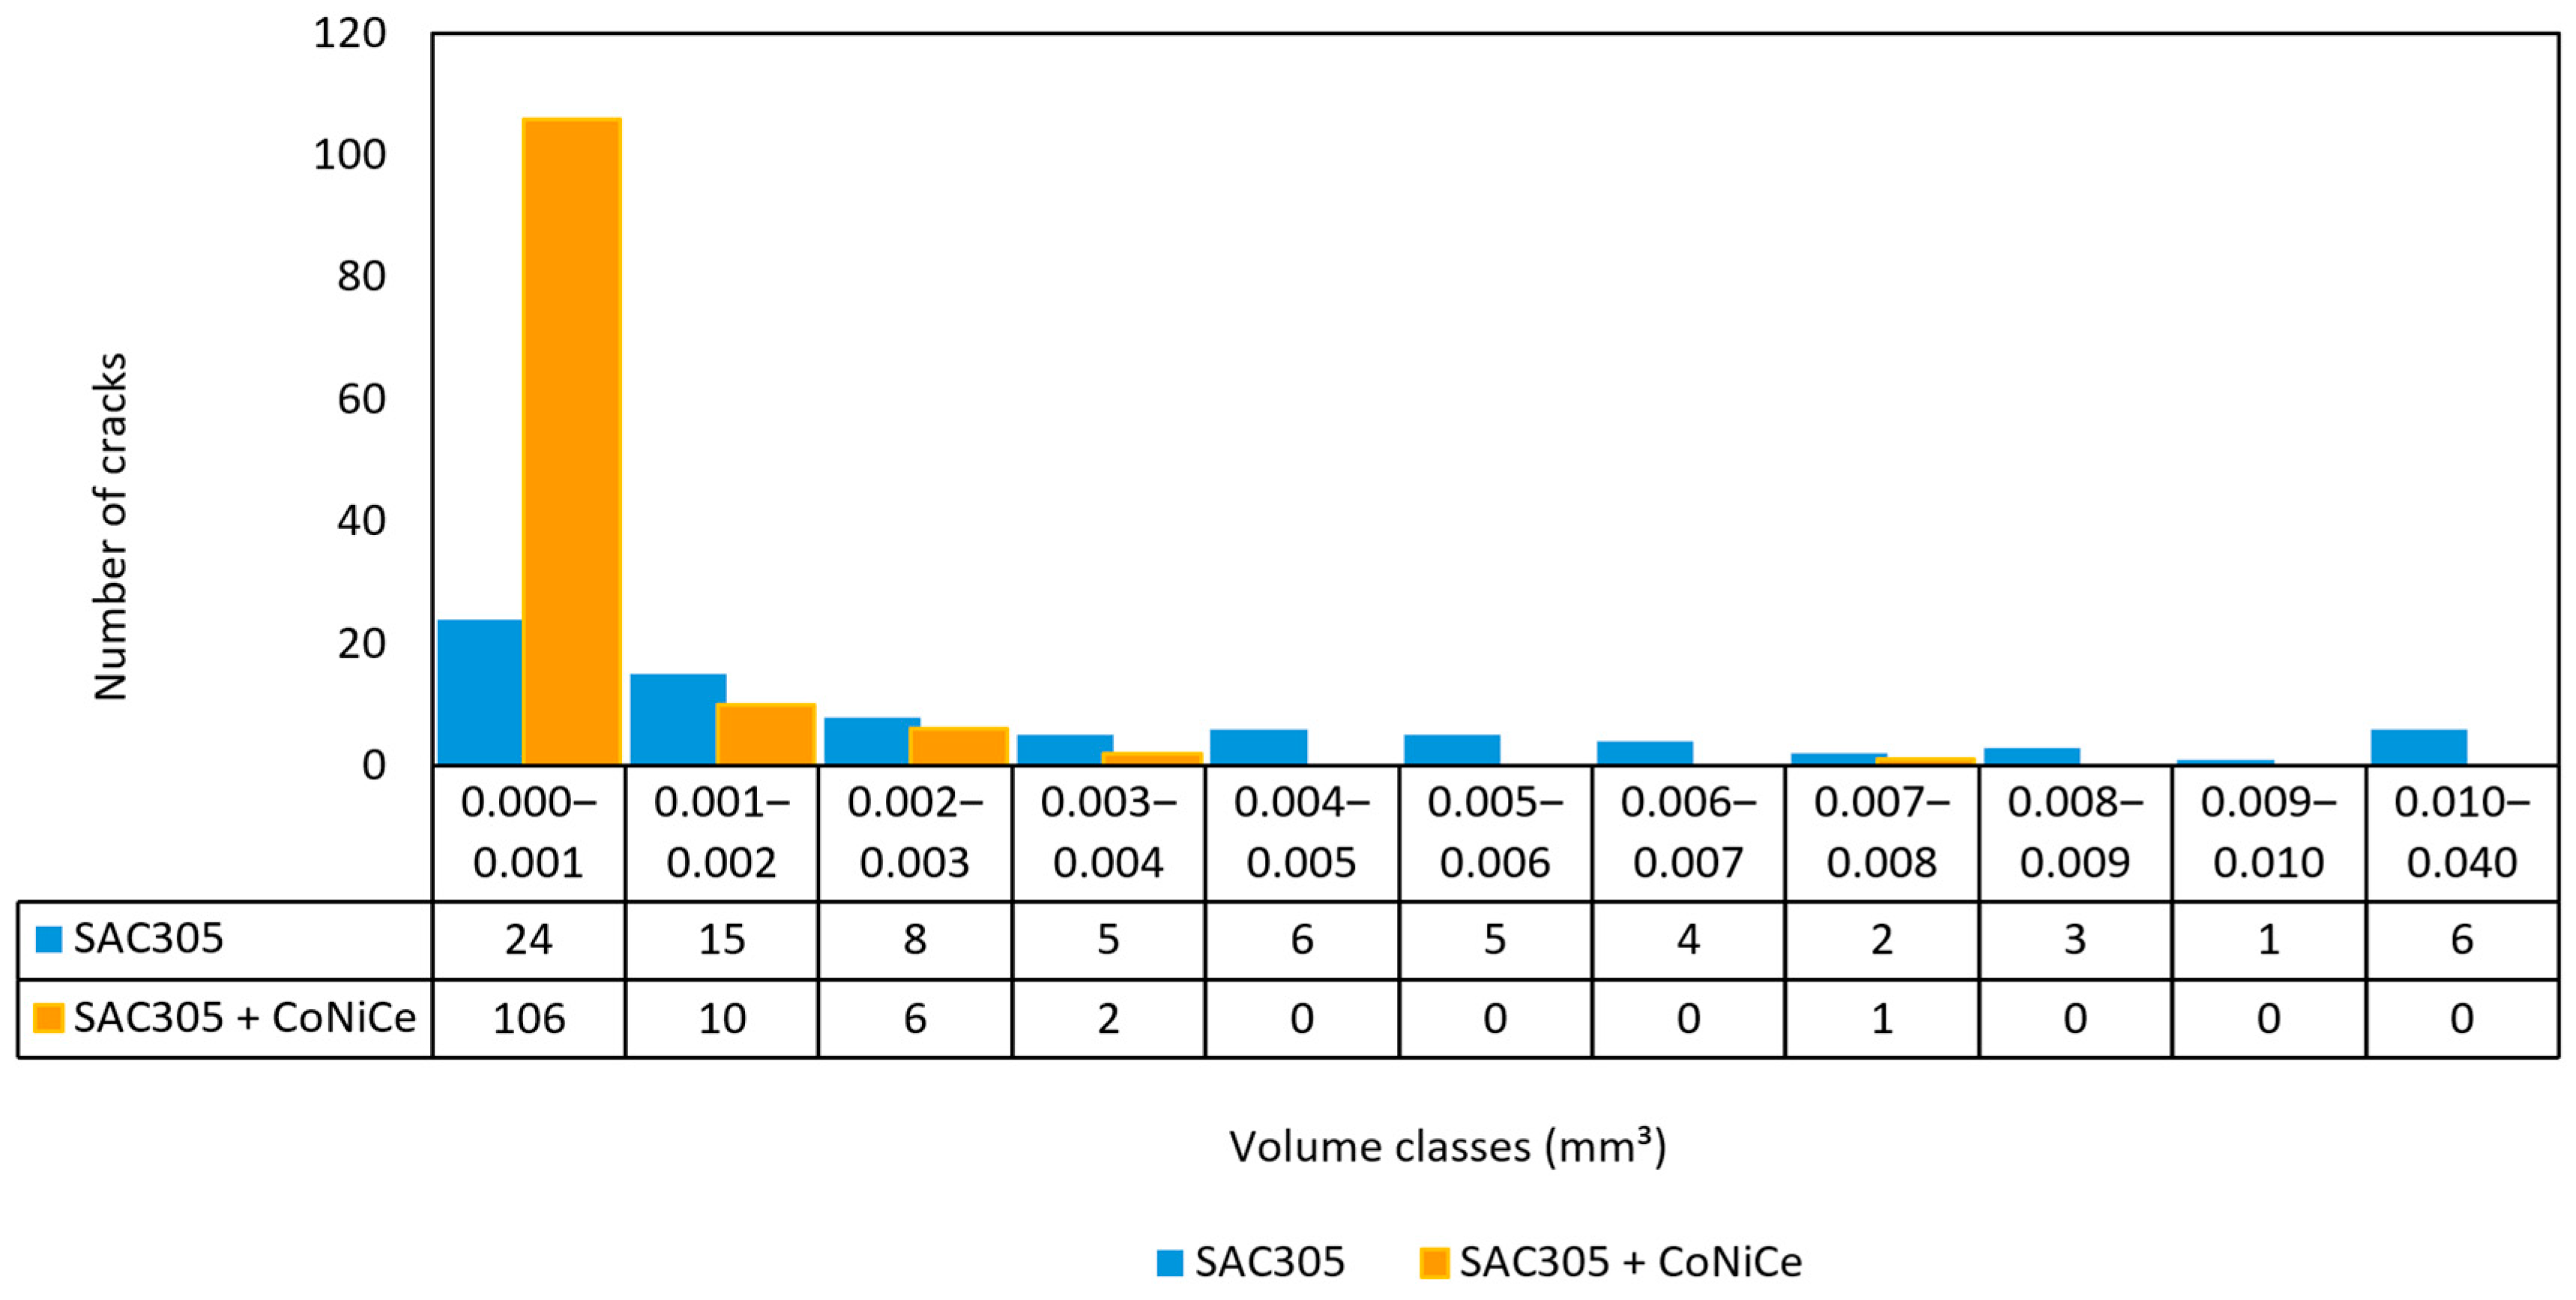
The size distribution of shrinkage cracks on the solder surface, grouped into classes of 0.001 mm3, are shown in the histogram in Figure 6. Although smaller voids (0−0.001 mm3) were more frequent in the microalloyed solder, the overall number of larger shrinkage cracks was significantly reduced. A roughly fourfold difference in the total shrinkage volume was measured between the samples: −0.33 mm3 for SAC305 versus 0.08 mm3 for SAC305 + CoNiCe in favor of the microalloyed alloy. Consequently, the surface of the SAC305 + CoNiCe sample appeared optically smoother and exhibited lower surface roughness than the conventional SAC305 solder.
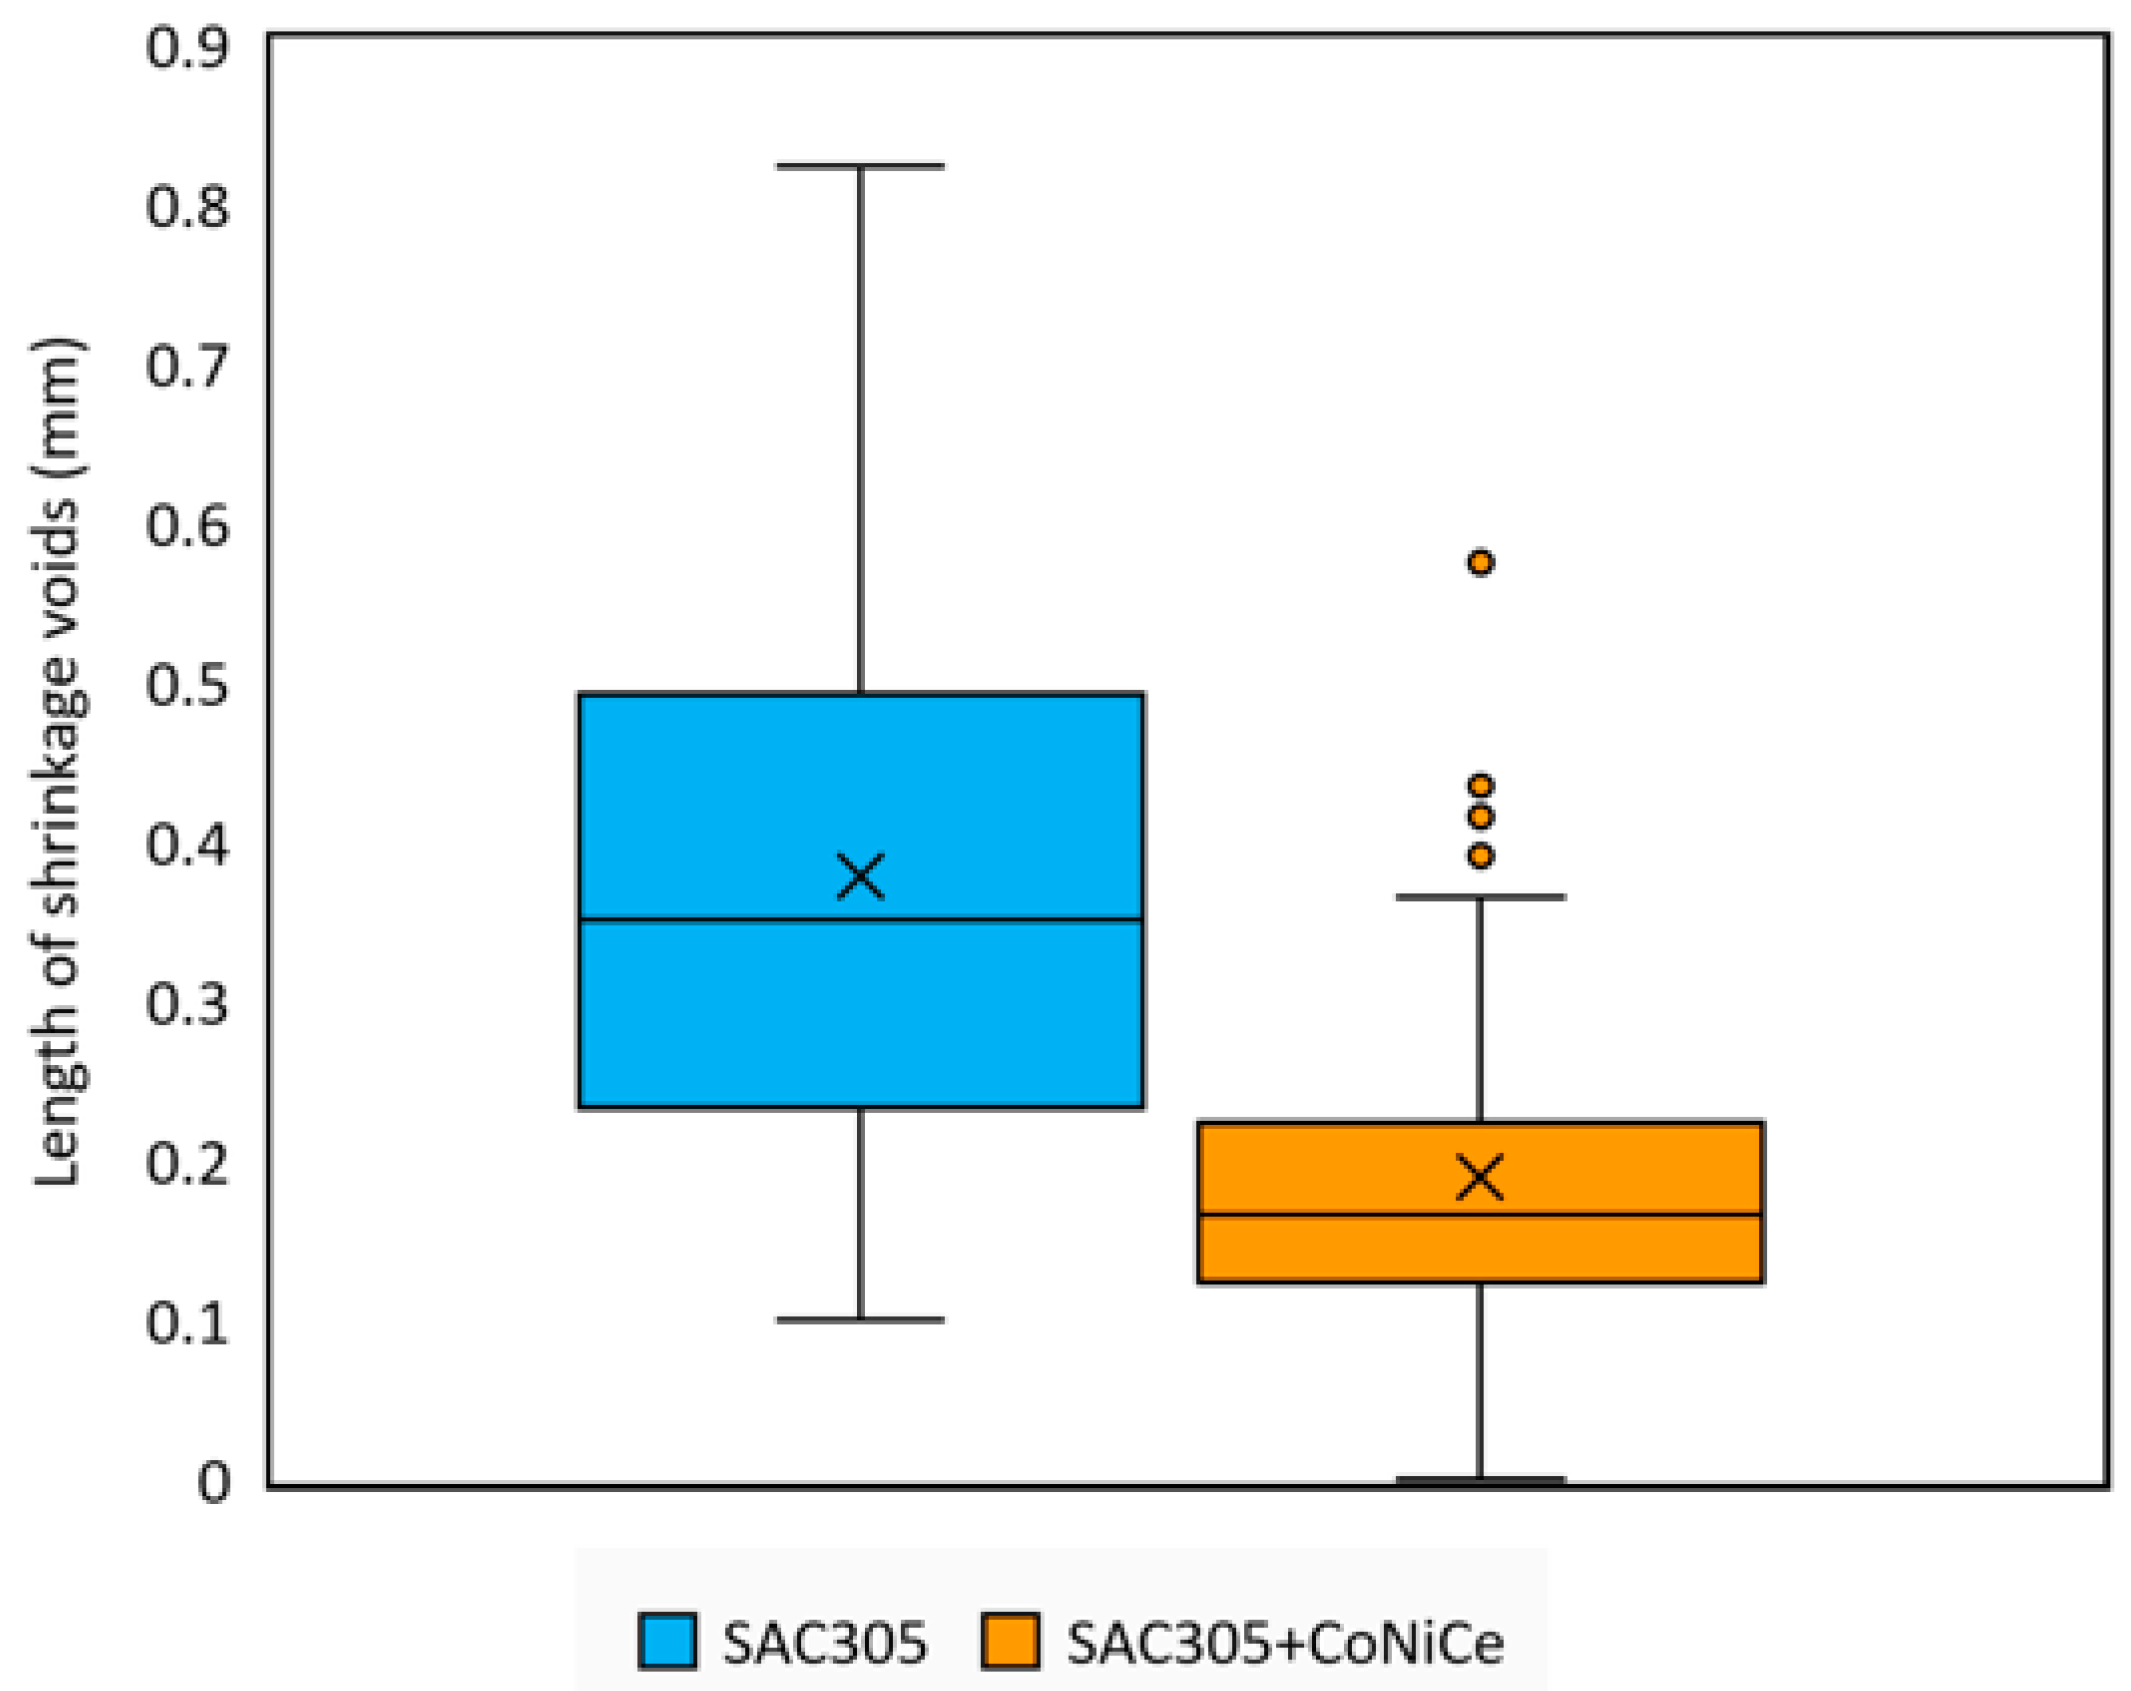
Figure 7 presents a box-plot of the shrinkage crack lengths measured on the sample surfaces. During XCT analysis, the diameter of each shrinkage void was defined as the largest diameter of the circumscribed sphere encompassing each void. The maximum crack length decreased from 0.82 mm (SAC305) to 0.57 mm (SAC305 + CoNiCe), while all statistical parameters—mean, median, and first and third quartiles—were significantly lower for the microalloyed solder. This confirms that microalloying effectively reduces the extent of shrinkage cracking, as a finer microstructure as the thermal and mechanical stresses are more uniformly distributed during solidification.
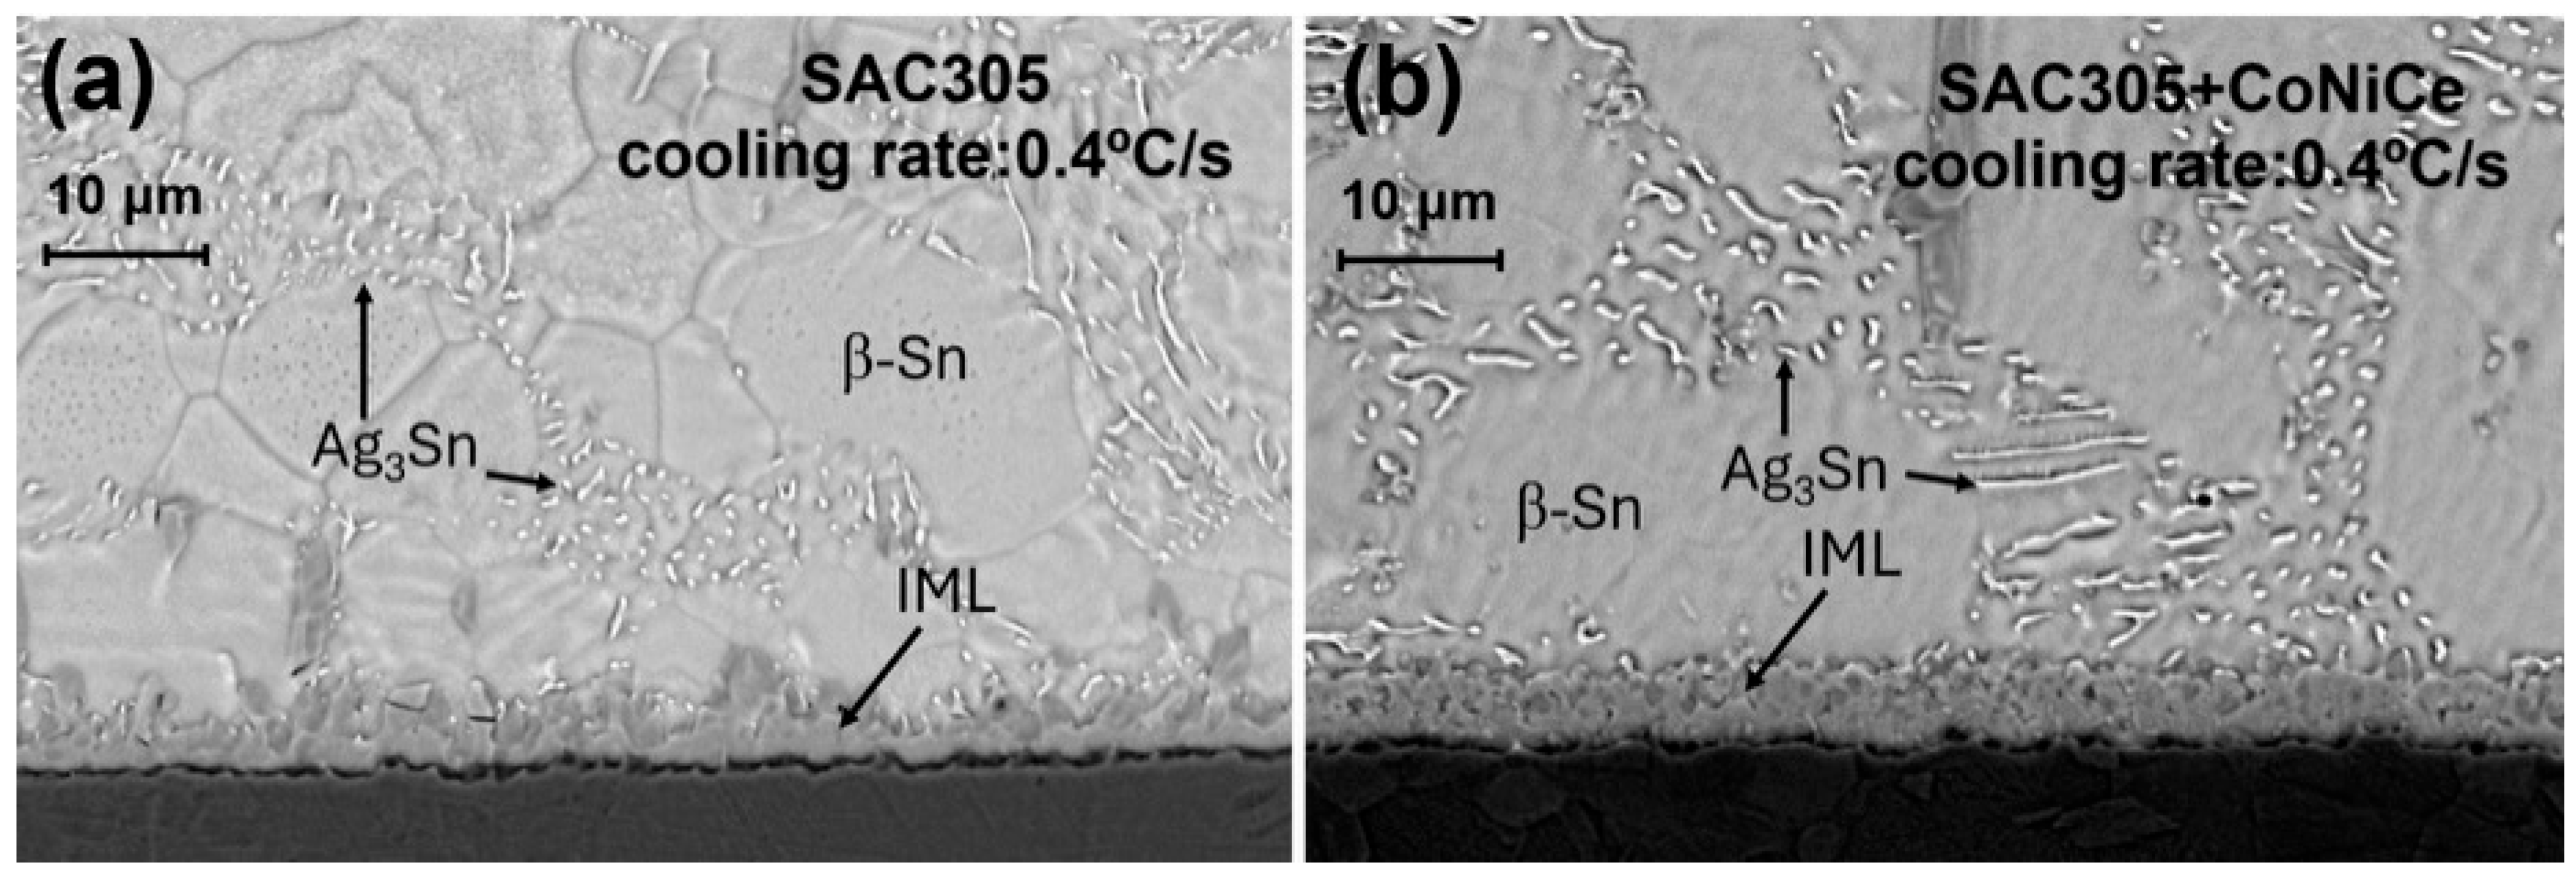
At a low cooling rate (<2.09 °C/s), the morphology of Cu6Sn5 IMC becomes rod-like [7]. In the present study, a relatively low cooling rate (0.4 °C/s) resulted in the formation of plate- and leaf-like Ag3Sn (Figure 8) and rod-like Cu6Sn5 phases. The brittle nature of these IMCs can initiate crack formation on the solder surface. The brittleness of IMCs is supported by their high Vickers hardness values (Ag3Sn: 141.9 ± 10 kg/mm2; Cu3Sn: 431.3 ± 10.5 kg/mm2; Cu6Sn5: 351 ± 16 kg/mm2) compared to the softer constituent elements Ag, Cu, and Sn of 25, 50, and 15 kg/mm2, respectively, while the SAC305 solder itself had a Vickers hardness of 19–20 HV [8,34].
Furthermore, migration of Ag3Sn precipitates toward the grain boundaries weakens the grain boundaries, thereby contributing the formation of intergranular cracks [35]. The refined microstructure with more uniform IMC distribution observed in SAC305 + CoNiCe, together with the larger eutectic area, reduced hot-tearing susceptibility. Consequently, the total shrinkage crack volumes on the surface of the solder joint were significantly reduced in the microalloyed solder.

3.4. IML Morphology and Thickness

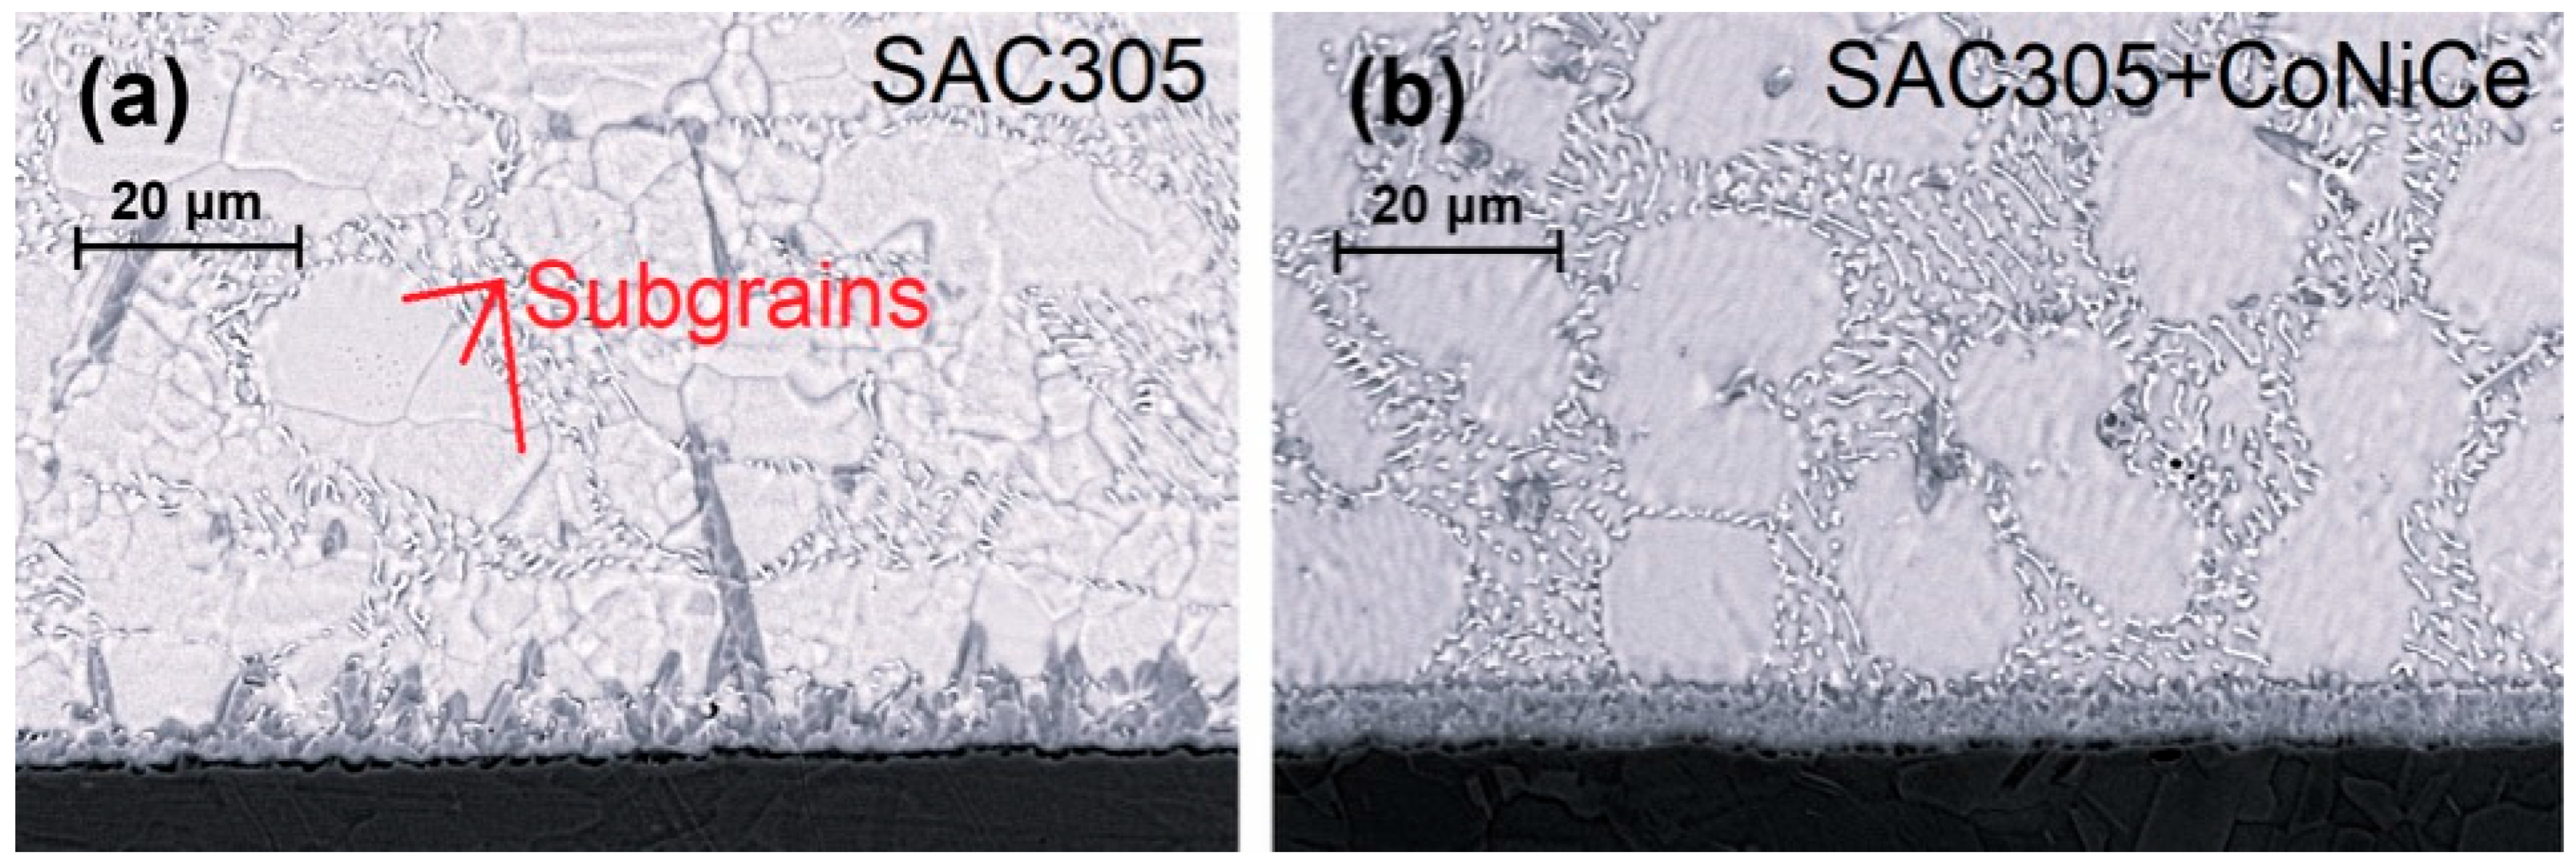
The thickness of the IML was determined from scanning electron microscope (SEM) images acquired at a magnification of 3500×. Figure 8 clearly demonstrates that the addition of microalloying elements transformed the characteristic scallop-shaped IML morphology of the SAC305 solder into a more planar structure, accompanied by a refinement of the IML microstructure. In addition, a very thin (0.4–0.6 μm), darker, continuous Cu3Sn layer was observed between the Cu substrate and the scalloped Cu6Sn5 layer in both samples. Since Cu6Sn5 is not an equilibrium phase with Cu, continuous Cu diffusion from the substrate promotes its gradual transformation into the more stable Cu3Sn phase over the service life of the solder joint [36].
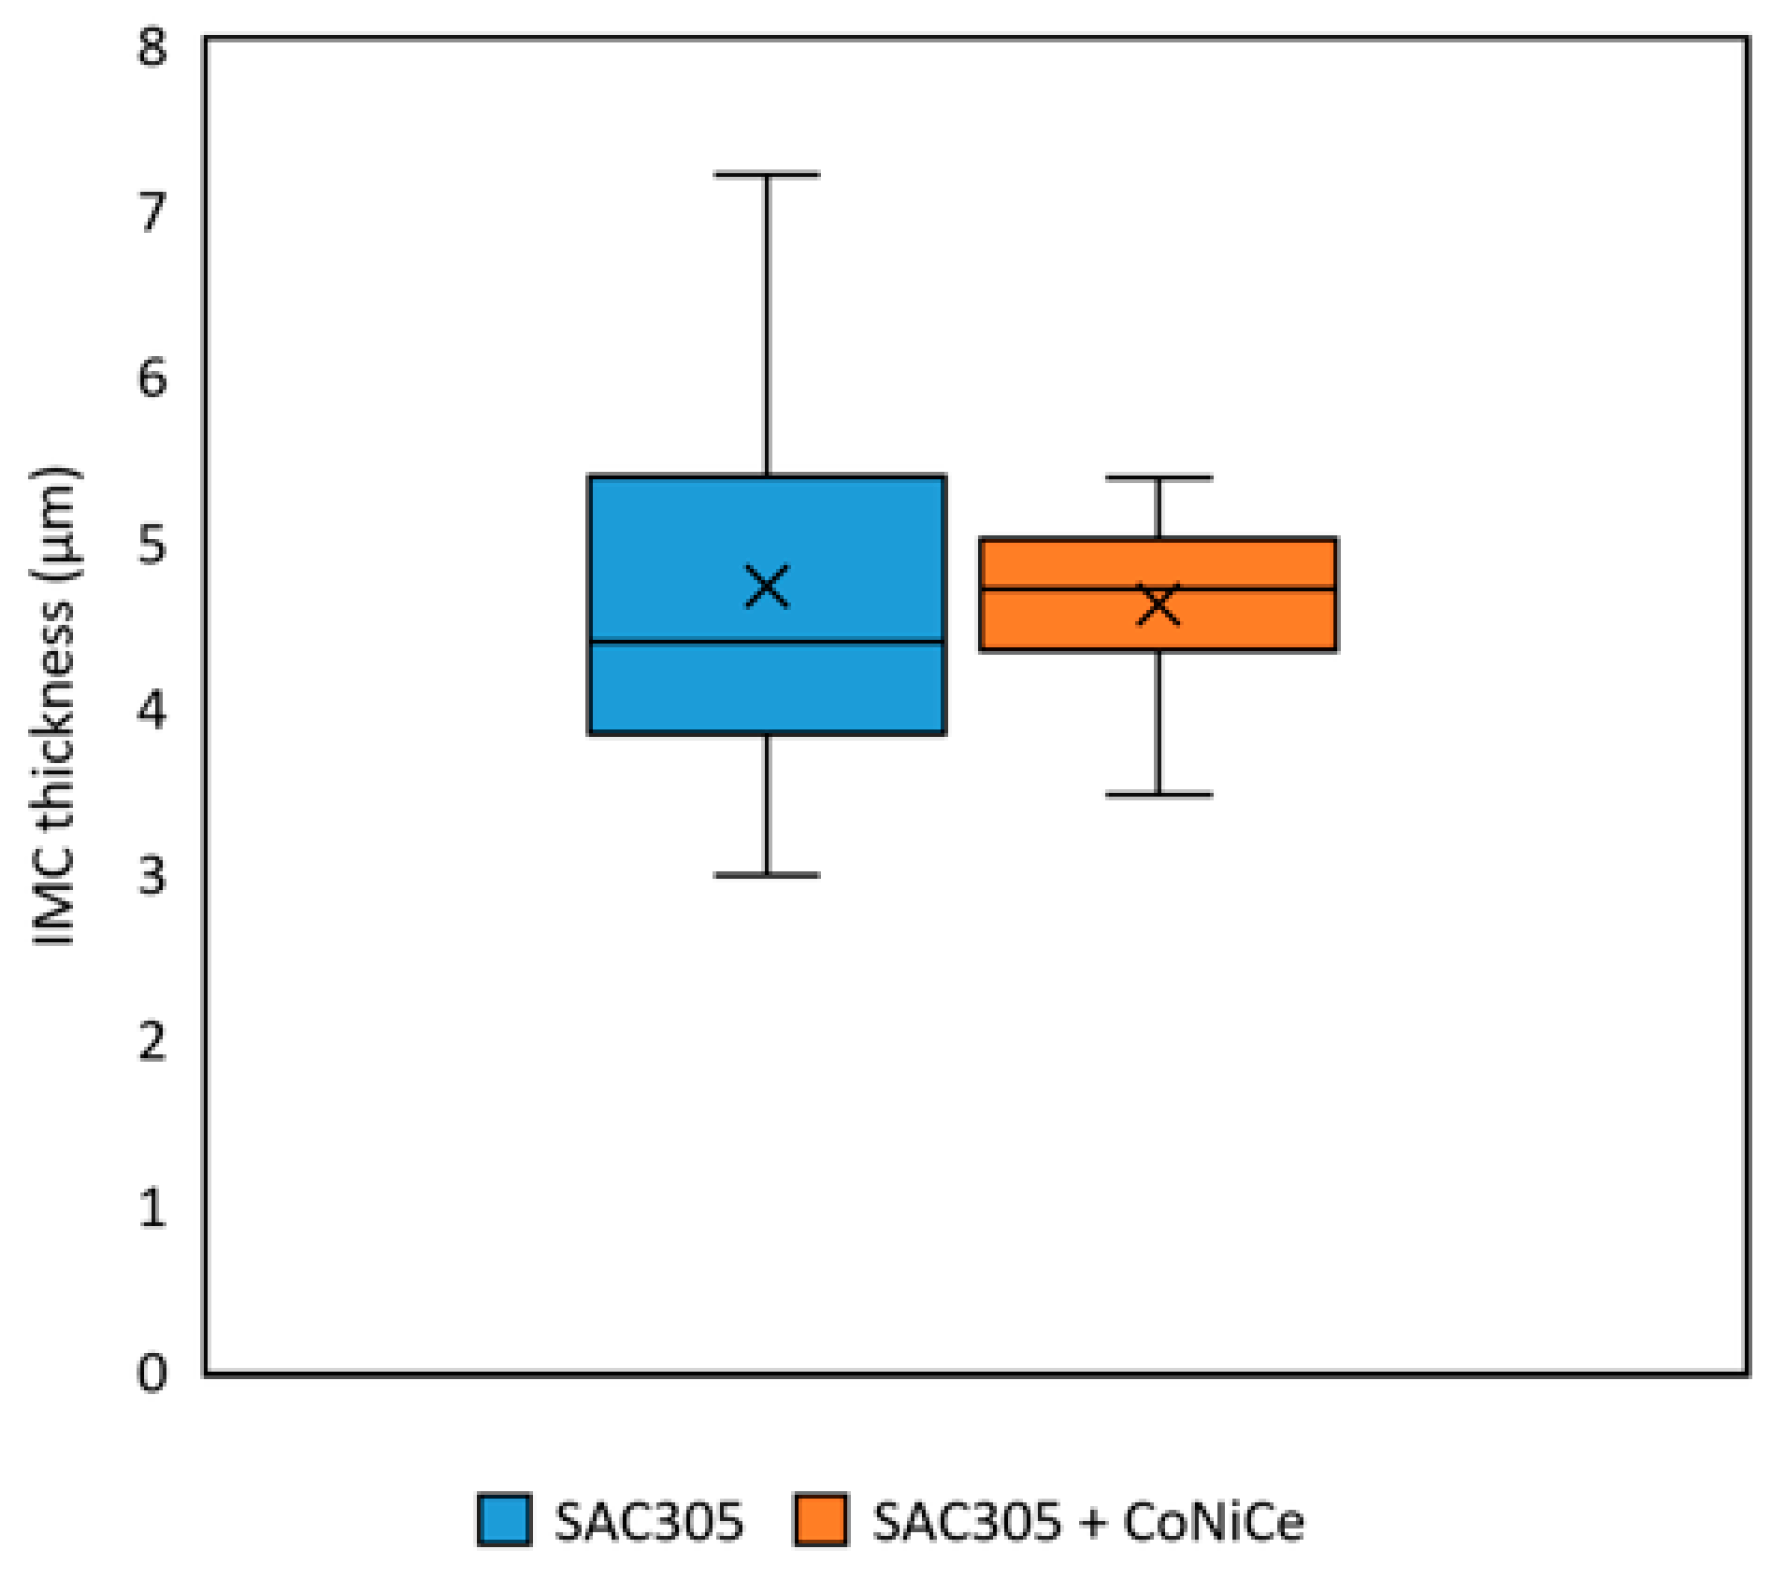
In both examined images, two distinct types of IMCs were clearly observed: Cu6Sn5 (η-phase) and Cu3Sn (ε-phase) for the SAC305 solder joints. Both phases were included in the total IML thickness evaluation. The results in Table 7 indicate that the average IML thicknesses of SAC305 and SAC305 + CoNiCe solders were not significantly different. However, due to the pronounced scalloped morphology of the SAC305 IML, the measured thickness values exhibited a considerably higher deviation, as shown in Figure 9. Consequently, the IML thickness measurements of the SAC305 + CoNiCe solder showed markedly improved uniformity.
According to the binary Sn-Co phase diagram [37], four types of IMCs can form: CoSn, CoSn2, CoSn3, and Co3Sn2, of which both CoSn3 and Co3Sn2 exist in α and β allotropic forms. In addition, the Co and Sn solid solutions themselves, similar to the IMCs above-mentioned, also have α and β phases. However, the formation of these phases requires a higher Co content than those present in this study. Cheng et al. [29] reported that the Co addition of 0.2 wt% promoted CoSn2 formation, while the combined addition of 0.2 wt% Co and 0.05 wt% Ni suppressed the formation of CoSn2, transforming its morphology from a plate-like to a stratified structure, which in turn improved the ductility of the SAC305 solder alloy. Similarly, Co microalloying led to significant grain refinement in SAC305 [38], although the formation of Co-Sn IMCs and their variants requires relatively high concentrations of both Sn and Co [25]. Therefore, significant Co-Sn formation was not expected in the present work.
Due to the similar atomic radii of Ni and Co to Cu ( r C u = 0.128 nm; r N i = 0.125 nm; r C o = 0.125 nm), both elements can substitute for Cu atoms in the crystal lattice of existing Cu-Sn intermetallics. This substitution results in a modified IMC that retains a crystal structure similar to Cu6Sn5, but with partial replacement of Cu atoms by Co or Ni [18,39]. In contrast, Co does not react with Ag to form any IMC [26]. The substitution mechanism can be expressed as:
C u 6 S n   +   C o     ( C u , C o ) 6 S n 5
In this reaction, Co atoms substitute for some of the Cu within the Cu6Sn5 lattice, forming the mixed IMC of (Cu,Co)6Sn5.
Nickel is one of the most prevalent microalloying element. According to the binary Sn-Ni phase diagram, three main IMCs can form: Ni3Sn, Ni3Sn2, and Ni3Sn4. Among these, Ni3Sn and Ni3Sn2 exhibit two allotropic forms—a low-temperature α-phase and a high-temperature β-phase—and the system involves several peritectic, eutectic, peritectoid, and congruent reactions [40]. However, in Sn-rich solder systems, Ni3Sn4 is the dominant phase. In the patent specification for the Innolot solder [41], it is reported that Ni is soluble in Sn-Ag-Cu solder joints only up to approximately 0.2 wt%, above which Ni-containing precipitates form predominantly along the grain boundaries. Similarly, Cho et al. [42] determined through thermodynamic calculations that the solubility limit of Ni in Sn-3.5Ag solder is 0.101 wt% at 250 °C. During solidification, most dissolved Ni precipitate as primary Ni3Sn4 IMC.
The substitution of Cu atoms by Ni within the sublattice of Cu6Sn5 produces a more thermodynamically stable phase than the undoped compound [43], with Ni being more effective in promoting stability than Co. Zhang et al. [44] calculated that the formation enthalpy decreases by −40 to −100 meV/atom when Ni occupies Cu lattice sites within Cu6Sn5, indicating that the system releases energy upon Ni incorporation, thereby forming a more stable structure. Since Cu and Ni are fully soluble [45], Ni can replace Cu in Cu6Sn5 and Cu3Sn, leading to the formation of (Cu,Ni)6Sn5 with smaller grain size [46,47]. Additionally, Ni does not react with Ag3Sn IMC during solidification [48]. By analogy with Co, the incorporation of Ni into Cu6Sn5 can be expressed as:
C u 6 S n   +   N i     ( C u , N i ) 6 S n 5
It is generally accepted that the substitution of Ni or Co atoms for Cu within the Cu6Sn5 lattice structure leads to the formation of a thermodynamically more stable phase, regardless [43,44,46,47]. Accordingly, the formation of the thermodynamically stable (Cu,Co)6Sn5 and (Cu,Ni)6Sn5 phases during microalloying contributes to the development of a more planar IML with a refined grain structure.
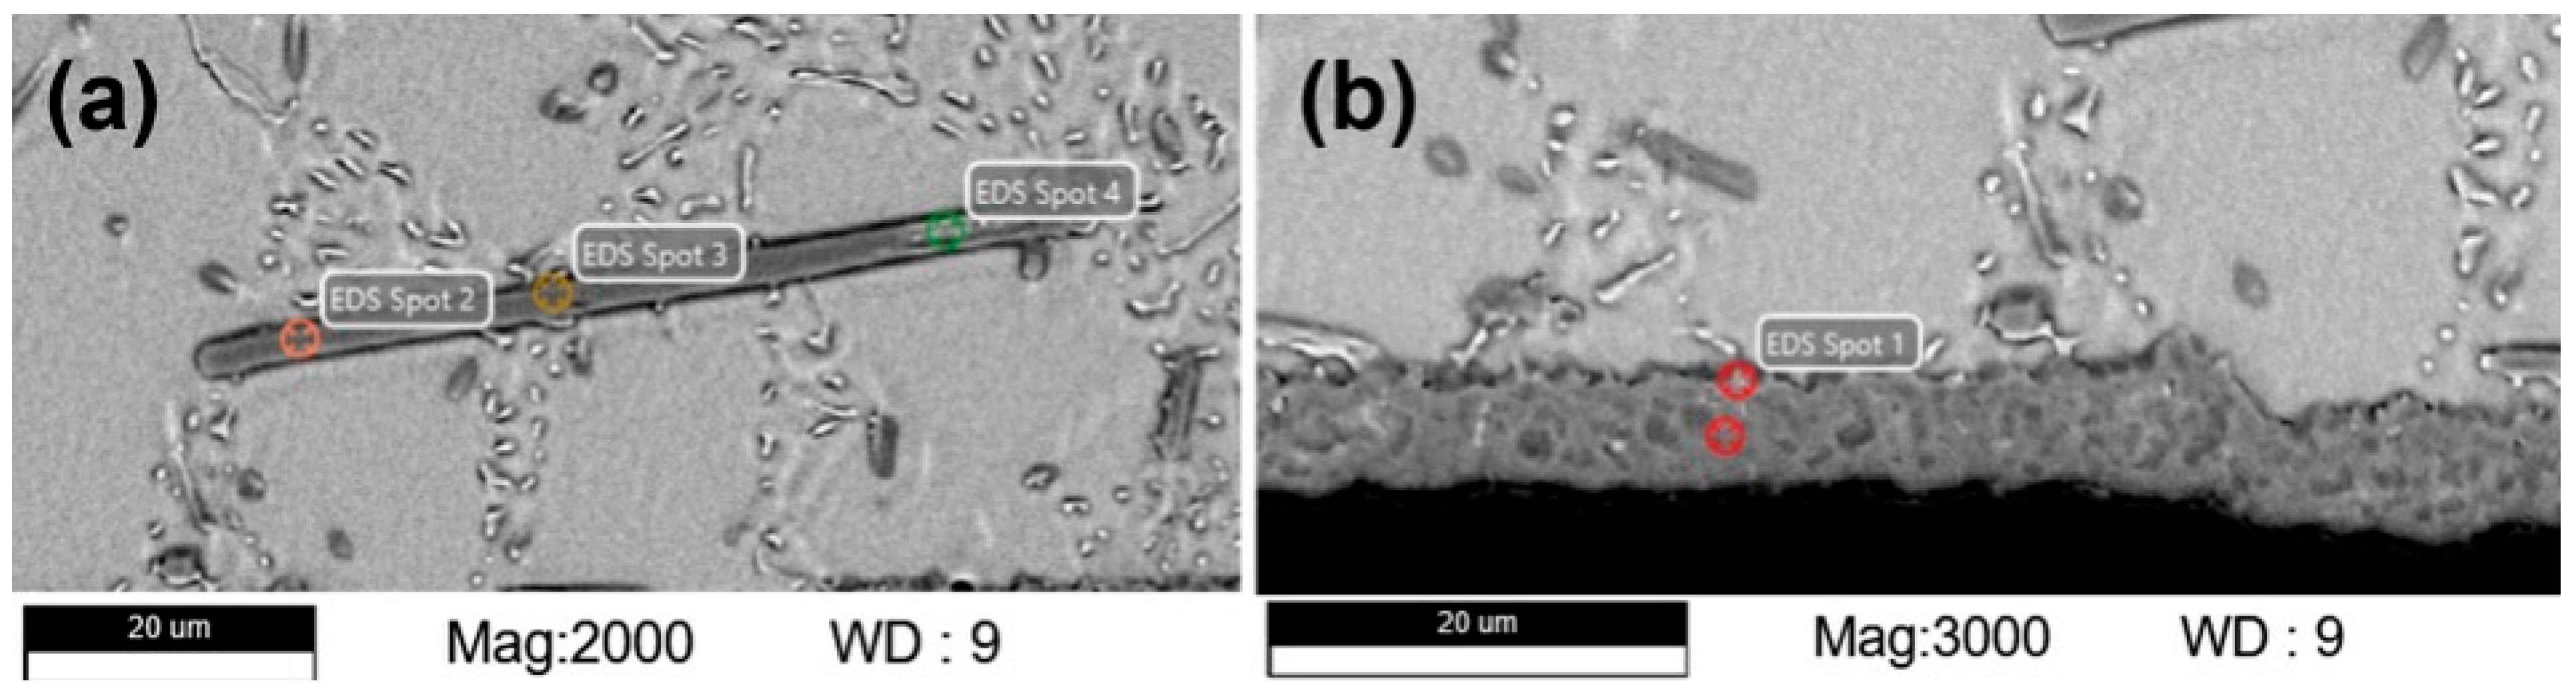
Energy dispersive X-ray spectroscopy (EDX) analysis (Figure 10) confirmed the composition of Cu6Sn5 in both the solder matrix and the IML. As shown in Table 8, Co and Ni concentrations were higher in the (Cu,Co,Ni)6Sn5 IMC particles within the bulk solder (spots 2 and 3) than that in the IML region (spot 1). For reference, the theoretical atomic percentages of Cu and Sn forming the stoichiometric Cu6Sn5 compound are 54.55 at.% Cu and 45.45 at.% Sn, respectively. As shown in Table 8, the measured atomic fraction of Sn closely matched the theoretical value, whereas the Cu fraction was noticeably lower. This deviation can be attributed to the substitution of Cu atoms by Co and Ni.
As a microalloying additive, the rare earth element Ce possesses strong microstructural refinement effects even at very low concentrations [48]. Due to its surface-active nature, Ce reacts with Sn, reducing its chemical activity, which leads to a reduction in IML thickness and suppresses the formation of large IMCs [27]. Optimal Ce concentration is reported below 0.15 wt% in order to achieve fine microstructures and enhanced mechanical properties [28], with 200 ppm yielding the finest dendritic structures [30]. At lower concentrations (50–110 ppm), Ce contributes to solid-solution strengthening, while at higher concentrations, it promotes Cu3Sn IMC formation, reducing ductility and toughness [30]. In combination with Co and Ni, Ce promotes the formation of a planar-type IML rather than a scalloped-type morphology, reducing stress concentration and enhancing the long-term reliability of the solder joint.
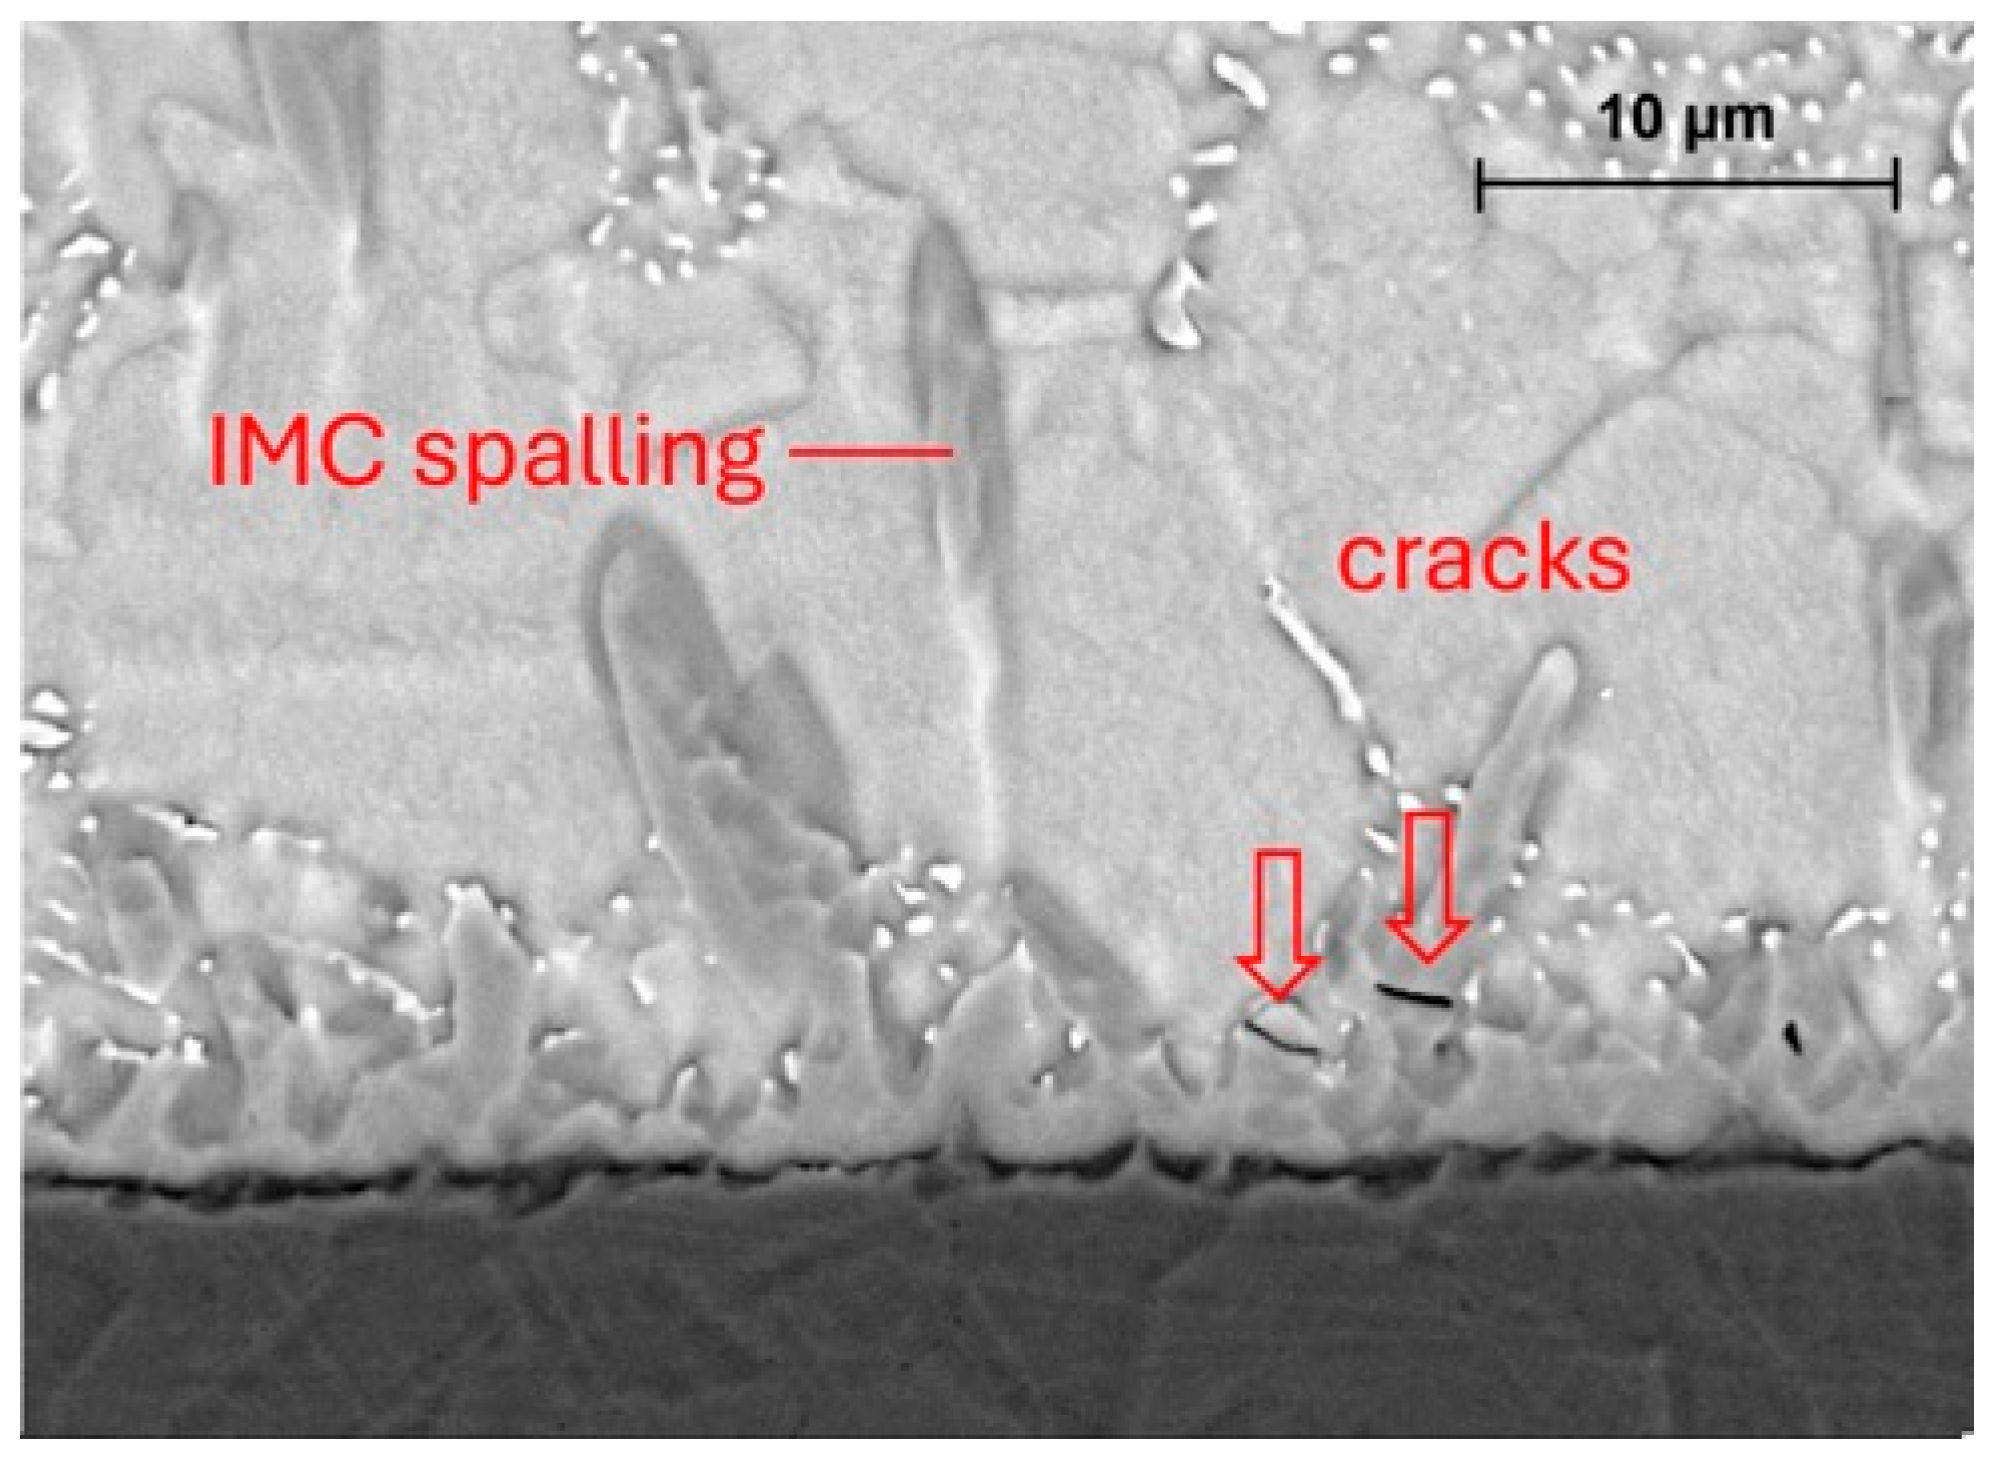
Micro-cracks within the IML and IMC spalling were observed in the SAC305 solder sample, as shown in Figure 11. These defects can originate from the allotropic transformation of the Cu6Sn5 IMC from the hexagonal (η) phase to the monoclinic (η′) phase at approximately 186 °C, accompanied by a 2.15% volumetric contraction, which induces significant mechanical stress within the IML, and promotes crack initiation and propagation [33,47]. In the present study, such defects were not observed in the microalloyed solder, consistent with previous findings that Ni stabilizes the hexagonal η-phase of Cu6Sn5, thereby suppressing the η→η′ transformation and reducing the likelihood of IML micro-crack formation [47,49,50,51].
Spalling is defined as the detachment of IMC particles from the IML, followed by their migration into the bulk solder. When this detachment occurs on a large scale, the phenomenon is referred to as massive spalling [52]. Spalling can occur both during the solidification of solder joints and during solid-state thermal cycling or aging, and it can be attributed to several potential mechanisms, including morphological changes in the IMC layer, thermal-cycle-induced stresses, and the depletion of reactive constituents at the interface [53,54]. Cu depletion has been reported in small-volume solder joints (solder diameter of 300 μm), altering the equilibrium phase composition at the interface, leading to destabilization of the IMC layer and subsequent spalling of IMC particles into the solder matrix [54].
In the present study, the solder volume was several orders of magnitude larger, consequently, the spalling observed in the SAC305 solder is more likely due to excessive IML thickness combined with the phase transformation of Cu6Sn5. During slow cooling, the Cu6Sn5 layer thickens as Cu atoms diffuse into the solder, promoting the formation of a secondary Cu3Sn layer at the interface between Cu6Sn5 and the Cu substrate. Since Cu3Sn is more brittle than Cu6Sn5, excessive thickness of this layer can lead to stress accumulation and crack propagation due to thermal expansion mismatch, ultimately weakening the bond and causing the spalling of Cu6Sn5. Furthermore, low cooling rates can promote the formation of large IMC particles, where transformation-induced stresses may exceed the fracture toughness of Cu6Sn5, leading to its detachment. Spalling was observed exclusively in SAC305, which can be attributed to the scalloped IML morphology, which exhibited a higher stress concentration compared to the planar IML structure formed in the SAC305 + CoNiCe alloy.

3.5. Grain Size and Eutectic Area

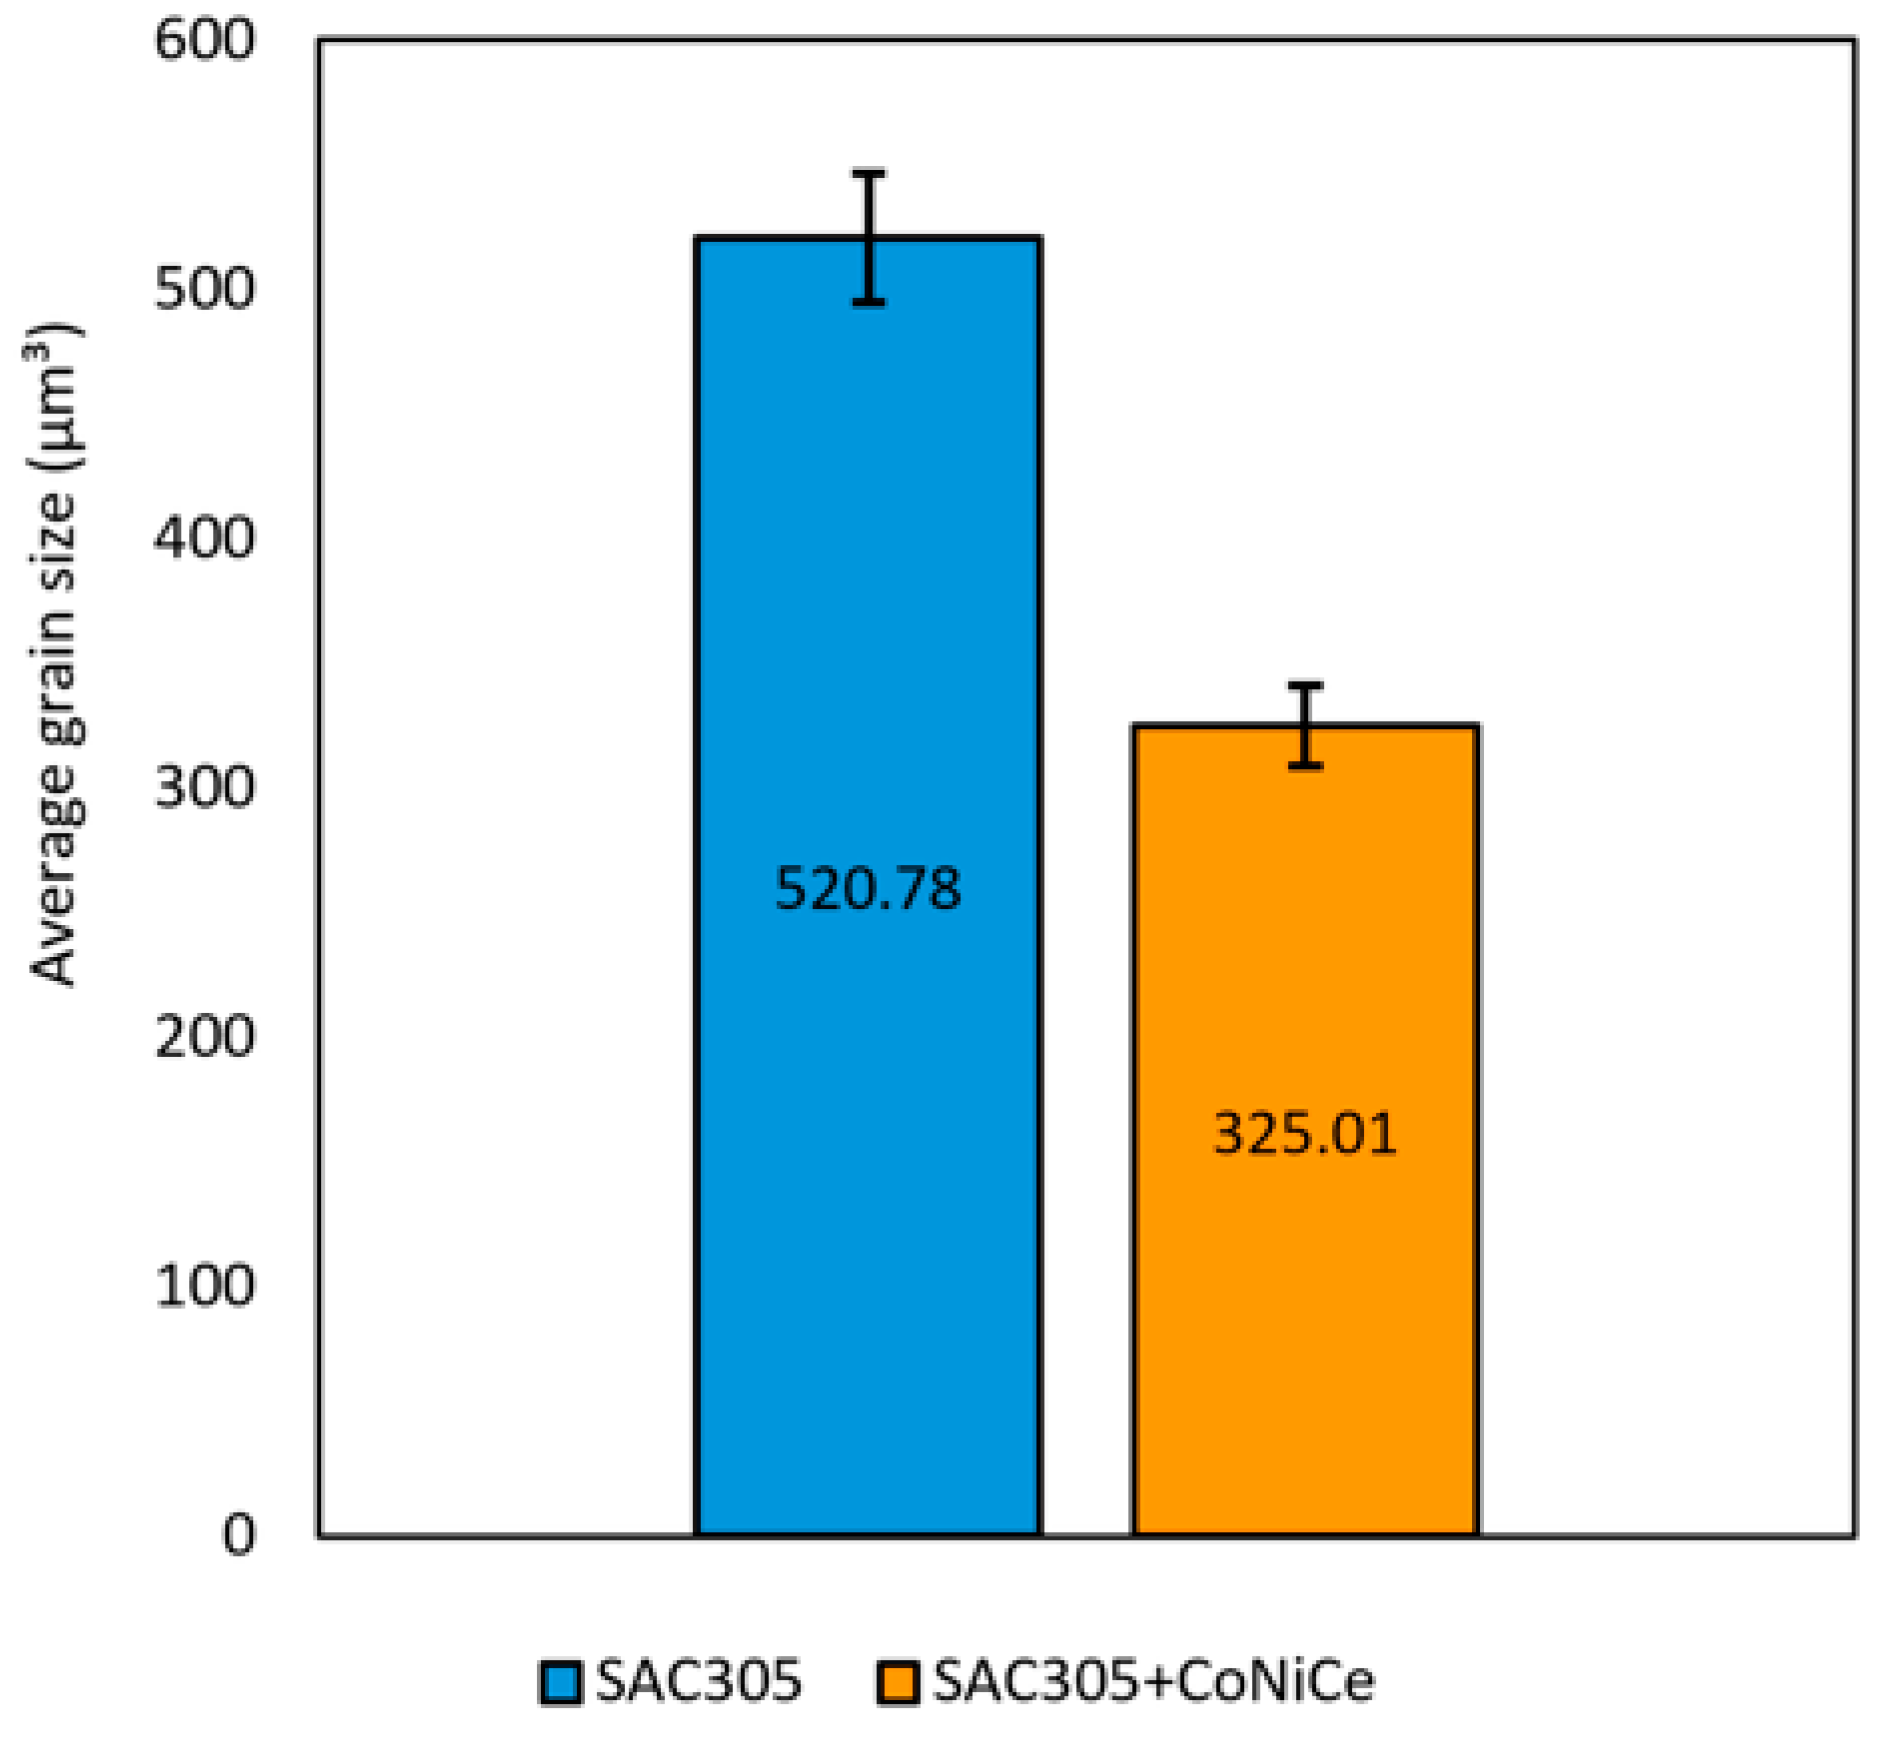
The calculated data for the eutectic area measurements are summarized in Table 9. The results indicate that the addition of CoNiCe microalloying elements suppressed the total β-Sn grain area while increasing the eutectic fraction from 32% in the SAC305 solder to 38% in the SAC305 + CoNiCe alloy.
The average β-Sn grain area in the matrix of the conventional SAC305 solder was found to be 520.78 μm2, whereas the addition of CoNiCe microalloying elements reduced this value to 325.01 μm2. This corresponds to a 37.5% reduction in average β-Sn grain size. Figure 12 illustrates the comparative average grain areas of β-Sn in the microstructures of the base SAC305 and the microalloyed SAC305 solders.
Figure 13 shows the SEM micrographs of both the SAC305 and SAC305 + CoNiCe samples. The SAC305 alloy exhibited a hypoeutectic microstructure, consisting of primary β-Sn grains and varying amounts and morphologies of eutectic structures. Within the large β-Sn grains, subgrains were clearly visible, indicating the formation of mosaic block structures [55]. These regions are essentially free of dislocations and represent locally strain-free domains within a single crystal grain. Such subgrains are predominantly concentrated in areas that solidified first during recalescence [56]. The formation of these single-grain substructures is attributed to the rearrangement of dislocations into dislocation walls immediately after solidification. Dislocations are generated during dendritic growth as a result of thermal contraction mismatches and concentration gradients between neighboring regions. Furthermore, the tetragonal β-Sn phase exhibits a highly anisotropic CTE, which induces local lattice distortions, especially where dendrite trunks or neighboring dendritic grains have different crystallographic orientations.
Subgrain formation increases with higher undercooling due to enhanced thermal gradients and solidification stresses. In contrast, such subgrains were not observed in the SAC305 + CoNiCe alloy, indicating significantly reduced undercooling during solidification, consistent with the DSC results discussed earlier. The microalloying with Co, Ni, and Ce promotes stable nucleation and uniform grain growth, resulting in a refined microstructure and the suppression of subgrain formation.
As microalloying shifts the SAC305 hypoeutectic toward a hypereutectic state, the addition of Co and Ni acts as inoculants, promoting the formation of IMCs that serve as heterogeneous nucleation sites, thus refining the grain structure and suppressing grain coarsening. Ce further contributes by reducing oxidation and mitigating the reactivity of elemental Sn, contributing to lower undercooling. As shown in Figure 13, the SAC305 + CoNiCe solder matrix contains primary (Cu,Co)6Sn5 and (Cu,Ni)6Sn5 intermetallic particles distributed alongside β-Sn grains and various eutectic phases. This inoculation mechanism provides a clear explanation for the observed 37.5% refinement of the β-Sn grains in the microalloyed solder. Consequently, the reduced total volume fraction of the primary β-Sn phase led to an increased eutectic fraction, rising from 32% to 38%. Overall, the combined effects of these microalloying elements lead to a more controlled solidification process, suppressing the rapid growth of Sn-rich phases and promoting a uniform microstructure.

4. Conclusions

In this work, the morphological and microstructural evolution of a Co-, Ni-, and Ce-doped SAC305 solder alloy was investigated and compared with the conventional SAC305 solder, both solidified under a low cooling rate. The simultaneous use of these three microalloying elements has received limited attention in the literature; therefore, this study focused on their combined effects on undercooling behavior, shrinkage crack formation, grain refinement, eutectic area fraction, and IML structure. The key conclusions are summarized as follows:
  • The reduction in undercooling observed in the microalloyed solder is attributed to the formation of heterogeneous nucleation sites, primarily associated with (Cu,Co,Ni)6Sn5 IMCs. These phases act as effective inoculants, promoting earlier and more uniform β-Sn nucleation, thereby suppressing recalescence and limiting excessive grain growth. As a consequence, a refined and more homogeneous microstructure is formed, characterized by smaller β-Sn grains and an increased eutectic fraction.
  • Microalloying also significantly modifies the interfacial reactions between the solder and the Cu. The incorporation of Co and Ni into the Cu6Sn5 lattice stabilizes its hexagonal structure and suppresses the η→η′ phase transformation, which is typically associated with volumetric changes and crack initiation. This stabilization leads to the formation of a more uniform and planar IML with reduced thickness variation.
  • The refinement of the microstructure and stabilization of IMCs have a direct impact on defect formation. The reduced undercooling and increased number of nucleation sites result in a more uniform distribution of stresses, significantly decreasing the formation of large shrinkage cracks. Although a higher number of smaller defects may be present, their total volume is substantially reduced, indicating improved solder integrity.
  • The combined experimental observations and thermodynamic simulations indicate that microalloying shifts the alloy behavior toward a hypereutectic regime, where primary intermetallic compounds form prior to β-Sn solidification. This shift enhances the inoculation mechanism and contributes to the observed grain refinement and microstructural stability.
For soldering process optimization, the reduced undercooling, refined β-Sn grain structure, and stabilized IML demonstrate that the Co-Ni-Ce microalloyed SAC305 alloy exhibits more stable and predictable solidification behavior. These microstructural improvements reduce sensitivity to cooling rate variations and effectively suppress shrinkage-related defects. As a result, the proposed microalloying strategy has the potential to broaden the processing window and significantly enhance the reliability of SAC305-based solder joints in industrial soldering applications.

Author Contributions

Conceptualization: B.B. and V.G. Data curation: B.B. Investigation, Methodology: B.B. and V.G. Supervision: V.G. Writing—original draft: B.B. Writing—review and editing: V.G. All authors have read and agreed to the published version of the manuscript.

Funding

This research was carried out within the framework of the OE-EKOP-KDP-2024_25_002 project with company-university cooperation, supported by the Óbuda University Cooperative PhD Student Scholarship Program, funded through the Talent Care Fund of Óbuda University.

Data Availability Statement

The raw data supporting the conclusions of this article will be made available by the authors on request.

Acknowledgments

The authors gratefully acknowledge Stannol GmbH & Co. KG and its Hungarian distributor for providing the solder samples used in this study. Special thanks are extended to Domokos Kiszel and Alex Ban of Metalloglobus Fémöntő Ltd. for conducting the OES analysis, and to András Hegyessy, Attila Petrik, and Gyula Lénárt of Robert Bosch Kft. for their assistance with the metallographic sample preparation and EDX analysis. The authors also wish to thank Gábor Tamás of Elas Kft. for his support in XCT scanning and data analysis.

Conflicts of Interest

The authors declare no conflicts of interest. The funders had no role in the design of the study; in the collection, analyses, or interpretation of data; in the writing of the manuscript; or in the decision to publish the results.

References

  1. Zeng, G.; McDonald, S.; Nogita, K. Development of high-temperature solders: Review. Microelectron. Reliab. 2012, 52, 1306–1322. [Google Scholar] [CrossRef]
  2. Seelig, K.; Munie, G.; Gesick, W.; Tournier, B.; Lotosky, P.; Vivari, J.A.; Takasu, K.; Dixon, D.; Bauer, B.; Slattery, J.; et al. IPC Solder Product Value Council Lead Free Subcommittee Members. Available online: https://www.avipre.com/products/printers/Shenmao%20Solder,%20Solder%20Paste,%20Solder%20Sphere,%20Solder%20Wire%20and%20Bar/Technical%20Paper/SVPC_Final_ExecSumm.pdf (accessed on 15 August 2025).
  3. Liu, S.; McDonald, S.; Sweatman, K.; Nogita, K. The effects of precipitation strengthening and solid solution strengthening on strain rate sensitivity of lead-free solders: Review. Microelectron. Reliab. 2018, 84, 170–180. [Google Scholar] [CrossRef]
  4. Cheng, S.; Huang, C.-M.; Pecht, M. A review of lead-free solders for electronics applications. Microelectron. Reliab. 2017, 75, 77–95. [Google Scholar] [CrossRef]
  5. Hamilton, C.; Snugovsky, P.; Kelly, M. Effects of SAC Alloy Copper Dissolution Rates on PTH Processes: Cost and Performance Justify Use of Certain Alternatives to SAC305/405. Available online: https://thor.inemi.org/webdownload/newsroom/Presentations/Celestica_iNEMI_Tech_Forum_07/Effects_of_SAC_alloy.pdf (accessed on 5 August 2025).
  6. Bődi, B.; Gonda, V. Characterization of Thermal Behavior of Lead-Free SAC305 Solder for Optimal Manufacturing in Soldering Processes. In 2024 IEEE 7th International Conference and Workshop Óbuda on Electrical and Power Engineering (CANDO-EPE); IEEE: New York, NY, USA, 2024; pp. 323–330. [Google Scholar] [CrossRef]
  7. Lee, H.-T.; Huang, K.-C. Effects of Cooling Rate on the Microstructure and Morphology of Sn-3.0Ag-0.5Cu Solder. J. Electron. Mater. 2016, 45, 182–190. [Google Scholar] [CrossRef]
  8. Ghosh, G. Elastic properties, hardness, and indentation fracture toughness of intermetallics relevant to electronic packaging. J. Mater. Res. 2004, 19, 1439–1454. [Google Scholar] [CrossRef]
  9. Monlevade, E.F.; Peng, W. Failure mechanisms and crack propagation paths in thermally aged Pb-free solder interconnects. J. Electron. Mater. 2007, 36, 783–797. [Google Scholar] [CrossRef]
  10. Henderson, D.W.; Gosselin, T.; Sarkhel, A. Ag3Sn plate formation in the solidification of near ternary eutectic Sn-Ag-Cu alloys. J. Mater. Res. 2002, 17, 2775–2778. [Google Scholar] [CrossRef]
  11. Garami, T.; Krammer, O. Quantitative analyses of Ag3Sn intermetallic compound formation in SnAgCu solder alloys. J. Mater. Sci. Mater. Electron. 2015, 26, 8540–8547. [Google Scholar] [CrossRef]
  12. Rajendran, S.; Jung, D.; Jung, J.P. Investigating the physical, mechanical, and reliability study of high entropy alloy reinforced Sn–3.0Ag–0.5Cu solder using 1608 chip capacitor/ENIG joints. J. Mater. Sci. Mater. Electron. 2022, 33, 3687–3710. [Google Scholar] [CrossRef]
  13. Hollomon, J.H.; Turnbull, D. Solidification of lead-tin alloy droplets. JOM 1951, 3, 803–805. [Google Scholar] [CrossRef]
  14. Kang, S.K.; Shih, D.Y.; Donald, N.Y.; Henderson, W.; Gosselin, T.; Sarkhel, A.; Charles Goldsmith, N.Y.; Puttlitz, K.J.; Choi, W.K. Ag3Sn plate formation in the solidification of near-ternary eutectic Sn-Ag-Cu. JOM 2003, 55, 61–65. [Google Scholar] [CrossRef]
  15. Anousheh, A.; Soleimani, M. Advances in microstructural evolution and reliability-driven mechanical and corrosion properties of lead-free SAC solder alloys. Mater. Des. 2025, 258, 114510. [Google Scholar] [CrossRef]
  16. Stannol GmbH. Solder Flowtin TSC305—Technical Data Sheet. Available online: https://stannol.de/static_data/synology/Datenblaetter____Data%20Sheets/Technical_Data_Sheets____Technische_Datenblaetter/Metals____Metalle/Metals_FLOWTIN___Metalle_FLOWTIN/TDS_FLOWTIN_TSC305_EN.pdf (accessed on 24 February 2026).
  17. Munz, V.; Kruppa, W. Bleifrei—Was Tun? Available online: https://epp.industrie.de/allgemein/bleifrei-was-tun/ (accessed on 24 February 2026).
  18. Kruppa, W. Mikrolegierte Bleifreie Lote—Die Mischung Macht’s, Baugruppenfertigung, Productronic, 2006. Available online: https://www.all-electronics.de/wp-content/uploads/migrated/article-pdf/96737/pr06-05-054.pdf (accessed on 24 February 2026).
  19. MacDermid Alpha. ALPHA® Vaculoy® SAC305, 387, 405 Solid Solder. Available online: https://www.macdermidalpha.com/products/circuit-board-assembly/through-hole-assembly/solder-alloys/alpha-vaculoy-sac305-387-405-solid-solder (accessed on 6 August 2025).
  20. Long, Z.; Liu, S.; Liu, L.; Tan, Y.; Wang, Z.; Wang, X. Microstructure refinement, thermodynamic characteristic, wettability and shear strength of Bi-added rapid solidification SAC305 solder. J. Mater. Sci. Mater. Electron. 2022, 33, 8016–8026. [Google Scholar] [CrossRef]
  21. Saunders, N.; Guo, Z.; Li, X.; Miodownik, A.; Schillé, J. Using JMatPro to model materials properties and behavior. JOM 2003, 55, 60–65. [Google Scholar] [CrossRef]
  22. Eid, E.A.; Fawzy, A.; Mansour, M.M.; Saad, G.; Amin, M. Microstructural Examination and Thermodynamic Analysis of Sn-1.5Ag-0.5Cu-x mass% Ni Lead-Free Solder Alloys. J. Therm. Anal. Calorim. 2024, 149, 4313–4331. [Google Scholar] [CrossRef]
  23. Sun, Q.; Wang, J.; Wang, X.-N.; Zhou, X.-W.; Tang, X.-X.; Akira, K. Cu aggregation behavior on interfacial reaction of Sn-3.0Ag-0.5Cu/ENIG solder joints. Mater. Lett. 2023, 348, 134659. [Google Scholar] [CrossRef]
  24. Moon, K.-W.; Boettinger, W.J.; Kattner, U.R.; Biancaniello, F.S.; Handwerker, C.A. Experimental and thermodynamic assessment of Sn-Ag-Cu solder alloys. J. Electron. Mater. 2000, 29, 1122–1136. [Google Scholar] [CrossRef]
  25. Bashir, M.N.; Haseeb, A.S.; Wakeel, S.; Khan, M.A.; Quazi, M.M.; Khan, N.B.; Ahmed, A.; Soudagar, M.E. Effect of Ni and Co nanoparticle-doped flux on microstructure of SAC305 solder matrix. J. Mater. Sci. Mater. Electron. 2022, 33, 20106–20120. [Google Scholar] [CrossRef]
  26. Kim, K.S.; Huh, S.H.; Suganuma, K. Effects of fourth alloying additive on microstructures and tensile properties of Sn–Ag–Cu alloy and joints with Cu. Microelectron. Reliab. 2003, 43, 259–267. [Google Scholar] [CrossRef]
  27. Wu, J.; Xue, S.; Wang, J.; Liu, S.; Han, Y.; Wang, L. Recent progress of Sn–Ag–Cu lead-free solders bearing alloy elements and nanoparticles in electronic packaging. J. Mater. Sci. Mater. Electron. 2016, 27, 12729–12763. [Google Scholar] [CrossRef]
  28. Muhammad, R.; Ali, U. Optimized Cerium Addition for Microstructure and Mechanical Properties of SAC305. Solder. Surf. Mt. Technol. 2021, 33, 197–205. [Google Scholar] [CrossRef]
  29. Cheng, F.; Nishikawa, H.; Takemoto, T. Microstructural and mechanical properties of Sn–Ag–Cu lead-free solders with minor addition of Ni and/or Co. J. Mater. Sci. 2008, 43, 3643–3648. [Google Scholar] [CrossRef]
  30. Drienovsky, M.; Trnkova, L.R.; Martinkovic, M.; Ozvold, M.; Cernickova, I.; Palcut, M.; Janovec, J. Influence of cerium addition on microstructure and properties of Sn–Cu–(Ag) solder alloys. Mater. Sci. Eng. A 2015, 623, 83–91. [Google Scholar] [CrossRef]
  31. Tu, X.; Yi, D.; Wu, J.; Wang, B. Influence of Ce addition on Sn-3.0Ag-0.5Cu solder joints: Thermal behavior, microstructure and mechanical properties. J. Alloys Compd. 2017, 698, 317–328. [Google Scholar] [CrossRef]
  32. Moon, K.-W.; Boettinger, W.J. Accurately determining eutectic compositions: The Sn-Ag-Cu ternary eutectic. JOM 2004, 56, 22–27. [Google Scholar] [CrossRef]
  33. Larsson, A.-K.; Stenberg, L.; Lidin, S. The superstructure of domain-twinned η’-Cu6Sn5. Acta Cryst. B 1994, 50, 636–643. [Google Scholar] [CrossRef]
  34. Hurtony, T.; Krammer, O.; Illés, B.; Harsányi, G.; Bušek, D.; Dušek, K. Investigation of the Mechanical Properties of Mn-Alloyed Tin-Silver-Copper Solder Solidified with Different Cooling Rates. Materials 2020, 13, 5251. [Google Scholar] [CrossRef]
  35. Libot, J.B.; Alexis, J.; Dalverny, O.; Arnaud, L.; Milesi, P.; Dulondel, F. Microstructural evolutions of Sn-3.0Ag-0.5Cu solder joints during thermal cycling. Microelectron. Reliab. 2018, 83, 64–76. [Google Scholar] [CrossRef]
  36. Illés, B.; Krammer, O.; Geczy, A. Reflow Soldering—Apparatus and Heat Transfer Processes; Elsevier Science: Amsterdam, The Netherlands, 2020; p. 196. [Google Scholar]
  37. Jiang, M.; Sato, J.; Ohnuma, I.; Kainuma, R.; Ishida, K. A thermodynamic assessment of the Co–Sn system. Calphad 2004, 28, 213–220. [Google Scholar] [CrossRef]
  38. Ma, Z.L.; Belyakov, S.A.; Gourlay, C.M. Effects of cobalt on the nucleation and grain refinement of Sn-3Ag-0.5 Cu solders. J. Alloys Compd. 2016, 682, 326–337. [Google Scholar]
  39. Chen, X.; Zhou, J.; Xue, F.; Bai, J.; Yao, Y. Microstructures and Mechanical Properties of Sn-0.1Ag-0.7Cu-(Co, Ni, and Nd) Lead-Free Solders. J. Electron. Mater. 2015, 44, 725–732. [Google Scholar] [CrossRef]
  40. Schmetterer, C.; Flandorfer, H.; Richter, K.W.; Saeed, U.; Kauffman, M.; Roussel, P.; Ipser, H. A new investigation of the system Ni–Sn. Intermetallics 2007, 15, 869–884. [Google Scholar] [CrossRef]
  41. Albrecht, H.-J.; Bartl, K.H.G.; Kruppa, W.; Müller, K.; Nowottnick, M.; Petzold, G.; Steen, H.A.H.; Wilke, K.; Wittke, K. Soldering Material Based on Sn Ag and Cu. US10376994B2, 13 August 2019. Available online: https://patents.google.com/patent/US10376994B2/en (accessed on 26 August 2024).
  42. Cho, M.G.; Kang, S.K.; Seo, S.-K.; Shih, D.-Y.; Lee, H.M. Effects of under bump metallization and nickel alloying element on the undercooling behavior of Sn-based, Pb-free solders. J. Mater. Res. 2009, 24, 534–543. [Google Scholar] [CrossRef]
  43. Gao, F.; Qu, J.; Takemoto, T. Additive Occupancy in the Cu6Sn5-Based Intermetallic Compound Between Sn-3.5Ag Solder and Cu Studied Using a First-Principles Approach. J. Electron. Mater. 2010, 39, 426–432. [Google Scholar] [CrossRef]
  44. Zhang, Y.; Yuan, D.-W.; Chen, J.-H.; Zeng, G.; Fan, T.-W.; Liu, Z.-R.; Wu, C.-L.; Liu, L.-H. Alloying Effects on the Phase Stability and Mechanical Properties of Doped Cu-Sn IMCs: A First-Principle Study. J. Electron. Mater. 2016, 45, 4018–4027. [Google Scholar] [CrossRef]
  45. An, B.; Wu, C.L. Evaluation of Wettability of Composite Solder Alloy Reinforced with Silver and Copper Particles. In 2007 8th International Conference on Electronic Packaging Technology; IEEE: New York, NY, USA, 2007; pp. 1–6. [Google Scholar] [CrossRef]
  46. Li, S.; Liu, Y.; Zhang, H.; Cai, H.; Sun, F.; Zhang, G. Microstructure and hardness of SAC305 and SAC305-0.3Ni solder on Cu, high temperature treated Cu, and graphene-coated Cu substrates. Results Phys. 2018, 11, 617–622. [Google Scholar] [CrossRef]
  47. Nogita, K.; Gourlay, C.M.; Nishimura, T. Cracking and phase stability in reaction layers between Sn-Cu-Ni solders and Cu substrates. JOM 2009, 61, 45–51. [Google Scholar] [CrossRef]
  48. Zhong, S.; Zhang, L.; Li, M.; Long, W.; Wang, F. Development of lead-free interconnection materials in electronic industry during the past decades: Structure and properties. Mater. Des. 2022, 215, 110439. [Google Scholar] [CrossRef]
  49. Nogita, K.; Nishimura, T. Nickel-stabilized hexagonal (Cu,Ni)6Sn5 in Sn–Cu–Ni lead-free solder alloys. Scr. Mater. 2008, 59, 191–194. [Google Scholar] [CrossRef]
  50. Somidin, F.; Maeno, H.; Toriyama, T.; McDonald, S.D.; Yang, W.; Matsumura, S.; Nogita, K. Direct observation of the Ni stabilising effect in interfacial (Cu,Ni)6Sn5 intermetallic compounds. Materialia 2020, 9, 100530. [Google Scholar] [CrossRef]
  51. Mu, D.K.; McDonald, S.D.; Read, J.; Huang, H.; Nogita, K. Critical properties of Cu6Sn5 in electronic devices: Recent progress and a review. Curr. Opin. Solid State Mater. Sci. 2016, 20, 55–76. [Google Scholar] [CrossRef]
  52. Yang, S.C.; Ho, C.E.; Chang, C.W.; Kao, C.R. Massive spalling of intermetallic compounds in solder-substrate reactions due to limited supply of the active element. J. Appl. Phys. 2007, 101, 084911. [Google Scholar] [CrossRef]
  53. Teo, J.W.R.; Sun, Y.F. Spalling behavior of interfacial intermetallic compounds in Pb-free solder joints subjected to temperature cycling loading. Acta Mater. 2008, 56, 242–249. [Google Scholar] [CrossRef]
  54. Ho, C.E.; Lin, Y.W.; Yang, S.C.; Kao, C.R.; Jiang, D.S. Effects of limited cu supply on soldering reactions between SnAgCu and Ni. J. Electron. Mater. 2006, 35, 1017–1024. [Google Scholar] [CrossRef]
  55. Tisza, M. Physical Metallurgy for Engineers; ASM International: Materials Park, OH, USA, 2001; p. 115. [Google Scholar]
  56. Sun, S.; Xian, J.; Hsieh, C.-L.; Gourlay, C.M. Misorientations and Subgrains in Sn-Ag and Sn-Ag-Cu Solder Balls After Solidification. J. Electron. Mater. 2024, 53, 8024–8038. [Google Scholar] [CrossRef]
Figure 1. Measured DSC heat flow curve of SAC305 solder for heating/cooling rates of 0.4 °C/s.
Metals 16 00374 g001
Figure 2. Measured DSC heat flow curve of SAC305 + CoNiCe solder for heating/cooling rates 0.4 °C/s.
Metals 16 00374 g002
Figure 3. Gibbs free energy of phases of SAC305 + xNi solder as a function of Ni concentration.
Metals 16 00374 g003
Figure 4. Detection and 3D visualization of shrinkage holes on the surface and within SAC305 + CoNiCe solder samples.
Metals 16 00374 g004
Figure 5. Surface hot-tear defects observed in the SAC305 + CoNiCe solder sample: 2D cross-sectional view from the XCT examination.
Metals 16 00374 g005
Figure 6. Number of shrinkage cracks in each size class.
Metals 16 00374 g006
Figure 7. Length of shrinkage surface cracks.
Metals 16 00374 g007
Figure 8. Phases and intermetallic layers in (a) SAC305 and (b) SAC305 + CoNiCe solder.
Metals 16 00374 g008
Figure 9. Box-plot diagram of measured IML thicknesses for SAC305 and SAC305 + CoNiCe solders.
Metals 16 00374 g009
Figure 10. EDX analysis measurement spots (a) in the solder matrix and (b) in the IML.
Metals 16 00374 g010
Figure 11. IML micro-cracks and IMC spalling in the SAC305 solder.
Metals 16 00374 g011
Figure 12. Average grain size of β-Sn in the SAC305 and SAC305 + CoNiCe solder.
Metals 16 00374 g012
Figure 13. Solder matrix of (a) SAC305 and (b) SAC305 + CoNiCe near the IML.
Metals 16 00374 g013
Table 1. Measured mean chemical composition and standard deviation of SAC305 + CoNiCe in wt%. Cerium content was estimated based on the report in [18].
SnAgCuCoNi(Ce)
MeanBalance2.980.5640.02870.0169(0.0020)
Standard deviation0.0570.0350.0060.00050.0002
Table 2. Specification and measured chemical composition of SAC305 in wt%.
SnAgCuNiSbBiAsPb
SpecificationBalance3 ± 0.20.5 ± 0.1max. 0.01max.
0.1
max. 0.1max. 0.03max. 0.07
MeasuredBalance3.00.50.010.020.03<0.010.02
Table 3. Summary of XCT inspection scanning and processing parameters.
ParameterSpecification
Type of XCT machineGE Phoenix Microme X
Detector typeDXR-250RT (14-bit)
X-ray tube voltage110 kV
X-ray tube current90 μA
Number of acquiring positions1000
Scanning settings5 averaged and 1 erased frame with 333 ms timing
Geometrical magnification14.97
Voxel size13.35 μm
Analysis softwareVolume Graphics VGSTUDIO 2024.1
Software modulePorosity/Inclusion Analysis
(VGDefX algorithm)
Analysis areaInternal cleaning with overall closing option
Material/background gray values44,900/24,000
Table 4. Characteristic DSC temperatures of SAC305 and SAC305 + CoNiCe alloys.
T o n
(°C)
T p
(°C)
T e n d
(°C)
T m u s h y
(°C)
T u c
(°C)
SAC305heating219.0226.3229.410.419.6
cooling199.4196.1, 198.1 193.75.7
SAC305
+ CoNiCe
heating219.1226.9230.010.94.35 ± 0.75
cooling214.75 ± 0.75206.75 ± 0.05, 211.25 ± 0.2203.910.85 ± 0.75
Table 5. Crystallization temperatures of different phases at Ni doped SAC305 solder alloys determined by simulations. Primary phase crystallization is highlighted with a gray background.
β-Sn
(°C)
Ag3Sn
(°C)
Cu6Sn5
(Hexagonal)
(°C)
Cu6Sn5
(Monoclinic)
(°C)
Liquid
Removed (Solidus)
(°C)
Mushy Range
(°C)
SAC305219.92217.41216.06185.85216.063.86
SAC305
+ Ni (100 ppm)
219.82217.39217.81−5.56216.143.68
SAC305
+ Ni (150 ppm)
219.78217.47218.78−52.48216.183.60
SAC305
+ Ni (200 ppm)
219.73217.55219.48216.223.51
SAC305
+ Ni (250 ppm)
219.74217.62222.34216.276.07
SAC305
+ Ni (300 ppm)
219.77217.68226.30216.319.99
Table 6. Shrinkage voids analysis statistics.
SAC305SAC305
+ CoNiCe
Material volume (mm3)86.7881.70
Indication volume (mm3)0.330.08
Indication volume/Material volume ratio (%)0.380.1
Length of deepest crack (mm)0.820.57
Number of detected indications
on the solder surfaces
79125
Table 7. Measured IML thicknesses of SAC305 and SAC305 + CoNiCe.
SAC305SAC305
+ CoNiCe
Average IML thickness (μm)4.724.62
Standard deviation (μm)1.140.46
3rd quartiles (μm)5.354.99
1st quartiles (μm)3.844.42
Max. IML thickness (μm)7.215.38
Min. IML thickness (μm)2.983.47
Table 8. EDX elemental compositions (at%) of IMC in the solder matrix and IML.
LocationComposition of the Elements (at%)
CuSnCoNiAg
IMC particle in the solder matrix
(spot 2)
48.146.33.52.1-
IMC particle in the solder matrix
(spot 3)
48.945.53.42.2-
IMC particle in the solder matrix
(spot 4)
34.173.22.51.71.9
IML adjacent to solder matrix (spot 1)44.747.52.31.04.5
IML adjacent to Cu substrate57.340.61.11.0-
Table 9. Measured β-Sn area and eutectic area, and the calculated eutectic fractions of SAC305 and SAC305 + CoNiCe solder.
SAC305SAC305
+ CoNiCe
A β S n (μm2)20,378.5618,561.42
A e u (μm2)9621.4411,423.58
F e u (%)3238
Disclaimer/Publisher’s Note: The statements, opinions and data contained in all publications are solely those of the individual author(s) and contributor(s) and not of MDPI and/or the editor(s). MDPI and/or the editor(s) disclaim responsibility for any injury to people or property resulting from any ideas, methods, instructions or products referred to in the content.