Article

Research on the Johnson–Cook Constitutive Model and Failure Behavior of TC4 Alloy

by
Jiaxuan Zhu
1,
Huidong Zhi
1,
Tong Huang
2,
Ning Ding
1 and
Zhaoming Yan
3,*
1
School of Mechanical and Electrical Engineering, North University of China, Taiyuan 030051, China
2
Science and Technology Development Department, Northern Development Investment Co., Ltd., Xi’an 710299, China
3
School of Materials Science and Engineering, North University of China, Taiyuan 030051, China
*
Author to whom correspondence should be addressed.
Metals 2025, 15(9), 951; https://doi.org/10.3390/met15090951
Submission received: 6 June 2025 / Revised: 10 August 2025 / Accepted: 25 August 2025 / Published: 27 August 2025
(This article belongs to the Special Issue Structure and Mechanical Properties of Titanium Alloys)

Abstract

This study investigates the mechanical response characteristics and damage evolution behavior of TC4 alloy through quasi-static/dynamic coupled experimental methods. Quasi-static tensile tests at varying temperatures (293 K, 423 K, and 623 K) were conducted using a universal testing machine, while room-temperature dynamic tensile tests (strain rate 1000–3000 s−1) were performed with a Split Hopkinson Tensile Bar (SHTB). Key findings include the following: (1) Significant temperature-softening effect was observed, with flow stress decreasing markedly as temperature increased; (2) Notch size effect influenced mechanical properties, showing 50% enhancement in post-fracture elongation when notch radius increased from 3 mm to 6 mm; and (3) Strain-hardening effect exhibited rate dependence under dynamic loading, with reduced hardening index within the tested strain rate range. The Johnson–Cook constitutive model and failure criterion were modified and parameterized based on experimental data. A 3D tensile simulation model developed in ABAQUS demonstrated strong agreement with experimental results, achieving a 0.97 correlation coefficient for load–displacement curves, thereby validating the modified models. Scanning electron microscopy (SEM) analysis of fracture surfaces revealed temperature- and strain rate-dependent microstructural characteristics, dominated by ductile fracture mechanisms involving microvoid nucleation, growth, and coalescence. This research provides theoretical foundations for analyzing Ti alloy structures under impact loading through established temperature–rate-coupled constitutive models.

1. Introduction

Ti-6Al-4V alloy has become a key material for achieving lightweight equipment and performance enhancement in aviation, aerospace, ordnance, and other fields [1,2,3,4,5] due to its excellent properties such as low density, high strength, high melting point, corrosion resistance, and fatigue resistance. However, components made of Ti-6Al-4V material carry a risk of fracture under extreme loads such as high temperatures and high-speed impact. Therefore, it is crucial to conduct in-depth research on the stress flow and fracture failure behavior of titanium (Ti) alloys.
Establishing constitutive models and failure models applicable to high temperatures, high velocities, and large deformations can effectively predict the deformation and fracture states of materials under load. This is of great significance for advancing the development of Ti-6Al-4V alloy in lightweight armor protection and engineering applications. Among these, the Johnson–Cook (J–C) constitutive model and failure model are commonly used models for describing high-velocity impact, high-temperature, and large deformation behavior. The constitutive model characterizes the relationship between stress, strain, strain rate, and temperature, while the failure model describes the relationship between fracture strain and stress triaxiality. Both models have been widely applied in engineering fields [6,7].
However, extensive research has revealed limitations in the predictive capability of the original J–C model, necessitating modifications for specific materials and applications. When Wu et al. [6] studied the dynamic deformation behavior of 7A75 alloy, they found that the traditional J–C model exhibited significant prediction errors. To address this, they introduced an improved J–C model incorporating strain rate compensation, which significantly enhanced the accuracy in predicting dynamic/static deformation responses across a wide range of strain rates. Luo et al. [8] proposed a modified J–C constitutive model that improved the prediction accuracy for the uniaxial tensile behavior of Q345-BW at different temperatures; the applicability of this model was validated using the true stress–strain curves of Q345-BW. Tao et al. [9] proposed an improved J–C model that simultaneously considers nonlinear strain rate hardening and the interaction between strain hardening and thermal softening. The improved model significantly increased the prediction accuracy of the flow stress during the deformation of Ti-6Al-4V tubes. They also applied the proposed model to numerically controlled warm bending, achieving better precision in predicting forming defects such as fracture, wrinkling, and over-thinning. Wu et al. [10] employed a modified Johnson–Cook plasticity model and the Xue–Wierzbicki fracture criterion to describe the flow stress and fracture behavior of Ti-6Al-4V alloy, exploring the influence of strain rate on the material’s yield strength and fracture strain. The model’s validity was further verified through ballistic impact tests.
In order to better describe the stress flow behavior and fracture failure behavior of Ti-6Al-4V alloy material during tensile processes, this study investigates the quasi-static mechanical behavior of TC4 alloy at temperatures ranging from 293 K to 623 K using a universal testing machine. The dynamic mechanical properties of TC4 alloy are examined using a split Hopkinson pressure bar (SHPB). Additionally, the relationship between fracture strain and stress triaxiality for TC4 alloy is established through notched tensile experiments. Based on the experimental results, the J–C constitutive model and failure model are modified, and the material parameters are calibrated. The reliability of these parameters is verified by comparing numerical simulation results with experimental data. Finally, scanning electron microscopy (SEM) is employed to observe the micromorphology of the Ti alloy fracture surfaces, aiming to investigate the microscopic mechanisms by which temperature and strain rate influence the fracture strain of the Ti alloy.

2. Materials and Methods

The tested material was TC4 (Ti-6Al-4V) alloy, classified as a dual-phase (α + β) Ti alloy. The chemical composition of the alloy is shown in Table 1, and the physical properties are shown in Table 2. The quasi-static tensile testing is conducted with strain rate of 10−3 s−1.
Figure 1a illustrates the geometry of the smooth tensile specimen, designed to investigate the influence of temperature on fracture strain. To explore the effect of stress triaxiality on fracture strain, notched tensile specimens with varying notch radii were fabricated, as shown in Figure 1b, where R denotes the notch radius. For smooth specimens, the notch radius is theoretically approximated as infinite (R → ∞). The notch radii employed in this study were R = 3 mm, 6 mm, 9 mm, and ∞ (smooth specimen). Figure 1c displays the dynamic tensile specimen geometry, specifically configured for Split Hopkinson Tensile Bar (SHTB) testing, to examine strain rate dependence of fracture strain.

Material Tensile Test

The quasi-static tensile tests were conducted on an electronic universal testing machine at a strain rate of 0.001 s−1. To minimize experimental errors, each test group was repeated twice. The engineering stress and engineering strain data acquired from the electronic universal testing machine were subsequently converted into the true stress and true strain of the specimens using Equations (1) and (2).
σ t = σ e ( 1 + ε t )
ε t = l n ( 1 + ε e )  
In the equations, σ e and ε e represent the engineering stress and engineering strain, respectively, while σ t and ε t denote the true stress and true strain, respectively. Finally, the true stress and true strain data were obtained under a strain rate of 0.001 s−1, with varying temperatures, and different notch radii were fitted into true stress–strain curves using Origin 2024 software. The mechanical properties of TC4 alloy during quasi-static tensile deformation, such as yield strength, ultimate tensile strength, and fracture strain, were systematically analyzed based on these curves.
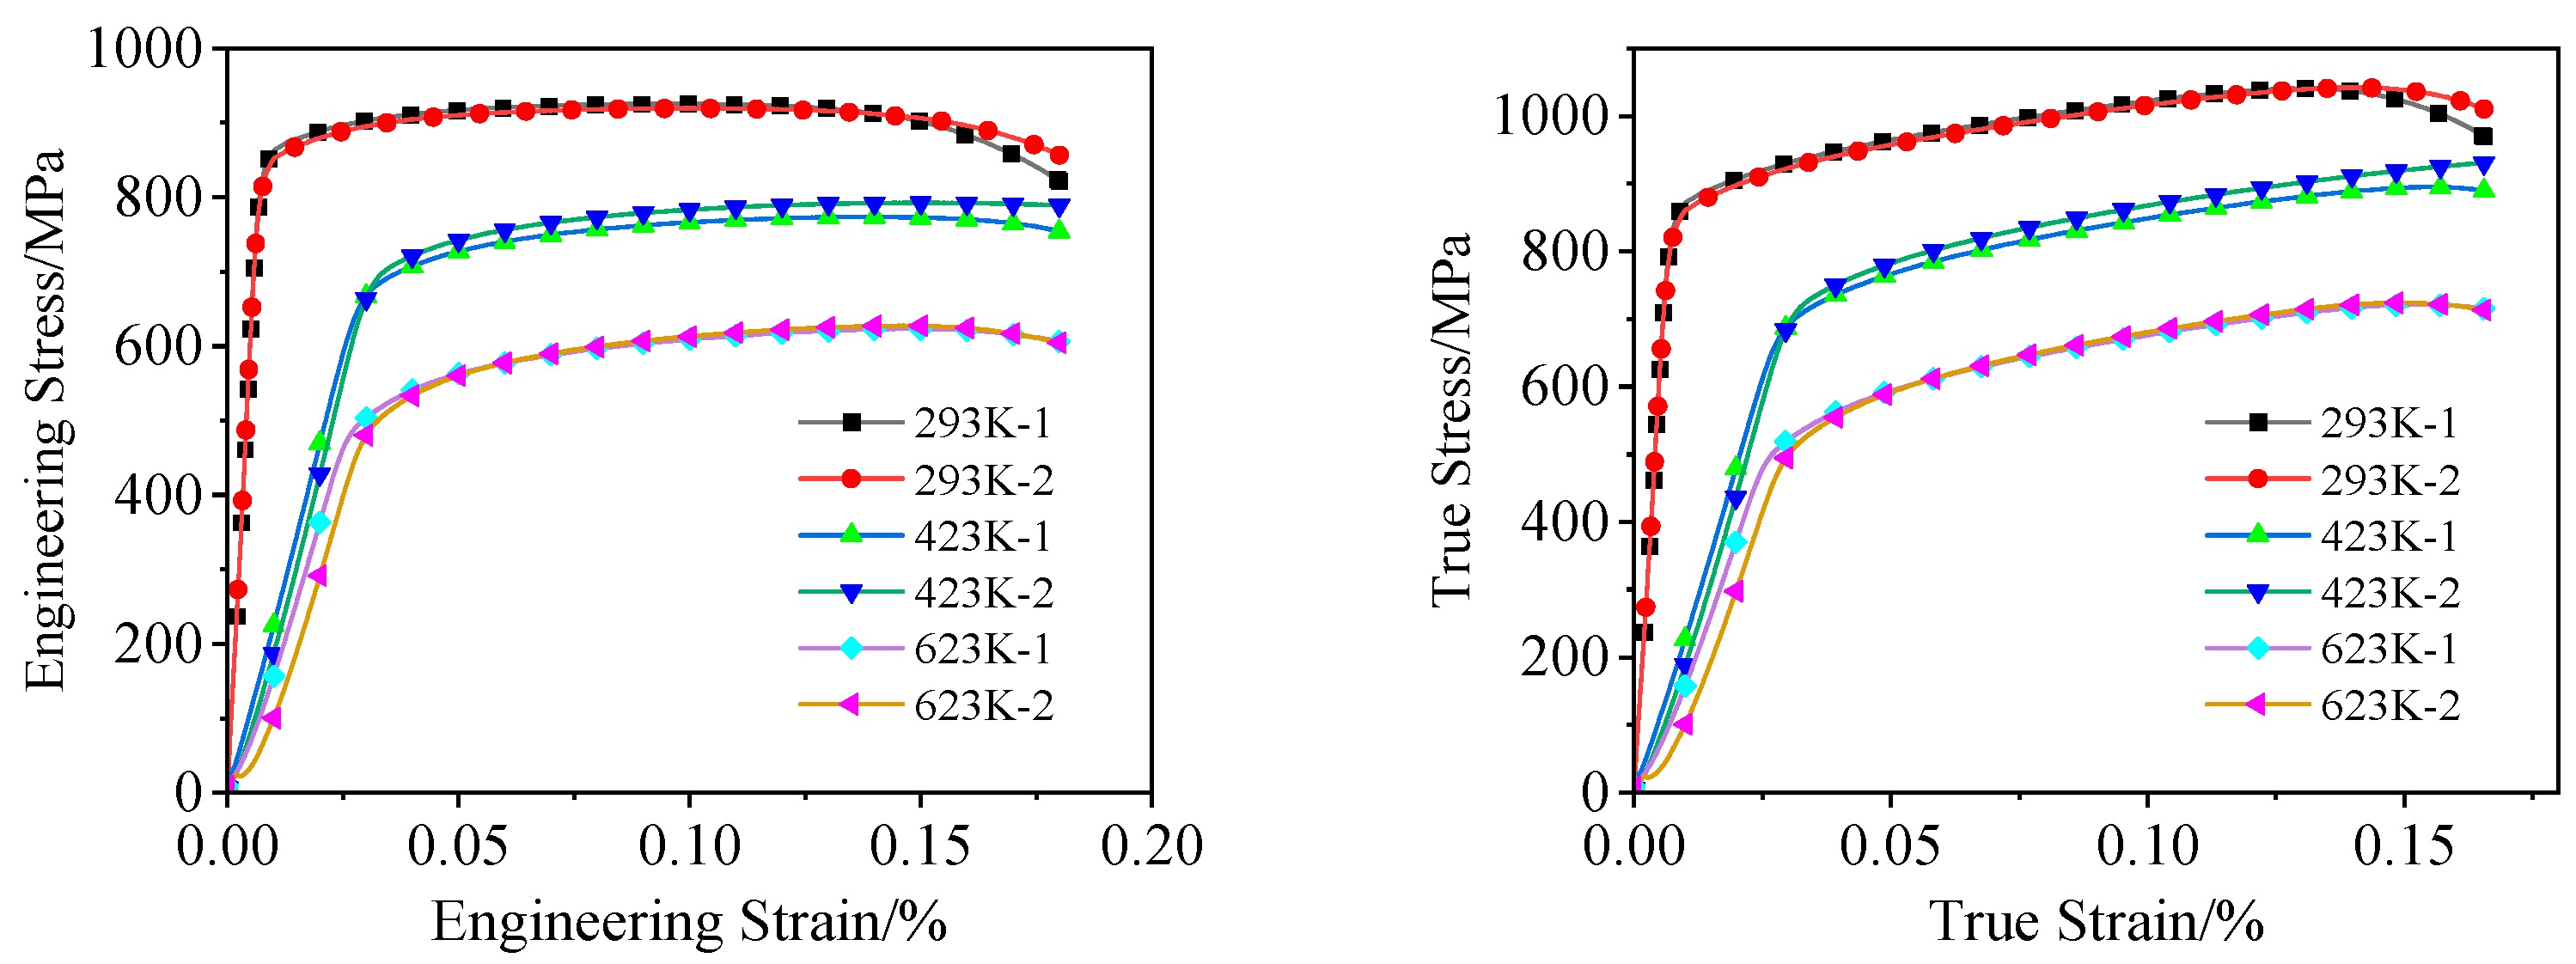
Figure 2 presents the engineering and true stress–strain curves of smooth tensile specimens for TC4 alloy under a strain rate of 0.001 s−1 at varying temperatures, obtained after experimental data processing. As shown in the figure, no distinct yield plateau is observed for TC4 alloy at room temperature (293 K). Consequently, the engineering stress corresponding to 0.2% plastic strain was defined as the yield strength. The yield strengths derived from two repeated tests were averaged, yielding a final yield strength of 848 MPa. In the initial tensile stage, the stress increases linearly with strain. Upon entering the plastic deformation stage, the stress growth rate significantly decreases, indicating weak strain-hardening behavior. Under the same strain rate, the yield strength of the alloy markedly declines with increasing temperature, demonstrating a pronounced thermal-softening effect.
Figure 3 presents the engineering and true stress–strain curves of notched specimens under quasi-static tensile loading at room temperature. The notch radius significantly influences the load-bearing capacity and post-fracture elongation of the specimens. Specifically, the fracture elongation increases with larger notch radii, while the flow stress decreases correspondingly. This inverse relationship indicates that specimens with larger notch radii exhibit enhanced ductility due to reduced stress concentration and improved plastic deformation capability. Based on Figure 3, as the notch size increases from 3 mm to 9 mm, the variation between the stress and strain curves becomes progressively smaller. This indicates that with increasing notch radius, the decreasing trend of the strain concentration effect at the notch gradually diminishes. Furthermore, the stress–strain curves for the 6 mm notch and the 9 mm notch show little difference. This is because the TC4 alloy exhibits good ductility, resulting in a relatively large critical size beyond which the notch effect becomes insignificant.
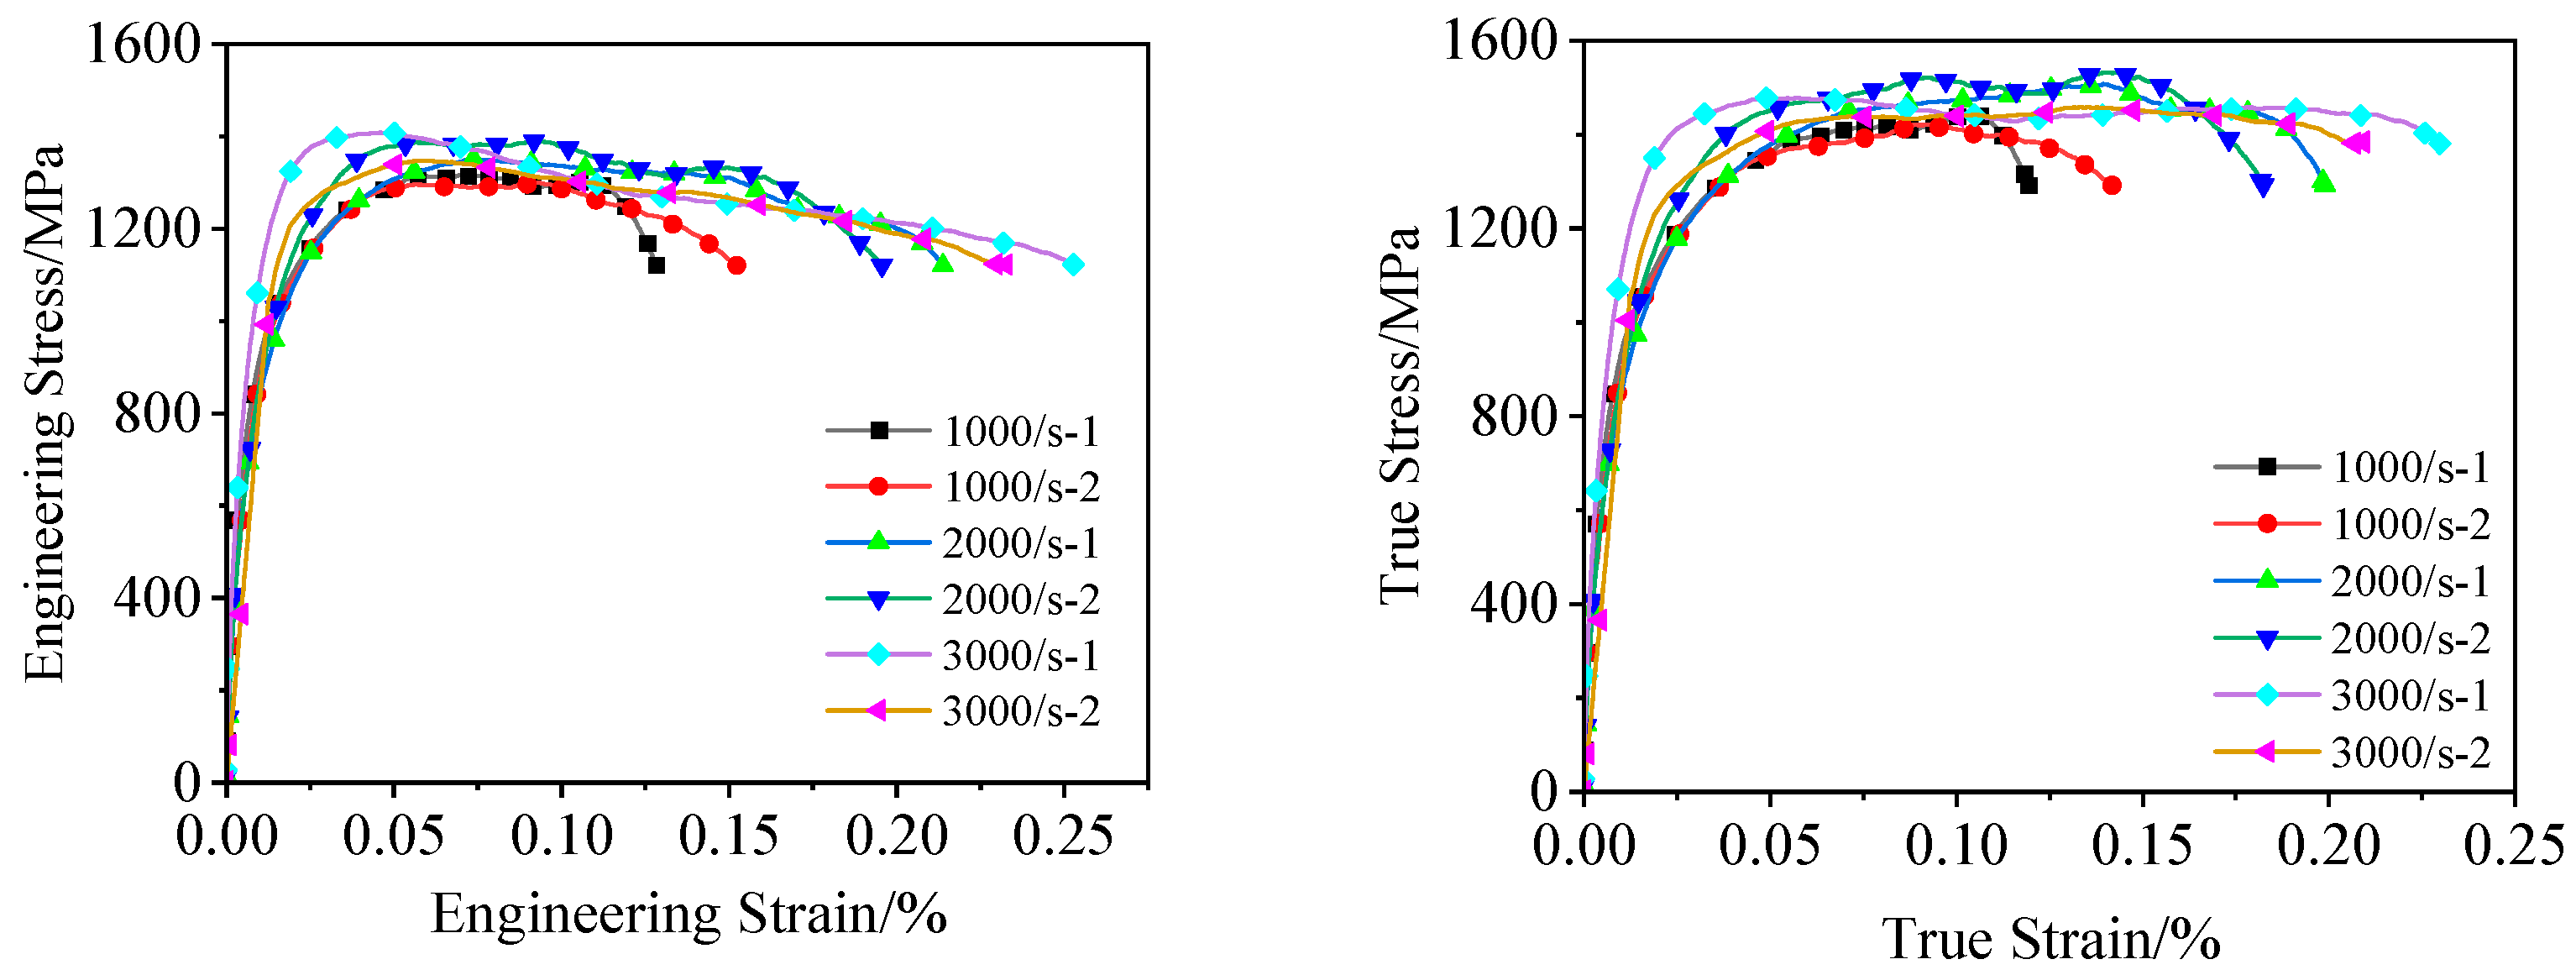
Dynamic tensile tests at room temperature were conducted using a split Hopkinson pressure bar (SHPB) system (ZONE-DE, Jinan, China) under strain rates of 1000 s−1, 2000 s−1, and 3000 s−1, with two repetitions per strain rate group. Figure 4 displays the engineering and true stress–strain curves derived from these dynamic tensile tests. The results reveal that the yield strength of TC4 alloy under high strain rates is significantly higher than its quasi-static yield strength (848 MPa). However, within the tested strain rate range (1000 s−1 to 3000 s−1), the alloy exhibits only moderate strain rate sensitivity, accompanied by a comparatively weak strain-hardening effect.

3. Constitutive Model and Failure Criteria

3.1. Modification and Development of the J–C Constitutive Model

The J–C constitutive model is an empirical formulation proposed to characterize the flow stress behavior of metallic materials under high strain rates and elevated temperatures [11,12]. Widely adopted in engineering applications, its mathematical expression is given as follows:
σ e q = ( A + B ε e q n ) ( 1 + C l n ε e q ) ( 1 T m )
where A represents the yield strength at reference temperature and strain rate; B is the strain-hardening modulus; n is the strain-hardening exponent; C is the strain rate strengthening coefficient; m is the thermal-softening exponent; σ e q is the equivalent stress; ε e q is the equivalent plastic strain; ε e q   =   ε ˙ e q / ε ˙ 0 , where ε ˙ e q is the equivalent plastic strain rate and ε ˙ 0 is the strain rate; T   =   ( T T 0 ) / ( T m T 0 ) , where T is the test temperature, T m is the melting point, and the T 0 is the reference temperature.
The J–C constitutive model consists of three primary components that describe the strain hardening ( A   +   B ε e q n ) , strain rate strengthening ( 1   + C l n ε e q ) , and thermal softening of materials ( 1 T m ) . This formulation holistically integrates the relationships among equivalent stress, equivalent plastic strain, equivalent strain rate, and temperature, providing a comprehensive framework for characterizing material behavior under complex thermomechanical conditions.

3.1.1. Parameters A, B, and n

The constitutive model parameters A, B, and n were calibrated using quasi-static tensile test data from smooth specimens under reference strain rate and temperature conditions. Under these reference conditions, Equation (1) reduces to the following:
σ e q = ( A + B ε e q n )
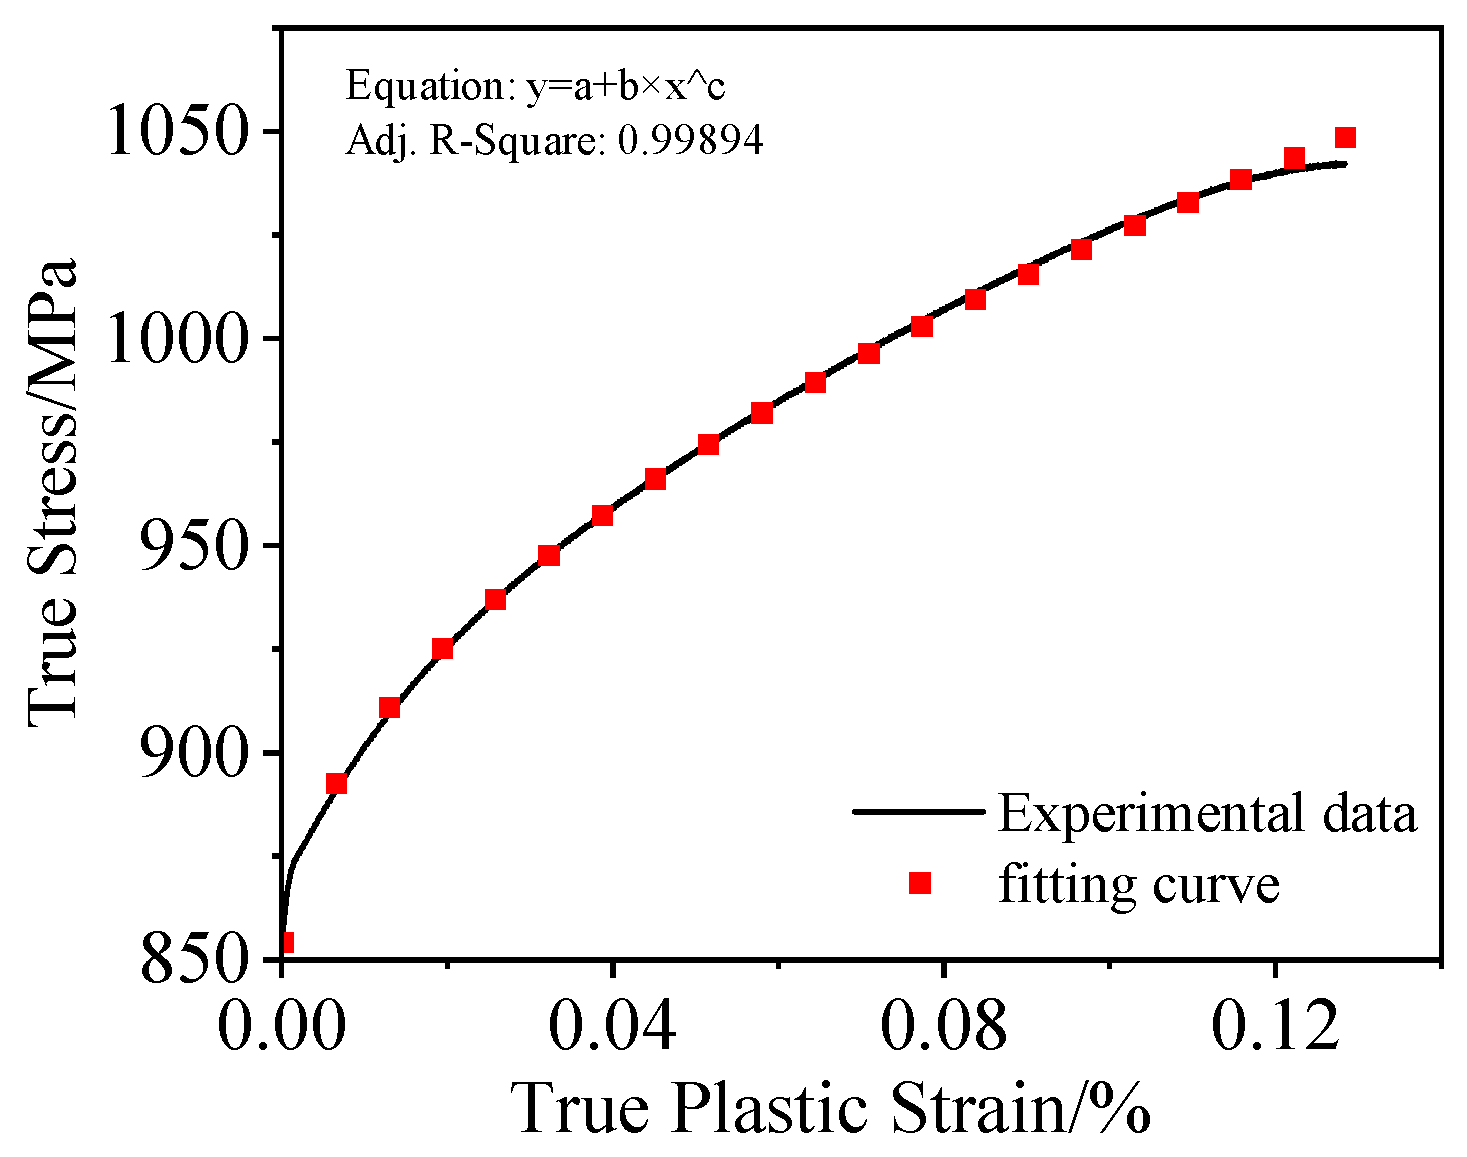
Based on the aforementioned quasi-static tensile tests, the material’s yield stress under reference temperature and strain rate conditions was determined to be 848 MPa, which corresponds to parameter A = 848 MPa. The plastic deformation region of the true stress–strain curve was subsequently fitted using Equation (2), as illustrated in Figure 5, yielding calibrated parameters B = 566 MPa, and n = 0.505.

3.1.2. Parameters C

The experimental data obtained from dynamic tensile tests can be utilized to calibrate the strain rate strengthening coefficient C, as shown in Figure 6. When the temperature is maintained at the reference temperature and the plastic strain is zero, Equation (3) simplifies to a linear function of parameter C:
σ e q / A 1 = C l n ε e q
The parameter C was calibrated as 0.033 through regression analysis of yield stresses corresponding to different strain rates.
Table 3 presents published research on the J–C model parameters for TC4 alloy in the literature, with all test data obtained using SHPB apparatus. The value of parameter C fitted in Reference [10] is essentially consistent with that obtained in this study. However, the result from Reference [13] is comparatively lower, which is attributed to the inclusion of multiple sets of tensile data at low and medium strain rates during their fitting process. The significant deviation observed in Reference [14] arises because they incorporated multiple low-strain-rate data sets. This suggests that the strain rate strengthening effect of TC4 alloy within the low and medium strain rate ranges is less pronounced than that observed at high strain rates.

3.1.3. Parameters m

The thermal-softening exponent m was determined using tensile test data obtained at varying temperatures under the reference strain rate. Under the reference strain rate and with zero plastic strain ( ε p   = 0), Equation (3) can be simplified as follows:
σ e q = A ( 1 T m )
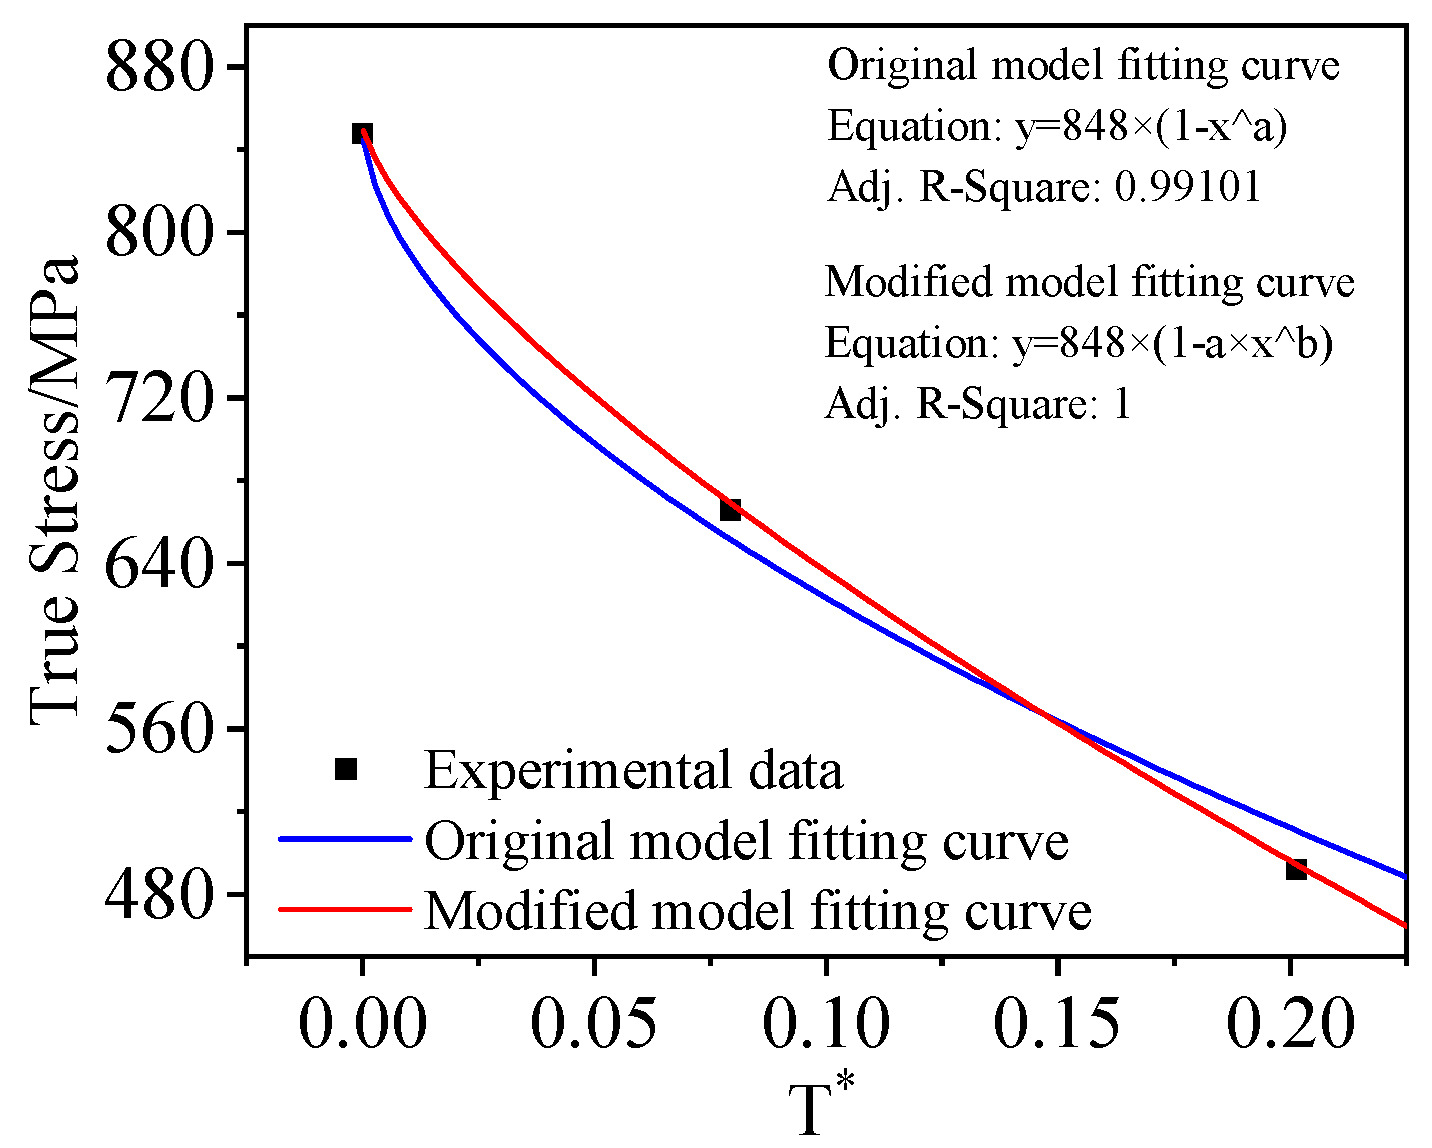
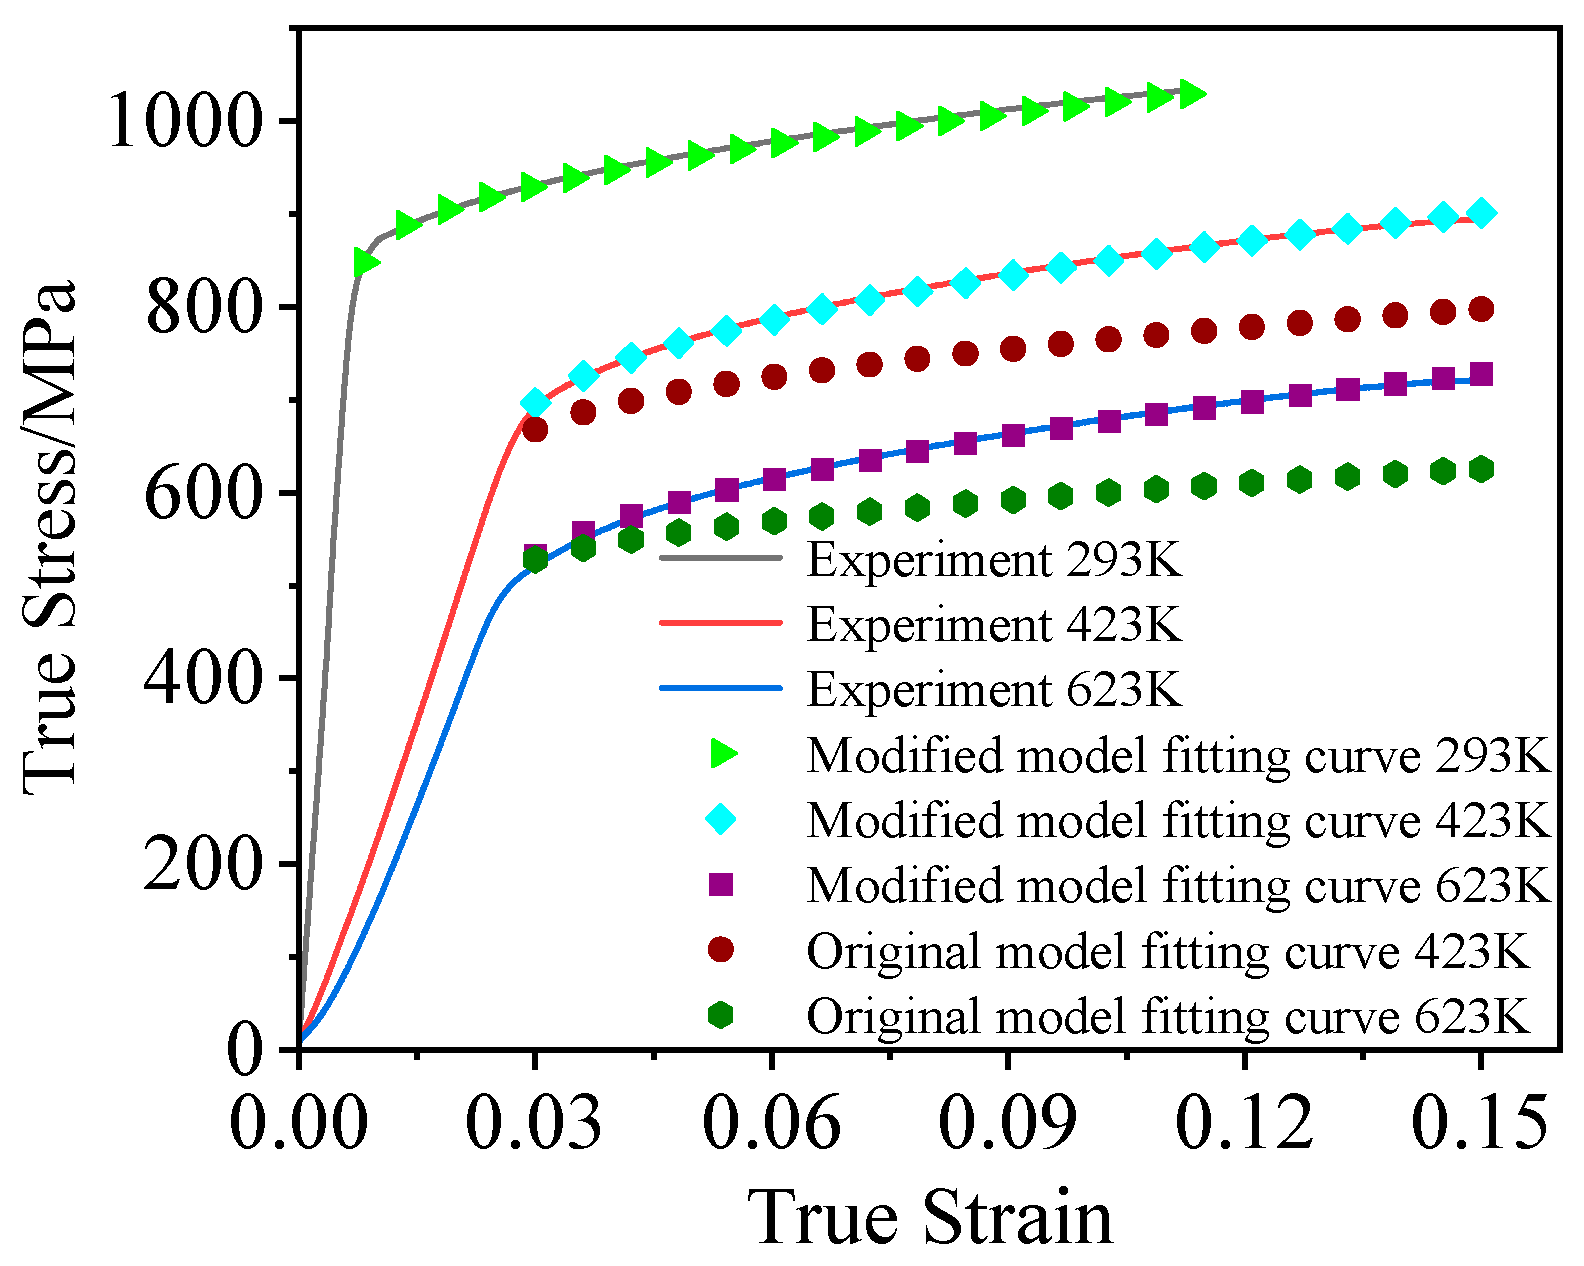
The thermal-softening exponent m = 0.571 was determined through regression analysis of the temperature-dependent yield stress data under the reference strain rate. However, the original thermal-softening term fails to accurately describe the relationship between flow stress and temperature. Thus, parameter m1 is introduced to modify the variation pattern of material yield strength with temperature. Additionally, it has been observed that the strain-hardening effect of the material changes as temperature increases. Therefore, parameters O and O1 are introduced, coupling with parameter T* to correct this effect. Consequently, Equation (6) was revised as follows:
σ e q = ( A + B ε e q n ( 1 + O 1 T O ) ) ( 1 m 1 T m )
where parameters O1, O, m1, and m are the thermal-softening parameters.
The experimental data fitting yielded the following parameters: O1 = 3.604, O = 0.754, m1 = 1.330, and m = 0.720. The calibration procedures for parameters m1 and m are illustrated in Figure 7. A comparison between the constitutive model predictions and experimental results at varying temperatures is presented in Figure 8. Based on Figure 8, it can be seen that the modified thermal-softening term can accurately describe the relationship between flow stress and temperature for the TC4 alloy at the reference strain rate. Specifically, the fitting function for 423 K achieves an adjusted R-squared coefficient of 0.997, while that for 623 K reaches an adjusted R-squared coefficient of 0.996.
In summary, the modified J–C constitutive model is expressed as follows:
σ e q = 848 + 566 × ε e q 0.505 ( 1 + ( 3.604 ) × T 0.754 ) 1 + 0.033 × l n ε e q ( 1 1.330 T 0.720 )

3.2. Calibration of J–C Failure Criterion Parameters

Ductile fracture failure in materials involves complex mechanical mechanisms. Accurately predicting material failure modes is of critical importance for engineering applications. The J–C failure model accounts for the relationships among fracture strain, stress triaxiality, strain rate, and temperature. It employs an accumulated damage criterion to predict failure initiation, with the damage accumulation formulated as follows:
D =   ( ε p / ε f )
where D is the damage variable, and Δε represents the strain increment per time step. The initial value of D is 0, and when D reaches 1 the material fractures.
The J–C failure criterion can be expressed as follows:
ε f = D 1 + D 2 e D 3 δ ( 1 + D 4 l n ε e q ) ( 1 + D 5 T )
where ε f is the fracture strain; D 1 , D 2 , D 3 , D 4 , and D 5 are the equation parameters; δ is the stress triaxiality defined as the ratio of the hydrostatic stress to the equivalent stress.

3.2.1. Parameters D1, D2, D3

Under the reference strain rate and reference temperature, the relationship between fracture strain and stress triaxiality is shown below:
ε f = D 1 + D 2 e D 3 δ
Based on Equation (11), the parameters were calibrated using the fracture strain and stress triaxiality at fracture obtained from tensile tests on specimens with different notch radii.
Based on the principle of plastic incompressibility, the average fracture strain at the fractured cross-section can be calculated by measuring the specimen’s diameter before and after the tensile test [15]. In this study, the true failure strain of the material was calculated using Equation (12), formulated as follows:
ε f = ln A 0 / A f = 2 ln d 0 / d f
where A 0 is the original cross-sectional area of the specimen; A f is the cross-sectional area after fracture; d 0 is the original diameter of the specimen; and d f is the diameter of the fractured surface.
The stress triaxiality of a material characterizes its stress state. Research by Bridgman et al. [16] derived formulas for the stress triaxiality in cylindrical specimens with different notch geometries:
δ = 1 / 3 + l n ( 1 + ( a 2 r 2 ) / 2 a R )
where a is the minimum cross-sectional radius; R is the notch radius; and r is the distance from the selected point to the center of the cross-section. Based on this formula, it can be observed that the stress triaxiality (η) is highest at the center of the cross-section and gradually decreases outward. The average stress triaxiality for notched tensile specimens, calculated using the Bridgman formula, is summarized in Table 4.
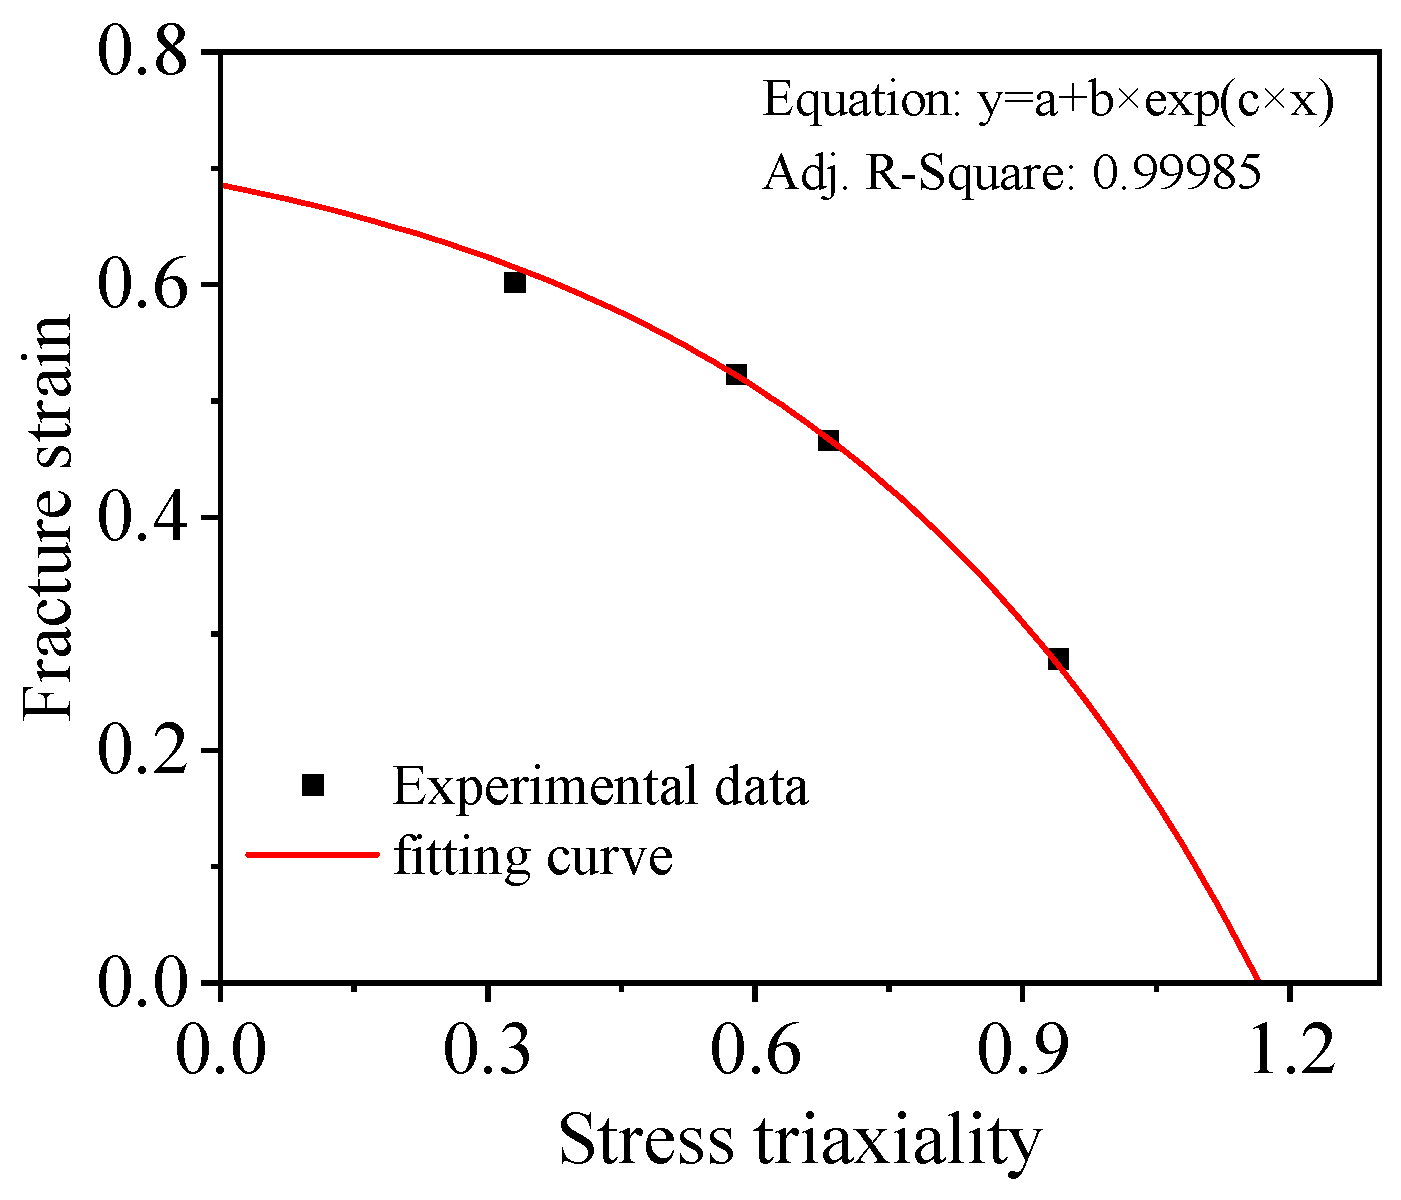
Based on the data in Table 2 and Equation (10), the failure parameters were fitted as D 1   = 0.762, D 2   = −0.077, and D 3   = 1.963. Figure 9 shows the fitting curves of the failure parameters D 1 , D 2 , D 3 . As illustrated in the figure, the fracture strain decreases with increasing stress triaxiality, and this decreasing trend aligns with the predictions of the J–C failure model.
.

3.2.2. Parameters D4, D5, and D6

With a, b, and c known, Equation (7) can be simplified under the reference temperature as follows:
ε f / ( D 1 + D 2 e D 3 δ ) = 1 + D 4 l n ε e q
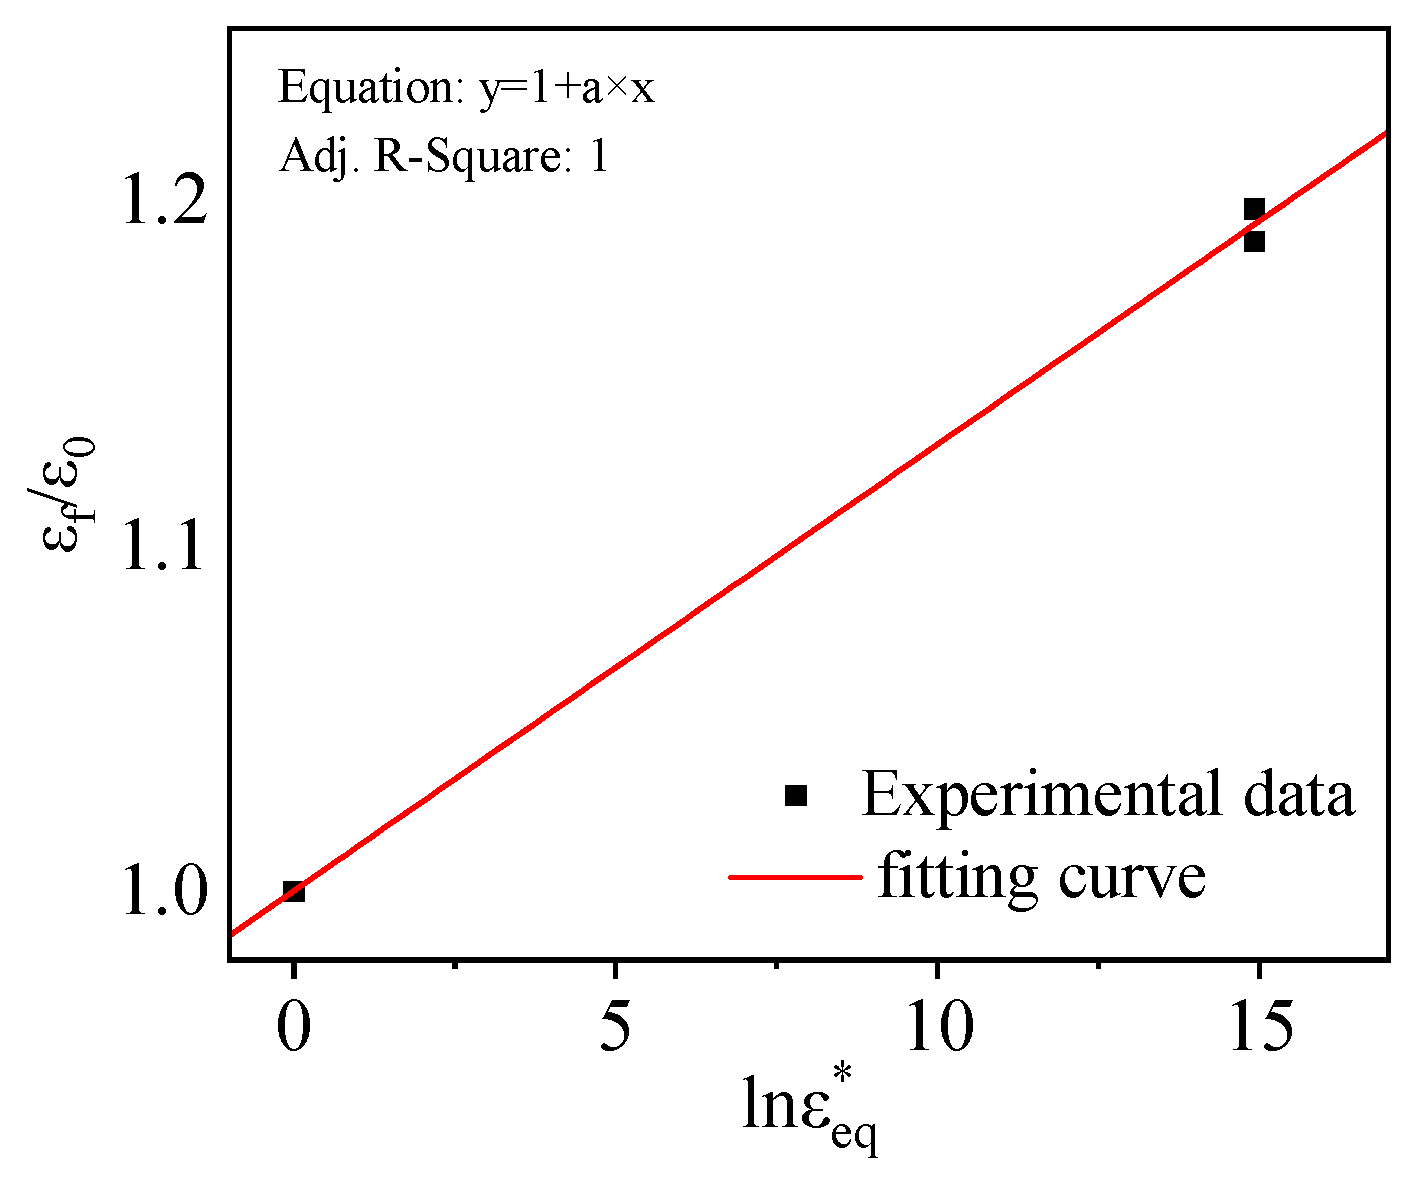
By defining D 1 + D 2 e D 3 δ as ε 0 , a linear relationship exists between ε f / ε 0 and ln ε e q , with D 4 as the slope. Using fracture strain data from dynamic tensile tests at different strain rates and Equation (14), the relationship is shown in Figure 10. The fitted parameter is 0.013. Under the reference strain rate, Equation (7) reduces to the following:
ε f / ( D 1 + D 2 e D 3 δ ) = 1 + D 5 T
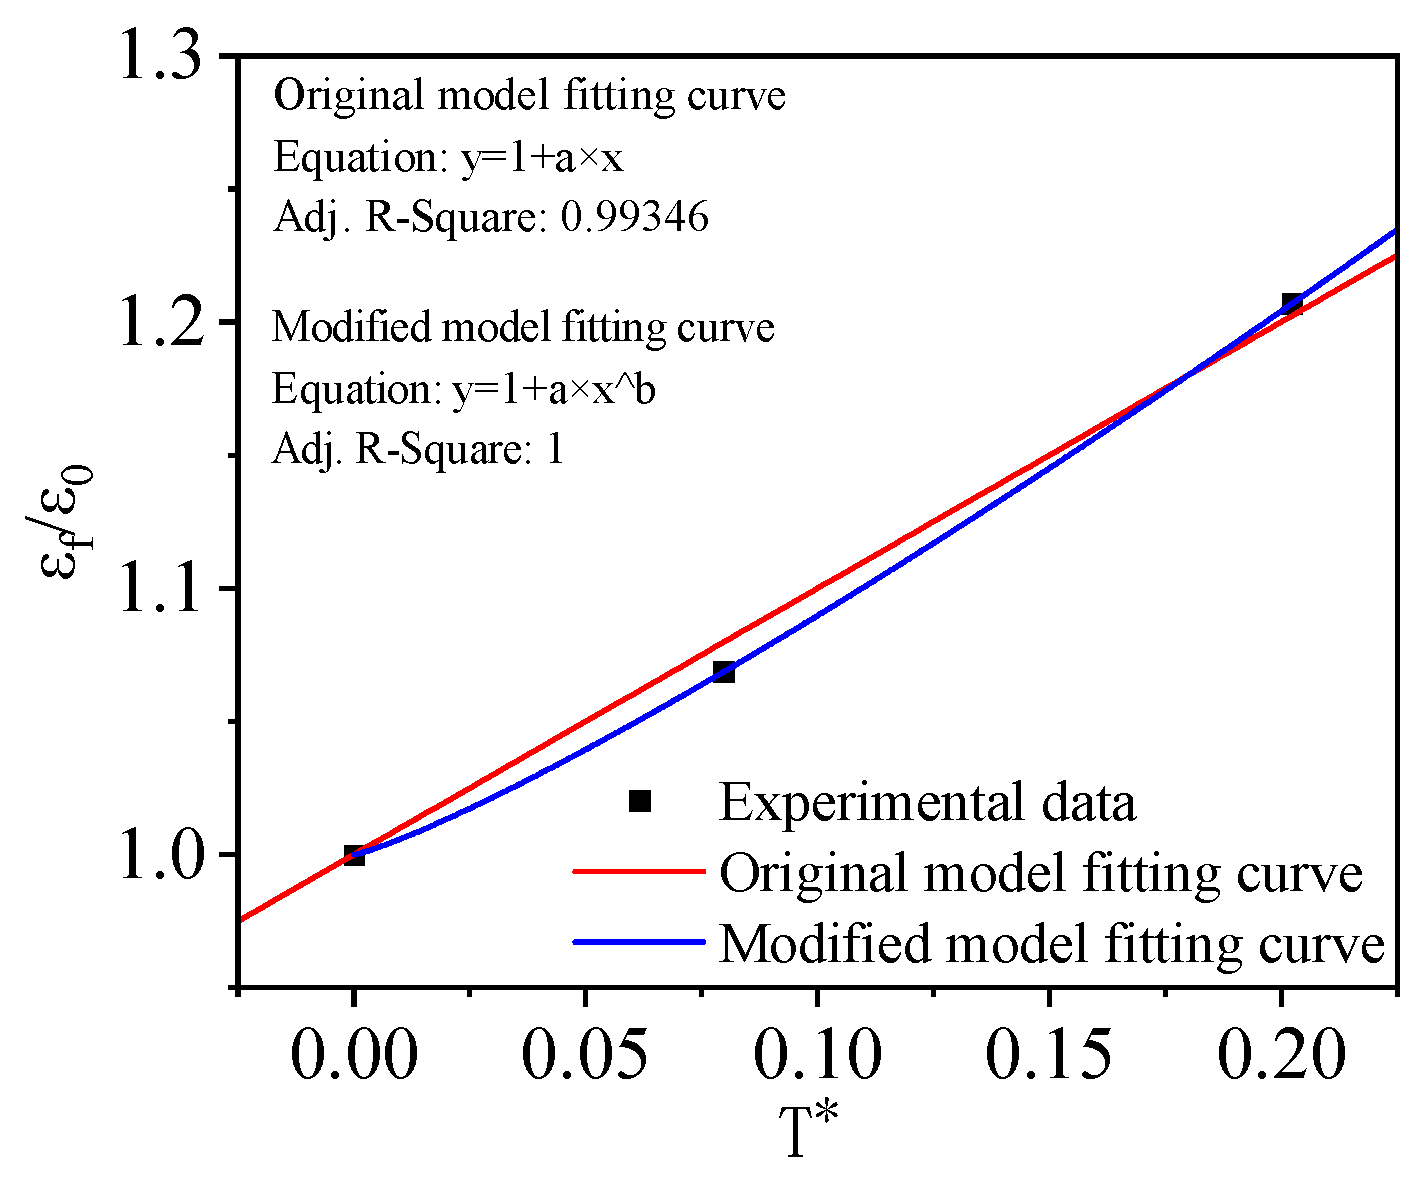
Here, a linear relationship is established between ε f / ε 0 and T , with D 5 as the slope. Using the fracture strain data from tensile tests at different temperatures and Equation (11), the correlation between ε f / ε 0 and l n ε e q is illustrated in Figure 11. The parameter D 5   = 1 is derived from the fitted curve. Figure 11 demonstrates that the relationship between temperature and failure strain is nonlinear. Consequently, Equation (15) is revised to Equation (16) and arrives at the fitting yields D 5   = 1.375 and D 6   = 1.185.
ε f / ( D 1 + D 2 e D 3 δ ) = 1 + D 5 T D 6
In summary, the calibrated J–C failure model is expressed as follows:
σ e q = 0.762 + 0.077 × e 1.963 δ ( 1 0.013 × l n ε e q ) ( 1 + 1.375 × T 1.185 )

4. Model Reliability Validation and Microscopic Fractography Analysis

To verify the reliability of the model parameters, experimental simulations were conducted using the finite element analysis software Abaqus 2022. A 1:1 scale finite element model based on an eight-node linear hexahedral element was established. To balance simulation efficiency and accuracy, the gauge section of the tensile specimen employed smaller mesh elements measuring 0.5 mm × 0.5 mm. The fitted constitutive model parameters and failure model parameters were imported into Abaqus for calculation using the explicit solver. By comparing the stress–strain curves and failure deformation results from both simulations and experiments, the reliability of the model was analyzed.
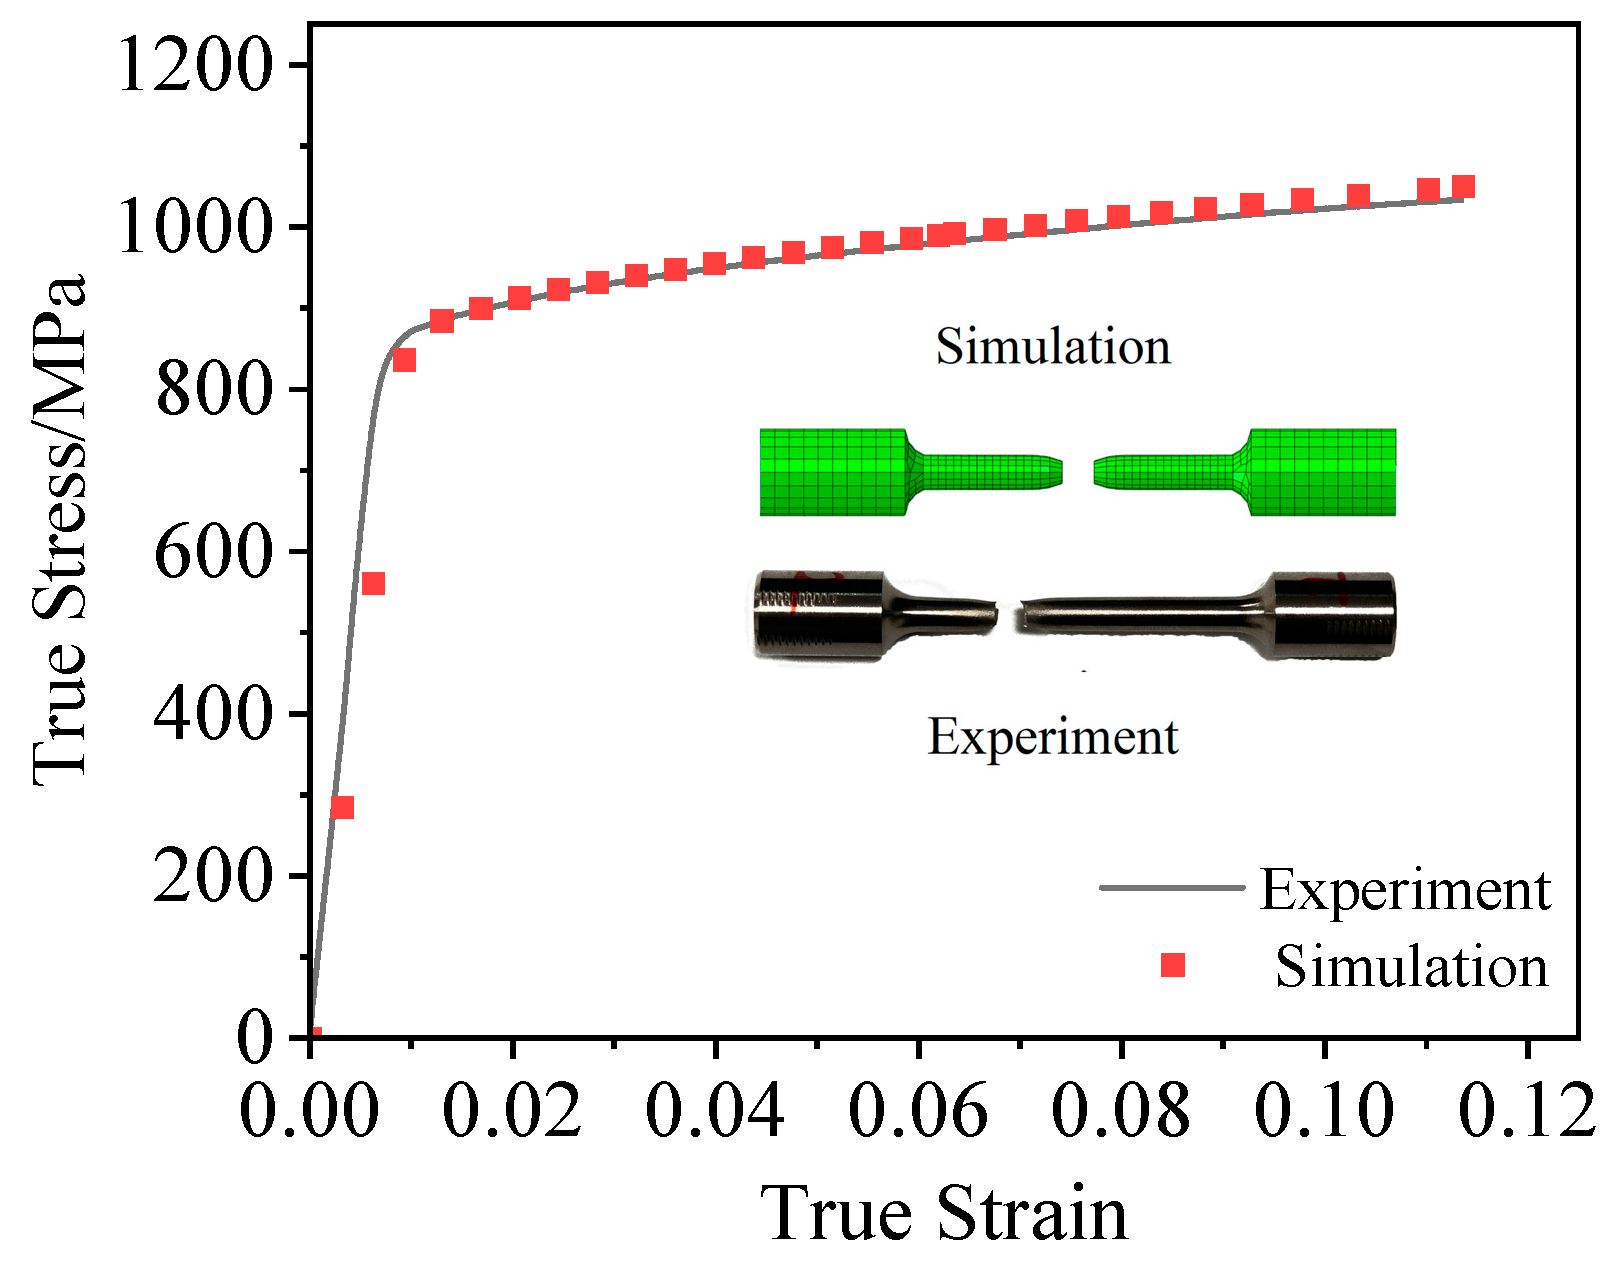
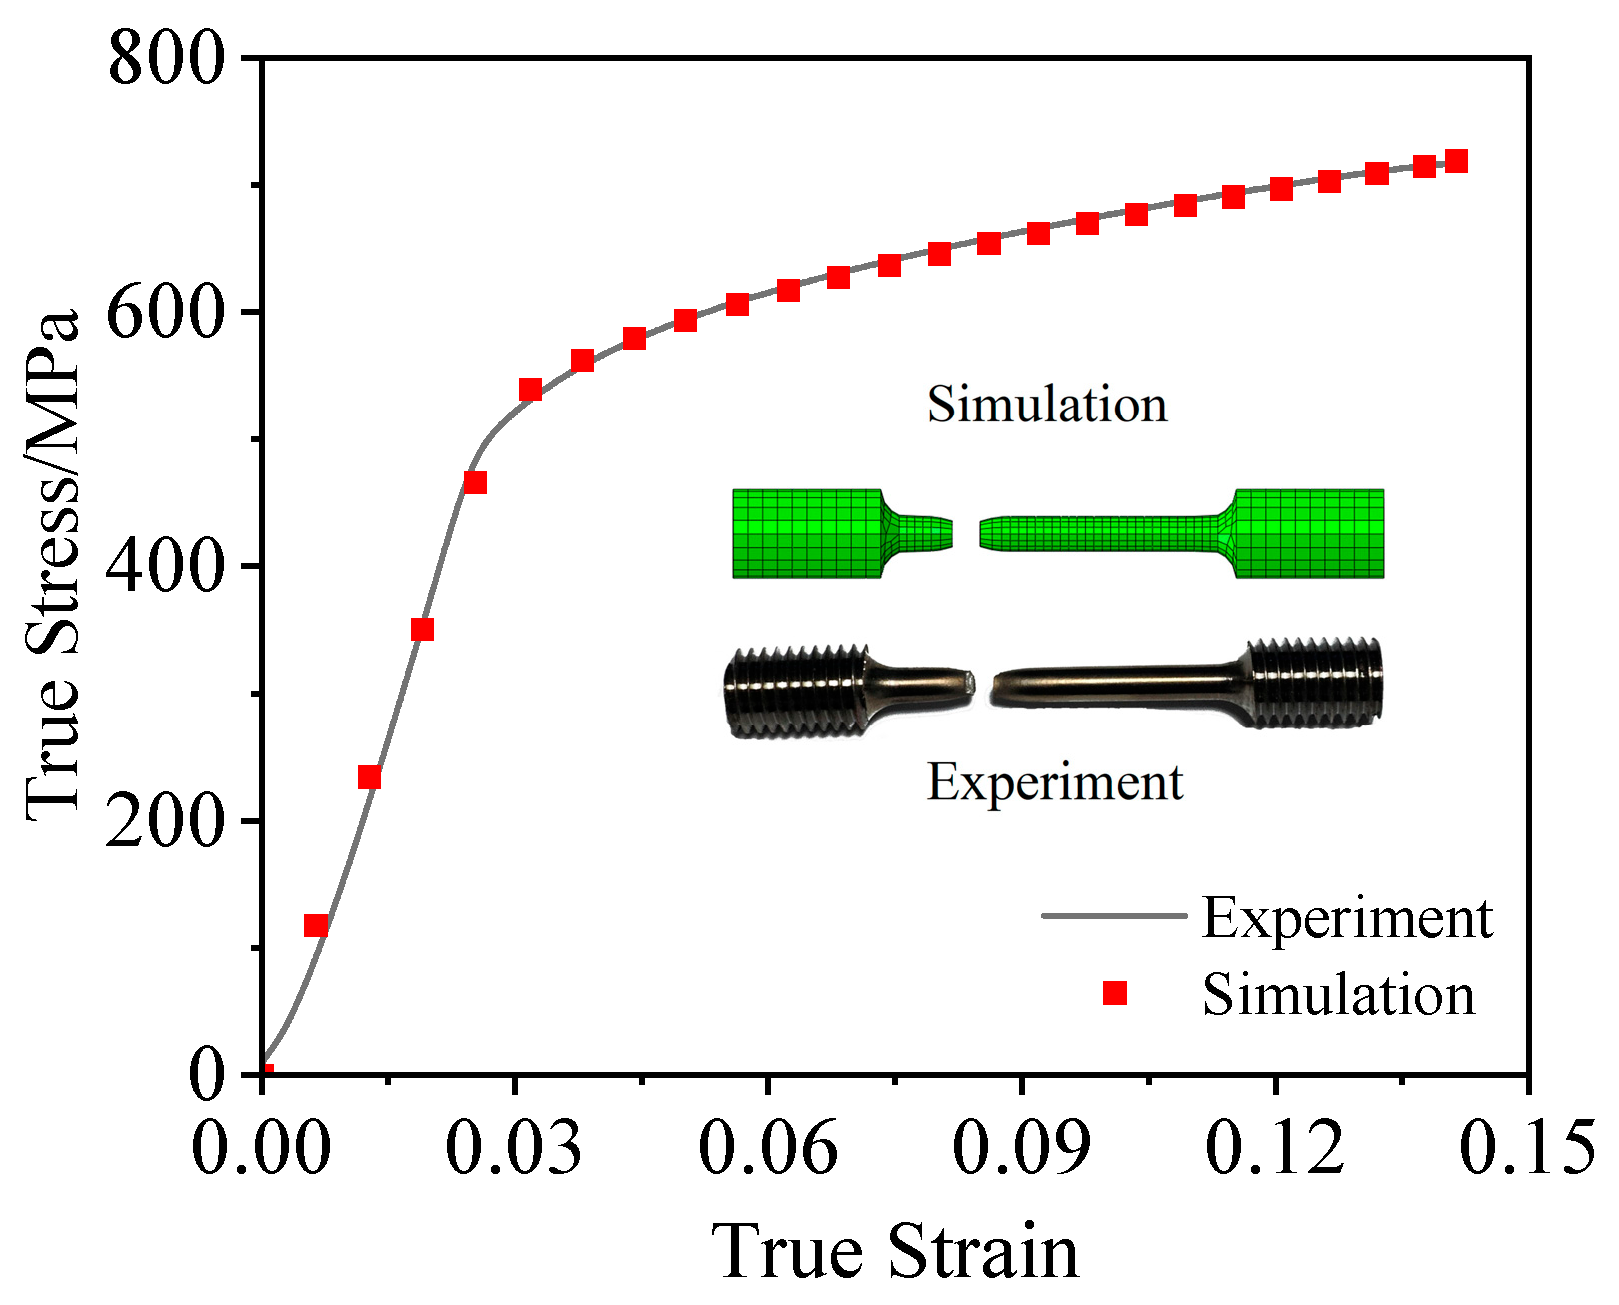
The comparison between quasi-static tensile test results and simulation results is shown in Figure 12. Figure 12 shows the comparison between the experimental stress–strain curve from a room temperature quasi-static tensile test (strain rate of 0.001 s−1) and the simulation stress–strain curve. Figure 13 shows the comparison between the experimental stress–strain curve from a high-temperature tensile test (temperature of 623 K) and the simulation stress–strain curve. As shown in Figure 12 and Figure 13, as the deformation temperature increases, the necking phenomenon of the alloy becomes more pronounced, and its plasticity significantly improves. At room temperature, the TC4 alloy undergoes uniform plastic deformation during tensile loading, typically necking near the geometric center, with final fracture occurring at the center of the necked region. At elevated temperatures, the strength of the TC4 alloy decreases while its plasticity increases. The necking location may shift closer to the gripping end, but the final fracture still occurs at the center of the necked region. Figure 14 shows the comparison between the experimental stress–strain curve from a dynamic tensile test (strain rate of 2000 s−1) and the simulation stress–strain curve. The results indicate that the simulated stress–strain curve exhibits a high degree of overlap with the experimental data, and the failure modes observed in the simulation and experiment are similar. This demonstrates that the constitutive equation parameters and failure model parameters fitted in this study can accurately reflect the mechanical properties and fracture failure behavior of the TC4 alloy under different strain rates and temperatures.
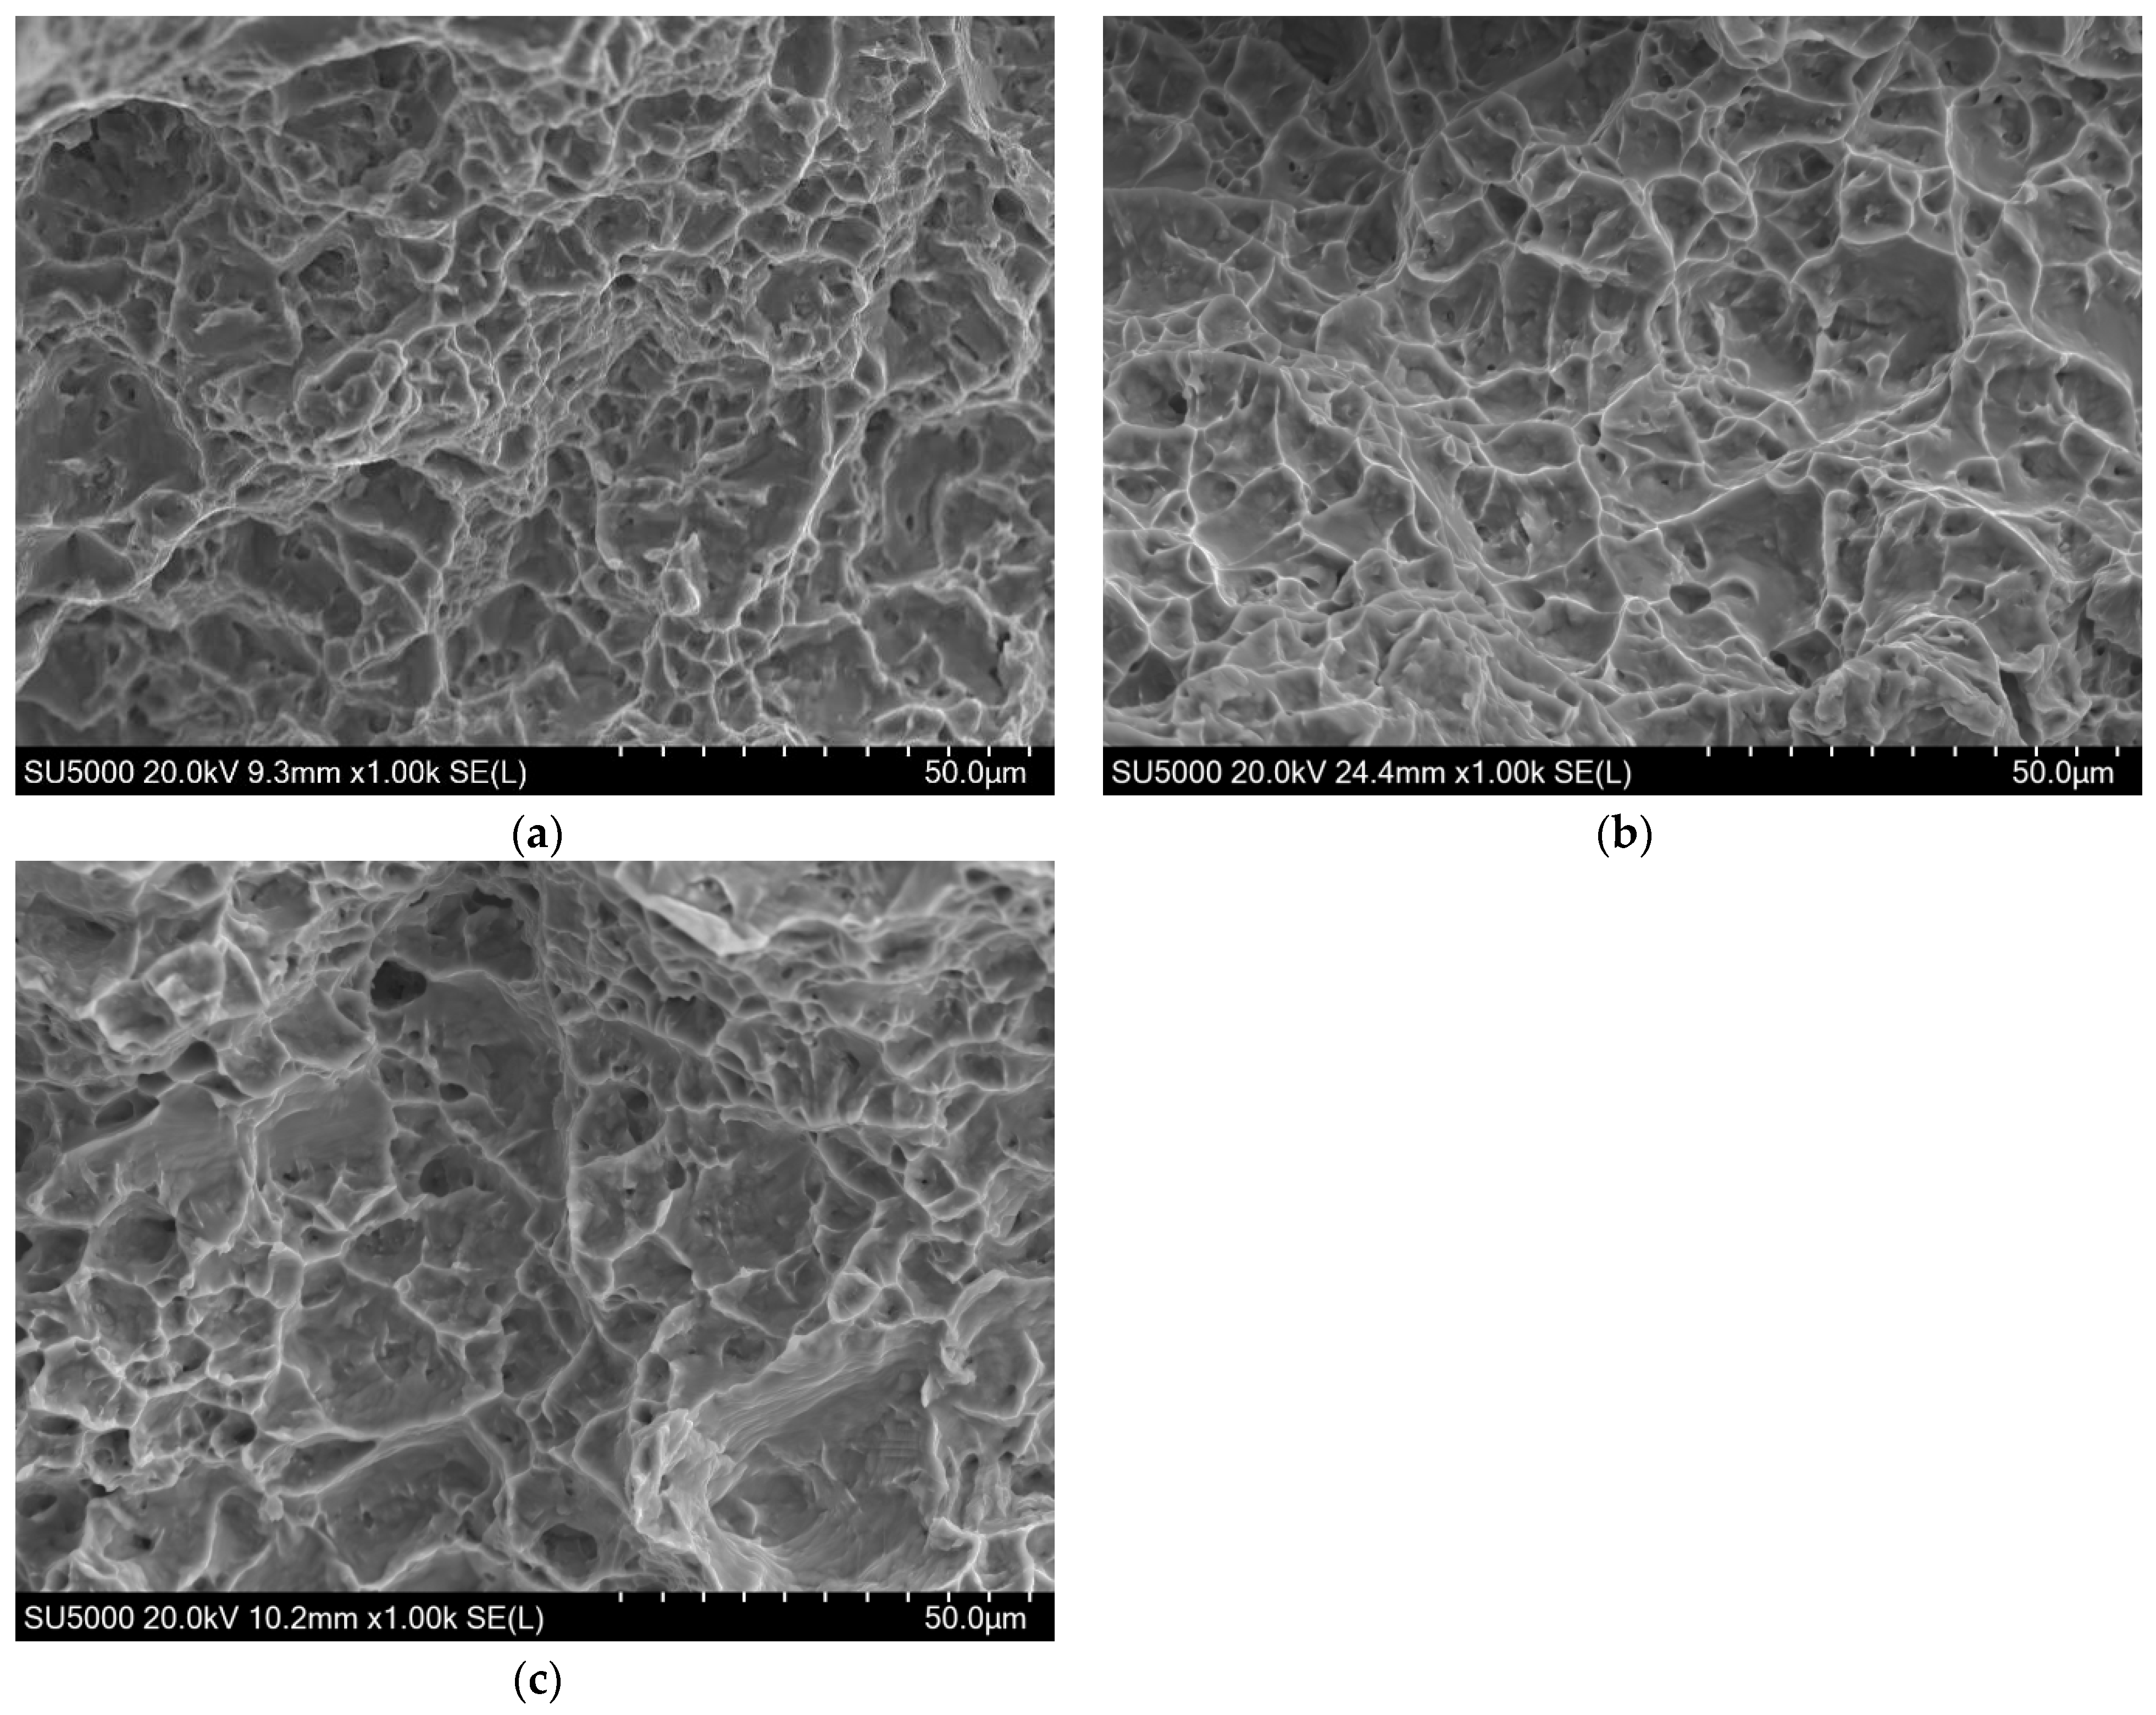
Figure 15 shows the fracture surface morphology of TC4 alloy with different temperature and strain rates. Fractographic analysis revealed that the material exhibits typical ductile fracture characteristics. The fracture surface is uniformly covered with equiaxed dimples measuring 5–8 μm in diameter (Figure 15a). Microvoids formed by debonding of secondary-phase particles are visible at the dimple bases, which is consistent with the plastic deformation mechanism of α + β dual-phase Ti alloys. At a strain rate of 3000 s−1, it can be seen that tear ridges with heights of 1–2 μm are distributed among the dimple clusters, as shown in Figure 15b. These ridges exhibit a radial extension direction oriented at a 45° angle relative to the crack propagation path, reflecting localized shear deformation characteristics accompanying the microvoid coalescence process. Furthermore, significant variations in void density are observed, which may correlate with local stress triaxiality fluctuations or strain localization induced by inhomogeneous β-phase distribution. As illustrated in Figure 15c, the fracture process in the alloy is predominantly governed by microvoid nucleation-growth-coalescence, aligning with the strain accumulation-driven damage evolution law described in the J–C failure model [17].

5. Conclusions

The stress flow behavior and fracture failure behavior of TC4 alloy were investigated through quasi-static tensile tests at room and elevated temperatures, as well as dynamic tensile tests. Based on the experimental results, the J–C constitutive model and failure model were modified. Combined with numerical simulations, the validity of the obtained model parameters was validated. The main conclusions are as follows.
In this paper, a universal material testing machine and Hopkinson bar were employed to conduct material tests under varying temperatures and strain rates, investigating the constitutive relationship and damage-failure behavior of TC4 alloy. The main results are as follows:
(1)
The flow stress of TC4 alloy decreases with increasing temperature, while its fracture strain increases with temperature elevation, exhibiting a significant temperature-softening effect. The notch radius notably influences the alloy’s load-bearing capacity and post-fracture elongation, with larger notch radii resulting in better plasticity. Furthermore, within the strain rate range of 1000 s−1 to 3000 s−1, the strain-hardening effect of TC4 alloy appears relatively weak.
(2)
The J–C constitutive parameters and failure parameters were calibrated based on experimental data and validated through numerical simulations. The results demonstrate that the fitted J–C constitutive parameters and failure parameters can accurately describe the material’s mechanical properties as well as its deformation and failure behavior.
(3)
The fractographic analysis of TC4 alloy under varying temperatures and strain rates reveals a ductile fracture mechanism dominated by microvoid nucleation, growth, and coalescence. At low strain rate (0.001 s−1), the fracture surfaces exhibit uniformly distributed equiaxed dimples (5–8 μm) with secondary-phase particle debonding-induced microvoids, consistent with the plastic deformation behavior of α + β dual-phase Ti alloys. At high strain rate (3000 s−1), localized shear deformation is evidenced by tear ridges (1–2 μm height) aligned at 45° to the crack propagation path.

Author Contributions

Conceptualization, J.Z. and Z.Y.; methodology, Z.Y.; software, H.Z. and N.D.; validation, J.Z., N.D. and H.Z.; formal analysis, H.Z. and T.H.; writing—original draft preparation, J.Z. and H.Z.; writing—review and editing, Z.Y. and T.H.; funding acquisition, Z.Y. and J.Z. All authors have read and agreed to the published version of the manuscript.

Funding

This research was funded by Fundamental Research Program of Shanxi Province, grant number 202303021212180.

Data Availability Statement

The original contributions presented in this study are included in the article. Further inquiries can be directed to the corresponding author.

Conflicts of Interest

Author Tong Huang was employed by the company Northern Development Investment Co., Ltd. The remaining authors declare that the research was conducted in the absence of any commercial or financial relationships that could be construed as a potential conflict of interest.

References

  1. Zou, Z.Y.; Dunstan, M.K.; McWilliams, B.; Robertson, S.; Hague, R.; Simonelli, M. Development of low-cost Ti alloys with a balanced strength and ductility with generation of ultra-fine microstructures. J. Alloys Compd. 2025, 1030, 180786. [Google Scholar] [CrossRef]
  2. Zhan, J.W.; Ma, C.H.; Liu, J.L.; Zhao, H.J.; He, J.J. Improved dynamic impact behavior of TC4 alloy coated with Ti-SiC. Mater. Lett. 2025, 395, 138727. [Google Scholar] [CrossRef]
  3. Zhang, W.J.; Liu, H.X.; Liu, Z.Q.; Liang, Y.Y.; Hao, Y. Experimental Study of Performance of Ti-6Al-4V Femoral Implants Using Selective Laser Melting (SLM) Methodology. Metals 2024, 14, 492. [Google Scholar] [CrossRef]
  4. Gao, B.X.; Barella, S.B.; You, B.J.; Xiao, H.; Yu, C.; Liu, C.Y.; Gruttadauria, A.; Mapelli, C. Study on the mechanism of synergistic improvement of bonding strength and elongation of Ti/Al composite plates by annealing treatment. Mater. Sci. Eng. A 2025, 941, 148603. [Google Scholar] [CrossRef]
  5. Wang, L.Y.; Li, Y.; Liu, G.P.; Lei, M.; Li, X.W.; Li, Y.L. Phase formation, microstructure evolution, corrosion behavior and mechanical properties of porous Ti prepared by heat-treating Ag-coated Ti plate. Mater. Charact. 2025, 224, 115067. [Google Scholar] [CrossRef]
  6. Wu, B.B.; Wang, Y.X.; Liu, X.M.; Zhang, D.; Zhou, S.H.; Deng, L.R.; Wang, L.Q.; Li, H. Investigation on dynamic deformation behavior of 7A75 aluminum alloy over wide strain rates and constitutive model establishment. J. Mater. Res. Technol. 2024, 30, 5963–5976. [Google Scholar] [CrossRef]
  7. Rajoria, S.R.; Gulhane, S.; Khan MD, F.; Sahoo, B.N. Hot deformation behavior study of coarse grained and ultrafine grained QE22 magnesium alloy through development of constitutive analysis and Johnson–Cook model. J. Alloys Compd. 2025, 1013, 178530. [Google Scholar] [CrossRef]
  8. Luo, X.T.; Zhang, C.T.; Zhu, H.J.; An, R.B. Modified Johnson-Cook constitutive model for butt-welded Q345 structural steel after high temperature cooling. J. Constr. Steel Res. 2025, 235, 109801. [Google Scholar] [CrossRef]
  9. Tao, Z.J.; Fan, X.G.; Yang, H.; Ma, J.; Li, H. A modified Johnson–Cook model for NC warm bending of large diameter thin-walled Ti–6Al–4V tube in wide ranges of strain rates and temperatures. Trans. Nonferrous Met. Soc. China 2018, 28, 298–308. [Google Scholar] [CrossRef]
  10. Wu, S.T.; Zhou, C.W.; Shi, Y.S.; Hu, A.; Xiao, X.K. Plasticity, ductile fracture and ballistic impact behavior of Ti-6Al-4V alloy. Int. J. Impact. Eng. 2023, 174, 104493. [Google Scholar] [CrossRef]
  11. Umbrello, D.; M’Saoubi, R.; Outeiro, J.C. The influence of Johnson-Cook material constants on finite element simulation of machining of AISI 316L steel. Int. J. Mach. Tools Manu. 2007, 47, 462–470. [Google Scholar] [CrossRef]
  12. Wang, H.; Zhao, K.X.; Chu, X.R.; Zhao, B.; Gao, J. Constitutive modelling and microscopic analysis of TC4 alloy sheet at elevated temperature. Results Phys. 2019, 13, 102332. [Google Scholar] [CrossRef]
  13. Deng, Y.F.; Zhang, Y.; An, J.D.; Zhang, T.C.; Zhou, C.P. Mechanical properties and constitutive relationship of TC4 titanium alloy. J. Vib. Shock. 2020, 39, 70–77. [Google Scholar]
  14. Hu, H.Z.; Xu, Z.J.; Dou, W.; Huang, F.L. Effects of strain rate and stress state on mechanical properties of Ti-6Al-4V alloy. Int. J. Impact Eng. 2020, 145, 103689. [Google Scholar] [CrossRef]
  15. Wang, X.Y.; Huang, C.Z.; Zou, B.; Liu, H.L.; Zhu, H.T.; Wang, J. Dynamic behavior and a modified Johnson-Cook constitutive model of Inconel 718 at high strain rate and elevated temperature. Mater. Sci. Eng. A 2013, 580, 385–390. [Google Scholar] [CrossRef]
  16. Bridgman, P.W. Studies in Large Plastic Flow and Fracture with Special Emphasis on the Effects of Hydrostatic Pressure; McGraw-Hill: New York, NY, USA, 1952. [Google Scholar]
  17. Bakhshan, H.; Oñate, E.; Carbonell, J.M. Microstructure evolution modeling of Ti6Al4V alloy during cutting using the Particle Finite Element Method and homogeneous field distributions. J. Manuf. Process. 2024, 131, 73–92. [Google Scholar] [CrossRef]
Figure 1. Configurations and sizes of the samples (a) smooth sample, (b) notch sample, and (c) dynamic sample. (unit: mm).
Metals 15 00951 g001
Figure 2. Engineering and true stress–strain curves of TC4 alloy under quasi-static tensile loading at different temperatures.
Metals 15 00951 g002
Figure 3. Engineering and true stress–strain curves of TC4 alloy notched specimens under quasi-static tensile loading: Effect of notch radius.
Metals 15 00951 g003
Figure 4. Engineering and true stress–strain curves of TC4 alloy under dynamic tensile loading at different strain rates.
Metals 15 00951 g004
Figure 5. Schematic illustration of the calibration procedures for parameters A, B, and n.
Metals 15 00951 g005
Figure 6. Schematic illustration of the calibration procedure for parameter C.
Metals 15 00951 g006
Figure 7. Schematic illustration of the calibration procedure for parameter m.
Metals 15 00951 g007
Figure 8. Comparison of experimental and model curves at a strain rate of 0.001 s−1.
Metals 15 00951 g008
Figure 9. Schematic illustration of the calibration procedure for parameter D 1 , D 2 , D 3 .
Metals 15 00951 g009
Figure 10. Schematic illustration of the calibration procedure for parameter D4.
Metals 15 00951 g010
Figure 11. Schematic illustration of the calibration procedure for parameter D5, D6.
Metals 15 00951 g011
Figure 12. Comparison of quasi-static tensile simulation and test results.
Metals 15 00951 g012
Figure 13. Comparison of high-temperature tensile simulation and test results.
Metals 15 00951 g013
Figure 14. Comparison of dynamic tensile simulation and test results.
Metals 15 00951 g014
Figure 15. Comparison of quasi-static tensile finite element simulation and experimental results: (a) Quasi-static tensile at room temperature with strain rate of 0.001 s−1; (b) Dynamic tensile test at room temperature with strain rate of 3000 s−1; and (c) High-temperature tensile at 623 K with strain rate of 0.001 s−1.
Metals 15 00951 g015
Table 1. Chemical component of TC4 alloy (at %).
AlVFeOCNHTi
6.384.170.280.180.090.040.013Bal.
Table 2. Physical properties of TC4 alloy at room temperature.
Density/(g × cm−3)Elastic Modulus/GPaPoisson’s RatioMelting Point range/°CTensile Yield Strength/MPaUltimate
Tensile Strength/MPa
4.511300.341600–16508481042
Table 3. Comparison between the present results and that in the literature for parameter C.
A/MPaB/MPanCMaximum Strain Rate/s−1
Ref. [10]895.2910.10.7490.0334219
Ref. [13]104010300.7570.0301137
Ref. [14]797.5305.70.2850.0206500
This study8485660.5050.0343000
Table 4. Failure strain of notched specimen.
R δ ε f
0 (smooth)0.3330.6022
30.9390.2785
60.6820.4663
90.5780.5227
Disclaimer/Publisher’s Note: The statements, opinions and data contained in all publications are solely those of the individual author(s) and contributor(s) and not of MDPI and/or the editor(s). MDPI and/or the editor(s) disclaim responsibility for any injury to people or property resulting from any ideas, methods, instructions or products referred to in the content.