
Study of the Intrinsic Factors Determining the Near-Threshold Fatigue Crack Propagation Behavior of a High-Strength Titanium Alloy

Abstract
1. Introduction
2. Materials and Experimental Methods
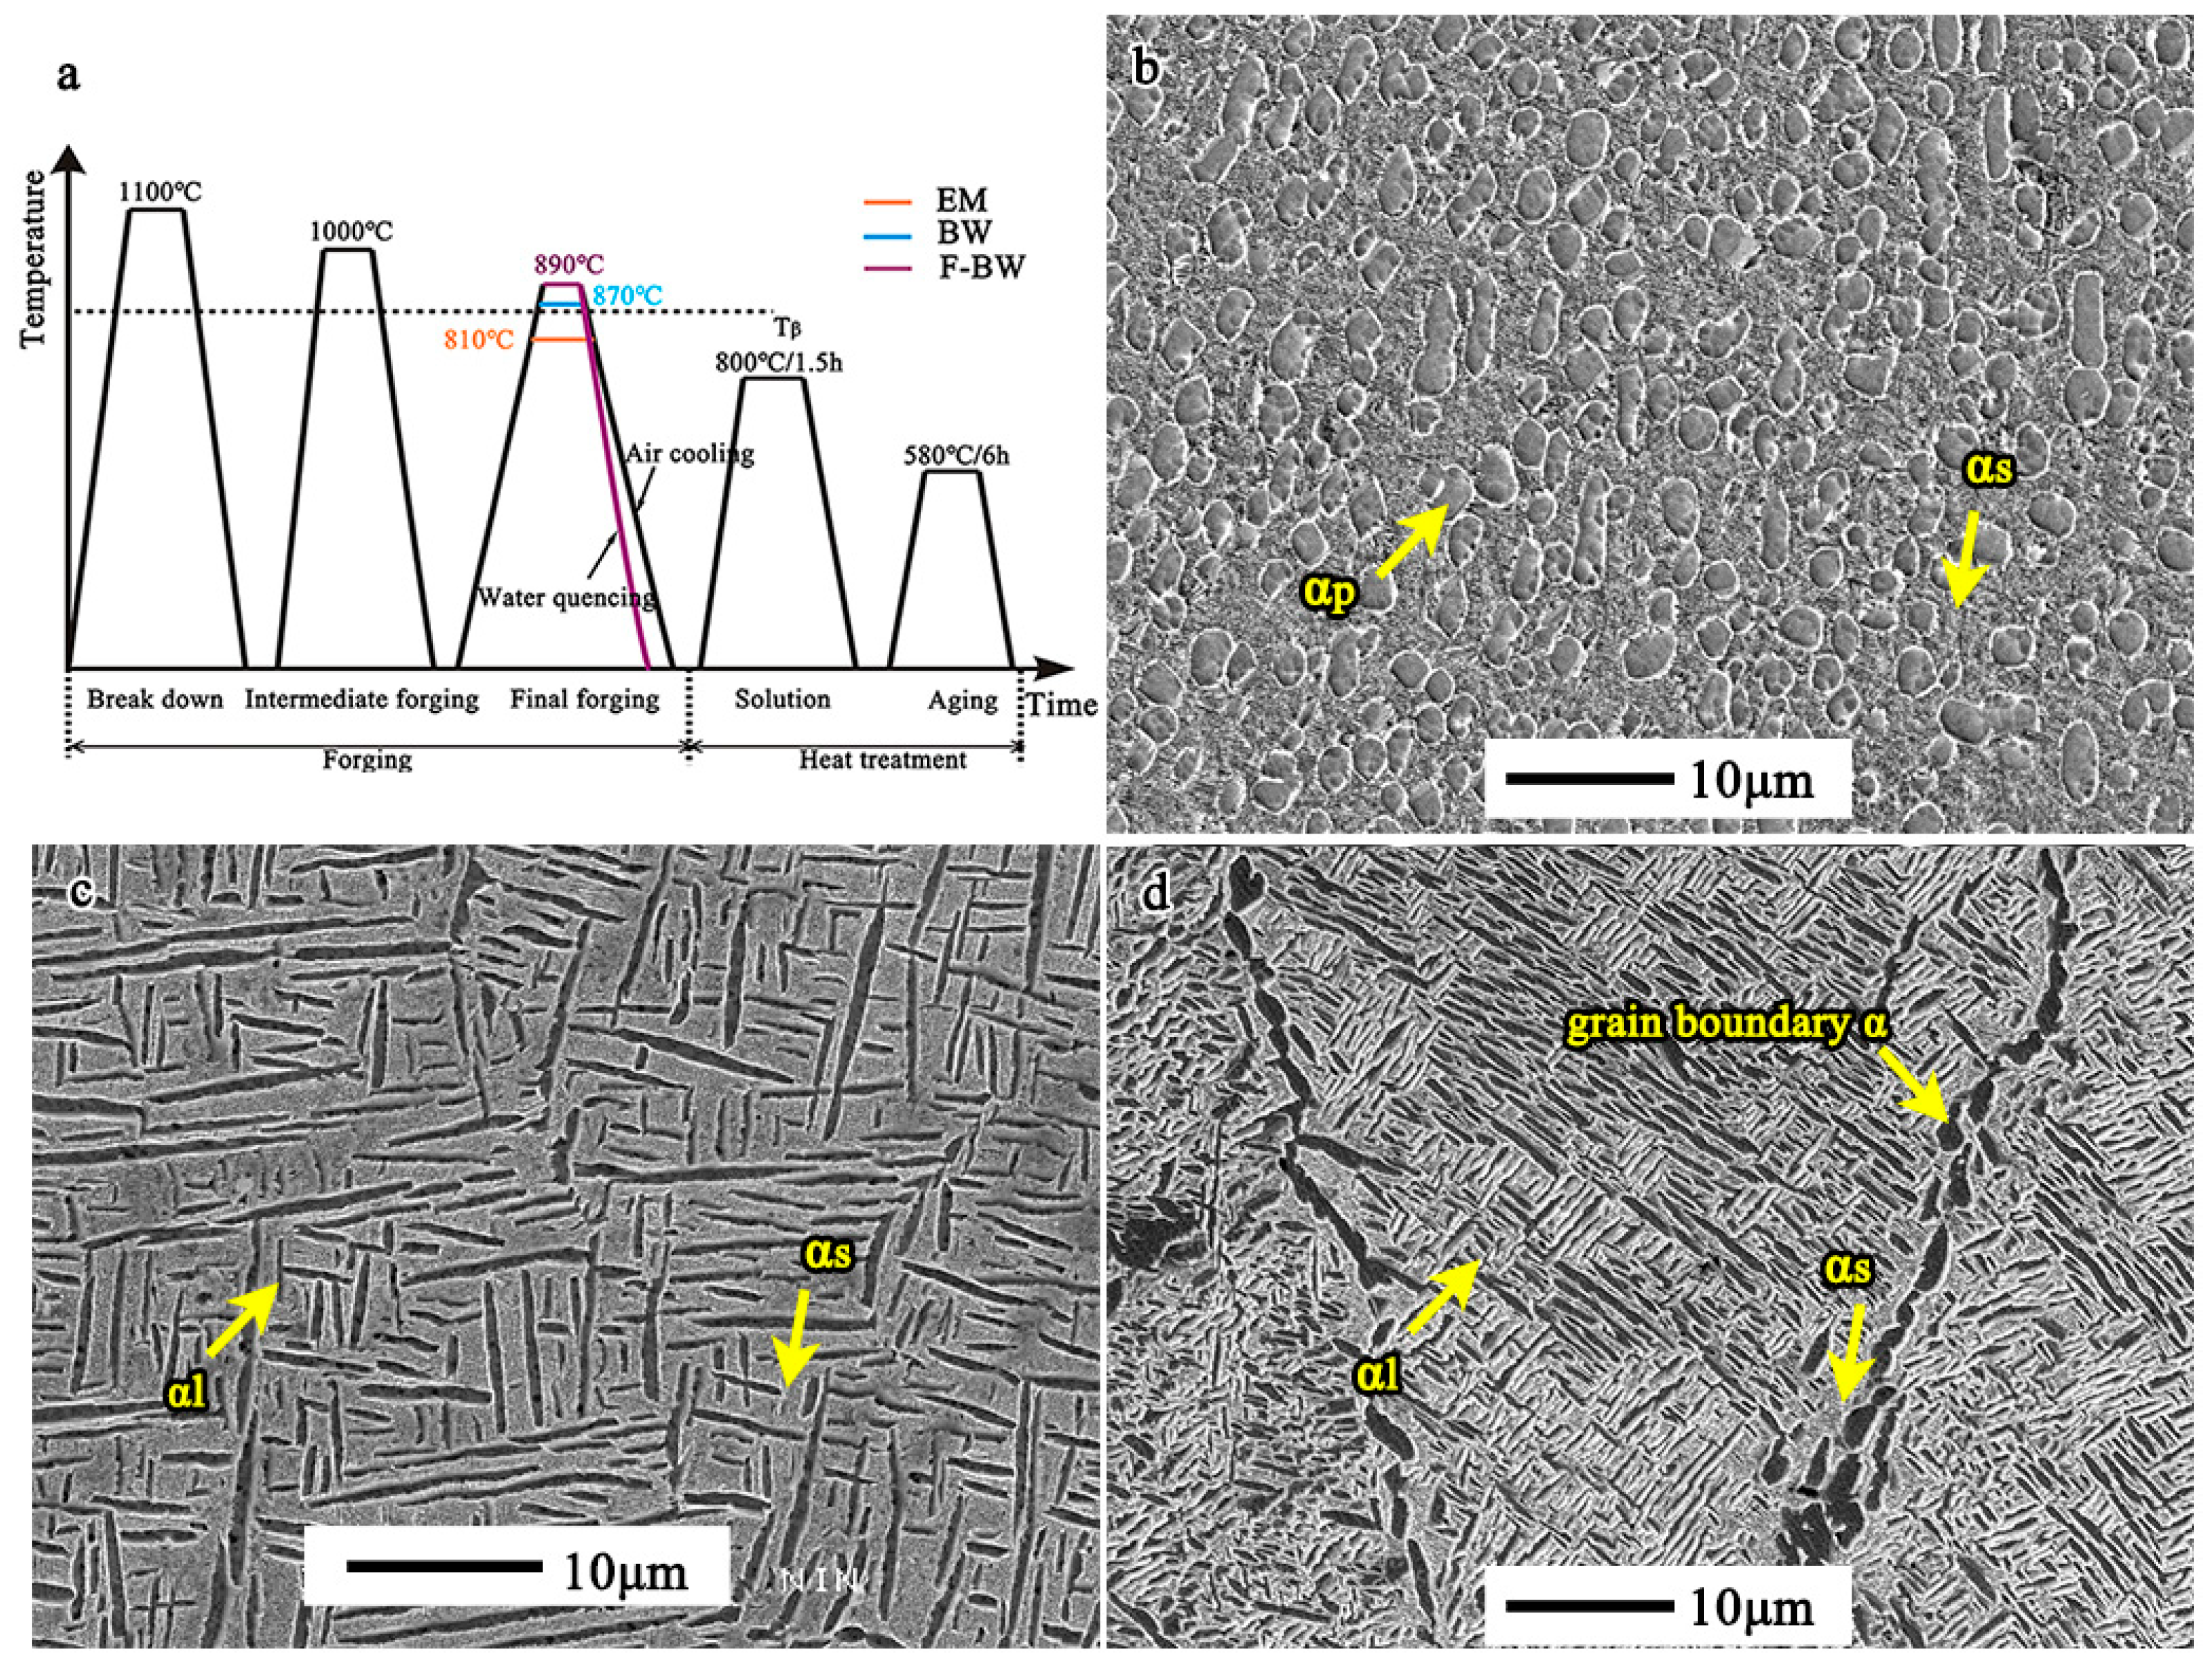
2.1. Materials
2.2. Experimental Methods
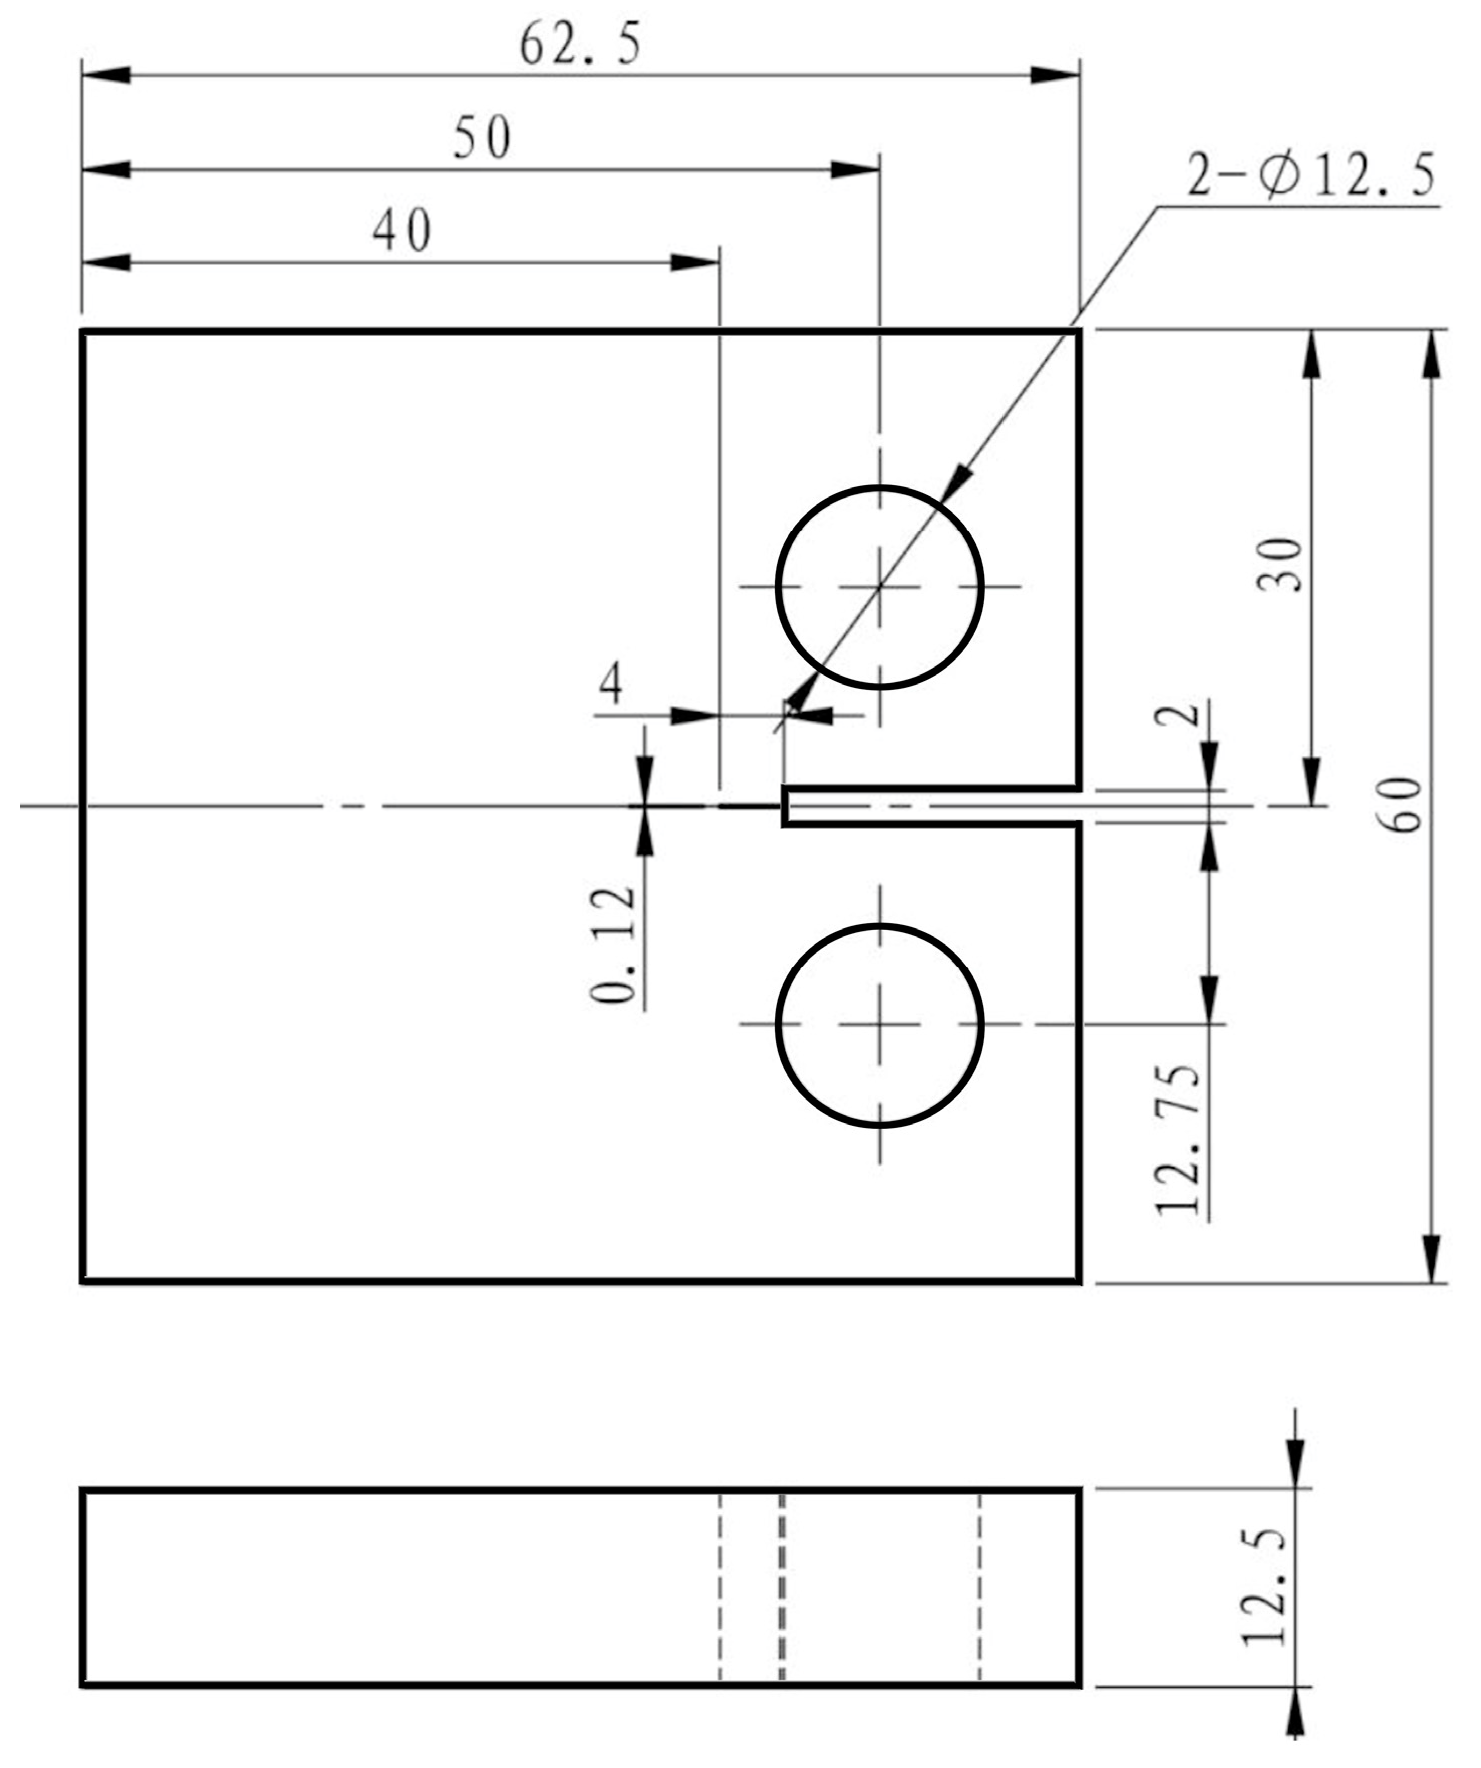
2.2.1. Fatigue Crack Propagation Rate Test
2.2.2. Characterization
3. Results
4. Discussion
4.1. Crack Propagation Path
4.2. Crystallographic Crack Propagation Mechanisms
4.3. Effects of Microstructures on Near-Threshold Fatigue Crack Propagation Behavior
5. Conclusions
- (1)
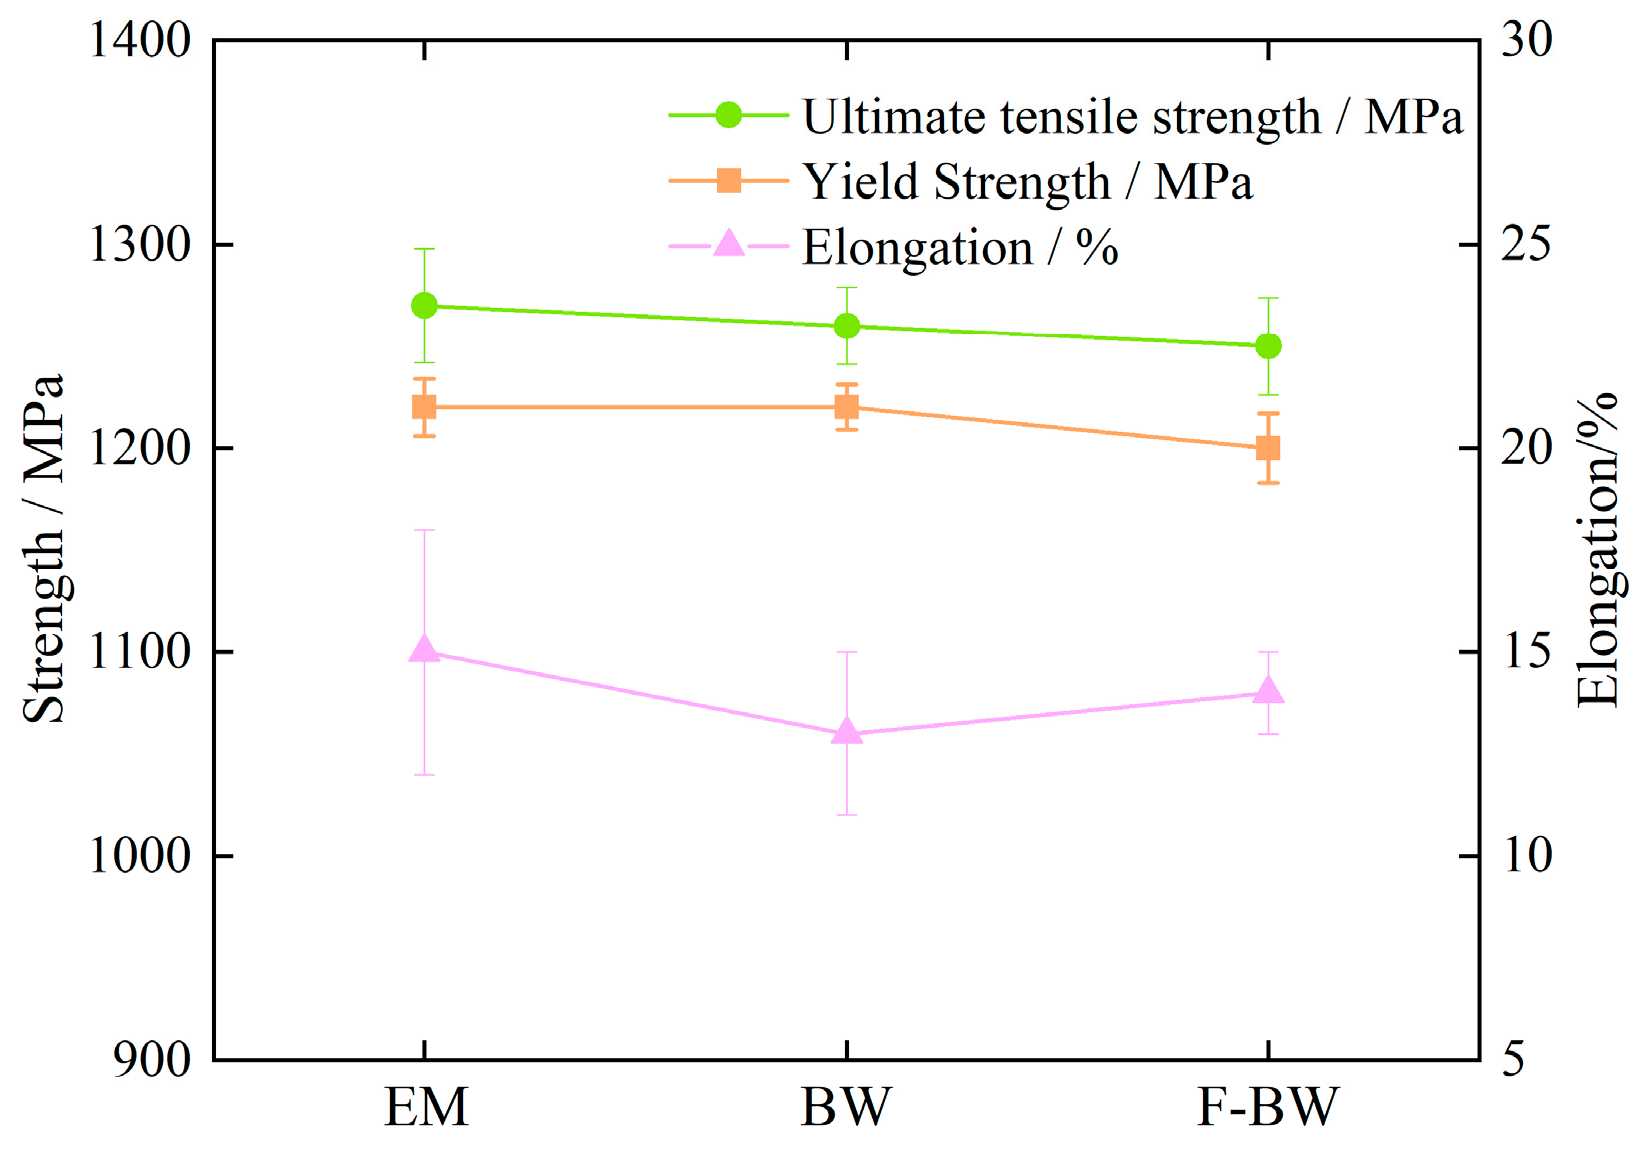
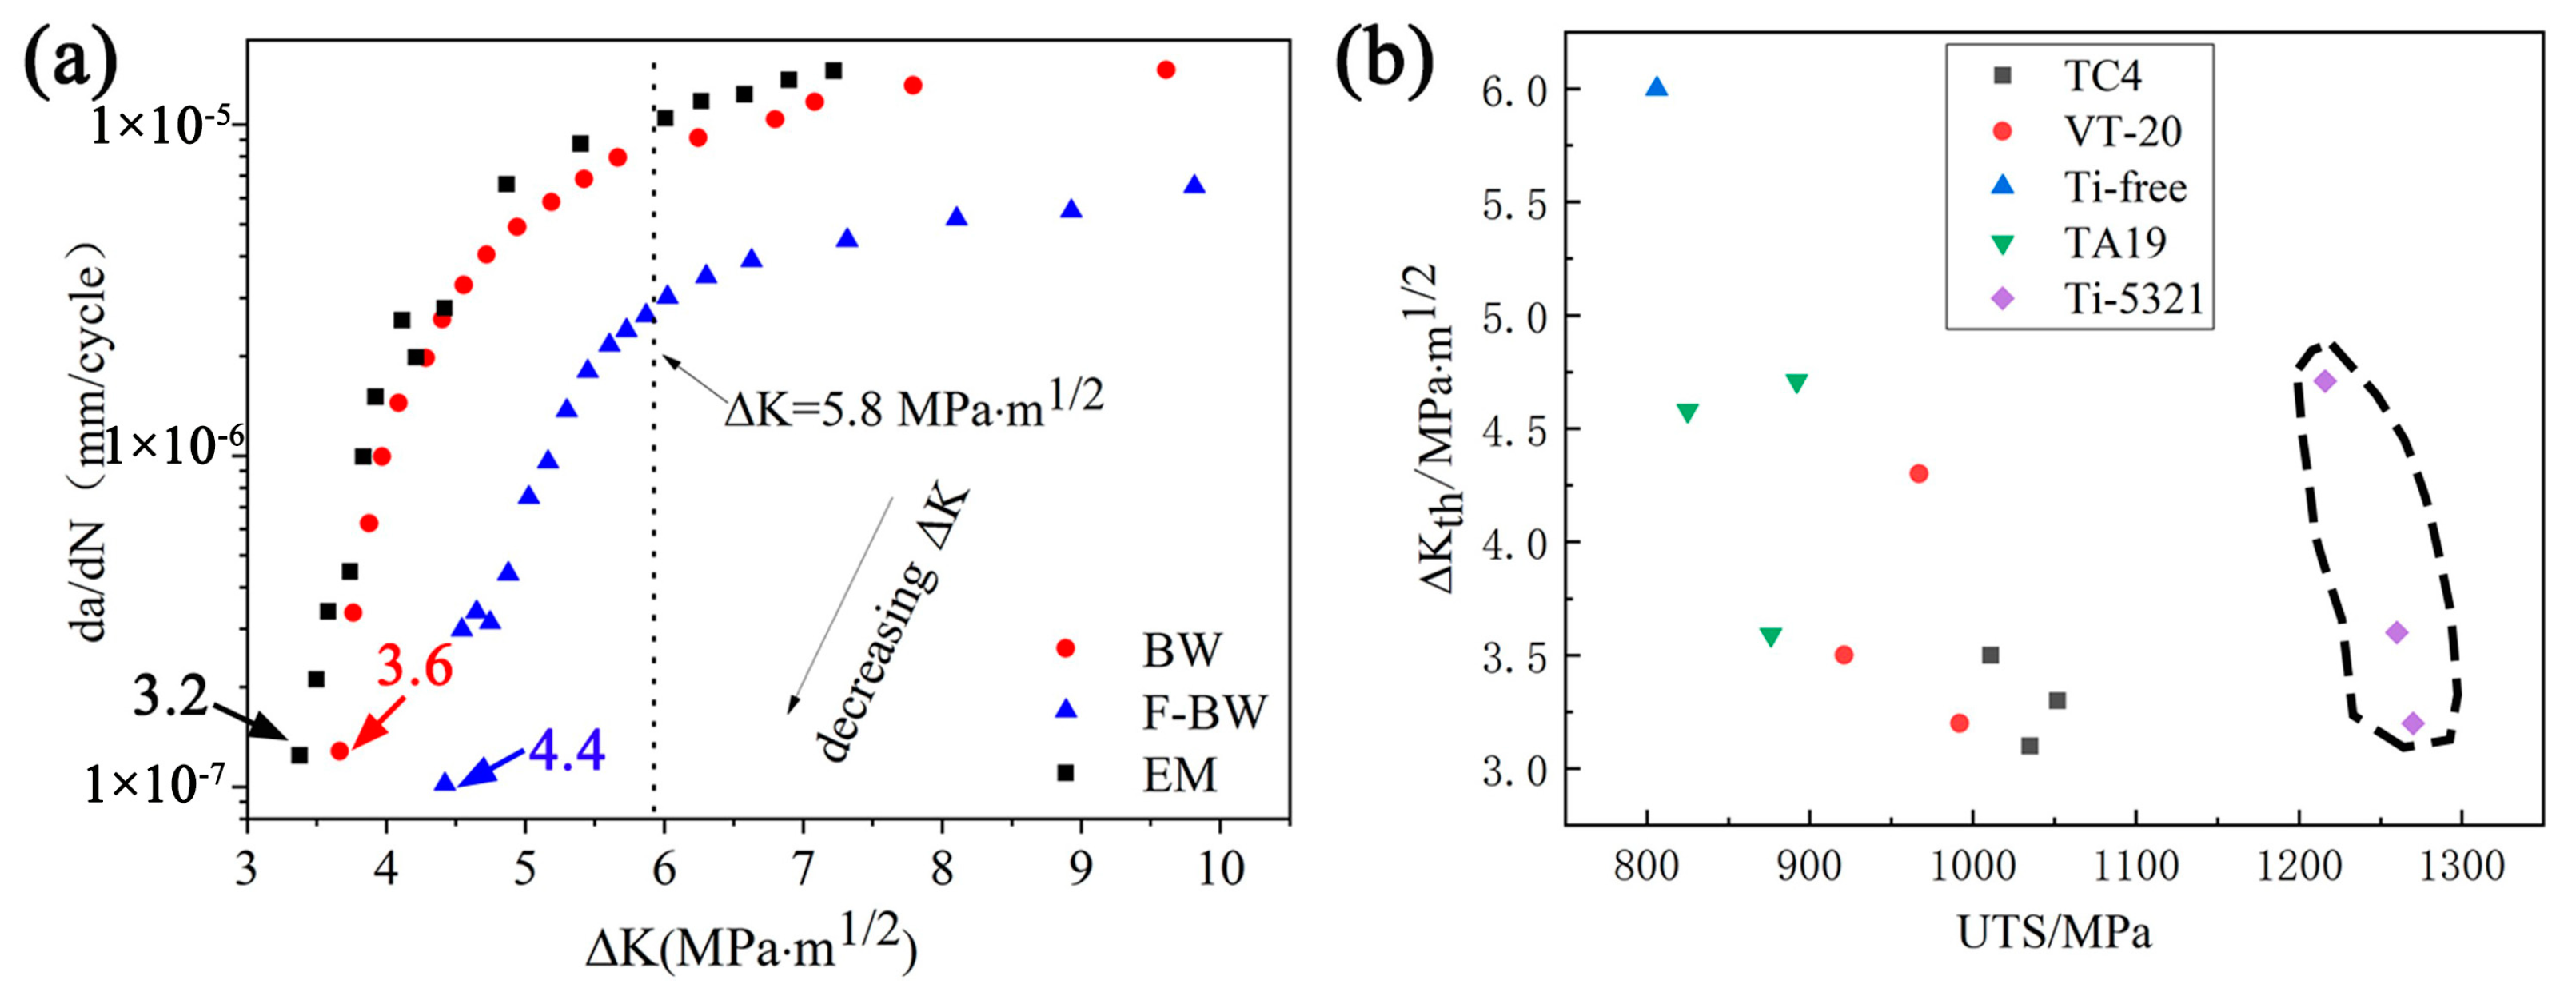
- At a similar strength of 1200 MPa, the F-BW sample with a multilevel feature (e.g., mixtures of elongated βt matrix, discontinuous grain boundary α, intragranular α colonies, and fine α plates) exhibits a higher fatigue crack propagation threshold value (4.4 MPa·m1/2).
- (2)
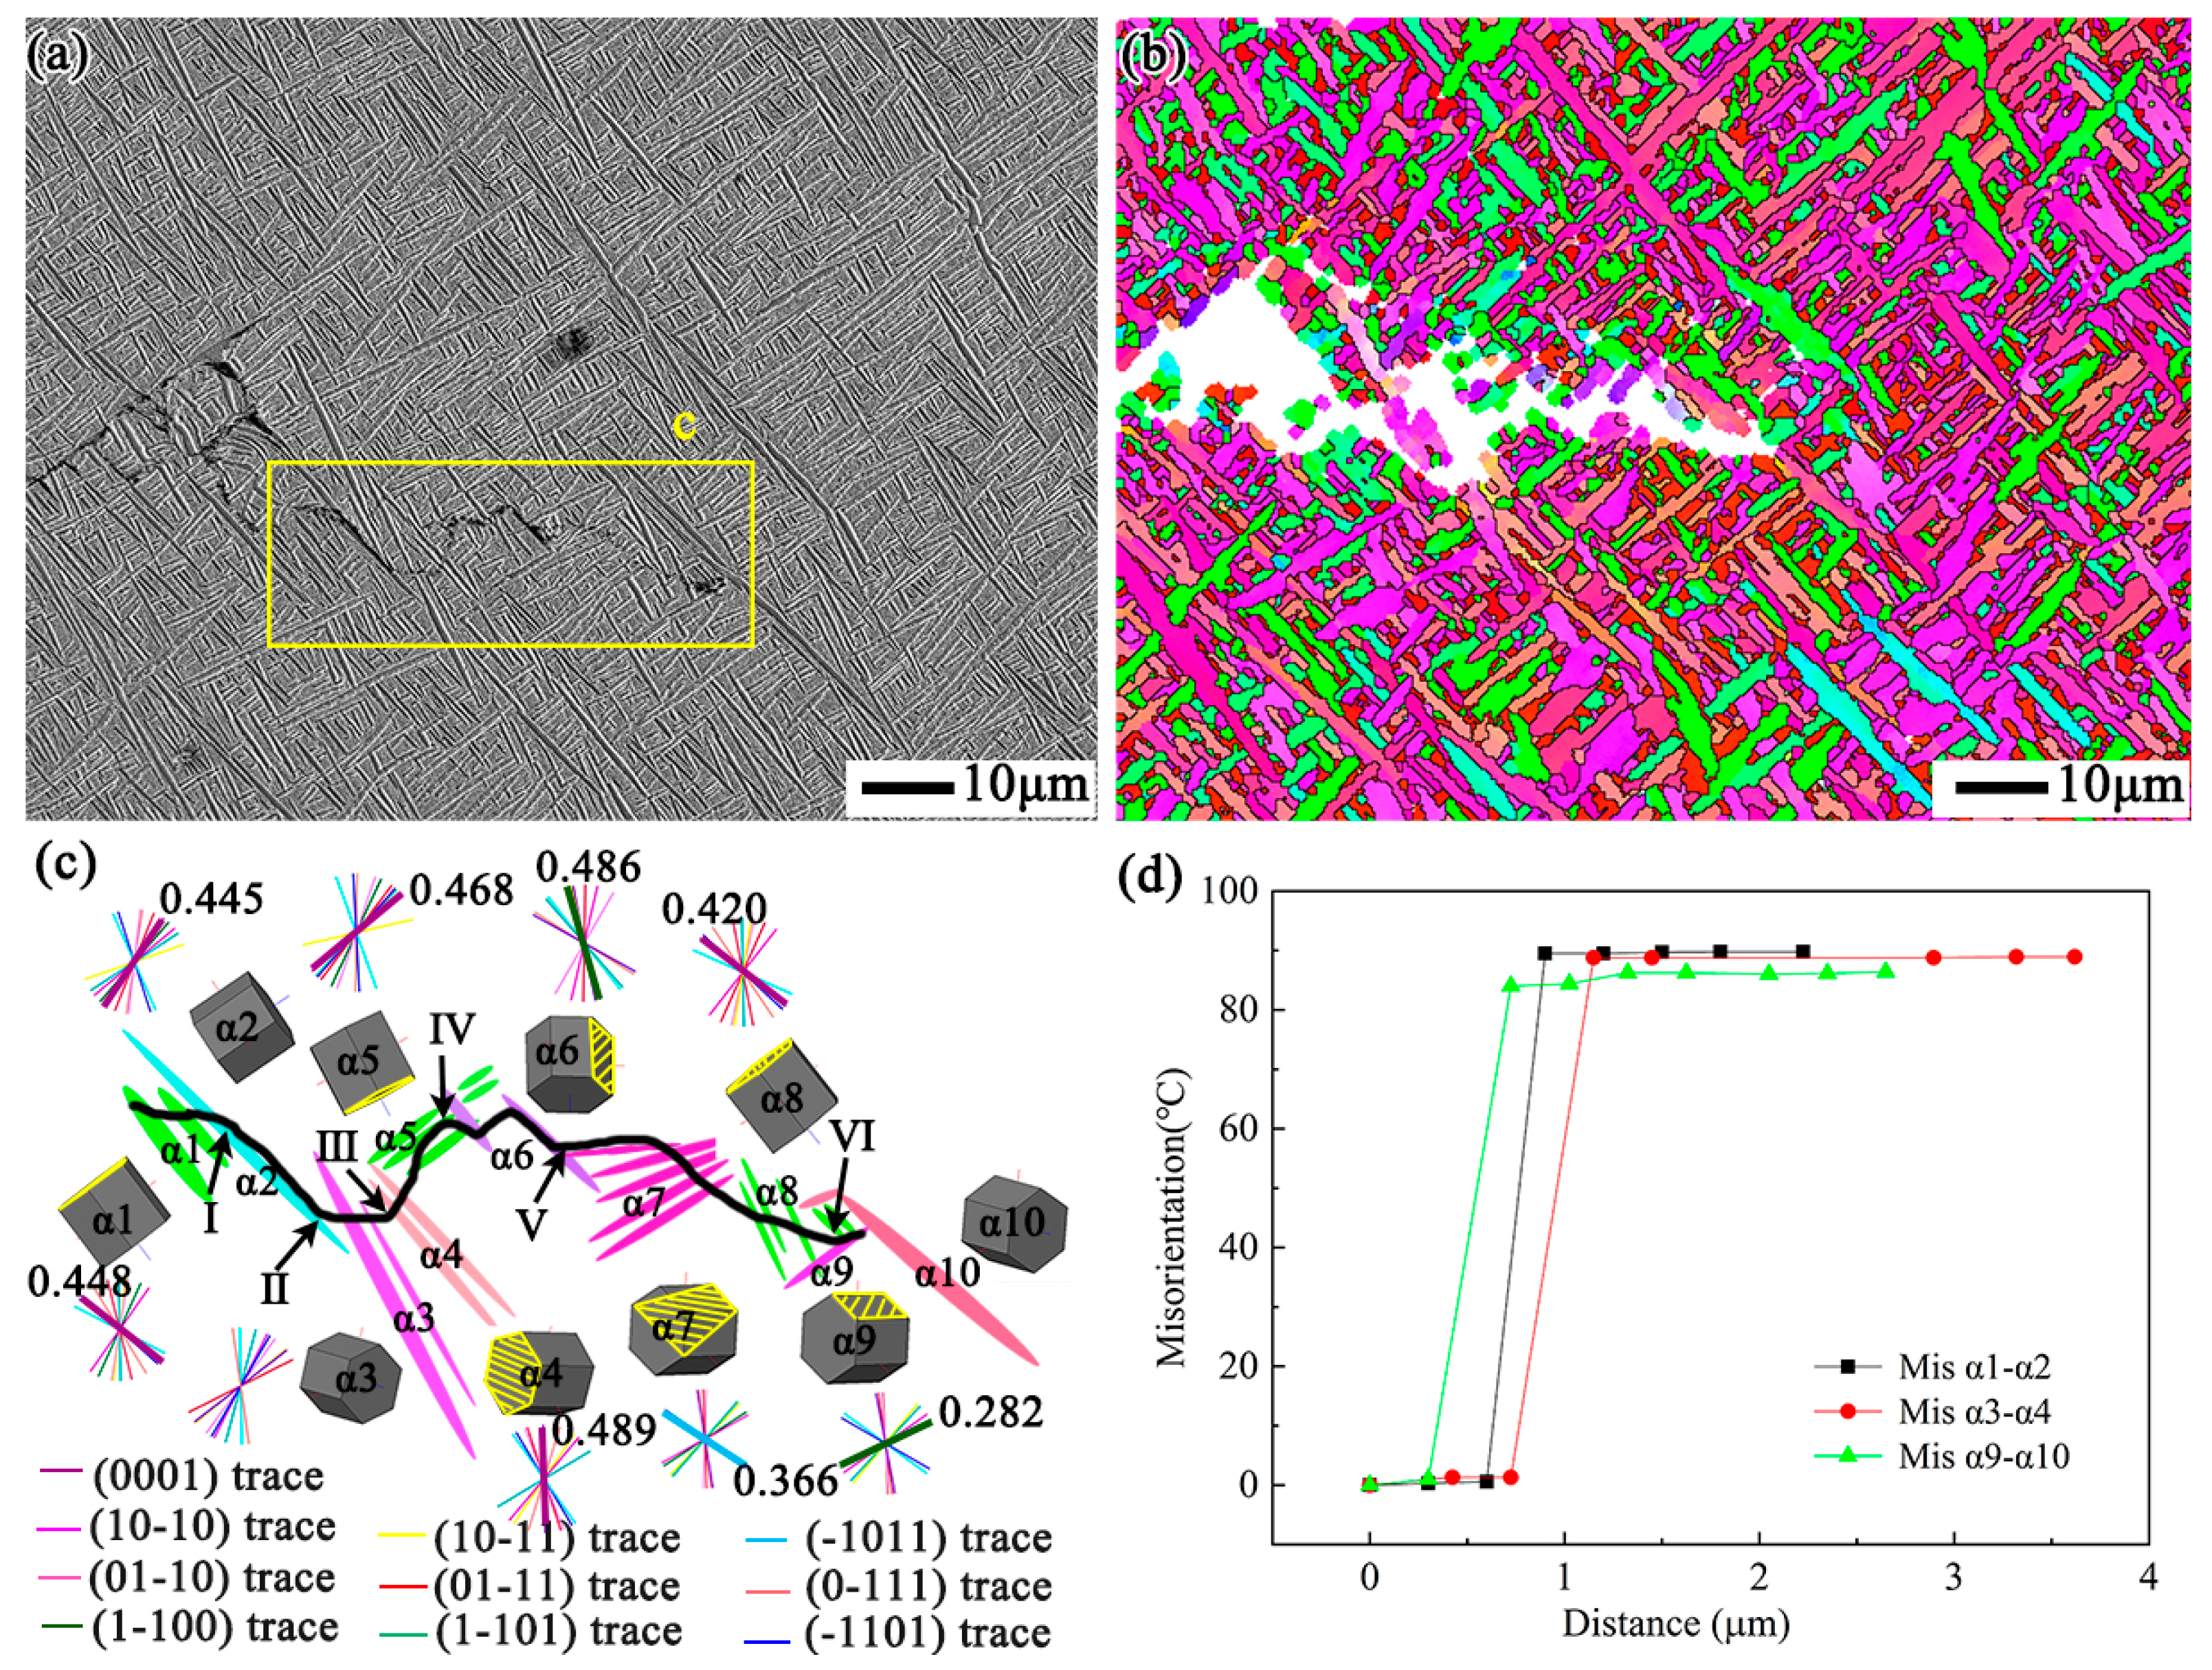
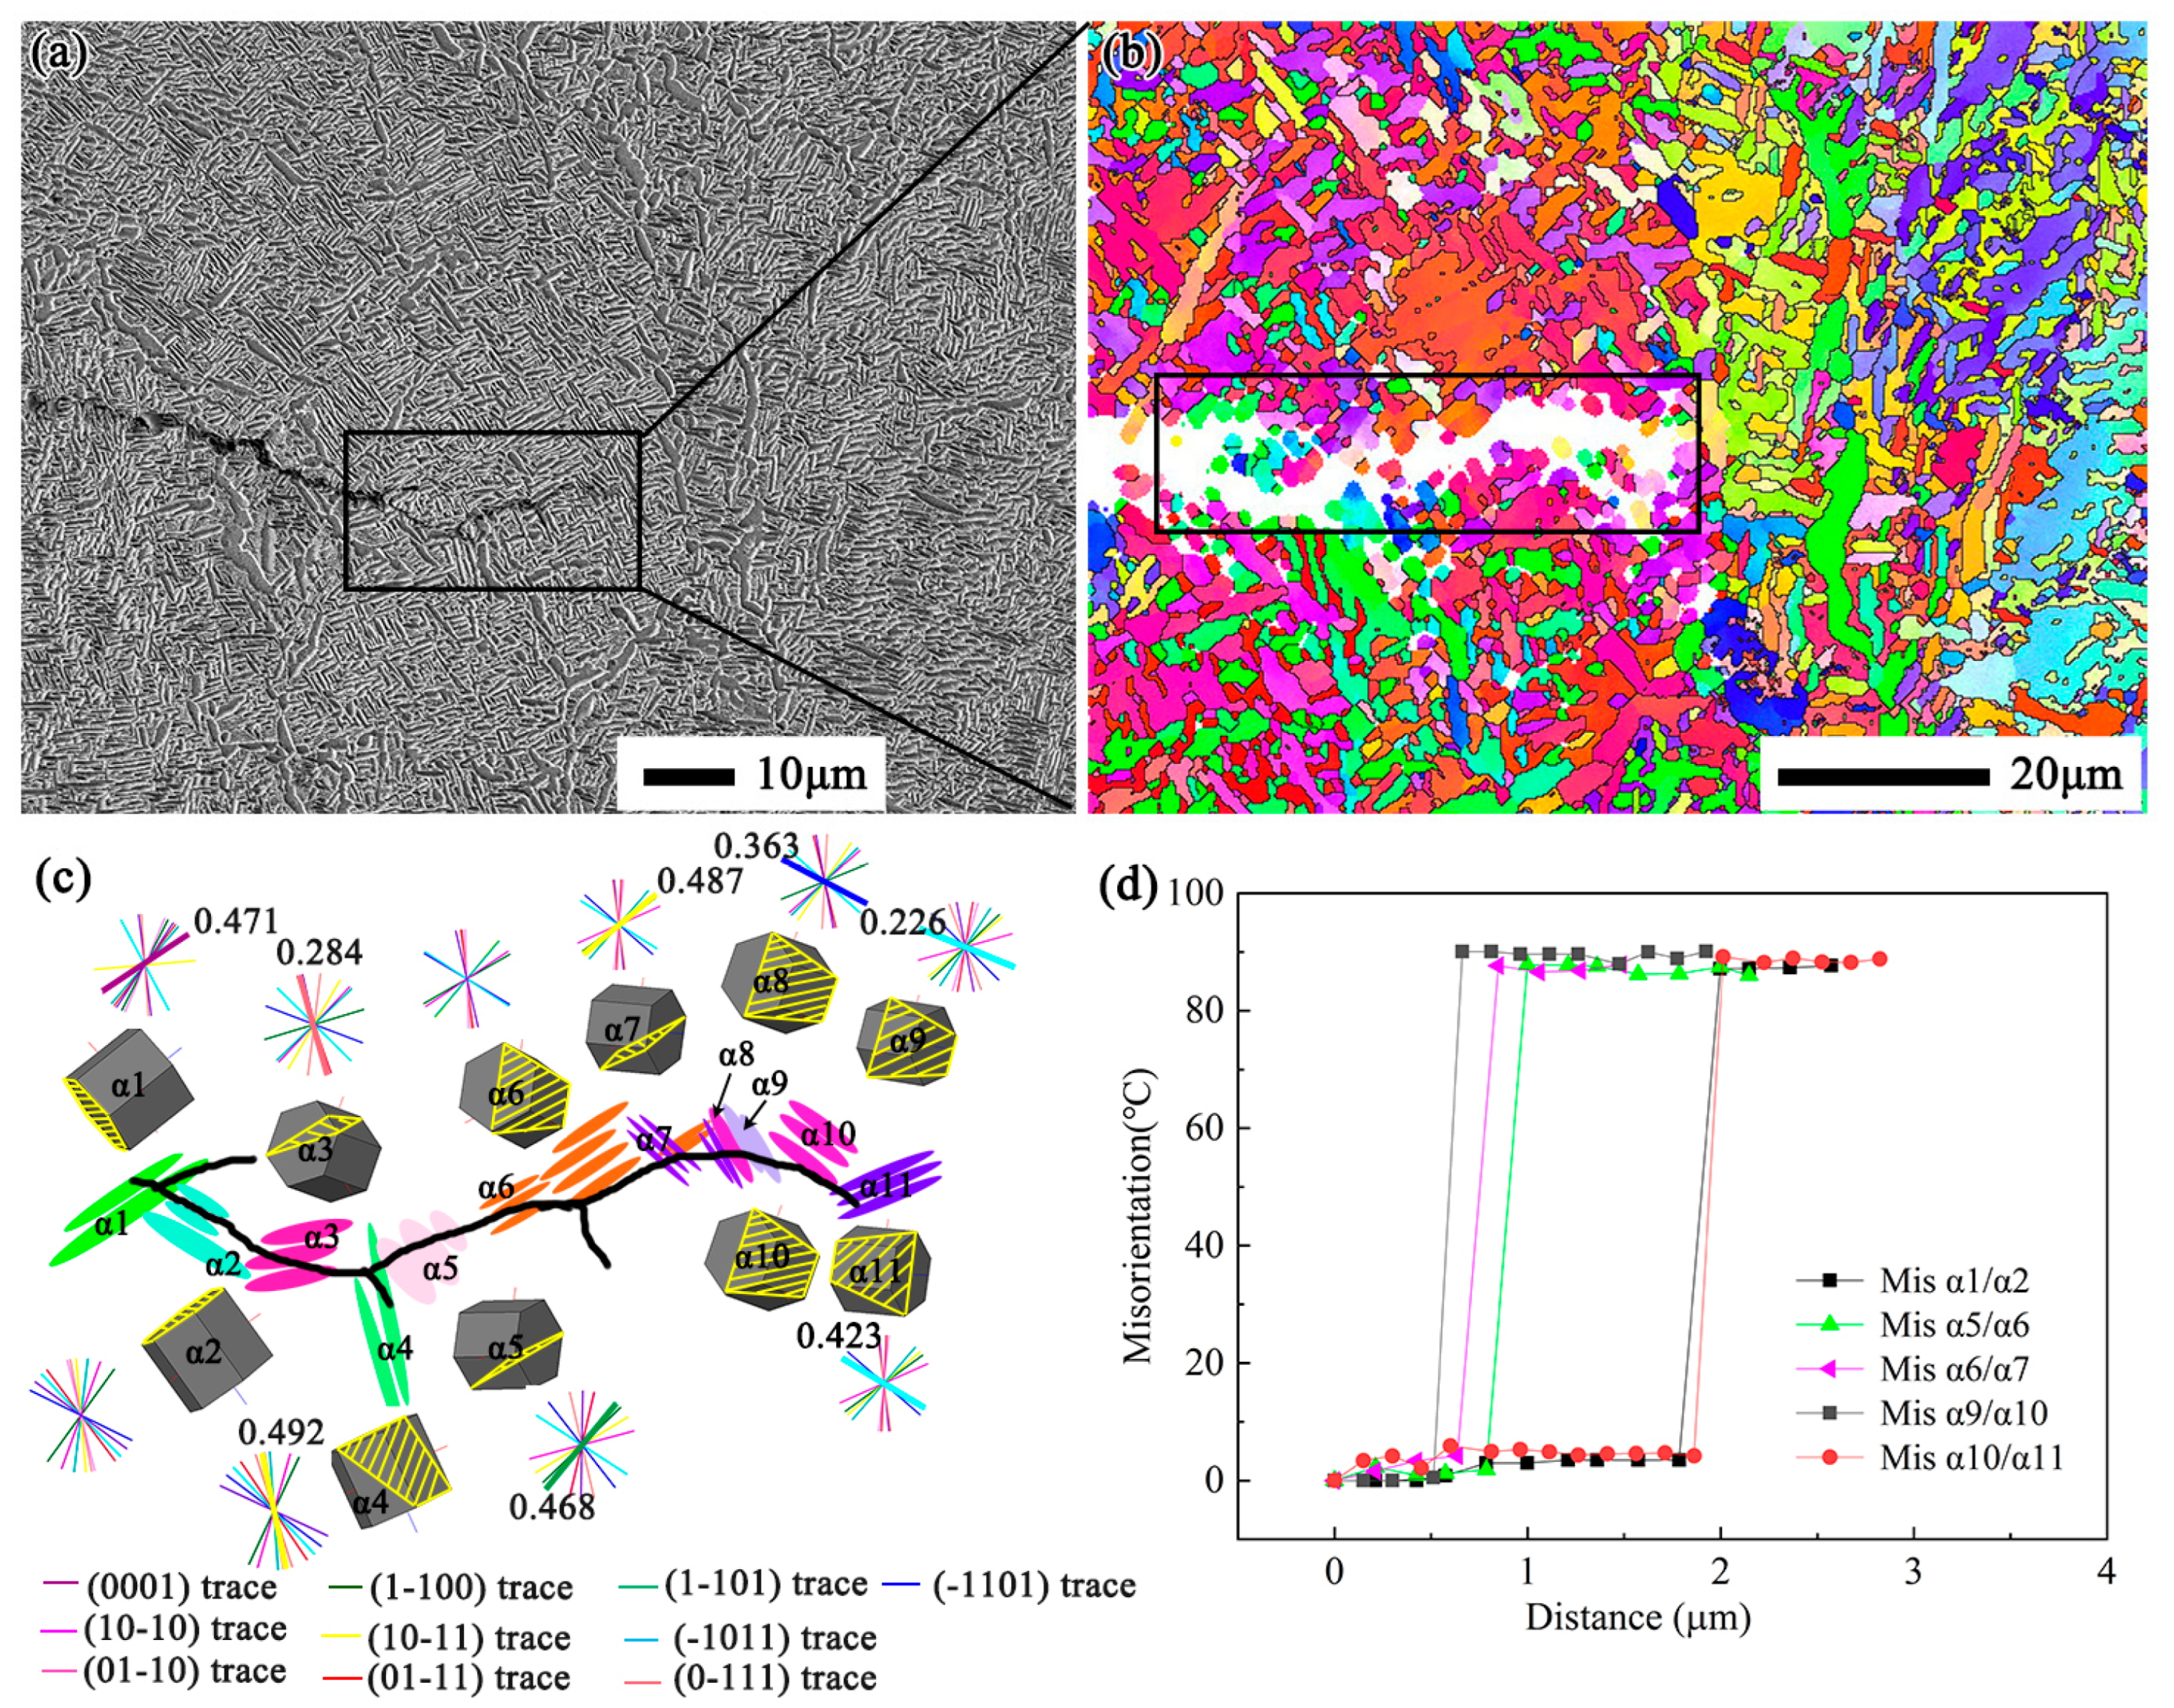
- In the near-threshold regime, the main crack growth mode in the Ti-5321 alloy with EM, BW, and F-BW is translamellar, and the translamellar crack always propagates parallel to the crystal plane with a high SF.
- (3)
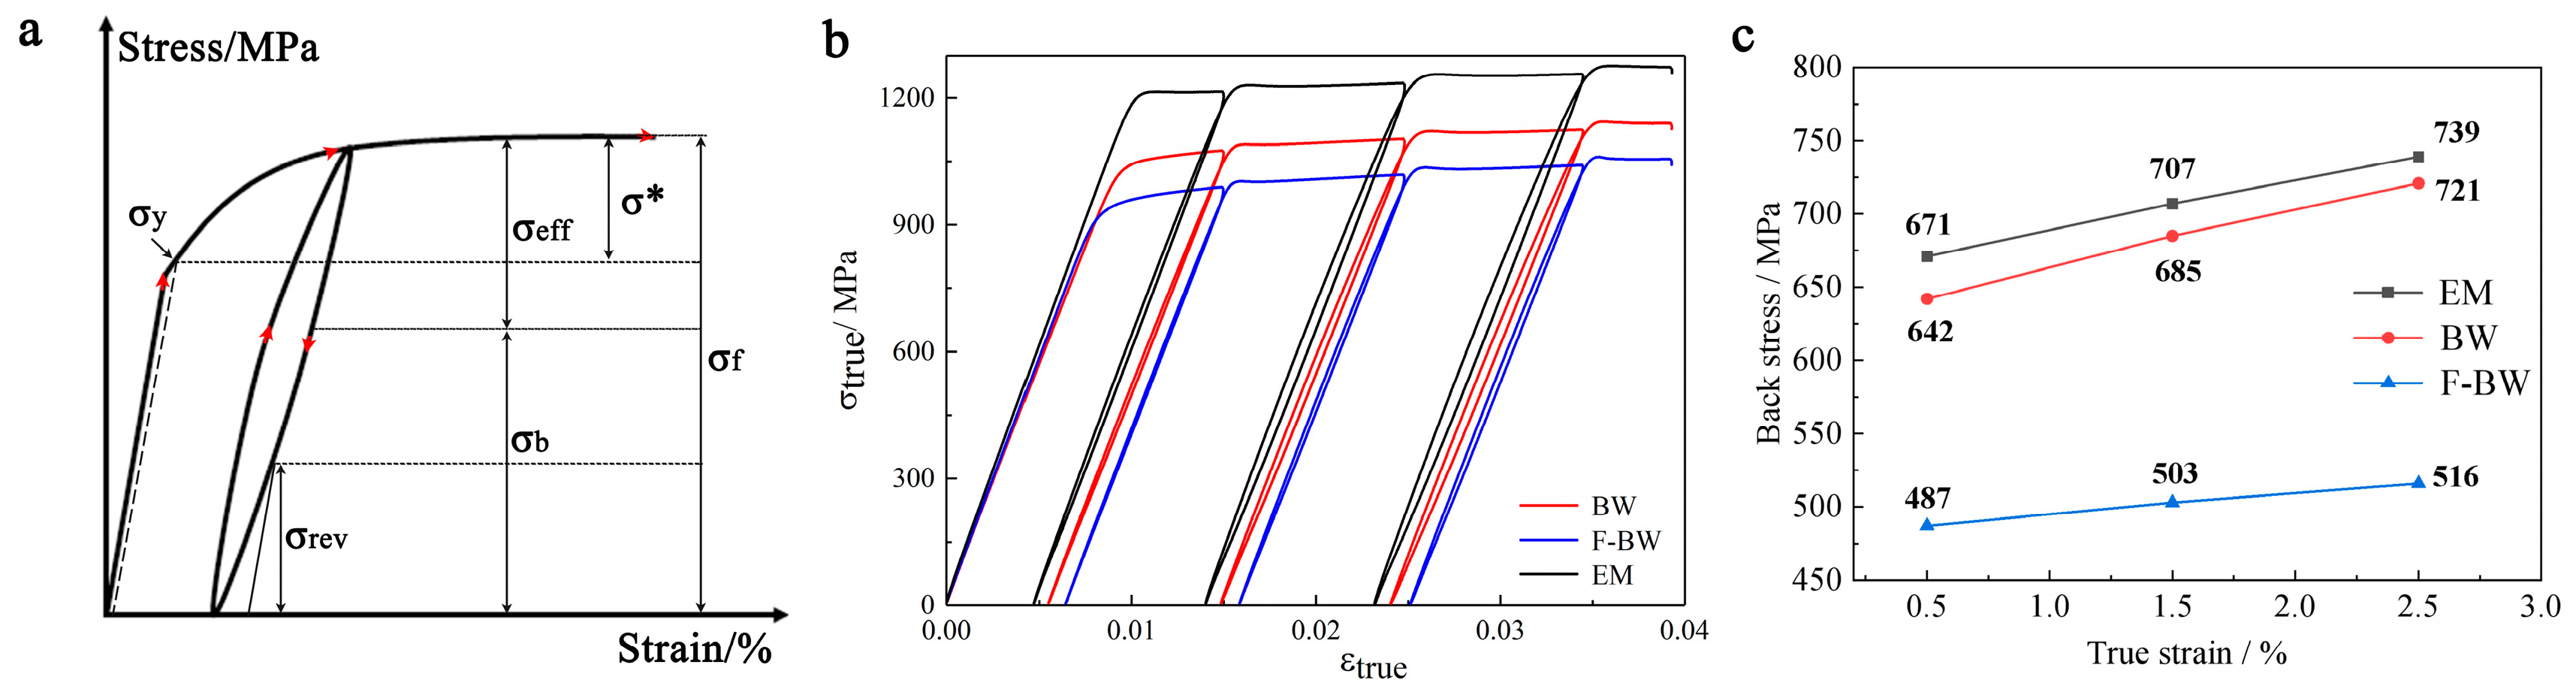
- At a similar strength of 1200 MPa, the increased FCP resistance in F-BW is attributed to the better stress/strain compatibility and greater number of interface obstacles in the CTPZ.
Author Contributions
Funding
Data Availability Statement
Conflicts of Interest
Abbreviations
| Words | Symbols or Abbreviations |
| Fine basket-weave microstructure | F-BW |
| Equiaxed microstructure | EM |
| Basket-weave microstructures | BW |
| Electron backscatter diffraction | EBSD |
| Scanning electron microscopy | SEM |
| Threshold stress intensity factor range | ΔKth |
| Stress intensity factor range | ΔK |
| Effective stress intensity factor range | ΔKeff |
| Fatigue crack propagation rate | FCPR |
| Fatigue crack propagation | FCP |
| Crack tip plastic zone | CTPZ |
| Compact tension | CT |
| Yield stress | YS |
| Ultimate tensile stress | UTS |
| Elongation | El |
| Reduction in area | RA |
| Crack propagation rate | da/dN |
| Average roughness | Raver |
| Schmid factor | SF |
| Inverse pole of figure | IPF |
| Primary α | αp |
| Secondary α | αs |
References
- Banerjee, D.; Williams, J. Perspective on Titanium science and technology. Acta Mater. 2013, 61, 844–879. [Google Scholar] [CrossRef]
- Sadananda, K.; Vasudevan, A.K. Fatigue crack growth behavior of titanium alloys. Int. J. Fatigue 2005, 27, 1255–1266. [Google Scholar] [CrossRef]
- Su, M.; Feng, C.; Peng, C.; Xu, L.; Han, Y.; Zhao, L. A unifed approach for describing metallic fatigue short and long crack growth behaviors via plastic accumulated damage. Int. J. Fatigue 2023, 166, 107258. [Google Scholar] [CrossRef]
- Liu, X.; Qian, Y.; Fan, Q.; Zhou, Y.; Zhu, X.; Wang, D. Plastic deformation mode and α/β slip transfer of Ti–5Al-2.5Cr-0.5Fe-4.5Mo–1Sn–2Zr–3Zn titanium alloy at room temperature. J. Alloy Compd. 2020, 826, 154209. [Google Scholar] [CrossRef]
- Wang, X.; Liu, C.; Sun, B.; Ponge, D.; Jiang, C.; Raabe, D. The dual role of martensitic transformation in fatigue crack growth. Proc. Natl. Acad. Sci. USA 2022, 119, 2110139119. [Google Scholar] [CrossRef] [PubMed]
- Ma, Y.J.; Xue, Q.; Wang, H.; Huang, S.; Qiu, J.; Feng, X.; Lei, J.; Yang, R. Deformation twinning in fatigue crack tip plastic zone of Ti-6Al-4V alloy with Widmanstatten microstructure. Mater. Charact. 2017, 132, 338–347. [Google Scholar] [CrossRef]
- Carroll, J.D.; Abuzaid, W.Z.; Lambros, J.; Sehitoglu, H. On the interactions between strain accumulation, microstructure, and fatigue crack behavior. Int. J. Fatigue 2013, 180, 223–241. [Google Scholar] [CrossRef]
- Verdhan, N.; Bhende, D.D.; Kapoor, R.; Chakravartty, J.K. Effect of microstructure on the fatigue crack growth behaviour of a near-α Ti alloy. Int. J. Fatigue 2015, 74, 46–54. [Google Scholar] [CrossRef]
- Hasib, M.T.; Ostergaard, H.; Li, X.; Kruzic, J.J. Fatigue crack growth behavior of laser powder bed fusion additive manufactured Ti-6Al-4V: Roles of post heat treatment and build orientation. Int. J. Fatigue 2021, 142, 105955. [Google Scholar] [CrossRef]
- Kikuchi, S.; Imai, T.; Kubozono, H.; Nakai, Y.; Ota, M.; Ueno, A.; Ameyama, K. Effect of harmonic structure design with bimodal grain size distribution on near-threshold fatigue crack propagation in Ti-6Al-4V alloy. Int. J. Fatigue 2016, 92, 616–622. [Google Scholar] [CrossRef]
- Nalla, R.K.; Boyce, B.L.; Campbell, J.P.; Peters, J.O. Influence of microstructure on high-cycle fatigue of Ti-6Al-4V: Bimodal vs. lamellar structures. Metall. Mater. Trans. A. 2002, 33, 899–918. [Google Scholar] [CrossRef]
- Sarrazin-Baudoux, C. Abnormal near-threshold fatigue crack propagation of Ti alloys: Role of the microstructure. Int. J. Fatigue 2005, 27, 773–782. [Google Scholar] [CrossRef]
- Prasad, K.; Karamched, P.S.; Bhattacharjee, A.; Kumar, V.; Rao, K.B.S.; Sundararaman, M. Electron back scattered diffraction characterization of thermomechanical fatigue crack propagation of a near a titanium alloy Timetal 834. Mater. Des. 2015, 65, 297–311. [Google Scholar] [CrossRef]
- Liu, Z.Y.; Dash, S.S.; Zhang, J.H.; Lyu, T.; Lang, L.; Chen, D.; Zou, Y. Fatigue crack growth behavior of an additively manufactured titanium alloy: Effects of spatial and crystallographic orientations of α lamellae. Int. J. Plast. 2024, 172, 103819. [Google Scholar] [CrossRef]
- Wang, H.; Xin, S.W.; Zhao, Y.Q.; Zhou, W.; Zeng, W.D. Forging-microstructure-tensile properties correlation in a new near beta high-strength titanium alloy. Rare Met. 2021, 40, 2109–2117. [Google Scholar] [CrossRef]
- Wu, C.; Zhao, Y.Q.; Huang, S.X.; Zhao, Y.; Lei, L.; Sun, Q.; Zhou, L. New insights in the development of α phase during continuously heating in a β-quenched Ti-5321 alloy. J. Mater. Sci. Technol. 2021, 151, 106348. [Google Scholar] [CrossRef]
- Ajabshir, S.Z.; Hare, C.; Sofia, D.; Barletta, D.; Poletto, M. Investigating the effect of temperature on powder spreading behaviour in powder bed fusion additive manufacturing process by Discrete Element Method. Powder Technol. 2024, 436, 119468. [Google Scholar] [CrossRef]
- ASTM E647-15; Standard Test Method for Measurement of Fatigue Crack Growth Rates. ASTM: West Conshohocken, PA, USA, 2015.
- Wei, S.; Zhu, G.; Tasan, C. Slip-twinning interdependent activation across phase boundaries: An in-situ investigation of a Ti-Al-V-Fe (α+β) alloy. Acta Mater. 2021, 206, 116520. [Google Scholar] [CrossRef]
- Guo, X.Y.; Zhao, L.F.; Liu, X.; Lu, F.G. Investigation on the resistance to fatigue crack growth for weld metals with different Ti addition in near-threshold regime. Int. J. Fatigue 2019, 120, 1–11. [Google Scholar] [CrossRef]
- Wang, F.; Lei, L.M.; Fu, X.; Shi, L.; Luo, X.M.; Song, Z.M.; Zhang, G.P. Toward developing Ti alloys with high fatigue crack growth resistance by additive manufacturing. J. Mater. Sci. Technol. 2023, 13, 166–178. [Google Scholar] [CrossRef]
- Zhai, Y.; Lados, D.A.; Brown, E.J.; Vigilante, G.N. Fatigue crack growth behavior and microstructural mechanisms in Ti-6Al-4V manufactured by laser engineered net shaping. Int. J. Fatigue 2016, 93, 51–63. [Google Scholar] [CrossRef]
- Ren, Y.; Lin, X.; Jian, Z.; Peng, H.; Huang, W. Long fatigue crack growth behavior of Ti-6Al-4V produced via high-power laser directed energy deposition. Mater. Sci. Eng. A 2021, 819, 141392. [Google Scholar] [CrossRef]
- Rui, S.S.; Shang, Y.B.; Su, Y.; Qiu, W.; Niu, L.-S.; Shi, H.-J.; Matsumoto, S.; Chuman, Y. EBSD analysis of cyclic load effect on final misorientation distribution of post-mortem low alloy steel: A new method for fatigue crack tip driving force prediction. Int. J. Fatigue 2018, 113, 264–276. [Google Scholar] [CrossRef]
- Suzuki, S.; Sakaguchi, M.; Domen, M.; Karato, T.; Suzuki, K. Temperature and ΔK dependence of grain boundary effect on fatigue crack propagation in a two-dimensional polycrystalline Ni-base superalloy. Acta Mater. 2022, 240, 118288. [Google Scholar] [CrossRef]
- Li, T.L.; Wu, H.P.; An, D.Y.; Chen, J.; Li, X.; Chen, J. By introducing heterogeneous interfaces: Improved fatigue crack growth resistance of a metastable β titanium alloy Fatigue crack branching in laser melting deposited Ti-55511 alloy. Scr. Mater. 2022, 220, 114921. [Google Scholar] [CrossRef]
- Shibata, A.; Gutierrez-Urrutia, I.; Nakamura, A.; Miyamoto, G.; Madi, Y.; Besson, J.; Hara, T.; Tsuzaki, K. Multi-scale three-dimensional analysis on local arrestability of intergranular crack in high-strength martensitic steel. Acta Mater. 2022, 234, 118053. [Google Scholar] [CrossRef]
- Margolin, H. Fracture toughness—A rationalization of the role of microstructure in an α-β titanium alloy. Metall. Trans. A 1982, 13A, 2191–2195. [Google Scholar] [CrossRef]

| Samples | Break Down | Intermediate Forging | Final Forging | ||||||
|---|---|---|---|---|---|---|---|---|---|
| Start T./°C | Final T./°C | Reduction /% | Start T./°C | Final T./°C | Reduction /% | Start T./°C | Final T./°C | Reduction /% | |
| EM | 1100 | 1020 | 70% | 1000 | 950 | 70% | 810 | 760 | 70% |
| BW | 870 | 810 | |||||||
| F-BW | 890 | 835 | |||||||
| Microstructures | Size of αp/μm | Size of αl/μm |
|---|---|---|
| EM | 2.2 ± 0.2 μm | / |
| BW | / | 0.78 ± 0.2 μm |
| F-BW | / | 0.40 ± 0.2 μm |
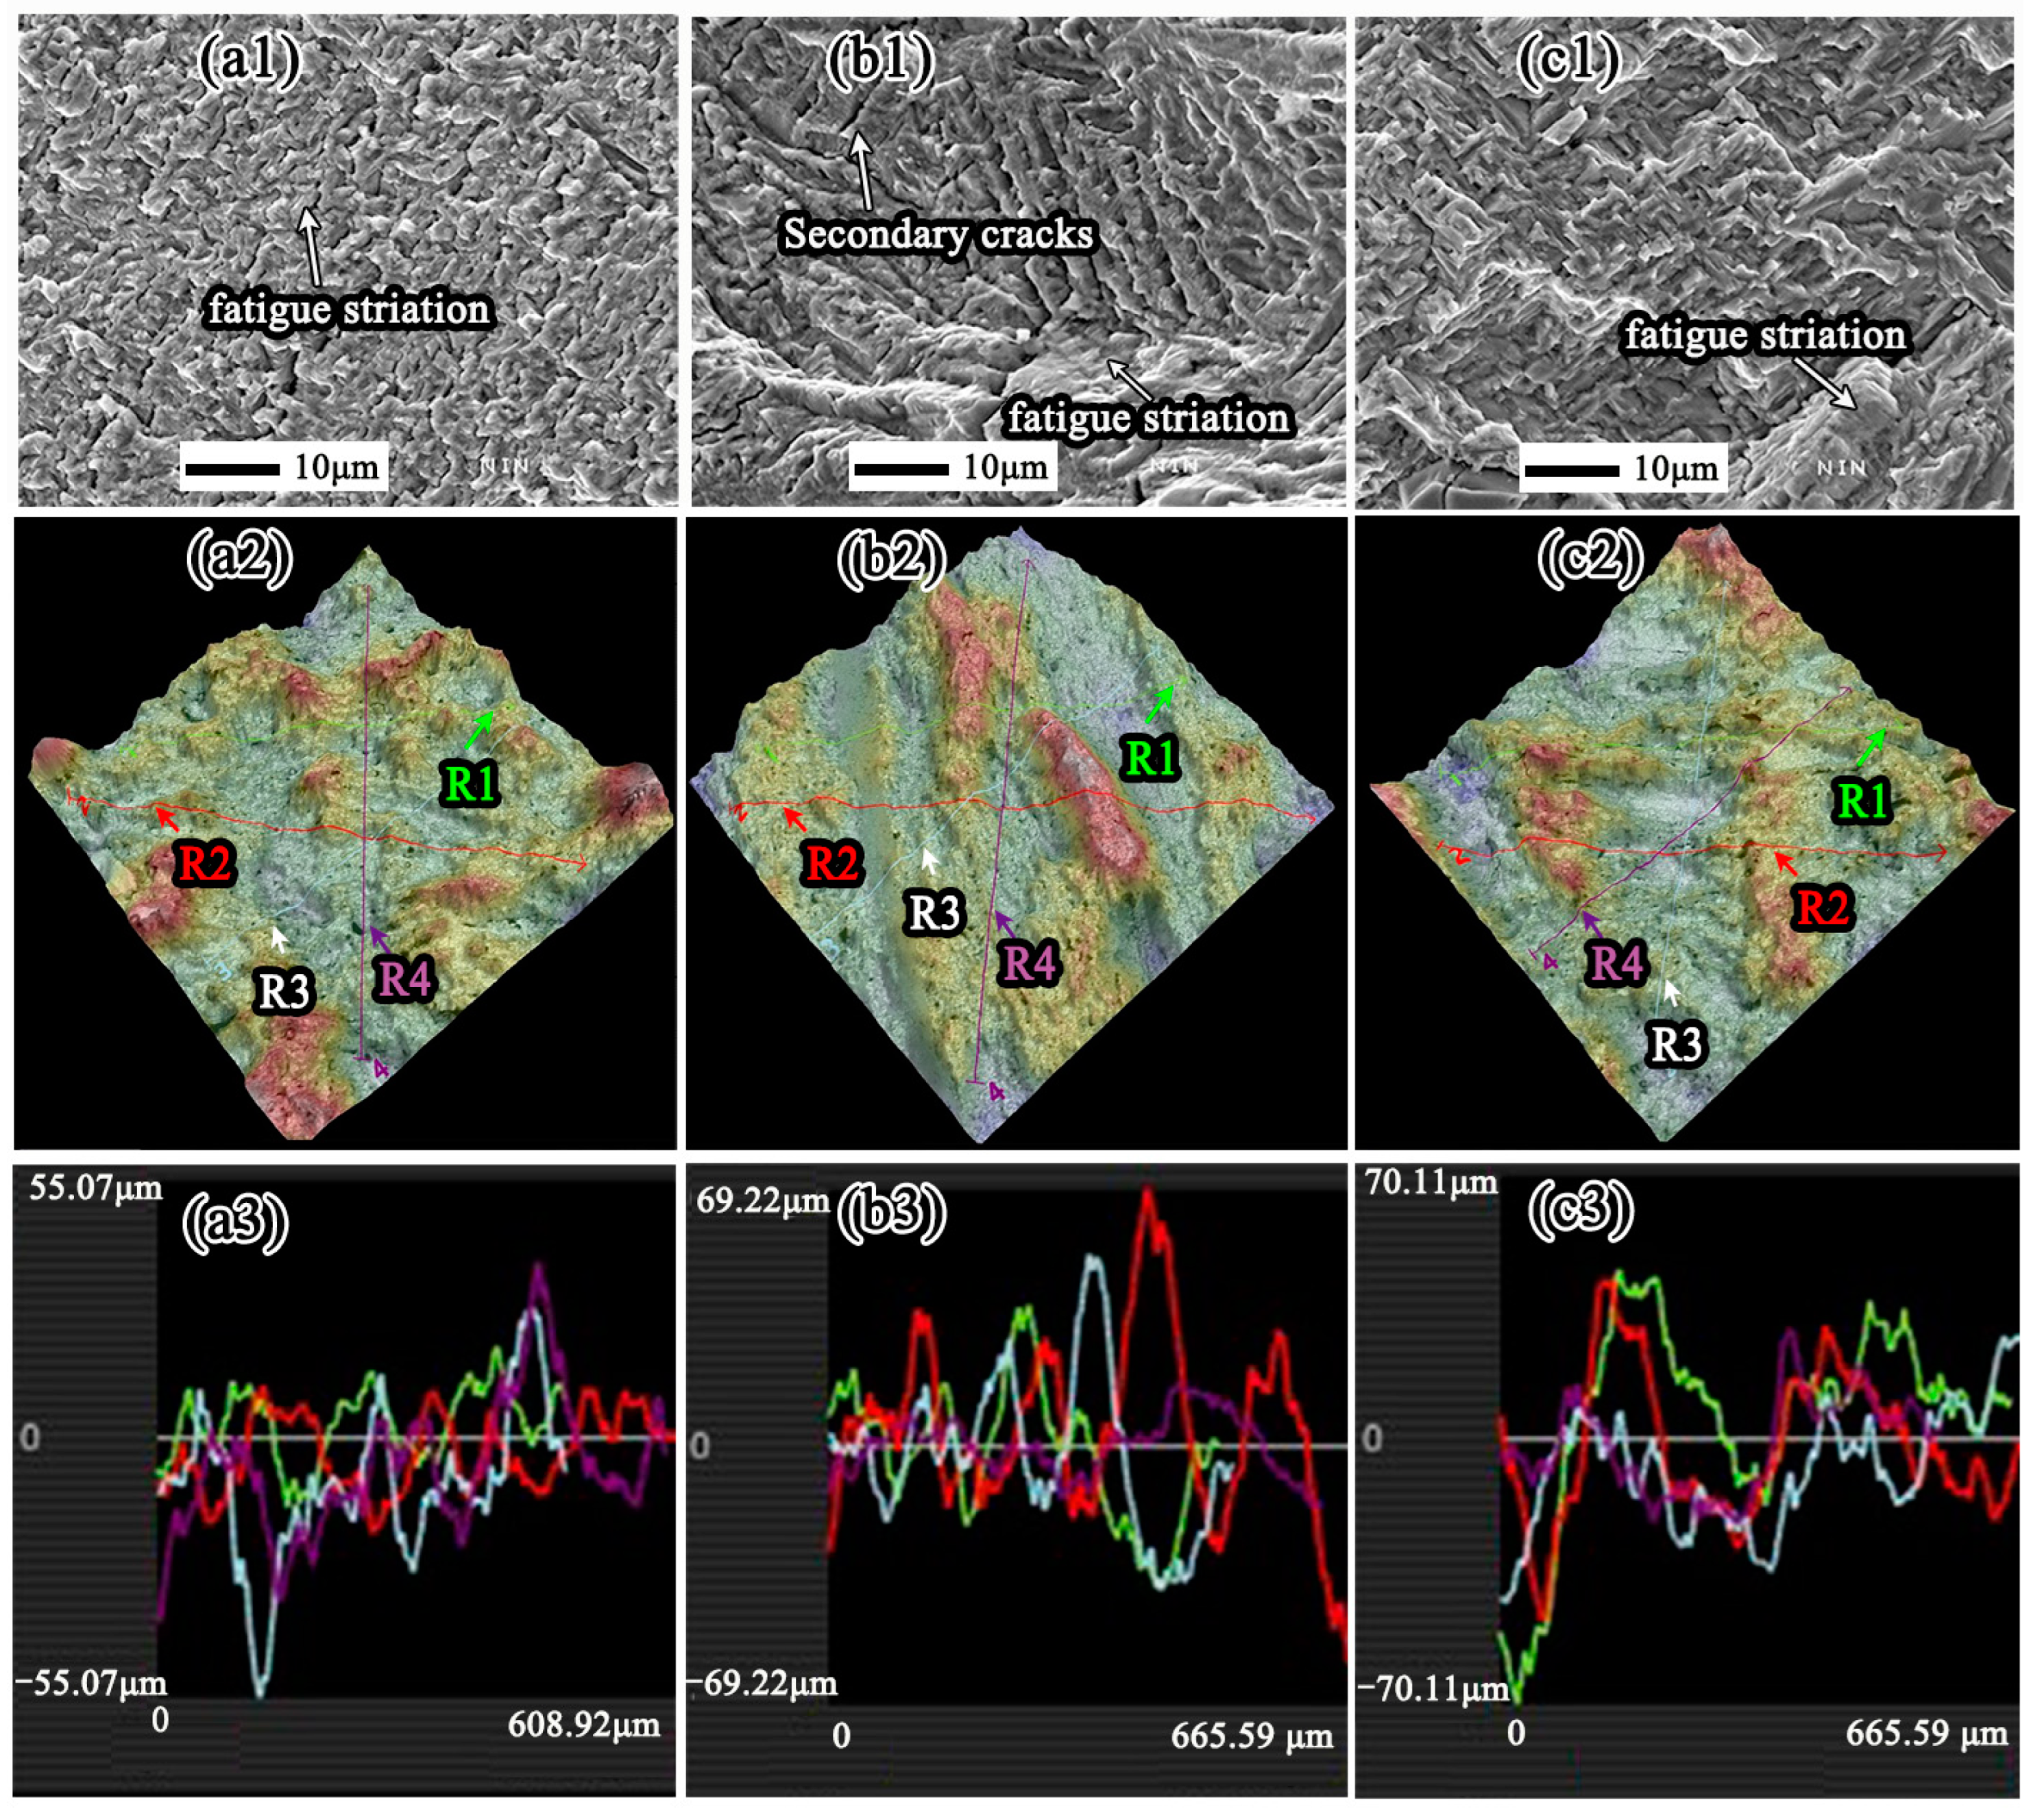
| Microstructure | R1/μm | R2/μm | R3/μm | R4/μm | Raver/μm |
|---|---|---|---|---|---|
| EM | 11.49 | 12.11 | 14.96 | 14.46 | 13.25 ± 1.48 |
| BW | 21.14 | 19.72 | 17.53 | 17.23 | 18.91 ± 1.61 |
| F-BW | 18.69 | 18.96 | 18.09 | 12.64 | 17.10 ± 2.59 |
| Microstructure | Diameter/Width of α Phase (μm) | ΔK (MPa·m1/2) | rc (μm) |
|---|---|---|---|
| EM | 2.2 ± 0.2 | 3.2–7 | 0.27–1.30 |
| BW | 0.78 ± 0.2 | 3.6–9.5 | 0.35–2.34 |
| F-BW | 0.40 ± 0.2 | 4.4–10 | 0.57–2.94 |
Disclaimer/Publisher’s Note: The statements, opinions and data contained in all publications are solely those of the individual author(s) and contributor(s) and not of MDPI and/or the editor(s). MDPI and/or the editor(s) disclaim responsibility for any injury to people or property resulting from any ideas, methods, instructions or products referred to in the content. |
© 2025 by the authors. Licensee MDPI, Basel, Switzerland. This article is an open access article distributed under the terms and conditions of the Creative Commons Attribution (CC BY) license (https://creativecommons.org/licenses/by/4.0/).
Share and Cite
Wang, H.; Zhao, Y.; Guo, P.; Qiang, F.; Zhang, L.; Qiao, Z.; Xin, S. Study of the Intrinsic Factors Determining the Near-Threshold Fatigue Crack Propagation Behavior of a High-Strength Titanium Alloy. Metals 2025, 15, 84. https://doi.org/10.3390/met15010084
Wang H, Zhao Y, Guo P, Qiang F, Zhang L, Qiao Z, Xin S. Study of the Intrinsic Factors Determining the Near-Threshold Fatigue Crack Propagation Behavior of a High-Strength Titanium Alloy. Metals. 2025; 15(1):84. https://doi.org/10.3390/met15010084
Chicago/Turabian StyleWang, Huan, Yongqing Zhao, Ping Guo, Fei Qiang, Lei Zhang, Zhongli Qiao, and Shewei Xin. 2025. "Study of the Intrinsic Factors Determining the Near-Threshold Fatigue Crack Propagation Behavior of a High-Strength Titanium Alloy" Metals 15, no. 1: 84. https://doi.org/10.3390/met15010084
APA StyleWang, H., Zhao, Y., Guo, P., Qiang, F., Zhang, L., Qiao, Z., & Xin, S. (2025). Study of the Intrinsic Factors Determining the Near-Threshold Fatigue Crack Propagation Behavior of a High-Strength Titanium Alloy. Metals, 15(1), 84. https://doi.org/10.3390/met15010084