Article

The Role of Local Orientations Gradients in the Formation of the Recrystallisation Texture in Cold-Rolled IF Steel

by
Estefania A. Sepulveda Hernández
1,2,*,
Felipe M. Castro Cerda
2 and
Leo A. I. Kestens
1,3
1
Department of Electromechanical Systems and Metal Engineering, Ghent University, 9000 Ghent, Belgium
2
Department of Metallurgical Engineering, Universidad de Santiago de Chile, Alameda Bdo. O’Higgins 3363, Estacion Central, Santiago 9170022, Chile
3
Department of Materials Science and Engineering, Delft University of Technology, 2628 CD Delft, The Netherlands
*
Author to whom correspondence should be addressed.
Metals 2025, 15(9), 939; https://doi.org/10.3390/met15090939 (registering DOI)
Submission received: 25 June 2025 / Revised: 20 August 2025 / Accepted: 21 August 2025 / Published: 24 August 2025

Abstract

This study investigates the subsequent stages of recrystallisation in Interstitial-Free (IF) steel subjected to an unconventional continuous annealing process with a controlled thermal gradient. A cold-rolled steel strip was exposed to varying annealing temperatures along its length, enabling the analysis of microstructural evolution during the course of recrystallisation. The microstructure and stored energy were assessed at various positions along the strip using Electron Backscatter Diffraction (EBSD). The results underscore the significant influence of local misorientation and structural inhomogeneity on orientation selection during recrystallisation. The remaining non-recrystallised volume fraction (NRF) strongly correlates with the average misorientation gradient, obeying a phenomenological power-law correspondence with an exponent of ~3.7. This indicates that the recrystallisation process is highly sensitive to small changes in local orientation gradients. These findings highlight the crucial role of stored energy distribution for texture evolution, particularly during the early stages of recrystallisation in continuous annealing. It is observed that g-fiber grains, in comparison to a-fiber grains, are much more susceptible to grain fragmentation and therefore develop more robust intra-granular misorientation gradients, allowing for successful nucleation events to occur. In the present study, these phenomena are documented in a statistically representative manner. These insights are valuable for optimising thermal processing in interstitial-free (IF) steels.

1. Introduction

Interstitial free (IF) steel is widely regarded in the automotive industry as the preferred material for car body manufacturing for outer panels due to its excellent drawability [1]. Achieving good deep-drawability involves a homogeneous recrystallisation texture with a strong fiber texture, such that the {111} crystal planes align parallel to the rolling plane (the γ-fiber). The γ-fiber is produced through carefully selecting the chemical composition (reducing C content to ~20–30 weight ppm and minute additions of Ti and/or Nb) and meticulous control of the thermomechanical process. The IF steel sheet manufacturing process involves four stages: steelmaking, continuous casting, cold rolling, and annealing. Concerning the annealing process, continuous annealing (CA) enables higher annealing temperatures than batch annealing (BA), leading to shorter recovery times and increased recrystallisation kinetics. The CA process significantly influences the recrystallisation texture of IF steel. Employing elevated coiling temperatures during hot rolling in combination with high soaking temperatures and rapid cooling rates during recrystallisation annealing promotes a homogeneous and strong γ-fiber texture, enhancing the IF steel’s formability [2,3].
Plastic deformation in crystalline metals mainly occurs through dislocation movement, which allows for shear strain by slip on specific crystallographic slip systems. During deformation, dislocations are generated, propagate, interact, and accumulate. This is a highly endothermic process whereby most mechanically applied energy is dissipated as heat. However, a relatively small fraction of the applied energy (~5–10%) is accumulated in the microstructure, primarily in a dislocation substructure, which emerges during plastic deformation. This accumulation depends on the crystal orientation, as some orientations are more favourably oriented than others to accommodate the boundary conditions of the plastically imposed velocity field. Thus, some orientations require a higher slip activity than others. The established substructure involves the formation of geometrically necessary dislocations (GNDs), which are instrumental in accommodating strain differences between adjacent regions within a grain. This redistribution causes local changes in crystallographic orientation, and thus, becomes visible as orientation gradients that can be observed, e.g., in EBSD maps [4].
The assessment of locally stored energy caused by plastic deformation, as determined through EBSD, has been conducted using metrics based on kernels, specifically the Kernel Average Misorientation (KAM). This metric heavily depends on the number of nearest neighbours considered. The KAM slope has been proposed as a metric for plastically stored energy to minimise this inherent dependence [5,6,7]. This method involves evaluating, for each pixel, the average misorientation gradient (Δθ/Δx) for n nearest neighbours. It is noted that for n nearest neighbours (with n ≤ 4), there is a linear increase in the KAM as a function of the number of nearest neighbours. The dimension of this slope is °/µm and corresponds to the elements of the curvature tensor described by Nye [8]. Pantleon [9] demonstrated that this curvature tensor positively correlates with the dislocation density. This approach enables a more reliable estimate of the locally stored energy than the KAM metric, avoiding the limitations of choosing the number of nearest neighbours in the KAM calculation.
Despite extensive research on the formation of recrystallisation textures in ferritic steels [4], it has not yet been investigated considering local misorientation gradients as a statistical metric to quantify the plastically stored energy and its role in local orientation selection during the progress of recrystallisation. In this research, we will address this knowledge gap. To this purpose, the Electron Backscattered Diffraction (EBSD) technique is employed to obtain accurate measurements of the misorientation gradients at various stages of recrystallisation [5,6]. In the current study, samples that were subjected to different deformation levels across multiple recovery states are examined. This approach enables a detailed understanding of how the internal energy of the material is distributed among different crystal orientations and how it changes during annealing, providing valuable information for optimising industrial processes and enhancing material properties.

2. Materials and Methods

The chemical composition of the as-received samples is listed in Table 1. The samples were commercially hot rolled to a thickness of 3.5 mm before undergoing cold rolling in the laboratory with varying degrees of thickness reduction (75%, 80%, 85% and 90%) through multiple passes using a two-high rolling mill with rolls having a diameter of 350 mm. Subsequently, each cold-rolled strip, measuring 400 mm long and 25 mm wide, was subjected to a gradient annealing treatment (Figure 1a). The process involved the immersion of one end of the sample in a salt bath for a period of 120 to 200 s, whereby the temperature of 950 °C was indicated by the thermocouple positioned centrally in the salt bath. After annealing, the samples were water quenched to room temperature.
The opposite end of the strip was secured to a solid copper block kept at room temperature. The temperature variations along the strip were meticulously recorded using five thermocouples (TC), strategically welded at intervals along its length (Figure 1b). The recorded temperatures revealed a gradient, whereby the end immersed in the oven reached a temperature of 900 °C. The end attached to the copper block registered a maximum temperature of 60 °C.
This unconventional gradient annealing method has been chosen to allow the continuous monitoring of temperature-dependent phenomena, improving efficiency and reducing experimental variability by avoiding discrepancies between batches. It also provides valuable insights into the local effects of thermal gradients commonly seen in industrial practices, which can be challenging to replicate in laboratory conditions.
The microstructural characterisation at each point monitored by the thermocouples was performed using electron backscatter diffraction (EBSD). EBSD measurements were carried out with a FEI Quanta™ 450-FEG-SEM, equipped with a Hikari EBSD camera. Sample preparation involved standard grinding, polishing, and electropolishing methods. The scanning electron microscope (SEM) was operated at an acceleration voltage of 20 kV and a beam current of 2.3 nA. Two types of scans were carried out on the ND-RD section of each sample: (i) to capture the details of the substructure a high resolution scan was carried out including approximately 1,000,000 points within an area of 35 × 35 µm2, with a step size of 0.1 µm, and (ii) to characterise the crystallographic texture wide field scans were performed over an area of 385 × 1280 µm2 with a step size of 0.2 µm, comprising also about 1,000,000 points. To monitor the recrystallisation progress between thermocouples 1 and 2, each millimetre was evaluated through a scan of an area measuring 250 µm × 1000 µm, with a step size of 0.4 µm, with approximately 700,000 points. The data were post-processed using OIM™ software version 8.2 [10].
In the post-processing of the EBSD data, the Kuwahara filter was employed to optimise the angular resolution of the EBSD measurement [11,12,13]. The filter applies edge-preserving noise smoothing, which is crucial for detecting short-range misorientations, as it suppresses short-range noise induced by experimental scatter—the study conducted by Brough et al. [14]. Applying the Kuwahara filter can improve angular resolution to less than 0.02°. This enhancement in angular resolution allows for detailed analysis of EBSD maps, which is essential for detecting local misorientation changes during recovery and recrystallisation processes. Conversely, the recrystallised microstructure was identified through the application of a criterion based on the Grain Orientation Spread (GOS) <1.5° [15,16,17].

3. Results

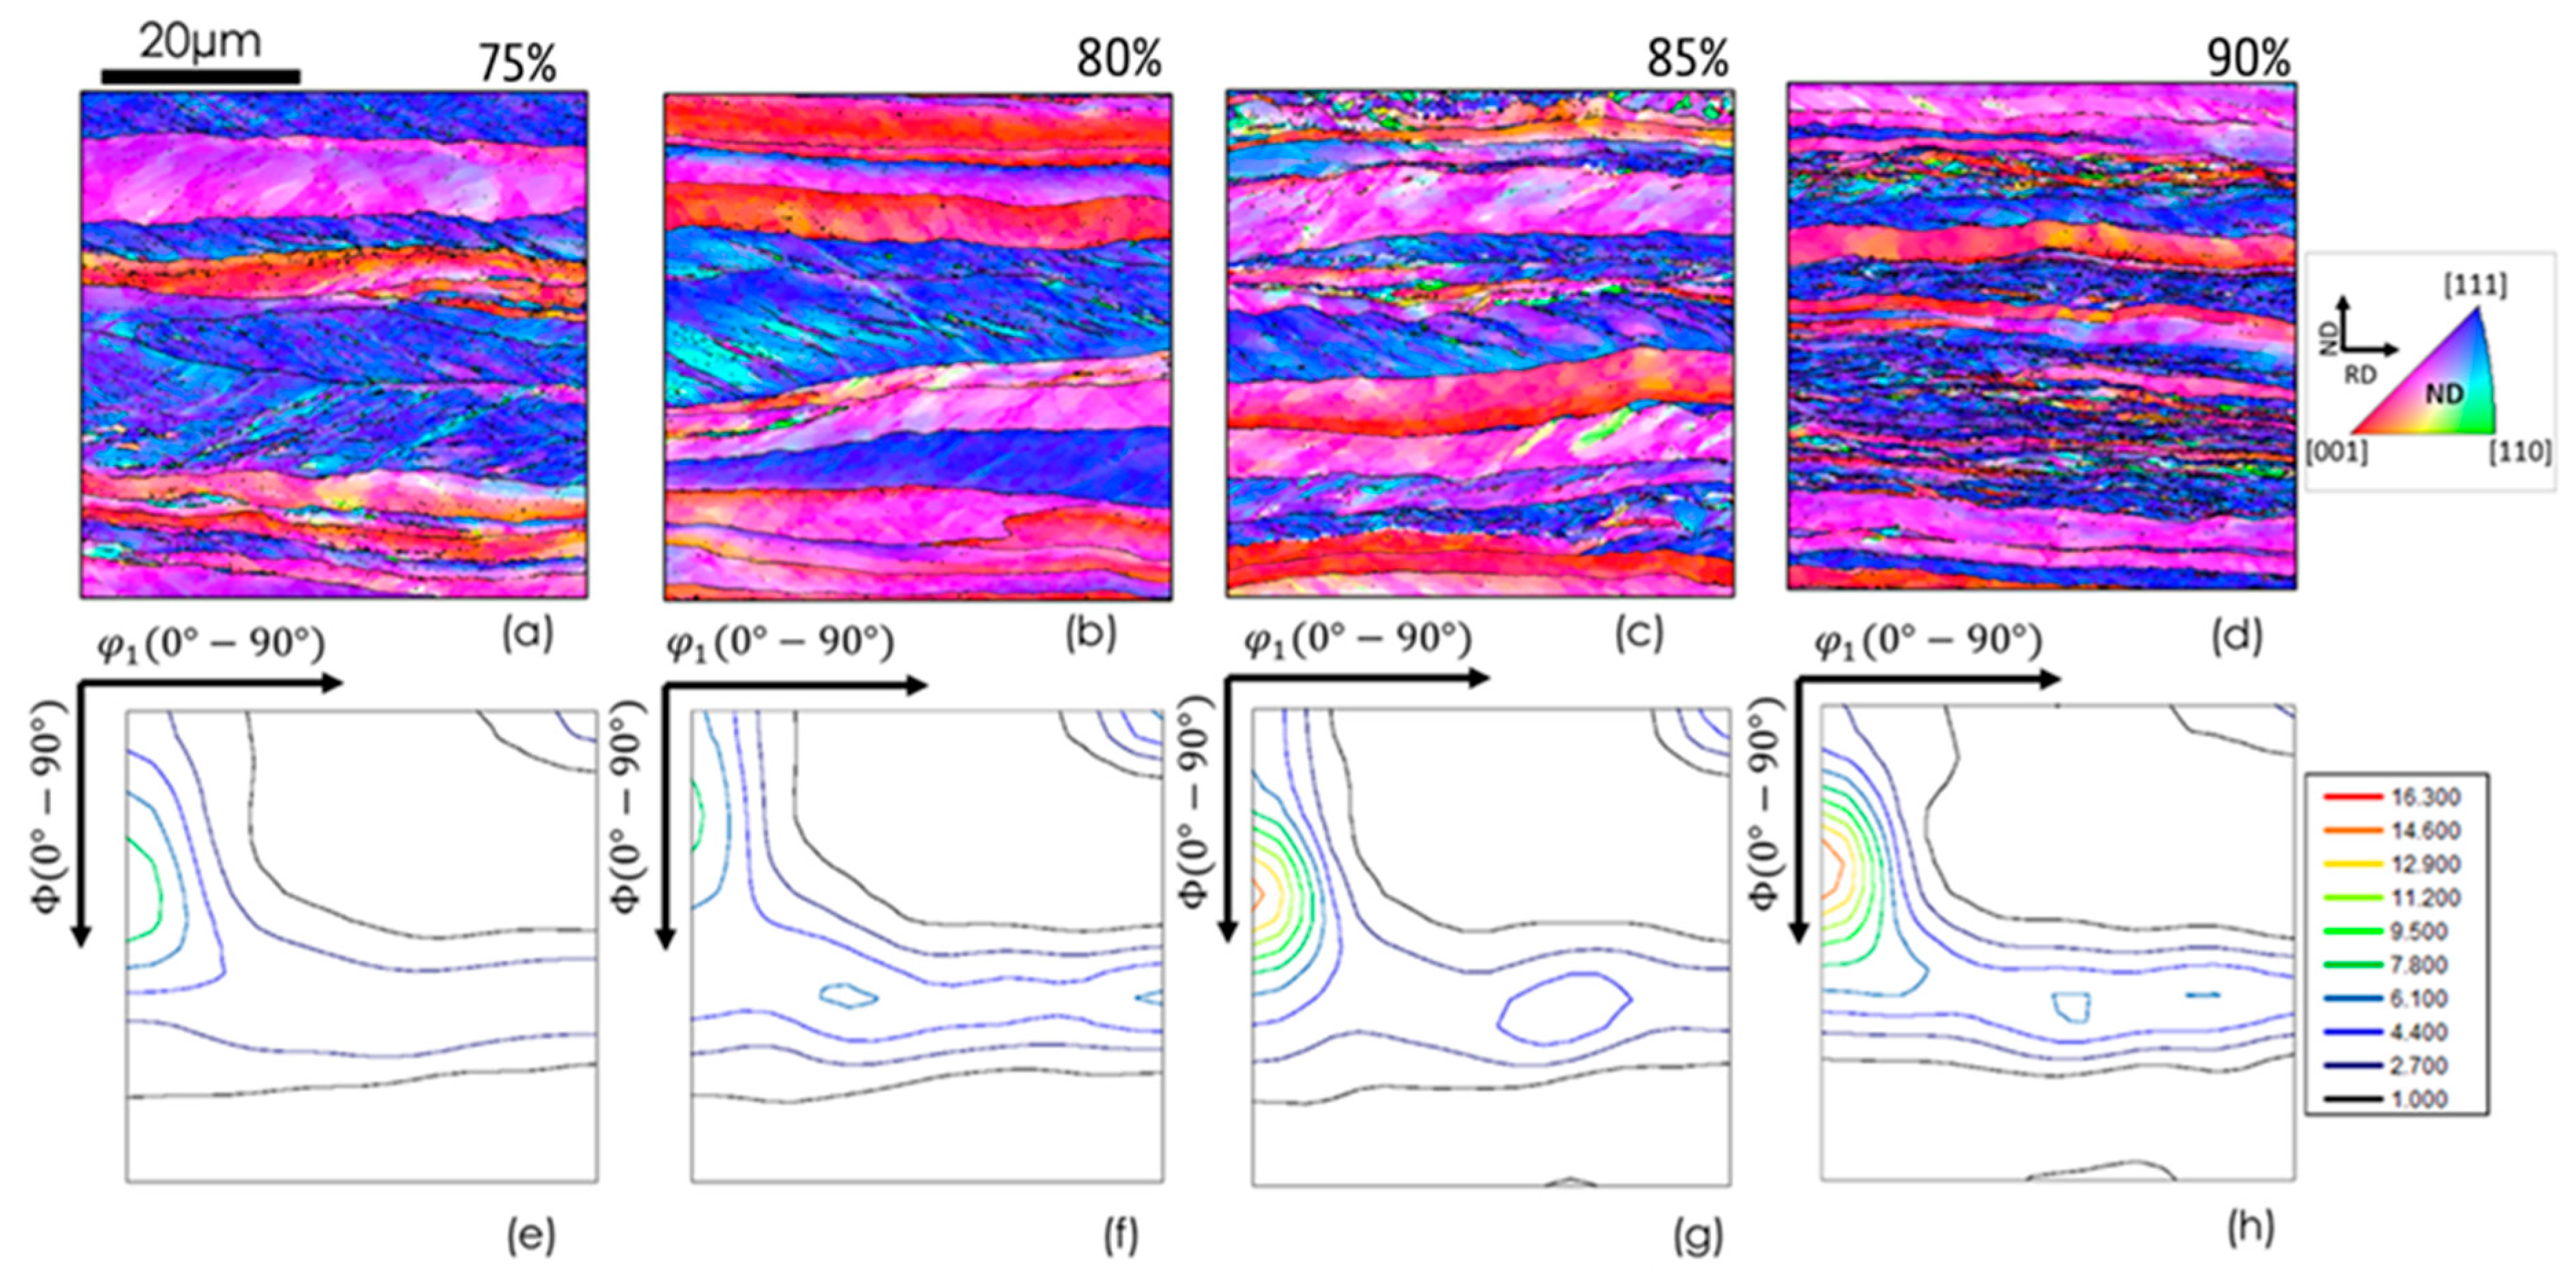
Figure 2a–e shows the inverse pole Figure maps (IPF) of various samples subjected to deformation by rolling to different reductions. It is evident that as the reduction rises, the fragmentation of the grains also increases. Figure 2e–h depicts the gradual evolution of texture with increased deformation. As reduction increases, the α/γ fiber texture develops, whereby the α fiber largely dominates at the highest reductions.
Figure 3 displays the misorientation gradient frequency distribution and the cumulative frequency for different reduction percentages. Figure 3a,b show that the distributions shift notably towards larger orientation gradient values as the rolling reduction increases. This behaviour indicates that a higher reduction percentage correlates with an increase in short-range misorientation, highlighting the impact of strain amplitude on the microstructural heterogeneity induced in the material.
Figure 4 illustrates the microstructural evolution at different locations along a strip subjected to a continuous heat treatment under a thermal gradient after a cold rolling reduction of 80%. As shown in Figure 4a–d, grain orientation spread (GOS) maps indicate that recrystallisation has not yet started after annealing at 60 °C and 145 °C. At 600 °C, recrystallisation begins in certain areas, as shown in Figure 4c and after reaching 800 °C, the recrystallisation is complete, resulting in minimal intra-granular internal misorientation, as depicted in Figure 4d. Figure 4e–h show an analysis of the crystallographic texture at each point. Notably, the intensity of the α-fiber diminishes as the peak temperature increases, eventually vanishing, while a distinct γ-fiber begins to develop once the material approaches full recrystallisation.
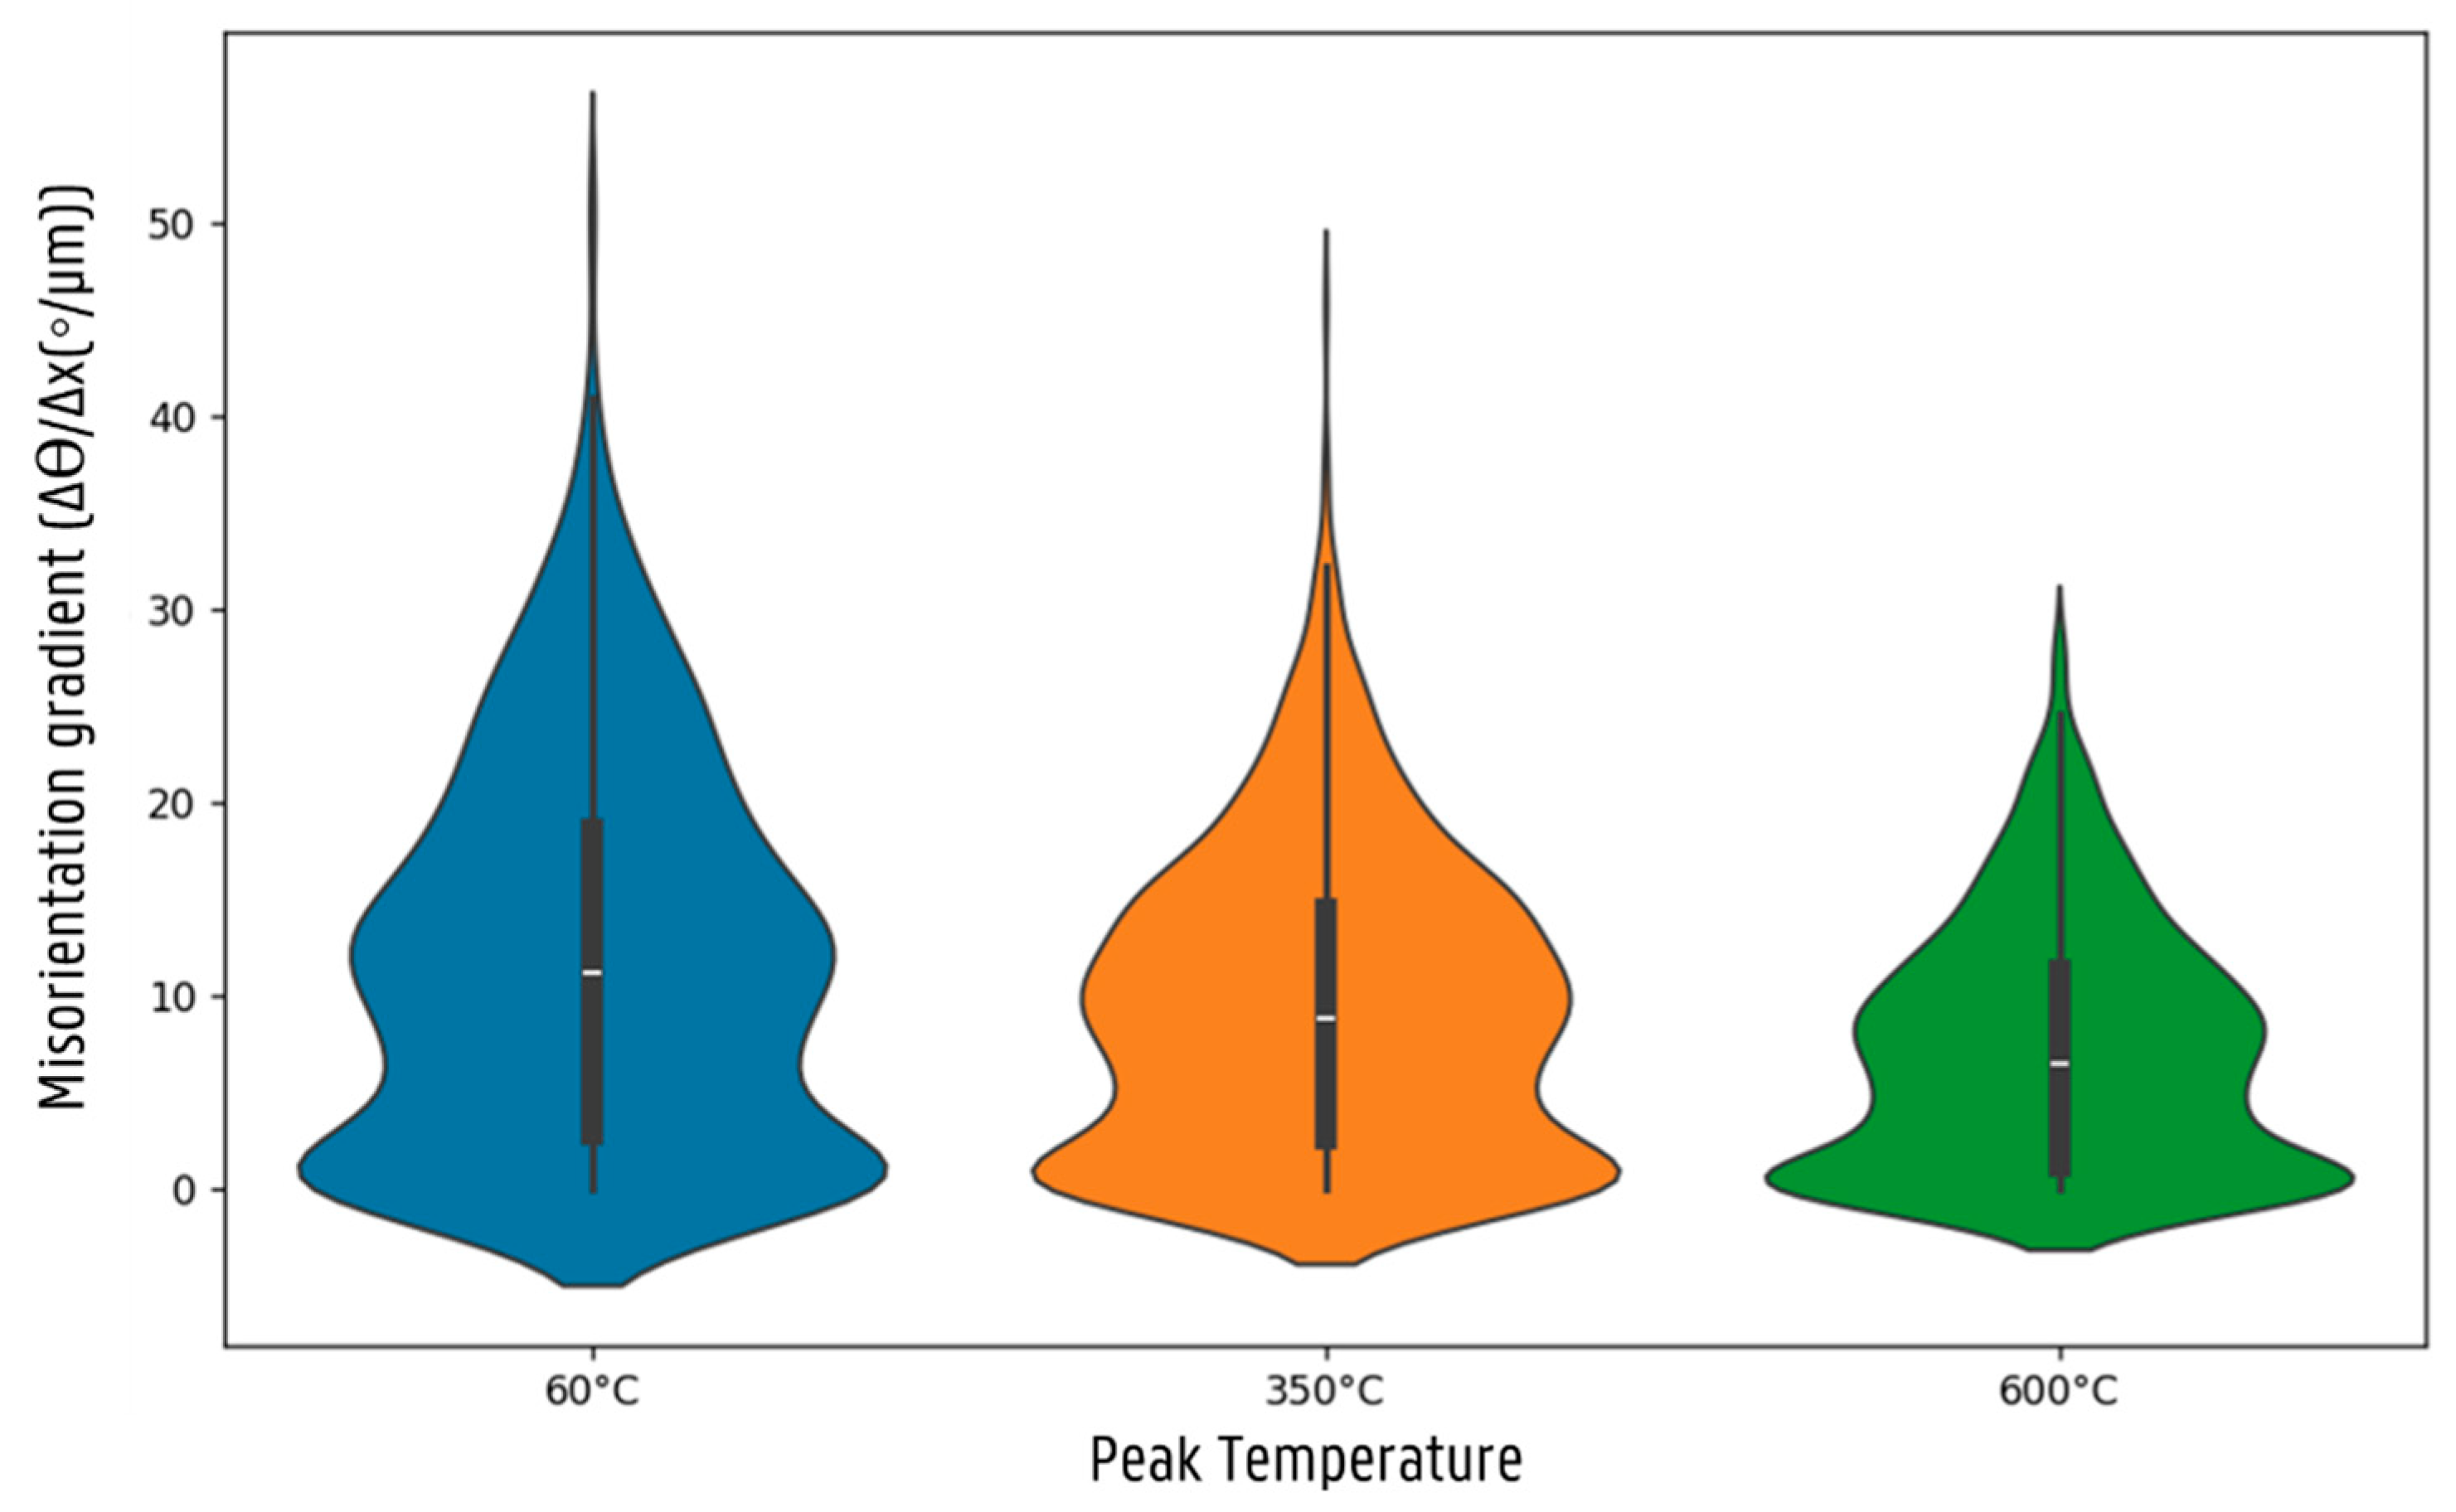
As illustrated in Figure 5, peak temperature increases with a decrease in the mean misorientation gradient and the standard deviation of said gradient. This higher standard deviation at the lower temperatures is commensurate with the larger short-range heterogeneity of the deformed microstructure, reflecting the intra-granular misorientation gradients.
It was observed that the bulk of the recrystallisation progress occurs between thermocouples 1 and 2, positioned about 6 mm apart (cf. Figure 1a). A detailed analysis was conducted on the segment between these two points using Electron Backscatter Diffraction (EBSD) to assess the recrystallisation process. The results, illustrated in Figure 6, indicate that the percentage of recrystallisation at the low temperature end is 46%, whereas it has increased to 77% at the high temperature end.
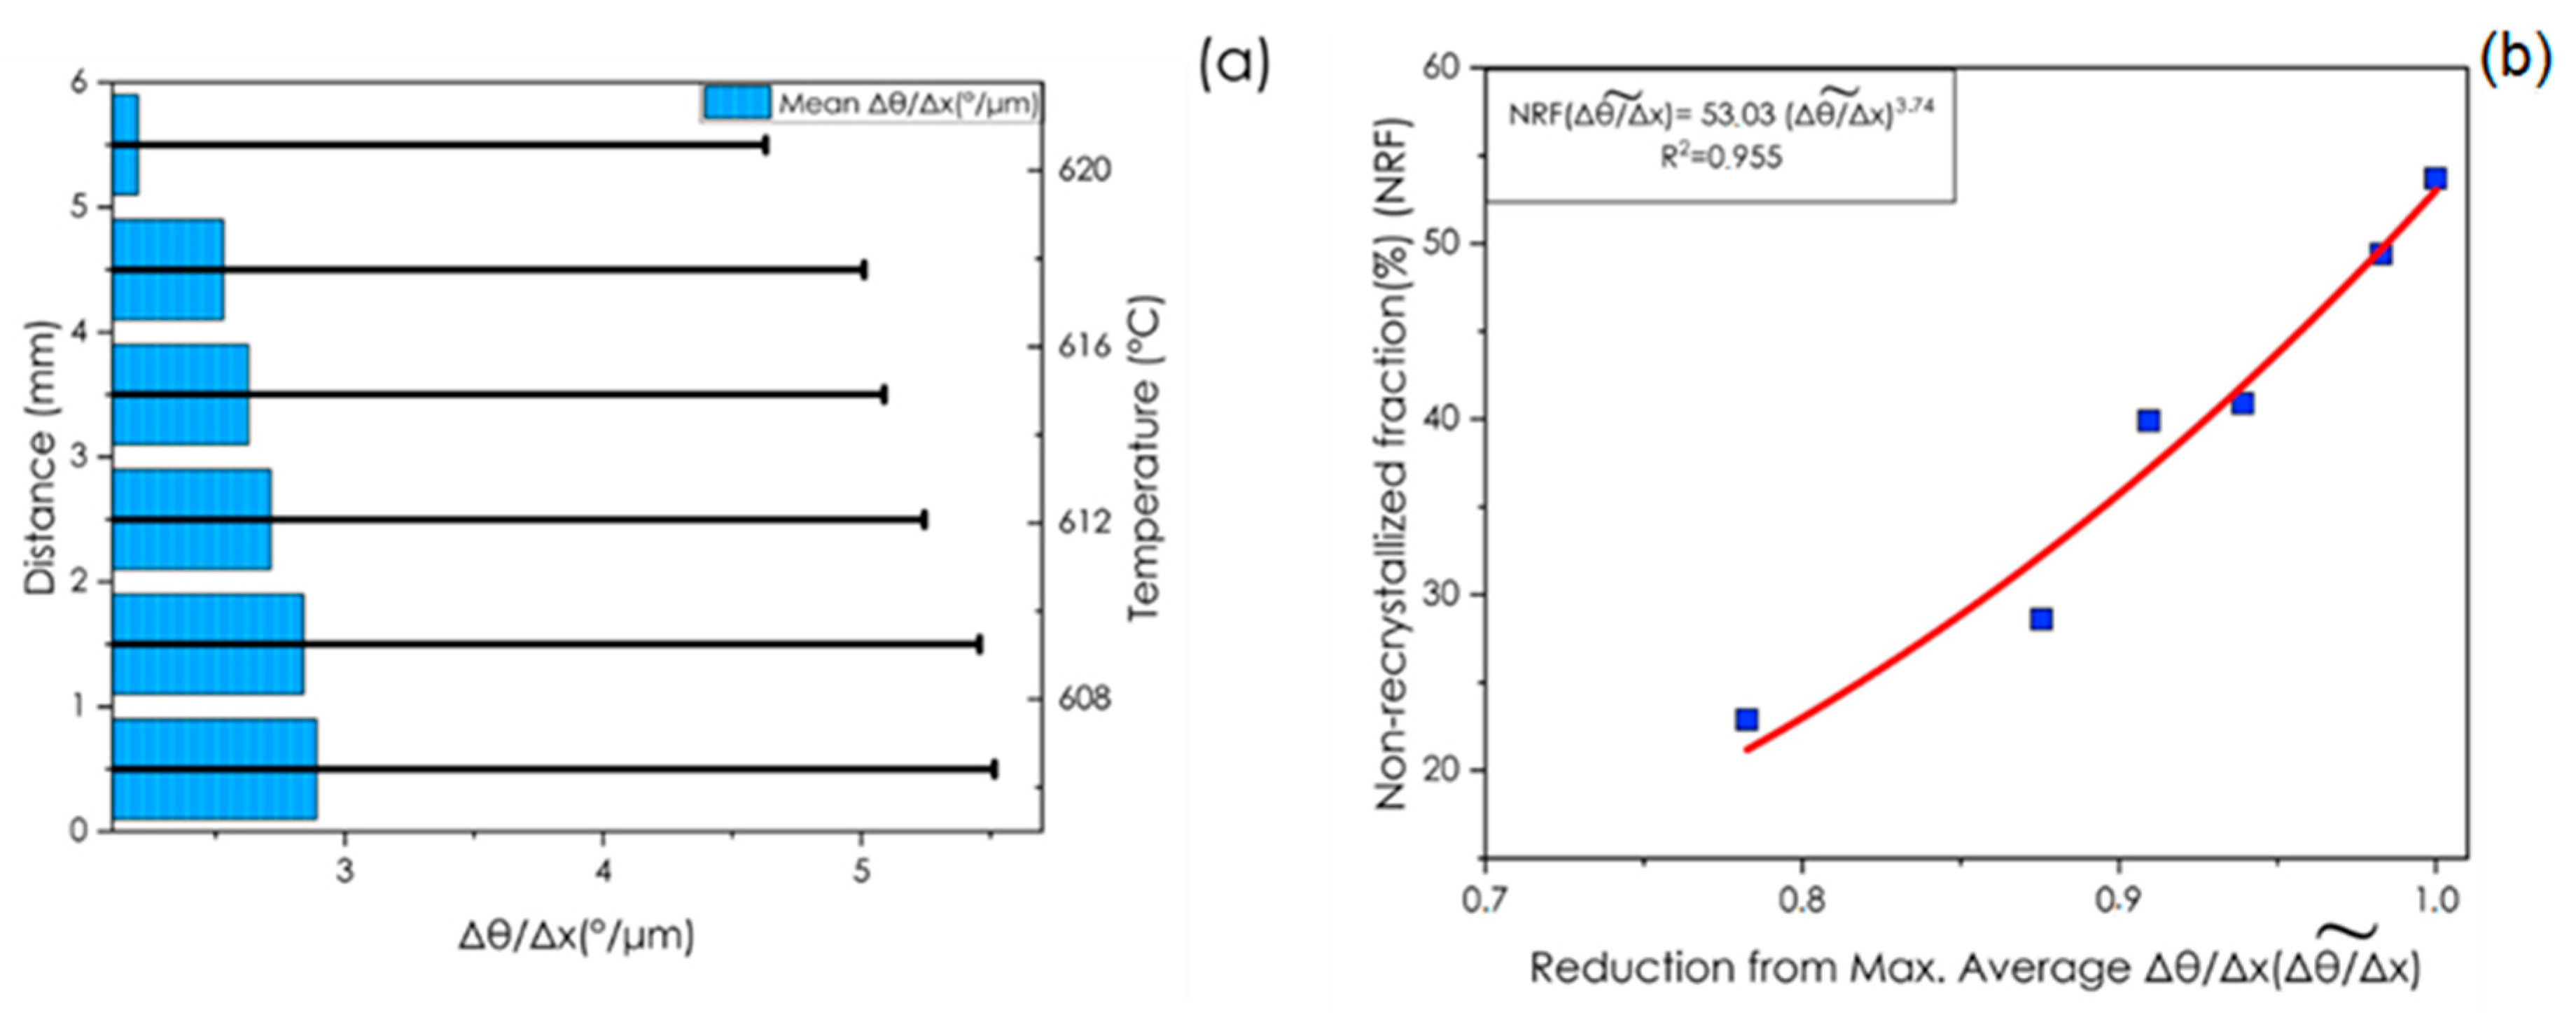
Figure 7 illustrates the misorientation gradient evolution of the material between ~600 °C and ~630 °C. It is important to emphasise that the misorientation gradient exclusively applies to the non-recrystallised fraction of the microstructure. Figure 7a shows the variation in the mean misorientation gradient and the standard deviation as a distance function along the sample. Notably, as the temperature increases, the gradient value and its standard deviation decrease, indicating an increase in the homogeneity of the material.
Figure 7b shows the relationship between the fraction of deformed/recovered (non-recrystallised) structure and the normalised mean misorientation gradient, expressed as a percentage of its maximum value. It can be observed that at ~80% of recrystallised volume fraction, the remaining deformed grains still possess ~80% of the initial mean misorientation value θ / x ~ .
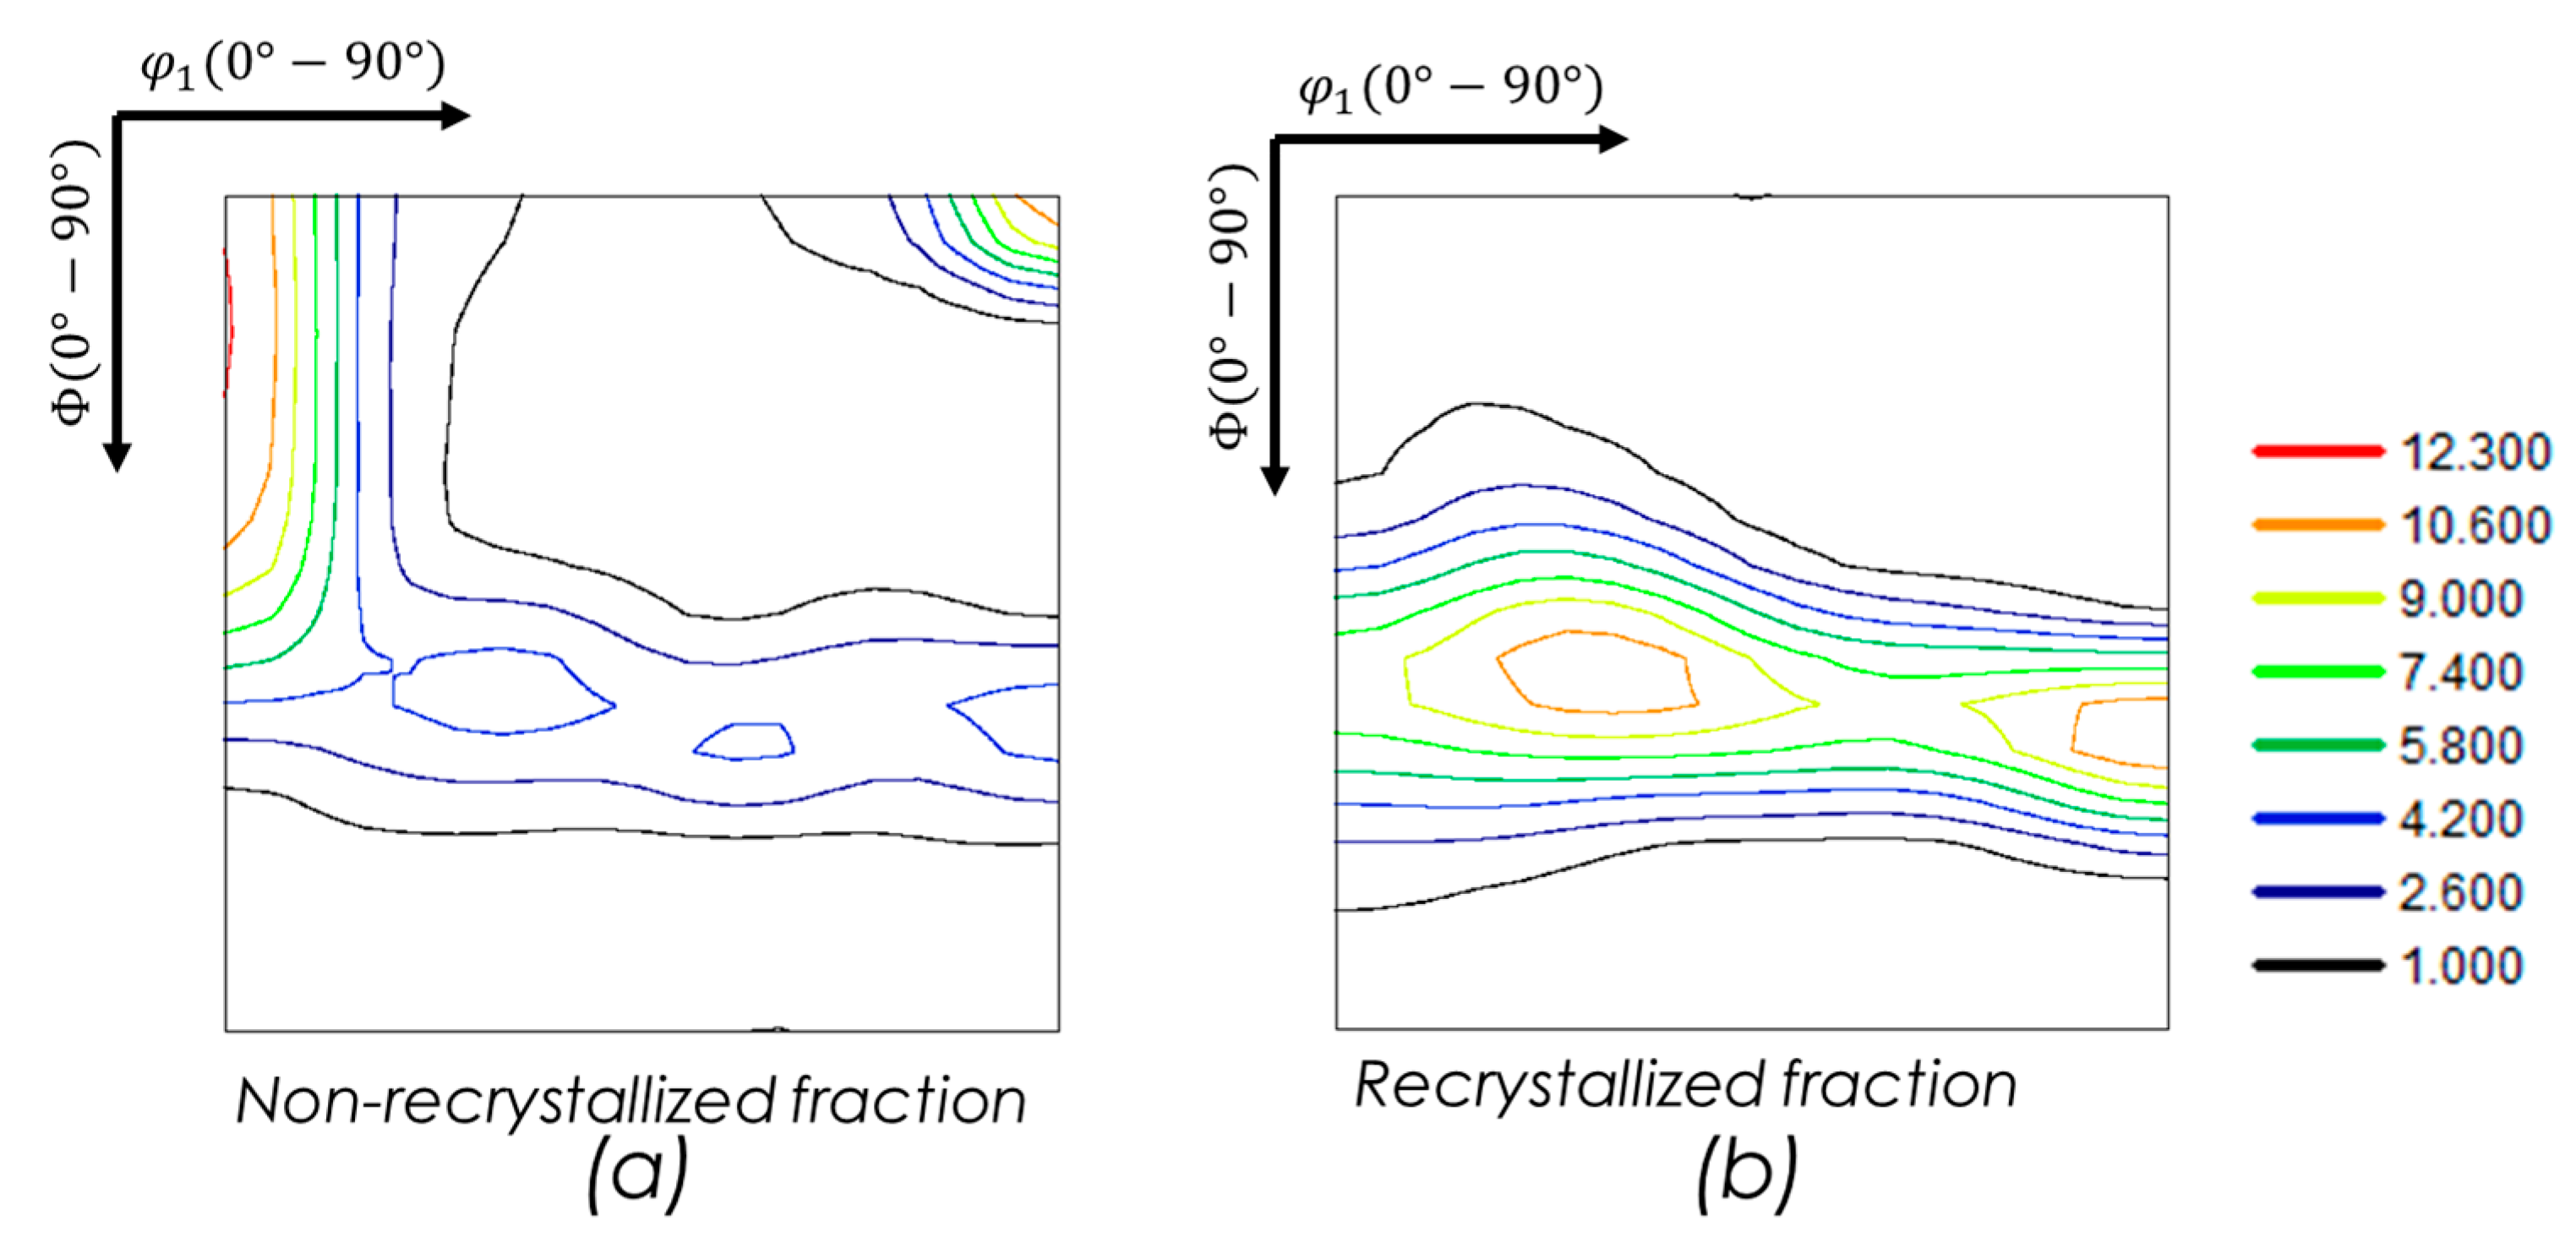
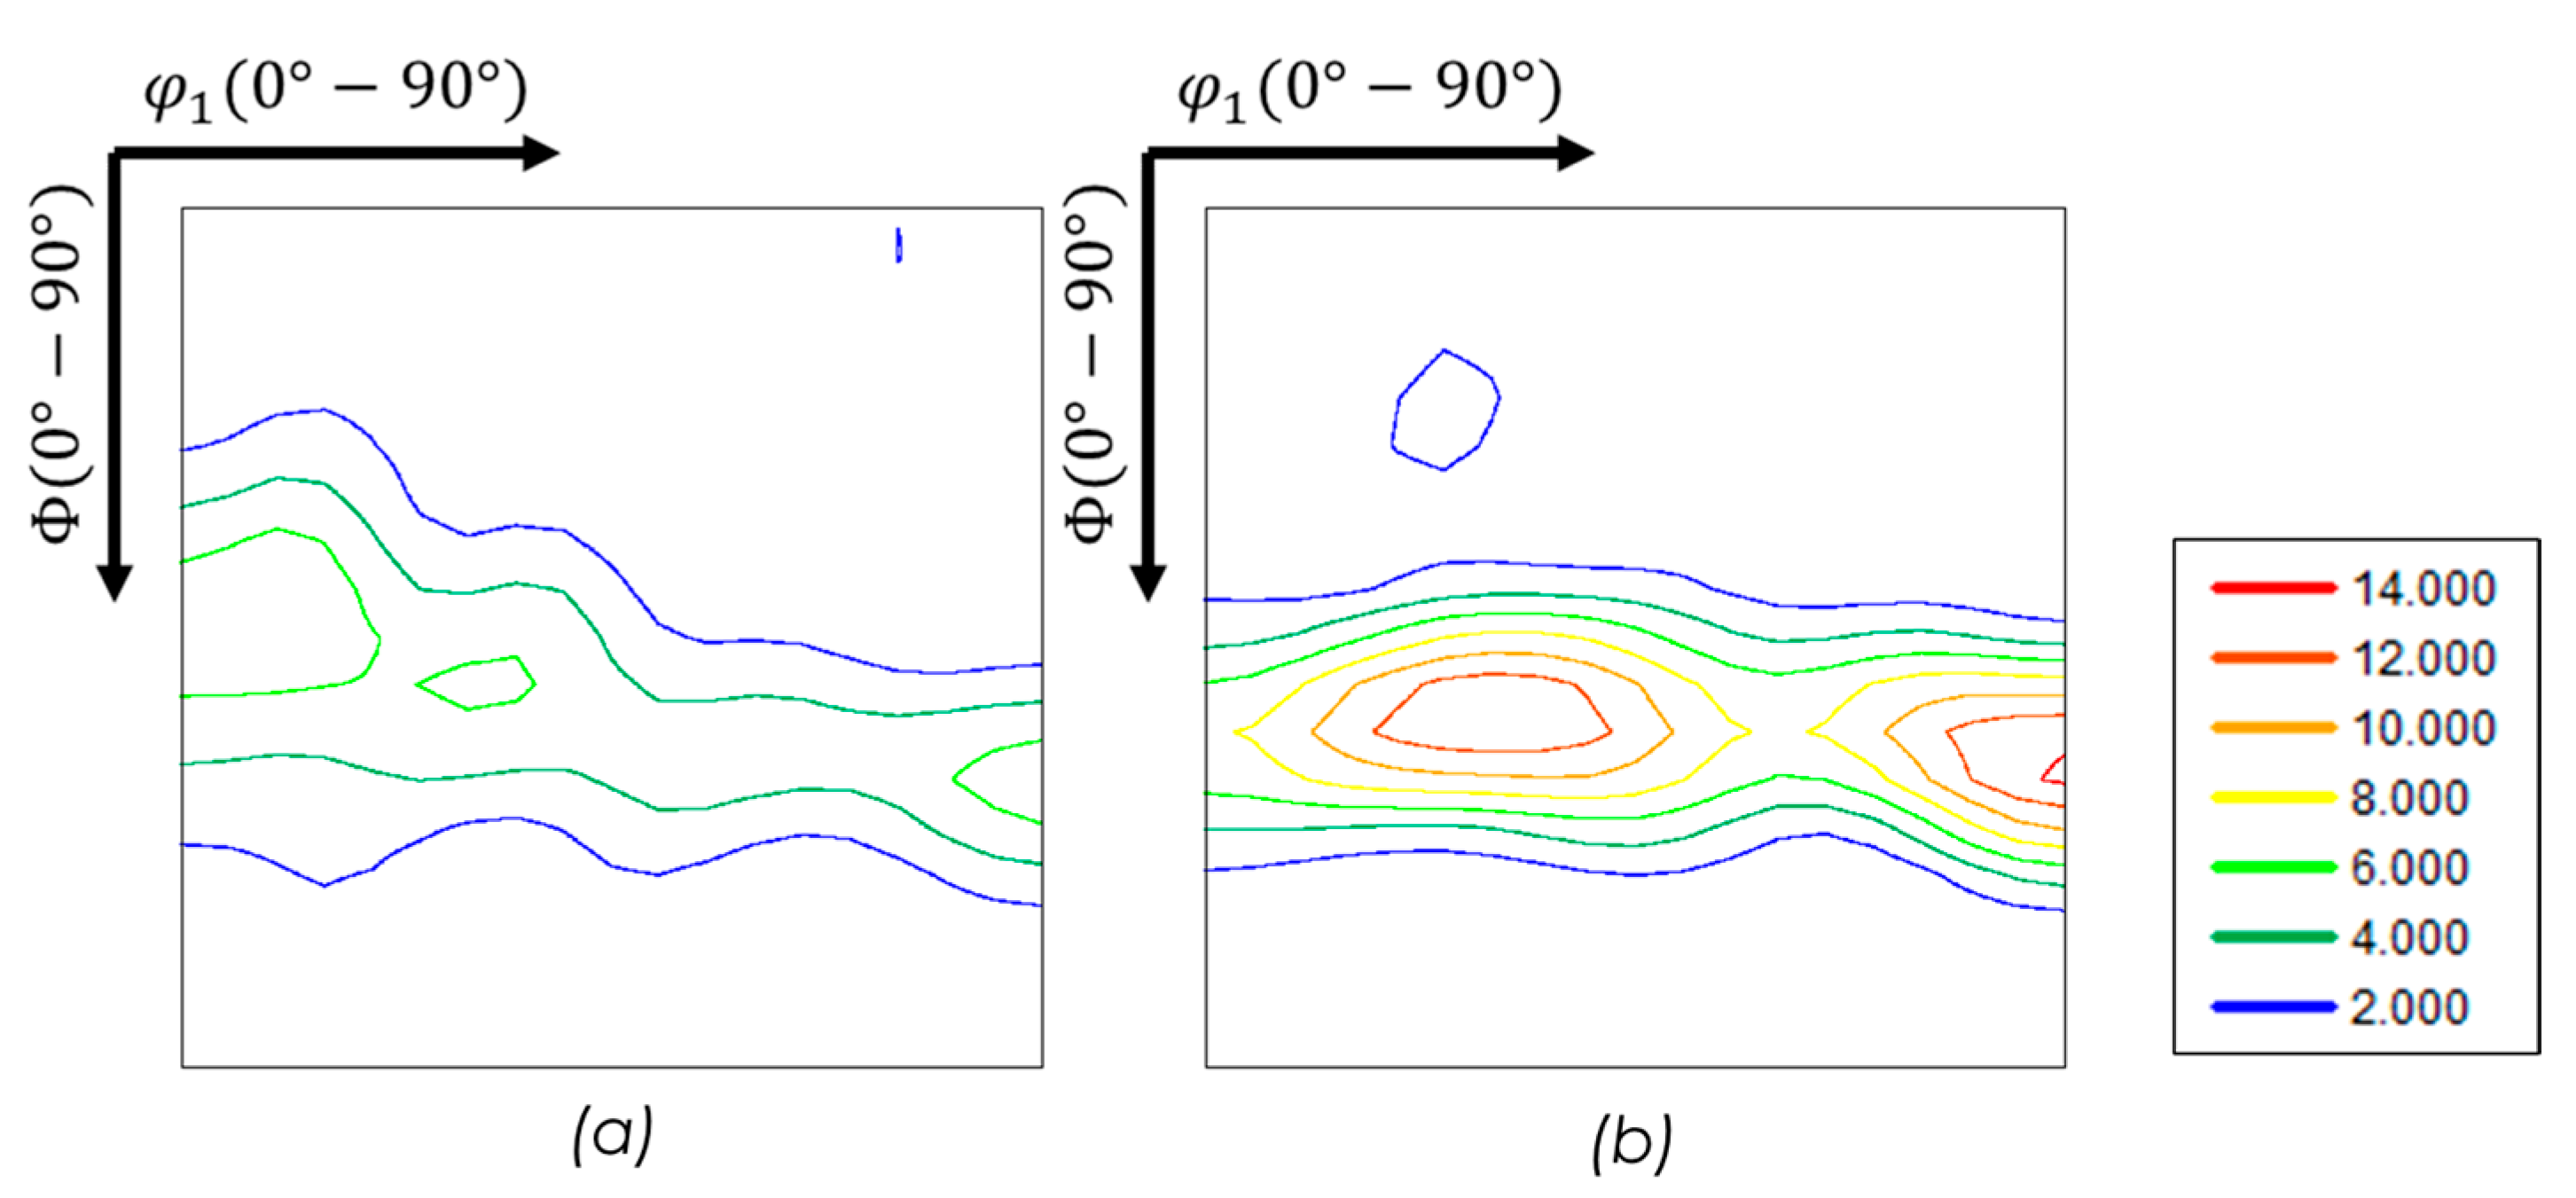
Figure 8 shows the ODFs observed after a peak temperature of 620 °C and 630 °C, corresponding to the non-recrystallised grains (i.e., the deformed + recovered microstructure) (Figure 8a) and the recrystallised grains (Figure 8b), respectively. The ODF reveals the development of a strong γ-fiber in the early stages of recrystallisation and a strong α-fiber for the non-recrystallised microstructure.
Figure 9 shows the different ODFs for fully recrystallised samples subjected to two initial cold rolling conditions: 75% thickness reduction (Figure 9a) and 90% thickness reduction (the maximum reduction, Figure 9b). The ODFs reveal the development of a γ-fiber in both cases, but with a much stronger intensity after 90% cold rolling and a more heterogeneously distributed intensity along the γ-fiber with a maximum on the {111}<211> component. It also can be noticed that a minor maximum appears in the recrystallisation texture on the {311}<136> component after 90% rolling reduction.

4. Discussion

Figure 2a–d shows the evolution of microstructure. Figure 2e–h illustrates the texture as a function of increasing degrees of deformation—this increase in deformation results in greater grain fragmentation and a more heterogeneous microstructure. At the same time, the intensity of the α fiber of the deformation texture shows significant variation, rising from a maximum of 7.8 on the {112}<110> component at 75% reduction to 16.3 at 90% reduction. The energetic changes associated with different degrees of reduction are detailed more in Figure 3. As the reduction increases, the misorientation gradient advances towards higher values. The analysis by Rollet et al. [18] indicates that orientation gradients are mainly concentrated near grain boundaries in Fe-α alloys, as seen in both experimental and numerical studies. This phenomenon, involving changes in crystallographic orientation caused by activating multiple slip systems, gives rise to the appearance of deformation bands, which demonstrate the occurrence of grain fragmentation. For the present, IF steel, the hot band microstructure featured an equiaxed grain structure with an average size of 40 µm. The average band width (measured along ND) after 75, 80, 85 and 90% cold reduction is 15.71 µm, 16.08 µm, 8.48 µm, and 7.27 µm, respectively. This corresponds to a fragmentation factor of 3.18, 3.11, 5.90 and 6.90, for the respective rolling reductions of 75, 80, 85 and 90%–i.e., on average a single hot band grain has fragmented in ~3, ~3, ~6 and ~7 parts, respectively, as a result of cold rolling. More precisely, it can be observed in Figure 2a–d that this formation of deformation bands, i.e., the fragmentation of grains, is particularly prevalent in the γ-fiber grains (the blue grains).
Figure 4c and Figure 6 both show the start of primary recrystallisation. Microstructural analysis reveals that recrystallisation mainly begins at high-angle grain boundaries (HAGB) and is seen primarily in γ-fiber grains [19,20,21,22]. Looking at these observations within the context of the deformed microstructure, it is clear that the recovery and recrystallisation processes speed up in these regions of increased misorientation. During plastic deformation, dislocations interact with each other and various defects, leading to internal stresses and changes in the crystalline orientation. As the percentage reduction increases, the importance of grain fragmentation and the build-up of imperfections also increases, which boosts misorientation within the microstructure [23,24]. As exemplified by the fragmentation factor (cf. supra).
Figure 7a illustrates the changes in stored energy during different stages of recovery and recrystallisation. It is clear that increasing the peak temperature (and, thus, the volume fraction of recrystallisation) results in a gradual decrease in stored energy within the deformed matrix grains that have not yet been consumed by recrystallising grains. Recrystallisation is described as a process that reduces energy by replacing deformed areas with defect-free grains. Conversely, recovery decreases energy without a discontinuous change in the microstructure. As the γ-fiber grains are the earliest to recrystallise, it is obvious that the last orientations to remain in the deformed matrix (i.e., the non-recrystallised grains) are α-fiber grains. Previous data have shown [25]. Due to static recovery, the intragranular average misorientation gradient in the α-fiber grains decreases by ~23%, which is confirmed by the present data.
The correlation between the uncrystallised volume fraction and the stored energy in metals subjected to plastic deformations is governed by dislocation density. Analysing the relationship between the recovered microstructure and its corresponding stored energy (cf. Figure 7b), as gauged by the average misorientation gradient, can be quantified by a polynomial equation with an exponent of ~3.7. This finding indicates that the progress of recrystallisation is quite sensitive to the stored energy metric under consideration here. This observation highlights the influence of fluctuations in strain energy accumulation on the recrystallisation dynamics in interstitial-free (IF) steel.
The formation of the recrystallisation texture depends on local micro-growth selection operating on the substructural level. In general, the local growth law is determined by the well-known dependence v = M*ΔG, with v the propagation velocity of migrating boundary (in m/s), M the mobility (in m3/(J.s)) and ΔG the driving force (in J/m2) [26,27,28]. Both mobility and driving force are dependent on the misorientation gradient. From a macro-scale consideration, one might expect that α-fiber orientations have a nucleation advantage as they exhibit a reduced stored energy compared to the γ-fiber grains. However, the data show that the nucleation texture is strongly dominated by γ-fiber grains. The reason is that there are many more intragranular γ-fiber sub-grain boundaries (with sufficient orientation gradients providing both mobility and driving force for micro growth to occur) than α-fiber grains are neighbouring γ-fiber grains. Conversely, the intra-granular α-fiber sub-grain boundaries do not exhibit a sufficient orientation gradient for successful nucleation events. The complexity of the deformation structure on the local scale determines the initial condition on which the local growth law applies (v = M*ΔG) and ultimately determines the orientation selection and henceforth the dominant recrystallisation texture component.
The present data apply to a single-phase ferrite IF steel in which the intra-granular orientation gradients are primarily determined by crystallographic features, i.e., α-fiber vs. γ-fiber grains. However, modern low-carbon high-strength steels, such as, e.g., Dual-Phase steel, Quench and Partition Steels, TRIP steels or medium manganese steels, have a deformation substructure, which is mainly determined by phase and chemical heterogeneities, which are different from the crystallographic heterogeneities presently under consideration. Hence, the characteristic transformation of α to γ-fiber texture, which is so common for IF steels, is not observed or only to a minor extent in these advanced high-strength steels [29,30]. This is an additional indirect corroboration of the arguments presented here on the role of crystallographic orientation gradients in the formation of recrystallisation textures in IF steels.

5. Conclusions

This study underscores the critical role of local misorientation gradients in the recrystallisation behaviour of interstitial-free (IF) steels as observed in an experiment whereby a sample was submitted to a temperature gradient during annealing. The findings emphasise that the misorientation gradient, considered a relevant metric of stored energy of plastic deformation, is of key importance for nucleating new grains during annealing. A power-law relation with an exponent of n ≈ 3.7 can phenomenologically describe the relationship between the non-recrystallised fraction and the average misorientation gradient. This illustrates the sensitivity of the recrystallisation kinetics to localised orientation variations.
According to conventional behaviour, deformed γ-fiber orientations are strongly preferred for nucleation and growth compared to α-fiber grains, among the last to be consumed by the growing recrystallised grains. This increased nucleation potential of γ-fiber orientations can be attributed to the increased incidence of short-range misorientation gradients, which is also underscored by the increased prevalence of fragmentation of these grains during cold rolling. Conversely, α-fiber grains do not exhibit a sufficient incidence of intra-granular misorientation gradients to allow for a critical frequency of successful nucleation events. Only the α-fiber grains directly neighbouring γ-fiber grains exhibit a viable nucleation potential, but these are too sparsely distributed to affect the overall recrystallisation texture.

Author Contributions

Conceptualization, E.A.S.H. and L.A.I.K.; Methodology, F.M.C.C.; Validation, E.A.S.H. and L.A.I.K.; Formal analysis, E.A.S.H., F.M.C.C. and L.A.I.K.; Investigation, E.A.S.H. and F.M.C.C.; Resources, L.A.I.K.; Data curation, E.A.S.H.; Writing—original draft, E.A.S.H.; Writing—review & editing, E.A.S.H., F.M.C.C. and L.A.I.K.; Visualization, E.A.S.H.; Supervision, F.M.C.C. and L.A.I.K.; Project administration, F.M.C.C. and L.A.I.K.; Funding acquisition, F.M.C.C. and L.A.I.K. All authors have read and agreed to the published version of the manuscript.

Funding

This research was funded by Agencia Nacional de Investigación y Desarrollo, grant number 21210158.

Data Availability Statement

The original contributions presented in this study are included in the article. Further inquiries can be directed to the corresponding author.

Conflicts of Interest

The authors declare no conflicts of interest.

References

  1. Ye, W.; Le Gall, R.; Saindrenan, G. A Study of the Recrystallization of an IF Steel by Kinetics Models. Mater. Sci. Eng. A 2002, 332, 41–46. [Google Scholar] [CrossRef]
  2. Saha, R.; Ray, R.K. Effect of Severe Cold Rolling and Annealing on the Development of Texture, Microstructure and Grain Boundary Character Distribution in an Interstitial Free (IF) Steel. ISIJ Int. 2008, 48, 976–983. [Google Scholar] [CrossRef]
  3. Massardier, V.; Ngansop, A.; Fabrègue, D.; Merlin, J. Identification of the Parameters Controlling the Grain Refinement of Ultra-Rapidly Annealed Low Carbon Al-Killed Steels. Mater. Sci. Eng. A 2010, 527, 5654–5663. [Google Scholar] [CrossRef]
  4. Humphreys, F.J.; Rohrer, G.S.; Rollett, A. Recrystallization and Related Annealing Phenomena, 3rd ed.; Elsevier: Amsterdam, The Netherlands, 2017. [Google Scholar]
  5. Moussa, C.; Bernacki, M.; Besnard, R.; Bozzolo, N. About Quantitative EBSD Analysis of Deformation and Recovery Substructures in Pure Tantalum. Proc. IOP Conf. Ser. Mater. Sci. Eng. 2015, 89, 012038. [Google Scholar] [CrossRef]
  6. Moussa, C.; Bernacki, M.; Besnard, R.; Bozzolo, N. Statistical Analysis of Dislocations and Dislocation Boundaries from EBSD Data. Ultramicroscopy 2017, 179, 63–72. [Google Scholar] [CrossRef] [PubMed]
  7. Lanjewar, H.; Naghdy, S.; Verleysen, P.; Kestens, L.A.I. Statistical Analysis of Dislocation Substructure in Commercially Pure Aluminum Subjected to Static and Dynamic High Pressure Torsion. Mater. Charact. 2020, 160, 110088. [Google Scholar] [CrossRef]
  8. Nye, J.F. Some Geometrical Relations in Dislocated Crystals. Acta Metall. 1953, 1, 153–162. [Google Scholar] [CrossRef]
  9. Pantleon, W. Resolving the Geometrically Necessary Dislocation Content by Conventional Electron Backscattering Diffraction. Scr. Mater. 2008, 58, 994–997. [Google Scholar] [CrossRef]
  10. EDAX, OIM Analysis Help: Charts; EDAX Inc.: Mahwah, NJ, USA, 2013.
  11. Kuwahara, M.; Hachimura, K.; Eiho, S.; Kinoshita, M. Processing of RI-Angiocardiographic Images. In Digital Processing of Biomedical Images; Springer: Boston, MA, USA, 1976. [Google Scholar]
  12. Humphreys, F.J. Grain and Subgrain Characterisation by Electron Backscatter Diffraction. J. Mater. Sci. 2001, 36, 3833–3854. [Google Scholar] [CrossRef]
  13. Humphreys, F.J.; Bate, P.S.; Hurley, P.J. Orientation Averaging of Electron Backscattered Diffraction Data. J. Microsc. 2001, 201, 50–58. [Google Scholar] [CrossRef] [PubMed]
  14. Brough, I.; Bate, P.S.; Humphreys, F.J. Optimising the Angular Resolution of EBSD. Mater. Sci. Technol. 2006, 22, 1279–1286. [Google Scholar] [CrossRef]
  15. Ayad, A.; Ramoul, M.; Rollett, A.D.; Wagner, F. Quantifying Primary Recrystallization from EBSD Maps of Partially Recrystallized States of an IF Steel. Mater. Charact. 2021, 171, 110773. [Google Scholar] [CrossRef]
  16. Mirzadeh, H.; Cabrera, J.M.; Najafizadeh, A.; Calvillo, P.R. EBSD Study of a Hot Deformed Austenitic Stainless Steel. Mater. Sci. Eng. A 2012, 538, 236–245. [Google Scholar] [CrossRef]
  17. Alvi, M.H.; Cheong, S.W.; Suni, J.P.; Weiland, H.; Rollett, A.D. Cube Texture in Hot-Rolled Aluminum Alloy 1050 (AA1050)-Nucleation and Growth Behavior. Acta Mater. 2008, 56, 3098–3108. [Google Scholar] [CrossRef]
  18. Rollett, A.D.; Wagner, F.; Allain-Bonasso, N.; Field, D.P.; Lebensohne, R.A. Comparison of Gradients in Orientation and Stress between Experiment and Simulation. In Materials Science Forum; Trans Tech Publications Ltd.: Wollerau, Switzerland, 2012; Volume 702–703. [Google Scholar]
  19. Traka, K.; Sedighiani, K.; Bos, C.; Galan Lopez, J.; Angenendt, K.; Raabe, D.; Sietsma, J. Topological Aspects Responsible for Recrystallization Evolution in an IF-Steel Sheet—Investigation with Cellular-Automaton Simulations. Comput. Mater. Sci. 2021, 198, 110643. [Google Scholar] [CrossRef]
  20. Traka, K.; Hernández, E.S.; Nguyen-Minh, T.; Sedighiani, K.; Sietsma, J.; Kestens, L.A.I. Prediction of Different Recrystallisation Textures under a Single Unified Physics-Based Model Description. Comput. Mater. Sci. 2025, 246, 113425. [Google Scholar] [CrossRef]
  21. Urabe, T.; Jonas, J.J. Modeling Texture Change during the Recrystallization of an IF Steel. ISIJ Int. 1994, 34, 435–442. [Google Scholar] [CrossRef]
  22. De Siqueira, R.P.; Sandim, H.R.Z.; Raabe, D. Particle Stimulated Nucleation in Coarse-Grained Ferritic Stainless Steel. Metall. Mater. Trans. A Phys. Metall. Mater. Sci. 2013, 44, 469–478. [Google Scholar] [CrossRef]
  23. Beck, P.A.; Hu, H. Recrystallization, Grain Growth and Textures; American Society for Metals: Metals Park, OH, USA, 1966; pp. 393–433. [Google Scholar]
  24. Doherty, R.D.; Hughes, D.A.; Humphreys, F.J.; Jonas, J.J.; Juul Jensen, D.; Kassner, M.E.; King, W.E.; McNelley, T.R.; McQueen, H.J.; Rollett, A.D. Current Issues in Recrystallization: A Review. Mater. Sci. Eng. A 1997, 238, 219–274. [Google Scholar] [CrossRef]
  25. Sepúlveda Hernández, E.; Nguyen-Minh, T.; Traka, K.; Castro Cerda, F.; Kestens, L.A.I. Orientation Dependence of Dynamic Compared to Static Recovery in Interstitial Free Steel. Scr. Mater. 2024, 249, 116151. [Google Scholar] [CrossRef]
  26. Gilbert, M.R.; Queyreau, S.; Marian, J. Stress and Temperature Dependence of Screw Dislocation Mobility in α-Fe by Molecular Dynamics. Phys. Rev. B Condens. Matter. Mater. Phys. 2011, 84, 174103. [Google Scholar] [CrossRef]
  27. Rios, P.R.; Siciliano, F.; Sandim, H.R.Z.; Plaut, R.L.; Padilha, A.F. Nucleation and Growth during Recrystallization. Mater. Res. 2005, 8, 225–238. [Google Scholar] [CrossRef]
  28. Furu, T.; Ørsund, R.; Nes, E. Subgrain Growth in Heavily Deformed Aluminium-Experimental Investigation and Modelling Treatment. Acta Metall. Mater. 1995, 43, 2209–2232. [Google Scholar] [CrossRef]
  29. Castro Cerda, F.M.; Kestens, L.A.I.; Monsalve, A.; Petrov, R.H. The Effect of Ultrafast Heating in Cold-Rolled Low Carbon Steel: Recrystallization and Texture Evolution. Metals 2016, 6, 288. [Google Scholar] [CrossRef]
  30. Castro Cerda, F.M.; Kestens, L.A.I.; Petrov, R.H. “Flash” Annealing in a Cold-Rolled Low Carbon Steel Alloyed with Cr, Mn, Mo, and Nb: Part II—Anisothermal Recrystallization and Transformation Textures. Steel Res. Int. 2019, 90, 1800277. [Google Scholar] [CrossRef]
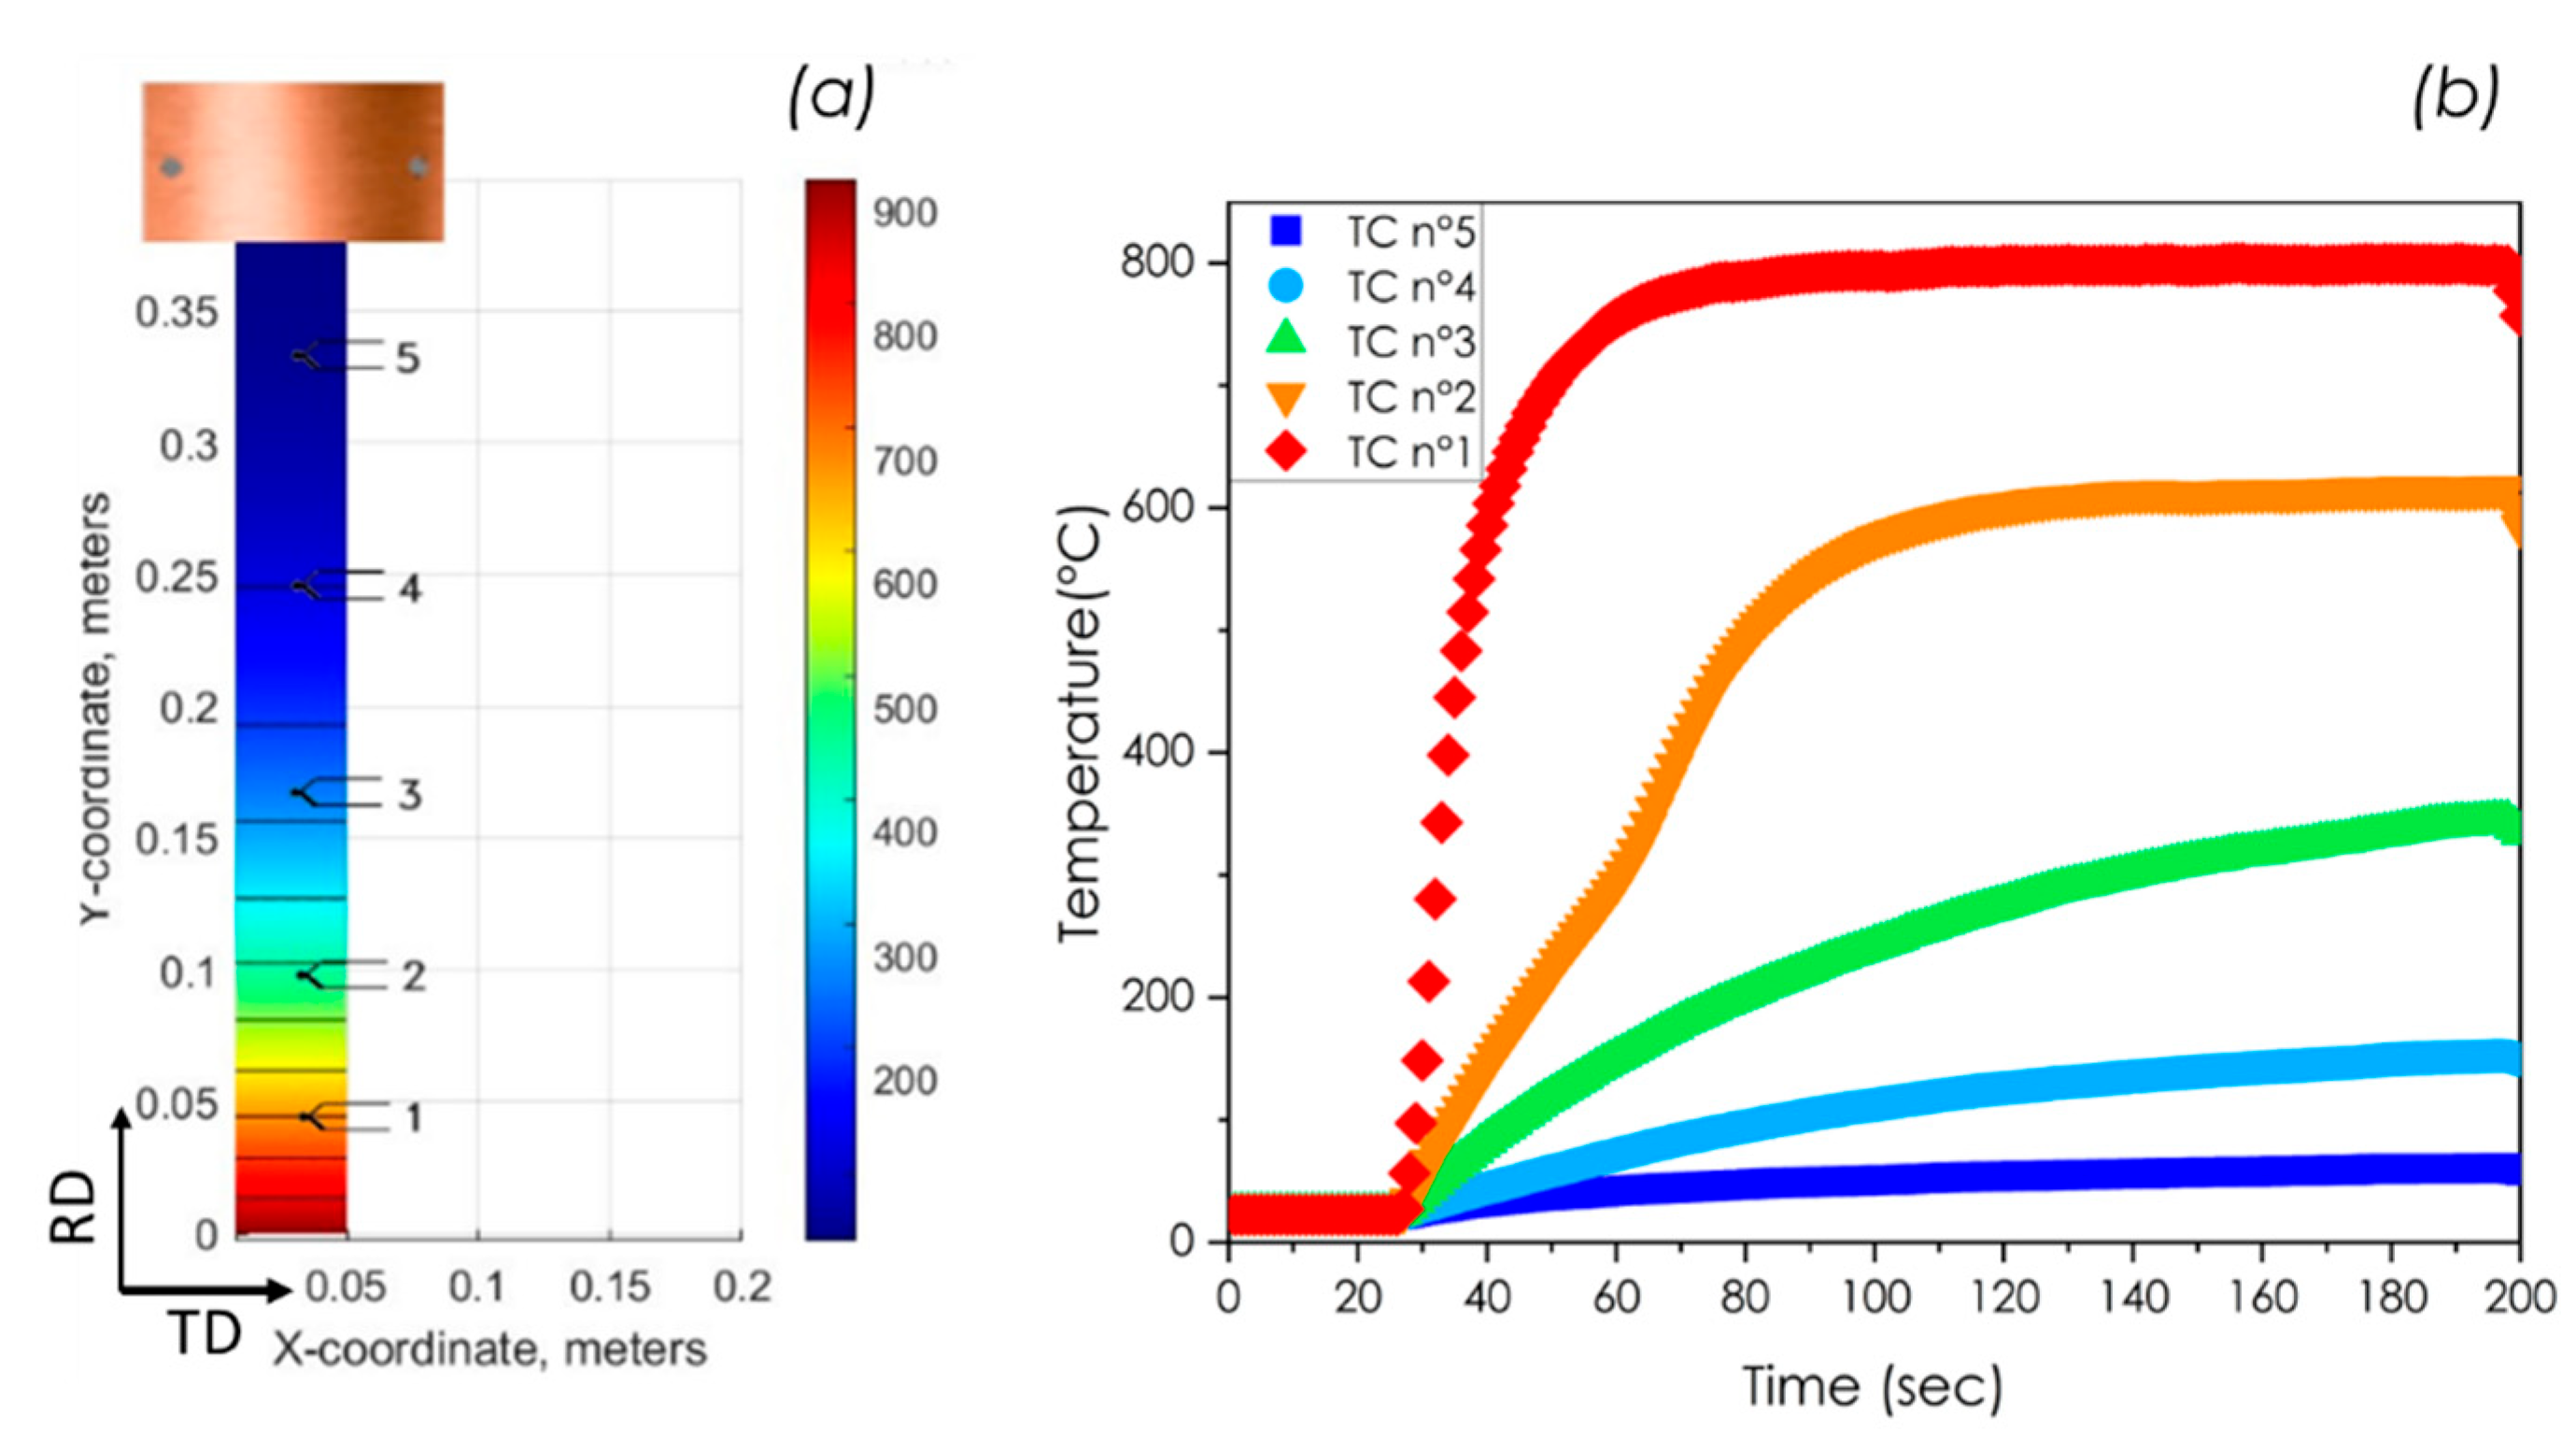
Figure 1. (a) Schematic representation of the annealing experiment on an IF steel strip, whereby one end was submerged in a salt bath furnace at 900 °C and the other end clamped in a solid cupper block. The temperature distribution was measured with 5 different thermo-couples (TC) welded to the sample (b) Temperature profiles as recorded by the TCs.
Metals 15 00939 g001
Figure 2. (ad) EBSD scans colour-coded according to the Inverse Pole Figure key in the upper right corner and (eh) φ2 = 45° sections of the Orientation Distribution Function (ODF) for Interstitial Free (IF) steel after cold rolling to different levels of thickness reduction: (a) and (e) 75%, (b) and (f) 80%, (c) and (g) 85%, and (d) and (h) 90%.
Metals 15 00939 g002
Figure 3. (a) Frequency distribution of the misorientation gradient as a function of the % cold reduction percentage. (b) Accumulative frequency distribution of the misorientation gradient for identical reduction percentages.
Metals 15 00939 g003
Figure 4. Grain Orientation Spread (GOS) maps and φ2 = 45° sections of the Orientation Distribution Function (ODF) for Interstitial Free (IF) steel subjected to 80% reduction by cold rolling followed by continuous annealing. The GOS maps are shown for samples annealed at four different peak temperatures: (a) 60 °C, (b) 145 °C, (c) 600 °C, and (d) 800 °C. Correspondingly, the φ2 = 45° sections of the ODF for these temperatures are depicted in (eh).
Metals 15 00939 g004
Figure 5. Mean misorientation gradient observed in different peak temperatures observed in the present experiment under consideration. The little white dash represents the average misorientation gradient, and the vertical thick black line exhibits the standard deviation.
Metals 15 00939 g005
Figure 6. (a,b) Conventional EBSD scans colour-coded according to the ND-IPF legend and (c,d) Grain Orientation Spread (GOS) maps of 80% cold-rolled IF steel exposed to a temperature gradient from 600 °C to 630 °C. (e,f) ND-IPF colour-coded EBSD map, only exhibiting the recrystallised grains. (g,h) ND-IPF colour-coded EBSD map, only exhibiting the non-recrystallised grains. All maps show the evolution over a distance of ~6 mm from the end with the lowest temperature (left) to the end with the highest temperature (right).
Metals 15 00939 g006
Figure 7. Variation in the misorientation gradient of the deformed/recovered matrix for a col rolled steel reduced to 80%: (a) average misorientation gradient and standard deviation across different distances/temperatures for deformed matrix grains that are not yet recrystallised, and (b) non-recrystallised fraction (NRF) versus average misorientation gradient (expressed as a fraction of the maximum value), including the fitted curve and R2 value shown.
Metals 15 00939 g007
Figure 8. φ2 = 45° sections of the Orientation Distribution Function (ODF) for Interstitial Free (IF) steel after 80% cold rolling and continuous annealing at a peak temperature between 620 °C and 630 °C, showing (a) the non-recrystallised fraction and (b) the recrystallised fraction.
Metals 15 00939 g008
Figure 9. φ2 = 45° sections of the Orientation Distribution Function (ODF) for Interstitial Free (IF) steel after cold rolling and continuous annealing at a peak temperature between 800 °C, showing: (a) fully recrystallised microstructure after 75% thickness reduction, and (b) the fully recrystallised microstructure after 90% thickness reduction.
Metals 15 00939 g009
Table 1. Chemical composition of Interstitial Free steel.
CMnAlNTi
0.0020.0950.050.0020.045
Disclaimer/Publisher’s Note: The statements, opinions and data contained in all publications are solely those of the individual author(s) and contributor(s) and not of MDPI and/or the editor(s). MDPI and/or the editor(s) disclaim responsibility for any injury to people or property resulting from any ideas, methods, instructions or products referred to in the content.