Abstract
The role of notch geometry and stress levels on fatigue crack initiation and small crack propagation behavior in the FGH96 superalloy was investigated using groove and bolt hole simulated specimens at 500 °C. The findings indicate that the fatigue crack initiation mechanisms and the number of cracks are significantly affected by stress levels. The fatigue crack initiation life and its contribution to the total fatigue lives were analyzed for both specimen types. Notch geometry was found to have a more pronounced effect on crack propagation life than on initiation life under high applied stress. The smaller notch root radius could accelerate the occurrence of crack coalescence, thereby shortening the propagation life. These results are valuable for optimizing the fatigue damage tolerance design of FGH96 turbine discs.
1. Introduction
Powder metallurgy (P/M) superalloys have gained significant attention as advanced materials for aero-engine applications in recent years [1]. Among these, the FGH96 alloy stands out as a high-performance, nickel-based P/M superalloy commonly used in turbine discs for advanced aero-engines [2,3]. However, inherent defects such as nonmetallic inclusions and pores are often present in FGH96, posing a risk of catastrophic component failure [4,5]. To address these challenges, the damage tolerance design concept has been developed, with a focus on fatigue damage tolerance for nickel-based P/M turbine discs. Understanding the mechanisms of small fatigue crack initiation and early propagation is essential for improving the reliability of these components, offering significant value for engineering applications.
Turbine discs often feature geometrical discontinuities, such as grooves and bolt holes, which create local stress concentrations. Under cyclic loading, these high-stress zones accelerate crack initiation and significantly impact the fatigue life of the turbine disc [6]. The notch geometry and applied stress further influence the size of these stress zones and the overall fatigue damage process [7]. Research indicates that in nickel-based alloys, crack initiation and small crack propagation account for 50% to 80% of the total fatigue life. Under the same stress intensity factor range (ΔK), the propagation rate of small cracks is higher than that of long cracks [8,9]. Relying on traditional fatigue life design laws for long cracks to predict the behavior of small fatigue cracks introduces significant risks. Therefore, understanding the initiation and propagation of small fatigue cracks in FGH96 under realistic stress conditions is crucial for improving the life design and safety of turbine discs.
In recent years, several studies have been conducted on the characteristics of the small fatigue crack propagation of nickel-based superalloy. Connolley et al. [10] employed an acetate replica method to investigate the initiation, propagation, and coalescence of fatigue cracks in notched Inconel 718 specimens at 600 °C. Their findings revealed that the small cracks growth remained nearly stable across a broad range of crack lengths before transitioning to rapid growth. Similarly, Deng et al. [11,12] employed a RepliSet-based replication technique to reveal the influence of local microstructure on the fatigue crack initiation and small crack growth mechanisms in GH4169, obtaining comparable results. In order to more easily record the fatigue crack growth in the early stage, researchers have employed techniques such as electron discharge machining [13], focused ion beam [14], or lasers [15,16,17] to create rounded rectangular surface crack initiators. However, these pre-cracking methods cannot fully capture the impact of crack initiation mechanisms on small crack propagation. Moreover, many studies on naturally initiated small crack growth rely on semi-circular or U-shaped single-sided notched samples, which differ from the complex notch geometries found in turbine discs. To address these limitations, it is essential to use simulated specimens that mimic critical turbine disc geometries. This approach allows for a more accurate analysis of the effects of notch geometry on small fatigue crack initiation and early propagation behavior, providing insights directly applicable to turbine disc designs.
This study aims to quantitatively evaluate the influence of notch geometry and stress levels on fatigue crack initiation and small crack propagation behavior in the FGH96 P/M superalloy through naturally initiated small crack growth tests conducted at 500 °C. Additionally, the influence of notch geometry on fatigue crack initiation life and the corresponding proportions are revealed.
2. Materials and Methods
2.1. Materials
The experimental material was the P/M nickel-based superalloy FGH96, which is used for turbine discs in aircraft engines. Its chemical composition is provided in Table 1. The microstructure of FGH96 is composed of a face-centered cubic γ matrix and the strengthening precipitated phases of secondary γ’ and tertiary γ’ [18]. Electron backscatter diffraction (EBSD) was employed to quantitatively characterize the γ grains. As shown in Figure 1, the average grain size, excluding twin, is approximately 21 μm, and annealing twins are prevalent in the microstructure. The 0.2% offset yield strength and ultimate tensile strength of FGH96 superalloy at 500 °C are 1140 MPa and 1460 MPa, respectively.

Table 1.
Chemical composition of FGH96 P/M superalloy [ω/%].
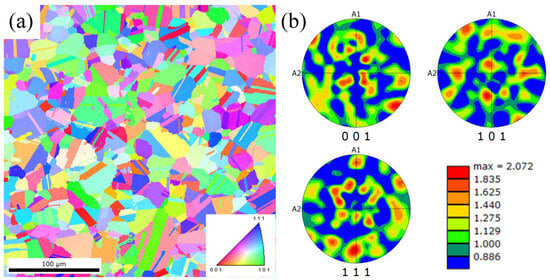
Figure 1.
(a) Inverse pole figure map of γ grain in FGH96 superalloy and (b) corresponding pole figures.
2.2. Experimental Procedure
Two types of single-edge notch tensile (SENT) specimens, designed to simulate critical turbine disc locations in aircraft engines, groove and bolt hole, were used to study fatigue crack initiation and small crack propagation behavior under complex stress states and high temperatures. The geometry and dimensions of the specimens are illustrated in Figure 2. All fatigue specimens were machined from the same disc in a specific orientation to ensure consistency. To achieve a controlled surface finish, the notched surfaces were carefully polished. This process involved sequential use of finer polishing papers, followed by a wool polishing wheel, resulting in a smooth surface suitable for fatigue testing.
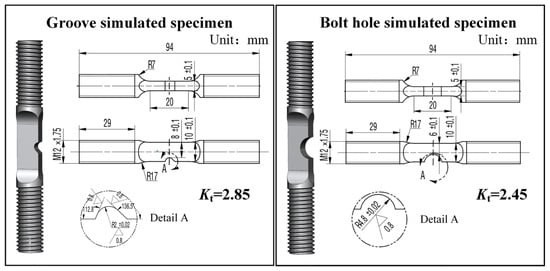
Figure 2.
Geometric dimension of two simulated specimens and the corresponding stress concentration factors (Kt).
Fatigue tests were performed at 500 °C, using the stress-controlled triangle-wave loading mode, with a frequency of 10 Hz and a stress ratio of 0.05, on an Instron 8801 servo-hydraulic testing machine (Instron, Boston, MA, USA). The heating was performed using a resistive furnace, which kept the temperature in the gauge section within a ±3 °C range. To evaluate the influence of stress levels on small crack growth behavior, three maximum stress values at the notch, ranging from 480 MPa to 700 MPa, were selected. The regular interruption of the fatigue tests and the replica method were used to quantify fatigue crack growth. After high-temperature fatigue loading, specimens were cooled to ambient temperature, and replicas were taken from the notch root under a tensile load equivalent to 80% of the maximum applied stress. Detailed procedures for using RepliSet during crack growth tests are documented in prior studies [19,20,21]. The number of cycles per intervals varied according to the test condition and the expected cyclic life to make sure that about 10–20 replicas were available for each fatigue test. Surface replicas were examined and measured using optical microscopy (OM) (ZEISS, Jena, Germany). The fatigue crack growth rate was determined using a two-point secant method for replicas, recorded before the onset of crack coalescence. After the fatigue test, fracture surfaces were analyzed using a Hitachi S-3400 N scanning electron microscope (SEM) (Hitachi, Tokyo, Japan). Additionally, EBSD maps were processed and analyzed using Channel 5 software from Oxford-HKL to further investigate microstructural characteristics.
3. Results
3.1. Fatigue Life
Figure 3 and Table 2 display the number of cycles to failure for the two simulated specimens under different stress levels. A comparison between uninterrupted and replication tests reveals that the replication process slightly reduced the fatigue lifetime, particularly at the maximum nominal stress of 700 MPa. One possible explanation is that the heating and cooling cycles involved in the replication process introduce additional cyclic thermal stresses in the specimens [22]. Another contributing factor could be the prolonged exposure to high-temperature oxidation, which further diminished fatigue life. This effect was especially significant for specimens with inherently shorter fatigue lifetimes.
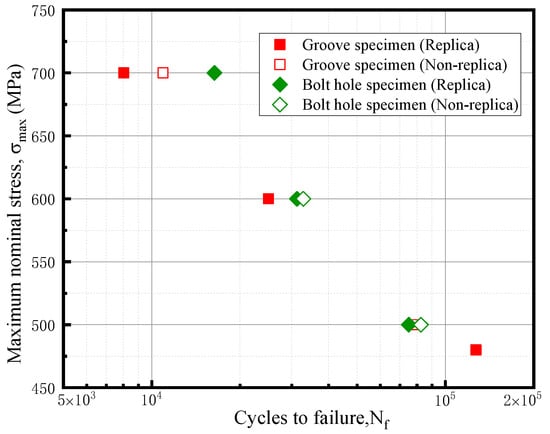
Figure 3.
Comparison of fatigue lives for the simulated specimens at interrupted and uninterrupted tests.
Table 2.
Number of fatigue cycles to failure of two simulated specimens.
For the fatigue lives of the two simulated specimens, the bolt hole simulated specimens exhibited a longer fatigue lifetime at a stress level of 700 MPa. However, when the stress was reduced to 500 MPa, there was no obvious difference in fatigue lifetime between the two specimen types. This outcome may be attributed to variations in fatigue crack initiation and propagation behavior influenced by notch geometry, which will be analyzed in detail in subsequent sections.
3.2. Crack Initiation in Simulated Specimens
The crack initiation behavior in the simulated specimens was analyzed by examining the fatigue fracture surfaces and surface replicas at the initial stage of fatigue testing. Multi-site crack initiation was consistently observed at the notch root in all tests. Figure 4 presents representative fractographs of the fatigue failure initiation sites, revealing three types of crack initiation sites: surface slip bands, crystallographic facets, and inclusions. As shown in Figure 4a, large facets were observed on the fracture surface, with corresponding replicas indicating that cracks formed parallel to multiple slip bands, suggesting surface slip band initiation. This mechanism was primarily found in specimens subjected to a stress of 700 MPa. Figure 4b depicts a crystallographic facet-initiated crack from specimen B-3, where the initiation site was located in the sub-surface region. Figure 4c shows a fractograph from specimen G-5, demonstrating crack initiation from a polygonal inclusion approximately 40 μm in size and located 20 μm below the surface. Energy dispersive spectrometer (EDS) analysis identified the inclusion as silicon oxide. Figure 4d shows additional cases of inclusion-initiated failure, where loosely packed inclusions near the surface facilitated crack formation. These findings indicate a trend where crack initiation sites shift from the surface to the interior as stress levels decrease. This result was similar to some previous studies [5,23].
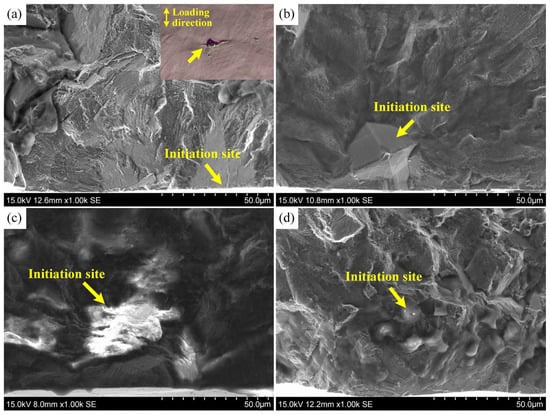
Figure 4.
SEM fractographs of simulated specimens tested at 500 °C displaying the different types of initiation sites: (a) surface slip band initiation (Specimen B-1); (b) crystallographic facet initiation (Specimen B-3); (c,d) inclusion initiation (Specimen G-5).
To investigate the multiple crack initiation behavior, the evolution of the number of cracks with different initiation modes was studied, using surface replicas and corresponding fracture analysis, as shown in Figure 5. A common observation was that the total number of cracks increased initially and then decreased as the fatigue life progressed. At a high stress level (Figure 5a), with a maximum stress of 600 MPa, numerous cracks initiated in slip bands were found to occur in the later stages. Over time, some of these cracks coalesced into a dominant crack, leading to a reduction in the total number of cracks. Notably, the cycle ratio at which the groove simulated specimen reached its peak crack number was lower than that of the bolt hole simulated specimen, indicating earlier crack coalescence in the groove specimen under the same stress conditions. For tests conducted at lower stress levels (Figure 5b), the total number of cracks at the notch root decreased significantly, especially cracks induced by slip bands. Additionally, no significant difference was observed in the cycle ratio at the peak crack number between the two simulated specimens under low-stress conditions.

Figure 5.
Quantification of cracks number observed in notch root for two simulated specimens at different stress levels: (a) specimen G-3 and B-3, (b) specimen G-5 and B-5.
3.3. Small Crack Growth Behavior
Figure 6 and Figure 7 illustrate representative fracture surfaces and corresponding surface replicas as a function of cycles for specimens with cracks initiated in inclusions and crystallographic facets. The fracture surface of specimen G-5 (Figure 6) highlights three distinct regions characterized by different crack growth behaviors: microstructurally small crack (MSC), physically small crack (PSC), and long crack (LC) growth regions (Figure 6a). Near the initiation site (Figure 4c), extension edges were visible. The size of the long axis of the equivalent ellipse of the MSC growth region is approximately 180 μm (Figure 6b). No fatigue striations were observed in this region. As the crack propagated into the PSC region, the fracture surface displayed a river pattern aligned with the crack propagation direction, along with visible fatigue striations (Figure 6c). In the LC region, the fracture surface was dominated by cleavage-like fracture facets and slip steps. Surface replicas taken at various cycle intervals provided additional insights into small crack growth behavior. In the MSC region, the crack initiated in the inclusion exhibited a non-planar geometry (Figure 6d). As the crack length increased, its growth path transitioned to a zig-zag trajectory, predominantly oriented perpendicular to the loading direction.
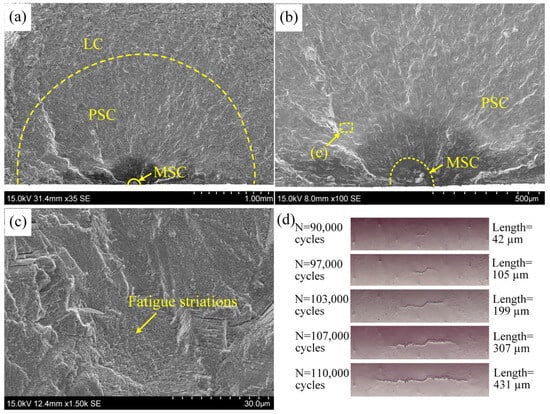
Figure 6.
Representative fracture surface and the corresponding surface replicas for the specimen G-5. Test conducted with σmax = 480 MPa, R = 0.05. (a) overall view of the fracture surface in the early stage, (b) crack initiation region, (c) crack propagation region, (d) surface replicas under different cycles.
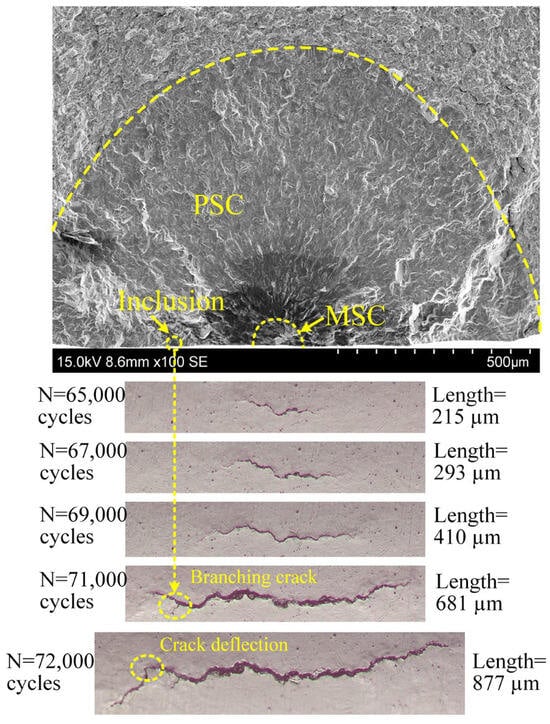
Figure 7.
Representative fracture surface and the corresponding surface replicas for the specimen B-5. Test conducted with σmax = 500 MPa, R = 0.05.
Figure 7 presents the fracture surface and surface replications of specimen B-5 with a crystallographic facet-initiated crack, which displays the same characteristics of small crack growth behavior. Additionally, crack branching and large-angle deflection were observed. The corresponding fracture morphology indicates local crack branching was induced by a small inclusion. The deflection may be relevant to the interaction and coalescence between cracks.
In order to further investigate the interaction and coalescence of small cracks, the evolution of the crack morphology was observed using surface replicas of specimen B-1, as illustrated in Figure 8. Numerous small cracks were observed initiating at the notch root and propagating independently. When these cracks formed near the primary crack (C1) or along its extension path (e.g., C2, C3, C4, and C5), they influenced the propagation of the primary crack by altering its path through coalescence (Figure 8c,d). In contrast, cracks located farther from the primary crack, such as C6, showed no significant impact on its propagation behavior. Moreover, the absence of the dominant crack may inhibit the growth of these cracks or even make them become non-propagating [17,24].
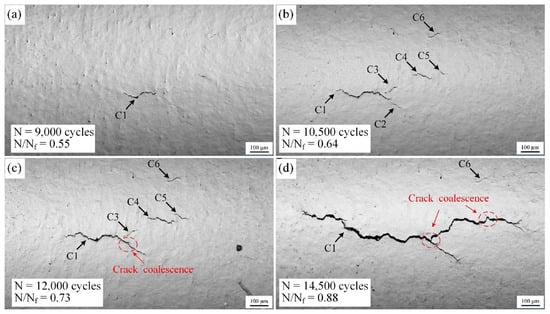
Figure 8.
The morphology evolution of multiple cracks observed at surface replicas for the specimen B-1. Test conducted with σmax = 700 MPa, R = 0.05. (a) N = 9,000 cycles, (b) N = 10,500 cycles, (c) N = 12,000 cycles, (d) N = 14,500 cycles.
Figure 9 illustrates the fatigue crack growth rates (da/dN) as a function of crack length (a) for the primary propagating cracks. The crack growth rate is calculated using the secant method:
where Δa and ΔN are the crack growth increment and cyclic interval, respectively, and ai is the surface crack length at Ni cycles. The results indicate noticeable fluctuations in crack growth rates during the early stages of fatigue crack growth. When highly fluctuating data points are excluded, the growth rates of small cracks remain relatively constant for crack lengths below 150 μm. Beyond this length, the growth rate accelerates as the crack length grows. These phenomena are commonly observed for fatigue cracks initiating from notches [10,11,12,25]. Furthermore, no significant differences in fatigue crack growth rates were observed between the bolt hole and groove simulated specimens.
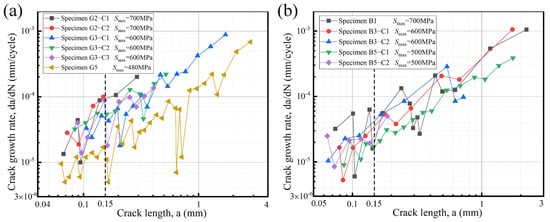
Figure 9.
Variations of crack lengths along the number of cycles for two simulated specimens at different stress levels. (a) groove simulated specimens, (b) bolt hole specimens.
4. Discussion
The two simulated specimens exhibited significantly different fatigue lives at a σmax of 700 MPa, despite having similar stress concentration factors (Kt). However, when the stress was reduced to 500 MPa, the fatigue life differences between the two specimen types became negligible, as shown in Figure 3. This suggests that notch geometry plays a critical role in determining fatigue life, which is related to the crack initiation location and propagation behavior.
To gain a deeper understanding of the fatigue failure process occurring, the crack initiation life of the two simulated specimens at different stress levels was analyzed, with their proportions of total life presented in Table 3. The results show that the ratio of the initiation period (Nini/Nf) increased with a decrease in σmax, where Nini represents the number of cycles at which the crack was first observed, and Nf is the total number of cycles until failure. At the σmax below 600 MPa, Nini/Nf ranged from approximately 60% to 75% for both specimen types. At higher stress levels (700 MPa), the groove simulated specimens exhibited an Nini/Nf of over 36.7%, significantly lower than the bolt hole simulated specimens, which showed a value above 56.1%. Interestingly, the values of Nini and the lengths of the initial cracks were similar for both specimen types. Therefore, the reduced fatigue life in the groove simulated specimens can be attributed to a substantial decrease in the crack propagation life.
Table 3.
Crack initiation life and its proportion of total life of two simulated specimens.
The single fatigue crack growth rates do not differ significantly between the two types of simulated specimens, as shown in Figure 9. This suggests that the interaction and coalescence of small cracks at the notch root are likely the primary factors contributing to the reduced fatigue crack propagation life. The initial-stage propagation of a small crack is a process of the competition among different multiple cracks. Most of these cracks become non-propagating, while a few coalesce to form a dominant crack along the notch root, leading to specimen failure [24]. At high stress levels, the propagation of the dominant crack is accelerated by crack coalescence, which depends on the number and concentrative degree of small cracks. In this study, crack coalescence occurred earlier in the groove simulated specimens with a notch root radius of 2 mm, compared to the bolt hole simulated specimens with a notch root radius of 4.8 mm (Figure 5a). The smaller notch root radius appears to concentrate crack initiation, thereby accelerating crack coalescence under high stress. Consequently, the fatigue crack propagation life of groove simulated specimens is shorter than that of bolt hole simulated specimens at a stress of 700 MPa, despite their similar stress concentration factors. In contrast, at lower stress levels, the reduced number of cracks diminishes the impact of crack coalescence on the fatigue crack propagation life. Consequently, the fatigue lives of groove and bolt hole simulated specimens are nearly identical at a stress of 500 MPa.
5. Conclusions
In this work, the small fatigue crack initiation and propagation behavior characterizing groove and bolt hole simulated specimens of FGH96 superalloy at 500 °C was investigated. The main conclusions of the study are summarized as follows:
- (1)
- Fatigue cracks in both groove and bolt hole simulated specimens initiated at the notch root, exhibiting a multi-site crack initiation mode.
- (2)
- Stress level had a greater influence on fatigue crack initiation than notch geometry. At high applied stress, the surface crack initiation induced by a surface slip band is dominant. At lower stresses, the fatal cracks predominantly initiated in internal regions near crystallographic facets or nonmetallic inclusions.
- (3)
- The ratio of the incubation period ranged from approximately 35% to 75% and increased with σmax in both types of simulated specimen tests at 500 °C.
- (4)
- The influence of the notch geometry on the fatigue crack propagation life is larger than Nini, particularly at high applied stresses. A smaller notch root radius could accelerate the occurrence of crack coalescence and consequently reduce the fatigue crack propagation life.
Author Contributions
Conceptualization, Z.Z. and X.H.; methodology, Z.Z.; software, Z.Z. and X.H.; validation, Z.Z., X.H. and Z.G.; formal analysis, Z.Z.; investigation, Z.Z. and Z.G.; resources, X.H.; data curation, Z.Z.; writing—original draft preparation, Z.Z.; writing—review and editing, Z.Z.; visualization, Z.Z.; supervision, X.H.; project administration, Z.Z. and X.H.; funding acquisition, Z.Z. and X.H. All authors have read and agreed to the published version of the manuscript.
Funding
This research was funded by the Natural Science Foundation of the Jiangsu Higher Education Institutions of China, grant number 23KJB460026.
Data Availability Statement
The original contributions presented in this study are included in the article. Further inquiries can be directed to the corresponding author.
Conflicts of Interest
Author Zhiwei Guo was employed by the company AECC Shenyang Engine Research Institute. The remaining authors declare that the research was conducted in the absence of any commercial or financial relationships that could be construed as a potential conflict of interest.
References
- Pollock, T.M.; Tin, S. Nickel-based superalloys for advanced turbine engines: Chemistry, microstructure and properties. J. Propuls. Power 2006, 22, 361–374. [Google Scholar] [CrossRef]
- Hu, D.Y.; Wang, T.; Ma, Q.H.; Liu, X.; Shang, L.H.; Li, D.; Pan, J.C.; Wang, R.Q. Effect of inclusions on low cycle fatigue lifetime in a powder metallurgy nickel-based superalloy FGH96. Int. J. Fatigue 2019, 118, 237–248. [Google Scholar] [CrossRef]
- Liu, L.; Gao, H.S.; Wang, J.D.; Zhang, C.J.; Wen, Z.X.; Yue, Z.F. Combined high and low cycle fatigue analysis of FGH96 alloy under high temperature conditions. Mater. Today Commun. 2024, 38, 108053. [Google Scholar] [CrossRef]
- Chen, S.Y.; Wei, D.S.; Wang, J.L.; Wang, Y.R.; Jiang, X.H. Experimental and modeling investigation of the creep-fatigue interactive deformation behavior of PM super alloy FGH96 at evaluated temperature. Mater. Sci. Eng. A 2019, 749, 106–117. [Google Scholar] [CrossRef]
- Miao, G.L.; Yang, X.G.; Shi, D.Q. Competing fatigue failure behaviors of Ni-based superalloy FGH96 at elevated temperature. Mater. Sci. Eng. A 2016, 668, 66–72. [Google Scholar] [CrossRef]
- Owolabi, G.; Okeyoyin, O.; Bamiduro, O.; Olasumboye, A.; Whitworth, H. The effects of notch size and material microstructure on the notch sensitivity factor for notched components. Eng. Fract. Mech. 2015, 145, 181–196. [Google Scholar] [CrossRef]
- Li, Z.L.; He, Y.S.; Xu, G.Q.; Shi, D.Q.; Yang, X.G. A fatigue life estimation approach considering the effect of geometry and stress sensitivity. Theor. Appl. Fract. Mech. 2021, 112, 102915. [Google Scholar] [CrossRef]
- Zhu, X.M.; Gong, C.Y.; Jia, Y.F.; Wang, R.Z.; Zhang, C.C.; Fu, Y.; Tu, S.T.; Zhang, X.C. Influence of grain size on the small fatigue crack initiation and propagation behaviors of a nickel-based superalloy at 650 °C. J. Mater. Sci. Technol. 2019, 35, 1607–1617. [Google Scholar] [CrossRef]
- Qin, C.H.; Zhang, X.C.; Ye, S.; Tu, S.T. Grain size effect on multi-scale fatigue crack growth mechanism of Nickel-based alloy GH4169. Eng. Fract. Mech. 2015, 142, 140–153. [Google Scholar] [CrossRef]
- Connolley, T.; Reed, P.; Starink, J.M. Short crack initiation and growth at 600 °C in notched specimens of Inconel 718. Mater. Sci. Eng. A 2003, 340, 139–154. [Google Scholar] [CrossRef]
- Deng, G.J.; Tu, S.T.; Zhang, X.C.; Wang, Q.Q.; Qin, C.H. Grain size effect on the small fatigue crack initiation and growth mechanisms of nickel-based superalloy GH4169. Eng. Fract. Mech. 2015, 134, 433–450. [Google Scholar] [CrossRef]
- Deng, G.J.; Tu, S.T.; Zhang, X.C.; Wang, J.; Zhang, C.C.; Qian, X.Y.; Wang, Y.N. Small fatigue crack initiation and growth mechanisms of nickel-based superalloy GH4169 at 650 °C in air. Eng. Fract. Mech. 2016, 153, 35–49. [Google Scholar] [CrossRef]
- Kevinsanny; Okazaki, S.; Takakuwa, O.; Ogawa, Y.; Okita, K.; Funakoshi, Y.; Yamabe, J.; Matsuoka, S.; Matsunaga, H. Effect of defects on the fatigue limit of Ni-based superalloy 718 with different grain sizes. Fatigue Fract. Eng. Mater. Struct. 2019, 19, 312–319. [Google Scholar] [CrossRef]
- Maenosono, A.; Koyama, M.; Tanaka, Y.; Rid, S.; Wang, Q.H. Crystallographic selection rule for the propagation mode of microstructurally small fatigue crack in a laminated Ti-6Al-4V alloy: Roles of basal and pyramidal slips. Int. J. Fatigue 2019, 128, 105200. [Google Scholar] [CrossRef]
- Motoyashiki, Y.; Brückner-Foit, A.; Englert, L.; Haag, L.; Wollenhaupt, M.; Baumert, T. Use of femtosecond laser technique for studying physically small cracks. Int. J. Fatigue 2006, 139, 561–568. [Google Scholar] [CrossRef]
- Wang, J.; Wang, R.Z.; Zhang, X.C.; Ye, Y.J.; Cui, Y.; Miura, H.; Tu, S.T. Multi-stage dwell fatigue crack growth behaviors in a nickel-based superalloy at elevated temperature. Eng. Fract. Mech. 2021, 253, 107859. [Google Scholar] [CrossRef]
- Yang, Q.Z.; Yang, X.G.; Huang, W.Q.; Shi, Y.; Shi, D.Q. Small fatigue crack propagation rate and behaviours in a powder metallurgy superalloy: Role of stress ratio and local microstructure. Int. J. Fatigue 2022, 160, 106861. [Google Scholar] [CrossRef]
- Liu, A.; Zhang, Y.T.; Wang, X.S.; Xu, W.; Zhang, Y.; He, Y.H. Evaluation of the influences of the stress ratio, temperatures, and local microstructure on small fatigue crack propagation behavior of the FGH96 superalloy. Int. J. Fatigue 2023, 171, 107573. [Google Scholar] [CrossRef]
- Newman, J.A.; Willard, S.A.; Smith, S.W.; Piascik, R.S. Replica-based crack inspection. Eng. Fract. Mech. 2009, 76, 898–910. [Google Scholar] [CrossRef]
- Jordon, J.B.; Bernard, J.D.; Newman, J.C. Quantifying microstructurally small fatigue crack growth in an aluminum alloy using a silicon-rubber replica method. Int. J. Fatigue 2012, 36, 206–210. [Google Scholar] [CrossRef]
- Zhu, L.; Wu, Z.R.; Hu, X.T.; Song, Y.D. Investigation of small fatigue crack initiation and growth behaviour of nickel base superalloy GH4169. Fatigue Fract. Eng. Mater. Struct. 2016, 39, 1150–1160. [Google Scholar] [CrossRef]
- Pang, H.T.; Reed, P.A.S. Microstructure effects on high temperature fatigue crack initiation and short crack growth in turbine disc nickelbase superalloy udimet 720Li. Mater. Sci. Eng. A 2007, 448, 67–79. [Google Scholar] [CrossRef]
- Stinville, J.C.; Martin, E.; Karadge, M.; Ismonov, S.; Soare, M.; Hanlon, T.; Sundaram, S.; Echlin, M.P.; Callahan, P.G.; Lenthe, W.C.; et al. Fatigue deformation in a polycrystalline nickel base superalloy at intermediate and high temperature: Competing failure modes. Acta Mater. 2018, 152, 16–33. [Google Scholar] [CrossRef]
- Wu, Z.; Sun, X. Multiple fatigue crack initiation, coalescence and growth in blunt notched specimens. Eng. Fract. Mech. 1998, 5, 353–359. [Google Scholar] [CrossRef]
- Yuan, S.H.; Wang, Y.R.; Wei, D.S. Experimental investigation on low cycle fatigue and fracture behavior of a notched Ni-based superalloy at elevated temperature. Fatigue Fract. Eng. Mater. Struct. 2014, 37, 1002–1012. [Google Scholar] [CrossRef]


Disclaimer/Publisher’s Note: The statements, opinions and data contained in all publications are solely those of the individual author(s) and contributor(s) and not of MDPI and/or the editor(s). MDPI and/or the editor(s) disclaim responsibility for any injury to people or property resulting from any ideas, methods, instructions or products referred to in the content. |
© 2025 by the authors. Licensee MDPI, Basel, Switzerland. This article is an open access article distributed under the terms and conditions of the Creative Commons Attribution (CC BY) license (https://creativecommons.org/licenses/by/4.0/).