Article

Constructal Design and Numerical Simulation Applied to Geometric Evaluation of Stiffened Steel Plates Subjected to Elasto-Plastic Buckling Under Biaxial Compressive Loading

by
Andrei Ferreira Lançanova
1,
Raí Lima Vieira
2,
Elizaldo Domingues dos Santos
1,2,
Luiz Alberto Oliveira Rocha
1,2,
Thiago da Silveira
2,
João Paulo Silva Lima
3,
Emanuel da Silva Diaz Estrada
1 and
Liércio André Isoldi
1,2,*
1
Graduate Program in Computational Modeling, Federal University of Rio Grande, Rio Grande 96201-900, RS, Brazil
2
Graduate Program in Ocean Engineering, Federal University of Rio Grande, Rio Grande 96201-900, RS, Brazil
3
Faculty of Science and Technology, Federal University of Goiás (UFG), Aparecida de Goiânia 74968-755, GO, Brazil
*
Author to whom correspondence should be addressed.
Metals 2025, 15(8), 879; https://doi.org/10.3390/met15080879 (registering DOI)
Submission received: 31 May 2025 / Revised: 15 July 2025 / Accepted: 4 August 2025 / Published: 6 August 2025

Abstract

Widely employed in diverse engineering applications, stiffened steel plates are often subjected to biaxial compressive loads. Under these conditions, buckling may occur, initially within the elastic range but potentially progressing into the elasto-plastic domain, which can lead to permanent deformations or structural collapse. To increase the ultimate buckling stress of plates, the implementation of longitudinal and transverse stiffeners is effective; however, this complexity makes analytical stress calculations challenging. As a result, numerical methods like the Finite Element Method (FEM) are attractive alternatives. In this study, the Constructal Design method and the Exhaustive Search technique were employed and associated with the FEM to optimize the geometric configuration of stiffened plates. A steel plate without stiffeners was considered, and 30% of its volume was redistributed into stiffeners, creating multiple configuration scenarios. The objective was to investigate how different arrangements and geometries of stiffeners affect the ultimate buckling stress under biaxial compressive loading. Among the configurations evaluated, the optimal design featured four longitudinal and two transverse stiffeners, with a height-to-thickness ratio of 4.80. This configuration significantly improved the performance, achieving an ultimate buckling stress 472% higher than the unstiffened reference plate. In contrast, the worst stiffened configuration led to a 57% reduction in performance, showing that not all stiffening strategies are beneficial. These results demonstrate that geometric optimization of stiffeners can significantly enhance the structural performance of steel plates under biaxial compression, even without increasing material usage. The approach also revealed that intermediate slenderness values lead to better stress distribution and delayed local buckling. Therefore, the methodology adopted in this work provides a practical and effective tool for the design of more efficient stiffened plates.

1. Introduction

Plates are two-dimensional structural components whose thickness is significantly smaller than their in-plane length and width dimensions [1,2]. They are commonly used in scenarios subjected to uniaxial, biaxial, and combined loadings [3]. When subjected to compressive loadings, they can suffer an undesirable instability phenomenon called buckling. Buckling phenomena can initially manifest as elastic buckling, where instability occurs in plates while the material remains within its elastic constitutive regime [4]. However, unlike slender columns, plates can resist loads even after elastic buckling has occurred [5]. This behavior can then evolve into elasto-plastic buckling, in which the applied load causes the material to exceed its elastic limit and enter the plastic deformation regime [4].
The buckling resistance of plates is directly proportional to their bending stiffness [6]. Therefore, implementing stiffeners is a common practice, as they increase the plate’s stiffness against buckling caused by in-plane compressive and shear loadings [7]. Under uniaxial longitudinal loading, longitudinal stiffeners support part of the applied load, while transverse stiffeners subdivide the plate into smaller sections. Under biaxial loading conditions, longitudinal and transverse stiffeners support the respective loading directions and further divide the plate into smaller panel areas. However, randomly adding stiffeners does not guarantee improved buckling resistance. Therefore, it is necessary to study and identify the optimal number, geometry, and arrangement of longitudinal and transverse stiffeners based on the boundary conditions and loading scenarios [8].
The Constructal Design method, combined with the Exhaustive Search technique, has been used to investigate the influence of the number and geometric configuration of longitudinal and/or transverse stiffeners on the mechanical behavior of stiffened plates. One can highlight studies regarding these structural components subjected to bending due to distributed lateral pressure [9,10,11], elasto-plastic buckling due to uniaxial compressive load [12,13], or elasto-plastic buckling due to distributed lateral pressure combined with biaxial compressive load [8]. In these analyses, the total steel volume of an unstiffened plate is kept constant, with a portion of this material being transformed into stiffeners. The mechanical behavior of various proposed stiffened plates is then evaluated [8,12,13].
Despite the many plate configurations required to determine the optimized geometry, numerical analysis has proven to be a helpful tool, especially for assessing ultimate buckling resistance compared to analytical methods [12], showing good accuracy and agreement with experimental results [14]. The Finite Element Method (FEM) is commonly used to investigate the buckling of stiffened plates due to its ability to capture buckling modes, as well as its efficiency and simplicity in analyzing and optimizing complex structures [15]. This method is particularly suitable for analyzing plates with stiffeners subjected to compressive loads and operating within the elasto-plastic buckling regime [16]. Ansys Mechanical APDL (MAPDL) software, based on the FEM, has been employed in studies to conduct buckling analysis of plates [8,12,17], using versions 2024R2, 12.1, and 17.1, respectively.
Numerous studies have investigated the buckling behavior of unstiffened plates [18,19,20] and stiffened plates [21,22,23,24,25,26,27,28,29,30,31,32,33,34,35,36,37,38,39,40] to better understand this instability behavior and identify ways to assess or improve the resistance of these structural components.
Piscopo [19] studied the buckling behavior of unstiffened rectangular plates under uniaxial and biaxial compression using analytical and numerical approaches with simply supported boundary conditions. The author adopted a two-variable refined plate theory from classical thin plate theory to account for bending and shear effects, proposing a new expression for the Euler buckling load and presenting buckling coefficient curves. The analytical results were verified through numerical simulations in ANSYS (version 12.1).
Hanif et al. [41] investigated the ultimate strength of steel stiffened plates under uniaxial compressive loading using nonlinear finite element analysis in ANSYS MAPDL. The authors evaluated the influence of several geometric parameters, including different maximum values of amplitudes and modes of initial imperfections (column-type, local, torsional, and combined), as well as plate and web slenderness. As a result, a simplified formula was proposed to predict the ultimate stress with reasonable accuracy, showing a maximum difference of 2.08% compared to the computational model.
Saad-Eldeen et al. [35] conducted experimental and numerical analyses using ANSYS to evaluate the structural capacity of corroded stiffened steel plates with multiple circular openings under uniaxial compression. The study investigated the effects of opening degree, number, and distribution of openings, initial imperfections, and material corrosion. Results showed that larger imperfection amplitudes and greater opening degrees significantly reduced load capacity, while material properties became less influential as the number of openings increased. Plates with more small openings performed better than those with fewer large ones, especially when openings were placed away from the central region.
Zhang et al. [42] synthesized a decade of experimental, analytical, and numerical research (from 2014 to 2023) in a comprehensive systematic review of stiffened composite plates’ elastic and elasto-plastic buckling behavior. The review encompassed over 200 studies, identifying limitations and opportunities for future research. The authors concluded that there is a need to develop more cost-effective experimental methods that better replicate real-world environmental and loading conditions to refine analytical methods to accurately predict the elastic and elasto-plastic behavior of more complex geometries, including three-dimensional effects and to integrate machine learning and artificial intelligence to enhance data interpretation, model validation, and the optimization of stiffened composite plate structures.
Wang et al. [43] presented a new method based on numerical buckling analysis to develop empirical formulas and design charts. This method estimates the maximum lateral pressure that stiffened panels can endure under combined loading, considering various loading conditions, stiffener configurations, and initial imperfections. The authors observed that stiffener location strongly influences ultimate strength and that including local buckling as an initial imperfection improves strength predictions.
Lima et al. [12] developed a computational model to assess the ultimate buckling stress and a Constructal Design model to evaluate the influence of stiffeners and their geometric characteristics on the performance of plates under uniaxial compression. Converting part of the plate volume into stiffeners led to increases in buckling stress of 7.38% and 88.50%, depending on the initial volume considered. Additionally, a variation of 481.24% was observed between the best and worst configurations in terms of ultimate buckling stress, emphasizing the importance of optimizing stiffener geometry. The optimal plate configuration for the second volume scenario featured two longitudinal and two transverse stiffeners.
Baumgardt et al. [44] verified and validated a model in ANSYS Mechanical APDL (2023R1) for predicting critical and ultimate buckling stresses in plates with and without stiffeners, including perforated cases and loading conditions. Maximum deviations were 4.83% and 5.40%, confirming model reliability.
Vieira et al. [8] combined the models by Lima et al. [12] and Baumgardt et al. [45] to analyze stiffened plates with flat stiffeners under elasto-plastic buckling, subjected to biaxial compression and constant lateral pressure P Z = 0.016 MPa. With 30% of the plate’s volume converted into stiffeners, the optimal configuration (five longitudinal and four transverse stiffeners) showed a 284% improvement in ultimate buckling stress. Increasing the height-to-thickness ratio favors local failure, while reducing it synchronizes displacement, decreasing stress concentration. Very low ratios caused premature stiffener buckling and global modes with lower strength.
Although substantial research has been conducted on elasto-plastic buckling and the role of stiffeners in determining the ultimate buckling strength of plates, the effects of plate configuration in relation to stiffeners and the optimization of stiffener geometry under biaxial loading still require further investigation. A more comprehensive understanding of these interactions is crucial for reevaluating the design of structural components subjected to this complex condition, aiming for enhanced structural performance and improved safety. Therefore, guided by the work of Lima et al. [12], the present study aims to apply the Constructal Design method and the exhaustive search technique in numerical analysis, using ANSYS MAPDL (version 2025R2) software, to investigate the phenomenon of elasto-plastic buckling in plates subjected to biaxial compressive loading. The objective is to understand how the plate configuration, the number of stiffeners, and their respective geometries influence ultimate buckling resistance performance indicators. The goal is to identify the optimized configuration of stiffened plates, demonstrating the best performance regarding ultimate buckling resistance under biaxial loading. To achieve this, 30% of the steel volume of an unstiffened plate is converted into flat longitudinal and transverse stiffeners. The number of longitudinal and transverse stiffeners and the ratio between their heights and thicknesses are defined as degrees of freedom. This approach enabled the generation to have various geometric configurations, maintaining the same total volume as the unstiffened reference plate. The ultimate buckling resistances of these configurations are evaluated, allowing for the identification of the highest-performing design for the investigated loading scenario.
Therefore, while most previous studies have addressed uniaxial loading conditions or considered limited stiffener configurations, this work advances the current state of the art by exploring a broader design space defined by variations in stiffener number, geometry, and distribution, while maintaining constant material volume. This study presents a detailed numerical investigation focused on optimizing the geometric configuration of stiffened plates under biaxial compression, aiming to improve buckling performance without increasing material usage. The findings provide new insights into the relationship between stiffener slenderness and structural behavior, leading to the identification of an optimal configuration that enhances the ultimate buckling stress by 472% compared to the unstiffened reference plate.

2. Materials and Methods

2.1. Computational Modeling of Unstiffened and Stiffened Plates

The thin steel unstiffened and stiffened plates are modeled considering the same parameters as Lima et al. [12].
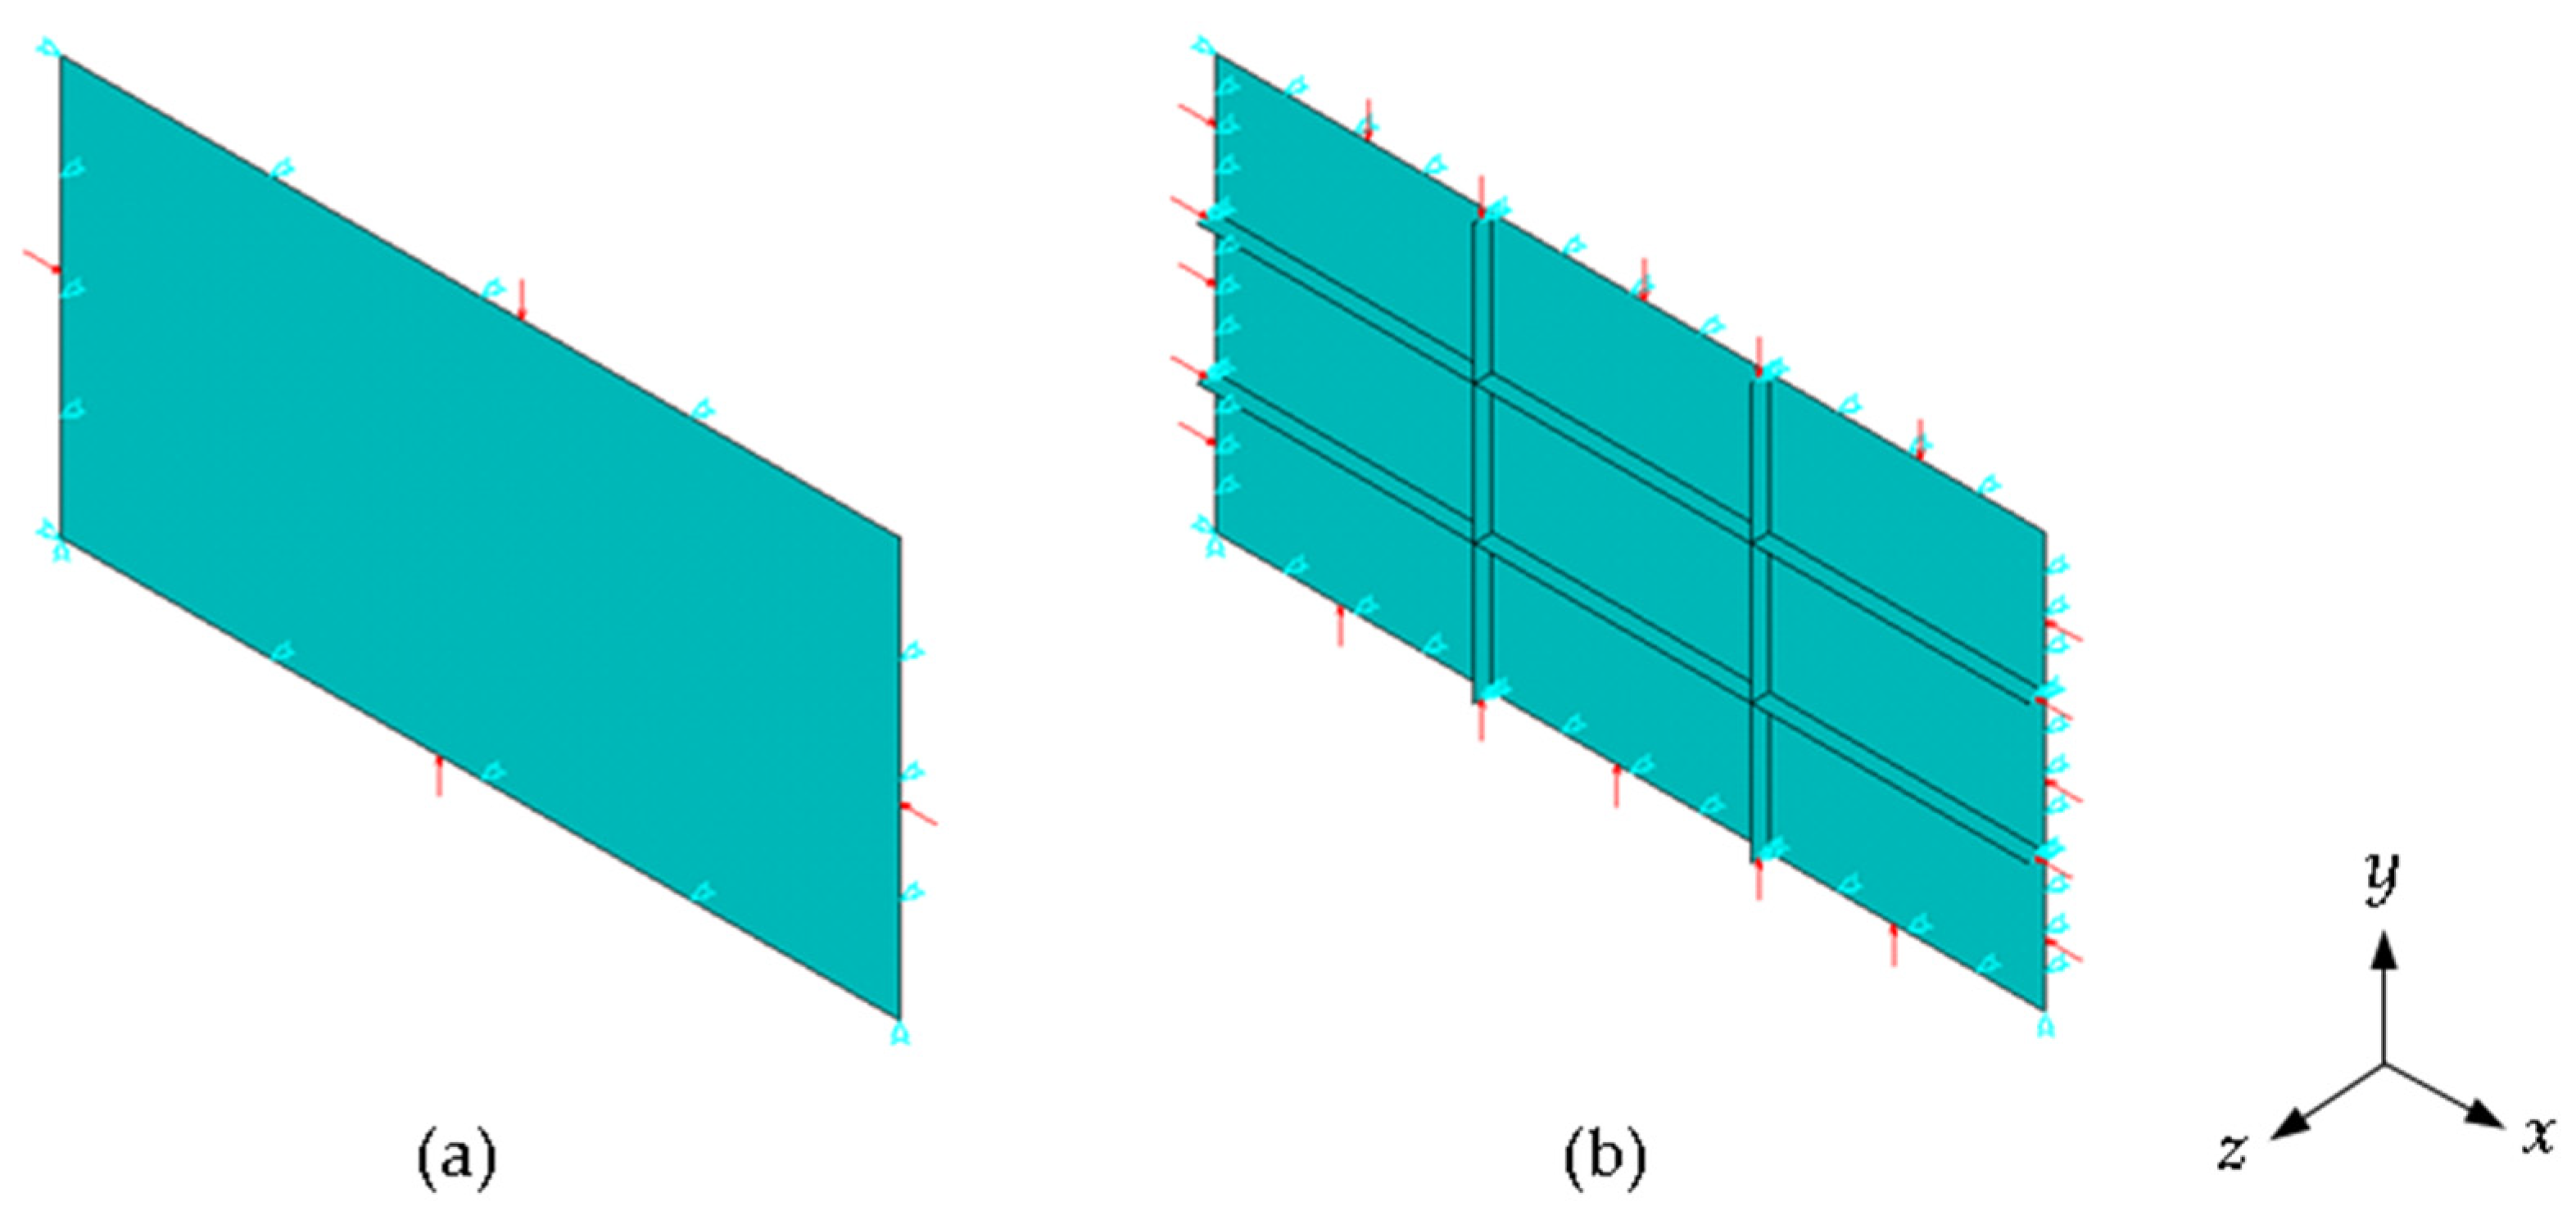
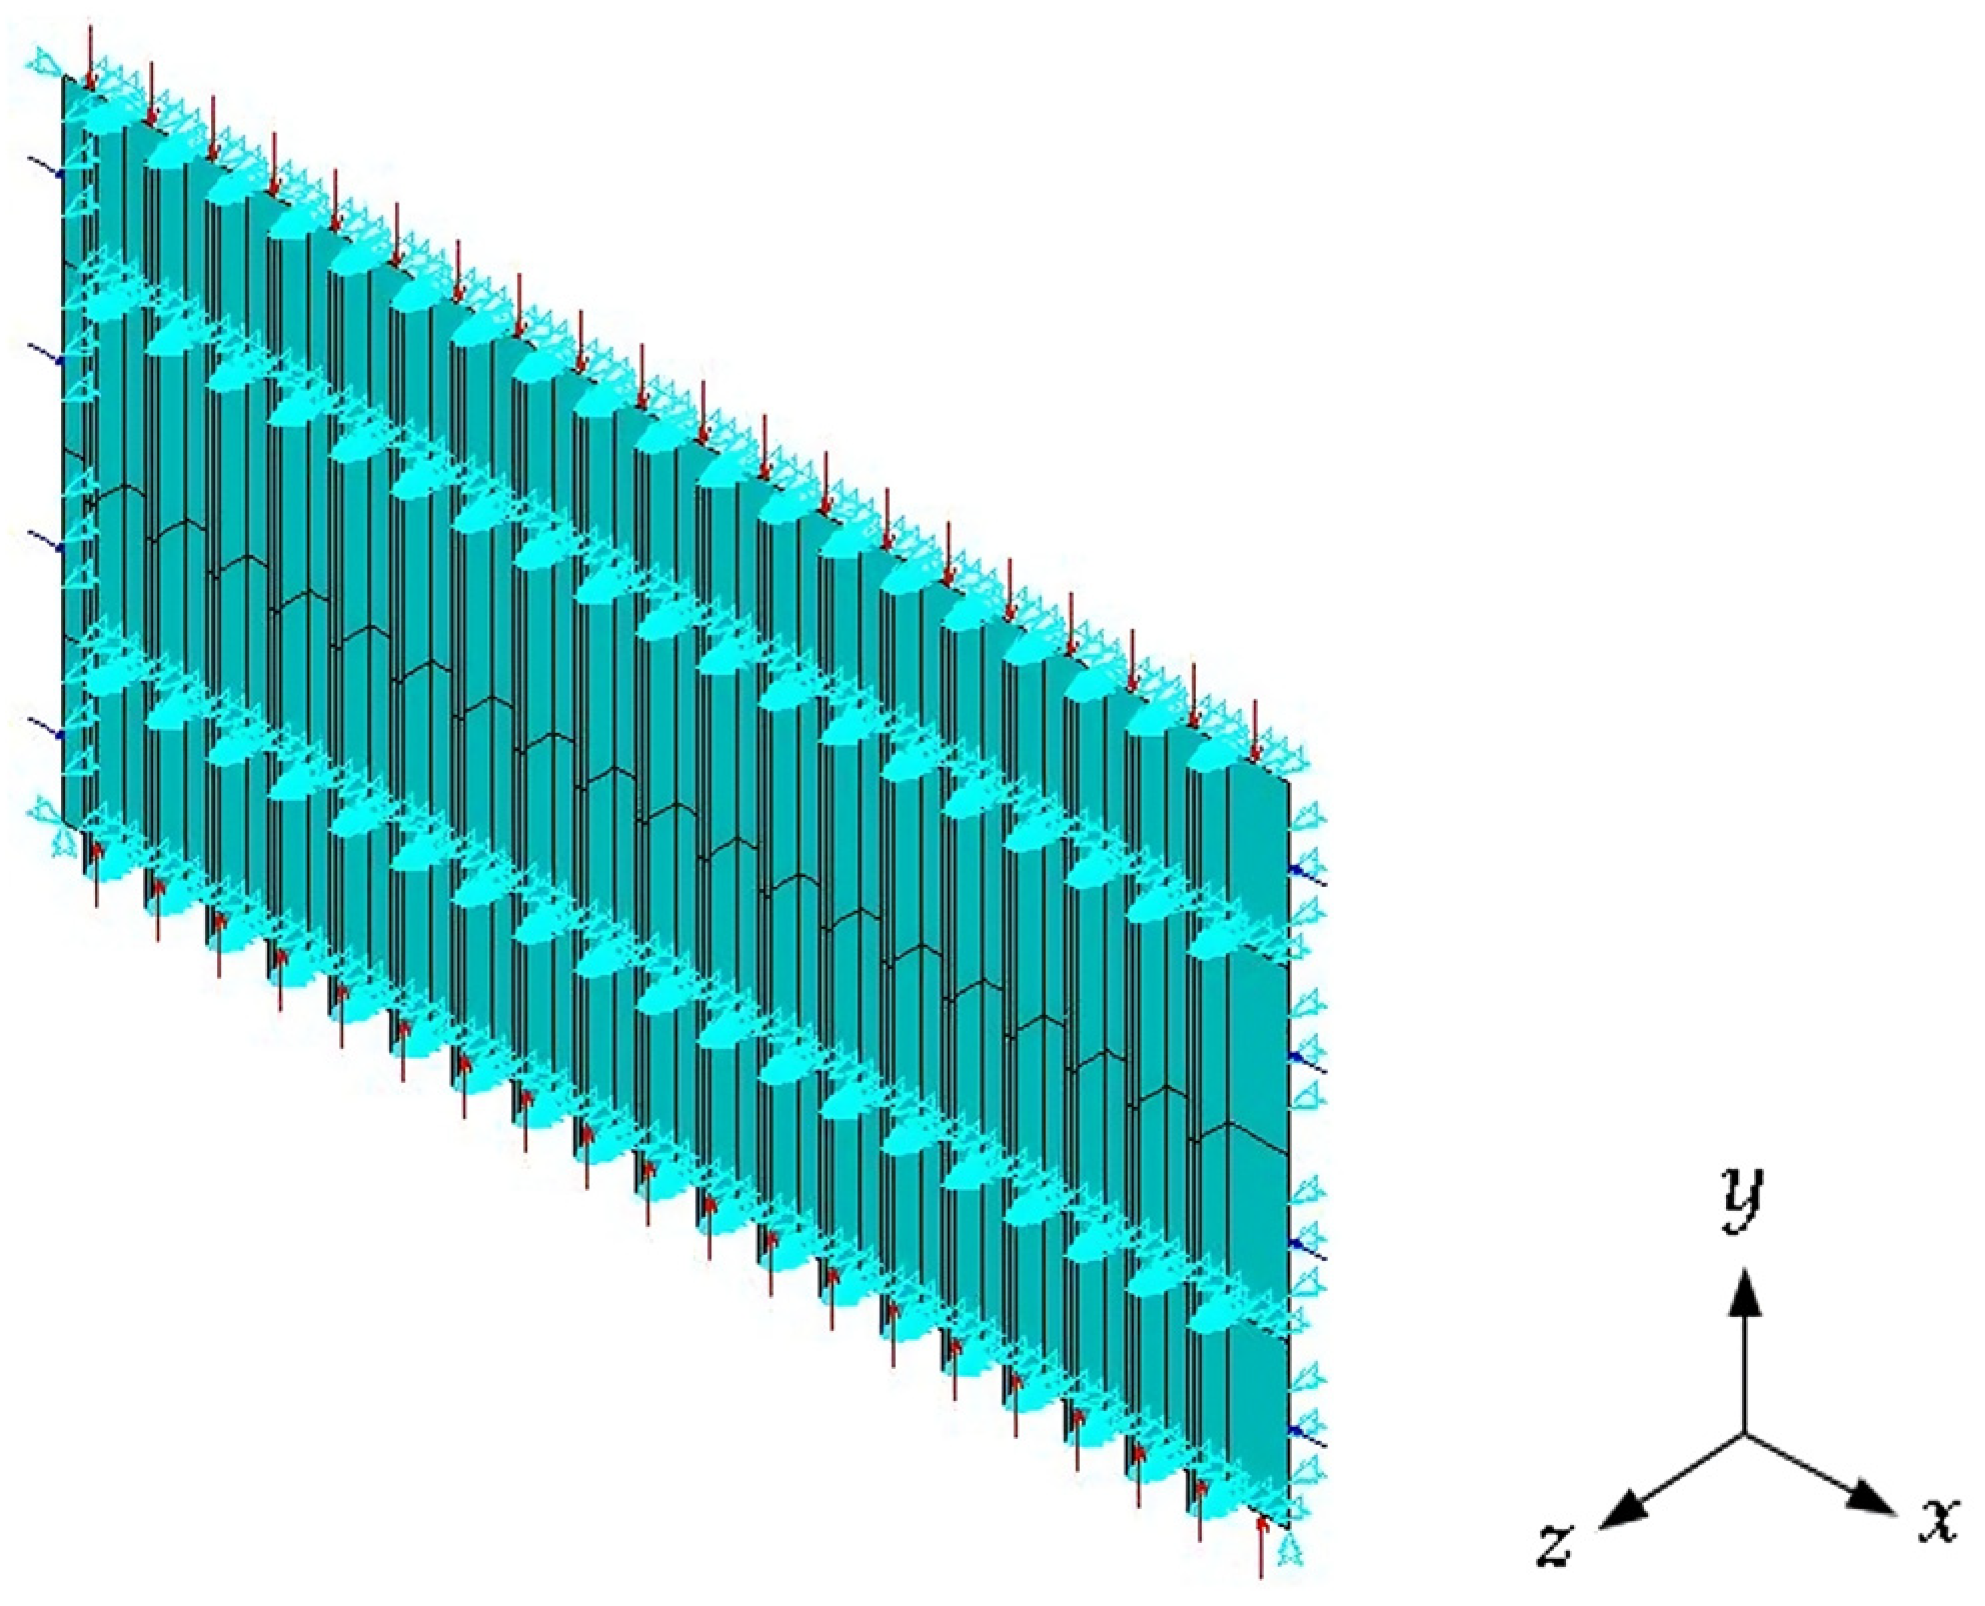
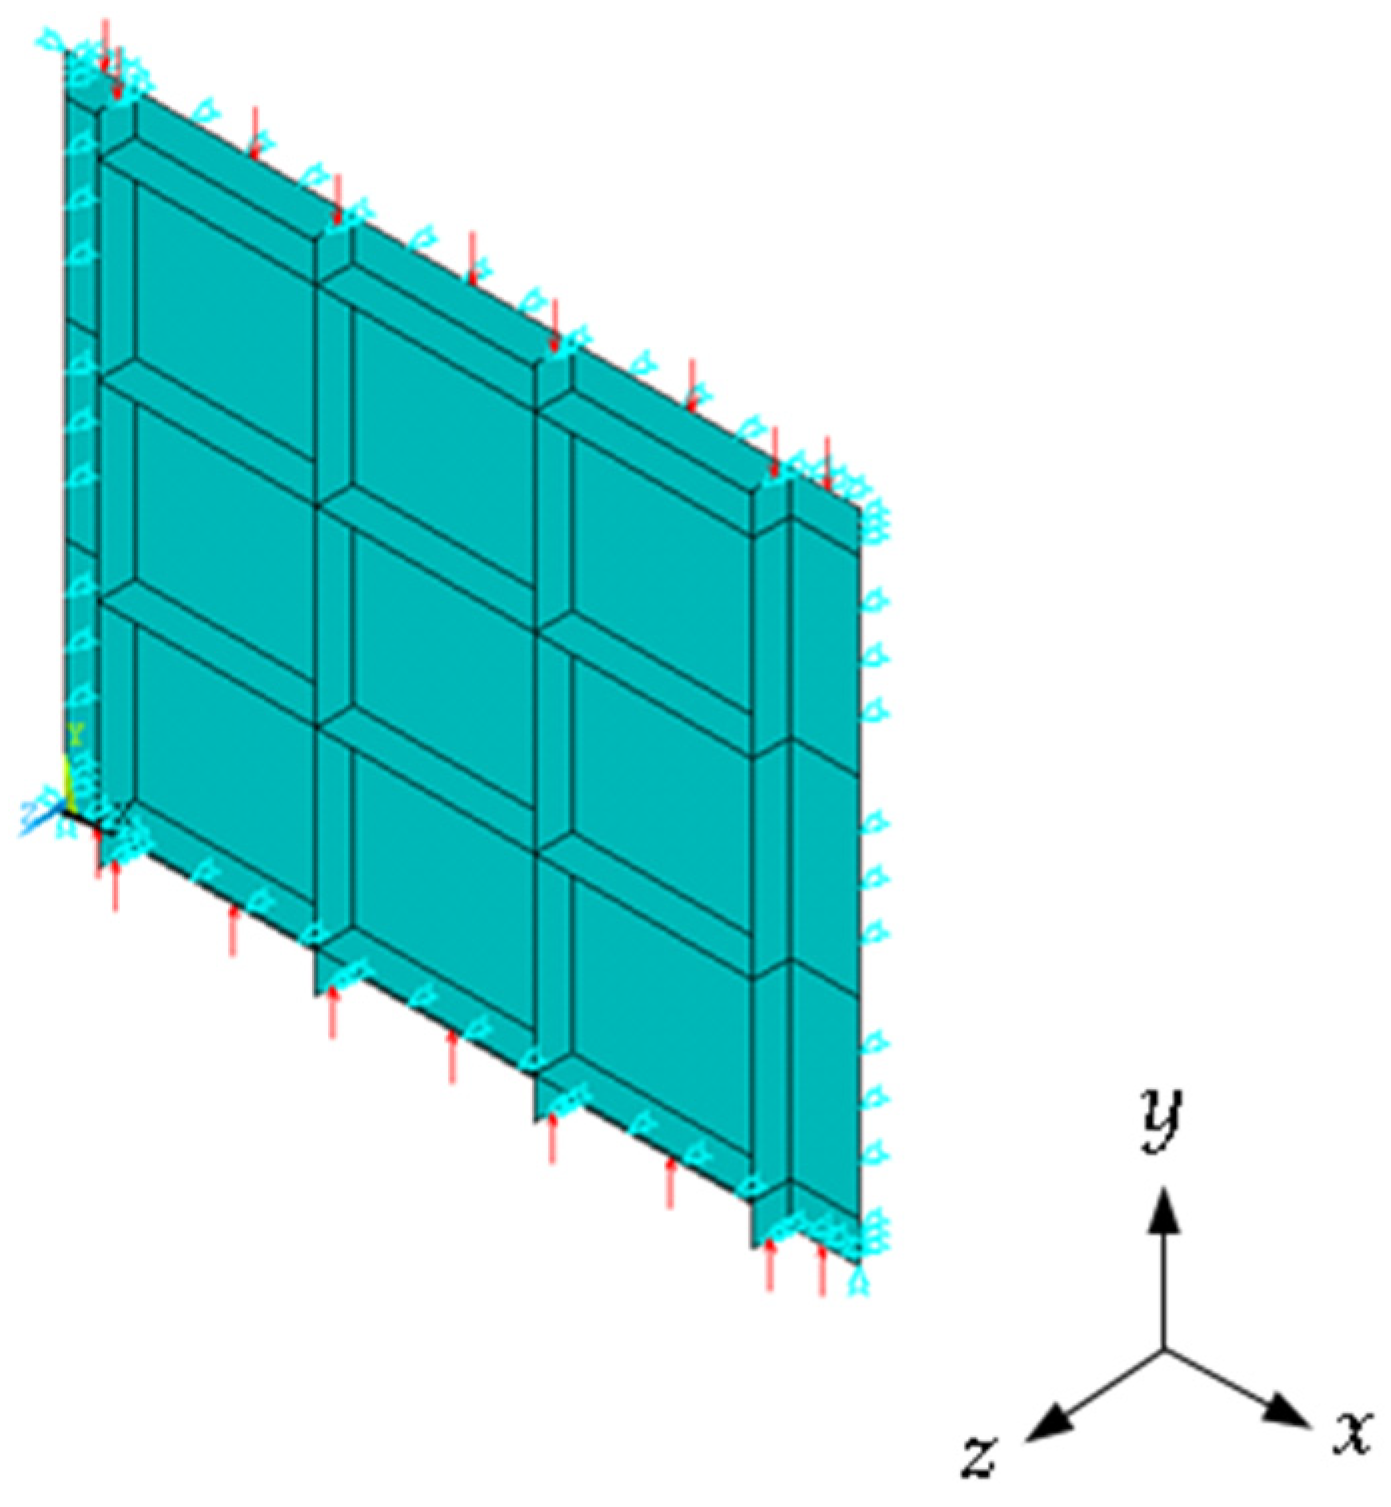
The unstiffened plate has thickness t and total volume   V p illustrated in Figure 1a. The stiffened plates have thickness t p , stiffeners thickness t s , stiffeners height h s , heigh-to-thickness ratio h s / t s , number of longitudinal stiffeners N ls , longitudinal stiffeners spacing S ls ,   number of transverse stiffeners N ts , transverse stiffeners spacing S ts , and total volume of stiffeners V s depicted in Figure 1b. In this work, the plate and stiffeners present same length a, width b, module of elasticity E, Poisson’s ratio ν , and the yield stress σ y .
These plates are numerically simulated using a computational model that initially considers their elastic buckling behavior. Based on the first critical buckling mode, the initial imperfect configuration of each plate is then defined for the subsequent elasto-plastic computational modeling.

2.2. Boundary and Loading Conditions

All simulations’ boundary conditions are considered simply supported, restricting the out-of-plane displacement U z across the four edges of the plate and stiffener boards. Additionally, the horizontal displacement U x is constrained at the lower-left corner of the plate, while the vertical displacement U y is constrained at the lower-right corner. The symbols of constraints are illustrated in Figure 2, with the cyan symbols representing the displacement constraints according to the axis directions and the red symbols indicating the applied compressive loading.
The loading condition considered in this study is compressive biaxial loading applied to the borders of the plate and stiffeners, represented by the red arrow in Figure 2. The respective values used in the elastic and elasto-plastic buckling analyses are presented in the following subsections.

2.3. Computational Modeling of Elastic Buckling

The elasto-plastic buckling analysis is based on the eigenvalue problem derived from the total stiffness matrix, combining elastic and geometric stiffness components. Although the fundamental formulations of elastic buckling analysis via FEM are well established, they are presented here to clarify the specific numerical procedures adopted for accurately modeling the elasto-plastic buckling of stiffened plates under biaxial compression, particularly as implemented in ANSYS MAPDL. According to Przemieniecki [45], the displacement equations contain nonlinear terms that must be considered in the calculation of the stiffness matrices for each element [ k ] , represented in the equation:
[ k ]   =   [ k E ]   +   [ k G ] ,
where [ k E ] represents the standard elastic stiffness matrix for each element, determined based on the element’s initial geometry at the beginning of the load step, and [ k G ] represents the geometric stiffness matrix for each element, whose determination depends not only on the geometry but also on the internal forces acting on the element at the start of the loading step. These matrices, [ k E ] and [ k G ] , are computed for each element in the structure:
[ K E ]   =   [ k E ] ,
[ K G ] = [ k G ] ,
where [ K E ] represents the total elastic stiffness matrix and [ K G ] represents the total geometric stiffness matrix. The total stiffness matrix [ K ] is then assembled from them, expressed by:
[ K ]   =   [ K E ]   +   [ K G ] ,
Thus, the global matrix of equations governing the solution of the elastic buckling problem, based on eigenvectors and eigenvalues, is described as:
[ K ]   ×   { U }   =   { P } ,
where {U} is the unknown displacement vector, [ K ] is the total stiffness, and {P} is an external loading vector. The incremental and iterative nature of the analysis necessitates expressing both the total stiffness matrix [ K ] and the external load vector {P} as functions of the load factor λ. To facilitate this, a unit geometric stiffness matrix, denoted by   [ K G * ] and a unit external load vector { P * } are defined by setting λ   =   1 on equations:
[ K G ]   =   λ   ×   [ K G * ] ,
{ F } = λ   ×   { P * } .
Substituting Equation (6) on Equation (4), and considering that the elastic stiffness matrix [ K E ] can be regarded as constant for a significant range of displacements, the following expression can be written as:
[ K ]   =   [ K E ]   +   λ   ×   [ K G * ] .
The global matrix equation, Equation (5), can be rewritten as:
( [ K E ]   +   λ   ×   [ K G * ] )   ×   { U }   =   λ   ×   { P } ,
Being possible to isolate { U } to obtain the displacements:
{ U }   =   λ   ×   P *   × ( [ K E ]   +   λ   ×   [ K G * ] ) 1 .
It is noted that as ( [ K E ]   +   λ   ×   [ K G * ] ) 1 is solved, the displacement values tend to infinite under the condition:
det [ [ K E ]   +   λ ×   [ K G ] ] = 0
Using the Lanczos method, the smallest value of λ, and consequently the respective critical buckling load, is determined by:
P crit =     λ crit   ×   { P * } ,
where P crit represents the critical buckling load, the λ crit represents the associated buckling mode, { P * } represents the external load applied. In the elastic buckling analysis of this work, only the first buckling mode is considered. A comprehensive explanation of the Block Lanczos method’s operation and implementation can be found in the work of Grimes et al. [46], which serves as the theoretical basis for the eigen solver implemented in MAPDL.

2.4. Computational Modeling of Elasto-Plastic Buckling

In elasto-plastic buckling analyses, both geometric and material nonlinearities are considered. This consideration implies that the total stiffness matrix [ K G ] and the global displacements { U } no longer exhibit a direct proportional relationship with the load application and resulting stresses, thus characterizing a nonlinear analysis. In the analyses conducted in this work, the selected material is defined with bilinear isotropic hardening; however, for simplification and to obtain more conservative results, a linear elastic-perfectly plastic model is adopted, disregarding the phenomenon of strain hardening. This simplification results in the prediction of lower ultimate buckling resistances, making the analysis more conservative [8].
For elasto-plastic buckling analyses, considering initial imperfections is essential to obtain realistic results regarding its mechanical behavior. The initial imperfections in this study are based on the first elastic buckling mode [4], representing the deformed configuration resulting from the application of the critical buckling load.
The first buckling mode represents the dominant deformation pattern leading to instability in nonlinear buckling studies and exhibits the lowest critical load in an eigenvalue buckling analysis. Although real plate imperfections (originating from manufacturing, transportation, and handling) are often irregular and localized, these deviations can be represented using buckling mode shapes, with the first mode contributing most significantly to the imperfection geometry. Therefore, employing a suitably scaled first buckling mode as the initial imperfection is a practical, conservative approximation widely accepted in buckling analyses [47].
The maximum amplitude of these imperfections is defined according to the recommendations of El-Sawy et al. [4]:
w b = b 2000 .
The multiplication of this maximum amplitude by the deformed configuration of the first buckling mode defines the imperfect initial geometric configuration for the beginning of the elasto-plastic buckling analysis, as adopted by Fonseca [48].
Once the geometry is updated, as explained by Helbig et al. [49] and Baumgardt et al. [44], a reference load is considered based on the yield stress of the material and applied in small increments, called load sub-steps, to the edges in both directions of the plate, where the reference load is given by:
P y = σ y   ×   t ,
where P y   represents the reference load based on the material’s yield stress, σ y represents the yield stress of material and t (or t p —see Figure 1) the thickness of plate. The application of these sub-steps is governed by the Newton–Raphson iterative method, in which the values of the tangent stiffness matrix [ K n , i T ] and the restoring force vector { P n , i nr } are recalculated for each load sub-step n and iteration i , referring to the configuration of each sub-step of the applied external loading { P n a } :
[ K n , i T ] { U i } = { P n a } { P n , i nr } .
Also, for each load sub-step n and iteration i , a new value of the displacement vector resulting from each iteration { U i + 1 } is obtained by:
{ U i + 1 } = { U i } + { U i } .
Repeating the iterative process of updating and obtaining Equations (15) and (16) for each iteration until non-convergence is reached, also called out-of-balance convergence criteria, occurring when:
R   <   ε R R ref ,
where ε R represents the convergence tolerance for the criterion, R ref is the reference value of the criterion, and R represents the residual vector as:
{ R } = { P n a } { P n , i nr } .
Non-convergence indicates that the displacements are so large due to the external loading { P n a } that the restoring forces { P n , i nr } cannot reach values that respect the criterion of Equation (16), representing that the structure has collapsed. The convergence criteria adopted in this computational model are set to 5% for displacements and 0.5% for both forces and moments values.

2.5. Finite Element

In this study, the finite element SHELL281 is employed to model both the plate and the stiffeners numerically. SHELL281 is an eight-node shell element, with each node featuring six degrees of freedom: three translational ( U x , U y , U z ) and three rotational ( θ x , θ y , θ z ). The element is based on the First-Order Shear Deformation Theory (FSDT), also known as the Reissner–Mindlin theory, which accurately represents shear effects in thin to moderately thick structures. SHELL281 is particularly suited for plate and shell applications involving complex geometries, as it accommodates linear and nonlinear analyses. It can model large rotations and large deformations, including changes in thickness. Its advanced features include defining various integration points and support for thickness offsets, drill still factors, and curved shell formulations. These features make it especially effective in capturing geometric nonlinearities and providing reliable results for various structural behaviors [50]. For this computational model, except for the integration points, set as five as recommended by ANSYS, all features of the SHELL281 element are used with the default.
In addition, this finite element supports both quadrilateral and triangular shapes. In general, quadrilateral elements are preferred for simple geometries due to their lower element count and faster convergence. Moreover, triangular elements for SHELL281 are recommended only as fillers in the mesh [50]. For this reason, the quadrilateral shape of the SHELL281 element is adopted in this computational model.

2.6. Constructal Design and Exhaustive Search

The Constructal Design and Exhaustive Search techniques applied to evaluate stiffened plates under biaxial elasto-plastic buckling follow the approach introduced by Lima et al. [12], illustrated in Figure 3.
An unstiffened plate is taken as a reference, and a fraction of the volume is redistributed (by reducing its original thickness) to form the stiffeners. This transformation is quantified by the volume fraction ϕ, while the total volume of the plate remains constant:
ϕ   =   V s V p     =   N ls ( a h s t s )   +   N ts ( b   -   N ls t s ) h s t s   abt .
In this work, an unstiffened plate with defined dimensions (as shown in Figure 1) is taken as the reference configuration. A volume fraction ϕ = 0.3 was adopted based on findings from previous studies. Lima et al. [12] demonstrated that, for plates with identical in-plane dimensions and varying thickness, redistributing 30% of the original plate volume into stiffeners provided the highest ultimate buckling stress under uniaxial compression, when compared to 10%, 20%, and 40%. Similarly, Vieira et al. [8] employed the same fraction in a study involving combined lateral pressure and biaxial loading. To ensure methodological consistency and enable direct comparison with these previous works, the same redistribution fraction was maintained in the present study. This formulation enables the systematic investigation of multiple geometric configurations by evaluating how variations in the degrees of freedom (DOFs) ( N ls , N ts , and ratio h s / t s ) influence the σ u .
In this work, an unstiffened plate with dimensions is taken as a reference plate depicted in Figure 1. A volume fraction ϕ = 0.3 was adopted based on findings from previous works. Lima et al. [12] showed that, for plates with identical in-plane dimensions and varying thickness, a 30% redistribution into stiffeners provided the highest ultimate buckling stress when compared to 10%, 20%, and 40% under uniaxial compression. Vieira et al. [8] also used this value in a study involving combined lateral pressure and biaxial loading. To ensure methodological consistency and enable direct comparison with these benchmark studies, the same redistribution fraction was maintained in the present work. This formulation enables the investigation of multiple geometric configurations by analyzing how variations in the degrees of freedom (DOF) ( N ls , N ts , and ratio h s / t s ) influence the σ u .
The N ls and N ts is varied from 2 to 5, also following the approach adopted by Lima et al. [12], who investigated plates with identical dimensions under uniaxial loading. This range was chosen because it enables, under the volume conservation constraint, the generation of configurations with sufficiently high h s to trigger local buckling modes, as well as sufficiently low h s values to allow the development of global buckling behavior. These values yield sixteen plate configurations denoted as P( N ls ;Nₜₛ): P(2;2), P(2;3), P(2;4), P(2;5), P(3;2), P(3;3), P(3;4), P(3;5), P(4;2), P(4;3), P(4;4), P(4;5), P(5;2), P(5;3), P(5;4), and P(5;5). To ensure a symmetric distribution of stiffeners across the plate, the spacing between both longitudinal and transverse stiffeners is defined accordingly based on the selected values of N ls and N ts :
S ls   =   b N ls   +   1 ,
S ts = a N ts + 1 ,
with S ls as the spacing between longitudinal stiffeners and S ts as the spacing between transverse stiffeners.
The value of t s is defined as a minimum of 5 mm, incrementally up to a maximum of 40 mm, which, combined with the sixteen different plate configurations, resulted in 128 different stiffened plate designs to have σ u investigated.
To evaluate and compare the performance of the various stiffened plate configurations and stiffener geometries, σ u values obtained are non-dimensionalized by normalizing the ultimate buckling stress of the reference plate σ uR , resulting in the normalized ultimate buckling stress σ uN . This normalized parameter serves as a performance indicator and is calculated as:
σ uN     =   σ u σ uR .
Additionally, the normalized out-of-plane displacements U zN   are also calculated, by equation:
U zN     =   U z U zR ,
where U z represents the maximum value of out-of-plane displacements calculated, and U zR is the maximum value of out-of-plane displacements from the reference plate. In this study, only the σ uN   is taken as performance indicator, being U zN   calculated only to investigate the relation between stress and displacement.
By varying the DOFs N ls , N ts , and the ratio h s / t s , and subsequently calculating the σ uN , the h s / t s ratios that maximized σ uN are determined for each plate configuration. These are the once-optimized height-to-thickness ratios ( h s / t s ) o and the corresponding once-maximized normalized buckling stress ( σ uN ) m . From this first optimization step, the highest ( σ uN ) m values and their associated ( h s / t s ) o and N ts values are identified and redefined, respectively, as the twice-maximized stress ( σ uN ) mm , the twice-optimized height-to-thickness ratio ( h s / t s ) oo , and the once-optimized number of transverse stiffeners ( N ts ) o . Finally, based on these refined values, the plate configuration with the overall highest ultimate buckling stress is established, referred to as the three-times maximized strength ( σ uN ) mmm , the three-times optimized ratio ( h s / t s ) ooo , the twice-optimized number of transverse stiffeners ( N ts ) oo , and the once-optimized number of longitudinal stiffeners ( N ls ) o .
The combination of Constructal Design, Exhaustive Search, and Finite Element Method (FEM) is particularly effective for studying plate buckling due to its ability to optimize geometrical configurations and analyze complex mechanical behaviors, as demonstrated in Lima et al. [12] and Vieira et al. [8]. This occurs because it is possible to understand how the variation in degrees of freedom influences the performance indicator.

2.7. Mesh Convergence Test

Mesh convergence tests are a fundamental step in ensuring the reliability of finite element analysis. These tests identify whether the results are independent of mesh size, confirming that the chosen discretization does not compromise solution accuracy. Additionally, they assess whether the achieved level of accuracy is sufficient, ensuring that further mesh refinement would not yield significant improvements relative to the increased computational cost [51].
In verifying the computational model used in this study, the size of the finite elements is determined through mesh convergence tests conducted for each case. However, due to the large number of simulations required by the Constructal Design methodology and the Exhaustive Search technique, a representative mesh convergence test is performed. This test is conducted for both an unstiffened plate and a stiffened plate after calculating all possible values of h s for each combination of N ls , N ts , and t s , to identify a representative and more complex plate configuration. The results of this test are then used to standardize the mesh element size across all subsequent simulations.

2.8. Sub-Steps Load Convergence Test

As the computational model is initially applied to only a few simulations for the computational model verification, a high number of 200 sub-steps is considered, with a maximum of 400 and a minimum of 50, depending on the convergence of analysis.
For the case study, once all possible geometries are defined and the finite element mesh shape and size are established, a sub-step load convergence test is also performed to standardize the number of incremental subdivisions used for applying the reference loads. This test is essential due to the many simulations required for the various stiffened plate geometric configurations generated through the Constructal Design method.

2.9. Verification of Computational Model

According to Oñate [52], in the context of structural finite element analysis, building confidence in the numerical results is essential for ensuring that the computational model reliably represents the physical problem under study. This confidence is primarily established through two complementary processes: verification and validation. Verification is concerned with assessing whether the computational model accurately represents the underlying mathematical and structural formulation. It focuses on identifying and minimizing numerical errors by comparing the results of the computational model with established reference solutions. In this work, verification was conducted through comparison with published numerical results from the literature, which, although not analytical, are widely recognized as benchmarks in similar studies. This approach is especially relevant when analytical solutions are not available for complex problems such as biaxial elasto-plastic buckling of stiffened plates. On the other hand, validation involves evaluating how accurately the computational results reflect real-world behavior, typically by comparing numerical predictions with experimental data. In the present study, validation was incorporated through comparisons with selected experimental results available in the literature, thereby reinforcing the reliability of the computational model. Together, verification and validation are fundamental to demonstrating both the correctness of the numerical implementation and the physical representativeness of the model, ensuring that the conclusions drawn from the simulations are robust and trustworthy. Additionally, Morris [53] recommends a one-factor-at-a-time approach to isolate the effect of each parameter. The proposed computational model is therefore verified using reference numerical results and validated through comparison with experimental ultimate loads results for both unstiffened and stiffened plates.

3. Results and Discussion

3.1. Computational Model Verification and Validation

3.1.1. Verification for Elasto-Plastic Buckling and Unstiffened Plates

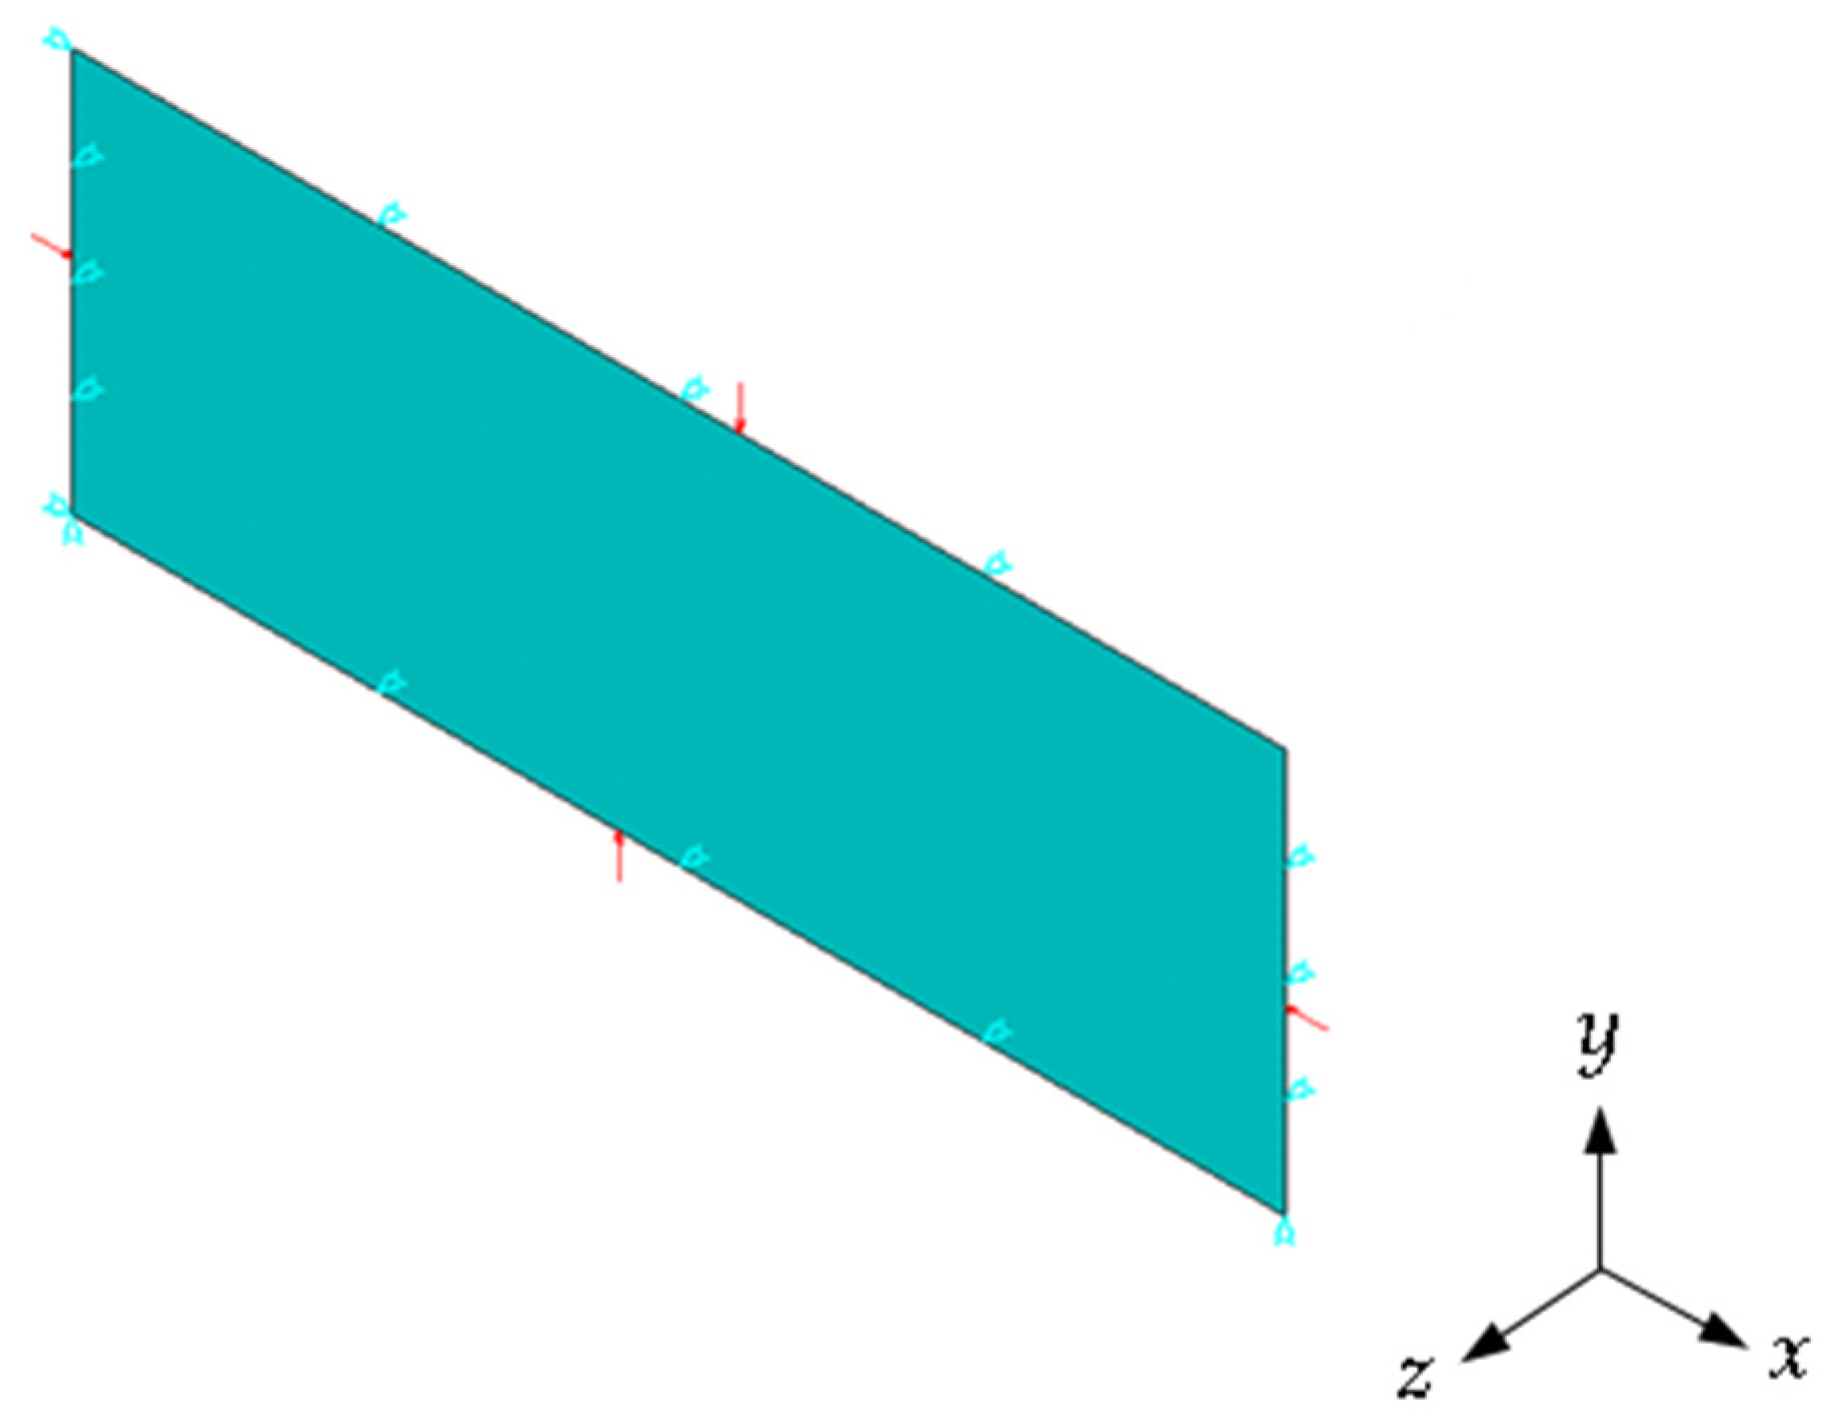
The first verification for elasto-plastic buckling and unstiffened simply-supported steel plate considered the Lima et al. [12] study, which investigated the uniaxial compressive loading in an unstiffened plate with dimensions a = 2000 mm, b = 1000 mm, and t = 14 mm, with material properties E = 210 GPa, σ y = 355 MPa, and ν = 0.3, represented in Figure 4.
The σ u resultant from this computational model is obtained through the mesh convergence test, as presented in Table 1.
The mesh convergence test achieved an σ u = 186.45 MPa, which is 0.62% lower than compared with the σ u = 187.61 MPa obtained by Lima et al. [12]. This slight difference may be related to the type of finite element used, as the SHELL281 element is adopted in the present study, whereas Lima et al. [12] employed the SHELL93 element.
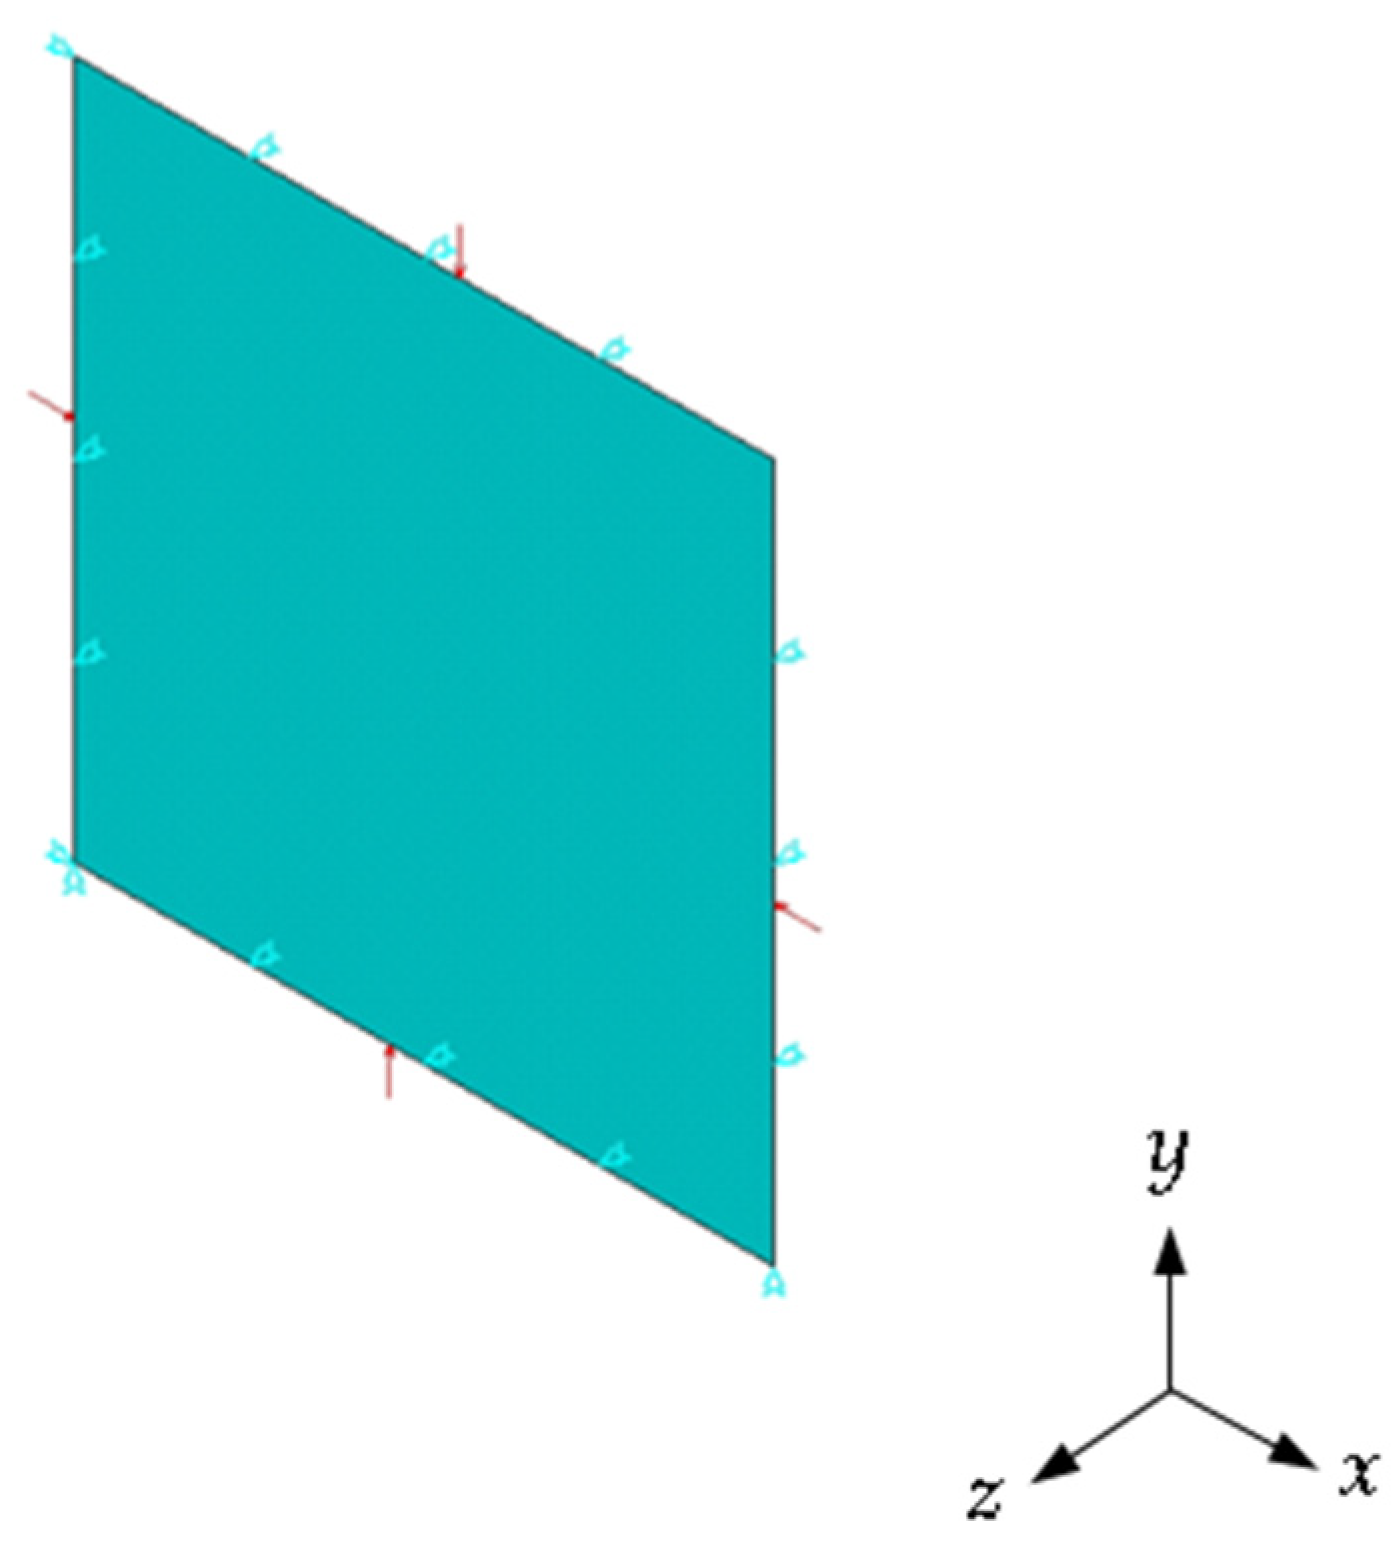
The second verification of this computational model for elasto-plastic buckling and unstiffened simply-supported steel plate is carried out by the Shanmugam and Narayanan [18] study. This study applied a biaxial compressive loading to an unstiffened plate with dimensions a = 720 mm, b = 240 mm, and t = 4 mm, with material properties E = 205 GPa, σ y = 245 MPa, and ν = 0.3, represented in Figure 5.
The value of σ u achieved for this verification is obtained through the mesh convergence test, shown in Table 2.
The mesh convergence test achieved an σ u = 55.28 MPa, which represents a difference of 1.90% lower than compared with the σ u = 56.35 MPa obtained by Shanmugam and Narayanan [18].

3.1.2. Validation for Elasto-Plastic Buckling and Unstiffened Plates

The validation of this computational model for elasto-plastic buckling and unstiffened plate is realized considering a case from Shanmugam and Narayanan [18], which tested experimentally a simply-supported plate with dimensions a = b = 86 mm, t = 2.032 mm, and material properties E = 205 GPa, σ y = 334.7 MPa, and ν = 0.3, illustrated in Figure 6.
The value of P u result of this validation is obtained through the mesh convergence test, shown in Table 3.
The mesh convergence test resulted in P u = 33.05 kN, which represents an error of −7.03% compared with the P u = 35.55 kN obtained by Shanmugam and Narayanan [18].

3.1.3. Verification for Elasto-Plastic Buckling and Stiffened Plates

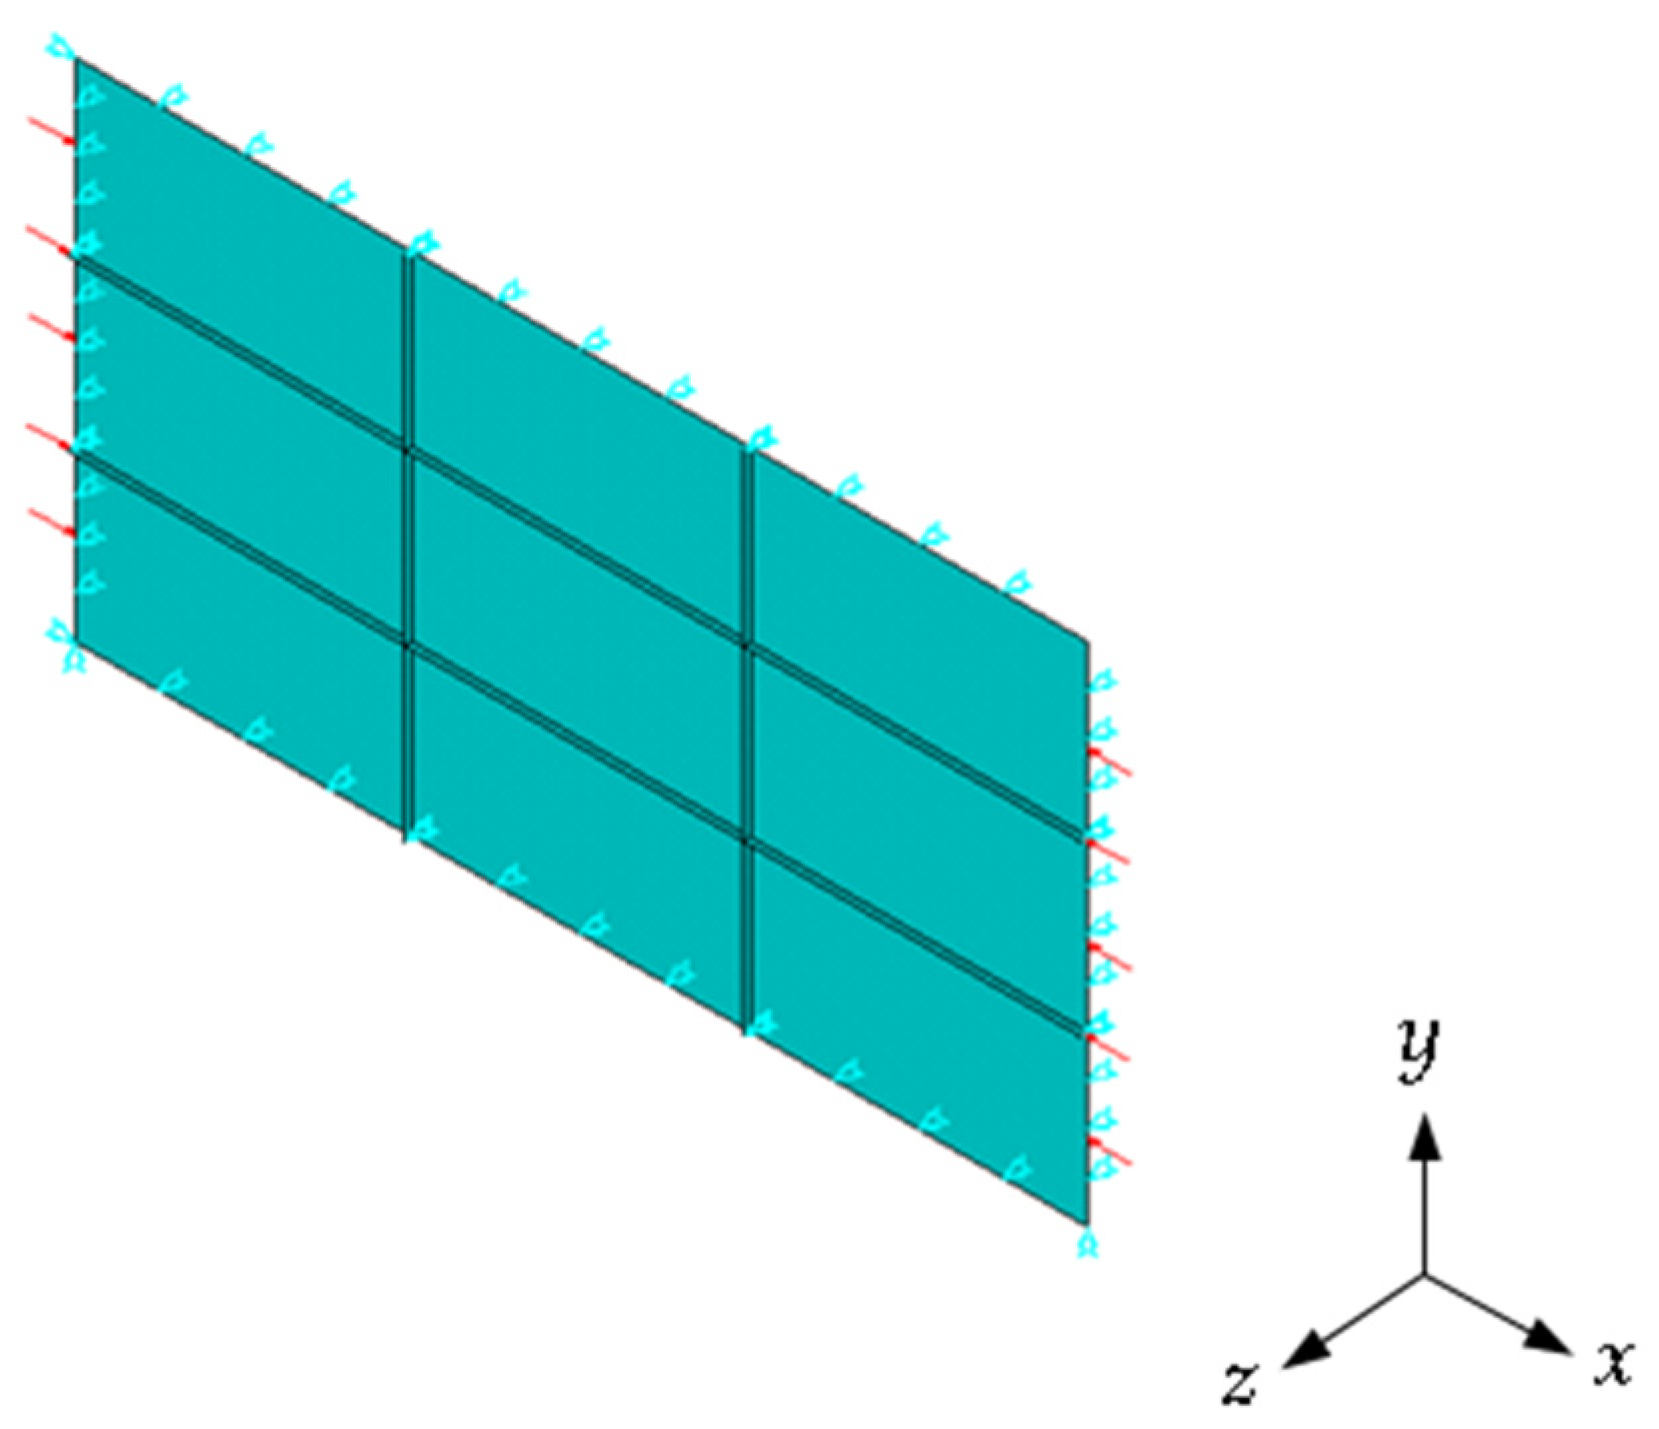
The first verification of this computational model for elasto-plastic buckling and stiffened plate is also based on Lima et al. [12] study, which applied a uniaxial compressive loading in a simply-supported steel stiffened plate, with the plate presenting a = 2000 mm, b = 1000 mm, t = 18 mm, and N ls = N ts = 2. The stiffeners present the same a and b values of plate, h s = 14 mm, and t s = 45 mm. The material properties of plate and stiffeners are the same, with E = 210 GPa, σ y = 355 MPa, and ν = 0.3, represented in Figure 7.
The value of σᵤ resultant is determined based on the mesh convergence results presented in Table 4.
The mesh convergence test resulted in a σ u = 281.22 MPa, which is 4.28% lower than the σ u = 293.78 MPa reported by Lima et al. [12]. As mentioned earlier, this difference may be attributed to the different types of finite elements used.
The second verification of the computational model for elasto-plastic buckling of stiffened plates is based on the study by Paik and Seo [21], which applied biaxial compressive loading to a simply supported steel stiffened plate with dimensions a = 16,300 mm, b = 4300 mm, and thickness t p = 18 mm. The plate contained N ts = 19 T-shaped stiffeners, extending across the full plate length and width, with h s = 463 mm, t s = 8 mm, and flange thickness t f = 172 mm. The plate and stiffeners present the same material properties, with Young’s modulus E = 205.8 GPa, yield strength σ y = 315 MPa, and Poisson’s ratio ν = 0.3. The longitudinal stiffeners are represented indirectly by imposing U z = 0 boundary conditions along their intersection lines with the plate without explicitly modeling their geometry. The stiffened plate and loading and boundary conditions are illustrated in Figure 8, in which the blue arrows represent the applied compressive loading in x direction, red arrows represent the applied compressive loading in y direction, and cyan symbols indicate the support conditions.
The σ u value is obtained from the mesh convergence analysis, with results summarized in Table 5.
The computational model resulted in a longitudinal ultimate buckling σ ux = 69.30 MPa and transverse ultimate buckling σ uy = 103.95 MPa, which is respectively 0.87% and 0.88% lower than the σ ux = 69.91 MPa and σ uy = 104.87 MPa presented by Paik and Seo [21].

3.1.4. Validation for Elasto-Plastic Buckling and Stiffened Plates

The validation for elasto-plastic buckling and stiffened plates was carried out by comparing the P u obtained in the present study with experimental results reported by Kumar et al. [24]. In their investigation, a stiffened steel panel was subjected to uniaxial compressive loading. The geometry of the panel, illustrated in Figure 9, consisted of a plate with dimensions a = 1160 mm, b = 960 mm, and thickness t p = 5 mm. The material properties of the plate were E = 180 GPa, σ yp = 218 MPa, and Poisson’s ratio ν = 0.3. The panel was reinforced with four longitudinal stiffeners, each located 100 mm from the plate edges and spaced 320 mm apart, and four transverse stiffeners placed 60 mm from the panel ends, with a spacing of 280 mm. The stiffeners had thickness t s = 5 mm and height h s = 50 mm and were made of material with E = 180 GPa, σ ys = 300 MPa, and ν = 0.3.
The P u value is achieved from the mesh convergence test, with results shown in Table 6.
The present study achieved P u = 1118.99 kPa, which represents an error of −8.28% relative to the experimental value of P u = 1220 kN reported by Kumar et al. [21].

3.2. Mesh Convergence Test—Case Study

After calculating all possible values of h s for each combination of N ls , N ts , and t s , the mesh convergence test to standardize the finite element size is performed for both the unstiffened reference plate and stiffened plate with configuration P(5;5), with intermediate values of h s and t s . This plate configuration represents the case with the highest interaction between the plate and stiffeners due to the most significant number of stiffeners, which is considered the most complex case.
For the simply supported unstiffened reference steel plate with a = 2000 mm, b = 1000 mm, t = 14 mm, E = 210 GPa, ν = 0.3, and σ y = 355 MPa, the mesh convergence test is shown in Table 7.
From Table 7, one can observe a value of σ u = 59.68 MPa, with no variation when comparing element sizes of 75 mm, 50 mm, and 25 mm. As previously demonstrated by Vieira et al. [8], while the element size does not significantly affect the predicted value of σ u , it can influence the local stress distribution patterns. Therefore, a finite element size of 25 mm was adopted, as it provided both a converged value of σ u and consistent stress field representation. Given that convergence was already achieved and that further mesh refinement would only escalate computational cost without improving the accuracy of σ u , no additional refinements were performed. The computational cost remains scalable, and the numerical prediction of σ u stable, even for highly refined meshes (though at the expense of increased simulation time.)
For the simply-supported stiffened steel plates with a = 2000 mm, b = 1000 mm, t p = 9.8 mm, N ls = N ts = 5, h s = 29 mm, t s = 20 mm, E = 210 GPa, ν = 0.3, and σ y = 355 MPa, the mesh convergence is shown in Table 8.
The mesh convergence test presented in Table 8 resulted in a σ u = 122.70 MPa, without difference due to the element size adopted. Considering the same approach considered for the unstiffened reference plate (see Table 7), all simulations of stiffened plates are performed with an element size of 25 mm.

3.3. Load-Steps Convergence Test—Case Study

With all possible geometries defined and the finite element shape and size established, a sub-step convergence test is carried out to standardize the number of incremental subdivisions used for applying the reference loads (see Equation (14)). This load-step convergence test is performed using the same stiffened plate configuration previously adopted in the mesh convergence analysis, as shown in Table 9.
From Table 9, it is concluded that dividing the reference load into 200 and 300 sub-steps led to higher values of σ u . Although the number of sub-steps resulted in differences in the stress distributions [8], this study adopted 200 sub-steps to reduce computational effort. This decision is supported by the convergence test for the plate model considered, which showed a computational cost reduction of approximately 21.54% when using 200 sub-steps instead of 300.

3.4. Reference Plate

An unstiffened plate with a = 2000 mm, b = 1000 mm, t = 18 mm, E = 210 GPa, ν = 0.3, and σ y = 355 MPa is selected as a reference plate and presented σ uR = 59.68 MPa and U zR = 38.05 mm calculated with this computational model. The out-of-plane displacements and von Mises stress distributions are shown in Figure 10.
In Figure 10a, the maximum displacement values are located at the center of the plate, forming a semi-wave pattern indicative of a global buckling failure mode. In Figure 10b, the stress distribution reveals that the material reaches its yield stress across nearly the entire plate. Similar behaviors are reported in unstiffened plates with comparable a and b dimensions, boundary conditions, and biaxial compressive loading, as discussed by Baumgardt et al. [44] and Vieira et al. [8].

3.5. Influence of   N ls , N ts   , and t s over h s

To investigate the influence of N ls , N ts , and t s over h s , the plate configurations with less (2) and higher (5) values of N ls are plotted in Figure 11, varying the N ts and t s .
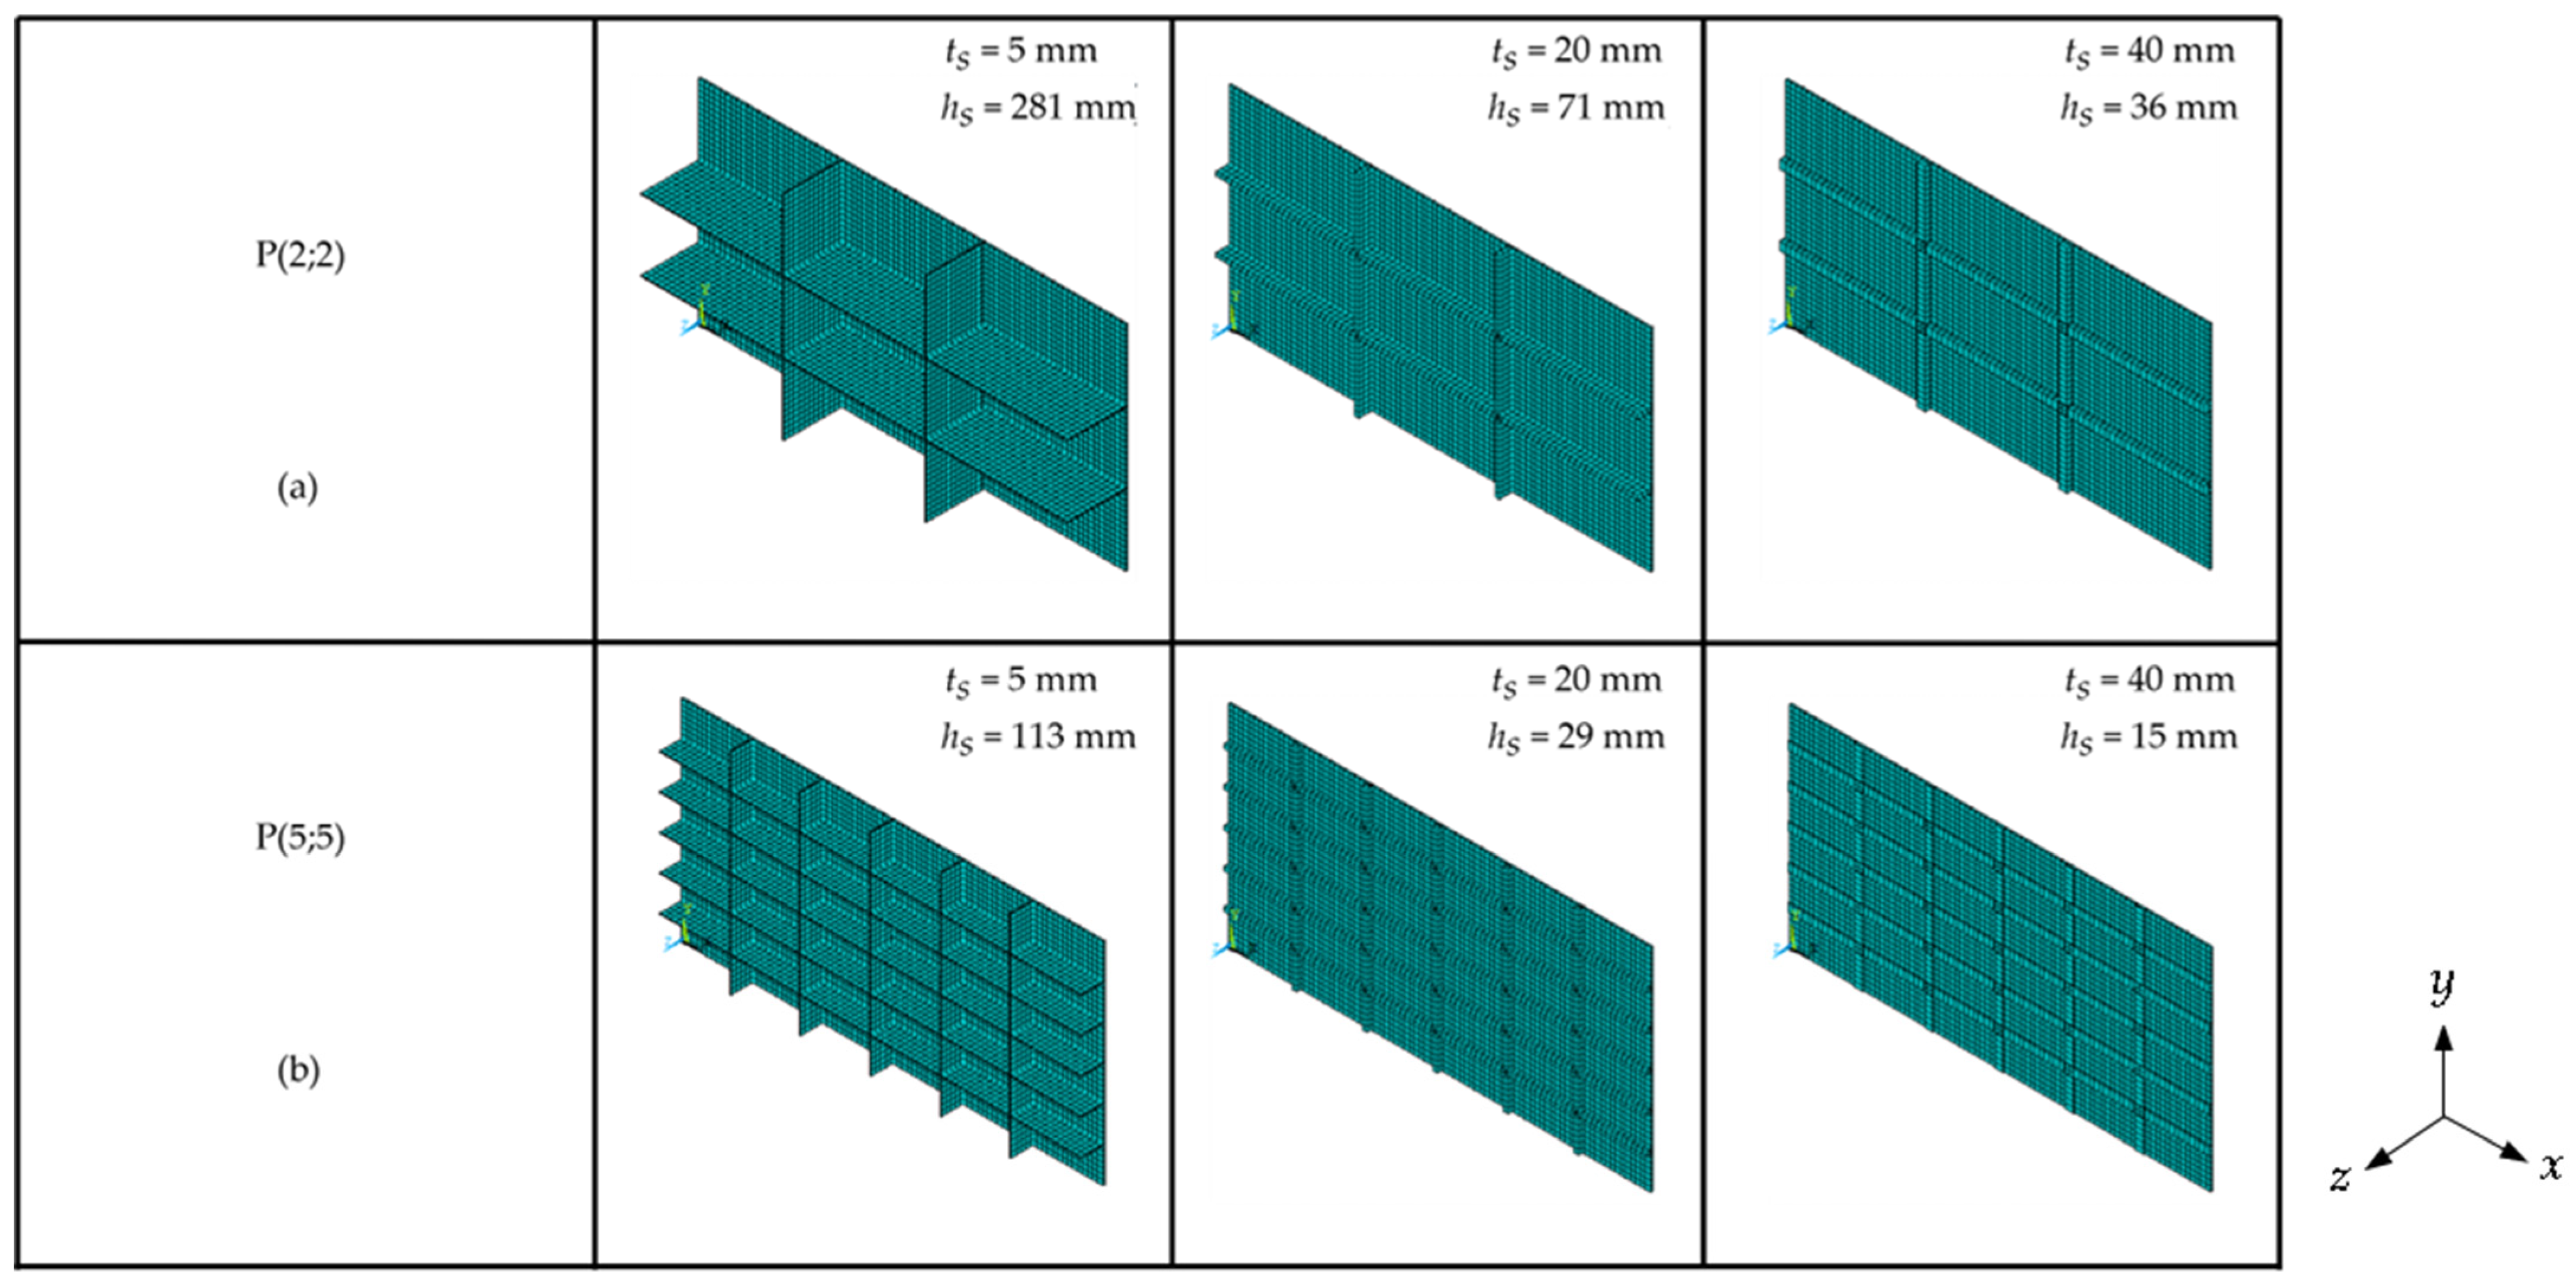
In Figure 11, the same behavior can be observed across all graphs: to satisfy the premise of conserving the original material volume of the reference plate (while converting 30% of this volume into stiffeners), together with the N ls and N ts ranging from 2 to 5, and the t s varying from 5 mm to 40 mm, the resulting h s becomes a function of these parameters. As N ls , N ts and t s increase, both the maximum and minimum possible values of h s decrease, leading to a corresponding reduction in the h s / t s ratio. This behavior is consistent across all plate configurations analyzed in this study. Figure 12 further illustrates this trend by visually comparing the geometrical configurations with the lowest (P(2;2)) and highest (P(5;5)) number of stiffeners, as t s varies.
Figure 12a shows that the plate configuration P(2;2), which has the lowest number of stiffeners, allows the stiffeners to reach a height of h s = 281 mm when using the minimum thickness t s   = 5 mm. As t s   increases to its maximum value of 40 mm, the stiffener height decreases to h s = 36 mm, representing a reduction of approximately 87.2%. In contrast, the configuration with the highest number of stiffeners, P(5;5), reaches a maximum stiffener height of h s = 113 mm at t s = 5 mm, which decreases to h s = 15 mm at t s = 40 mm, a reduction of about 86.7% (see Figure 12b). These differences in values and the corresponding illustrations in Figure 12 (resulting solely from the transformation of part of the plate volume into stiffener) demonstrate how the application of the Constructal Design can lead to numerous and significantly different geometric configurations, which can be explored to identify the most resistant component without requiring additional material. The complete information on all values of N ls , N ts , h s , and t s are available in Supplementary Materials of this article.

3.6. Influence of   h s / t s , N ls , and N ts over σ uN and U zN

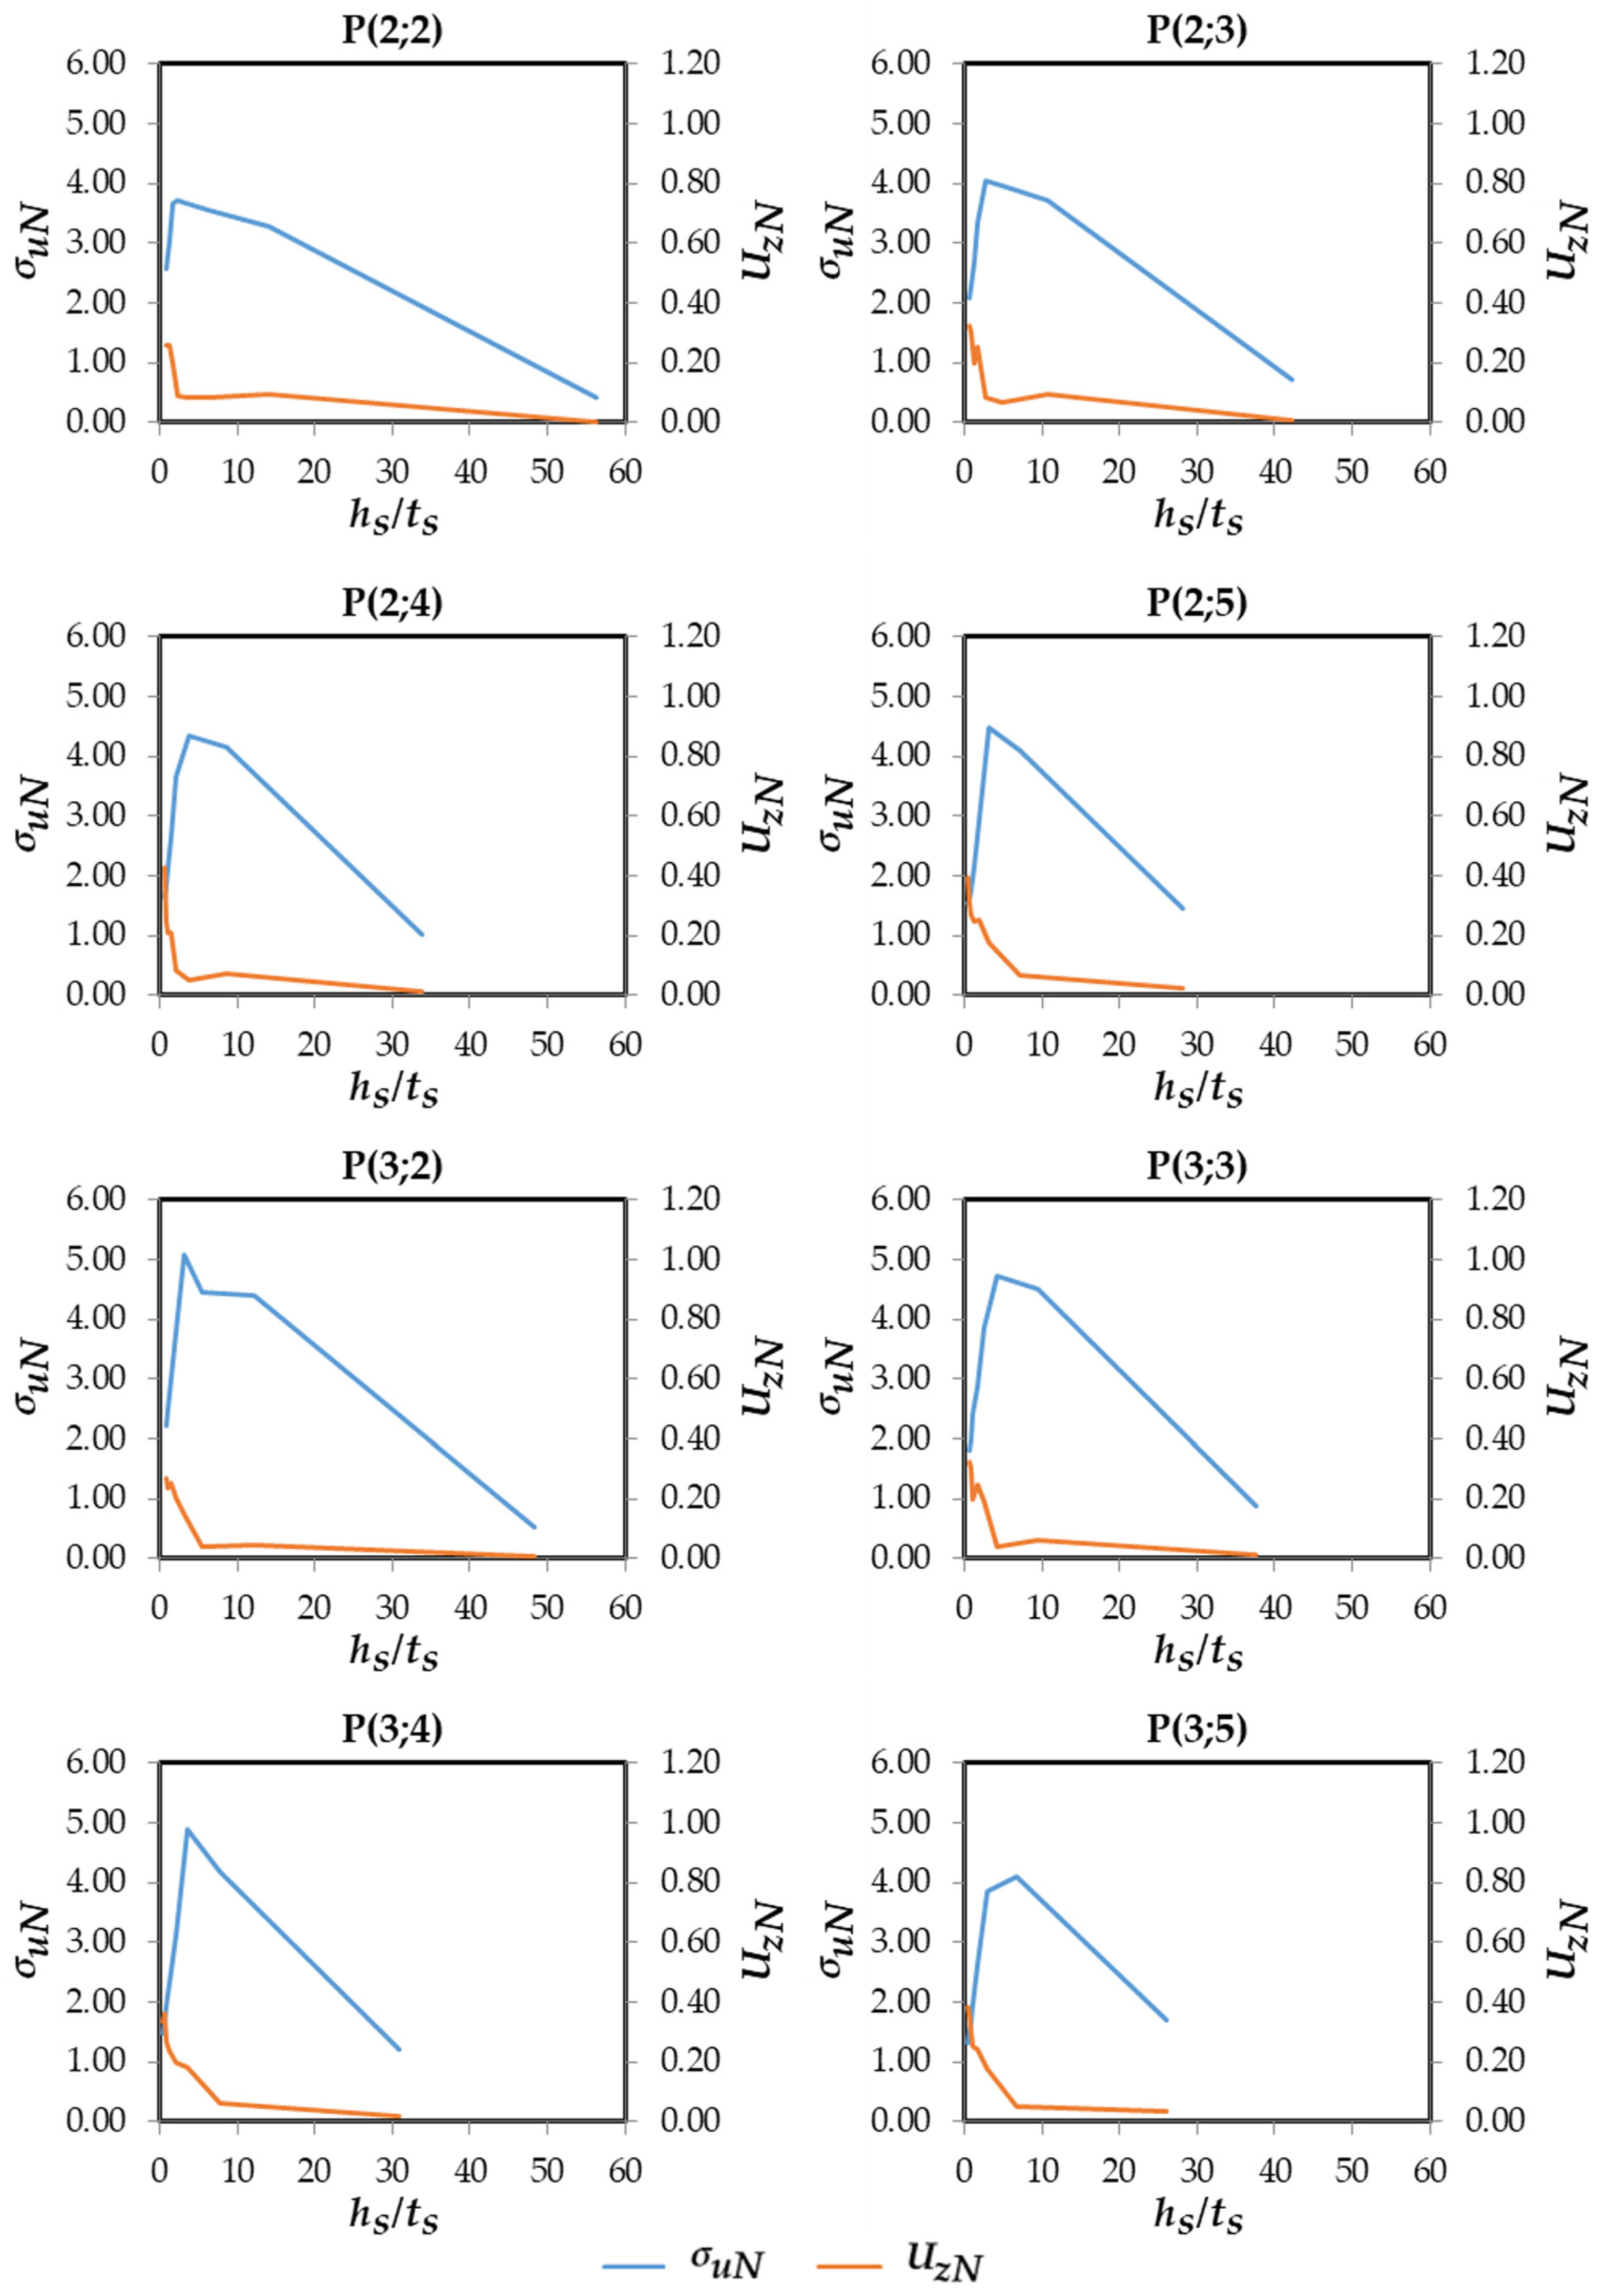
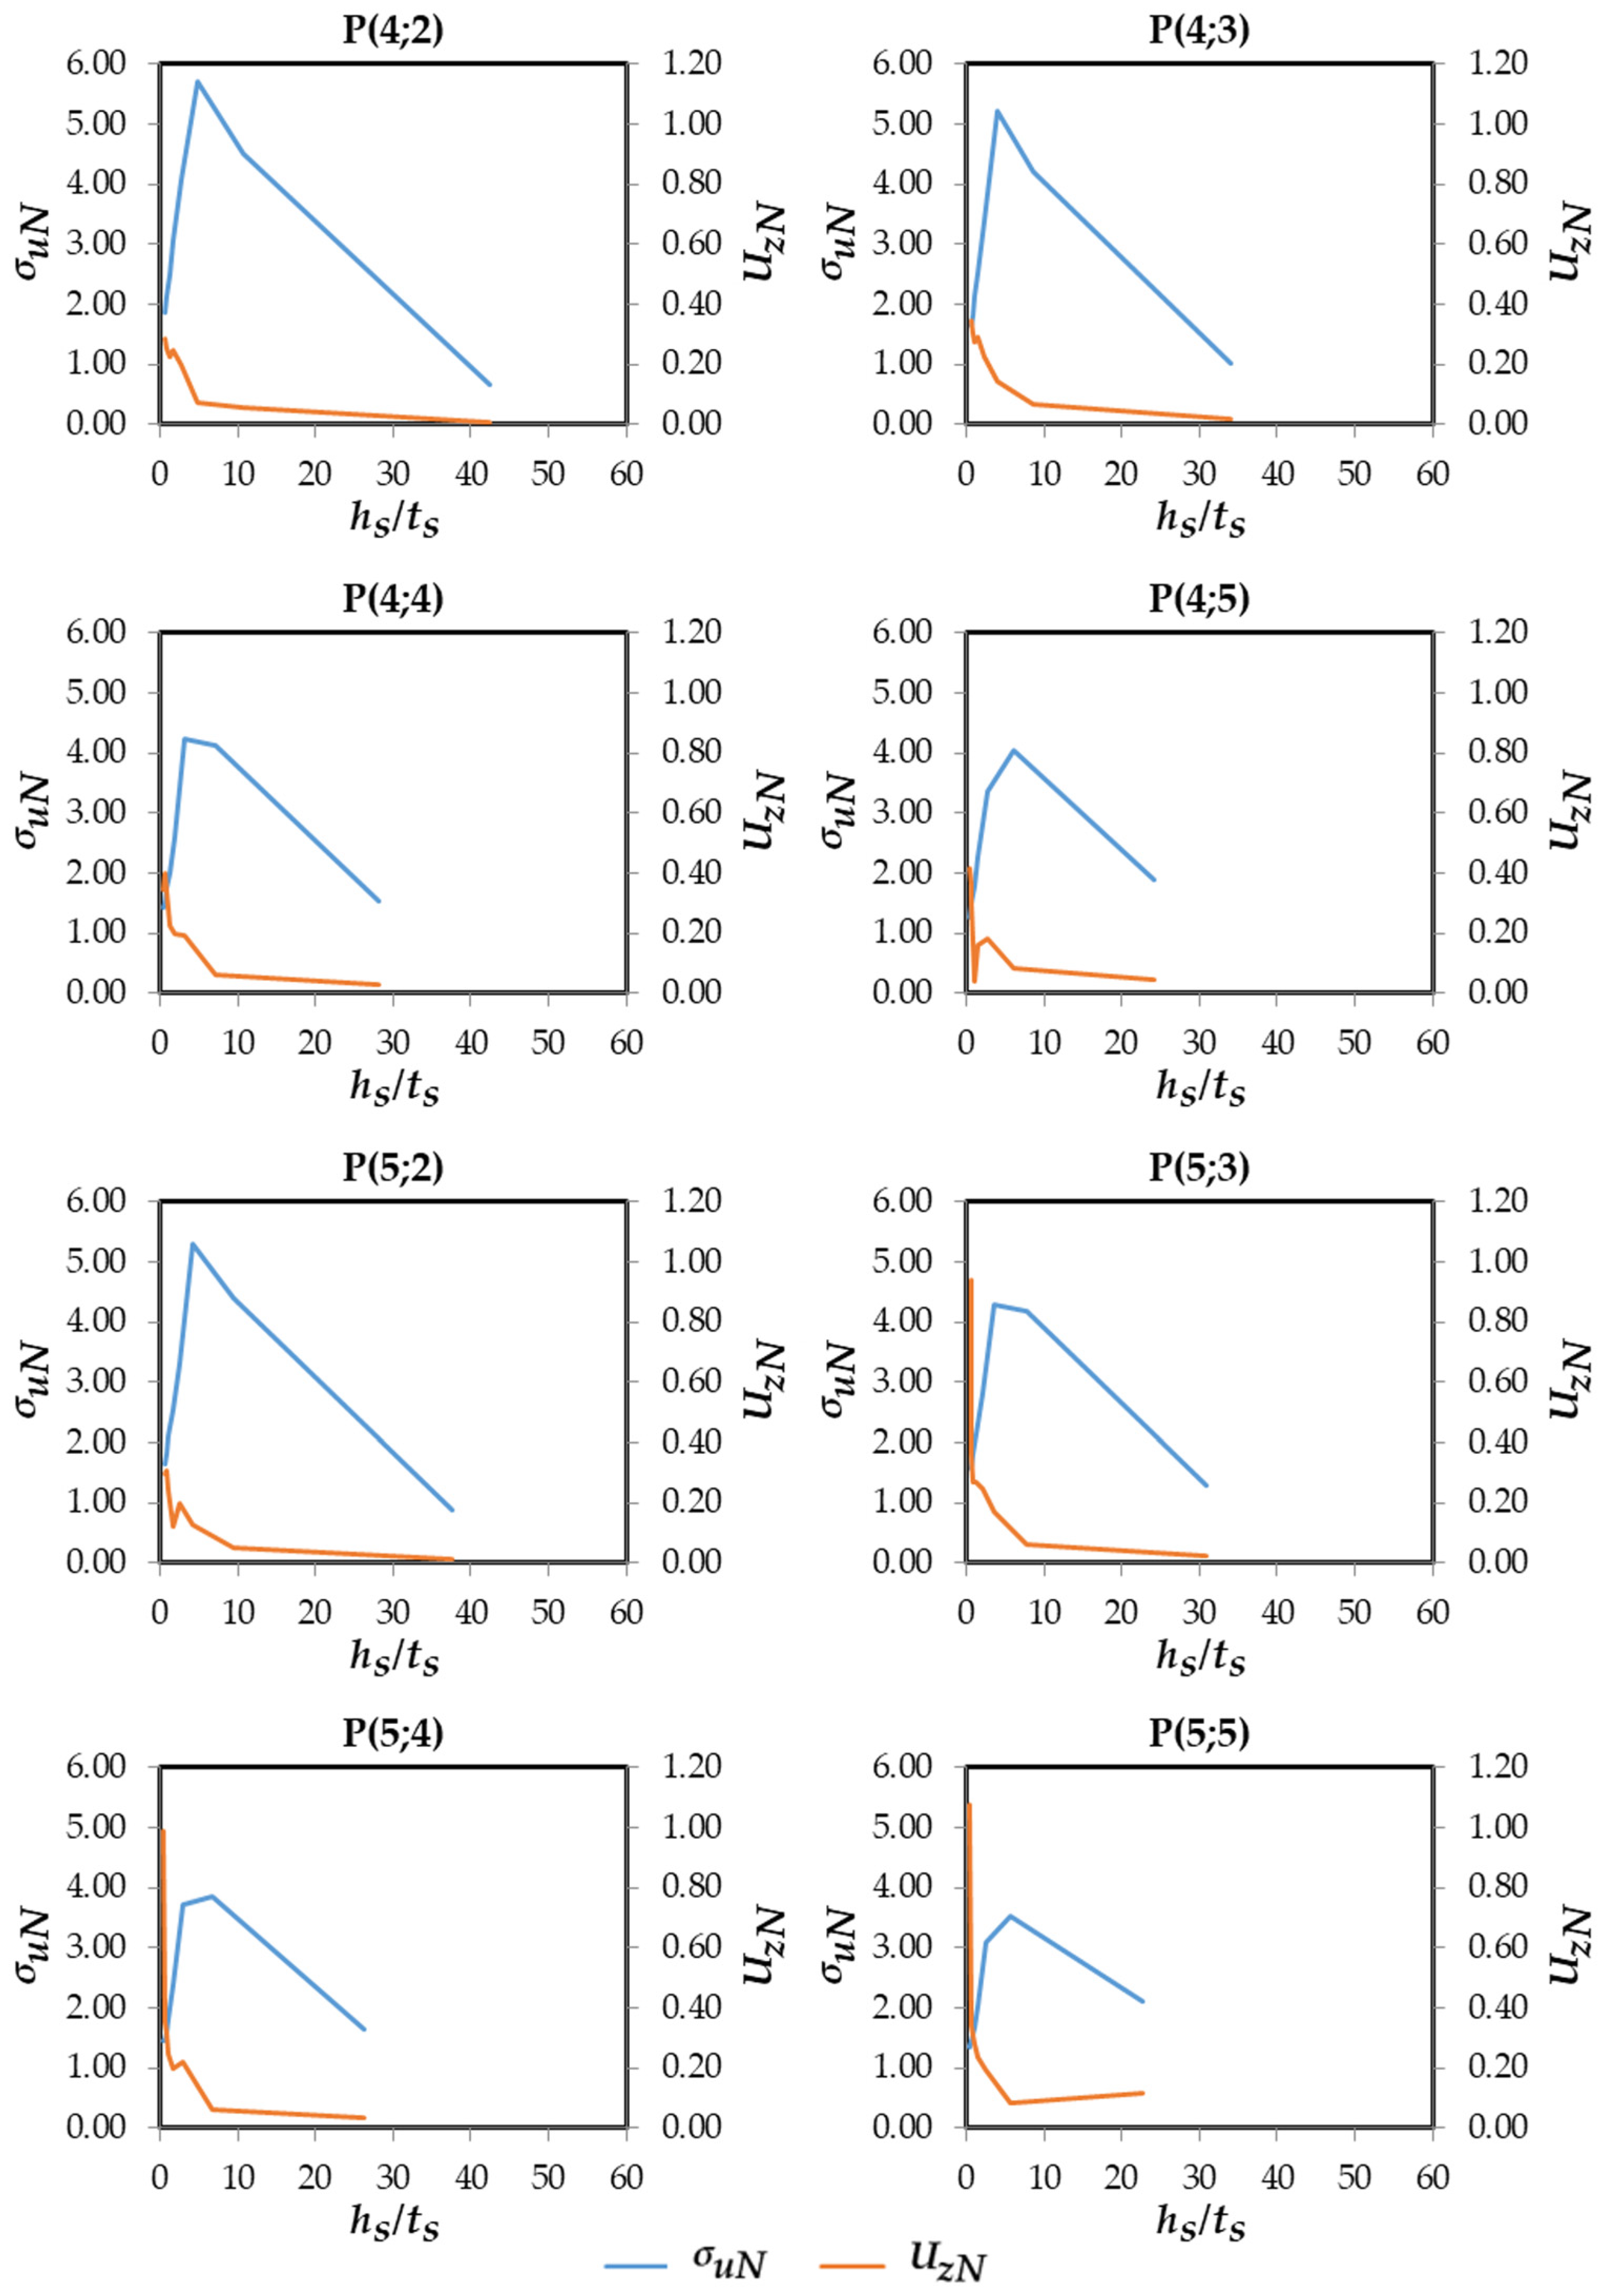
For the 128 different stiffened plates defined by the Constructal Design method, the influence of the ratio h s / t s , N ls , and N ts is evaluated concerning the σ uN and the U zN ; i.e., the effect of the variation in the DOFs on the performance indicators is evaluated. Figure 13 illustrates this influence for plates with N ls = 2 and N ls = 3, while Figure 14 presents the corresponding influence for plates with N ls = 4 and N ls = 5. A large number of curves were plotted to enable the identification of a consistent typical behavior regarding the relationship between the parameters investigated in this subsection.
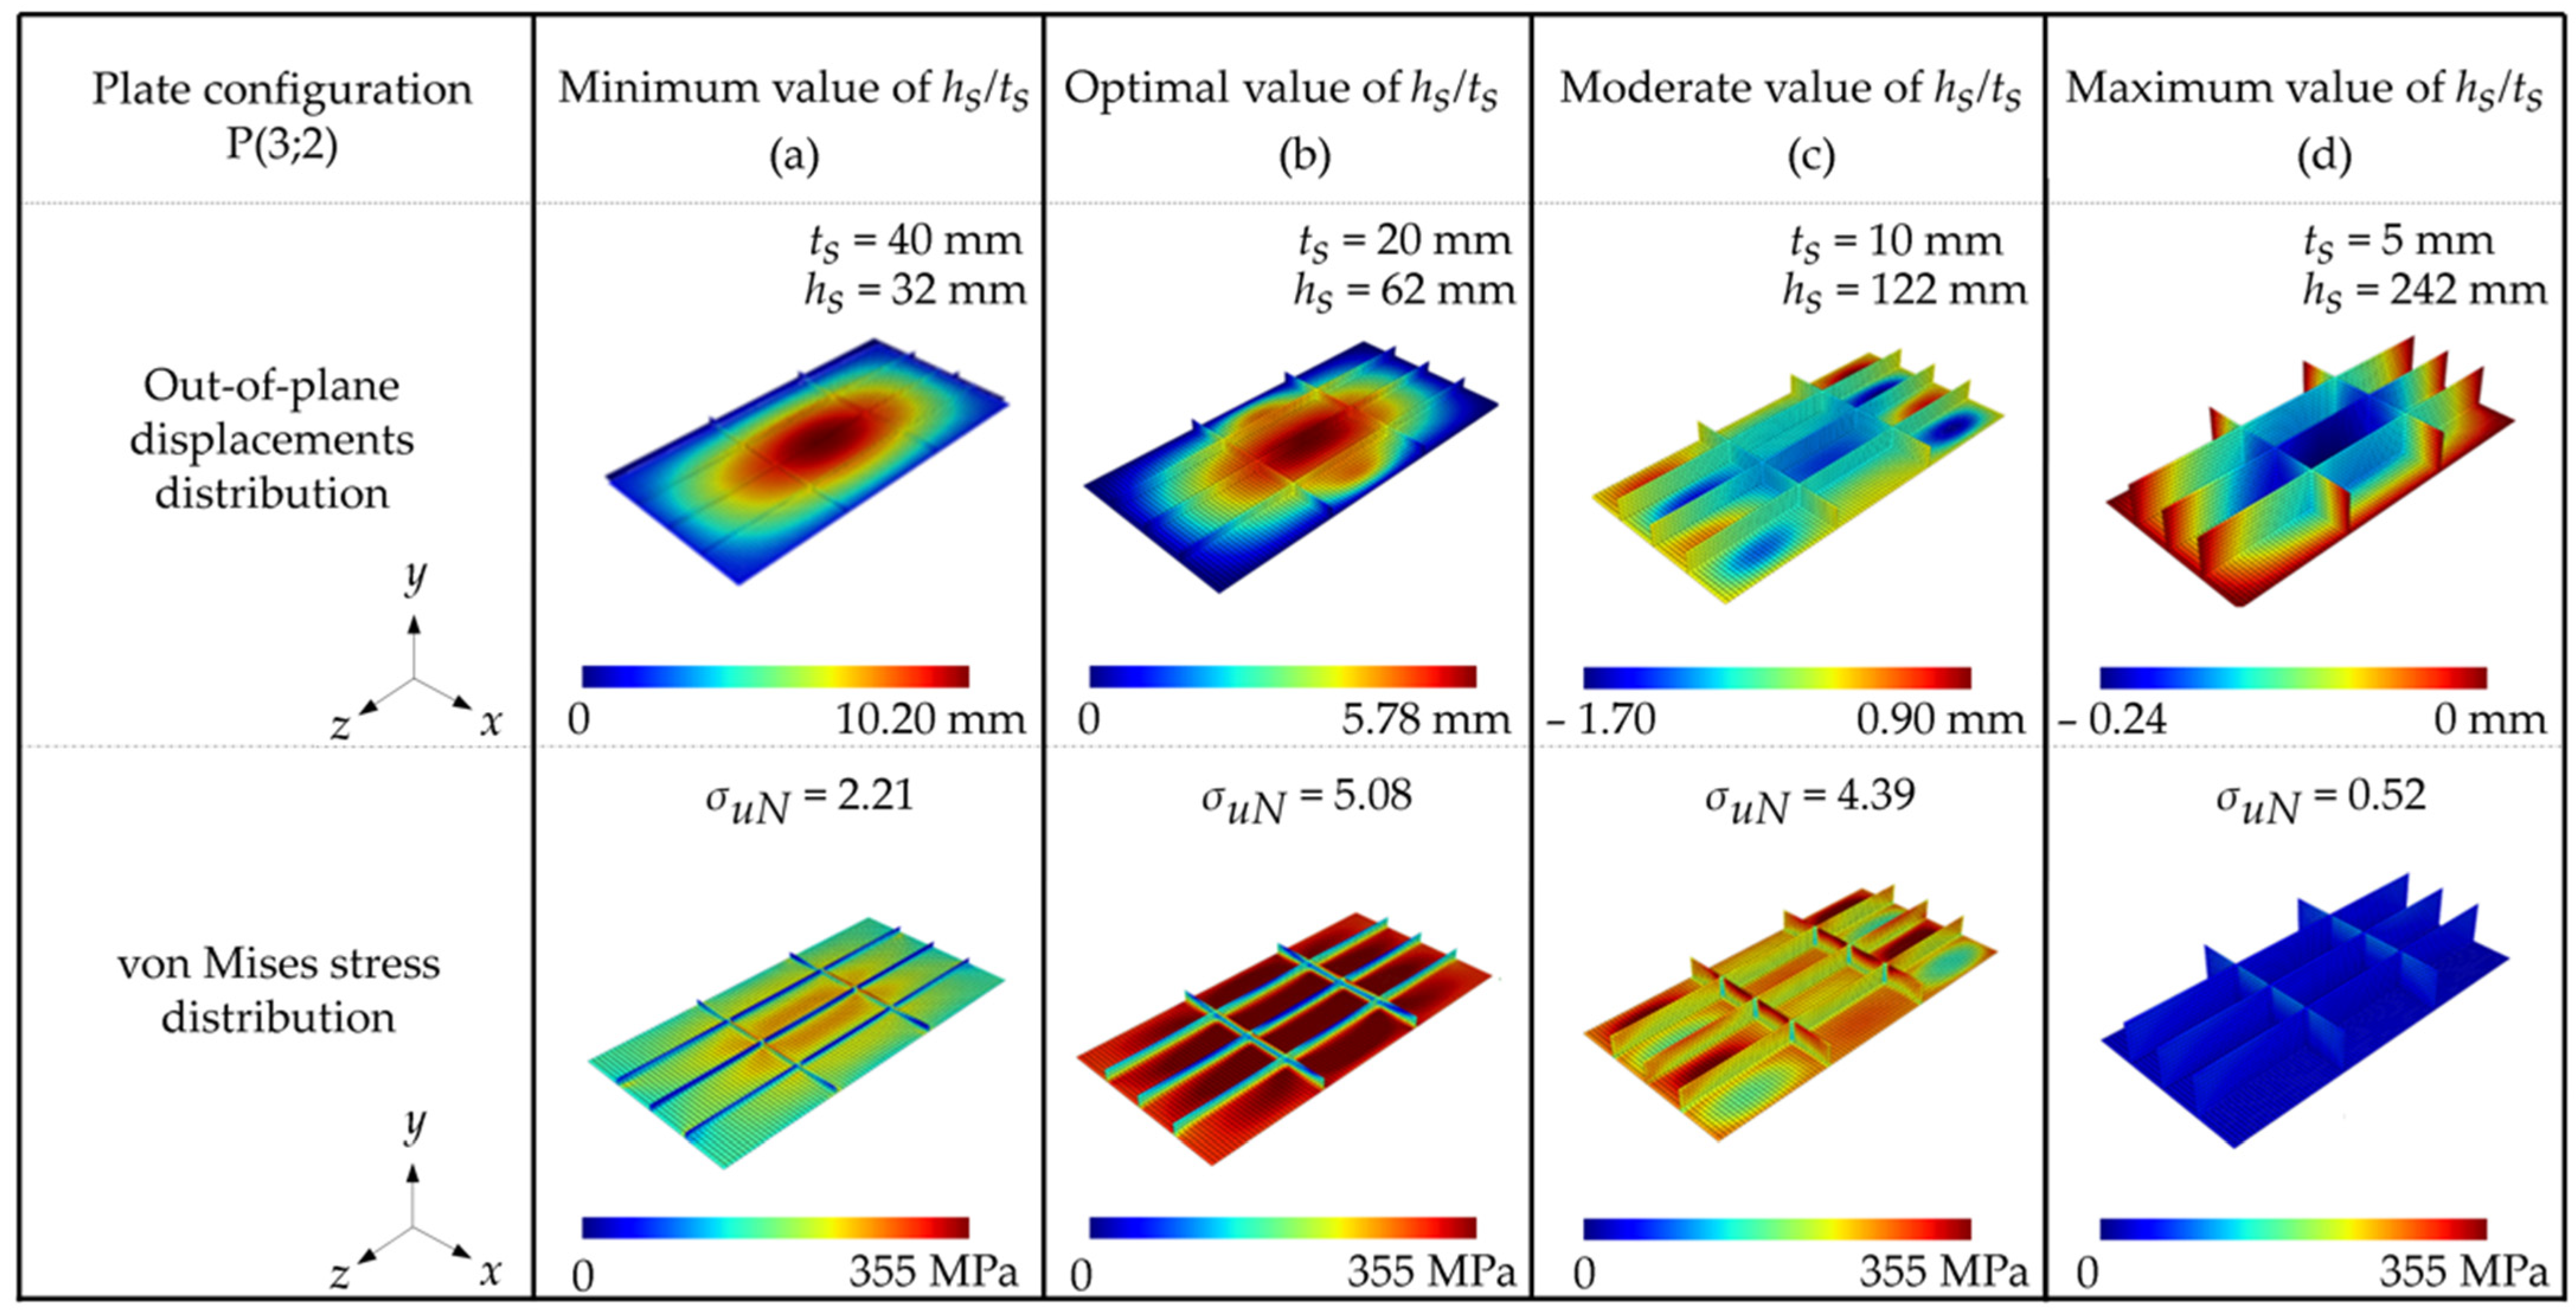
Regarding the σ uN , in several graphics in Figure 13 and Figure 14, it is observed that, for all stiffened plate geometries analyzed, very low values of the ratio h s / t s resulted in low values of σ uN . The same behavior is observed for very high values of this ratio. In all geometric configurations, the best performance in terms of stress occurred at intermediate values of h s / t s , with the best results occurring for values of t s between 15 and 20 mm. As h s / t s increased progressively from this optimal value, a decreasing trend in σ uN values are identified. To understand this behavior, plate P(3;2) is selected arbitrarily, and the minimum, optimal, moderate, and maximum values of h s / t s are selected to investigate the stress distributions and out-of-plane displacements. Figure 15 presents the behavior of stress distributions and out-of-plane displacements for P(3;2) with the increment of the h s / t s value.
Figure 15a illustrates that for the minimum value of the h s / t s ratio in the P(3;2) plate configuration, the volume conservation results in stiffeners with low height and large thickness. This geometric combination reduces moments of inertia, thereby providing limited structural reinforcement. As a result, the stiffeners contribute minimally to the overall stiffness of the system, and the structure remains predominantly governed by global buckling. The von Mises stress distribution shows high stress values concentrated in the majority of the plate, but it is also present in the stiffeners.
As the h s / t s ratio approaches its optimal value, Figure 15b shows a significantly improved distribution of out-of-plane displacements. The increased stiffener height enhances the overall structural stiffness, which not only reduces the typical concentration of displacements at the center of the plate and along the stiffeners (characteristic of global buckling) but also causes noticeable displacements redistributed symmetrically along the horizontal and vertical axes. This behavior change indicates the onset of local instability, confirming that the stiffened plate begins to exhibit local buckling characteristics. The von Mises stress distribution presents more red regions across the plate and stiffeners, indicating that the stress has been redistributed, occupying larger areas and reducing stress concentration.
For a moderate (higher) value of the h s / t s ratio, Figure 15c illustrates that the increased h s leads to a higher moment of inertia among the stiffeners. This behavior enhances their local stiffness, making them more resistant to out-of-plane displacements in the regions where they are located than to the rest of the plate. Consequently, displacements previously distributed between the stiffeners and the plate (as shown in Figure 15b, where blue areas indicate central displacement) become concentrated primarily in the unstiffened regions of the plate.
At the maximum h s / t s value for the P(3;2) configuration (Figure 15d), the load applied to the stiffeners resulted in displacements occurring in the opposite direction. This behavior is attributed to the elevated h s value, which significantly increased the bending moment induced by the applied load. Additionally, the stiffeners’ high slenderness promoted their lateral buckling. As a result, the von Mises stress distribution did not exhibit significant stress levels, indicating that the structure failed abruptly under relatively low loading conditions.
Regarding U z , in Figure 15, it can be inferred that their reduction does not necessarily imply an improvement in ultimate buckling stress; rather, it is closely related to the buckling mode that develops. When comparing the different cases, it is evident that the minimum h s / t s ratio (Figure 15a) leads to global buckling, characterized by the highest U z and lowest σ uN . As the h s / t s ratio increases to the optimal value (Figure 15b), buckling mode transitions from global to local buckling. This transition is accompanied by a redistribution of displacements, reducing the maximum displacement value and resulting in the highest σ uN .
However, when the h s / t s ratio is increased beyond the optimal point (Figure 15c), displacements, which are previously concentrated in the center of the plate and along the stiffeners, become more widely distributed across various regions of the plate. This redistribution leads to premature local buckling, resulting in lower ultimate buckling stress than that obtained at the optimal ratio. Therefore, even though the maximum U z continues to decrease, structural performance in buckling resistance also diminishes.
These findings help explain the trends observed in the σ uN and U z curves shown in Figure 13 and Figure 14. At lower h s / t s values, global buckling dominates, with high displacement levels and low σ uN . As the h s / t s ratio increases, an optimal value is reached, marked by redistributed displacements and improved structural performance (lower U z , higher σ uN ). When the h s / t s ratio exceeds this optimal point, U z continues to decrease, but σ uN also declines.
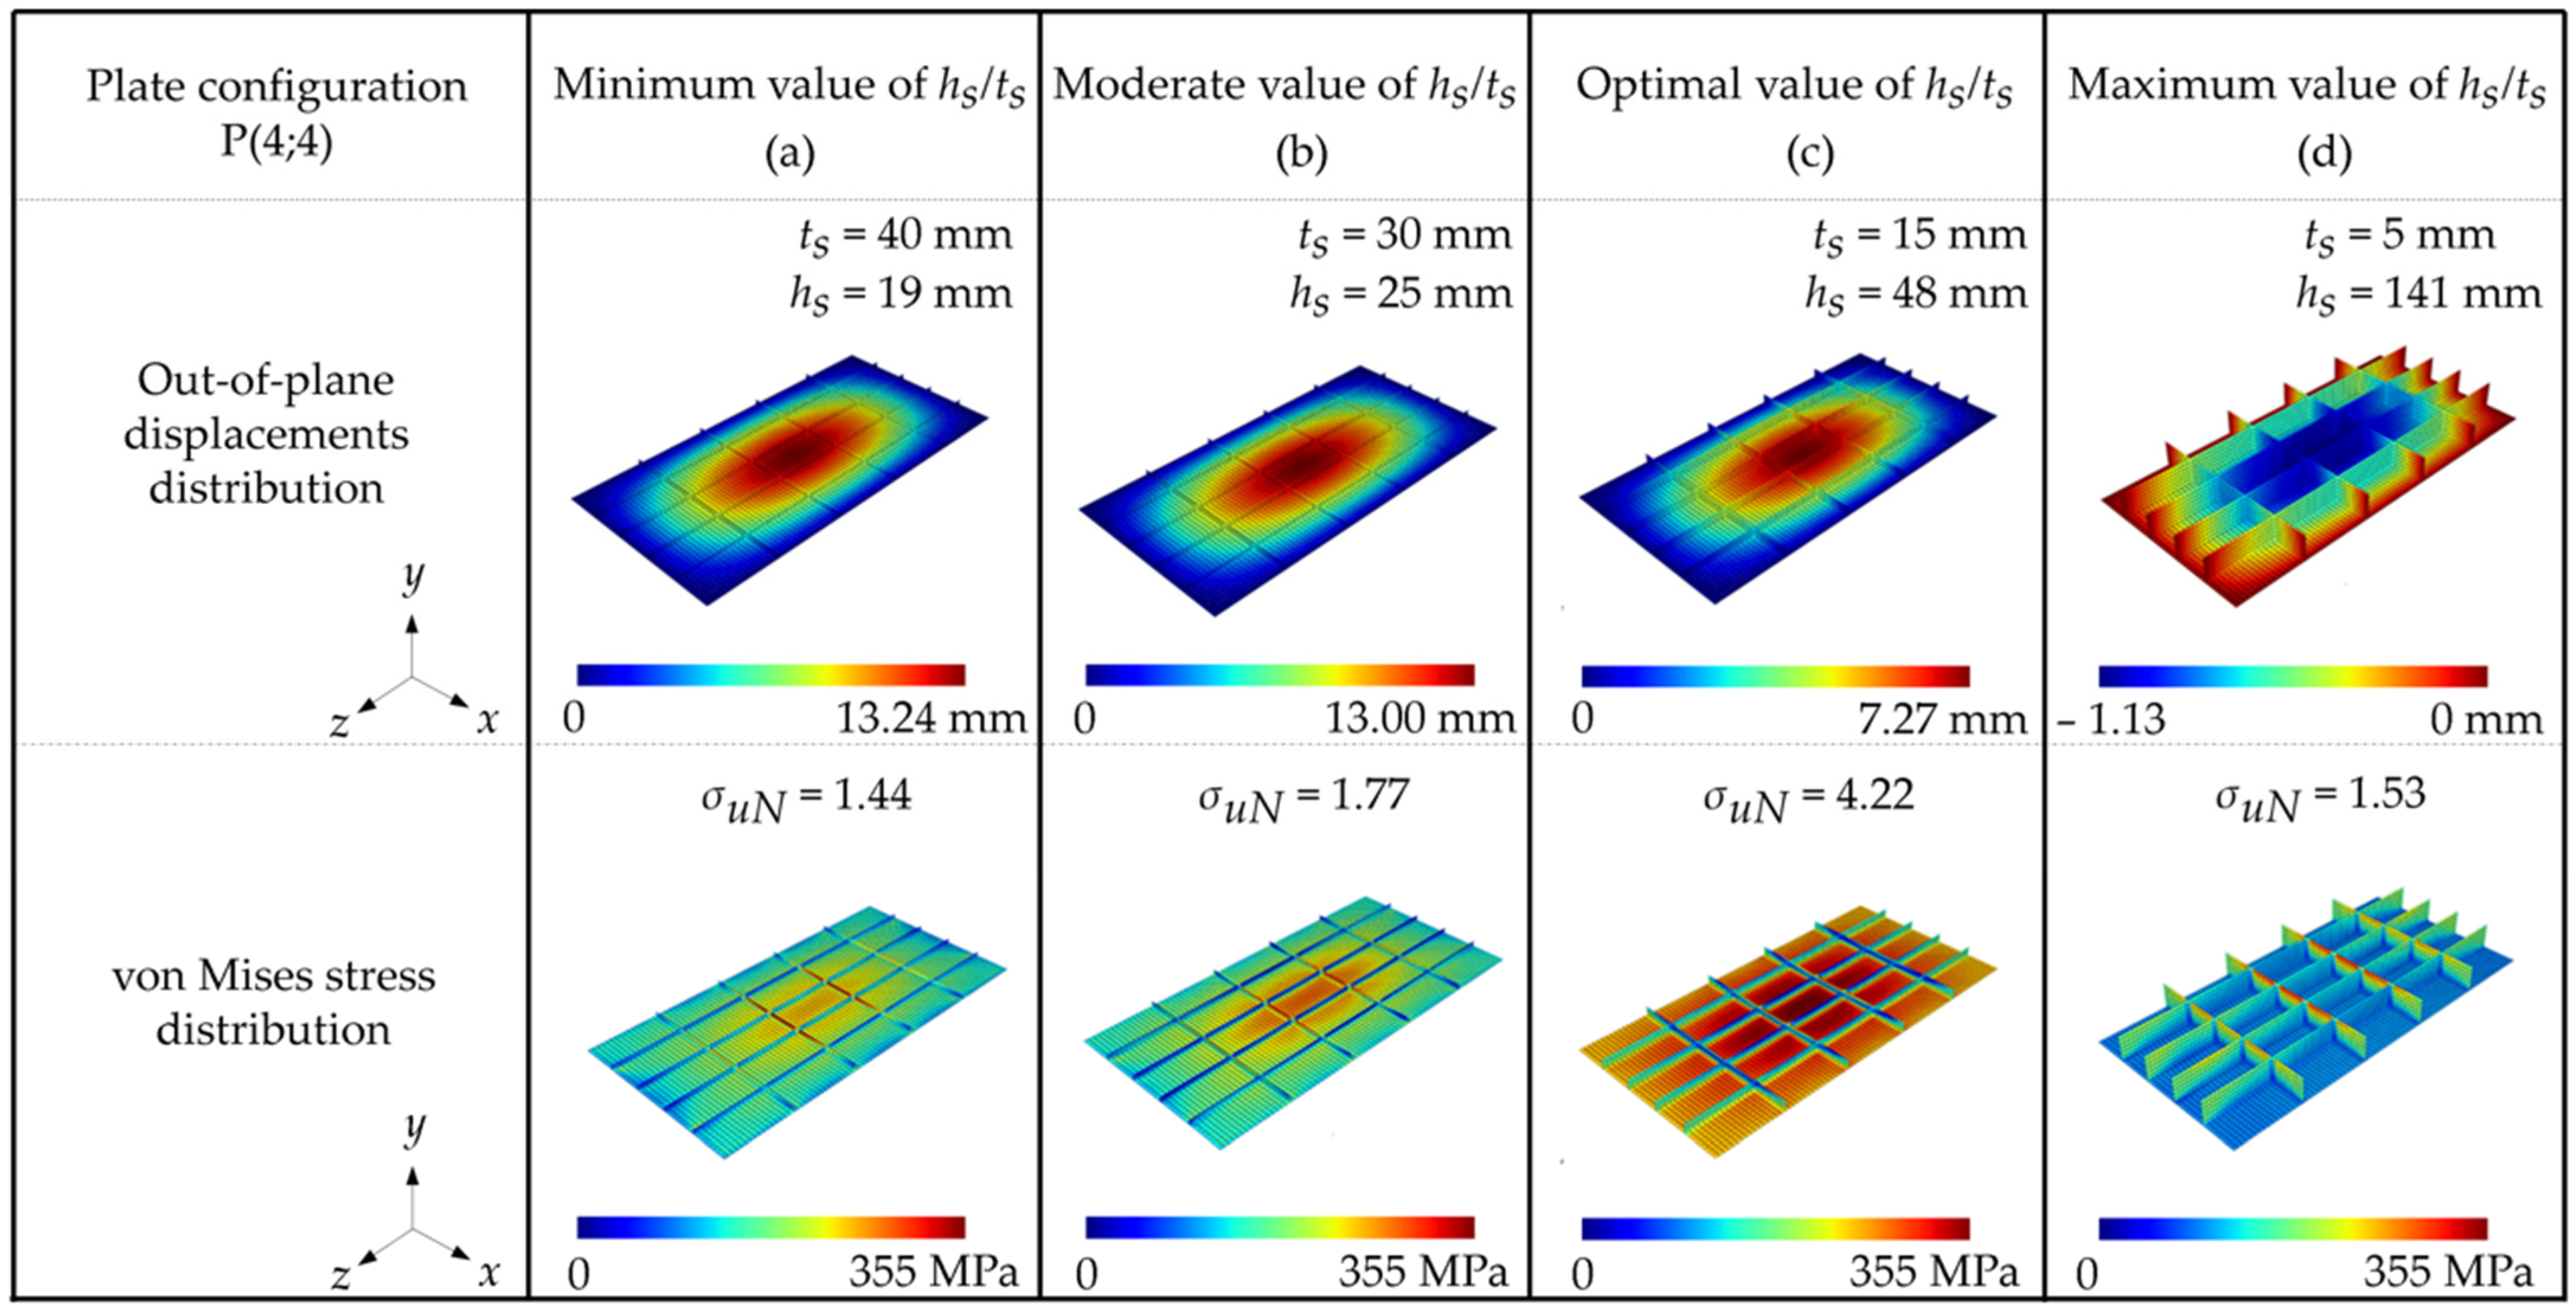
Regarding N ls and N ts , increasing these values reduces the minimum and maximum allowable values of the h s / t s ratio. As illustrated in Figure 15a, lower h s / t s ratios generally result in global buckling. Nevertheless, across all plate configurations P( N ls ; N ts ) and h s / t s values, the minimum h s / t s consistently resulted in global buckling for all plate configurations. Additionally, depending on the specific values of N ls and N ts , increasing the h s / t s ratio beyond the minimum could either induce a transition to local buckling (at higher h s / t s values) or sustain global buckling behavior, as shown in Figure 16, taken at P(4;4) as an investigation example.
As observed in the plates with lower N ls and N ts values (see Figure 15), the maximum value of σ u N is achieved with an optimized h s / t s ratio corresponding to the most efficient stress distribution (Figure 16c). In contrast, Figure 16a shows that, due to the low h s / t s ratio, stresses are highly concentrated in the stiffeners. As the h s / t s ratio increases, the stiffeners contribute more significantly to the overall stiffness of the plate-stiffeners system. When this ratio reaches its optimal value, a more uniform stress distribution is achieved, with both the plate and the lower regions of the stiffeners sustaining stress levels close to the yield strength. The plates P(4;4), which had the highest h s / t s ratio, also exhibited an inverse displacement direction. This behavior is attributed to the influence of the high h s value, which significantly affects the resulting moment generated by the load acting on the stiffeners. Additionally, the higher values of N ls and N ts contribute to a more effective distribution of this moment over a larger plate area.
In agreement with Bejan and Lorente [53], flow systems naturally exhibit imperfections, which cannot be eliminated but redistributed to promote efficient flow. By utilizing Constructal Design, it becomes possible to develop improved configurations and more effective strategies for generating geometries that enable an optimal distribution of these imperfections. Besides that, structural engineering systems can be interpreted as flow systems that evolve and adapt their shapes to facilitate the flow of stress. While it may seem unconventional to regard stress as a flow, this perspective proves valuable when determining the most effective geometric configuration of structural components under load. Within the framework of material mechanics, imperfections are associated with areas of increased stress concentrations. Thus, improved structural performance is achieved when these peak stresses are distributed more uniformly across the available material. Based on Figure 15 and Figure 16, and the constructal principle of optimal distribution of imperfections [54,55], one can infer that the optimized geometries promote a more uniform distribution throughout the structure. In the context of stress flow, this implies that the most efficient structural geometries allow for a more even distribution of stress, enabling more regions of the stiffened plate to reach the stress limit, enhancing the overall mechanical performance. Notably, this trend—where optimized geometric configurations of steel plates under elasto-plastic buckling exhibit a greater amount of regions reaching the limit stress—is also identified in the studies by Lima et al. [12], Lima et al. [13], and Vieira et al. [8].

3.7. Highest and Lowest Values of   h s / t s , N ls , and N ts over σ uN

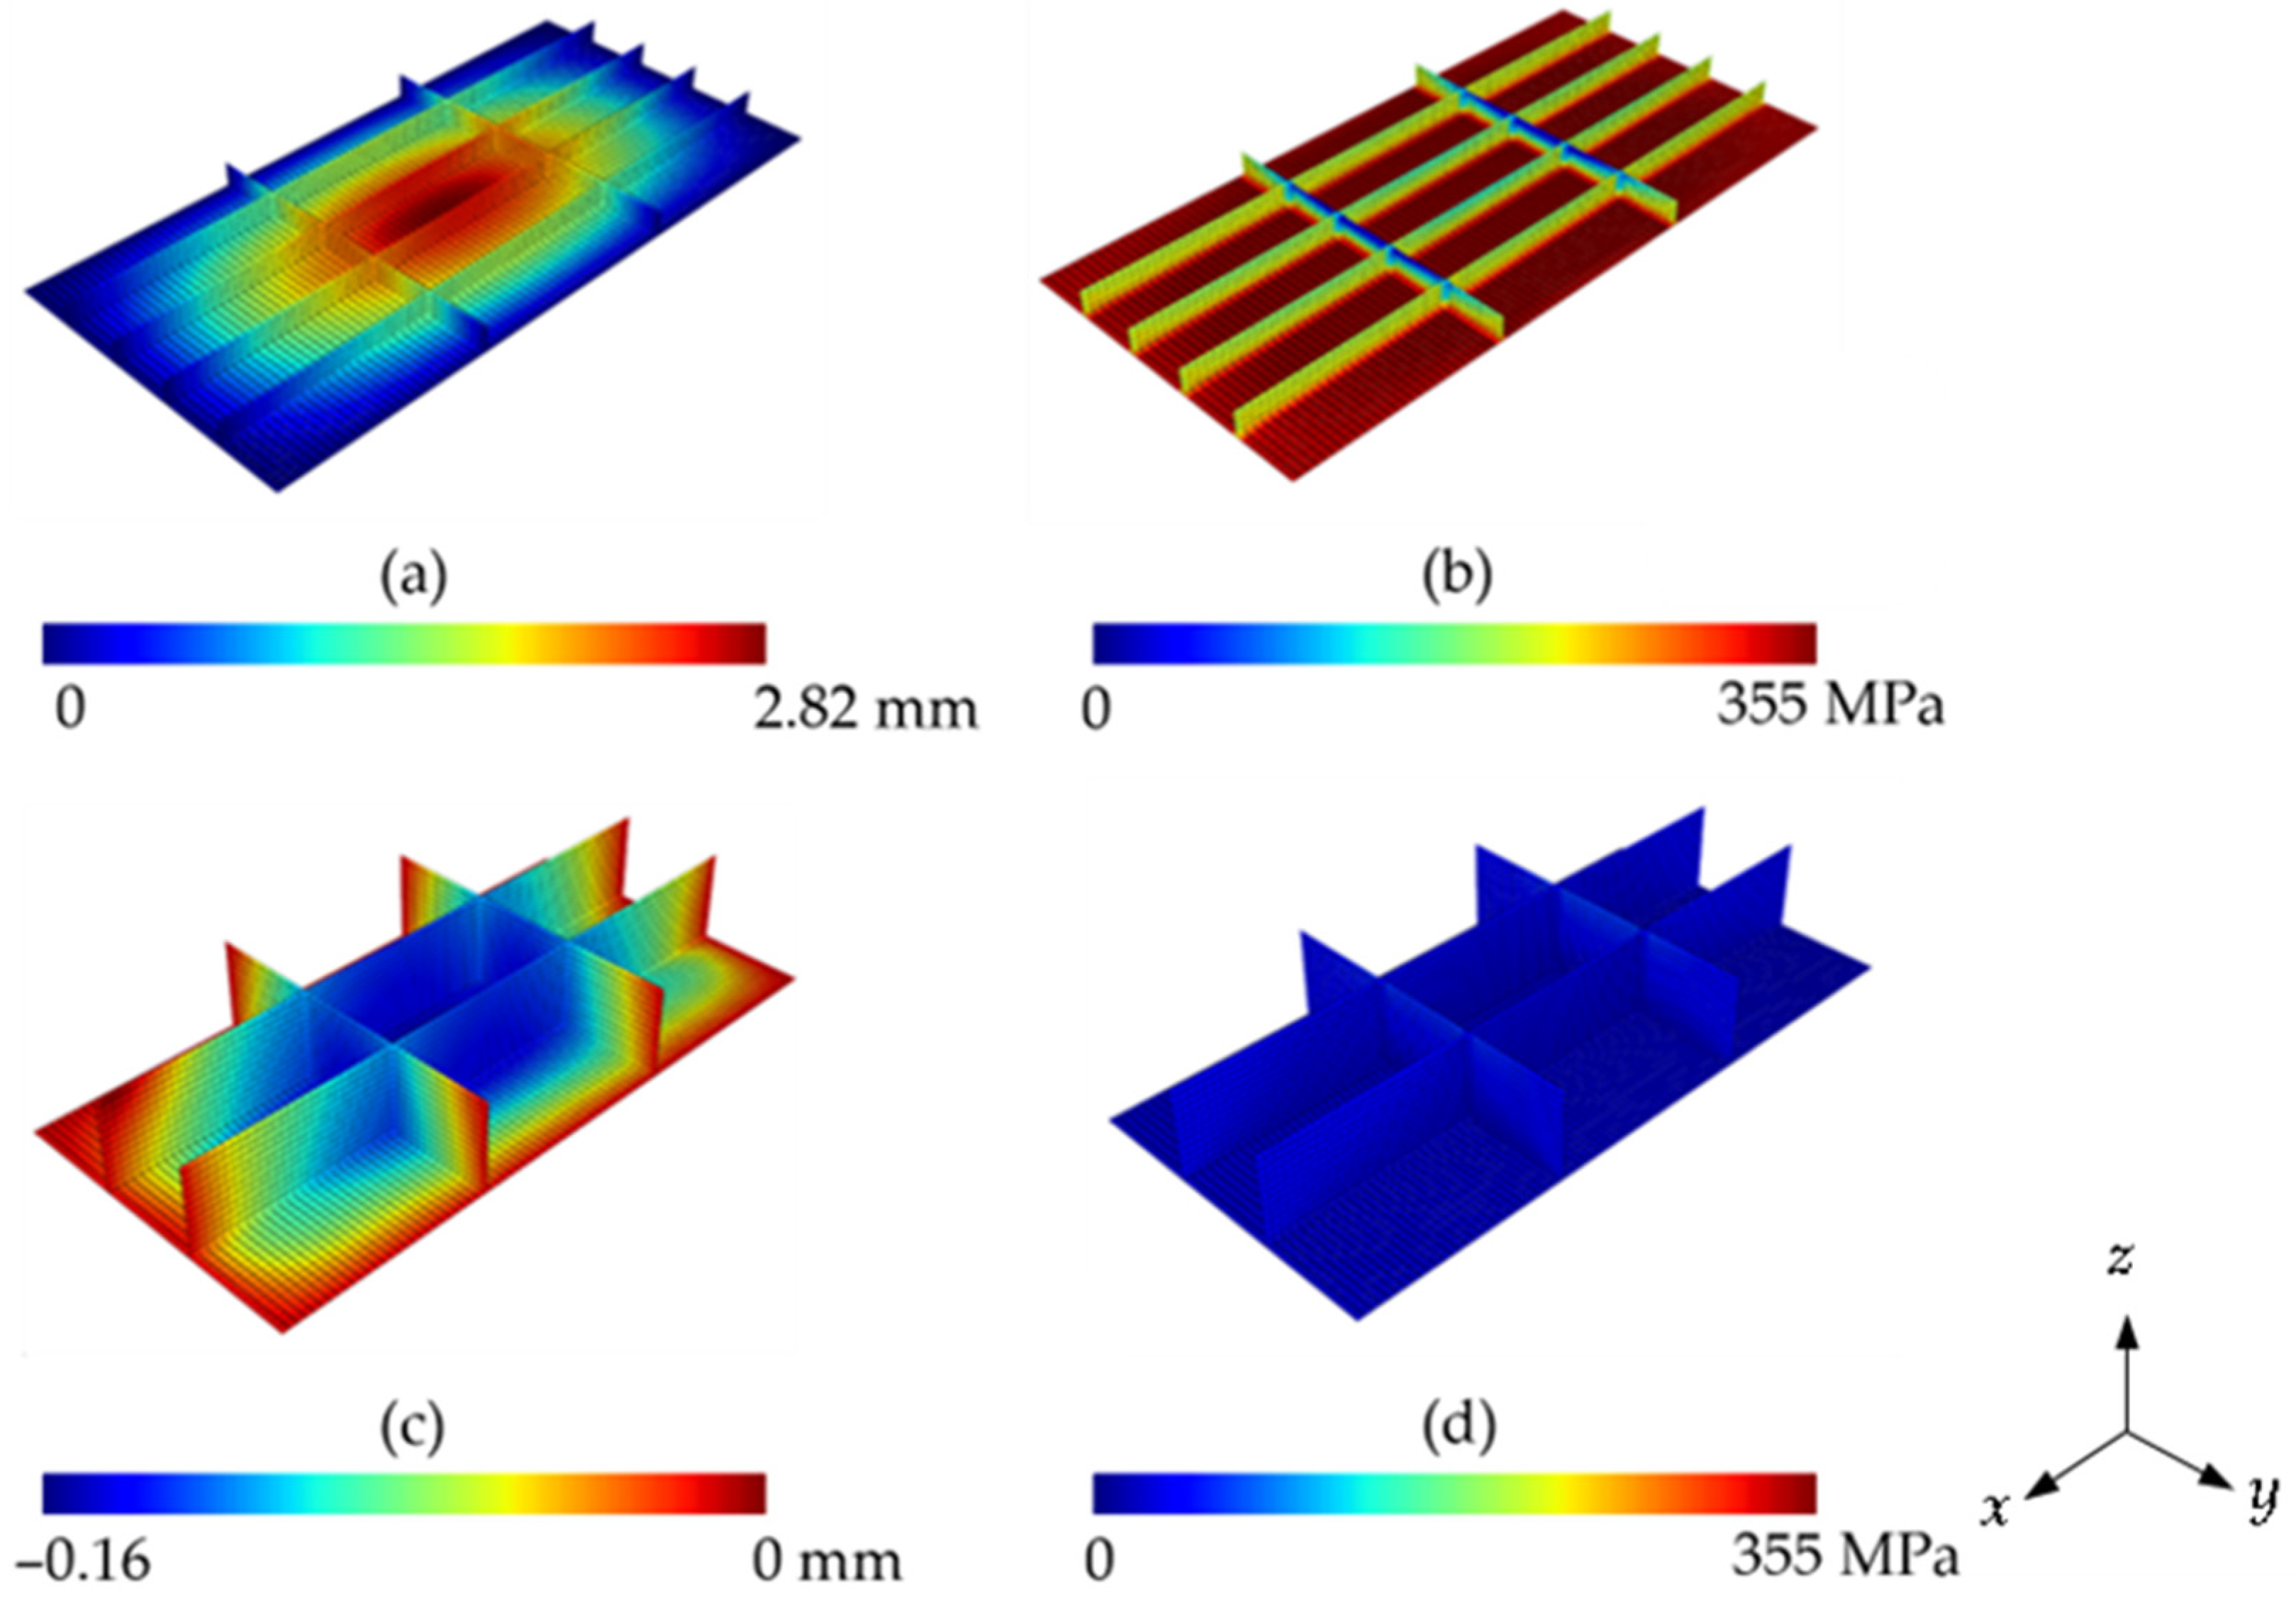
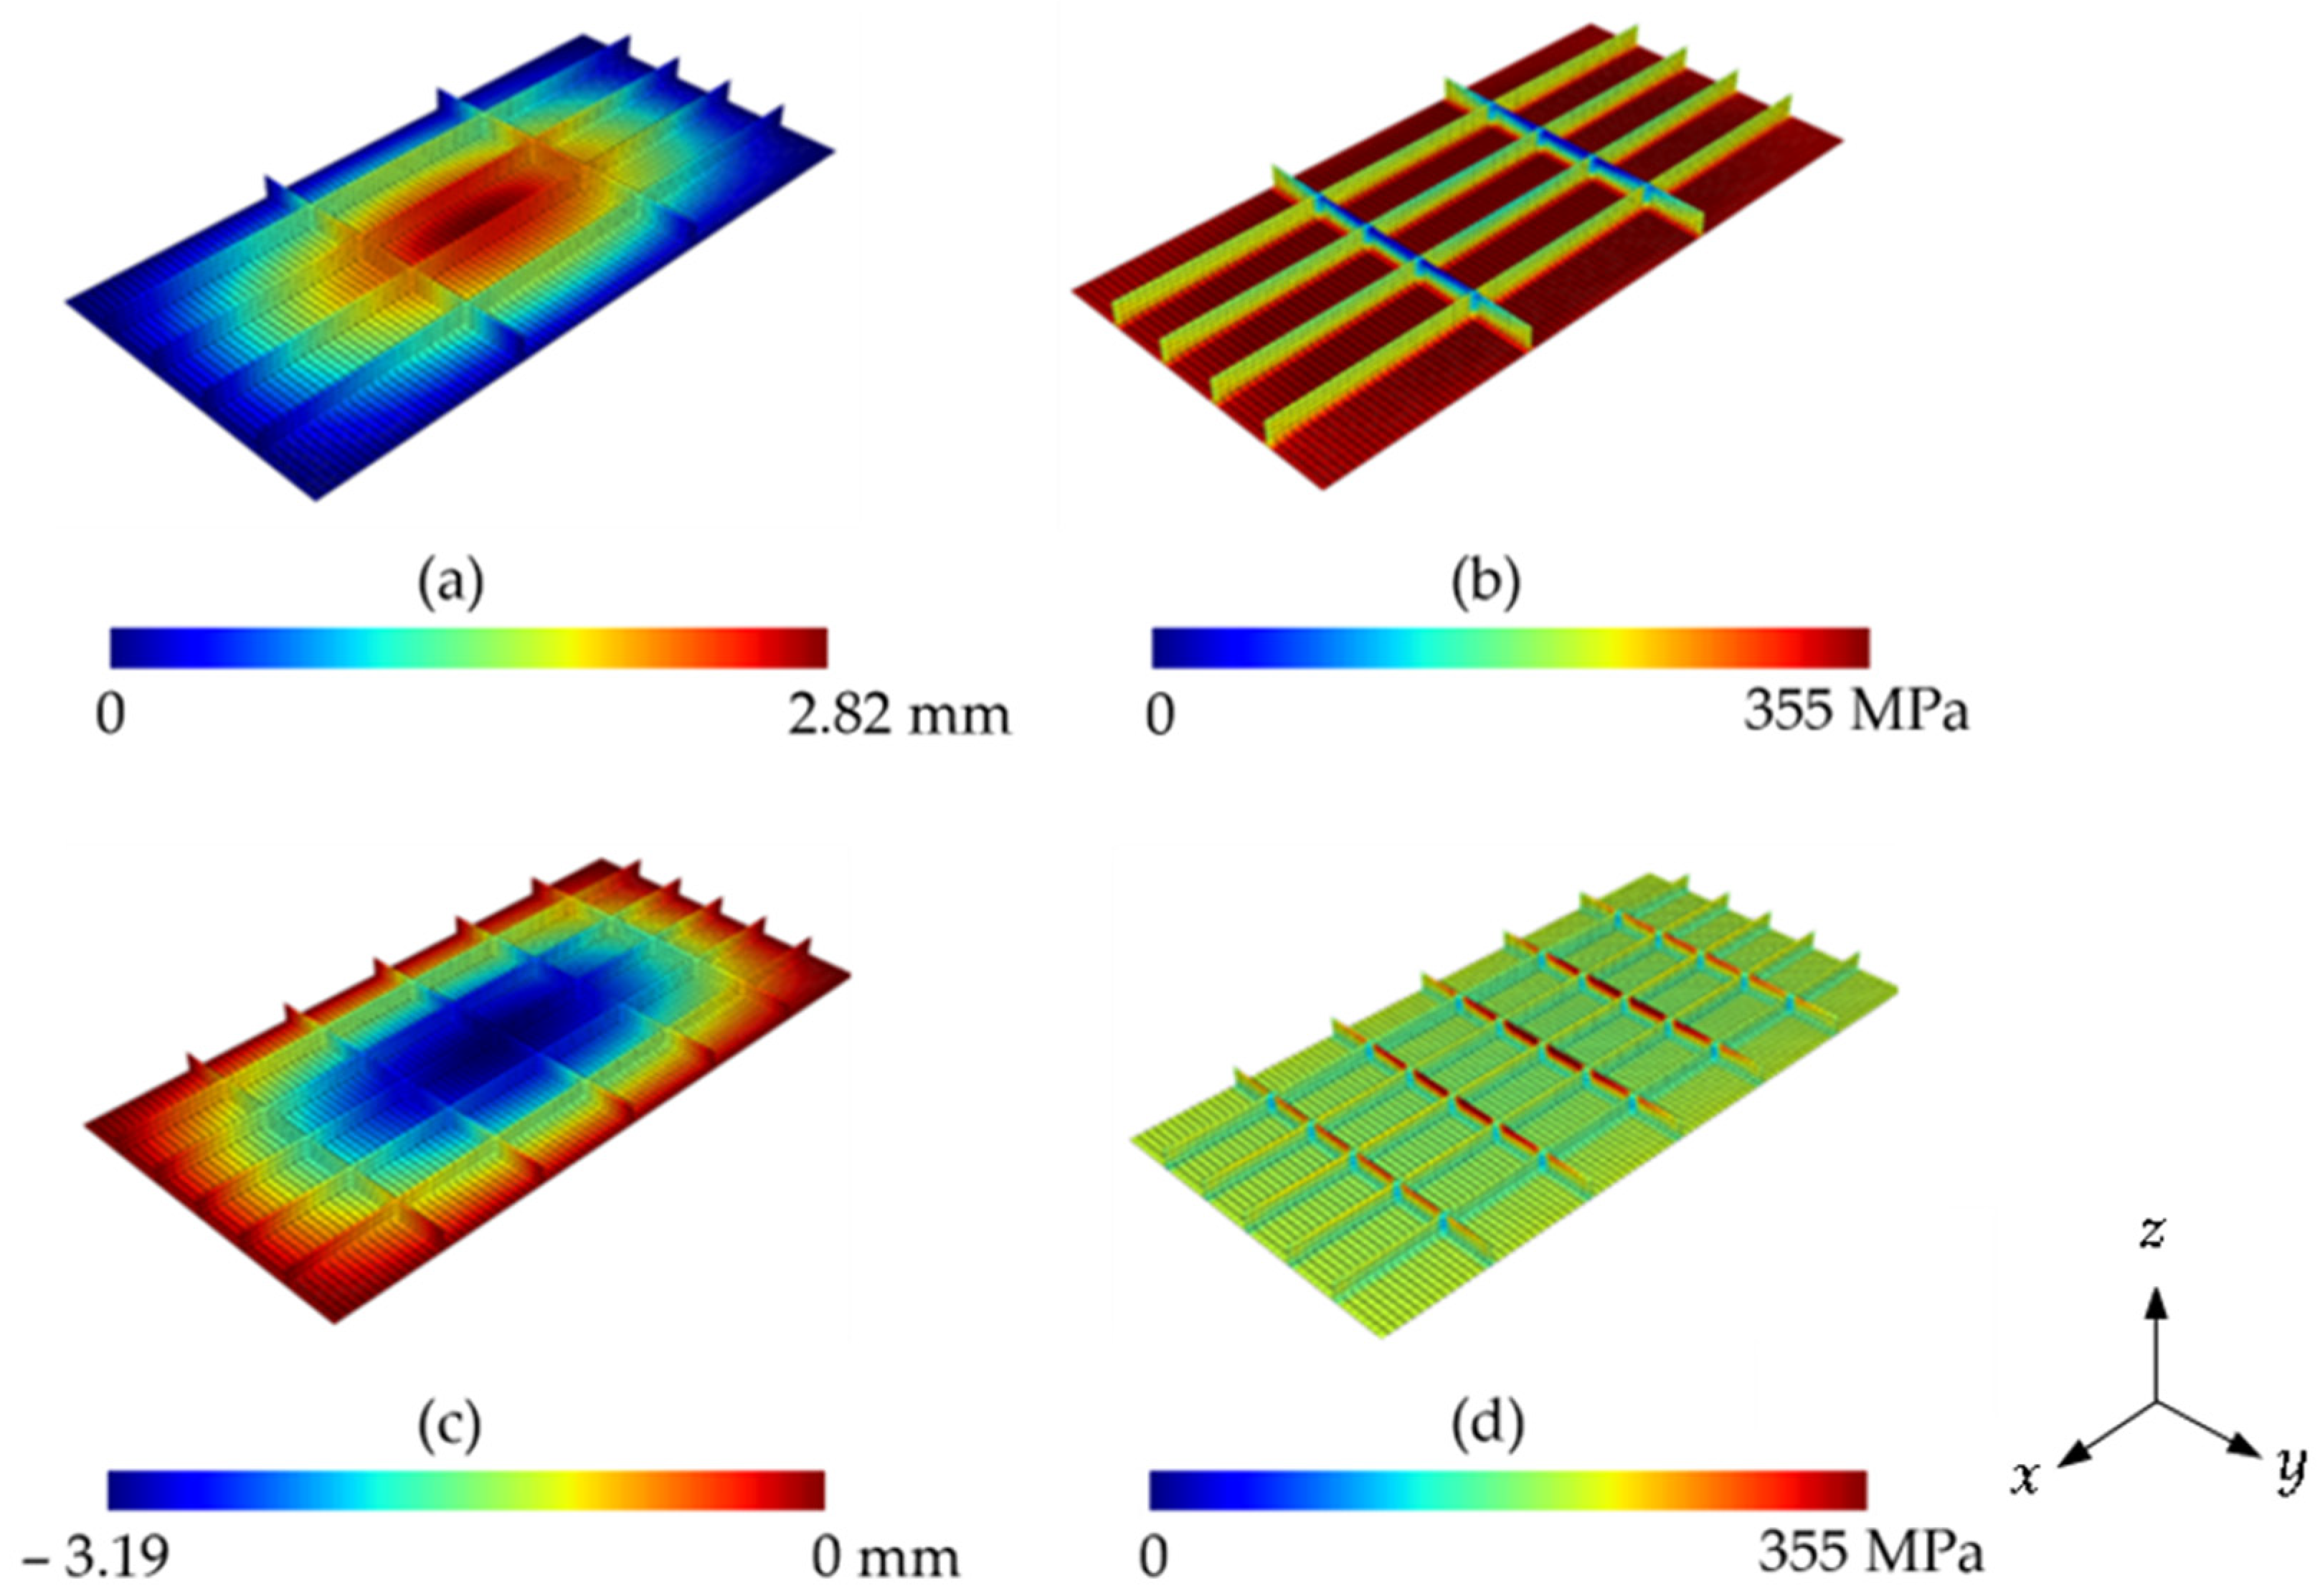
The highest σ uN value observed is 5.72, occurring in the P(4;2) configuration with an h s / t s ratio of 4.80. In contrast, the lowest σ uN value, 0.43, is obtained for the P(2;2) configuration with h s / t s equal to 56.20. These extremes correspond to a 472% increase and a 57% decrease relative to the reference stress σ uR . The corresponding out-of-plane displacement distribution and von Mises stress distributions for these two configurations are illustrated in Figure 17.
The out-of-plane displacements (see Figure 17a) are uniformly distributed across the global structure in the optimal plate configuration. The von Mises stress (illustrated in Figure 17b) is also effectively balanced among the structural elements, with values close to the yield stress in the plate and the stiffeners. Conversely, the least effective plate configuration features the highest h s / t s ratio (shown in Figure 17c,d), resulting in excessive slenderness. This condition leads to failure due to lateral buckling of the stiffeners under relatively low loads.

3.8. Influence of N ls and N ts over Once Optimized ( h s / t s ) o and Once Maximized ( σ uN ) m

Based on the σ uN values corresponding to each h s / t s ratio within the different plate configurations (see Figure 13 and Figure 14), the ( σ uN ) m and its associated ( h s / t s ) o are determined, as presented in Table 10.
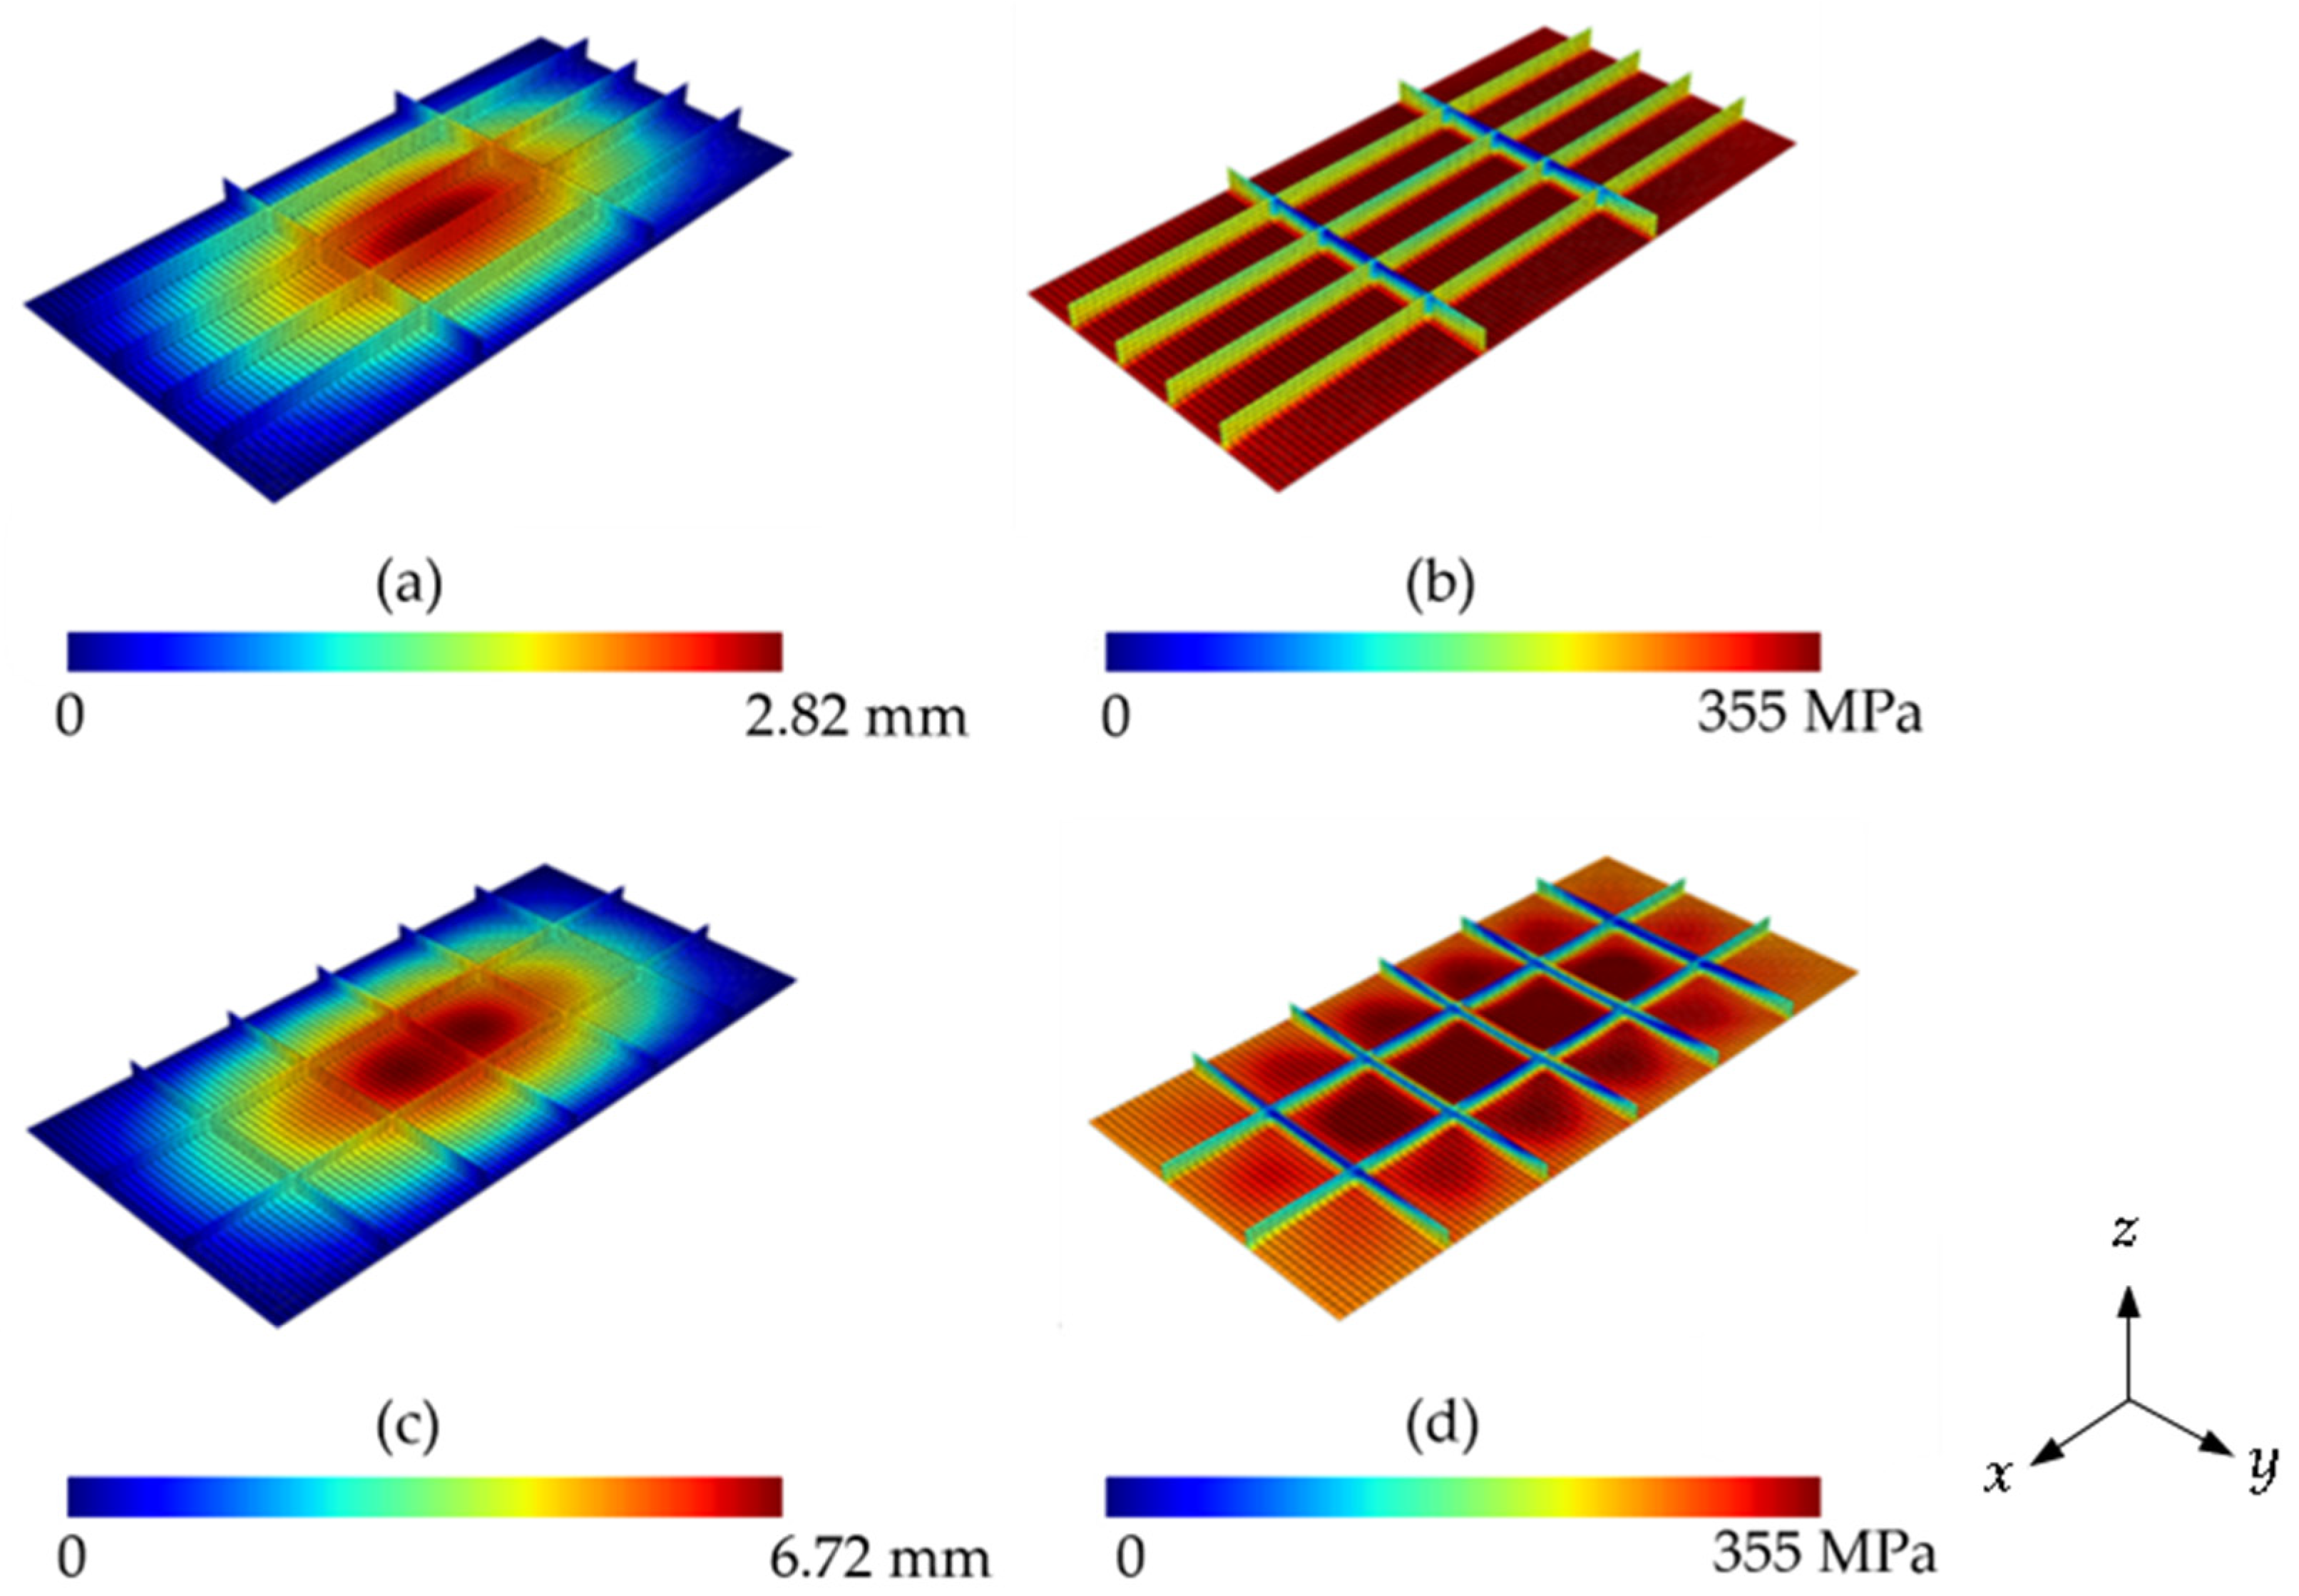
According to Table 10, the maximum value of ( σ uN ) m is 5.72, observed in the P(4;2) configuration with an ( h s / t s ) o ratio of 4.80. In contrast, the lowest performance is recorded for the P(5;5) configuration, which reached a ( σ uN ) m of 3.51 at an ( h s / t s ) o ratio of 5.70. These results correspond to improvements of 472% and 251% over σ uR , respectively. The corresponding out-of-plane displacement and von Mises stress distributions for both configurations are illustrated in Figure 18.
Comparing the displacement distributions of the best-performing plate configuration in terms of ( σ uN ) m (see Figure 18a) with the worst-performing one (see Figure 18c), the latter exhibits a predominant concentration of out-of-plane displacements at the center of the stiffened plate. This behavior indicates a less efficient structural response than the configuration with the highest ( σ uN ) m , where displacements are more evenly distributed. Regarding stress distribution, the better-performing plate (Figure 18b) also shows greater participation of the plate itself in stress, resulting in more uniform stress distribution and, consequently, reducing stress concentrations if compared with the P(5;5) plate (see Figure 18d). The influence of N ls and N ts over ( h s / t s ) o and ( σ uN ) m from Table 10 is shown in Figure 19.
Figure 19a shows that, except for the configuration with N ls = 2, there is a general trend of decreasing ( σ uN ) m as N ts increases. This behavior can be attributed to the reduction in the h s / t s ratio that results from adding more N ls and N ts , as previously discussed. In the case of plates with N ls = 2, however, the increase in N ts appears beneficial. Due to the low N ls value, the resulting h s / t s values are relatively high, which is illustrated in Figure 17d, leading to lateral buckling of the stiffeners and ultimately the worst performance in terms of σ uN . In this specific configuration, the available material volume is better utilized by increasing the number of N ts , which helps stabilize the structure and improve stress distribution.
According to Figure 19b, a predicted behavior is noticed, as shown in Figure 15 and Figure 16, that for each plate configuration, the maximized value of σ uN is not necessarily obtained by the highest values of ( h s / t s ) o . When the curves of ( h s / t s ) o increase with the rise in N ts , it indicates that, despite the reduction in the available h s due to the increased number of transverse stiffeners, the maximum ( σ uN ) m value had not been previously achieved with the higher ( h s / t s ) o values.

3.9. Influence of   N ls , ( N ts ) o , and ( h s / t s ) oo , on ( σ uN ) mm

Based on the results for N ts , ( h s / t s ) o , and ( σ uN ) m , see Table 10 and Figure 19, it is possible to determine the once-optimized number of transverse stiffeners ( N ts ) o , the twice-maximized normalized ultimate buckling stress ( σ uN ) mm , and the corresponding twice-optimized height-to-thickness ratio ( h s / t s ) oo , as summarized in Table 11.
The maximum value of ( σ uN ) mm is 5.72, observed in the P(4;2) configuration with ( h s / t s ) oo of 4.80. In contrast, the lowest value, 4.48, is obtained from the P(2;5) configuration with ( h s / t s ) oo equal to 3.20. These values correspond to an increase of 472% and 348% in relation to σ uR , respectively. Figure 20 presents the displacement and von Mises stress distributions for both scenarios.
As expected, and consistent with previous optimizations, the plate that exhibited the highest ultimate buckling stress also showed a better displacement distribution (lower maximum out-of-plane displacement value compared to another plate with the same global buckling mode) in Figure 20a. Supporting this result, the same plate also presented a more efficient stress distribution (Figure 20b); with stress levels close to the yield limit distributed across the entire surface of the plate and along the stiffeners, especially in the contact regions between the plate and the stiffeners. This indicates that both components work together to enhance the structural strength of the system. In contrast, the plate shown in Figure 20c,d, although it exhibits some regions with stress close to the yield limit, shows a concentration of stresses in the center of the plate, while the edges present lower values. This less uniform distribution indicates a lower structural performance compared to the plate shown in Figure 20b, which presented better uniform distribution.
The influence of N ls , ( N ts ) o , and ( h s / t s ) oo , over ( σ uN ) mm are graphically shown in Figure 21.
From Figure 21, it can be observed that only plate configuration with N ls = 2 presented the maximum possible value of transverse stiffeners ( ( N ts ) o = 5). The other configurations, with N ls > 2, presented ( σ uN ) mm associated with the minimum value of transverse stiffeners ( ( N ts ) o = 2). This behavior is again related to volume conservation, the configuration with N ls = 2 allowed for higher values of ( h s / t s ) oo , even with a high value of longitudinal stiffeners. In contrast, in the other configurations, lower values of N ts are obtained so that the values of ( h s / t s ) oo would be sufficient to achieve the corresponding ( σ uN ) mm .
By comparing the results obtained under the same premises for the application of constructal design and exhaustive search, using plates with identical dimensions and material properties, Lima et al. [12] achieved the optimized configuration for uniaxial loading as plate P(2;2), with ( h s / t s ) ooo = 14.09 and ( σ uN ) mmm = 1.89. In this study, considering biaxial loading, the optimized configuration is found to be plate P(4;2), with ( h s / t s ) ooo = 4.80 and ( σ uN ) mmm = 5.72. This behavior comparison reveals a substantial increase in ultimate strength: the ( σ uN ) mmm under biaxial loading is approximately three times higher than that obtained under uniaxial loading. This indicates that, for the same 30% redistribution of the original plate volume into stiffeners, the configuration optimized for biaxial loading is more effective, resulting in significantly greater structural efficiency in comparison with the respective reference plate. Furthermore, the critical buckling direction is longitudinal since the plate’s length is twice its height. This behavior explains why the optimized configuration under biaxial loading featured many longitudinal stiffeners.

4. Conclusions

The verification, validation, and application of a numerical model for elasto-plastic buckling in both stiffened and unstiffened plates under biaxial compression enabled the use of Constructal Design and Exhaustive Search methods to evaluate structural performance in buckling conditions. This approach provided a detailed understanding of how longitudinal and transverse stiffeners (varying in number, height, and thickness) affect the elasto-plastic buckling behavior and the overall structural strength of the plate. It particularly highlighted the distribution of out-of-plane displacements and stress throughout the structure. The verification and validation of the elasto-plastic buckling analysis showed a maximum difference of 1.90% and 4.28% when compared to previous numerical results, and 7.03% and 8.28% when compared to experimental results, for unstiffened and stiffened plates, respectively.
Regarding the influence of the number of transverse and longitudinal stiffeners, the best performances occurred for intermediate values of h s / t s with t s between 15 mm and 20 mm. This behavior can be associated with a better stress distribution over the plate. Furthermore, concerning the influence of h s / t s , it may be inferred that the lower and intermediate values of h s / t s resulted in the worst and best performance for σ uN , respectively, while higher values of h s / t s led to local buckling of the stiffeners due to the increased slenderness.
With respect to U z , the results indicate that higher values of U z are related to global buckling, while intermediate values of U z are associated with local buckling, which also corresponds to the highest values of σ uN . Moreover, the optimal plate configuration exhibited out-of-plane displacements and von Mises stresses uniformly distributed along both the plate and the stiffeners.
Additionally, the methodology used allowed for the identification of an optimized plate configuration, where the geometry of the stiffeners improves structural performance by redistributing material from the original unstiffened plate to the strengthening elements. The plate configuration that achieved the highest normalized ultimate buckling stress was P(4;2), with ( σ uN ) mmm = 5.72, ( h s / t s ) ooo = 4.80, N t s o o = 4, and N l s o = 2, representing a 472% increase compared to the reference σ uR of the unstiffened plate. In contrast, the worst-performing stiffened plate configuration was P(2;2), with h s / t s = 56.20, N t s = 2, and N l s = 2, which resulted in a 57% reduction in σ uN compared to the unstiffened reference. The performance difference between the best and worst stiffened configurations reached 319%.
As recommendations for future work, it is suggested to investigate the following aspects: the influence of plates with varying aspect ratios (a/b); the impact of different ratios of applied loads in each principal direction; the effect of alternative stiffener geometries and the distribution of stiffener volume; the consideration of larger initial imperfections, in accordance with design standards, and the inclusion of material strain hardening (work hardening) behavior after yielding to better capture the post-yield response of modern steels and to improve the realism and accuracy of elasto-plastic buckling predictions.

Supplementary Materials

The following supporting information can be downloaded at: https://www.mdpi.com/article/10.3390/met15080879/s1, Table S1: Constructal Design; Table S2: Exhaustive Search.

Author Contributions

Conceptualization, A.F.L., R.L.V., J.P.S.L., E.d.S.D.E. and L.A.I.; methodology, A.F.L., R.L.V., E.D.d.S., L.A.O.R., T.d.S., J.P.S.L., E.d.S.D.E. and L.A.I.; software, A.F.L.; verification, A.F.L.; formal analysis, A.F.L., R.L.V., T.d.S., J.P.S.L., E.d.S.D.E. and L.A.I.; investigation, A.F.L., R.L.V., T.d.S., J.P.S.L., E.d.S.D.E. and L.A.I.; resources, E.D.d.S., L.A.O.R., E.d.S.D.E. and L.A.I.; data curation, A.F.L.; writing—original draft preparation, A.F.L., R.L.V. and L.A.I.; writing—review and editing, E.D.d.S., L.A.O.R., T.d.S., J.P.S.L., E.d.S.D.E. and L.A.I.; visualization, E.D.d.S., L.A.O.R., T.d.S., J.P.S.L., E.d.S.D.E. and L.A.I.; supervision, T.d.S., J.P.S.L., E.d.S.D.E. and L.A.I.; project administration, L.A.I.; funding acquisition, E.D.d.S., L.A.O.R. and L.A.I. All authors have read and agreed to the published version of the manuscript.

Funding

This research was funded by Coordination for the Improvement of Higher Education Personnel—Brazil (CAPES), Finance Code 001, for the social demand program, grant number (Process: 88887.501697/2020-00), and Brazilian National Council for Scientific and Technological Development—Brazil (CNPq) for their research grants (Processes: 307791/2019-0, 308396/2021-9, and 309648/2021-1).

Institutional Review Board Statement

Not applicable.

Informed Consent Statement

Not applicable.

Data Availability Statement

The original contributions presented in this study are included in the article/Supplementary Materials. Further inquiries can be directed to the corresponding author.

Acknowledgments

The authors thank the CAPES and CNPQ for their financial support in the form of doctoral and research productivity scholarships.

Conflicts of Interest

The authors declare no conflicts of interest.

References

  1. Jones, R.M.R. Buckling of Bars, Plates and Shells; Bull Ridge Publishing: Blacksburg, VA, USA, 2006. [Google Scholar]
  2. Szilard, R. Theories and Applications of Plate Analysis; John Wiley & Sons: Hoboken, NJ, USA, 2004; Volume 57. [Google Scholar]
  3. Musmar, M.A. Structural Performance of Steel Plates. Front. Built Environ. 2022, 8, 991061. [Google Scholar] [CrossRef]
  4. El-Sawy, K.M.; Nazmy, Y.A.S.; Martini, M.I. Elasto-Plastic Buckling of Perforated Plates under Uniaxial Compression. Thin Walled Struct. 2004, 42, 1083–1101. [Google Scholar] [CrossRef]
  5. Trahair, N.S.; Bradford, M.A.; Nethercot, D.A.; Gardner, L. The Behavior and Design of Steel Structures, 4th ed.; Taylor & Francis, CRC Press: Abingdon, UK, 2008; ISBN 9780415301565. [Google Scholar]
  6. Ueda, Y.; Yao, T. Ultimate Strength of Compressed Stiffened Plates and Minimum Stiffness Ratio of Their Stiffeners. Eng. Struct. 1983, 2, 97. [Google Scholar] [CrossRef]
  7. Zhao, W.; Mahdi, M.A. Buckling Load Maximization of Stiffened Plates Using Level Set Topology Optimization and Inverse Isoparametric Mapping Algorithm. In Proceedings of the American Institute of Aeronautics and Astronautics, San Diego, CA, USA, 8 June 2023. [Google Scholar]
  8. Vieira, R.L.; Baumgardt, G.R.; dos Santos, E.D.; Rocha, L.A.O.; da Silveira, T.; Lima, J.P.S.; Isoldi, L.A. Computational Model and Constructal Design Applied to Thin Stiffened Plates Subjected to Elastoplastic Buckling Due to Combined Loading Conditions. Appl. Sci. 2025, 15, 3354. [Google Scholar] [CrossRef]
  9. Troina, G.; Cunha, M.; Pinto, V.; Rocha, L.; Santos, E.D.; Fragassa, C.; Isoldi, L. Computational Modeling and Constructal Design Theory Applied to the Geometric Optimization of Thin Steel Plates with Stiffeners Subjected to Uniform Transverse Load. Metals 2020, 10, 220. [Google Scholar] [CrossRef]
  10. de Queiroz, J.P.T.P.; Cunha, M.L.; Pavlovic, A.; Rocha, L.A.O.; dos Santos, E.D.; Troina, G.d.S.; Isoldi, L.A. Geometric Evaluation of Stiffened Steel Plates Subjected to Transverse Loading for Naval and Offshore Applications. J. Mar. Sci. Eng. 2019, 7, 7. [Google Scholar] [CrossRef]
  11. Kucharski, D.M.P.; Pinto, V.T.; Rocha, L.A.O.; Dos Santos, E.D.; Fragassa, C.; Isoldi, L.A. Geometric Analysis By Constructal Design Of Stiffened Steel Plates Under Bending with Transverse I-Shaped Or T-Shaped Stiffeners. Facta Univ. Ser. Mech. Eng. 2022, 20, 617–632. [Google Scholar] [CrossRef]
  12. Lima, J.P.S.; Cunha, M.L.; dos Santos, E.D.; Rocha, L.A.O.; Real, M.d.V.; Isoldi, L.A. Constructal Design for the Ultimate Buckling Stress Improvement of Stiffened Plates Submitted to Uniaxial Compressive Load. Eng. Struct. 2020, 203, 109883. [Google Scholar] [CrossRef]
  13. Lima, J.P.S.; Rocha, L.A.O.; dos Santos, E.D.; Real, M.d.V.; Isoldi, L.A. Constructal Design And Numerical Modeling Applied To Stiffened Steel Plates Submitted To Elasto-Plastic Buckling. Proc. Rom. Acad. Ser. A—Math. Phys. Tech. Sci. Inf. Sci. 2018, 19, 195–200. [Google Scholar]
  14. Ringsberg, J.W.; Darie, I.; Nahshon, K.; Shilling, G.; Vaz, M.A.; Benson, S.; Brubak, L.; Feng, G.; Fujikubo, M.; Gaiotti, M.; et al. The ISSC 2022 Committee III.1-Ultimate Strength Benchmark Study on the Ultimate Limit State Analysis of a Stiffened Plate Structure Subjected to Uniaxial Compressive Loads. Mar. Struct. 2021, 79, 103026. [Google Scholar] [CrossRef]
  15. Wang, B.; Tian, K.; Hao, P.; Cai, Y.; Li, Y.; Sun, Y. Hybrid Analysis and Optimization of Hierarchical Stiffened Plates Based on Asymptotic Homogenization Method. Compos. Struct. 2015, 132, 136–147. [Google Scholar] [CrossRef]
  16. Ghavami, K.; Khedmati, M.R. Numerical and Experimental Investigations on the Compression Behaviour of Stiffened Plates. J. Constr. Steel Res. 2006, 62, 1087–1100. [Google Scholar] [CrossRef]
  17. Hassan, A.; Kurgan, N. Modeling and Buckling Analysis of Rectangular Plates in ANSYS. Int. J. Eng. Appl. Sci. 2019, 11, 310–329. [Google Scholar] [CrossRef]
  18. Shanmugam, N.E.; Narayanan, R. Ultimate Strength of Biaxially Loaded Plates. In Stability and Ductility of Steel Structures; Elsevier: Amsterdam, The Netherlands, 1998. [Google Scholar]
  19. Piscopo, V. Refined Buckling Analysis of Rectangular Plates Under Uniaxial and Biaxial Compression. World Acad. Sci. Eng. Technol. Int. J. Mech. Mechatron. Eng. 2010, 4, 1018–1025. [Google Scholar] [CrossRef]
  20. Paik, J.K.; Kim, B.J.; Seo, J.K. Methods for Ultimate Limit State Assessment of Ships and Ship-Shaped Offshore Structures: Part I-Unstiffened Plates. Ocean. Eng. 2008, 35, 261–270. [Google Scholar] [CrossRef]
  21. Paik, J.K.; Seo, J.K. Nonlinear Finite Element Method Models for Ultimate Strength Analysis of Steel Stiffened-Plate Structures under Combined Biaxial Compression and Lateral Pressure Actions—Part I: Plate Elements. Thin-Walled Struct. 2009, 47, 1008–1017. [Google Scholar] [CrossRef]
  22. Tanaka, S.; Yanagihara, D.; Yasuoka, A.; Harada, M.; Okazawa, S.; Fujikubo, M.; Yao, T. Evaluation of Ultimate Strength of Stiffened Panels under Longitudinal Thrust. Mar. Struct. 2014, 36, 21–50. [Google Scholar] [CrossRef]
  23. Anyfantis, K.N.; Pantazopoulou, S.; Papanikolaou, N. Generalized Probabilistic Response Surfaces for the Buckling Strength Assessment of Stiffened Panels. Thin-Walled Struct. 2023, 189, 110860. [Google Scholar] [CrossRef]
  24. Suneel Kumar, M.; Lavana Kumar, C.; Alagusundaramoorthy, P.; Sundaravadivelu, R. Ultimate Strength of Orthogonal Stiffened Plates Subjected to Axial and Lateral Loads. KSCE J. Civ. Eng. 2010, 14, 197–206. [Google Scholar] [CrossRef]
  25. Yuan, Y.; Xing, Y. A Semi-Analytical Solution for Critical Buckling Loads of Orthotropic Stiffened Rectangular Thin Plates. Thin-Walled Struct. 2024, 205, 112449. [Google Scholar] [CrossRef]
  26. Ozdemir, M.; Ergin, A.; Yanagihara, D.; Tanaka, S.; Yao, T. A New Method to Estimate Ultimate Strength of Stiffened Panels under Longitudinal Thrust Based on Analytical Formulas. Mar. Struct. 2018, 59, 510–535. [Google Scholar] [CrossRef]
  27. Guo, G.; Cui, J.; Wang, D. An Experimental Investigation on the Collapse Modes of Stiffened Plates Subjected to Combined Axial and Lateral Loads. Ocean. Eng. 2024, 299, 117189. [Google Scholar] [CrossRef]
  28. Ma, H.; Mei, H.; Wang, D. Scale Model Design for the Stiffened Plate Subjected to Combined Longitudinal Compression and Lateral Pressure Considering Collapse Modes. Ocean. Eng. 2022, 243, 110289. [Google Scholar] [CrossRef]
  29. Xu, M.C.; Song, Z.J.; Zhang, B.W.; Pan, J. Empirical Formula for Predicting Ultimate Strength of Stiffened Panel of Ship Structure under Combined Longitudinal Compression and Lateral Loads. Ocean. Eng. 2018, 162, 161–175. [Google Scholar] [CrossRef]
  30. Wang, Z.; Yuan, T.; Kong, X.; Wu, W. A Universal Similarity Method and Design Procedure for Buckling Assessment of Stiffened Plates under Compression Load on Real Ships. Thin-Walled Struct. 2022, 181, 110025. [Google Scholar] [CrossRef]
  31. Ma, H.; Xiong, Q.; Wang, D. Experimental and Numerical Study on the Ultimate Strength of Stiffened Plates Subjected to Combined Biaxial Compression and Lateral Loads. Ocean. Eng. 2021, 228, 108928. [Google Scholar] [CrossRef]
  32. Fujikubo, M.; Harada, M.; Yao, T.; Khedmati, M.R.; Yanagihara, D. Estimation of Ultimate Strength of Continuous Stiffened Panel under Combined Transverse Thrust and Lateral Pressure Part 2: Continuous Stiffened Panel. Mar. Struct. 2005, 18, 411–427. [Google Scholar] [CrossRef]
  33. Shi, G.-J.; Xiong, Y.-F.; Cai, S.-J.; Wang, D.-Y. Experiment Study of Dynamic Buckling for Stiffened Panels under Longitudinal Impact. Ocean. Eng. 2023, 284, 115243. [Google Scholar] [CrossRef]
  34. Anyfantis, K.N. Ultimate Strength of Stiffened Panels Subjected to Non-Uniform Thrust. Int. J. Nav. Archit. Ocean. Eng. 2020, 12, 325–342. [Google Scholar] [CrossRef]
  35. Saad-Eldeen, S.; Garbatov, Y. Experimental and Numerical Analysis of Structural Capacity of Perforated Stiffened Plates. J. Mar. Sci. Eng. 2023, 11, 842. [Google Scholar] [CrossRef]
  36. Shanmugam, N.E.; Dongqi, Z.; Choo, Y.S.; Arockiaswamy, M. Experimental Studies on Stiffened Plates under In-Plane Load and Lateral Pressure. Thin-Walled Struct. 2014, 80, 22–31. [Google Scholar] [CrossRef]
  37. Seo, J.K.; Song, C.H.; Park, J.S.; Paik, J.K. Nonlinear Structural Behaviour and Design Formulae for Calculating the Ultimate Strength of Stiffened Curved Plates under Axial Compression. Thin-Walled Struct. 2016, 107, 1–17. [Google Scholar] [CrossRef]
  38. Paik, J.K.; Kim, B.J.; Seo, J.K. Methods for Ultimate Limit State Assessment of Ships and Ship-Shaped Offshore Structures: Part II-Stiffened Plates. Ocean. Eng. 2008, 35, 271–280. [Google Scholar] [CrossRef]
  39. Paik, J.K.; Kim, B.J. Ultimate Strength Formulations for Stiffened Panels under Combined Axial Load, in-Plane Bending and Lateral Pressure: A Benchmark Study. Thin-Walled Struct. 2002, 40, 45–83. [Google Scholar] [CrossRef]
  40. Zhong, Q.; Wang, D. Ultimate Strength Characteristics and Assessment of Laser-Welded Web-Core Sandwich Plates under Combined Biaxial Compression and Lateral Pressure. Ocean. Eng. 2022, 263, 112324. [Google Scholar] [CrossRef]
  41. Hanif, M.I.; Adiputra, R.; Prabowo, A.R.; Yamada, Y.; Firdaus, N. Assessment of the Ultimate Strength of Stiffened Panels of Ships Considering Uncertainties in Geometrical Aspects: Finite Element Approach and Simplified Formula. Ocean. Eng. 2023, 286, 115522. [Google Scholar] [CrossRef]
  42. Zhang, G.; Hu, Y.; Yan, B.; Tong, M.; Wang, F. Buckling and Post-Buckling Analysis of Composite Stiffened Panels: A Ten-Year Review (2014–2023). Thin-Walled Struct. 2024, 205, 112525. [Google Scholar] [CrossRef]
  43. Wang, Z.; Kong, X.; Wu, W.; Kim, D.K. An Advanced Design Diagram of Stiffened Plate Subjected to Combined In-Plane and Lateral Loads Considering Initial Deflection Effects. Thin-Walled Struct. 2024, 203, 112144. [Google Scholar] [CrossRef]
  44. Baumgardt, G.R.; Fragassa, C.; Rocha, L.A.O.; dos Santos, E.D.; da Silveira, T.; Isoldi, L.A. Computational Model Verification and Validation of Elastoplastic Buckling Due to Combined Loads of Thin Plates. Metals 2023, 13, 731. [Google Scholar] [CrossRef]
  45. Przemieniecki, J.S. Theory of Matrix Structural Analysis; Dover Publications: New York, NY, USA, 1985; p. 384. [Google Scholar]
  46. Grimesf, R.G.; Lewisf, J.G.; Simon, H.D. A Shifted Block Lanczos Algorithm for Solving Sparse Symmetric Generalized Eigenproblems. SIAM J. Matrix Anal. Appl. 1994, 15, 228–272. [Google Scholar] [CrossRef]
  47. Ellobody, E.; Feng, R.; Young, B. Finite Element Analysis and Design of Metal Structures, 1st ed.; Butterworth-Heinemann: Waltham, MA, USA, 2014. [Google Scholar]
  48. Fonseca, E.M.M. Steel Columns under Compression with Different Sizes of Square Hollow Cross-Sections, Lengths, and End Constraints. Appl. Sci. 2024, 14, 8668. [Google Scholar] [CrossRef]
  49. Helbig, D.; Da Silva, C.C.C.; Real, M.d.V.; dos Santos, E.D.; Isoldi, L.A.; Rocha, L.A.O. Study about Buckling Phenomenon in Perforated Thin Steel Plates Employing Computational Modeling and Constructal Design Method. Lat. Am. J. Solids Struct. 2016, 13, 1912–1936. [Google Scholar] [CrossRef]
  50. ANSYS Inc. Mechanical APDL 2024 R2—Element Reference. In Ansys Mechanical APDL Element Reference; ANSYS, Inc.: Canonsburg, PA, USA, 2024; pp. 254–265. [Google Scholar]
  51. Bathe, K.J. Finite Element Procedures, 2nd ed.; Bathe, K.-J., Ed.; Prentice Hall: Upper Saddle River, NJ, USA, 2014. [Google Scholar]
  52. Oñate, E. Structural Analysis with the Finite Element Method—Linear Statics, 2nd ed.; Springer: Dordrecht, The Netherlands, 2009. [Google Scholar]
  53. Morris, M.D. American Society for Quality Factorial Sampling Plans for Preliminary Computational Experiments. Technometrics 1991, 33, 161–174. [Google Scholar] [CrossRef]
  54. Bejan, A.; Lorente, S. Design with Constructal Theory; Wiley & Sons, Inc.: Hoboken, NJ, USA, 2008. [Google Scholar]
  55. Bejan, A. Shape and Structure: From Engineering to Nature; Cambridge University Press: Cambridge, UK, 2000. [Google Scholar]
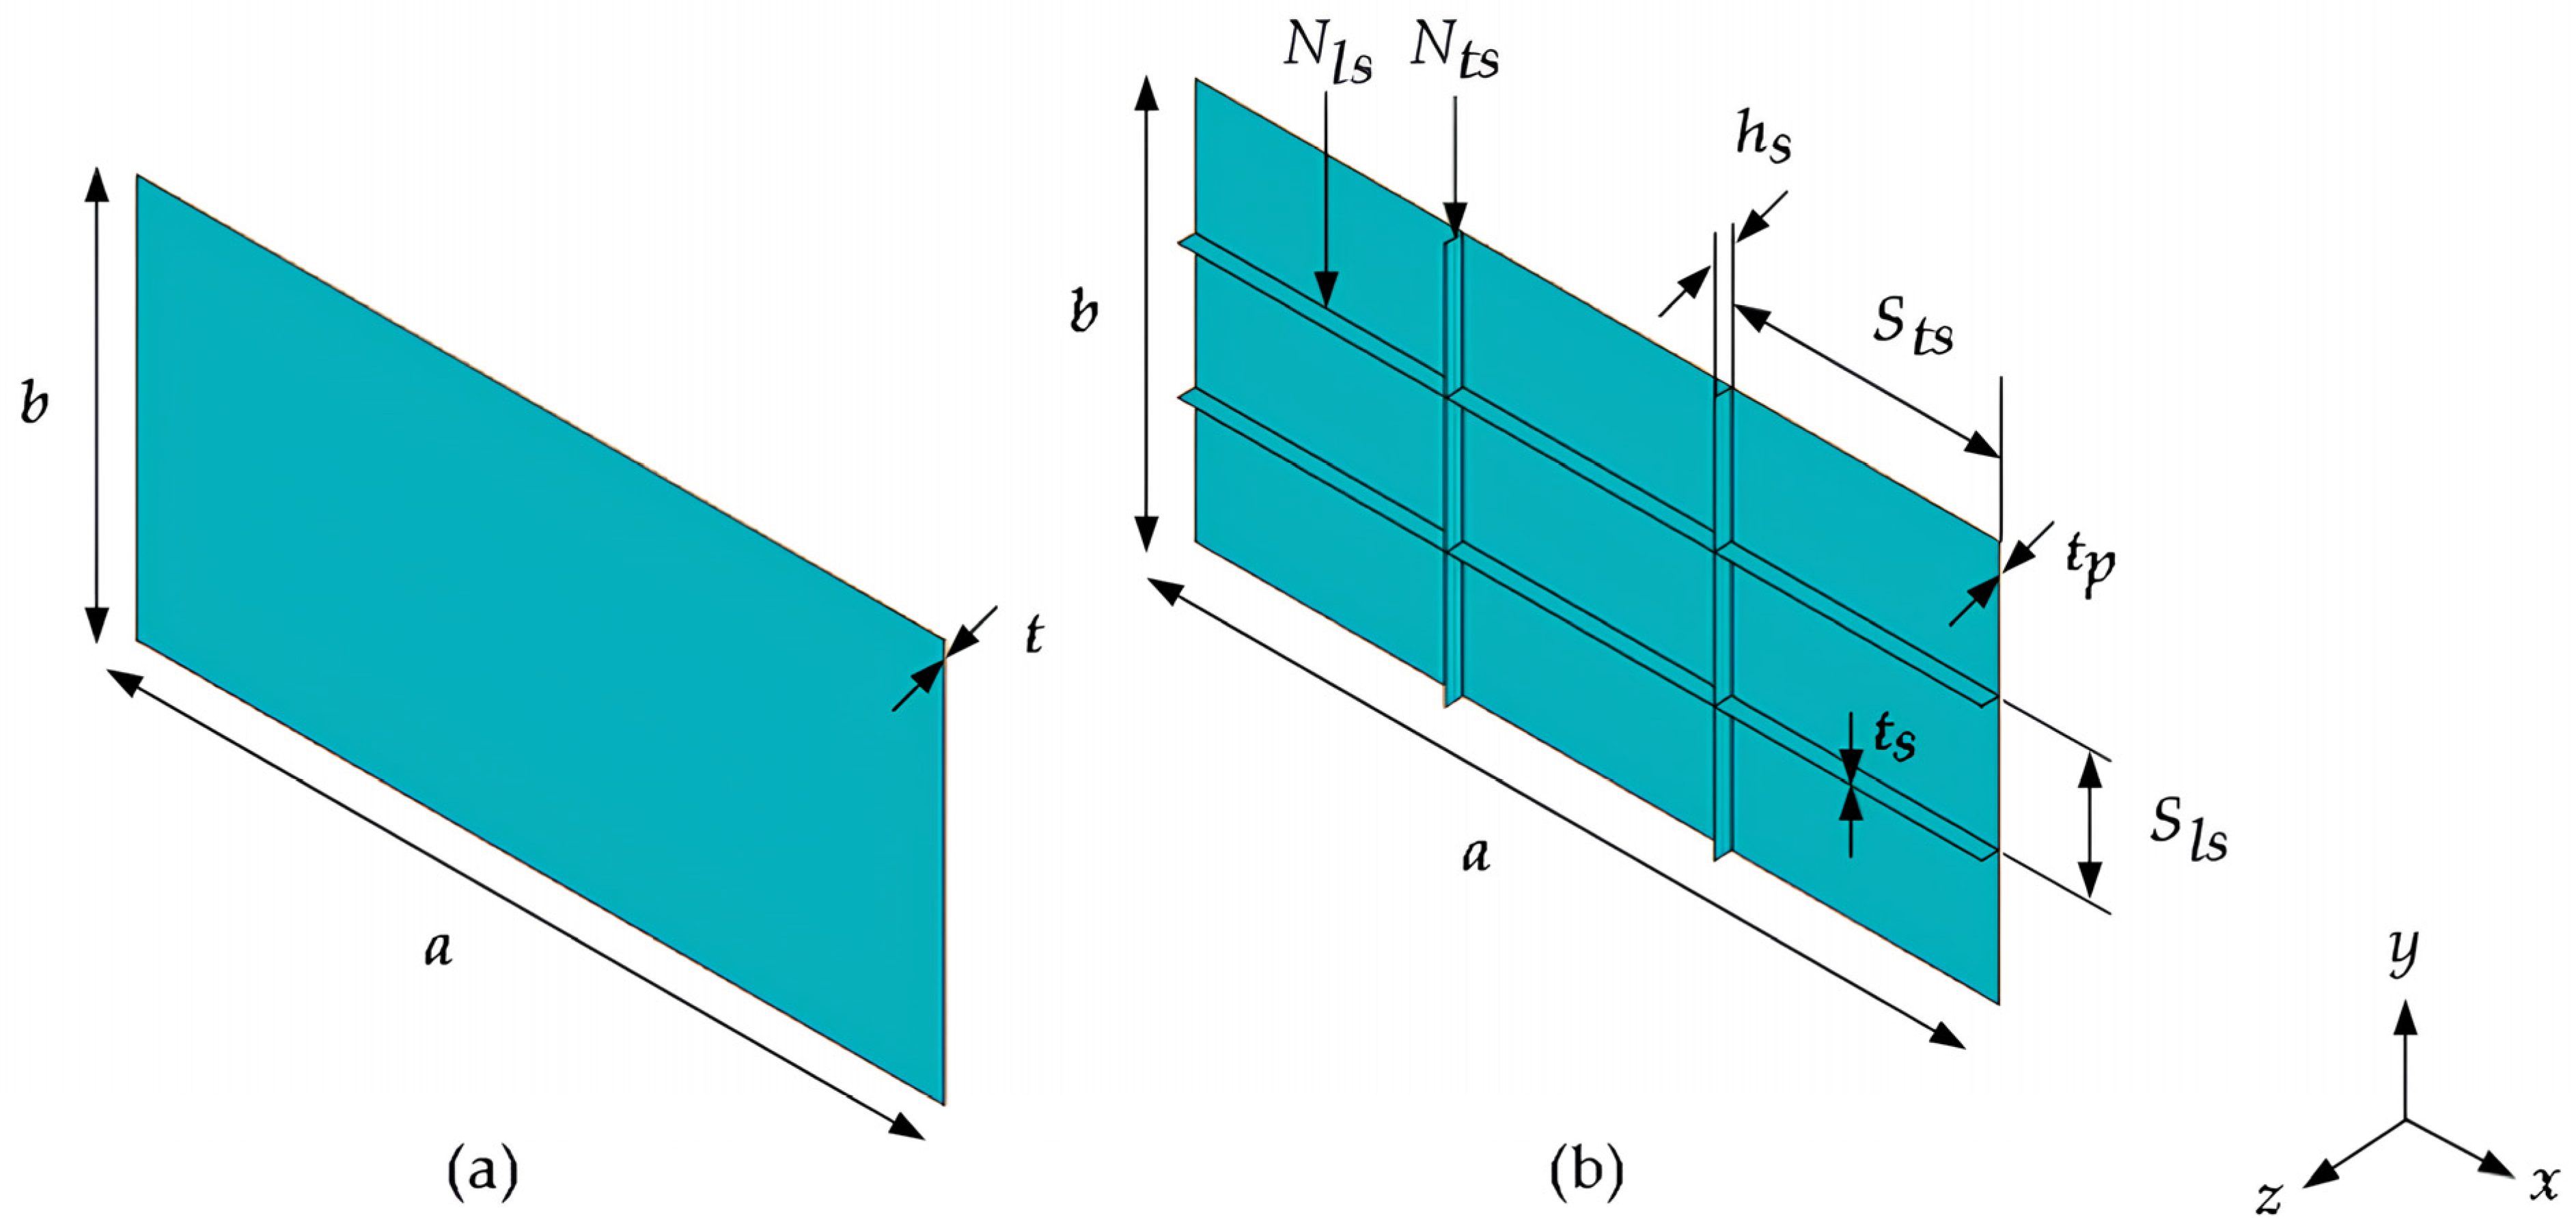
Figure 1. Modeling of: (a) unstiffened reference plate and (b) stiffened plate.
Metals 15 00879 g001
Figure 2. Boundary and loading conditions of: (a) unstiffened plate and (b) stiffened plates.
Metals 15 00879 g002
Figure 3. Steps of Constructal Design method and Exhaustive Search technique.
Metals 15 00879 g003
Figure 4. Loading and boundary conditions, represented by red and cyan symbols, respectively, of unstiffened plate considered for the first verification of the elasto-plastic computational model.
Metals 15 00879 g004
Figure 5. Loading and boundary conditions, represented by red and cyan symbols, respectively, of unstiffened plate considered for the second verification of the elasto-plastic computational model.
Metals 15 00879 g005
Figure 6. Loading and boundary conditions, represented by red and cyan symbols, respectively, of unstiffened plate considered for the validation of the elasto-plastic computational model.
Metals 15 00879 g006
Figure 7. Loading and boundary conditions, represented by red and cyan symbols, respectively, of stiffened plate considered for the first verification of the elasto-plastic computational model.
Metals 15 00879 g007
Figure 8. Loading and boundary conditions of stiffened plate considered for the second verification of the elasto-plastic computational model.
Metals 15 00879 g008
Figure 9. Loading and boundary conditions, represented by red and cyan symbols, respectively, of stiffened plate considered for the validation of the elasto-plastic computational model.
Metals 15 00879 g009
Figure 10. Unstiffened reference plate under biaxial compression: (a) out-of-plane displacements distribution and (b) von Mises stress distribution.
Metals 15 00879 g010
Figure 11. Influence of N ls , N ts , and t s over h s on stiffened plates with N ls = 2 and N ls = 5.
Metals 15 00879 g011
Figure 12. Visual demonstration of the influence of N ls , N ts and t s over h s on stiffened plates with N ls = 2 and N ls = 5. (a) P(2;2) and (b) P(5;5).
Metals 15 00879 g012
Figure 13. Influence of h s / t s , N ls , and N ts over σ uN and U zN for plates with N ls = 2 and N ls = 3.
Metals 15 00879 g013
Figure 14. Influence of h s / t s , N ls , and N ts over σ uN and U zN for plates with N ls = 4 and N ls = 5.
Metals 15 00879 g014
Figure 15. Influence of h s / t s over σ u and U z of plates: (a) P(3;2) and h s / t s = 0.80, (b) P(3;2) and h s / t s = 3.10, (c) P(3;2) and h s / t s = 12.20, and (d) P(3;2) and h s / t s = 48.40.
Metals 15 00879 g015
Figure 16. Influence of h s / t s over σ u and U z of plates: (a) P(4;4) and h s / t s = 0.48, (b) P(4;4) and h s / t s = 0.83, (c) P(4;4) and h s / t s = 3.20, and (d) P(4;4) and h s / t s = 28.20.
Metals 15 00879 g016
Figure 17. Best and worst plate configurations: (a) P(4;2) out-of-plane displacements, (b) P(4;2) von Mises stress distribution, (c) P(2;2) out-of-plane displacements, and (d) P(2;2) von Mises stress distribution.
Metals 15 00879 g017
Figure 18. Best and worst plate configurations: (a) P(4;2) out-of-plane displacements, (b) P(4;2) von Mises stress distribution, (c) P(5;5) out-of-plane displacements, and (d) P(5;5) von Mises stress distribution.
Metals 15 00879 g018
Figure 19. Influence of N ls and N ts on: (a) ( σ uN ) m and (b) ( h s / t s ) o .
Metals 15 00879 g019
Figure 20. Best and worst plate configurations: (a) P(4;2) out-of-plane displacements, (b) P(4;2) von Mises stress distribution, (c) P(2;5) out-of-plane displacements, and (d) P(2;5) von Mises stress distribution.
Metals 15 00879 g020
Figure 21. Influence of N ls on ( N ts ) o , ( h s / t s ) oo , and ( σ uN ) mm .
Metals 15 00879 g021
Table 1. Mesh convergence test for the first verification of the elasto-plastic buckling computational model with an unstiffened plate.
Element Length
(mm)
Number of
Elements
σ u
(MPa)
100200186.45
75378184.13
50800184.13
253200186.45
Table 2. Mesh convergence test for the second verification of the elasto-plastic buckling computational model with an unstiffened plate.
Element Length
(mm)
Number of
Elements
σ u
(MPa)
1002455.28
754055.28
507555.28
2529055.28
10172855.28
Table 3. Mesh convergence test for the first verification of the elasto-plastic buckling computational model with an unstiffened plate.
Element Length
(mm)
Number of
Elements
P u
(kN)
108133.05
7.514433.05
532433.05
2.5122533.05
Table 4. Mesh convergence test for the first verification of the elasto-plastic buckling computational model with a stiffened plate.
Element Length
(mm)
Number of
Elements
σ u
(MPa)
100318284.42
75489284.10
501008281.77
253648281.22
Table 5. Mesh convergence test for the second verification of the elasto-plastic buckling computational model with a stiffened plate.
Element Length
(mm)
Number of
Elements
σ ux
(MPa)
σ uy
(MPa)
100092499.54149.31
750116471.19106.79
500194069.93104.90
250561669.30103.95
10027,54469.30103.95
Table 6. Mesh convergence test for the validation of the elasto-plastic buckling computational model with a stiffened plate.
Element Length
(mm)
Number of
Elements
P u
(kN)
1002461169.57
753821131.64
508941118.99
2529461118.99
Table 7. Mesh convergence test to standardize the finite element size of unstiffened plates of case study.
Element Length
(mm)
Number of
Elements
σ u
(MPa)
10020060.57
7537859.68
5080059.68
25320059.68
Table 8. Mesh convergence test to standardize the finite element size of stiffened plates of case study.
Element Length
(mm)
Number of
Elements
σ u
(MPa)
100468122.70
75780122.70
501338122.70
254788122.70
Table 9. Sub-steps convergence test.
Number of Sub-StepsMaximum Number of Sub-StepsMinimum
Number of
Sub-Steps
Processing Time
(s)
σ u
(MPa)
501001091116.26
1002002594117.59
20040050153122.70
300600100195120.64
Table 10. ( σ uN ) m and ( h s / t s ) o for all plate configurations.
Plate
Configuration
N ls N ts ( h s / t s ) o ( σ uN ) m
P(2;2)222.283.71
P(2;3)232.704.04
P(2;4)243.804.34
P(2;5)253.204.48
P(3;2)323.105.08
P(3;3)334.274.74
P(3;4)343.474.88
P(3;5)356.604.11
P(4;2)424.805.72
P(4;3)433.875.20
P(4;4)443.204.22
P(4;5)456.104.05
P(5;2)524.275.31
P(5;3)533.474.29
P(5;4)546.603.86
P(5;5)555.703.51
Table 11. Results of ( N ts ) o , ( h s / t s ) oo , and ( σ uN ) mm for each N ls plate configuration.
Plate
Configuration
N ls ( N ts ) o ( h s / t s ) oo ( σ uN ) mm
P(2;5)253.204.48
P(3;2)323.105.08
P(4;2)424.805.72
P(5;2)524.275.31
Disclaimer/Publisher’s Note: The statements, opinions and data contained in all publications are solely those of the individual author(s) and contributor(s) and not of MDPI and/or the editor(s). MDPI and/or the editor(s) disclaim responsibility for any injury to people or property resulting from any ideas, methods, instructions or products referred to in the content.