Abstract
UNS S41003 is a low-cost, low-carbon ferritic stainless steel that exhibits moderate corrosion resistance but limited mechanical performance. This study evaluates the electrochemical behavior of untreated and thermomechanically treated UNS S41003 samples. Corrosion tests were conducted in acidic electrolytes with varying pH to simulate aggressive environments relevant to industrial and structural applications where exposure to acidic media and corrosive pollutants occurs. Potentiodynamic polarization curves for all samples displayed passive regions typically associated with protective oxide film formation; however, localized pitting corrosion was detected post-test. Electrochemical impedance spectroscopy indicated a marked decrease in corrosion resistance as pH decreased. The corrosion resistance of the treated alloy remained comparable to that of the untreated condition, indicating that thermomechanical processing did not detrimentally affect passivity or corrosion performance under the tested conditions. The literature suggests that the applied treatment enhances mechanical properties, supporting the potential use of this alloy in structural components subjected to acidic environments requiring a balance of mechanical strength and corrosion resistance.
1. Introduction
Stainless steel is a vital class of metal alloys, widely used in applications ranging from everyday objects, such as the manufacturing of domestic products, to high-performance sectors, including the construction of oil and gas infrastructure and components for the aerospace industry [1]. Its corrosion resistance arises from the spontaneous formation of a nanometric passive layer that protects the surface in aggressive environments, significantly slowing down corrosion processes. Although stainless steels typically incur a higher initial cost compared to conventional alloys such as carbon steel, a subset known as low-alloy stainless steels presents a cost-effective alternative under moderately corrosive conditions. These steels contain minimal alloying elements, maintaining relatively low production costs while still offering adequate corrosion resistance for specific applications [2,3].
Ferritic stainless steels (FSS) are characterized by a predominantly ferritic microstructure at room temperature. They offer good mechanical properties and corrosion resistance, with lower production costs compared to Austenitic Stainless Steels, primarily due to their reduced nickel content [4,5]. Among these, the UNS S41003 alloy stands out for its simple chemical composition and relatively low chromium content compared to other ferritic grades. While it performs well in both corrosive and abrasive environments, it also exhibits higher ductility than other FSS alloys [4,6].
Heat treatment is a common method for enhancing the mechanical properties of steels, and it can promote favorable microstructural changes. De Faria et al. [7] demonstrated that, despite its low carbon content, the UNS S41003 alloy is capable of undergoing martensitic transformation under suitable heat treatment conditions, resulting in improved mechanical performance. According to ASM International [8], martensitic stainless steels (MSS) are known for their moderate corrosion resistance and superior mechanical properties, making them suitable for a wide range of industrial applications, including those in the medical, arms, chemical, petrochemical, and aerospace sectors.
Heat treatment was applied to induce a martensitic transformation to expand the applicability of the UNS S41003 alloy, aiming to enhance its mechanical properties while retaining adequate corrosion resistance. The resulting alloy is intended for structural applications in environments that require both wear and corrosion resistance, serving as a potential replacement for carbon steels that offer little to no corrosion protection. Beyond corrosion resistance, stainless steels offer additional benefits for structural applications, such as superior impact resistance, better strength-to-weight ratios, and reduced maintenance costs [4,9].
Given the wide range of environments to which structural materials may be subjected, this study investigates the influence of pH variation, a key parameter affecting the electrochemical behavior of stainless steels. Variations in pH can significantly alter corrosion kinetics, the nature and solubility of corrosion products, the thermodynamic stability of passive films, and the propensity for localized corrosion phenomena, as extensively reported in the literature [10,11,12]. Acidic media are particularly prevalent in several industrial scenarios, including the petrochemical sector, mining operations, wastewater treatment, and infrastructure exposed to acid rain or pollutant-containing atmospheres. In such environments, the aggressive presence of H+ ions compromises passivity and accelerates anodic dissolution [13,14,15]. Furthermore, conducting this study under these more demanding conditions enhances the sensitivity in detecting microstructural effects on corrosion resistance, such as those induced by martensitic transformation. This approach is essential for evaluating the viability of the treated alloy in structural applications that require simultaneous resistance to wear and corrosion.
The present work investigates the influence of electrolyte pH on the electrochemical behavior of the UNS S41003 alloy and characterizes the impact of applied heat treatment. In this study, untreated UNS S41003 samples are referred to as 410F, while heat-treated samples are designated 410T.
2. Materials and Methods
2.1. Sample Preparation
This study was carried out using UNS S41003 alloy obtained from APERAM S.A. (Timóteo, Brazil), whose chemical composition is shown in Table 1. It can be seen that the chromium content is very low, placing both alloys near the minimum threshold for classification as stainless steel. Samples were cut to a final size of 10 mm × 10 mm × 4.75 mm.

Table 1.
Chemical composition of 410F and 410T alloys, in wt%.
The heat-treated samples, 410T, were also provided by the manufacturer and were not subjected to thermal processing by the authors. The thermomechanical treatment involved in obtaining the 410T samples is illustrated schematically in Figure 1. This treatment consisted of heating the alloy at a rate of 1 °C per second up to a temperature exceeding 937 °C, identified as the end of austenite formation, followed by a series of hot rolling passes and rapid cooling after the final deformation step.

Figure 1.
Schematic drawing of thermomechanical treatment.
Due to industrial confidentiality agreements, further details regarding the heat treatment procedure and the commercial designation of the modified alloy cannot be disclosed. Nevertheless, both 410F and 410T samples underwent preliminary mechanical and microstructural characterization to confirm the beneficial mechanical effects of the treatment. As proposed, the present study focuses specifically on the electrochemical characterization of both alloy conditions.
The cut specimens were mounted in epoxy resin and then ground using silicon carbide abrasive papers of 220, 400, 600, and 1200 grit before each analysis. For the microstructural characterization, samples from both alloys were then polished using a diamond padding paste of 3 µm and 1 µm (AROTEC, Cotia, Brazil), respectively. All grinding and polishing steps were carried out on a manual polishing/grinding machine Arocor 250 (AROTEC, Cotia, Brazil). All specimens were prepared according to ASTM G1-03 [16].
2.2. Microstructural Characterization Parameters
For the microstructural characterization, the polished samples were etched with Vilella’s Reagent (1 g picric acid, 5 mL hydrochloric acid, and 100 mL ethanol) to reveal the microstructure for examination via optical (LEICA DMI3000 M, São Paulo, Brazil) and electron (Quanta 450-FEG Scanning Electron Microscope—FEI, Hillsboro, OR, USA) microscopy.
Vickers microhardness tests were also carried out to evaluate any hardness effects of the heat treatment done during the 410T samples processing. They were performed in accordance with the ASTM E92 standard [17]. Twelve hardness measurements were taken on each sample, discarding the highest and lowest values, with the remaining values used for statistical analysis.
2.3. Electrochemical Analyses Parameters
The electrochemical analyses carried out included 1–Open Circuit Potential (OCP) Monitoring; 2–Potentiodynamic Polarization (PP); 3–Cyclic Polarization; 4–Electrochemical Impedance Spectroscopy (EIS); and 5–Chronoamperometry.
All the electrochemical analyses were carried out using three different solutions: 500 mg/L NaCl with pH values of 5.8, 4.0, and 2.0. A standard three-electrode cell was utilized with a working electrode, a platinum counter electrode, and an Ag/AgCl sat reference electrode, KCl. The analyses were performed with a PGSTAT30 potentiostat (Autolab, Metrohm-Eco Chemie, Herisau, Switzerland), as well as the Nova 2.1 software for data handling. All pH adjustments were made with HCl 1M solution, and the pH was measured using a 914 pH/conductometer (Metrohm), previously calibrated in acidic and neutral solutions. The final chloride ion concentrations are as follows: 500, 504, and 853 ppm, for solutions at pH 5.8, 4.0, and 2.0, respectively. The analyses were carried out to obtain triplicate measurements to ensure reproducibility.
OCP monitoring was carried out as the first measurement taken in all other electrochemical analyses performed in the present study. The OCP value was monitored for 60 min while being recorded every 0.1 s. PP tests were performed with both alloys, using samples of approximately 60 mm2 of exposed surface area. The studies were performed at room temperature (25 °C), and the measurement was carried out from −0.25 to 1.0 V of overpotential, with a scan rate of 0.001 V/s. Potentiodynamic curves of potential vs. log current were constructed, and corrosion current density and corrosion potential were calculated. The corrosion rates in mm/yr were also estimated from the corrosion current density, exposed surface area, and material density. Cyclic polarization tests were also carried out with similar specifications, with measurements from −0.25 to 1.0 V of overpotential, an upper potential vertex of 1.0 V, a lower vertex of −0.26, and a stopping potential of −0.25 in one full cycle. After the polarization tests were conducted, the samples’ surfaces were observed and studied via optical and electron microscopy to evaluate the morphology and extension of the corrosion process that had occurred. EIS tests were carried out at OCP potential and had the following specifications: a frequency ranging from 40 kHz to 10 mHz, with an amplitude of 10 mHz and 5 measured points per decade. Nyquist plots were constructed, and the system was simulated as an electrical circuit, which allowed for more in-depth information about the studied system. Chronoamperometry tests were performed at approximately 0.2 V relative to OCP, monitoring the current density for 900 s every 0.5 s.
2.4. Oxide Film Characterization
Laser Raman Spectroscopy experiments were performed to characterize the oxide films after polarization in NaCl 500 ppm medium using a Alpha 300 spectrometer (Witec, Ulm, Germany) equipped with a 600 groove/mm grating and a 532 nm laser as the excitation source.
3. Results and Discussion
3.1. Microstructural Characterization
The chemical composition of the studied alloys was used to calculate the equivalent chromium and nickel contents based on the Schaeffler diagram [18] using the following equations (Equations (1) and (2)):
Creq = %Cr + %Mo + (1.5 × %Si) + (0.5 × Nb),
Nieq = %Ni + (30 × %C) + (0.5 × %Mn),
The calculated values for both alloys are shown in Table 2 and fall within the ferrite + martensite region of the Schaeffler diagram, suggesting the potential for martensitic transformation after thermomechanical processing.

Table 2.
Equivalent chromium and nickel values, as well as martensite start and Md30 temperatures, calculated for the samples studied.
SEM micrographs of both samples are presented in Figure 2. The 410F condition (as-received) exhibits equiaxial ferritic grains, consistent with the microstructure of solution-annealed UNS S41003 and with literature reports [7,19]. In contrast, the 410T sample, which underwent thermomechanical treatment, shows a more refined structure, with lath-like features suggestive of strain-induced martensite; however, a few regions of remaining ferrite phase can still be seen, as indicated in Figure 2b.
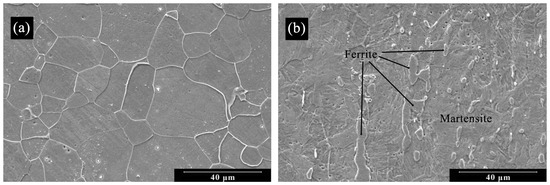
Figure 2.
Scanning electron micrographs of (a) 410F; (b) 410T alloys. Etch: Villella’s reagent.
These morphological differences are further supported by Vickers microhardness testing. As shown in Table 3, the 410T sample exhibited a ~66% increase in microhardness compared to 410F, reaching approximately 315 HV. This value is consistent with those reported for quenched martensite in low-carbon Cr-based stainless steels [7,8], which supports the interpretation that thermomechanical processing induced a martensitic transformation.

Table 3.
Vickers microhardness of 410F and 410T alloys as received.
Although direct phase determination techniques, such as XRD, were not employed, a rough estimate of martensite content was derived from the morphological features. Through analysis using ImageJ v.1.54p software, as shown in Figure 2b, a phase content of approximately 92.8% martensite was estimated in the 410T sample, which is in agreement with prior reports on similarly treated steels [7,20].
Furthermore, martensite start (Ms) and Md30 temperatures, which can be defined as the temperature at which 30% of the true strain imposed by stress induces a transformation in 50% of the austenite in martensite, can be calculated for low-alloy steels using Equations (3) and (4) [21,22].
Ms (°C) = 539 − 423 × %C − 30.4 × %Mn − 12.1 × %Cr − 17.7 × %Ni − 7.5 × %Mo,
Md30 (°C) = 413 − 462 × (%C + %N) − 9.2 × %Si − 8.1% × %Mn − 13.7 × %Cr − 9.5 × %Ni − 18.5 × %Mo
It can be seen that a lower content of allowing elements facilitates martensite transformation. The calculated Ms and Md30 values are also shown in Table 2. The obtained values, which are relatively high, corroborate the findings in this study on probable martensitic presence in the 410T samples. Given the processing route, which consists of hot deformation followed by rapid cooling coupled with a series of step deformations, it is thermodynamically plausible that the alloy passed through both Ms and Md30, leading to partial or near-complete transformation into martensite either thermally and/or mechanically induced. This interpretation aligns with both the observed microhardness and the microstructural refinement seen in SEM.
Overall, the data confirm that the applied treatment altered the original microstructure, yielding a dual-phase ferrite–martensite material with enhanced mechanical properties. This modified condition (410T) offers a potential advantage in applications requiring improved wear and mechanical resistance without compromising corrosion performance.
3.2. Electrochemical Analyses
3.2.1. Open Circuit Potential (OCP)
Figure 3 illustrates the evolution of OCP during monitoring time for both alloys in the various electrolytes used in this study. It is clear that for all conditions in the study, the 3600 s of monitoring were sufficient for stabilizing the measured potential, which is crucial for subsequent electrochemical analyses. The final five measurements in each analysis were taken to represent the OCP value. The resulting values for each condition are displayed in Table 4. Both alloys presented very similar OCP values for every solution used. As the pH decreased, it can be seen that the OCP values also decreased by approximately 0.34 for 410F and 0.33 for 410T from pH 5.8 to pH 2.0.
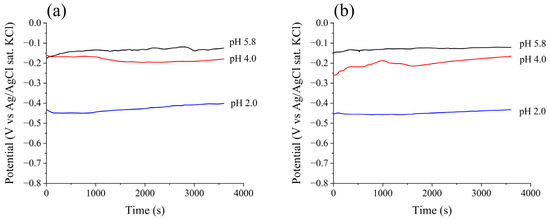
Figure 3.
Open circuit potential monitoring for (a) 410F e (b) 410T alloys in different pH electrolytes.

Table 4.
Open circuit potential results for 410F and 410T alloys in different pH electrolytes.
3.2.2. Potentiodynamic Polarization
Figure 4 shows the potentiodynamic polarization curves for both 410F and 410T alloys in NaCl 500 ppm solution at different pH values. At a pH level of 5.8 (Figure 4a), both alloys display clear passivation behavior, with passivity ranges initiating near −0.07 V and extending to approximately 0.28 V. The passivation potential was calculated to be −0.073 V and −0.066 V for 410F and 410T, respectively. The passivity potential displayed a slight increase throughout the applied potential range. The current density measured at 0.1 V was chosen to represent the passivation current density for this medium, which was 1.07 and 1.17 µA.cm−2 for 410F and 410T, respectively. However, it is noteworthy that the untreated alloy (410F) exhibited slightly lower current densities within the passive region compared to the thermomechanically treated sample, suggesting a marginally more stable passive layer under these conditions. This may be attributed to differences in surface reactivity and defect density resulting from the microstructural state. The pitting potential, Epit, was achieved at 0.287 V and 0.267 V for 410F and 410T, respectively. The lower Epit value indicates a slightly deleterious effect of the heat treatment, although it is not very significant. At a pH level of 4.0, the polarization curves, shown in Figure 4b, continue to present similar behavior for both alloys. The behavior displayed no remarkable change compared to the pH 5.8 results. A passive region was observed ranging from −0.09 V for both alloys, with Epit values of 0.186 V and 0.206 V for 410F and 410T, respectively. In this medium, the passive current density was much more stable, although there was an increase in current density when compared to the pH 5.8 results: 3.81 µA/cm2 and 3.14 µA/cm2 for 410F and 410T, respectively. Despite the slight variation observed in Figure 4b, which shows lower current density values for the 410T sample, the general results were indistinguishable between the untreated and treated conditions. The pH 2.0 results, as seen in Figure 4c, show different behavior for both alloys compared with the other media studied. In this medium, the passivation process exhibited a distinct behavior, ranging from approximately −0.25 V to −0.03 V. The passivity potential values were −0.381 V and −0.363 V for the untreated and treated samples, with passive current densities of 25.72 and 46.41 µA/cm2, respectively, much higher than those found for higher-pH media. An “anodic nose”, which is the behavior of current rise near the equilibrium potential that reaches its maximum value and then drops, can also be observed in the curves for both alloys at this pH value. This behavior can indicate an ongoing passivation process of the samples [23]. Several authors have also reported the occurrence of an anodic peak in low-pH environments for stainless steels [23,24,25,26]. This feature suggests a distinct passivation mechanism that is dependent on pH. In solutions with higher pH, passivation primarily occurs via the direct precipitation of corrosion products, resulting in the rapid formation of a stable oxide layer. Conversely, in highly acidic media, such as that with a pH level of 2.0, the initial stages of anodic polarization are dominated by a competitive precipitation–dissolution process in which the oxide layer is unstable and partially dissolves. Only when the applied potential reaches a sufficiently anodic value does it promote sustained oxide growth, enabling the establishment of a protective passive film [27]. The aggressive nature of this medium is reflected in the significantly smaller passive region displayed by both samples. After continued polarization following the anodic nose, the current density is reduced, given the formation of a relatively stable oxide film, which is almost instantaneously broken as the Epit value is reached. Small fluctuations observed in the 410T current response may suggest transient instabilities in the passive film, potentially due to the higher reactivity of martensitic interfaces [28]. Nonetheless, both alloys maintained a passive response throughout most of the scan, with no abrupt breakdown observed before the transpassive region. Interestingly, the passive current of 410F remained slightly lower, reinforcing the hypothesis that ferrite may yield a more stable passive layer in acidic chloride environments. These observations indicate that the thermomechanical treatment applied to produce 410T, while effective in refining the microstructure and increasing hardness, may slightly reduce the alloy’s ability to maintain a uniform passive film under aggressive conditions. This effect, however, does not translate into a clear loss of corrosion resistance. Rather, it suggests subtle changes in passivation behavior that are consistent with the formation of martensite.
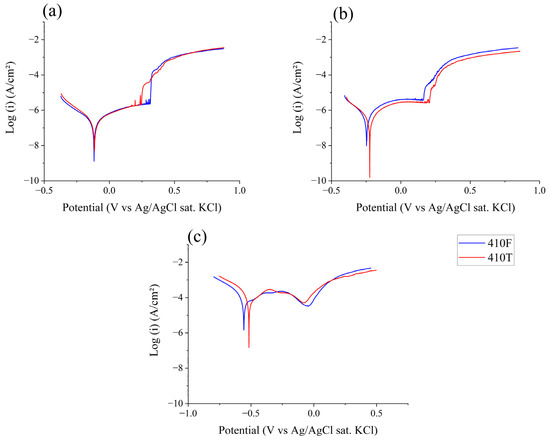
Figure 4.
Potentiodynamic polarization of 410F and 410T alloys in electrolytes with pH values of (a) 5.8; (b) 4.0; and (c) 2.0.
The passive behavior of stainless steels, such as UNS S41003, is notably influenced by the presence of chloride ions (Cl−), which are more notably present in lower-pH media. The addition of Cl− ions is known to compromise the stability of the passive film, leading to a reduction in the extent of the passive region observed during electrochemical testing [29,30].
Studies on stainless steel have demonstrated that Cl− ions can penetrate the passive oxide layer, particularly at defect sites or areas of compositional heterogeneity, facilitating localized passivity breakdown. This process results in the initiation of pitting corrosion, which is characterized by the formation of small, localized anodic sites where metal dissolution occurs. Susceptibility to such localized corrosion increases with higher concentrations of Cl− ions, as they disrupt the protective oxide film and hinder its self-repairing capabilities [31,32,33].
Table 5 shows the calculated data for the 410F and 410F samples obtained from the polarization curves. The corrosion current density (icorr) was obtained via Tafel analysis, while the corrosion rate (CR) was estimated using Equation (5), where K is the unit conversion coefficient to mm per year, M is the material molar mass, n is the number of electrons involved in the reaction, F is the Faraday constant, ρ is the specific density, and A represents the exposed area.
CR = (K × M × icorr)/(n × F × ρ × A),

Table 5.
Corrosion current density and estimated corrosion rate values for 410F and 410T samples in different pH electrolytes.
The results in Table 5 provide a quantitative comparison of the corrosion behavior of 410F and 410T under varying pH conditions in chloride-containing environments. A general trend of increasing corrosion activity with decreasing pH is observed for both alloys, as expected in acidic media. However, subtle differences between untreated and thermomechanically treated conditions are also evident.
At a pH level of 5.8, both alloys showed very low corrosion current densities, on the order of 10−8 A·cm−2, with slightly lower values for 410T. The corresponding corrosion rates were also minimal. These results indicate that both alloys are effectively passivated under mildly acidic conditions, and the presence of martensite in 410T does not negatively affect corrosion performance at this pH level. At a pH level of 4.0, corrosion rates increased by an order of magnitude. The overlapping uncertainties suggest that the difference is not statistically significant, but they support the observation that thermomechanical treatment did not impair corrosion resistance under these intermediate conditions. At a pH level of 2.0, the corrosion behavior changed more drastically. Here, 410F exhibited higher corrosion current density and corrosion rate compared to 410T, although, once again, within overlapping uncertainties.
Overall, while corrosion rates increased significantly at lower pH levels for both materials, the 410T samples did not exhibit higher corrosion rates. In all tested conditions, 410T matched 410F in terms of corrosion resistance. This suggests that the martensitic transformation induced by the thermomechanical treatment does not inherently compromise corrosion behavior in acidic chloride media.
Figure 5 and Figure 6 present the SEM micrographs of the 410F and 410T alloys, respectively, following the potentiodynamic polarization tests. In both cases, pitting corrosion is clearly identified as the dominant degradation mechanism. This is consistent with the behavior of stainless steels, which typically form passive oxide films that are locally compromised in the presence of aggressive species such as chloride ions.
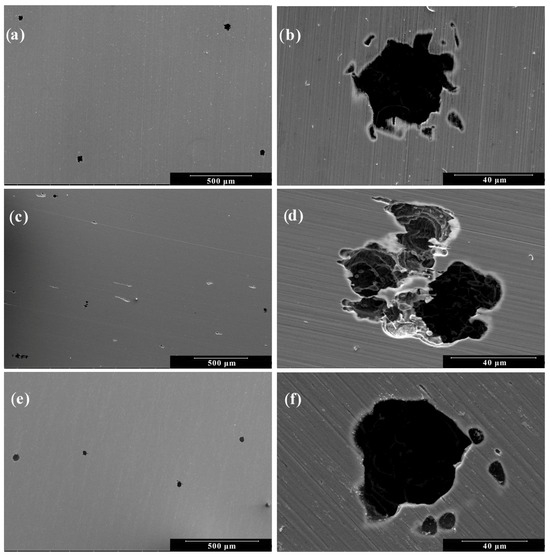
Figure 5.
Scanning electron micrographs of 410F alloy after anodic polarization: Low Magnification (500×) at pH levels of (a) 5.8; (c) 4.0; and (e) 2.0. High Magnification (2000×) at pH levels of (b) 5.8; (d) 4.0; and (f) 2.0.
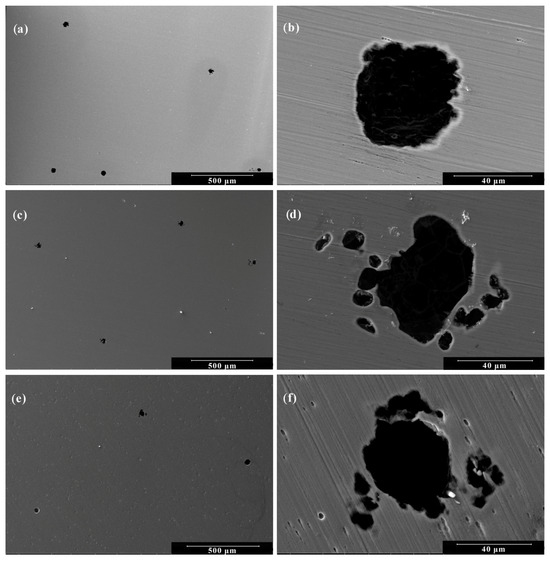
Figure 6.
Scanning electron micrographs of 410T alloy after anodic polarization: Low Magnification (500×) at pH levels of (a) 5.8; (c) 4.0; and (e) 2.0. High Magnification (2000×) at pH levels of (b) 5.8; (d) 4.0; and (f) 2.0.
Both alloys exhibited similar surface morphologies across the tested conditions. At a pH level of 5.8 (Figure 5a and Figure 6a), small and widely dispersed pits were observed, suggesting limited but localized film breakdown. At a pH level of 4.0 (Figure 5b and Figure 6b), the pits appeared larger and more developed, accompanied by the presence of smaller secondary pits, indicating a moderate increase in pitting susceptibility. At a pH level of 2.0 (Figure 5c and Figure 6c), a marked intensification of localized corrosion was observed, characterized by a high density of shallow and coalescing pits, reflecting the strong corrosive nature of the highly acidic environment. While for the two media with higher pH values, the resulting degradation morphology was virtually indistinguishable, for the highly acidic medium of pH 2.0, the samples showed only slight variation in behavior. These results reinforce the electrochemical data, confirming that a decreasing pH level not only increases the overall corrosion rate but also intensifies localized attacks due to reduced passive film stability. Overall, while both materials are susceptible to localized attacks in acidic chloride media, the 410T alloy, produced by thermomechanical treatment, did not show higher pitting susceptibility.
3.2.3. Cyclic Polarization
Figure 7 shows the cyclic polarization curves for both alloys in the media studied. The difference between forward and reverse scans, or hysteresis, provides information on the presence of localized corrosion, i.e., pitting corrosion [23]. The protection potential, Eprot, is characterized as the potential at which the reverse scan intercepts the forward scan at nobler potentials than Ecorr. As such, the nobler the Eprot exhibited by a material, the more resistant it is believed to be regarding localized corrosion. Another important parameter to observe in cyclic polarization is the potential of anodic–cathodic transition during the reverse scan (Ea–c). Because it is related to the stability of the passive layer formed, a more distant Ea–c from the vertex potential can be an indication of greater corrosion resistance [34,35].
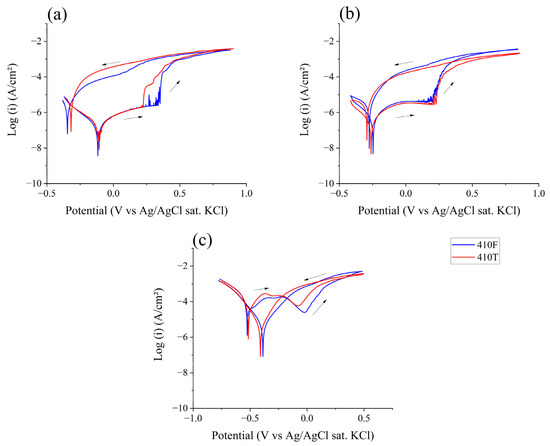
Figure 7.
Cyclic polarization of 410F and 410T alloys in electrolytes with pH values of (a) 5.8; (b) 4.0; and (c) 2.0. The arrows indicate scan direction.
Table 6 presents the anodic-to-cathodic transition potential (Ea–c) and the protection potential (Eprot) for both alloys in the different tested media. According to the polarization curves shown in Figure 7, at pH levels of 5.8 and 4.0, neither 410F nor 410T exhibited a distinct protection potential. In these cases, their reverse scan curves overlap on the cathodic side of the corrosion potential, indicating that repassivation did not occur and suggesting susceptibility to sustained localized corrosion. At a pH level of 2.0, however, both alloys displayed measurable protection potentials, with values of approximately 0.26 V, related to their OCP. This shift suggests that under highly acidic conditions, both materials retained some capacity for repassivation once a sufficiently anodic potential was reached. Another important indicator of the prevalence of localized corrosion is the presence and intensity of hysteresis between the forward and reverse scans. The greater the hysteresis, the more disturbed the oxide film and the more difficult it is for repassivation processes to occur. It is clear from Figure 7 that acidification of the electrolyte resulted in a decrease in hysteresis, which aligns with the Eprot being presented only in a pH 2.0 solution [34].

Table 6.
Anodic–cathodic transition potentials (Ea–c) and protection potentials (Eprot) obtained from cyclic polarization experiments for 410F and 410T samples.
Although the chemical composition of the passive film was not investigated in this work, previous studies have shown that it is significantly influenced by the solution pH level, with lower pH levels favoring a higher chromium-to-iron compound ratio due to the preferential dissolution of iron species [25,36,37]. Elsner and Rossi [25] demonstrated that passive films enriched in chromium exhibit improved repassivation capabilities, which may explain the presence of a distinct protection potential (Eprot) only in the most acidic solution (pH 2.0). As the pH level decreased, both alloys exhibited a consistent trend in their anodic-to-cathodic transition potential (Ea–c), becoming increasingly less noble. When compared to the vertex potential, this shift in Ea–c reflects a decline in repassivation ability and overall corrosion resistance under more acidic conditions. These findings are consistent with the electrochemical behavior observed throughout the study and further support the notion that the acidification of the medium significantly destabilizes the passive layer.
3.2.4. Electrochemical Impedance Spectroscopy
Figure 8 shows the Nyquist plots constructed from EIS tests. For pH 5.8 and 4.0 media, the behavior observed for both alloys was similar, with a single large capacitive arc being observed. At a pH level of 2.0, both alloys showed a clear trace of a second process at the low-frequency region, possibly related to a second capacitive arc or a diffusion tail. Although, when considered in relation to the corrosion behavior of stainless steels, two processes are often identified, regarding the charge transfer reaction and oxide film resistance [38].
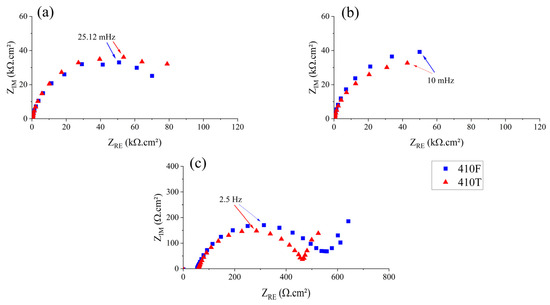
Figure 8.
Nyquist plots of 410F and 410T alloys in electrolytes with pH values of (a) 5.8; (b) 4.0; and (c) 2.0.
The polarization resistance (Rp) of the samples for each medium can be estimated by extrapolating the capacitive loops observed in the Nyquist plots to the real axis. The value of Rp can be related to the corrosion resistance of a material, with higher values indicating more resistance [39,40,41]. The calculated Rp values for the samples in different media are shown in Table 7. As expected, the decrease in pH resulted in a significant reduction of Rp for both alloys, which was especially noteworthy between the pH 4.0 and pH 2.0 results, where the resistance was reduced by almost three orders of magnitude. Regarding the effect of the heat treatment performed, both alloys exhibited the same trend regarding the acidification of the medium. While for a pH level of 4.0, the 410T samples generally presented slightly higher values of resistance, overall, the presence of a martensitic structure indicated no significant detrimental effect. These findings align with the trends observed in the icorr values and SEM analyses, reinforcing the finding that the thermomechanical treatment does not significantly impair corrosion performance under the conditions evaluated.

Table 7.
Rp values of the samples.
Figure 9 shows the Bode curves obtained from the EIS experiments. They show that for all electrolytes, there is a constant value plateau of impedance module in the high-frequency region. This value can be related to solution resistance, which in turn is dependent on its ionic concentration [29]. The observed modulus impedance values in the low-frequency range are related to the polarization resistance, Rp. The medium’s pH level decreased, and the impedance modulus values were also reduced, which is particularly significant for media with pH levels between 4.0 and 2.0. This behavior corroborates the results found from the Nyquist diagrams and the previously discussed polarization resistance data.
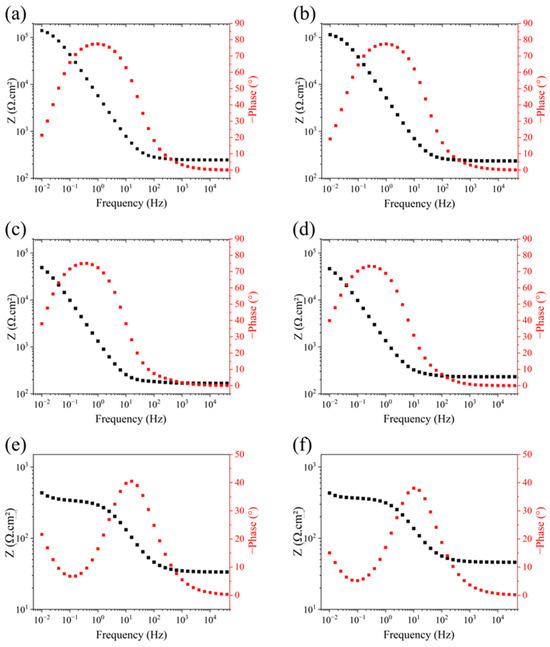
Figure 9.
Bode plots of 410F and 410T alloys in electrolytes with pH values of (a) 5.8—410F; (b) 5.8—410T; (c) 4.0—410F; (d) 4.0—410T; (e) 2.0—410F; (f) 2.0—410T.
The phase angle diagrams for both alloys in media with pH levels of 5.8 and 4.0 exhibit a single, broad peak centered at approximately 80°, as shown in Figure 9a–d. While ideal capacitive behavior is characterized by a 90° phase angle, the slight reduction observed here is common in metallic systems and is typically attributed to surface heterogeneity, microstructural complexity, and deviations from ideal dielectric behavior [42,43].
According to the literature, the presence of a broad phase angle peak often suggests the contribution of more than one electrochemical process or time constant [42,44,45]. In this case, although the Nyquist plots display a single capacitive loop, the Bode phase plots imply the coexistence of at least two time constants with similar characteristic frequencies. These closely spaced processes may overlap in the frequency domain, resulting in a merged peak that appears as a single broadened maximum. In the pH 2.0 medium, the separation between time constants becomes more evident, with two distinct phase angle peaks appearing for both alloys. This behavior indicates a clearer contribution from two electrochemical processes—typically interpreted as charge transfer resistance and passive film behavior occurring on different spatial or temporal scales. Additionally, the maximum phase angle under this condition decreases to approximately 40°, reflecting a substantial increase in surface heterogeneity and deviation from the ideal capacitive response. Such a reduction suggests passive layer instability and a more complex corrosion mechanism in the highly acidic environment. When comparing the alloys, both exhibited similar overall trends across the pH range. However, 410T displayed slightly narrower and more symmetric phase angle peaks at pH levels of 5.8 and 4.0, suggesting that the capacitances of the involved processes are closer to each other. At a pH level of 2.0, 410F maintained a marginally higher maximum phase angle, which may indicate better passive film stability in this aggressive environment. These differences are consistent with the corrosion current density and polarization resistance data, reinforcing the finding that 410F may retain greater film integrity under extreme acidity, most likely due to the higher reactivity of the martensite interface and ground boundaries [28].
3.2.5. Proposed Equivalent Circuit Model
Although the use of the Rp parameter provides initial information on the corrosion resistance of a given material, the use of an equivalent electrical circuit (EEC) for system simulation provides more detailed information and specific results for each process, enabling a more thorough study [39,46]. For the present work, a circuit with two parallel time constants in series with the solution resistance was chosen. Instead of capacitors, constant phase elements (CPEs) were used to better simulate conditions typically observed in experiments. The proposed circuit is shown in Figure 10.
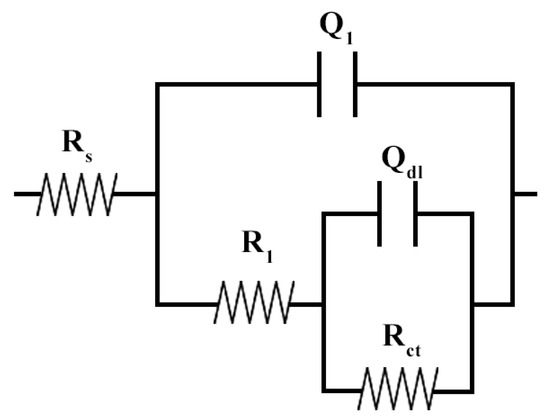
Figure 10.
Equivalent electric circuit used to simulate the system under study.
The physical meaning of the proposed EEC elements is as given: RS represents the ohmic solution resistance; R1 is related to the resistance of the corrosion products formed on the surface of the alloy, or the passive layer resistance; Q1 is the CPE related to the capacitance of the passive layer formed; Rct is the charge transfer resistance; and Qdl is the CPE related to the capacitance of the electronic double layer. The proposed circuit for simulating and studying stainless steels in acidic media can be found in the literature [29,38,42,47,48].
The experimental data obtained are presented in Table 8 and Table 9. The calculation of capacitance from the CPE elements was carried out using the following equation (Equation (6)) [49,50], where C is the capacitance; Y0 is the CPE module; n is the CPE exponent; and Req is the circuit’s equivalent resistance.
C = [Y0/(Req (n−1)](1/n)

Table 8.
Equivalent electric circuit data simulated for 410F alloy.

Table 9.
Equivalent electric circuit data simulated for 410T alloy.
In Table 8 and Table 9, it can be seen that the values of χ2 were low, indicating a good relationship between the simulated results and the experimental data. It can also be seen that the variation between the two alloys under study was minimal for all conditions studied, with most results falling within the overlap of uncertainties, which is in line with previous results. The exponent values of the CPEs point to non-ideal behavior (n < 1), corroborating the observations made from the Bode diagrams. It can be seen that for both alloys, lower pH values resulted in a decrease in solution resistance as expected, given the higher ionic concentration [51]. Furthermore, the corrosion product resistance initially showed no variation as the pH decreased, but at a pH level of 2.0, it exhibited a particular increase, which could be related to different oxide compositions. Regarding the charge transfer resistance, it can be seen that in higher pH solutions, the values calculated for this circuit element were much higher than for the other conditions. Like polarization resistance, the reduction in resistance to charge exchange results in a greater susceptibility to corrosive processes and can be related to higher corrosion rates for a given system, which is in line with the estimations calculated from previously discussed polarization data. The decrease in pH also resulted in an increase in the corrosion product layer’s capacitance, which can be attributed to thinner passive layers in more aggressive solutions [52,53].
3.2.6. Chronoamperometry
Figure 11 shows the chronoamperograms of 410F and 410T samples in media of different pH values over a duration of 900 s. It can be seen that the current density evolution with immersion time was similar for both materials across all of the electrolytes used in this study.
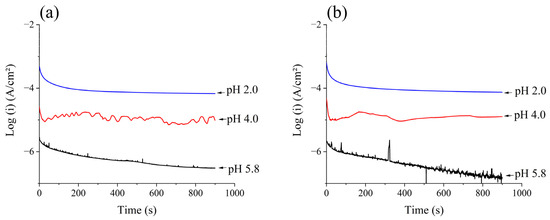
Figure 11.
Chronoamperograms for (a) 410F e (b) 410T alloys in different pH electrolytes.
A significant decrease in current was observed at a short immersion time, with a subsequent stabilization of current at a steady state of current density. As the pH value decreased, the stabilized current increased, as can be seen in Table 10, which shows the steady-state current density found in the samples of each medium. Higher values of current density indicate a more intensive corrosion process taking place, with lower values being an indication of higher corrosion resistance [54,55]. Once again, the results indicate that the thermomechanical treatment applied to the 410T samples did not negatively impact their corrosion resistance. Although the literature frequently reports a reduction in corrosion resistance associated with martensitic transformation, this effect is typically linked to the presence of precipitates [28]. Such precipitates can act as anodic initiation sites, generating high-energy regions within the iron matrix and inducing chromium-depleted zones in their vicinity. These microstructural alterations are often the result of tempering treatments and tend to intensify with increasing tempering temperatures [56]. In the present study, the thermomechanical process employed, combined with the relatively low carbon content of the base alloy, likely produced a final microstructure with minimal precipitation and reduced defect clustering. This may have contributed to the observed stability of the passive film and the absence of significant degradation in corrosion performance, even in the presence of martensite. Nonetheless, a slight reduction in performance was noted under highly acidic conditions, suggesting that passive film integrity may still be partially compromised in extreme environments.

Table 10.
Steady state current densities, in µA/cm2, obtained from chronoamperometry experiments for 410F and 410T samples.
3.3. Oxide Film Characterization
Figure 12 shows the Raman spectra of the alloys presently studied after polarization in a NaCl 500 ppm medium. It is clear that the process employed in obtaining the 410T alloy had no apparent effect on its main oxide layer compounds. Both spectra show multiple sharp peaks at 230 cm−1 (Fe2O3) [57,58], 290 cm−1 (Cr2O3) [57,59], 400 cm−1 (Fe2O3) [57,58], and 600 cm−1 (Cr2O3) [57] and low-intensity broad peaks at 490 cm−1 (Fe2O3) [57,60] and 1290 cm−1 (γ-FeOOH) [57,60]. Fe-O stretching vibrations from iron oxides or hydroxides often display several prominent peaks around the 240–350 cm−1 region. These peaks can overlap with the frequencies of some chromium oxides, such as Cr2O3, and distinguishing them can be somewhat difficult [61,62,63]. The formation of γ-FeOOH is expected in low Cl- concentrations, such as the medium in the present study. At higher Cl- concentrations, the formation of β-FeOOH is facilitated [51]. These results indicate the formation of an oxide layer, characteristic of stainless steels, acting as a passive film in both samples. This layer is mainly composed of Fe2O3, Cr2O3, and γ-FeOOH, which is supported by other works in the literature regarding the study of oxide films in stainless steels [64,65,66].
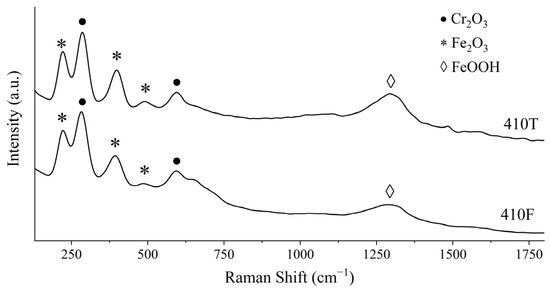
Figure 12.
Raman spectroscopy spectra of 410F and 410T samples after anodic polarization in 500 ppm NaCl.
4. Conclusions
Microstructural characterization confirmed that the thermomechanical treatment induced a martensitic transformation in the UNS S41003 alloy, resulting in a dual-phase microstructure distinct from the fully ferritic condition of the untreated sample. This transformation led to a substantial increase in Vickers microhardness, demonstrating a clear improvement in mechanical performance. The formation of martensite, often associated with reduced corrosion resistance in stainless steels, did not adversely affect the electrochemical behavior of the alloy under the tested conditions. Electrochemical analyses confirmed that both 410F and 410T maintained passive behavior across all pH levels, with pitting corrosion as the predominant localized degradation mechanism in acidic environments. Decreasing the pH level led to expected reductions in the open-circuit potential, charge transfer resistance, and polarization resistance, along with increased corrosion current densities—indicating intensified corrosion kinetics driven by elevated proton concentration. Despite these aggressive conditions, the corrosion resistance of the treated alloy remained statistically equivalent to that of the untreated condition across all tested media. These results emphasize the effectiveness of the thermomechanical treatment not only in improving hardness but also in preserving corrosion resistance, even after inducing a significant structural transformation. The ability to retain electrochemical stability while enhancing mechanical properties substantially broadens the range of potential applications for UNS S41003, particularly in structural components exposed to mechanically demanding and corrosive environments, such as petrochemical infrastructure, marine systems, and industrial processing equipment. The treated alloy thus presents itself as a robust alternative for use in scenarios in which conventional ferritic stainless steels may fall short in terms of mechanical performance.
Author Contributions
Conceptualization, W.S.A. and A.K.d.N.V.; methodology, W.S.A., D.d.C.G. and C.H.B.Q.; validation, C.H.B.Q., D.A.M., R.B.V., O.B.F.D. and M.A.C.F.; formal analysis, O.B.F.D. and G.F.R.; investigation, R.B.V., C.H.B.Q. and D.A.M.; resources, W.S.A., A.K.d.N.V. and M.A.C.F.; data curation, C.H.B.Q., O.B.F.D. and D.A.M.; writing—original draft preparation, D.A.M., R.B.V., D.d.C.G., G.F.R. and C.H.B.Q.; writing—review and editing, O.B.F.D., D.d.C.G., G.F.R. and R.B.V.; visualization, W.S.A., A.K.d.N.V., D.d.C.G., G.F.R. and M.A.C.F.; supervision, W.S.A.; project administration, W.S.A. and M.A.C.F.; funding acquisition, W.S.A. and A.K.d.N.V. All authors have read and agreed to the published version of the manuscript.
Funding
The authors received no financial support for the research, authorship, and/or publication of this article.
Data Availability Statement
The original contributions presented in this study are included in the article. Further inquiries can be directed to the corresponding author.
Acknowledgments
The authors acknowledge Brazilian agencies Conselho Nacional de Desenvolvimento Científico e Tecnológico (CNPq), Coordenação de Aperfeiçoamento de Pessoal de Nível Superior (CAPES), and Fundação Cearense de Apoio ao Desenvolvimento Científico e Tecnológico (Funcap) for the support and Central Analítica for the SEM analyses.
Conflicts of Interest
The authors declare no conflicts of interest. The funders had no role in the design of the study; in collection, analysis, or interpretation of data; the writing of the manuscript; or the decision to publish the results.
References
- Messinese, E.; Casanova, L.; Paterlini, L.; Capelli, F.; Bolzoni, F.; Ormellese, M.; Brenna, A. A Comprehensive Investigation on the Effects of Surface Finishing on the Resistance of Stainless Steel to Localized Corrosion. Metals 2022, 12, 1751. [Google Scholar] [CrossRef]
- Lo, K.H.; Shek, C.H.; Lai, J.K.L. Recent Developments in Stainless Steels. Mater. Sci. Eng. R Rep. 2009, 65, 39–104. [Google Scholar] [CrossRef]
- Zaffora, A.; Di Franco, F.; Megna, B.; Santamaria, M. One-Step Electrodeposition of Superhydrophobic Coating on 316l Stainless Steel. Metals 2021, 11, 1867. [Google Scholar] [CrossRef]
- Cashell, K.A.; Baddoo, N.R. Ferritic Stainless Steels in Structural Applications. Thin-Walled Struct. 2014, 83, 169–181. [Google Scholar] [CrossRef]
- Pimenta, A.R.; Loureiro, R.C.P.; Breves, I.M.S.; Perez, G.; Tavares, S.S.M. Microstructural Characterization of Low Carbon UNS S41003 Stainless Steel with Different Processing Routes (Hot Rolling and Annealing). Metallogr. Microstruct. Anal. 2024, 13, 880–890. [Google Scholar] [CrossRef]
- Yu, Y.; Shironita, S.; Souma, K.; Umeda, M. Effect of Chromium Content on the Corrosion Resistance of Ferritic Stainless Steels in Sulfuric Acid Solution. Heliyon 2018, 4, e00958. [Google Scholar] [CrossRef] [PubMed]
- Lúcio de Faria, G.; Godefroid, L.B.; Nunes, I.P.; Carlos de Lacerda, J. Effect of Martensite Volume Fraction on the Mechanical Behavior of an UNS S41003 Dual-Phase Stainless Steel. Mater. Sci. Eng. A 2020, 797, 140208. [Google Scholar] [CrossRef]
- Campbell, F.C. (Ed.) Elements of Metallurgy and Engineering Alloys, 1st ed.; ASM International: Almere, The Netherlands, 2008. [Google Scholar]
- Lalthazuala, R.; Darunkumar Singh, K. Structural Behaviour of Hybrid Stainless Steel Stub Columns under Axial Compression. Structures 2020, 27, 128–140. [Google Scholar] [CrossRef]
- Wu, W.; Liu, Z.; Hu, S.; Li, X.; Du, C. Effect of PH and Hydrogen on the Stress Corrosion Cracking Behavior of Duplex Stainless Steel in Marine Atmosphere Environment. Ocean. Eng. 2017, 146, 311–323. [Google Scholar] [CrossRef]
- Pessu, F.; Barker, R.; Neville, A. The Influence of PH on Localized Corrosion Behavior of X65 Carbon Steel in CO2-Saturated Brines. Corrosion 2015, 71, 1452–1466. [Google Scholar] [CrossRef]
- Loto, R.T. Study of the Corrosion Behaviour of S32101 Duplex and 410 Martensitic Stainless Steel for Application in Oil Refinery Distillation Systems. J. Mater. Res. Technol. 2017, 6, 203–212. [Google Scholar] [CrossRef]
- Bahadori, A. Engineering and Technical Guidelines for Painting. In Essentials of Coating, Painting, and Lining for the Oil, Gas and Petrochemical Industries; Elsevier: Amsterdam, The Netherlands, 2015; pp. 107–156. [Google Scholar]
- Fortes, J.C.; Dávila, J.M.; Sarmiento, A.M.; Luís, A.T.; Santisteban, M.; Díaz-Curie, J.; Córdoba, F.; Grande, J.A. Corrosion of Metallic and Structural Elements Exposed to Acid Mine Drainage (AMD). Mine Water Environ. 2020, 39, 195–203. [Google Scholar] [CrossRef]
- Visgilio, G.R.; Dawson, J.; Siver, P.A.; Whitelaw, D.M. Acid in the Environment: An Overview. In Acid in the Environment; Springer: Boston, MA, USA, 2007; pp. 1–12. [Google Scholar]
- ASTM Committee G-1 on Corrosion of Metals. Standard Practice for Preparing, Cleaning, and Evaluating Corrosion Test Specimens; ASTM International: West Conshohocken, PA, USA, 2017. [Google Scholar]
- E28 Committee. Test Methods for Vickers Hardness and Knoop Hardness of Metallic Materials; ASTM International: West Conshohocken, PA, USA, 2023. [Google Scholar]
- Olson, D.L.; Siewert, T.A.; Liu, S.; Edwards, G.R. (Eds.) Welding, Brazing, and Soldering; ASM International: Almere, The Netherlands, 1993. [Google Scholar]
- Sundqvist, J.; Kaplan, A.F.H. Sensitisation Behaviour of Drop-Deposited 11% Cr Ferritic Stainless Steel. Opt. Laser Technol. 2018, 108, 487–495. [Google Scholar] [CrossRef]
- de Barros Machado Vilela, L.; de Faria, G.L.; de Alcântara Aperam, C.M.; de Oliveira, T.R.; Cota, A. Efeito da taxa de resfriamento sobre a formação de martensita em um aço inoxidável ferrítico com 11 %Cr e baixos teores de intersticiais. Matéria 2019, 24, e-12280. [Google Scholar] [CrossRef]
- Alves, J.M.; Brandão, L.P.; Paula, A.D.S. Mechanically Induced Martensitic Transformation of Hot Rolled and Annealed 304L Austenitic Stainless Steel at Room and Cryogenic Temperatures. Mater. Res. 2019, 22 (Suppl. 1), e20190150. [Google Scholar] [CrossRef]
- Krauss, G. Quench and Tempered Martensitic Steels. Comprehensive Materials Processing; Elsevier: Amsterdam, The Netherlands, 2014. [Google Scholar] [CrossRef]
- Rosen, E.M.; Silverman, D.C. Corrosion Prediction from Polarization Scans Using an Artificial Neural Network Integrated with an Expert System. Corrosion 1992, 48, 734–745. [Google Scholar] [CrossRef]
- Cui, Z.; Chen, S.; Dou, Y.; Han, S.; Wang, L.; Man, C.; Wang, X.; Chen, S.; Cheng, Y.F.; Li, X. Passivation Behavior and Surface Chemistry of 2507 Super Duplex Stainless Steel in Artificial Seawater: Influence of Dissolved Oxygen and PH. Corros. Sci. 2019, 150, 218–234. [Google Scholar] [CrossRef]
- Elsner, B.; Rossi, A.M. Effect of PH on Electrochemical Behaviour and Passive Film Composition of Stainless Steels. Mater. Sci. Forum 1995, 192, 225–236. [Google Scholar] [CrossRef]
- Wang, Z.; Zhou, Z.-Q.; Zhang, L.; Hu, J.-Y.; Zhang, Z.-R.; Lu, M.-X. Effect of PH on the Electrochemical Behaviour and Passive Film Composition of 316L Stainless Steel. Acta Metall. Sin. (Engl. Lett.) 2019, 32, 585–598. [Google Scholar] [CrossRef]
- Ghahremaninezhad, A.; Wang, W.; Asselin, E.; Budac, J.; Alfantazi, A. Electrochemical and Corrosion Behaviour of Stainless Steels 316L and 317L in Chloridised Ammonium Sulphate Solution. Can. Metall. Q. 2012, 51, 471–484. [Google Scholar] [CrossRef]
- Wang, L.; Dong, C.; Man, C.; Hu, Y.; Yu, Q.; Li, X. Effect of microstructure on corrosion behavior of high strength martensite steel—A literature review. Int. J. Miner. Metall. Mater. 2021, 28, 754–773. [Google Scholar] [CrossRef]
- Li, H.; Jiang, Z.; Feng, H.; Wang, Q.; Zhang, W.; Fan, G.; Li, G.; Wang, L. Electrochemical Corrosion Characteristics of Super Duplex Stainless Steel S32750 in LT-MED Environment. Int. J. Electrochem. Sci. 2015, 10, 1616–1631. [Google Scholar] [CrossRef]
- Galvele, J.R. Transport Processes in Passivity Breakdown—II. Full Hydrolysis of the Metal Ions. Corros. Sci. 1981, 21, 551–579. [Google Scholar] [CrossRef]
- Choudhary, S.; Kelly, R.G.; Birbilis, N. On the Origin of Passive Film Breakdown and Metastable Pitting for Stainless Steel 316L. Corros. Sci. 2024, 230, 111911. [Google Scholar] [CrossRef]
- Parangusan, H.; Bhadra, J.; Al-Thani, N. A Review of Passivity Breakdown on Metal Surfaces: Influence of Chloride- and Sulfide-Ion Concentrations, Temperature, and PH. Emergent Mater. 2021, 4, 1187–1203. [Google Scholar] [CrossRef]
- Al Saadi, S.; Yi, Y.; Cho, P.; Jang, C.; Beeley, P. Passivity Breakdown of 316L Stainless Steel during Potentiodynamic Polarization in NaCl Solution. Corros. Sci. 2016, 111, 720–727. [Google Scholar] [CrossRef]
- Esmailzadeh, S.; Aliofkhazraei, M.; Sarlak, H. Interpretation of Cyclic Potentiodynamic Polarization Test Results for Study of Corrosion Behavior of Metals: A Review. Prot. Met. Phys. Chem. Surf. 2018, 54, 976–989. [Google Scholar] [CrossRef]
- Cotolan, N.; Pop, A.; Marconi, D.; Ponta, O.; Muresan, L.M. Corrosion Behavior of TiO2-coated Ti–6Al–7Nb Surfaces Obtained by Anodic Oxidation in Sulfuric or Acetic Acid. Mater. Corros. 2015, 66, 635–642. [Google Scholar] [CrossRef]
- Lodhi, M.J.K.; Deen, K.M.; Haider, W. Corrosion Behavior of Additively Manufactured 316L Stainless Steel in Acidic Media. Materialia 2018, 2, 111–121. [Google Scholar] [CrossRef]
- Kumagai, M.; Myung, S.T.; Kuwata, S.; Asaishi, R.; Yashiro, H. Corrosion Behavior of Austenitic Stainless Steels as a Function of PH for Use as Bipolar Plates in Polymer Electrolyte Membrane Fuel Cells. Electrochim. Acta 2008, 53, 4205–4212. [Google Scholar] [CrossRef]
- Fu, J.; Wang, J.; Li, F.; Cui, K.; Du, X.; Wu, Y. Effect of Nb Addition on the Microstructure and Corrosion Resistance of Ferritic Stainless Steel. Appl. Phys. A 2020, 126, 194. [Google Scholar] [CrossRef]
- Polo, J.L.; Cano, E.; Bastidas, J.M. An Impedance Study on the Influence of Molybdenum in Stainless Steel Pitting Corrosion. J. Electroanal. Chem. 2002, 537, 183–187. [Google Scholar] [CrossRef]
- Fattah-alhosseini, A.; Vafaeian, S. Effect of Solution PH on the Electrochemical Behaviour of AISI 304 Austenitic and AISI 430 Ferritic Stainless Steels in Concentrated Acidic Media. Egypt. J. Pet. 2015, 24, 333–341. [Google Scholar] [CrossRef]
- Chaves, R.; Costa, I.; De Melo, H.G.; Wolynec, S. Evaluation of Selective Corrosion in UNS S31803 Duplex Stainless Steel with Electrochemical Impedance Spectroscopy. Electrochim. Acta 2006, 51, 1842–1846. [Google Scholar] [CrossRef]
- Bautista, A.; González-Centeno, A.; Blanco, G.; Guzmán, S. Application of EIS to the Study of Corrosion Behaviour of Sintered Ferritic Stainless Steels before and after High-Temperature Exposure. Mater. Charact. 2008, 59, 32–39. [Google Scholar] [CrossRef]
- Ribeiro, D.V.; Souza, C.A.C.; Abrantes, J.C.C. Use of Electrochemical Impedance Spectroscopy (EIS) to Monitoring the Corrosion of Reinforced Concrete. Rev. IBRACON Estrut. Mater. 2015, 8, 529–546. [Google Scholar] [CrossRef]
- Blanco, G.; Bautista, A.; Takenouti, H. EIS Study of Passivation of Austenitic and Duplex Stainless Steels Reinforcements in Simulated Pore Solutions. Cem. Concr. Compos. 2006, 28, 212–219. [Google Scholar] [CrossRef]
- Arena, F.A.; Suegama, P.H.; Bevilaqua, D.; Dos Santos, A.L.A.; Fugivara, C.S.; Benedetti, A.V. Simulating the Main Stages of Chalcopyrite Leaching and Bioleaching in Ferrous Ions Solution: An Electrochemical Impedance Study with a Modified Carbon Paste Electrode. Miner. Eng. 2016, 92, 229–241. [Google Scholar] [CrossRef]
- Satpati, A.K.; Ravindran, P.V. Electrochemical Study of the Inhibition of Corrosion of Stainless Steel by 1,2,3-Benzotriazole in Acidic Media. Mater. Chem. Phys. 2008, 109, 352–359. [Google Scholar] [CrossRef]
- Tang, J.; Yang, X.; Wang, Y.; Wang, H.; Xiao, Y.; Apreutesei, M.; Nie, Z.; Normand, B. Corrosion Behavior of 2205 Duplex Stainless Steels in HCl Solution Containing Sulfide. Metals 2019, 9, 294. [Google Scholar] [CrossRef]
- Kandala, S.R.; Balani, K.; Upadhyaya, A. Mechanical and Electrochemical Characterization of Supersolidus Sintered Austenitic Stainless Steel (316 L). High Temp. Mater. Process. 2019, 38, 792–805. [Google Scholar] [CrossRef]
- Hirschorn, B.; Orazem, M.E.; Tribollet, B.; Vivier, V.; Frateur, I.; Musiani, M. Determination of Effective Capacitance and Film Thickness from Constant-Phase-Element Parameters. Electrochim. Acta 2010, 55, 6218–6227. [Google Scholar] [CrossRef]
- Zhang, X.; Qin, Z.; Zagidulin, D.; Noël, J.J.; Shoesmith, D.W. Effect of Oxide Film Properties on the Kinetics of O 2 Reduction on Alloy C-22. J. Electrochem. Soc. 2017, 164, C911–C917. [Google Scholar] [CrossRef]
- Ai, Z.; Sun, W.; Jiang, J.; Song, D.; Ma, H.; Zhang, J.; Wang, D. Passivation Characteristics of Alloy Corrosion-Resistant Steel Cr10Mo1 in Simulating Concrete Pore Solutions: Combination Effects of PH and Chloride. Materials 2016, 9, 749. [Google Scholar] [CrossRef]
- Harrington, S.P.; Devine, T.M. Analysis of Electrodes Displaying Frequency Dispersion in Mott-Schottky Tests. J. Electrochem. Soc. 2008, 155, C381. [Google Scholar] [CrossRef]
- Dean, M.H.; Stimming, U. Capacity of Semiconductor Electrodes with Multiple Bulk Electronic States Part I. Model and Calculations for Discrete States. J. Electroanal. Chem. Interfacial. Electrochem. 1987, 228, 135–151. [Google Scholar] [CrossRef]
- Von Wandruszka, R.; Orchard, S.W.; Greeff, A. Corrosion Measurements by Potential-Step Chronoamperometry. Talanta 1985, 32, 307–311. [Google Scholar] [CrossRef]
- Gharib, A.; Arab, A. Electrodeposited Pd, PdCd, and PdBi Nanostructures: Preparation, Characterization, Corrosion Behavior, and Their Electrocatalytic Activities for Formic Acid Oxidation. J. Electroanal. Chem. 2020, 866, 114166. [Google Scholar] [CrossRef]
- Gao, B.; Xu, T.; Wang, L.; Liu, Y.; Liu, J.; Zhang, Y.; Sui, Y.; Sun, W.; Chen, X.; Li, X.; et al. Achieving a superior combination of tensile properties and corrosion resistance in AISI420 martensitic stainless steel by low-temperature tempering. Corros. Sci. 2023, 225, 111551. [Google Scholar] [CrossRef]
- Oblonsky, L.J.; Devine, T.M. A Surface Enhanced Raman Spectroscopic Study of the Passive Films Formed in Borate Buffer on Iron, Nickel, Chromium and Stainless Steel. Corros. Sci. 1995, 37, 17–41. [Google Scholar] [CrossRef]
- Gumuslu, T.; Kaba, M.; Atar, E.; Cimenoglu, H. Effect of Testing Temperature on the Impact-Sliding Wear Behaviour of a 316L Austenitic Stainless Steel. Mater. Today Proc. 2023, 81, 81–86. [Google Scholar] [CrossRef]
- Zheng, J.X.; OuYang, S.Q.; Feng, L.; Sun, J.J.; Xuan, Z.W.; Fang, J.H. In-Situ Raman Spectroscopic Studies on Electrochemical Oxidation Behavior of Chromium in Alkaline Solution. J. Electroanal. Chem. 2022, 921, 116682. [Google Scholar] [CrossRef]
- Nuggehalli Sampathkumar, S.; Ferriday, T.B.; Middleton, P.H.; Van Herle, J. Activation of Stainless Steel 316L Anode for Anion Exchange Membrane Water Electrolysis. Electrochem. Commun. 2023, 146, 107418. [Google Scholar] [CrossRef]
- Graedel, T.E.; Frankenthal, R.P. Corrosion Mechanisms for Iron and Low Alloy Steels Exposed to the Atmosphere. J. Electrochem. Soc. 1990, 137, 2385–2394. [Google Scholar] [CrossRef]
- De Faria, D.L.A.; Venâncio Silva, S.; De Oliveira, M.T. Raman Microspectroscopy of Some Iron Oxides and Oxyhydroxides. J. Raman Spectrosc. 1997, 28, 873–878. [Google Scholar] [CrossRef]
- Dunn, D.S.; Bogart, M.B.; Brossia, C.S.; Cragnolino, G.A. Corrosion of Iron Under Alternating Wet and Dry Conditions. Corrosion 2000, 56, 470–481. [Google Scholar] [CrossRef]
- Copeland-Johnson, T.M.; Nyamekye, C.K.A.; Ecker, L.; Bowler, N.; Smith, E.A.; Rebak, R.B.; Gill, S.K. Multi-Modal Analysis of Oxidation on Fe-Cr-Ni Austenitic Stainless Steel 304 Exposed to beyond-Design Basis Temperatures. Corros. Sci. 2023, 218, 111167. [Google Scholar] [CrossRef]
- Zamanizadeh, H.R.; Sunde, S.; Pollet, B.G.; Seland, F. Tailoring the Oxide Surface Composition of Stainless Steel for Improved OER Performance in Alkaline Water Electrolysis. Electrochim. Acta 2022, 424, 140561. [Google Scholar] [CrossRef]
- Xiao, Y.; Tang, J.; Wang, Y.; Lin, B.; Nie, Z.; Li, Y.; Normand, B.; Wang, H. Corrosion Behavior of 2205 Duplex Stainless Steel in NaCl Solutions Containing Sulfide Ions. Corros. Sci. 2022, 200, 110240. [Google Scholar] [CrossRef]
Disclaimer/Publisher’s Note: The statements, opinions and data contained in all publications are solely those of the individual author(s) and contributor(s) and not of MDPI and/or the editor(s). MDPI and/or the editor(s) disclaim responsibility for any injury to people or property resulting from any ideas, methods, instructions or products referred to in the content. |
© 2025 by the authors. Licensee MDPI, Basel, Switzerland. This article is an open access article distributed under the terms and conditions of the Creative Commons Attribution (CC BY) license (https://creativecommons.org/licenses/by/4.0/).