Article

Optimization of Eleven Cross-Roll Straightening Process for 20CrMnTi Bars Based on Combined Hardening Model

1
Key Laboratory of Advanced Forging & Stamping Technology and Science (Yanshan University), Ministry of Education of China, Qinhuangdao 066004, China
2
School of Mechanical Engineering, Yanshan University, Qinhuangdao 066004, China
3
National Key Laboratory of Metal Forming Technology and Heavy Equipment, Xi’an 710000, China
4
China National Heavy Machinery Research Institute Co., Ltd., Xi’an 710016, China
5
School of Mechanical Engineering, Xi’an Jiaotong University, Xi’an 710049, China
*
Author to whom correspondence should be addressed.
Metals 2025, 15(8), 908; https://doi.org/10.3390/met15080908
Submission received: 26 June 2025 / Revised: 23 July 2025 / Accepted: 12 August 2025 / Published: 15 August 2025

Abstract

Straightness is one of the important indices to measure the quality of bars; multi-roll straightening is an essential process in bar production. Materials undergo multiple cycles of alternating tensile and compressive loading during multi-roll straightening, subject to the influence of the Bauschinger effect. However, most existing studies have failed to adequately account for the Bauschinger effect, leading to insufficient prediction accuracy of the process. This study establishes an eleven-roll straightening finite element model (FEM) for bars based on the nonlinear combined hardening model. The orthogonal experimental design method is employed to optimize the process parameters. Straightening experiments of 20CrMnTi bars using an eleven-roll straightener were conducted. Based on the FEM, the influence patterns of different process parameters on the straightening results were investigated. The results indicate excellent agreement between the eleven-roll straightening finite element simulation results and the experimental results. Using the optimized parameters, both the simulated and experimental straightness after straightening were within 1‰, with a relative error between them below 8%. The findings of this study can improve the prediction accuracy of the eleven-roll bar straightening process and provide reliable theoretical support and technical reference for the optimization of straightening process parameters.

1. Introduction

The steel industry is crucial to national economic development and national defense. Within this sector, bar products serve as key materials for machinery manufacturing and are extensively utilized. 20CrMnTi bars, renowned for their excellent hardness and wear resistance, are widely employed in the manufacturing of high-precision components. However, in engineering practice, a prevalent issue is straightness deviation exceeding tolerance limits. This problem arises from the coupling effect of uneven residual stresses induced by heat treatment and plastic deformation occurring during the forming process. The straightness of bars directly impacts the installation accuracy, service life, and overall performance of the final products, as well as the processing efficiency and cost of downstream operations. Consequently, the multi-roll straightening process constitutes an essential stage in bar production.
Multi-roll straightening employs various roll arrangement configurations. Common types include five-roll, six-roll, seven-roll, nine-roll, ten-roll, and eleven-roll straighteners. Specifically, the eleven-roll straightener incorporates an additional, smaller stabilizing tail roll compared to the ten-roll design. This tail roll serves to support the bar and restrict post-straightening whipping motion, thereby contributing to improved straightening accuracy. Although multi-roll straightening processes differ in form, their underlying principle remains consistent. By precisely controlling the reduction settings of each inclined roll, the bar is subjected to alternating reverse bending, inducing appropriate elasto-plastic deformation. The rotation of the rolls drives both the rotation and forward advancement of the workpiece. During the straightening process, the bar undergoes a variable-curvature rotary bending deformation. Material experiences multiple cycles of alternating tensile and compressive loading. Consequently, the influence of the Bauschinger effect must be accounted for in research on multi-roll straightening processes.
The Bauschinger effect refers to the phenomenon where, after a material undergoes plastic deformation in one direction, its yield stress upon subsequent reverse loading exhibits a significant reduction. The isotropic hardening model assumes that only the radius of the yield surface changes, while its central position remains fixed. Consequently, this model fails to capture the Bauschinger effect and significantly overestimates the yield strength during reverse loading. To describe the Bauschinger effect, Prager [1] first proposed the linear kinematic hardening model. Subsequently, Ziegler [2] modified Prager’s hardening model. The linear kinematic hardening model assumes that the yield surface translates linearly in the direction of the plastic strain. Thus, it can only describe linear hardening behavior and cannot account for nonlinear hardening phenomena. Nonlinear hardening is ubiquitous in materials, particularly when subjected to alternating tensile and compressive loading. Armstrong and Frederick [3] introduced a dynamic recovery term into the linear kinematic hardening model, proposing the renowned A–F back stress evolution law, which can describe nonlinear hardening behavior. Chaboche et al. [4,5] decomposed the back stress into the sum of multiple back stress components, each following the A–F type evolution law. The Chaboche combined hardening model (combining the Chaboche back stress model with the isotropic hardening model) provides an accurate description of the response curves generated under cyclic loading. Its relatively simple formulation has led to its widespread embedding within numerous finite element software packages and broad application. Scholars subsequently made modifications to the Chaboche model [6,7,8], which, to some extent, improved the fitting accuracy of the model, but at the same time increased the complexity of the model, making it difficult to apply these modified models. Okorokov et al. [9,10] proposed a novel form of kinematic hardening model; this model can accurately describe hysteresis loops under various loading conditions without requiring the superposition of multiple back stresses.
In the research on multi-roll straightening technology, Cui et al. [11] proposed a unique method for designing the main parameters of straighteners, simplifying their design and manufacturing processes, thereby advancing straightening theory and technology. Liu et al. [12] conducted a novel analysis of the roll shape curves for tube and bar straighteners and proposed a universal straightening principle applicable to different profiles using the same straightening roll. Song [13], through research on adjusting the angles of straightening rolls, provided a theoretical basis for straightener setup. Zhu et al. [14] applied the energy method to derive a calculation formula for the flattening reduction, revealing its variation patterns with diameter and wall thickness. Zhao et al. [15] optimized the roll shape curve formula for inclined-roll straighteners, providing a theoretical basis for determining the installation angle and contact line length. Zheng [16] conducted an in-depth study on the straightening process of a 2-2-2-type straightener based on elasto-plastic bending straightening theory. Zhang et al. [17,18] performed a detailed analysis of the flattening issues in tubes during multi-roll straightening. Current research on the cross-roll straightening process often simplifies the rotary bending process to multiple cycles of in-plane reverse bending, neglecting the strain path variation during rotation. Ma et al. [19] derived the relationship between flattening force and flattening displacement using the energy method, enabling control of the ovality in straightened tubes. Ma et al. [20] conducted a theoretical analysis of the eleven-roll inclined-roll straightening process and validated its effectiveness using field data. Li [21] derived a formula for calculating straightening roll service life based on Miner’s damage criterion, verifying its rationality through finite element simulation and friction-wear experiments, and analyzed key factors affecting roll life. Yao et al. [22] analyzed the influence of bite conditions, contact stress, and strength conditions on the roll diameter and roll pitch of roller straighteners, concluding that strength conditions are the key factor. Hu et al. [23] addressed issues like traditional straightening processes relying on manual experience and low efficiency by optimizing a BP neural network using the Dung Beetle Optimizer (DBO) algorithm to establish a straightening process prediction model. Results showed this method effectively improves prediction accuracy. Gu et al. [24] reviewed the current state of roller straightening technology, analyzed the influence of straightening strategies and key parameters on post-straightening flatness deviation and residual stress, providing theoretical support for the independent development of large-scale roller straightening equipment.
Mwita et al. [25] conducted numerical predictions of the tensile yield strength and hardness properties of Ti6Al4V alloy subjected to Constrained Bending Straightening (CBS) and Severe Plastic Deformation (SPD) processes. Gruber et al. [26] introduced a control scheme for a leveler employing different load triangles to eliminate straightening residual stresses. Petruska et al. [27] addressed the modeling of round bar cross-roll straightening by proposing a novel finite element formulation. This method, based on an Eulerian description, simulates the flow of elasto-plastic material through a fixed spatial finite element mesh, coupled with a multi-roll straightening machine. Asakawa et al. [28] performed a comprehensive analysis of the bar straightening process through simulation and experimental investigation. They proposed a method for predicting the deflection of bars after straightening. This method proves particularly effective for bars with large initial curvature, but further in-depth analysis and research are still required for bars with smaller initial curvature. Meng et al. [29] conducted an in-depth study on the basic problem of rotational bending springback involved in the cross-roller straightening process and proposed a new analytical method for rotational bending springback considering the strain path. Domitner et al. [30] proposed an experimental method to evaluate the wear of rollers in a multi-cross roller straightening process. Niu et al. [31] proposed a new radial feed-in rotary straightening method to address the planetary roller screw deflection problem and verified the feasibility of the process using numerical simulation and experimental methods.
The main literature comparison results are shown in Table 1. In summary, existing research predominantly employs simplified material models, failing to accurately account for the influence of the Bauschinger effect. This limitation leads to insufficient prediction accuracy for the multi-roll straightening process. To address this, this study establishes an eleven-roll bar straightening finite element model based on a nonlinear combined hardening model. The orthogonal experimental design method is utilized to optimize the process parameters. Straightening experiments on 20CrMnTi bars using an eleven-roll straightener were conducted to validate the reliability of both the numerical simulation results and the optimized process parameters. Leveraging the established eleven-roll straightening FEM, the influence patterns of various process parameters on the straightening results were systematically investigated. The findings of this research can provide reliable theoretical support and technical reference for the optimization design of the eleven cross-roll straightening process for 20CrMnTi bars.

2. Process Parameters

The arrangement of rollers in the eleven cross-roll straightening process for bars is shown in Figure 1. The main working components primarily include the straightening rollers and the front/rear sleeves. The key process parameters for eleven-roll straightening include roll gap, roll reduction, roller inclination angle, and straightening speed. The specific definitions of these parameters are as follows:
(1)
Roll gap: Refers to the minimum distance between two rollers.
(2)
Roll reduction: Refers to the displacement of the reverse bending roller relative to other rollers in the height direction, as shown in Figure 2. The greater the roll reduction, the greater the degree of deformation.
(3)
Roller inclination angle: Refers to the angle between the axes of two rollers.
(4)
Straightening speed: Refers to the rotational speed of the straightening rollers.
Figure 1. Schematic diagram of eleven cross-roll straightening process.
Metals 15 00908 g001
Figure 2. Schematic diagram of roll reduction.
Metals 15 00908 g002

3. Constitutive Model

Considering the balance of accuracy, ease of use, and computational efficiency, the Chaboche combined hardening model with three back stresses was selected for this study.
Based on the von Mises isotropic yield criterion, the yield function for the kinematic hardening model can be expressed as follows:
F = 3 2 ( s i j α i j ) ( s i j α i j ) Y
where F is the yield function, s i j is the deviatoric stress tensor, α i j is the back stress tensor (MPa), i , j are tensor indices, and Y is the yield stress.
The evolution law for back stress is categorized into linear and nonlinear forms. The linear expression is as follows:
d α i j = 2 3 C d ε i j p
where C is the parameter for the evolution of back stress.
Armstrong and Frederick [3] introduced a dynamic recovery term into the linear evolution law, proposing the renowned A–F nonlinear back stress evolution law. Its mathematical expression is given by the following equation:
d α i j = 2 3 C d ε i j p γ α i j d p
where γ is the back stress evolution parameters. Compared to the linear kinematic hardening model, the A–F evolution law can accurately describe the nonlinear hardening behavior of materials.
Chaboche [4] proposed an enhanced approach based on the A–F evolution law, representing the back stress as a superposition of multiple components. Each back stress component is assumed to independently follow the A–F evolution law, enabling a more precise description of the material’s nonlinear mechanical behavior:
d α i j = m = 1 N d α i j m
where N is the number of back stress components (in this study, N = 3 is adopted), and d α i j m is the m-th back stress component.
For the commonly used isotropic hardening model in the form of exponential functions, the expression is as follows:
Y = Y 0 + Q [ 1 exp ( b p ) ]
where Y 0 is the initial yield stress (MPa), Q , b is the isotropic hardening parameter, and p is the cumulative plastic strain.
Under uniaxial stress conditions, the back stress evolution law in Equation (3) can be integrated as follows:
α 11 m = α 11 m 0 exp ( γ Δ ε 11 p ) + 2 3 μ C m γ m [ 1 exp ( γ m Δ ε 11 p ) ]
where α 11 m 0 is the initial value of the back stress at the start of the load cycle, Δ ε 11 p is the change in plastic strain during the loading cycle; μ is the loading direction parameter, where μ = ± 1 indicates the direction of loading. When Δ ε 11 p is positive, the value is positive, and when Δ ε 11 p is negative, the value is negative.
Then there is the following:
α = m = 1 N α m 0 exp ( γ m Δ ε 11 p ) + μ C m γ m [ 1 exp ( γ m Δ ε 11 p ) ]
The stress expression for the unidirectional stress state is as follows:
σ 11 = α + μ Y
The stress–strain relationship can be expressed using the linear elasticity assumption for the elastic deformation stage as follows:
σ 11 = E ε 11
where E is the elastic modulus.
4. Materials and Methods

4.1. Material Performance Test

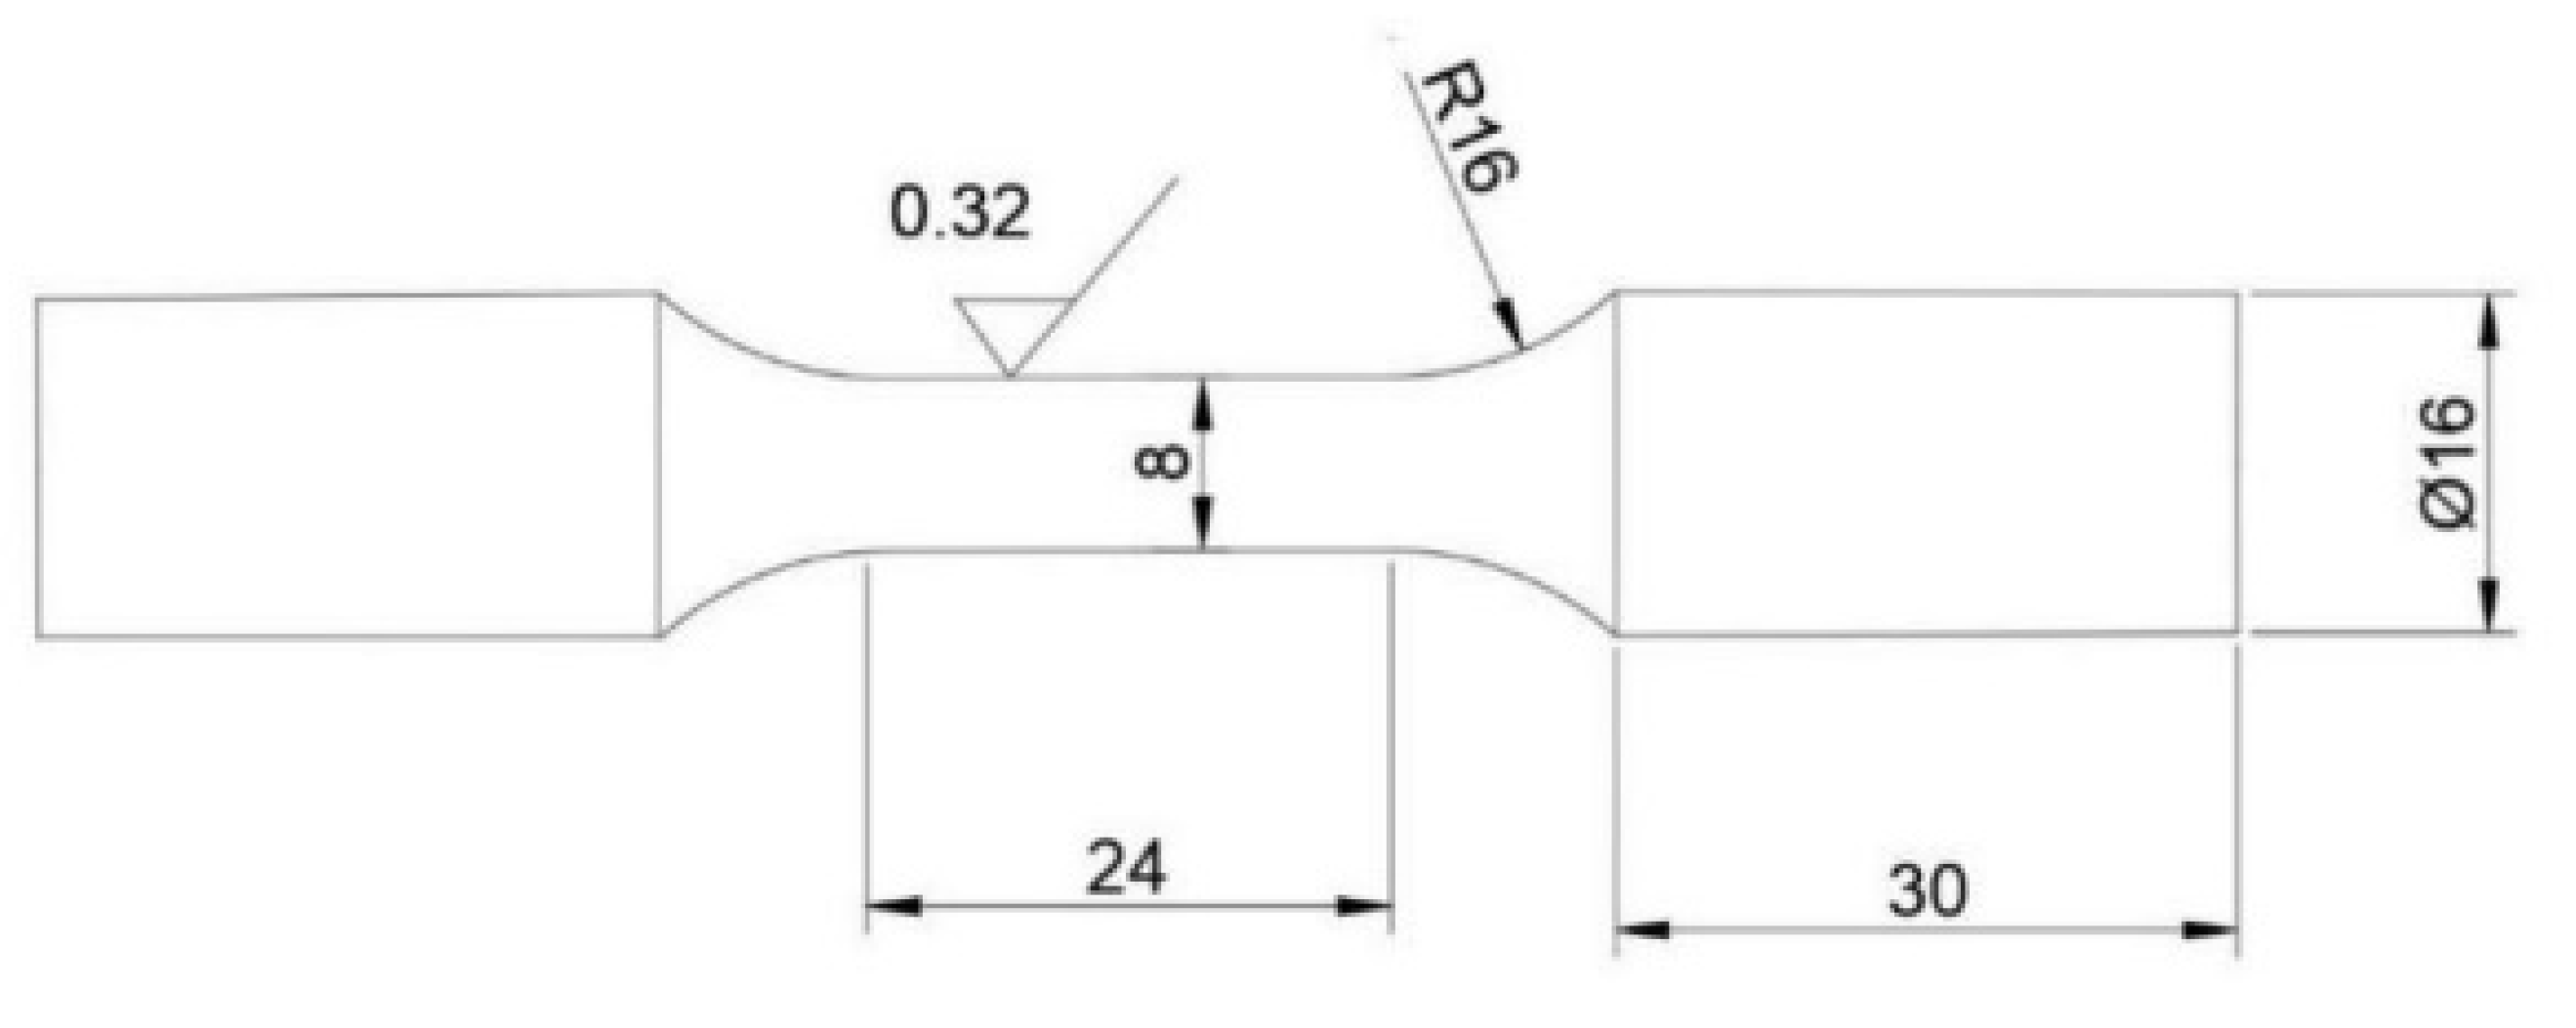
The cyclic test was performed using an Instron 8801 electro-hydraulic servo fatigue testing machine (Hexagon Manufacturing Intelligence, North Kingstown, RI, USA), conducting symmetric cyclic tension–compression tests at room temperature. The specimen specifications are shown in Figure 3. The chemical composition of 20CrMnTi bars is shown in Table 2.
The test procedure is shown in Figure 4. Figure 4a presents the specimen of 20CrMnTi bars subjected to cyclic loading, Figure 4b shows the cyclic loading process, and Figure 4c displays the Instron 8801 electro-hydraulic servo fatigue testing machine used for the tests. The studied bar eleven cross-roll straightening process belongs to the cold deformation process and is in the medium and low strain rate range. The effect of strain rate is ignored in the study. The loading speed of the testing machine is 0.5 mm/min. Corresponding to the maximum strain during the straightening process, the strain amplitude for the cyclic loading tests was set at 0.03.
Based on the analytical results of the hardening model under uniaxial stress conditions, the material parameters of the hardening model were fitted using the least squares method. The goal was to minimize the error between the fitted response curve and the experimental response curve. The error expression is as follows:
σ error = i = 1 N d ( σ model σ exp ) 2 N d
where σ model is the fitted stress (MPa), σ exp is the experimental stress (MPa), and N d is the number of data points used in the fitting.
To avoid local optimum solutions during the least squares fitting process, 10,000 sets of initial parameters were randomly generated. The set with the smallest standard deviation of the fitting results was selected as the final optimal parameters. The obtained fitting parameters are listed in Table 3.
During the testing process, strain control was applied with a strain amplitude of ±0.03, and three stress cycles were performed. The comparison of the fitting results and experimental results of the cyclic response curves is shown in Figure 5. It is evident that the nonlinear combined hardening model provides a good fit for the cyclic response curves, and the model can accurately represent the Bauschinger effect.

4.2. Finite Element Model

Considering the complexity of the straightening machine structure, this study focused on the roller system that directly acts on the bar, excluding non-critical components. The model includes the bar, front and rear sleeves, five pairs of straightening rollers, and the tail roll. Finite element simulations of the eleven-roll straightening process were conducted using the ABAQUS/Explicit module, and the FEM is shown in Figure 6. Since the deformations of the front and rear sleeves and the straightening rollers are minimal during the straightening process, they are assumed to be rigid bodies for computational efficiency. Their mesh type is set as R3D4 with a mesh size of 30 mm for the sleeves and 20 mm for the straightening rollers. The bar is modeled as a deformable body, with material properties as given in Table 3, and its mesh type is set as C3D8R, with 32 nodes along the circumference and 60 nodes along the length. In the contact property formulation, the tangential behavior is modeled using the penalty function. Numerical simulations were performed with friction coefficients of 0.12, 0.15, 0.18, and 0.2. When the friction coefficient was 0.15, the error between the numerical simulation results and the experimental results was the smallest. Therefore, the friction coefficient was taken as 0.15 in the simulation. For normal behavior, a hard contact approach is applied to ensure that the bar is properly constrained by the rollers, preventing unrealistic interpenetration. In terms of boundary conditions, all degrees of freedom for the front and rear sleeves are constrained. A local coordinate system is established for each straightening roller, with the roller axis aligned along the x-axis. All rollers are set as active rollers, and boundary conditions are applied to rotate the rollers along the local x-axis while constraining all other degrees of freedom.
The connecting-both-ends method is used to calculate the deflection. The connecting both ends method refers to connecting the start and end points of the bar axis, then drawing lines parallel to this connecting line through the highest point and the lowest point. The value measured along the vertical coordinate axis between these two parallel lines represents the deflection value. To obtain the straightness data of the bar in post-processing, a quarter-section of the bar is first swept along the axis to generate a quarter-bar model, and the remaining three-quarters of the bar are modeled similarly. These models are then combined to form a single bar entity. Since the bar has an initial deflection, the axis used for sweeping is a line with initial curvature. In the simulation, the bar is initially stress-free, and the effect of initial residual stress is ignored. The initial deflection of the bar is 40 mm, and the length and diameter of the bar are 5000 mm and 71.8 mm, respectively, as shown in Figure 7. For mesh division, each part is handled separately to ensure the presence of nodes along the bar’s axis. The coordinates of all nodes along the axis are extracted to calculate the straightness after straightening. It should be pointed out that due to the existence of half-span straightening blind zones at the head and tail rolls in the multi-cross-roll straightening process, all straightness results in subsequent studies did not calculate the straightening blind zone. The length of the straightening blind zone is 500 mm at the head and tail of the bar, and the straightness is calculated for the middle 4000 mm.

4.3. Eleven Roll Straightening Experiment of Bars

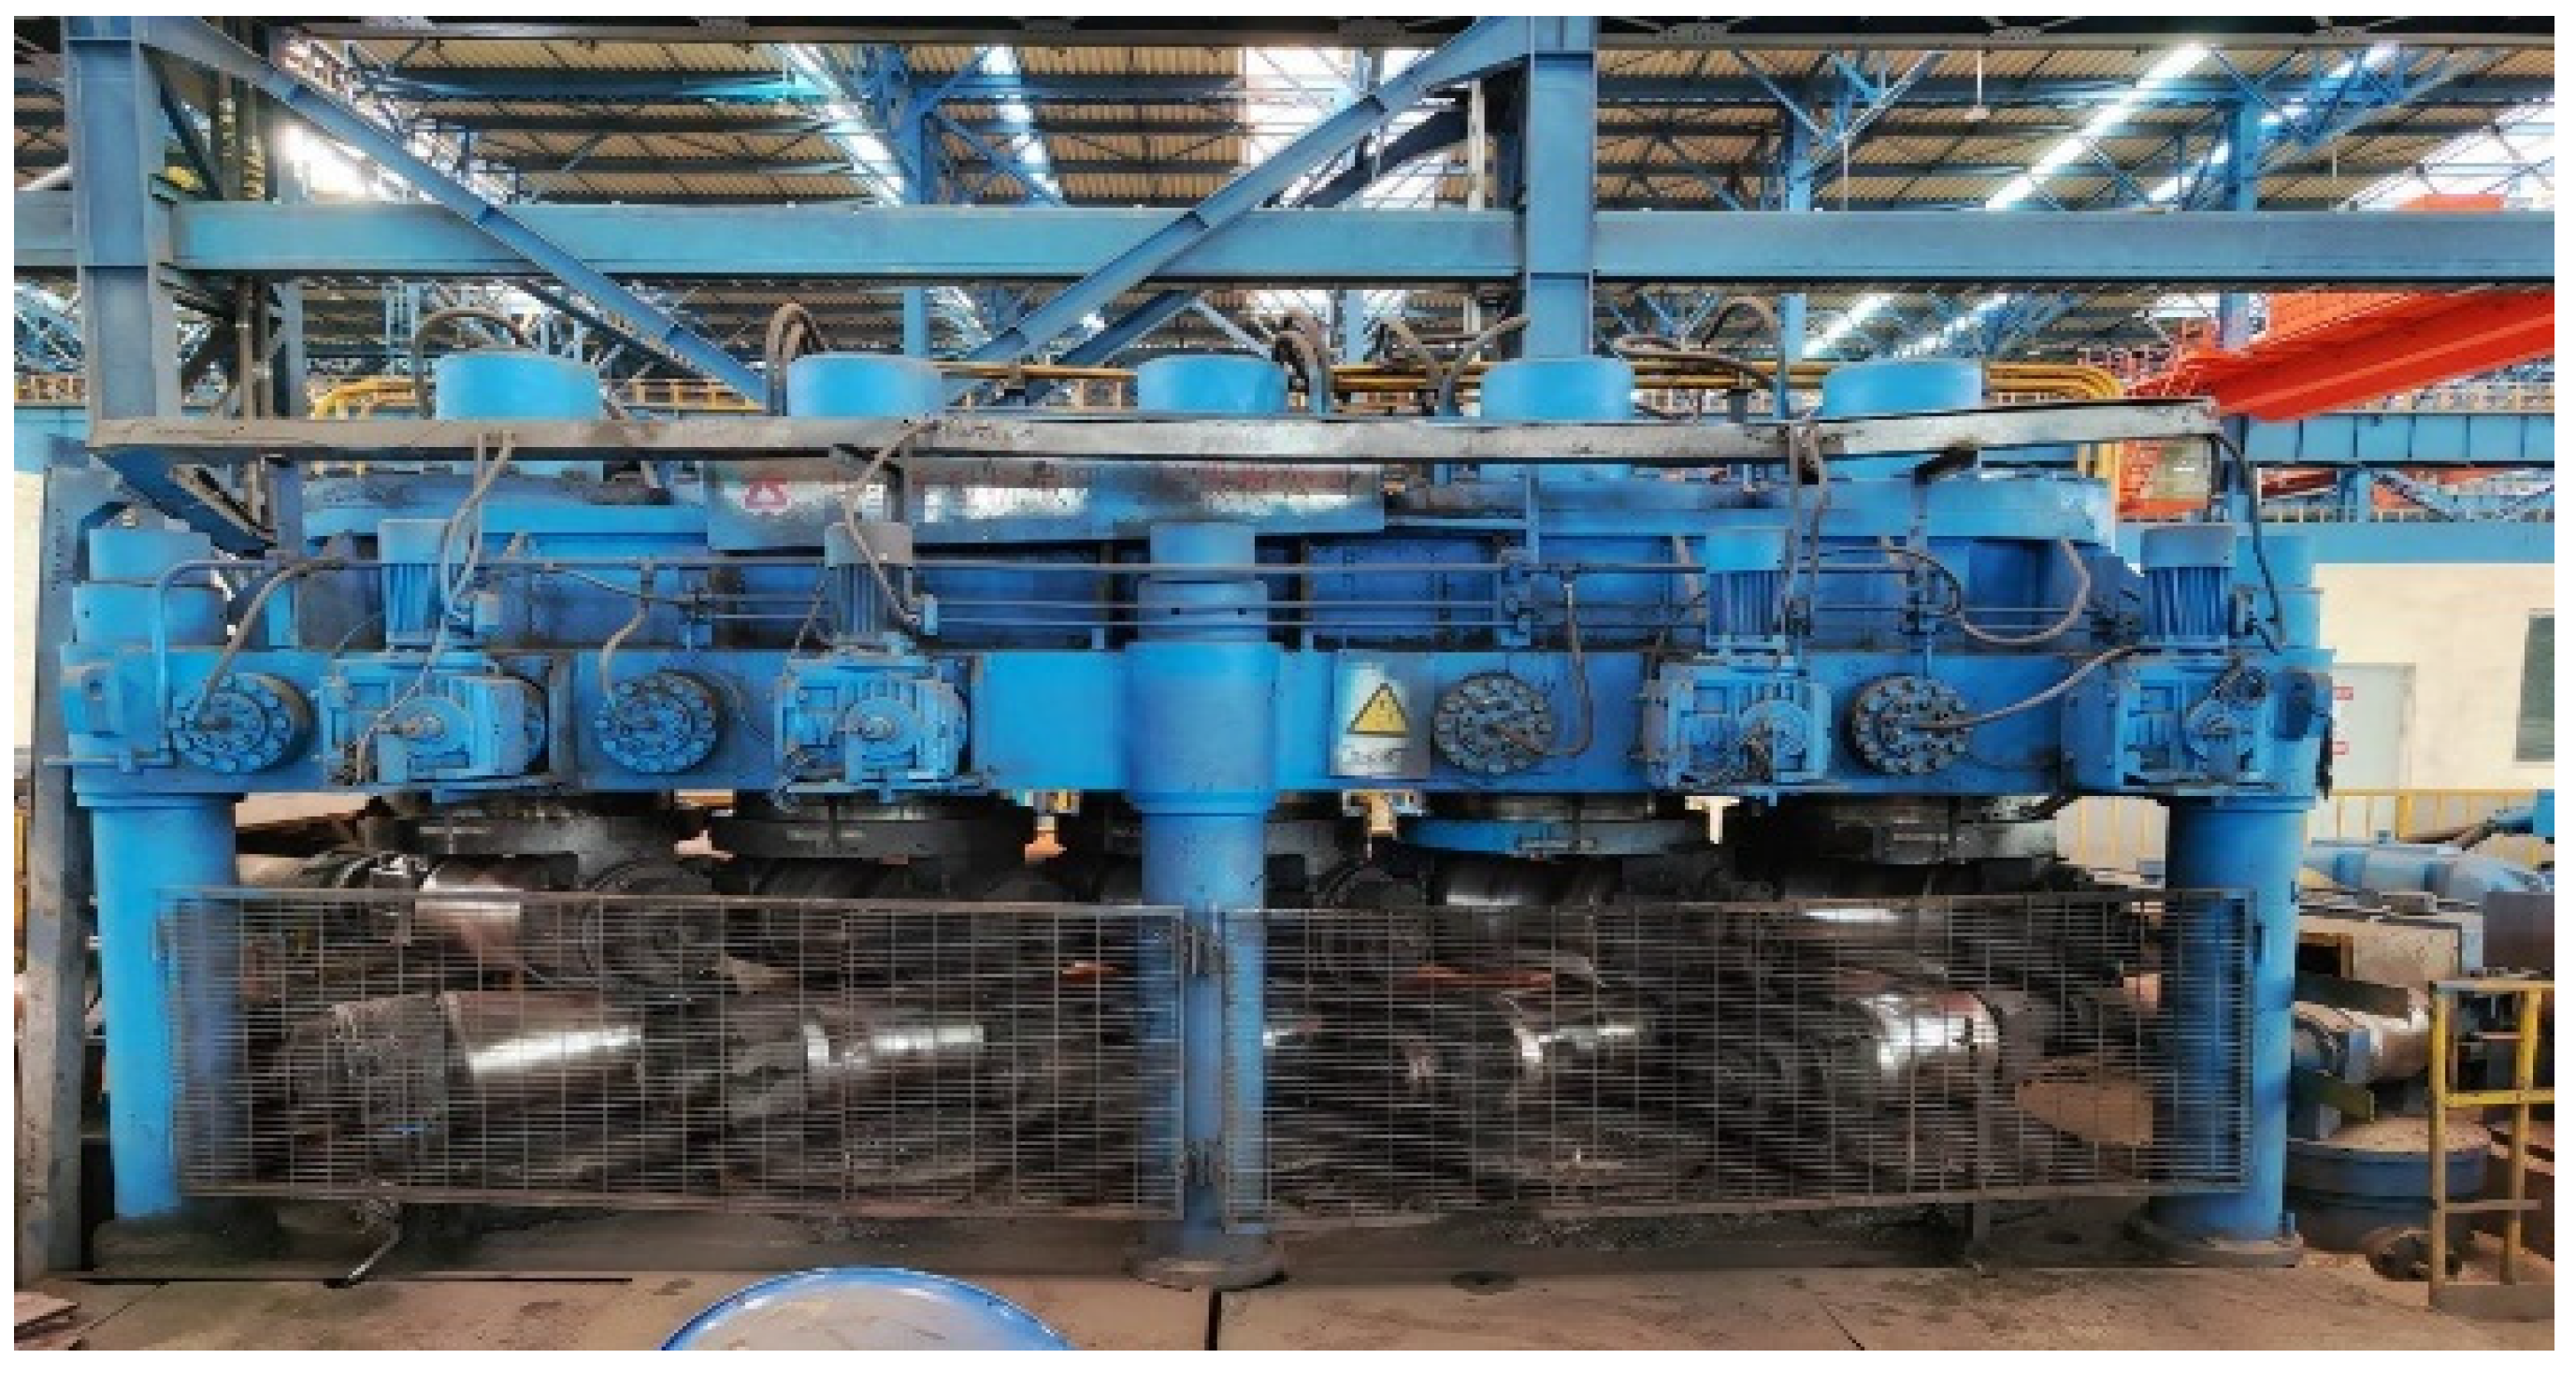
In this study, an eleven-roll straightening machine from Shigang Steel was used for experimental verification. This equipment, developed and manufactured by the China Heavy Machinery Research Institute, is specifically designed for straightening bars with diameters ranging from φ45 mm to φ150 mm. The straightening machine is equipped with a semi-automatic control system, which allows for the adjustment of roll inclination angle, roll gap, and roll reduction to accommodate different bar specifications and materials, ensuring stable and reliable straightening performance. A photo of the straightening machine is shown in Figure 8.
Figure 9 presents the flowchart of the experimental straightening process. Initially, the bars to be straightened are bundled and placed on the feeding platform, as shown in Figure 9a. The material is then fed into the front roller channel by a material-feeding machine, as shown in Figure 9b. The bars are conveyed into the straightening machine inlet through the front roller channel, as shown in Figure 9c. At the straightening machine inlet, the bar undergoes gripping and stable straightening, as illustrated in Figure 9d. After straightening, the bars pass through the tail roller and enter the rear roller channel, as shown in Figure 9e. Finally, the material is transferred to the unloading platform by the material-feeding machine, as shown in Figure 9f. In the configuration of the first ten rolls, the first, second, fourth, and fifth pairs are drive rolls, and the third pair is a passive roll. The straightness of the bars after straightening was tested using a combination of feeler gauges and reference gauges, as shown in Figure 10. During experimentation, temperature was not controlled, nor were additional lubrication steps implemented. Process parameters—including roll gap, roll reduction, roller inclination angle, and straightening speed—were controlled to match the settings used in the numerical simulations.

5. Results and Discussion

5.1. Optimization of Process Parameters

5.1.1. Orthogonal Experimental Scheme

The orthogonal experimental method was employed to optimize the process parameters for the eleven cross-roll straightening process. The factors considered in the experiments include roll inclination angle, roll reduction, straightening speed, and roll gap. The specific levels of these parameters in the orthogonal experiment are shown in Table 4. In order to improve efficiency, the effects of interactions between factors were ignored in the study.
The orthogonal experimental design was performed based on a four-factor and four-level model. Simulations were conducted using Abaqus software (Version 2021) to analyze the results, and the optimal combination of process parameters was determined. The orthogonal experimental design and corresponding results are shown in Table 5.

5.1.2. Range Analysis of Orthogonal Test Results

The mean value k was used to measure the influence of the four experimental factors at different levels on the straightness of the bar. A range analysis was performed on the orthogonal experimental results of the eleven-roll straightening process, and the range R reflects the impact of changes in factor levels on the experimental outcomes. The larger the value of R, the more significant the effect of that factor on the results. Conversely, a smaller value indicates a less significant effect. The effects of each factor level on bar straightness are shown in Table 6. From Table 6, it can be seen that the most significant factors influencing bar straightness are in the following order: roll gap > roll reduction > straightening speed > roll inclination angle, with roll gap having a much more significant impact compared to the other factors. Roll reduction, straightening speed, and roll inclination angle all have a certain degree of influence on bar straightness.

5.1.3. Process Analysis of Orthogonal Test and Experimental Verification of Optimal Process Parameters

Based on the range analysis of the orthogonal test, the effects of each factor on the experimental results were studied, and key variables were identified using the range values. The optimal process parameters were selected. By combining the orthogonal table design with data analysis, the effectiveness of various factor combinations was evaluated, thus improving the accuracy and reliability of the experiment and providing a reference for process optimization.
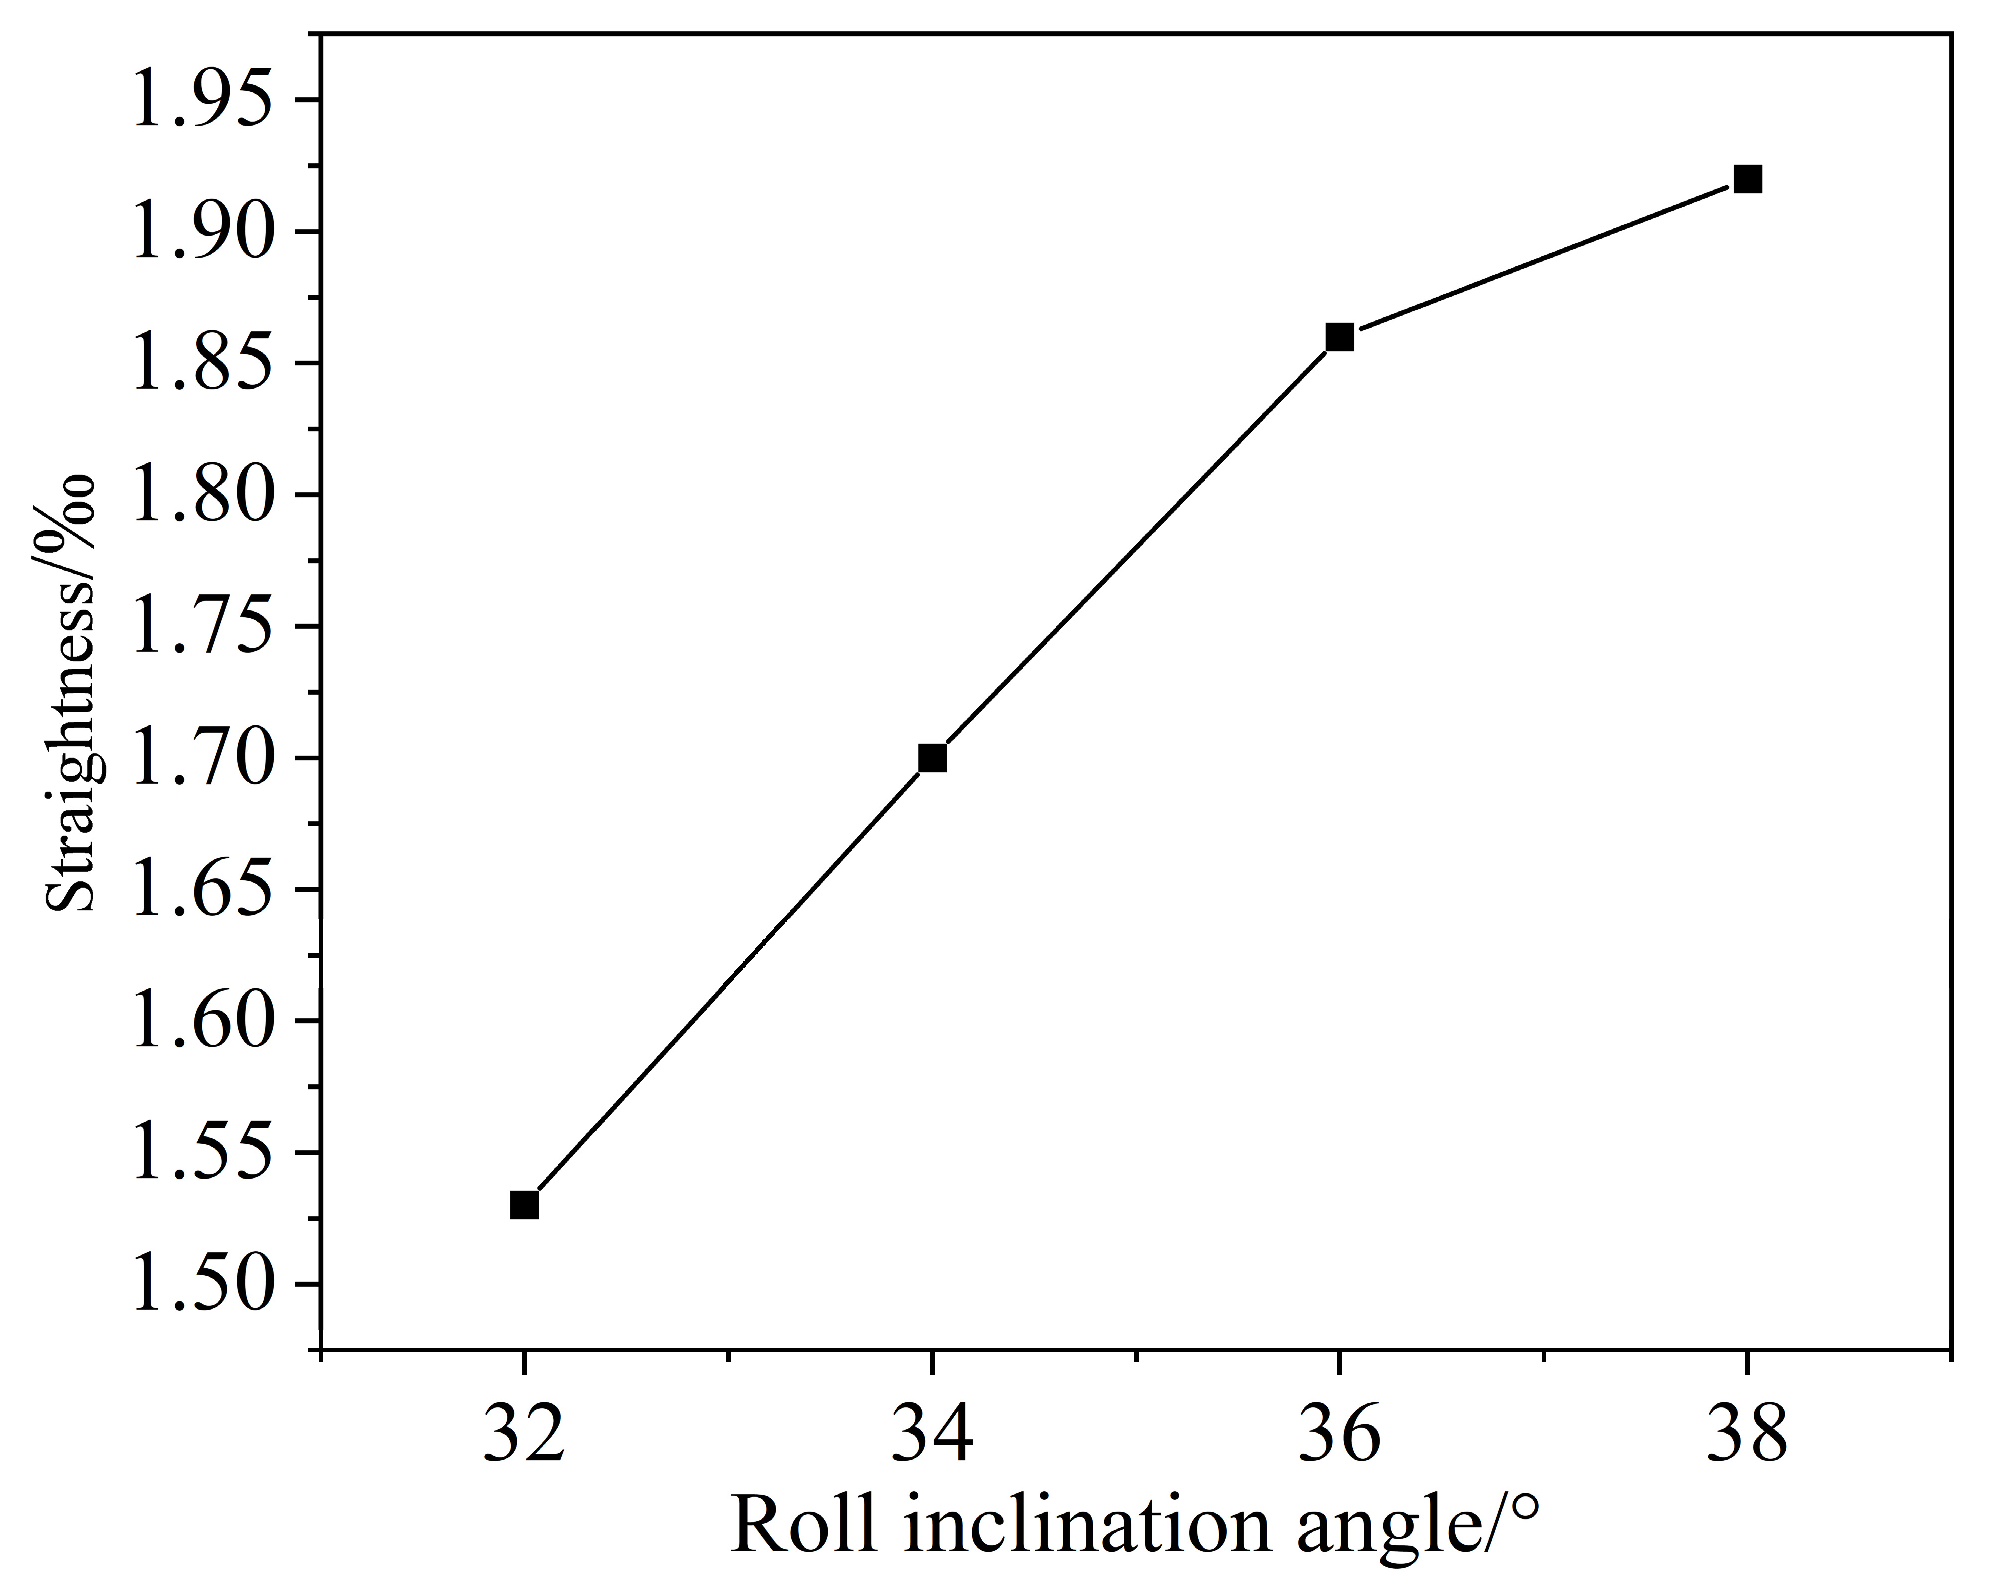
It was found that a larger roll inclination angle can also change the contact angle between the straightening roll and the bar, which in turn affects the direction and effect of the applied force. This variation can lead to an unstable pressure distribution during the straightening process, which may induce different levels of stress on the bar, further affecting the straightening performance. The roll inclination angle directly influences the post-straightening straightness of the bar, and its variation is shown in Figure 11.
From Figure 11, it can be observed that when the roll inclination angle is 32°, the post-straightening straightness of the bar is 1.53‰. When the roll inclination angle is increased to 38°, the post-straightening straightness worsens to 1.92‰. As the roll inclination angle increases, the post-straightening straightness decreases. This is because larger angles result in uneven force distribution on the bar during straightening. When the inclination angle is too large, the contact area between the straightening roll and the bar may become concentrated in specific regions, applying higher pressure to those areas while exerting less force on others. As a result, certain areas of the bar experience higher pressures while others receive less, ultimately leading to poorer straightness.
Figure 12 shows the effect of roll reduction on the straightness of the bar. It can be observed that when the roll reduction is 10 mm, the post-straightening straightness is approximately 1.37‰, and when the roll reduction is increased to 12 mm, the straightness is 1.77‰. However, when the roll reduction is 6 mm or 8 mm, the straightness after straightening is worse, indicating that a roll reduction of 10 mm results in the best straightness.
Therefore, in the multi-roll straightening process of the bar, the roll reduction should be controlled within a reasonable range. Excessively large roll reduction can lead to over-bending during straightening, resulting in excessive plastic deformation and potential surface damage, such as scratches or cracks. On the other hand, insufficient roll reduction may fail to adequately remove the original curvature, especially when the material has large internal stresses. In such cases, the straightening process may not fully eliminate the curvature, leading to substandard straightness in the final product.
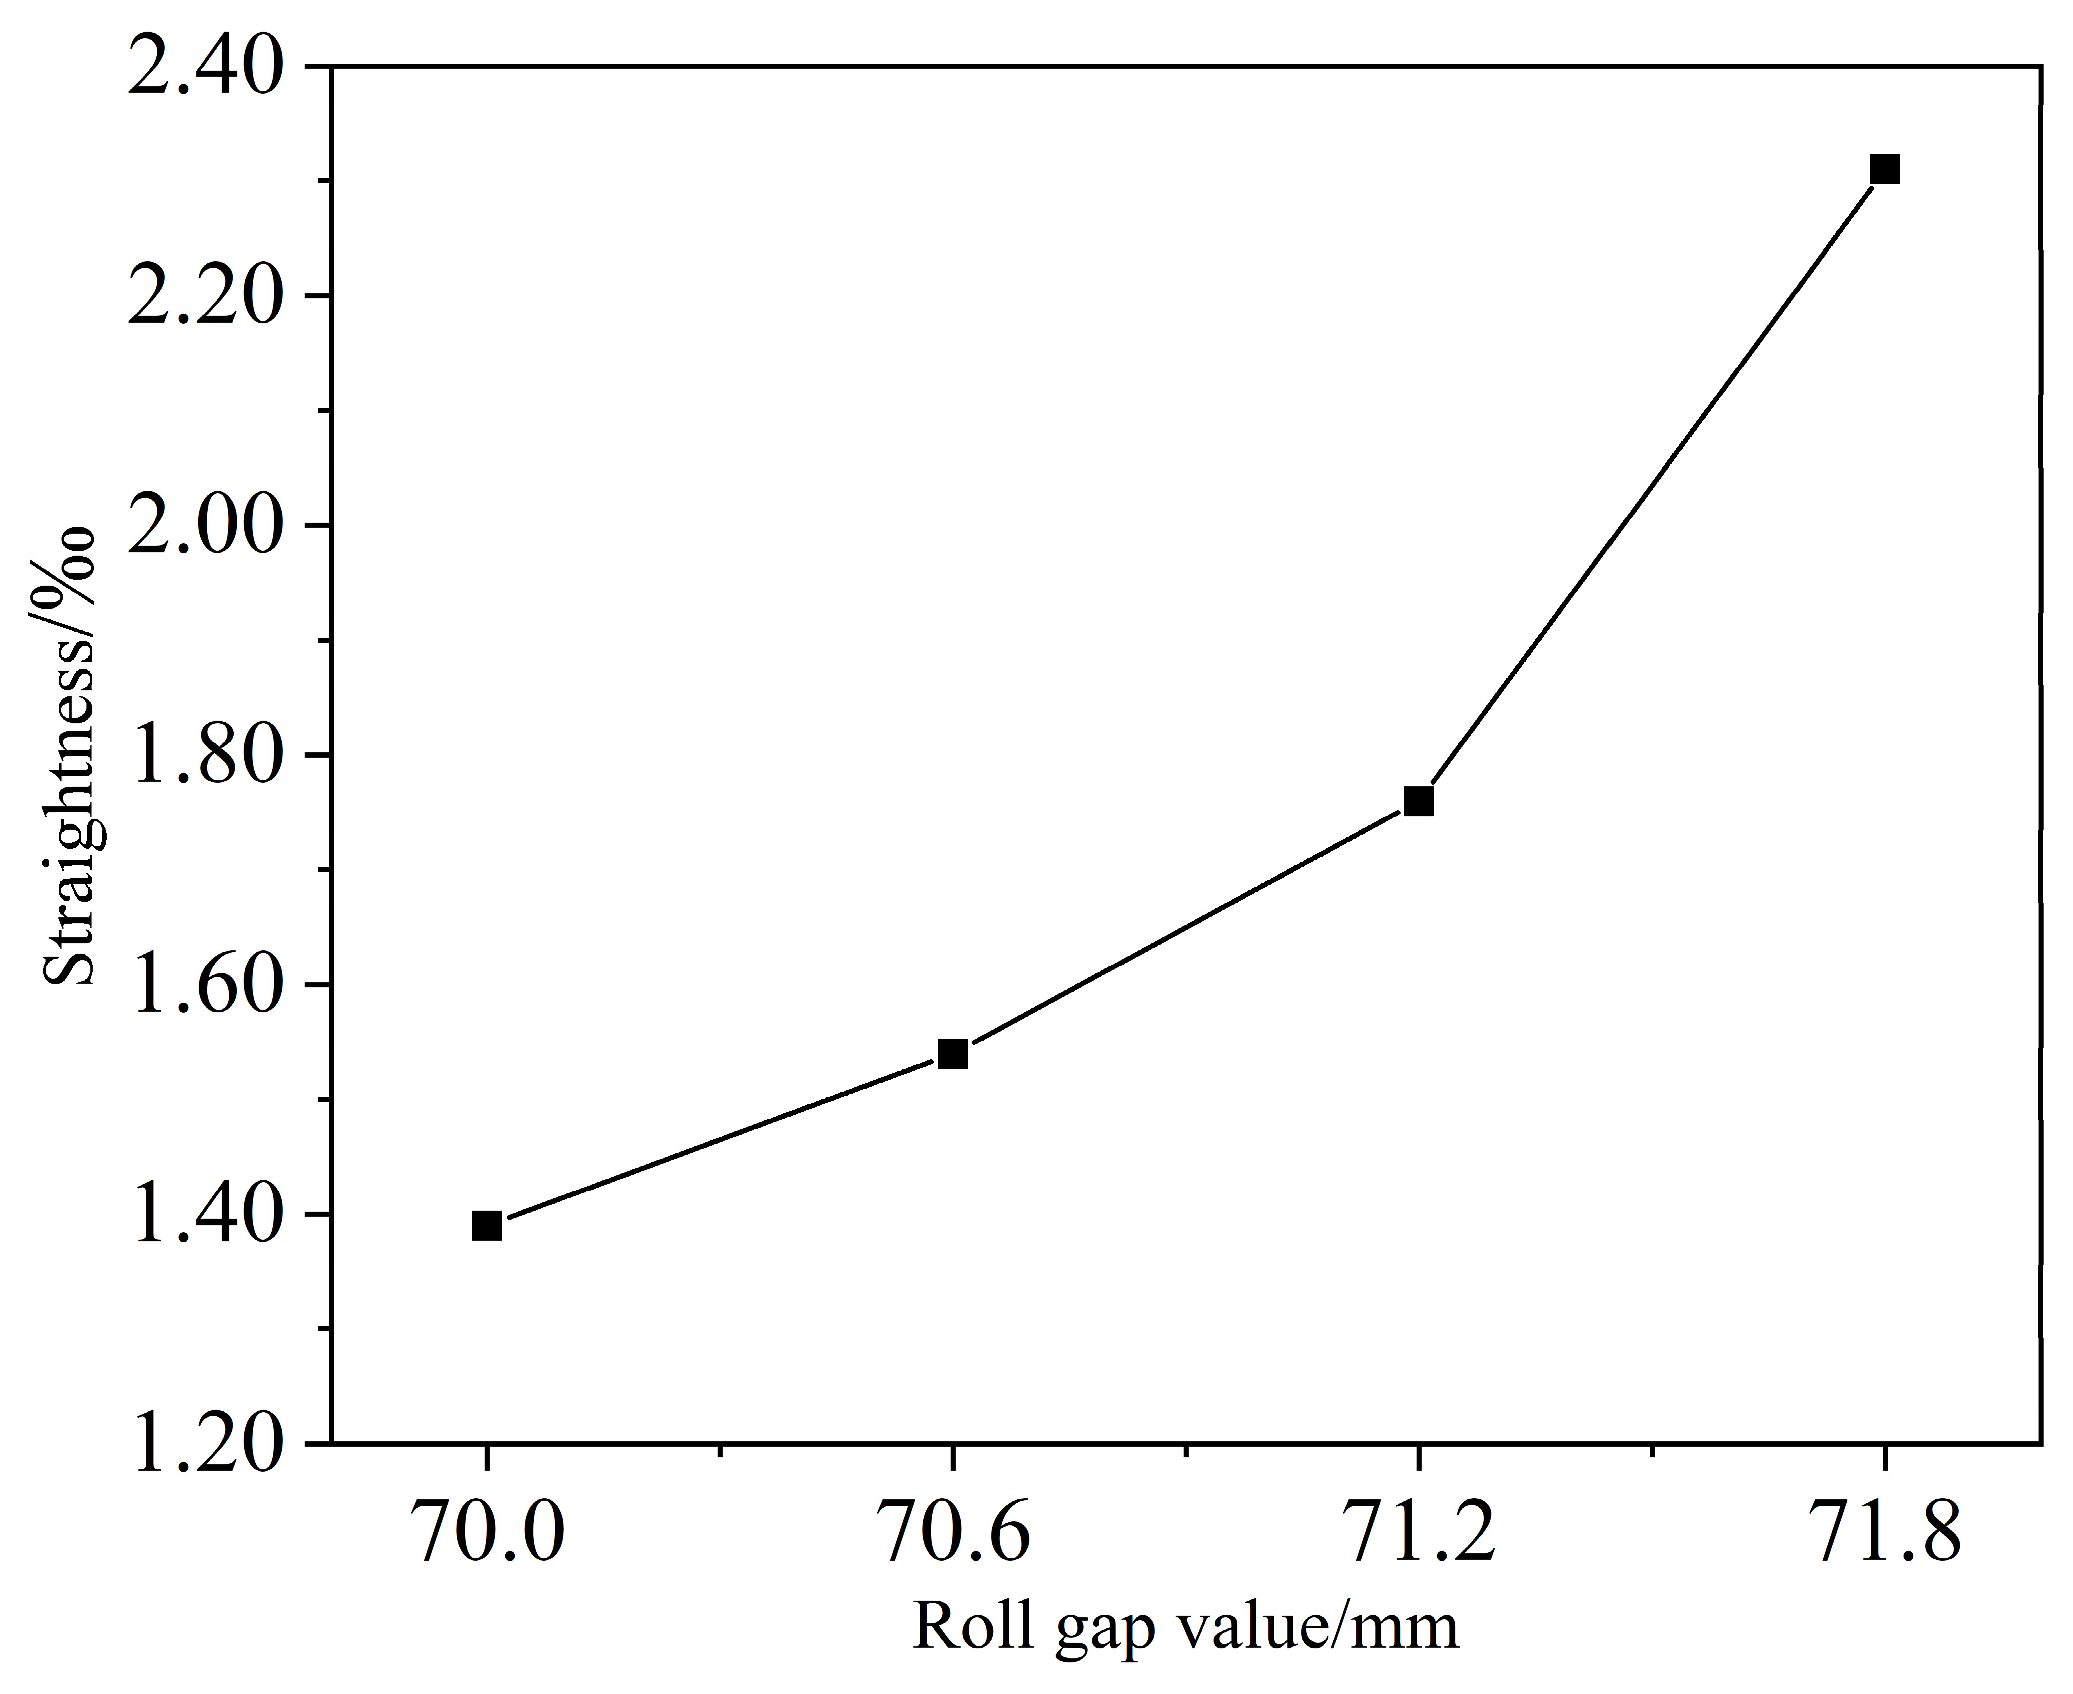
Figure 13 shows the effect of different roll gap values on the straightness of the bar. From Figure 13, it can be seen that when the roll gap is 70.0 mm, the straightness is 1.39‰. As the roll gap increases, the post-straightening straightness increases. When the roll gap is 71.8 mm, the straightness increases to 2.31‰. When the roll gap is too large, the contact area between the roll and the bar decreases, resulting in uneven pressure distribution. In such cases, certain areas of the bar may not receive enough straightening force, leading to worse straightening results.
Conversely, an excessively small roll gap can lead to issues such as increased roll wear and higher friction between the roll and the bar, potentially causing surface damage to the bar and affecting its service life. Therefore, to achieve optimal straightness, a reasonable roll gap should be selected in practical production. This range ensures appropriate pressure distribution during the straightening process, preventing both over-straightening and insufficient straightening.
In summary, the optimal process parameters for eleven-roll straightening of bars are A1B3C2D1, where A1 corresponds to a roll inclination angle of 32°, B3 corresponds to a reverse bending displacement of 10 mm, C2 corresponds to a straightening speed of 40 m/min, and D1 corresponds to a roll gap of 70.0 mm. When these optimal parameters were used for straightening, the straightness in numerical simulations was 0.91‰, and the experimental straightness was 0.98‰, with a relative error of 7.6%. This demonstrates the reliability of the numerical simulation results and the optimized process parameters.

5.1.4. Analysis of Variance of Orthogonal Test Results

Range analysis and analysis of variance (ANOVA) can effectively evaluate the influence of various process parameters on the straightening effect, i.e., straightness. Range analysis provides an intuitive demonstration of the influence trends of each factor, but it does not consider the interactions between factors or their statistical significance, thus having certain limitations.
To overcome this issue, ANOVA offers a more precise evaluation method. Table 7 shows the ANOVA table for the orthogonal experiment. ANOVA decomposes the total sum of squares (TSS) into the sum of squares for factors (SS for Factor) and the sum of squares for error (SS for Error). By comparing the mean squares of each part, it can more accurately assess the impact degree of each factor on the straightening effect. A larger mean square for a factor indicates a significant influence of that factor on the straightening effect, while a smaller mean square for error suggests good stability of the experimental data and high reliability of the results.
As shown in Table 7, the roll gap has a significant effect on the post-straightening straightness of the bars (p < 0.05), while the roller inclination angle, roll reduction, and straightening speed have no significant effect (p > 0.05). This result is generally consistent with the range analysis of the orthogonal experiment, indicating a high reliability of the conclusions drawn from the orthogonal test.

5.2. Effect of Roll Gap on Straightening Quality

The roll gap refers to the spacing between the upper and lower straightening rolls during the straightening process. It can be adjusted by modifying the position of these rolls. A proper roll gap effectively eliminates deformation and curvature in the material, thereby improving its straightness and dimensional accuracy. An excessively large roll gap may result in insufficient straightening force and incomplete stress release within the material, while an overly small gap could lead to excessive plastic deformation or even material damage. Therefore, the roll gap not only affects the magnitude and distribution of the straightening force but also influences the degree of plastic deformation and the residual stress distribution.
To investigate the influence of roll gap on bar quality, this study selected 20CrMnTi bars with a diameter of 71.8 mm and an initial deflection of 8‰. Four roll gap values (70.0 mm, 70.6 mm, 71.2 mm, and 71.8 mm) were analyzed. All other parameters were set according to the optimal values obtained from orthogonal experiments. Based on the established finite element model, the effects of roll gap on straightening force, residual stress, and final straightness were examined.

5.2.1. Effect of Roll Gap on Straightening Force

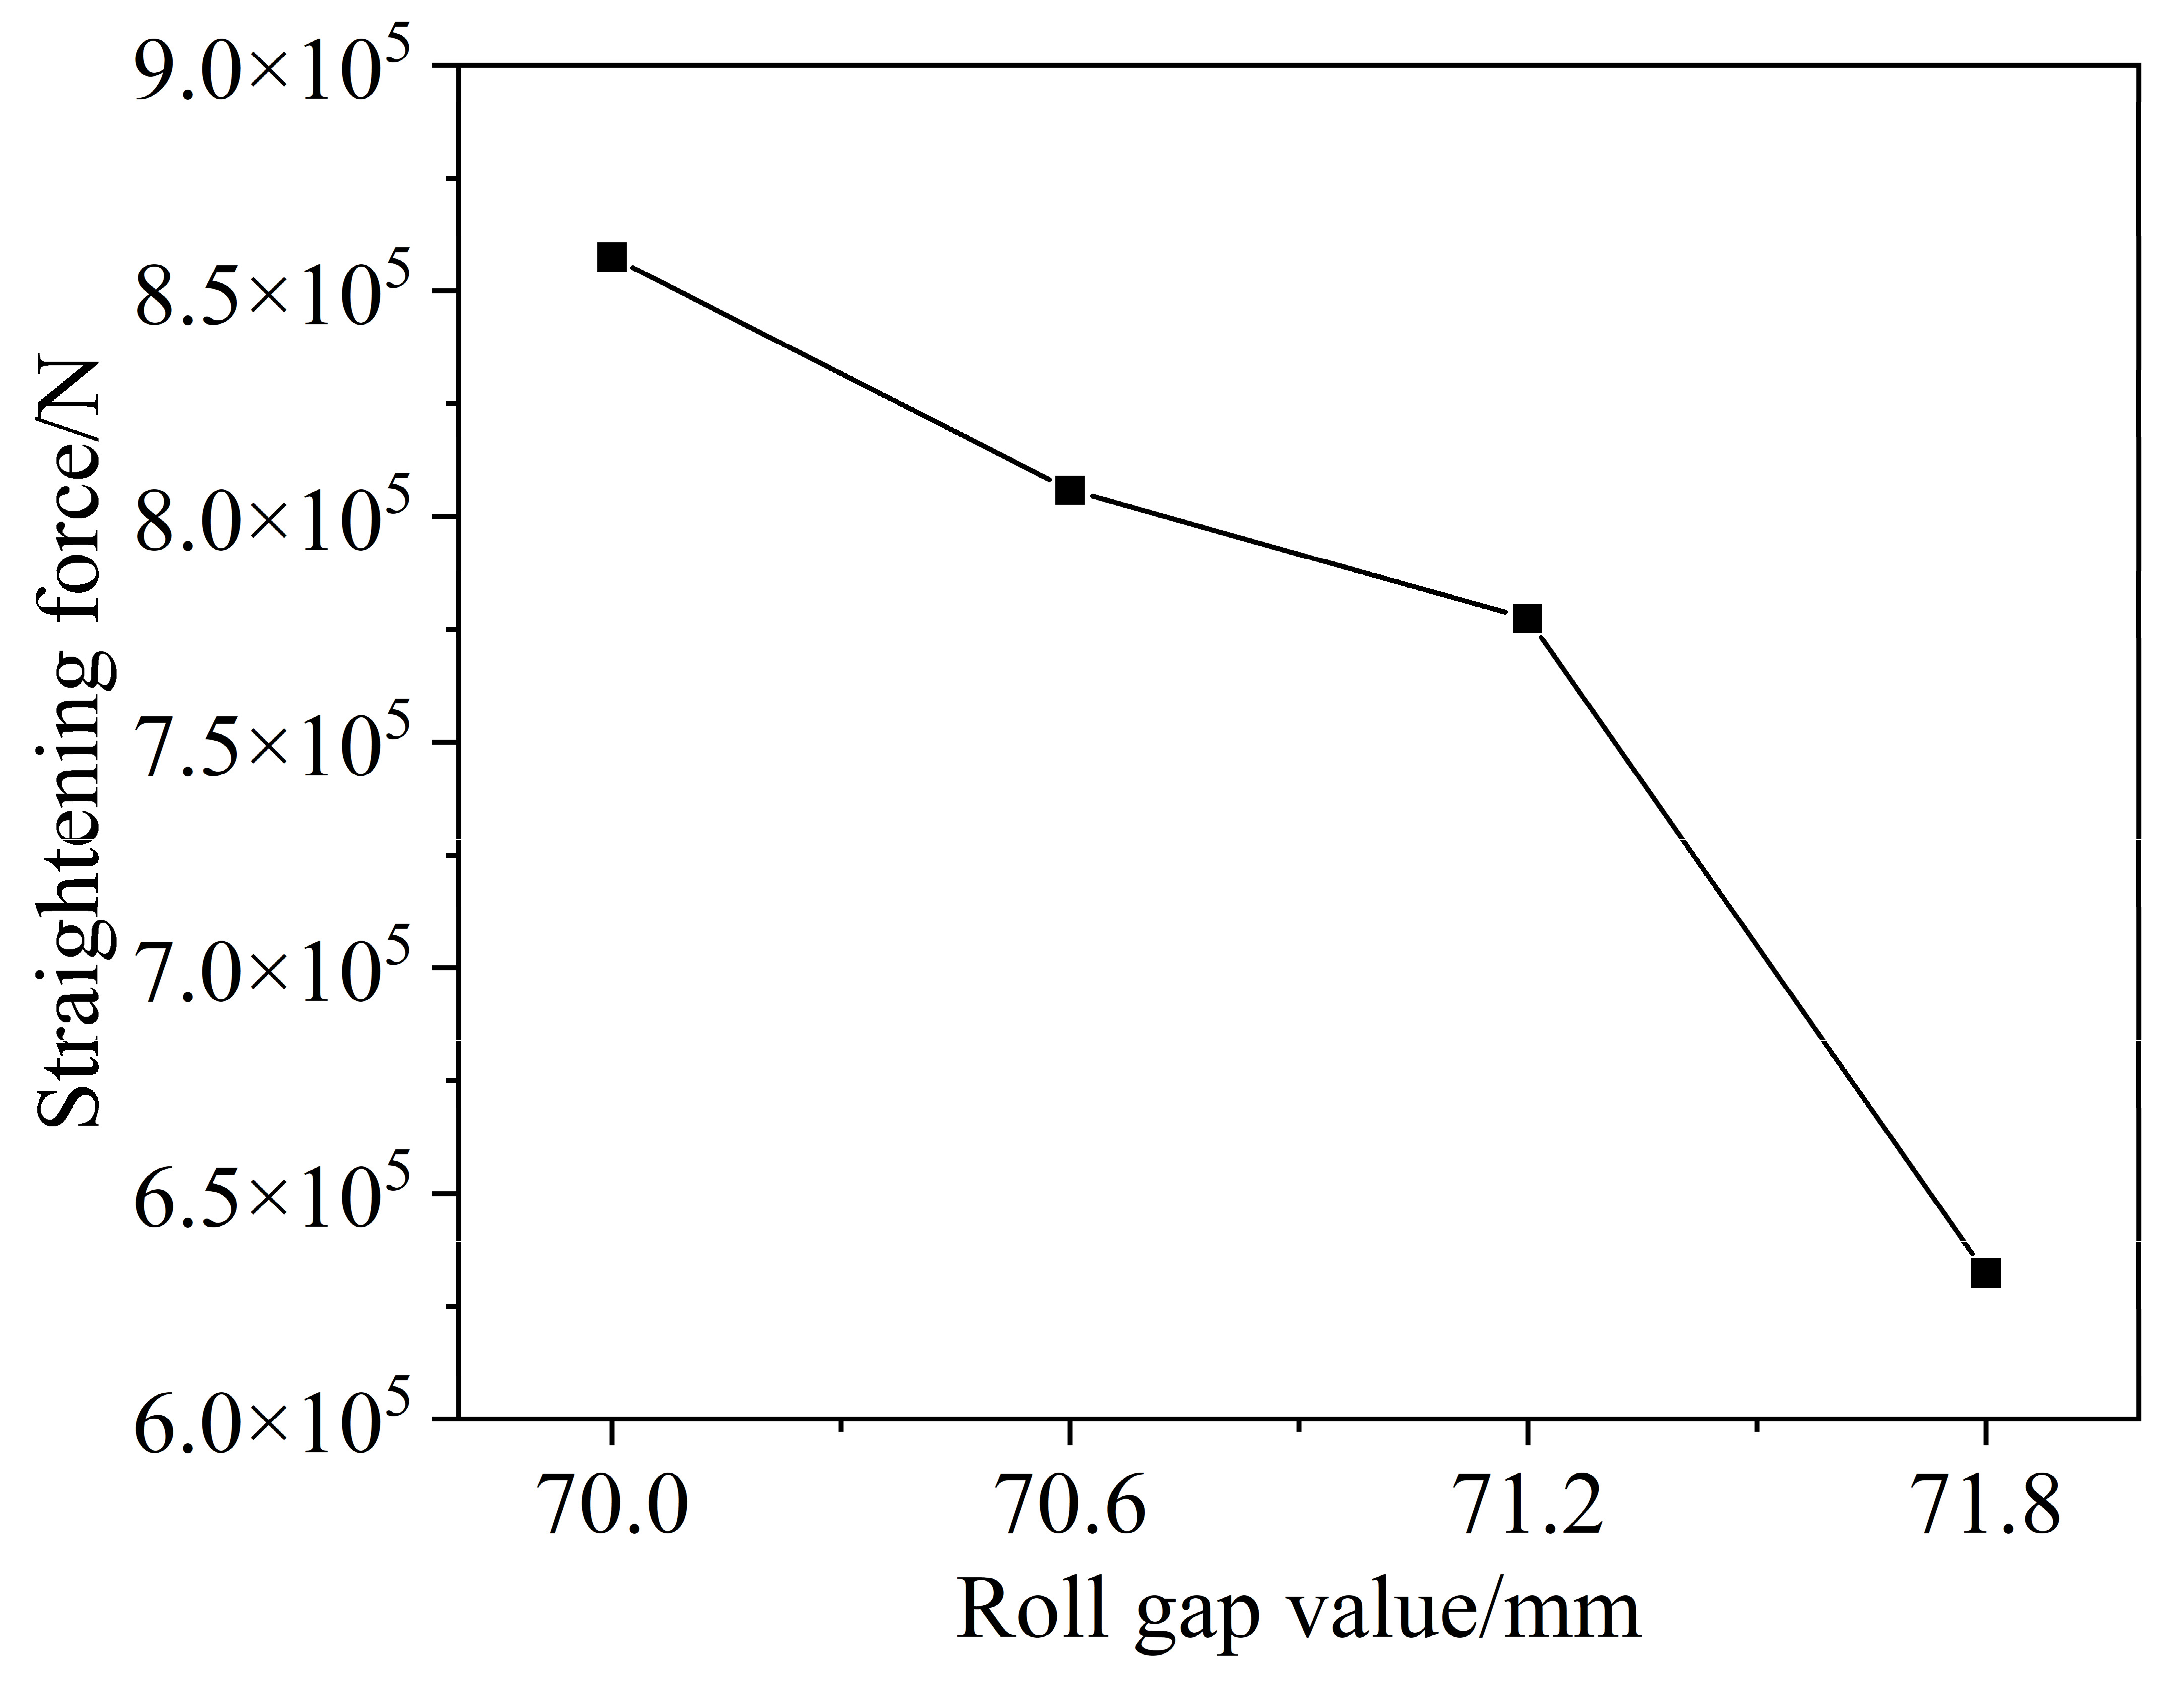
Figure 14 illustrates the maximum straightening force under different roll gap values. The results show that as the roll gap increases, the maximum straightening force gradually decreases, indicating a significant effect of roll gap on the straightening force. As the roll gap increases from 70.0 mm to 71.8 mm, the straightening force drops from approximately 8.6 × 10 5 N to approximately 6.4 × 10 5 N. Thus, to reduce the straightening force and roller wear while maintaining quality, the roll gap should be set as large as possible within an acceptable range.

5.2.2. Effect of Roll Gap on Residual Stress

Figure 15 displays the residual stress distributions under different roll gaps. The length of the bar in the figure is one span, specifically 1050 mm. It can be observed that increasing the roll gap leads to reduced and more uniformly distributed residual stresses. In practical applications, lower residual stress enhances the stability, deformation resistance, and service life of the bar. Therefore, a reasonably chosen roll gap not only ensures straightening quality but also improves the bar’s reliability and performance.

5.2.3. Effect of Roll Gap on Straightness After Straightening

Figure 16 shows the relationship between roll gap and straightness.
As seen in Figure 16, increasing the roll gap from 70.0 mm to 70.6 mm results in a deterioration of straightness, from 0.98% to 1.72%. Further increases up to 71.8 mm lead to a continued decline in straightness, reaching 2.53%. This trend suggests that excessively large roll gaps reduce the straightening force, making it insufficient to effectively straighten the bar. Thus, a roll gap of 70.0 mm yields the best straightening performance.

5.3. Effect of Roll Reduction on Straightening Quality

The roll reduction is a critical process parameter that significantly affects the straightness of the bar. It directly determines the reverse bending curvature within the roller system and thus impacts the final straightness. The roll reduction setting influences not only the straightening outcome but also the distribution of internal stresses within the bar. Therefore, analyzing the influence of roll reduction on straightening quality is essential. The eleven-roll inclined straightener achieves straightening through alternating bending and reverse bending applied by multiple inclined rolls. To investigate the influence of roll reduction on residual stress distribution, four levels of roll reduction (6 mm, 8 mm, 10 mm, and 12 mm) were selected for analysis. All other straightening parameters were set to the optimized values obtained from the orthogonal experiment.

5.3.1. Effect of Roll Reduction on Equivalent Stress After Straightening

During straightening, adjusting the roll reduction can compensate for initial curvature in the bar. However, if not properly controlled, it may lead to over- or under-straightening, generating new residual stresses or failing to fully release existing ones. A small reverse bending amount is generally insufficient to eliminate residual stress caused by the initial curvature, while an excessive reverse bend may induce over-plastic deformation, stress concentration, or even secondary bending, adversely affecting the straightening quality.
Thus, understanding the effect of roll reduction on residual stress is important for process optimization. Roll reduction also influences stress distribution during straightening. To study its effect on peak stress, the stress evolution under different roll reductions was analyzed, as shown in Figure 17.
As observed in Figure 17, when the roll reduction is 6 mm, the maximum stress during straightening is approximately 604 MPa. As the roll reduction increases, the maximum stress generally rises. However, at 10 mm, a slight reduction in maximum stress is observed. This may be due to an optimized distribution of plastic deformation and residual stress, which results in partial stress relief. When the roll reduction increases to 12 mm, the maximum stress reaches approximately 776 MPa, suggesting that while small adjustments can be beneficial, excessive roll reduction degrades the straightening effect.

5.3.2. Effect of Roll Reduction on Straightness After Straightening

Figure 18 shows the effect of different roll reductions on the straightness of the bars after straightening.
As shown in Figure 18, with other parameters held constant, increasing the roll reduction from 6 mm to 8 mm reduces straightness deviation from 2.86‰ to 2.34‰, indicating a minor improvement in straightening quality. When the roll reduction is further increased to 10 mm, the straightness deviation significantly drops to 0.98‰, demonstrating optimal straightening performance. However, increasing the roll reduction to 12 mm leads to a considerable increase in straightness deviation. Therefore, a reverse bending value of 10 mm enables the bar to undergo the most favorable deformation path, resulting in the best straightening effect.

5.3.3. Effect of Roll Reduction on Equivalent Plastic Strain After Straightening

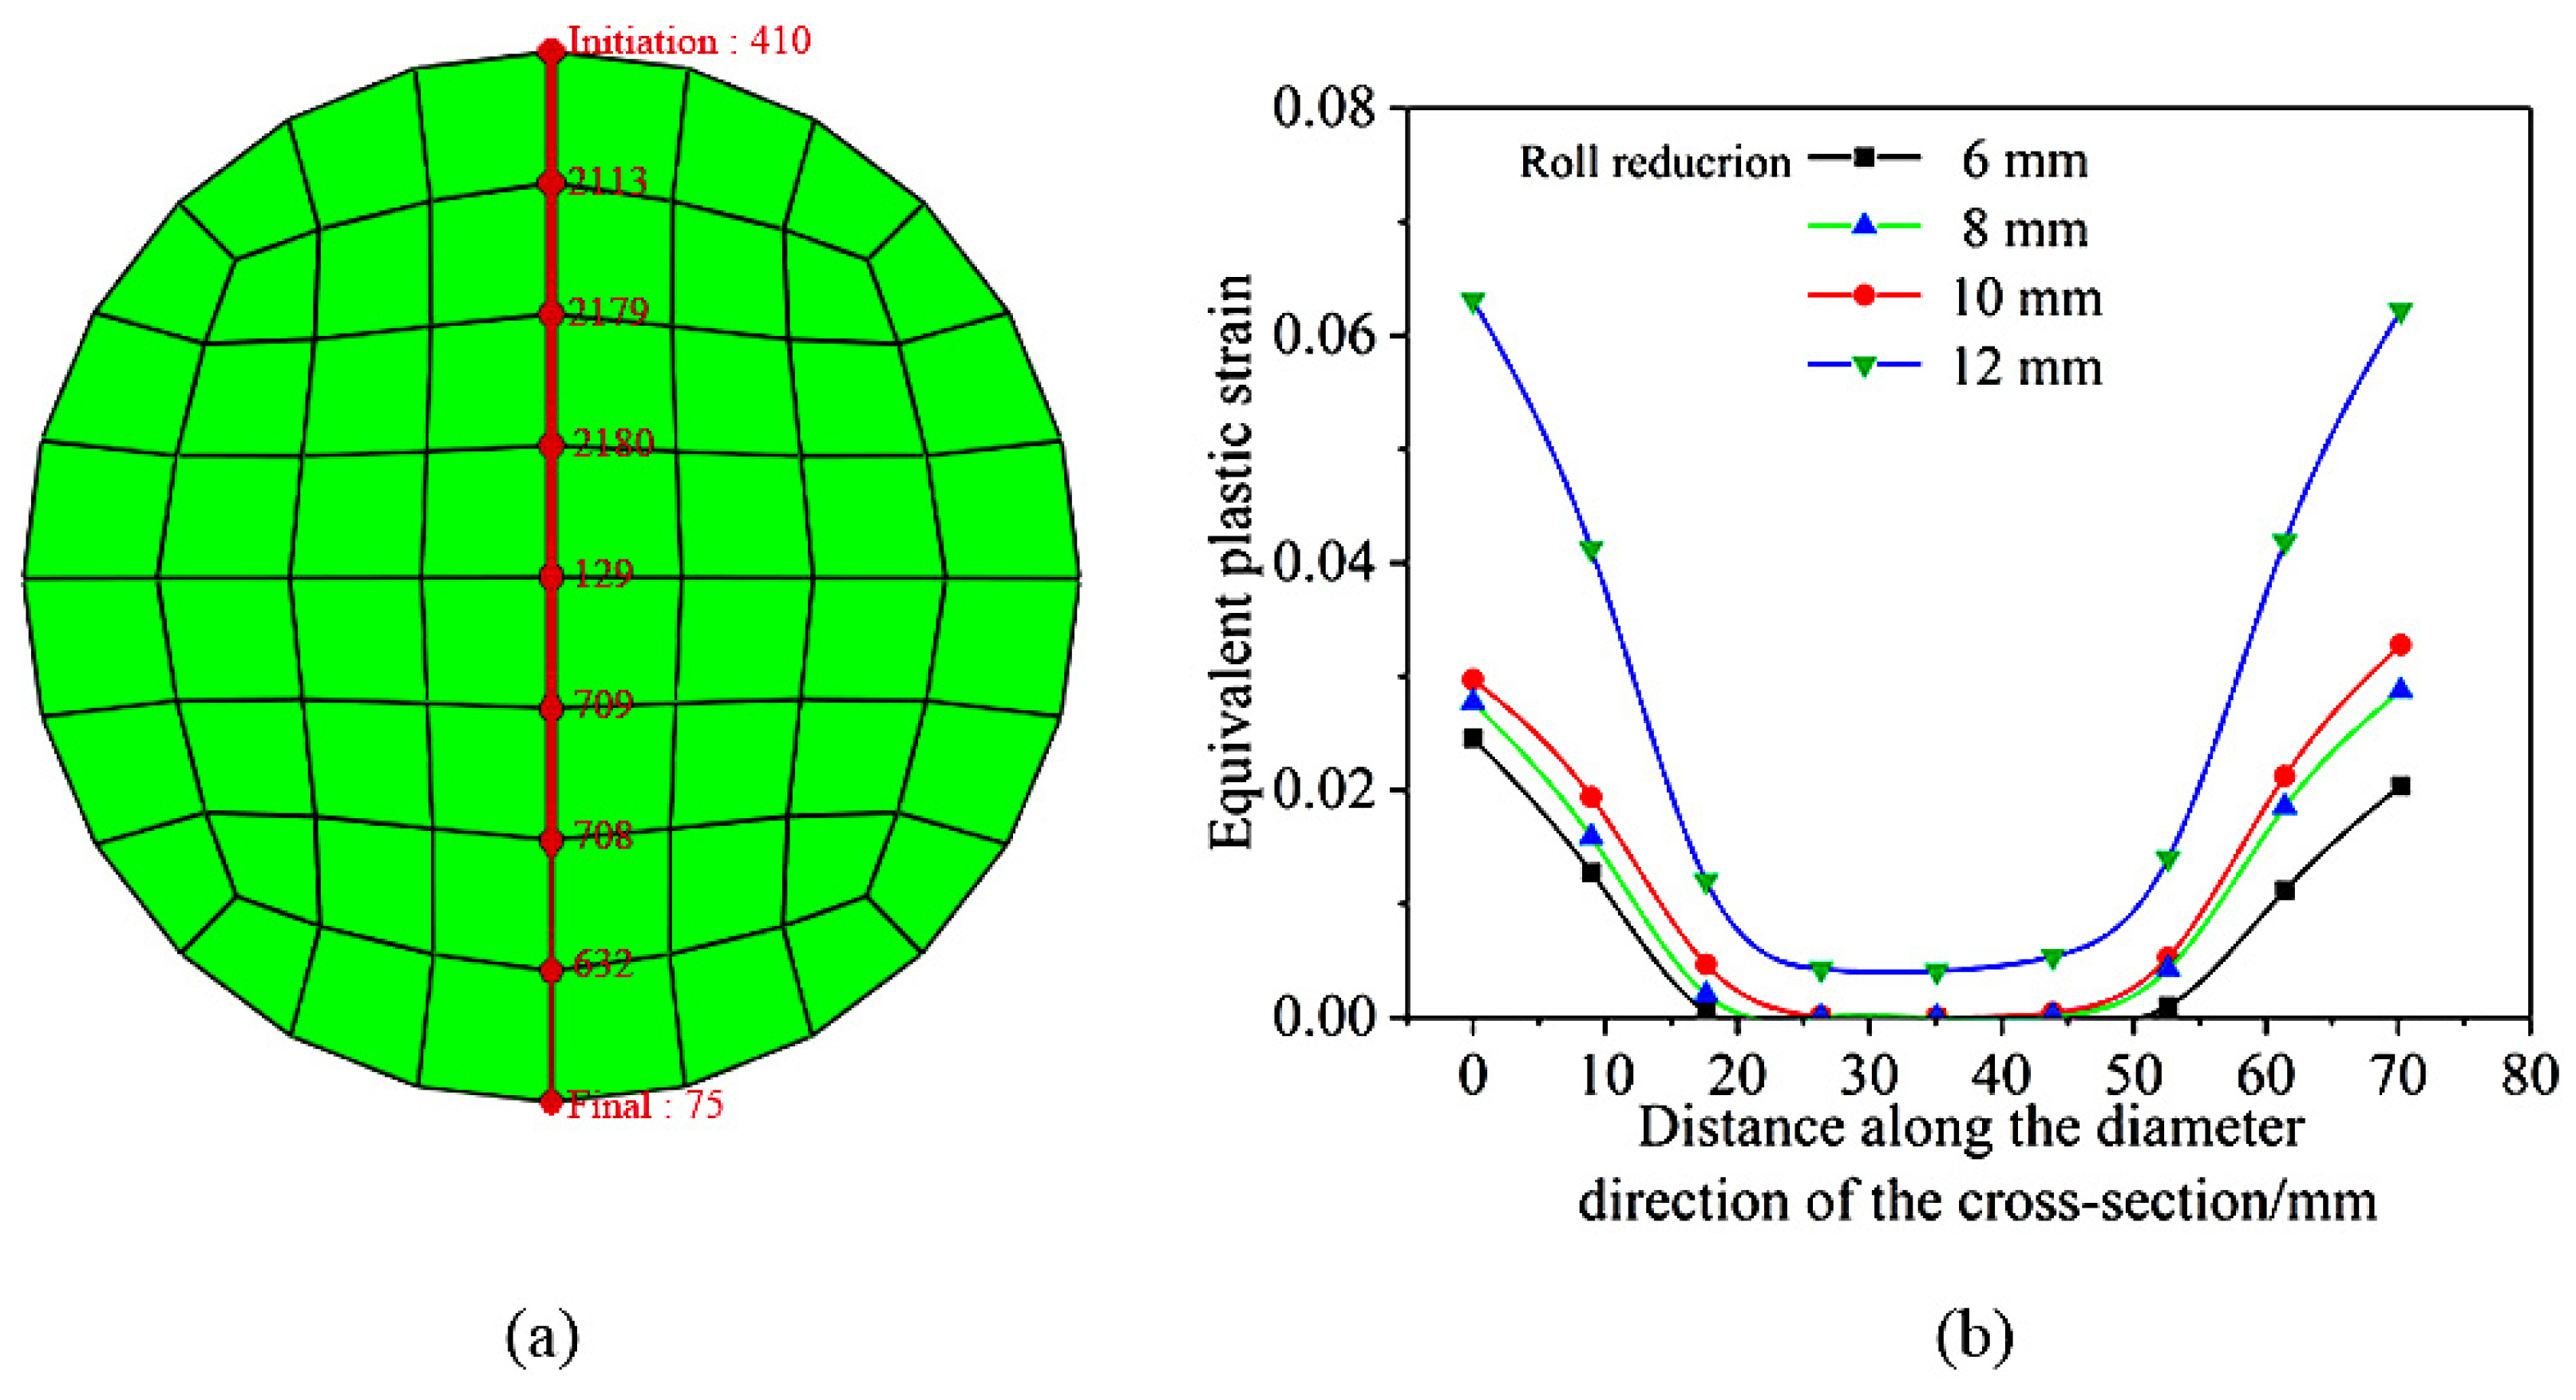
Figure 19 illustrates the path for section sampling and the effect of roll reduction on the equivalent plastic strain after straightening. As shown in Figure 19a, during the stable straightening process, the strain distribution along any cross-section of the bar can be obtained along the indicated path. The variation in strain from the bar core to its surface is shown in Figure 19b.
According to Figure 19b, a larger roll reduction leads to higher equivalent plastic strains after straightening. When the roll reduction is between 6 mm and 10 mm, the equivalent plastic strain on the surface is about 0.03, while the strain at the core is nearly zero. However, when the reverse bending increases to 12 mm, the surface strain abruptly rises to over 0.06, with the core strain reaching approximately 0.01. This demonstrates that roll reduction significantly influences equivalent plastic strain: the larger the roll reduction, the greater the plastic strain.

5.4. Effect of Straightening Roll Inclination on Straightening Quality

5.4.1. Effect of Straightening Roll Inclination on Residual Stress After Straightening

Inclination angles of 32°, 34°, 36°, and 38° were selected for the straightening rolls, while other process parameters were maintained at the optimal values obtained from the orthogonal tests. During the straightening process, variations in roll inclination angles change both the contact line length and bending degree between the bar and the rolls, which in turn affects the distribution characteristics of residual stress after straightening. Changes in inclination angle can alter the contact area, loading condition, and deformation pattern, resulting in variations in the magnitude and distribution of residual stresses. The influence of the roll inclination angle on the residual stress of straightened bars is shown in Figure 20. The length of the bar in the figure is one span, specifically 1050 mm.
From Figure 20, it can be observed that when the roll inclination angle is 32°, the residual stress distribution is relatively uniform, and the overall stress level is low. The predominance of blue areas indicates that the residual stress is mainly concentrated in the low-stress range, suggesting good straightening performance. At an inclination angle of 34°, the uniformity of the residual stress distribution decreases slightly, with an increase in green areas, indicating a moderate rise in stress levels. When the inclination angle increases to 36°, the blue areas significantly reduce, and the presence of green and yellow areas becomes more pronounced, suggesting an expansion of high-stress regions. At 38°, a substantial increase in green areas within the bar indicates higher residual stress levels and a corresponding decline in straightening quality.

5.4.2. Influence of Straightening Roll Inclination on Straightness After Straightening

The influence of roll inclination angle on bar straightness is illustrated in Figure 21. As shown, the best straightness is achieved when the roll inclination angle is 32°, which aligns with the conclusions drawn from the orthogonal experiment results. Larger inclination angles result in poorer straightness, likely because greater angles reduce the quality of contact between the straightening rolls and the bar. This suboptimal contact leads to uneven residual stress distribution within the bar after straightening, which negatively impacts straightness and the overall service life of the product.

5.5. Effect of Straightening Speed on Straightening Quality

Straightening speed is one of the key process parameters influencing the quality of bar straightening. At lower straightening speeds, plastic deformation and the release of residual stress in the bar are more complete, which is conducive to improved straightening quality. However, excessively low speeds may reduce production efficiency. Conversely, excessively high straightening speeds may lead to insufficient plastic deformation and incomplete stress relief and may even induce vibration or slippage issues. Therefore, investigating the influence of straightening speed on straightening quality is of practical significance.
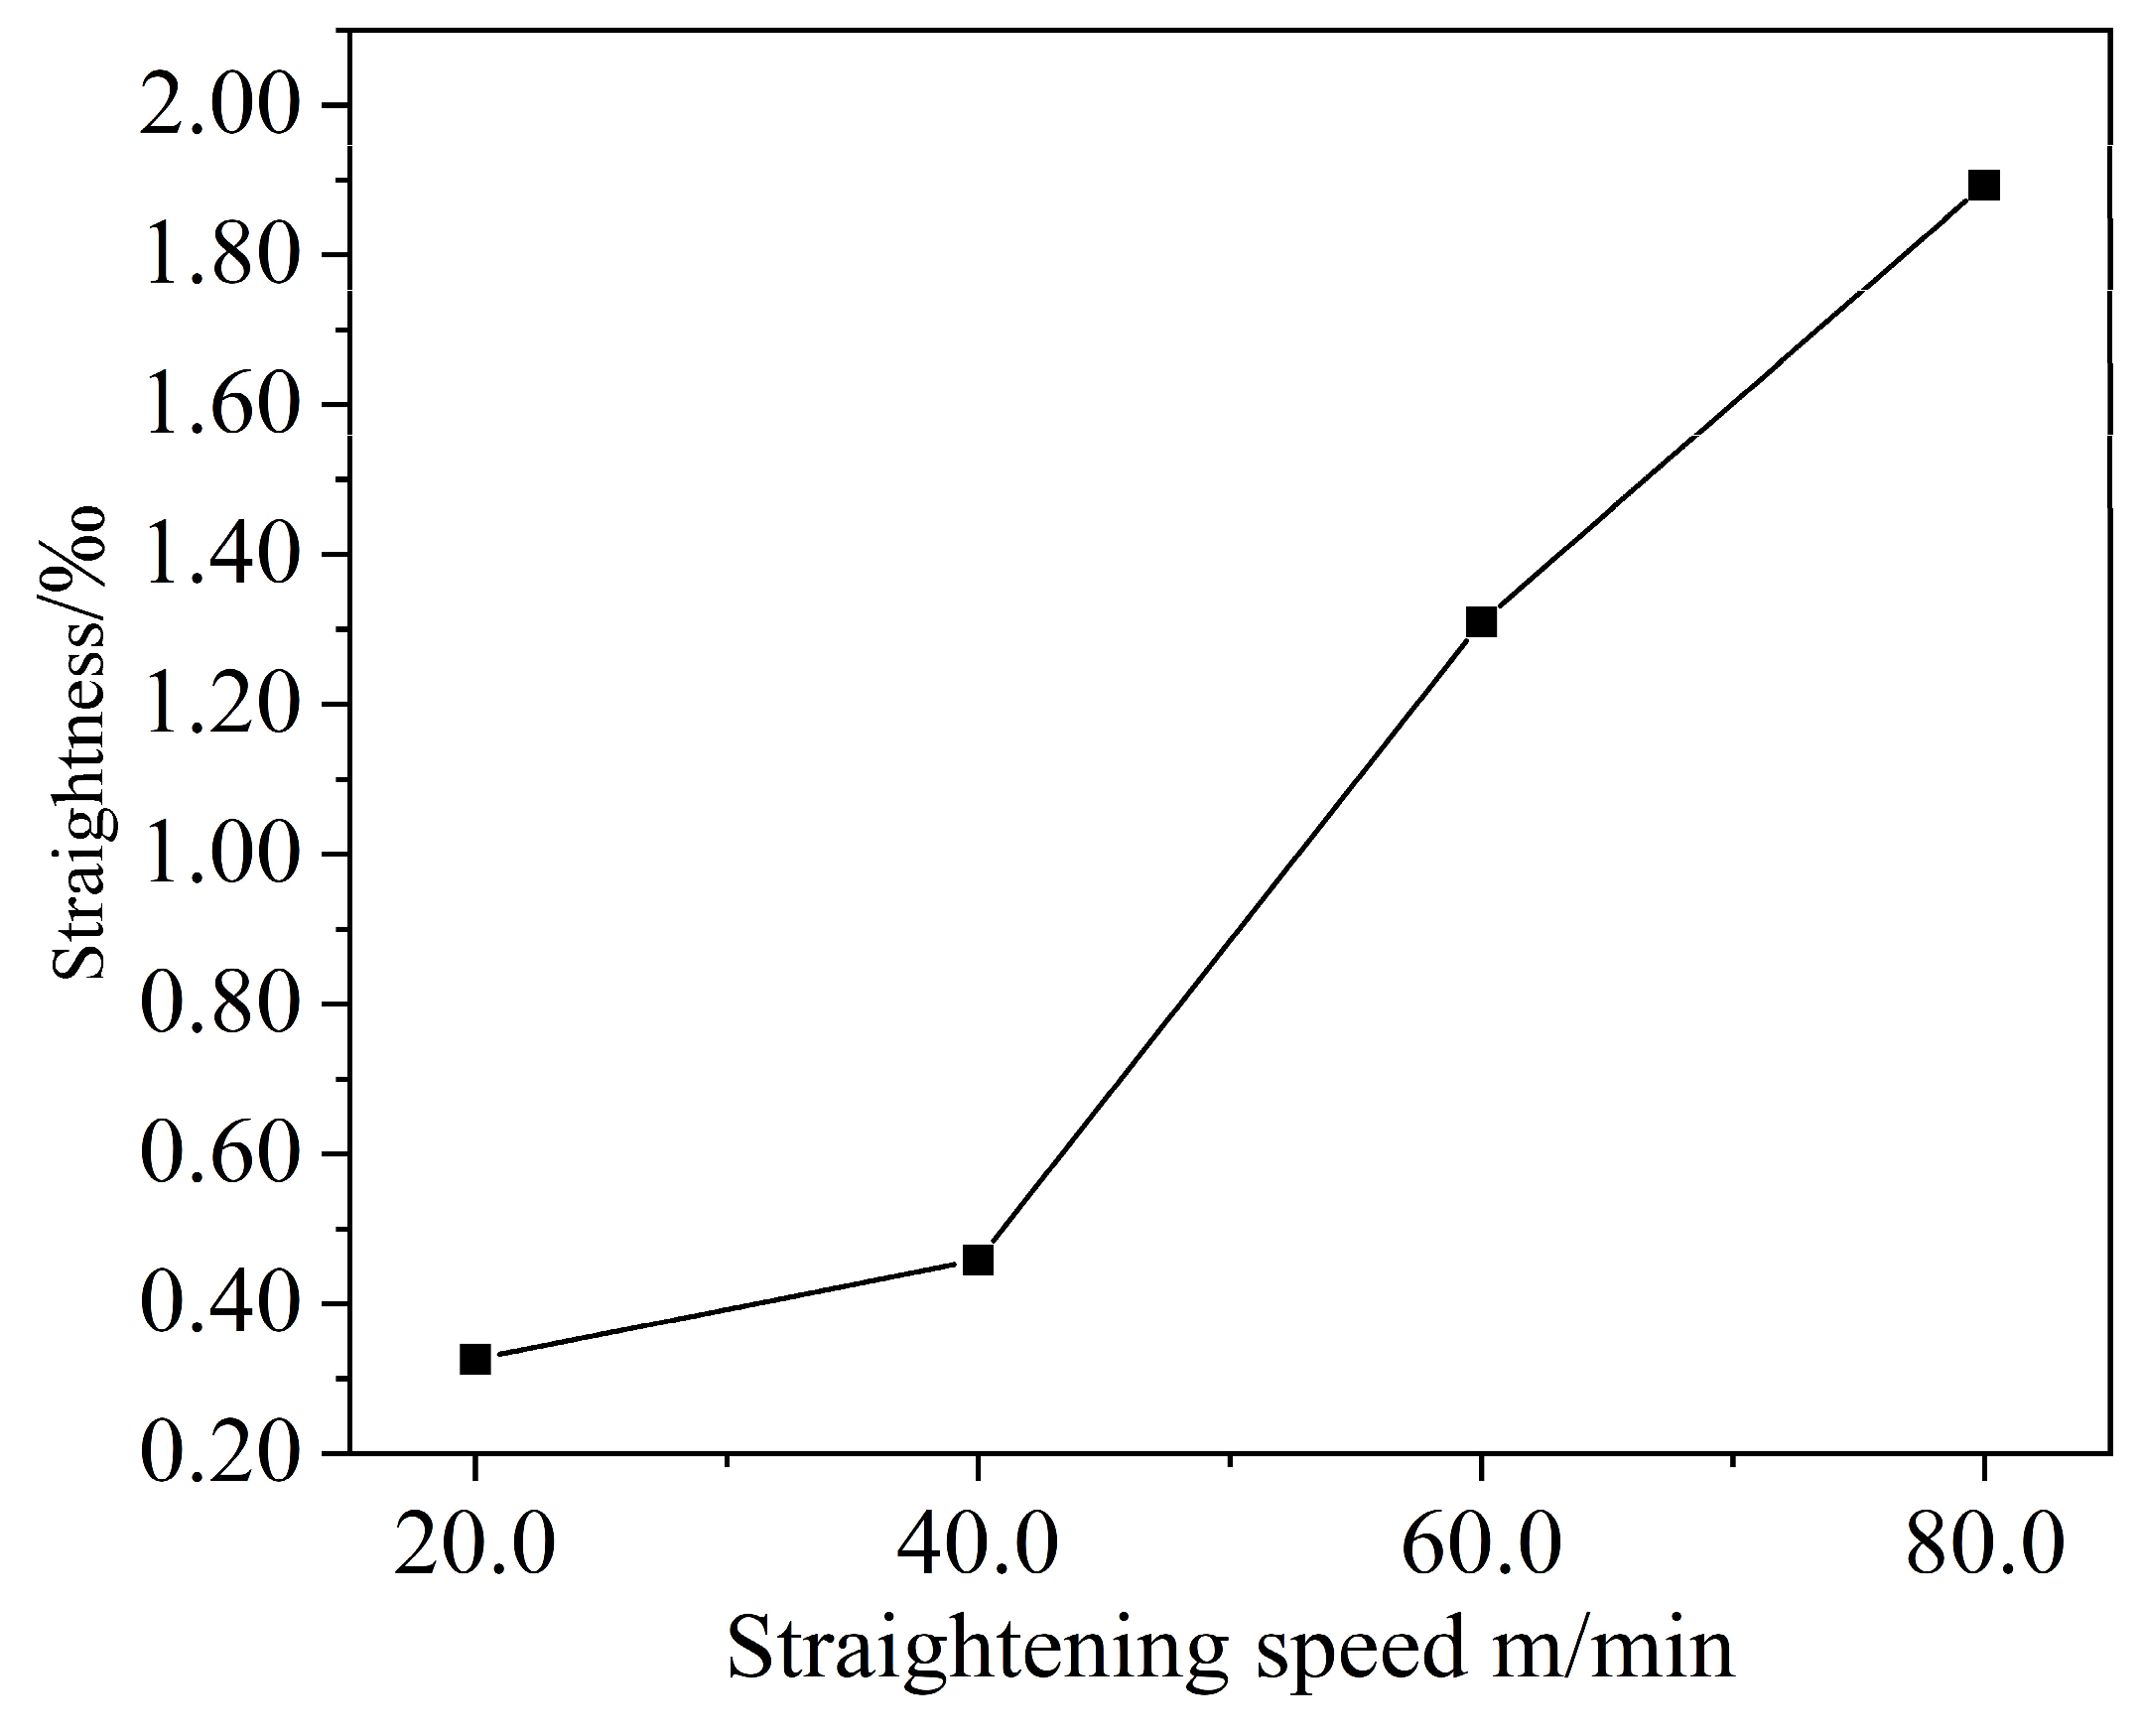
In this study, to investigate the influence of straightening speed on post-straightening straightness, four straightening speed settings were selected: 20 m/min, 40 m/min, 60 m/min, and 80 m/min. All other process parameters were kept at the optimal values determined from the orthogonal experiment. The influence of straightening speed on post-straightening straightness is illustrated in Figure 22.
As shown in Figure 22, when the straightening speed is 20 m/min, the post-straightening straightness of the bar is 0.33‰. At 40 m/min, the straightness increases slightly to 0.46‰. When the speed reaches 60 m/min, the straightness deteriorates to 1.32‰, and at 80 m/min, it further worsens to 1.89‰. This trend clearly indicates that straightening quality declines as straightening speed increases. The underlying reason may be that, at higher speeds, the contact time between the bar and the rolls is reduced, resulting in insufficient release of internal stresses. These residual stresses negatively impact the straightening effect, thereby reducing the final straightness of the product. Therefore, to balance production efficiency and straightening quality, a medium-speed straightening setting of 40 m/min is recommended.

6. Conclusions

Based on the nonlinear combined hardening model, a finite element model for eleven-roll straightening of 20CrMnTi bars was established. The orthogonal experimental design method was employed to optimize the key process parameters, and the effects of roll gap, roll reduction, straightening speed, and roll inclination angle on straightening quality were investigated. The accuracy of the finite element simulation and the reliability of the optimized process parameters were subsequently verified through a straightening experiment. The main conclusions drawn from this study are as follows:
(1)
The finite element simulation results of eleven-roll straightening based on the combined hardening model exhibit good agreement with experimental data. Both the simulated and experimental straightness values were within 1‰ using the optimized process parameters, with a relative error of less than 8%.
(2)
Among the four process parameters, their influence on bar straightness, in descending order of significance, is as follows: roll gap > roll reduction > straightening speed > roll inclination angle. Notably, the roll gap exhibits a significantly greater impact than the other factors.
(3)
A properly selected roll gap enhances the constraint on the bar during straightening, improving post-straightening straightness. However, an excessively small roll gap can lead to a substantial increase in straightening force. Appropriately adjusting the roll reduction helps release residual stress and improves overall straightening quality.
(4)
The roll inclination angle has a considerable influence on both residual stress and straightness. This influence is nonlinear and must be optimized based on actual working conditions. Additionally, a moderate straightening speed of 40 m/min achieves a desirable balance between production efficiency and straightening precision, resulting in the best overall straightening outcome.

Author Contributions

Conceptualization, S.J., S.W. and R.Z.; data curation, S.J., L.B. and Q.M.; formal analysis, L.B., S.W. and R.Z.; funding acquisition, R.Z. and Q.M.; methodology, S.J. and J.Z.; software, L.B. and S.W.; writing—original draft, S.J. and L.B. All authors have read and agreed to the published version of the manuscript.

Funding

This study was funded by the State Key Laboratory of Metal Forming Technology and Heavy Equipment (S2308100.W14), the S&T Program of Hebei (235A4502D, E2025203089), and the S&T Program of Qinhuangdao (202401A013).

Data Availability Statement

The original contributions presented in this study are included in the article. Further inquiries can be directed to the corresponding author.

Conflicts of Interest

Authors Shangwu Jia and Shijie Wang were employed by China National Heavy Machinery Research Institute Co., Ltd. The remaining authors declare that the research was conducted in the absence of any commercial or financial relationships that could be construed as a potential conflict of interest.

References

  1. Prager, W. A New Method of Analysing Stresses and Strains in Work Hardening Plastic Solids. J. Appl. Mech. 1956, 23, 493–496. [Google Scholar] [CrossRef]
  2. Ziegler, H. A Modification of Prager’s Hardening Rule. Q. Appl. Mech. 1959, 17, 55–65. [Google Scholar] [CrossRef]
  3. Armstrong, P.J.; Frederick, C.O. A Mathematical Representation of the Multiaxial Bauschinger Effect; GEGB Report; RD/B/N 731; Berkeley Nuclear Laboratories: Berkeley, CA, USA, 1966. [Google Scholar]
  4. Chaboche, J.-L. Constitutive Equations for Cyclic Plasticity and Cyclic Viscoplasticity. Int. J. Plast. 1989, 5, 247–302. [Google Scholar] [CrossRef]
  5. Chaboche, J.-L. On Some Modifications of Kinematic Hardening to Improve the Description of Ratchetting Effects. Int. J. Plast. 1991, 7, 661–678. [Google Scholar] [CrossRef]
  6. Han, S.W.; Cho, E.S. Simulation of Cyclic Behavior of Mild Steel with Empirical Model Parameter Equations. J. Constr. Steel Res. 2025, 227, 109351. [Google Scholar] [CrossRef]
  7. Shi, F.; Wang, D.S.; Chen, L. Cyclic Elastoplastic Constitutive Model for Stainless Steels Compatible with Multiple Strengths. J. Constr. Steel Res. 2023, 205, 107889. [Google Scholar] [CrossRef]
  8. Yang, M.; Bo, R.Y.; Gou, J.J.; Zhang, Y.; Fan, L.F. A Strain-Space Nonlinear Elasto-Plastic Model Improving Springback Prediction Accuracy and Efficiency. J. Constr. Steel Res. 2025, 226, 109210. [Google Scholar] [CrossRef]
  9. Okorokov, V.; Gorash, Y.; Mackenzie, D.; van Rijswick, R. New Formulation of Nonlinear Kinematic Hardening Model, Part I: A Dirac Delta Function Approach. Int. J. Plast. 2019, 122, 89–114. [Google Scholar] [CrossRef]
  10. Okorokov, V.; Gorash, Y.; Mackenzie, D.; van Rijswick, R. New Formulation of Nonlinear Kinematic Hardening Model, Part II: Cyclic Hardening/Softening and Ratcheting. Int. J. Plast. 2019, 122, 244–267. [Google Scholar] [CrossRef]
  11. Cui, F. Principles of Straightening and Straightening Machinery, 2nd ed.; Metallurgical Industry Press: Beijing, China, 2005. [Google Scholar]
  12. Liu, H.; Li, Q. Analysis of Straightening Roll Profiles and Their Close Relationship with Pipe and Bar Straightening. Steel Pipe 1995, 24, 27–29. [Google Scholar]
  13. Song, H. Study on the Adjustment Angle of Correction Rolls for Pipe Bending Roll Profiles. Heavy Mach. 1999, 299, 25–28. [Google Scholar]
  14. Zhu, M.; Huang, Y.; Wang, C. Study on Flattening Reduction of Opposed Six-Oblique-Roll Pipe Straightening Machine. J. Baotou Steel Inst. 1998, 19, 36–38. [Google Scholar]
  15. Zhao, B.; Zhao, H.; Liu, Z.; Li, S. Influence of Roll Profiles of Inclined Roll Straightening Machine on Installation Angle and Contact Line Length. J. Yanshan Univ. 1998, 22, 74–76. [Google Scholar]
  16. Zheng, G. Study on the Variation Law of Roundness of Steel Pipes Corrected by Inclined Rolls. Min. Metall. Eng. 2003, 23, 89–92. [Google Scholar]
  17. Zhang, Z.Q. Finite element simulation study on residual cross-sectional Ovalization of thin-walled circular steel tubes in continuous rotary straightening process. Int. J. Adv. Manuf. Technol. 2019, 102, 2633–2647. [Google Scholar] [CrossRef]
  18. Zhang, Z.Q.; Yan, Y.H.; Yang, H.L. A simplified model of maximum cross-section flattening in continuous rotary straightening process of thin-walled circular steel tubes. J. Mater. Process. Technol. 2016, 238, 305–314. [Google Scholar] [CrossRef]
  19. Ma, L.-D.; Du, Y.-K.; Meng, Z.-J.; Ma, L.-F.; Liu, Z.-J.; Liu, P.-Y. Effect of process parameters on steel tube roundness in straightening process. J. Iron Steel Res. Int. 2020, 27, 1270–1283. [Google Scholar] [CrossRef]
  20. Ma, L.; Liu, Z.; Ma, L.; Du, Y. Analysis of eleven cross-roll straightening process of steel tube based on cubic spline function and continuous bending elastic-plastic theory. Int. J. Adv. Manuf. Technol. 2021, 112, 3235–3245. [Google Scholar] [CrossRef]
  21. Li, Z. Study on the Wear Mechanism of Straightening Rolls in Roll-Type Straightening Machines. Master’s Thesis, Taiyuan University of Science and Technology, Taiyuan, China, 2024; pp. 2–39. [Google Scholar]
  22. Yao, Y.; Wu, W.; Liu, R.; Deng, L. Analysis of Factors Affecting Roll Diameter and Roll Distance in Roll-Type Straightening Machines. Metall. Equip. 2023, 45, 53–55. [Google Scholar]
  23. Hu, Y.; Yuan, J.; Lv, C. Research and Application of an Intelligent Optimization Process Prediction Model for Roll-Type Straightening. Mod. Manuf. Eng. 2024, 46, 109–117. [Google Scholar]
  24. Gu, C.; Ye, Y.; Fu, T.; Ma, M. Overview of Roll-Type Straightening Technology and Equipment Development. Heavy Mach. 2023, 315, 12–17. [Google Scholar]
  25. Mwita, W.M.; Akinlabi, E.T. Numerical prediction of tensile yield strengthand micro hardness of Ti6Al4V alloy processed by constrained bending and straightening severe plastic deformation. Mater. Res. Express 2019, 6, 106560. [Google Scholar] [CrossRef]
  26. Gruber, M.; Kummel, L.; Hirt, G. Control of residual stresses by roller leveling with regard to process stability and one-sided surface removal. J. Mater. Process. Technol. 2020, 280, 116600. [Google Scholar] [CrossRef]
  27. Petruska, J.; Navrat, T.; Sebek, F. Novel approach to computational simulation of cross roll straightening of bars. J. Mater. Process. Technol. 2016, 233, 53–67. [Google Scholar] [CrossRef]
  28. Kuboki, T. FEM analysis of tube straightener adopting implicit scheme. In Proceedings of the Metal Forming 2010: Proceedings of the 13th International Conference on Metal Forming, Toyohashi, Japan, 19–22 September 2010; pp. 584–587. [Google Scholar]
  29. Meng, Q.; Zhai, R.; Fu, P.; Zhang, Y.; Zhao, J. Springback Analysis of Rotary Bending Considering Strain Paths. J. Mater. Process. Technol. 2023, 315, 117930. [Google Scholar] [CrossRef]
  30. Domitner, J.; Schneeberger, P.; Silvayeh, Z.; Schnideritsch, H.; Engel, J.K.; Schider, S.; Klarner, J. Experimental Quantification of the Wear Performance of Rolls Used in Industrial Rotary Straightening of Seamless Steel Tubes. Wear 2025, 578, 206148. [Google Scholar] [CrossRef]
  31. Niu, T.; Luo, Y.; Chen, F.; Baddour, N.; Li, C.; Peng, B. Investigation of Rotary Straightening Process for the Rollers of Planetary Roller Screw. J. Braz. Soc. Mech. Sci. Eng. 2025, 47, 116. [Google Scholar] [CrossRef]
Figure 3. Geometry of cyclic tensile specimens (mm).
Metals 15 00908 g003
Figure 4. Cyclic tensile test equipment: (a) 20CrMnTi bar specimen; (b) cyclic loading process; (c) Instron 8801 electro-hydraulic servo fatigue testing machine.
Metals 15 00908 g004
Figure 5. Stress–strain curve of cyclic loading.
Metals 15 00908 g005
Figure 6. Finite element model of bar eleven-roll straightening.
Metals 15 00908 g006
Figure 7. Schematic diagram of the initial bar.
Metals 15 00908 g007
Figure 8. Eleven-roll straightening machine for bars.
Metals 15 00908 g008
Figure 9. Flow chart of field straightening.
Metals 15 00908 g009
Figure 10. Straightness check after bar straightening.
Metals 15 00908 g010
Figure 11. Effect of straightening rollers with different inclination angles on bar straightness.
Metals 15 00908 g011
Figure 12. Effect of roll reduction on straightness of bars.
Metals 15 00908 g012
Figure 13. Effect of different roll gap values on bar straightness.
Metals 15 00908 g013
Figure 14. Effect of the size of the roll gap on the straightening force.
Metals 15 00908 g014
Figure 15. Residual stress distribution at different roll gaps: (a) 70.0 mm; (b) 70.6 mm; (c) 71.2 mm; (d) 71.8 mm.
Metals 15 00908 g015
Figure 16. Straightness data of bars after straightening with different roll gap values.
Metals 15 00908 g016
Figure 17. Maximum stresses in bars with different roll reductions: (a) roll reduction of 6 mm; (b) roll reduction of 8 mm; (c) roll reduction of 10 mm; (d) roll reduction of 12 mm.
Metals 15 00908 g017
Figure 18. Straightness data of bars after straightening with different roll reductions.
Metals 15 00908 g018
Figure 19. Selected point paths and equivalent plastic strain evolution in bar section: (a) schematic diagram of selected cross-sectional path of the bar; (b) effect of roll reduction on post-straightening equivalent plastic strain.
Metals 15 00908 g019
Figure 20. Influence of straightening roll inclination angle on residual stress of bar after straightening: (a) 32°; (b) 34°; (c) 36°; (d) 38°.
Metals 15 00908 g020
Figure 21. Effect of roll inclination on straightness.
Metals 15 00908 g021
Figure 22. Effect of straightening speed on straightness after straightening.
Metals 15 00908 g022
Table 1. Main literature comparison.
ReferenceHardening ModelModel AccuracyRoll ConfigKey Contribution
[17]Linear kinematic hardeningLowEight cross-rollTube ovalization control
[18]Isotropic hardeningLowEight cross-rollTube flattening analysis
[19]Isotropic hardeningLowSix cross-rollOptimization of tube flattening displacement
[20]Bilinear hardening modelLowEleven cross-rollProcess analysis
[27]Linear kinematic hardeningLowTen cross-rollNew simulation method
This studyChaboche combination hardeningHighEleven cross-rollAccurate optimization of process parameters
Table 2. Chemical composition of 20CrMnTi bars/wt.%.
MaterialCSiMnpSCrTiNiCuMoFe
20CrMnTi0.190.260.960.0180.0181.140.0550.030.020.02Balanced
Table 3. Material parameters obtained by fitting the nonlinear hardening model.
Parameters20CrMnTiValue Range
Y 0 /MPa535
b 10550–10,000
Q /MPa−324.240–10,000
E /GPa173
C 1 /MPa451,319.140–1,000,000
C 2 /MPa26,005.190–300,000
C 3 /MPa2910.560–100,000
γ 1 2043.160–10,000
γ 2 170.60–5000
γ 3 3.070–1000
Table 4. Orthogonal test factor level table.
FactorParameterLevel 1Level 2Level 3Level 4
AAngle/°32343638
BRoll reduction/mm681012
CStraightening speed/(mm/min)20406080
DRoll gap/mm70.070.671.271.8
Table 5. Orthogonal test program and results.
Test NumberFactor AFactor BFactor CFactor DStraightness/‰
132°6 mm20 m/min 70.0 mm1.82
232°8 mm40 m/min70.6 mm1.23
332°10 mm60 m/min71.2 mm1.12
432°12 mm80 m/min71.8 mm1.93
534°6 mm60 m/min70.6 mm1.73
634°8 mm80 m/min70.0 mm1.26
734°10 mm20 m/min71.8 mm1.74
834°12 mm40 m/min71.2 mm2.07
936°6 mm80 m/min71.2 mm1.52
1036°8 mm60 m/min71.8 mm2.89
1136°10 mm40 m/min70.0 mm1.22
1236°12 mm20 m/min70.6 mm1.82
1338°6 mm40 m/min71.8 mm2.7
1438°8 mm20 m/min71.2 mm2.32
1538°10 mm80 m/min70.6 mm1.39
1638°12 mm60 m/min70.0 mm1.26
Table 6. Range analysis of bar straightness.
RangeFactor AFactor BFactor CFactor D
k11.531.941.931.39
k21.701.931.811.54
k31.861.371.851.76
k41.921.771.432.31
R0.390.570.50.93
Table 7. ANOVA of orthogonal test.
FactorSum of SquaresDegrees of FreedomMean SquareF-Valuep-Value
Roll inclination angle0.33430.1114.440.055
Reverse bending displacement0.29030.0973.880.052
Straightening speed0.25630.0853.400.065
Roll gap0.31030.1034.120.048
Error0.25030.083
Total1.44015
Disclaimer/Publisher’s Note: The statements, opinions and data contained in all publications are solely those of the individual author(s) and contributor(s) and not of MDPI and/or the editor(s). MDPI and/or the editor(s) disclaim responsibility for any injury to people or property resulting from any ideas, methods, instructions or products referred to in the content.