Abstract
Additive manufacturing (AM), particularly laser powder bed fusion (L-PBF), provides unmatched design flexibility for creating intricate steel structures with minimal post-processing. However, adopting L-PBF for high-performance applications is difficult due to the challenge of predicting microstructure evolution. This is because the process is sensitive to many parameters and has a complex thermal history. Thin-walled geometries present an added challenge because their dimensions often approach the scale of individual grains. Thus, microstructure becomes a critical factor in the overall integrity of the component. This study focuses on applying cellular automata (CA) modeling to establish robust and efficient process–structure relationships in L-PBF of 316L stainless steel. The CA framework simulates solidification-driven grain evolution and texture development across various processing conditions. Model predictions are evaluated against experimental electron backscatter diffraction (EBSD) data, with additional quantitative comparisons based on texture and morphology metrics. The results demonstrate that CA simulations calibrated with relevant process parameters can effectively reproduce key microstructural features, including grain size distributions, aspect ratios, and texture components, observed in thin-walled L-PBF structures. This work highlights the strengths and limitations of CA-based modeling and supports its role in reliably designing and optimizing complex L-PBF components.
1. Introduction
Additive manufacturing (AM) has established itself as a promising, resource-efficient technology that is opening up new possibilities for the production of metal components in various industries. Laser powder bed fusion (L-PBF) is a widely used AM process in which the component is built up layer by layer by locally melting raw material powder with a laser. With virtually unlimited degrees of geometric freedom, the L-PBF process enables the fabrication of complex, customized, filigree components with significantly reduced machining requirements compared to conventional manufacturing (CM) [1,2,3,4,5,6,7,8]. Despite its potential, AM, particularly L-PBF, faces significant obstacles to becoming a reliable and sustainable method for producing high-strength, safety-critical components. A key technological barrier is the complexity of the process, which is characterized by its dependence on a large number of parameters and a complex thermal history during solidification, making it difficult to predict microstructures and mechanical properties. For L-PBF filigree structures, the challenge is compounded by geometric and mechanical property deviations from desired specifications, exacerbated by their thin-walled design. In addition, the dimensions of these structures are often on the scale of grain sizes, placing the microstructure at the forefront of mechanical behavior assessment. Addressing these challenges requires not only a comprehensive understanding but also accurate and efficient predictive tools to assess the effects of process parameters and microstructures.
Investigating how different process parameters affect grain morphology is not only costly but also time-consuming. With increasing computing power, progress has been made in developing predictive physics-based multiscale modeling approaches to link process, microstructure, and properties by deriving so-called process-structure-property (PSP) relationships. Depending on L-PBF process parameters such as laser power, scan speed, and scan strategy, the resulting microstructures are highly complex and can include long, curved columnar grains with varying orientations and combinations of planar and cellular features [1]. There are several multiscale modeling approaches for simulating L-PBF solidification processes and establishing process-structure (PS) relationships: (1) cellular automata (CA) [2,3] integrated with finite element [4,5,6], finite difference [7,8], finite volume [9,10,11,12], or lattice Boltzmann methods [13] to model energy transfer; (2) kinetic Potts-type Monte Carlo (KMC) [14]; and (3) phase-field models (PFM) [15,16,17,18,19]. Each model offers unique perspectives and challenges in capturing the complexities of microstructural changes during AM processes. CA and KMC models operate at the mesoscale, focusing primarily on simulating a large number of grains with attention to their overall dimensions and shape. On the other hand, PFMs operate at the microscale, capable of detailed simulations down to the subgrain level, including aspects such as solute concentrations and the shapes of precipitates and dendrites. The CA approach provides a simplified, coarser view of cellular or dendritic microstructure by considering only the convex hull of a dendrite and ignoring internal segregation within a grain. The advantage of a CA model over a PF or KMC model is that it combines computational simplicity and scalability with physical rigor. The growth kinetics of dendrite tips in CA models are determined by local undercooling, but these models lack detailed information about the internal structure of grains. Due to the steep thermal gradients in AM melt pools that result in a narrow mushy zone, some CA models for additive solidification neglect heterogeneous nucleation to improve computational efficiency [8,20]. In [21], a detailed 3D numerical model was developed to investigate grain growth mechanisms in L-PBF 316L stainless steel using the CA method, with inputs from powder-scale thermo-fluid dynamics, including the temperature field and molten powder bed configuration. KMC models are used to simulate curvature-driven phase boundary growth and can address large-scale problems such as modeling entire devices. Although KMC models provide some insight into grain structures similar to those observed experimentally, they struggle to accurately simulate grain selection and texture formation in additive manufacturing (AM) processes. Nevertheless, KMC models have the potential to effectively model aspects such as grain coarsening in the heat-affected zone (HAZ) during post-solidification heat treatments. The PF model, based on irreversible thermodynamics, analyzes microstructural changes, taking into account the effects of solute concentration and temperature gradients, which are particularly relevant for AM. For certain alloys in AM, complexities like dendritic growth and solute diffusion may be omitted, allowing PFMs to focus more on polycrystalline microstructure evolution, similar to CA and KMC models [22,23]. Recent advances in 3D grain-scale PF modeling have enabled detailed simulations of the AM solidification process, including nucleation, orientation, grain growth kinetics, and grain coarsening [24,25].
Xue et al. [26] recently introduced the Physics-Embedded Graph Network (PEGN), a novel method that represents grain structure by graphs and incorporates classical PF theory into these networks, providing a scalable and time-efficient way to accurately predict microstructure evolution. However, despite the strengths of phase-field modeling in simulating additively manufactured (AM) microstructures, many studies still neglect texture evolution—either by limiting simulations to a small set of crystallographic orientations [27] or by omitting crystallographic orientation entirely. Chen et al. [28] used coupled FEM-PFM simulations to study how inter-track overlap ratio affects texture evolution in L-PBF SS316L. To reduce computational cost, they modeled 45 crystallographic orientations derived from <100>, <101>, and <111>. They identified hatch distance—linked to overlap ratio—as a key factor in controlling texture.
Xie et al. [29] extended a cellular automata model to better capture the microstructure evolution in additive manufacturing of Inconel 625, particularly across samples with varying cross-sectional areas. By incorporating crystallographically preferential nucleation based on local thermal gradients and allowing grain growth in mushy zones via solid-solid interface migration, the model more accurately represented texture development. Their simulations and EBSD measurements revealed that narrow-section samples exhibit nearly equiaxed grains with strong <100>//BD texture, while broad-section samples showed coarser, more heterogeneous microstructures. To enhance the computational efficiency of cellular automata (CA) models in additive manufacturing, Liang et al. [30] introduced a multi-level capture algorithm that prunes redundant grain growth paths through level-by-level pre- and post-pruning, paired with time-resolved growth tracking. This approach allows for larger time steps without sacrificing accuracy in grain competition modeling. In contrast, ExaCA, a CA framework recently updated by Rolchigo et al. [31], incorporates remelting, cumulative multi-pass thermal history, and scan path rotation using a sparse temperature-time format. With GPU acceleration and scalable architecture, ExaCA enables high-throughput, large-scale simulations, though it relies on approximate grain capture logic.
Despite recent advances in computational efficiency and modeling accuracy, robust and predictive simulation workflows for complex use cases—such as thin-walled filigree structures in biomedical and aerospace applications—remain limited. Determining suitable L-PBF parameters and scan strategies to achieve targeted microstructures and properties is still largely reliant on trial and error, with no assurance of achieving long-term performance. While morphological features of microstructures can often be qualitatively reproduced in current simulations, texture prediction is typically neglected or oversimplified, especially for intricate geometries and realistic scanning strategies, and rarely validated against EBSD data. Yet texture plays a critical role in determining mechanical properties and failure modes, particularly when structure dimensions approach grain size.
The questions of which modeling techniques to use, how process parameters influence both morphological and crystallographic features, and what limitations still hinder predictive capability remain open. Addressing these questions is vital for enabling efficient, simulation-driven process optimization for L-PBF of filigree components.
This work aims to address these gaps by developing a robust and time-efficient approach for predicting the microstructure of L-PBF 316L stainless steel manufactured with parameters optimized for thin-walled, load-bearing applications. The specific objectives are (1) to adapt and apply a state-of-the-art cellular automata (CA) modeling framework for L-PBF process simulation; (2) to evaluate the resulting microstructure predictions in terms of both morphology and crystallographic texture; and (3) to quantify the influence of key process variables—specifically laser absorption rate and nucleation density—on texture evolution. Process simulation is carried out using the latest ExaCA framework, driven by temperature fields generated from AdditiveFoam thermal simulations. The predicted textures are validated against experimental electron backscatter diffraction (EBSD) data for 316L stainless steel, enabling a detailed assessment of the model’s predictive capability.
2. Methodology
This section details the methodology for predicting grain morphology and texture of additive manufactured 316L through the combined use of ExaCA [32,33] and AdditiveFoam [34]. ExaCA is a cellular automaton developed to efficiently simulate grain growth in additive manufacturing (AM) processes. It is grounded on the pioneering work of Gandin and Rappaz [35] and decouples the CA from the temperature field simulation, significantly speeding up the overall simulation process by reusing temperature profiles. Efficiency is further improved by utilizing Kokkos and MPI, which enable single-node CPU parallel computation, GPU acceleration, and cross-node parallel computation. Meanwhile, AdditiveFoam, a customer computational fluid dynamic (CFD) solver for temperature field simulation, has been adopted. AdditiveFoam is based on OpenFOAM and is specifically tailored for additive manufacturing applications. The two models are loosely coupled via a CSV-like sparse temperature history file whose format is defined by ExaCA. In the following sections, we provide a summary of the theoretical and algorithmic framework of these two models.
2.1. Celluar Automata
2.1.1. Algorithm for Decentered Octahedrons
The Decentered Octahedron algorithm is a computational technique employed in cellular automaton models to simulate grain growth during solidification processes. This algorithm was initially proposed and implemented by Gandin and Rappaz [35]. The advantage of this algorithm lies in its ability to effectively track the envelope of arbitrarily oriented growing grains while minimizing the artificial anisotropy introduced by a regular grid. This is accomplished by utilizing octahedrons to represent and track the envelope of growing grains, with the six half-diagonals corresponding to the preferred <100> growth directions of dendrites. In the context of the Decentered Octahedron algorithm, the cells within the simulation domain are classified into three categories: liquid, solid, and active cells. Active cells separate the liquid and solid cells, with each active cell being assigned an independently tracked octahedron. During the simulation process, the octahedrons of active cells expand at a rate determined by the local temperature and undercooling conditions, which are modeled by the interface reaction function (see the following section). The centers of neighboring liquid cells of an active cell can be impinged upon by the octahedron of the active cell, leading to a capture event. This event is accompanied by the transition of the captured cell state from liquid to active, during which a new octahedron is assigned to the cell. The new octahedron is positioned to overlap the corner of the capturing octahedron closest to the center of the captured cell while maintaining the same orientation as the capturing octahedron. A cell becomes inactive when there are no more neighboring liquid cells. Consequently, the octahedron associated with this inactive cell is no longer tracked. If the temperature of a liquid cell falls to the critical undercooling threshold prior to when it is captured, a nucleation event occurs. The subsequent section elaborates on the specific algorithmic procedure for nucleation.
2.1.2. Interface Reaction Function
At the grain growth front, where the solid phase region grows into the undercooling area, a range of complex multi-physical phenomena occur, typically encompassing solute segregation, interfacial energy, and local non-equilibrium effects. The use of computational models to simulate these phenomena on a large scale is prohibitively expensive, if not practically infeasible. Consequently, the Interfacial Response Function (IRF) is employed. The IRF serves as a mathematical representation and approximation of the interface behavior between the solid and liquid phases during solidification, relating the growth velocity of the grain envelope to the local undercooling.
In ExaCA, the analytical approach of the Kurz, Giovanola, and Trivedi (KGT) model [36] is adopted. The interface response function has the form of
where is the local undercooling within the active cell. , and D are fitting parameters; in this work, we use the values of the parameters that come with ExaCA’s source code for 316L. The half-diagonals are then the growth at each time step by the amount of , where is the time step size and is the cell size.
2.2. Nucleation of Heterogeneous Grains
In laser powder bed fusion (L-PBF) additive manufacturing, the molten metal liquid exhibits inhomogeneity due to the presence of gas bubbles, unmelted or partially melted metal powders, or fragmented dendrite tips from growing grains. This inhomogeneity results in a heterogeneous nucleation. ExaCA has adapted the original nucleation approach of Gandin and Rappaz by coupling the temperature profile with the predetermined knowledge of the location and duration of a cell in the liquid state prior to simulation initialization. In ExaCA, a fraction , representing the nucleation density (i.e., the number of potential nuclei per unit volume), is randomly selected from the set of cells destined to become liquid. Each selected cell is assigned a critical undercooling , sampled from a Gaussian distribution.
where is the mean nucleation undercooling and the standard deviation. If a liquid cell is chosen as a potential nucleus and is not captured by a neighboring grain before reaching its critical undercooling , a nucleation event will occur, resulting in the formation of a new nucleus with a random orientation.
2.3. Temperature Profile with CFD Simulation
The cellular automaton (CA) model simulates the growth of dendritic and cellular structures by measuring local undercooling conditions through an interfacial response function (IRF) that correlates the grain boundary velocity with the thermodynamic driving force. The CFD simulation provides the thermal field that drives the microstructural evolution by solving a set of conservation equations that include the conservation of mass, momentum, and energy. The temperature profile is subsequently then coupled to the CA model through a sparse representation as specified by ExaCA. This section details the formulation of the coupled CFD simulation model.
The conservation of mass ensures that the mass of the fluid is conserved as it moves through space and time.
where denotes the mixture density of solid and liquid phases, t represents time, and is the velocity vector field.
The momentum conservation equation incorporates viscous stresses, pressure gradients, and body forces:
where p is the pressure field, the dynamic viscosity, and the body force term that includes both buoyancy effects (modeled through the Boussinesq approximation) and mushy zone resistance.
The conservation of energy equation accounts for the change in the thermal energy of the system, considering both heat conduction and other sources of energy.
where represents the specific heat capacity, T denotes the temperature field, and is the thermal conductivity.
In the case of additive manufacturing, the body force in the Equation (2) can be formulated as
where is the reference mixture density at reference temperature . is the coefficient of thermal expansion. is the gravitational acceleration vector. and are the viscosity and velocity, respectively. K is the permeability of the mushy zone, given by
where is the dendrite arm spacing, and is the mass fraction of liquid in the solid liquid mixture in the mushy zone.
in Equation (3) accounts for the latent heat duration phase transformation
In the above equations, is modeled by
where is the arithmetic mean of liquidus temperature and eutectic temperature .
2.3.1. Heat Source
A volumetric Gaussian heat source with a circular beam in the x-y plane and a finite penetration depth, as proposed by Goldak et al. [37], is used:
where are the coordinates of a location using the center of the laser beam as the origin. is a temperature-independent absorption rate of the surface of the powder bed. P is the laser power. r is the beam size in terms of radius. d is the penetration depth.
2.3.2. Boundary Conditions
The thermal boundary conditions at the top surface include conductive and radiative heat transfer.
where is the thermal conductivity, is the emissivity, is the far-field temperature, and // is the Stefan-Boltzmann constant. For the other sides of the simulation domain, Neumann BC is applied with a value of zero.
The main driving force of fluid flow in the melt pool is the Marangoni effect, which is caused by differences in surface tension due to the large temperature gradient (for an illustration, see Figure 1). The velocity boundary condition is equal to
where is the surface tension gradient and is the tangential vector. The Marangoni effect plays a critical role in laser-based additive manufacturing due to the steep temperature gradients induced by localized heating. As surface tension decreases with increasing temperature, fluid is driven from the hotter center of the melt pool toward the cooler periphery. This thermocapillary-driven surface flow alters the shape of the melt pool, enhances convective mixing, and changes the direction and rate of heat extraction—all of which influence the resulting grain morphology. Depending on the local solidification conditions, Marangoni convection may either suppress or promote grain refinement [38].
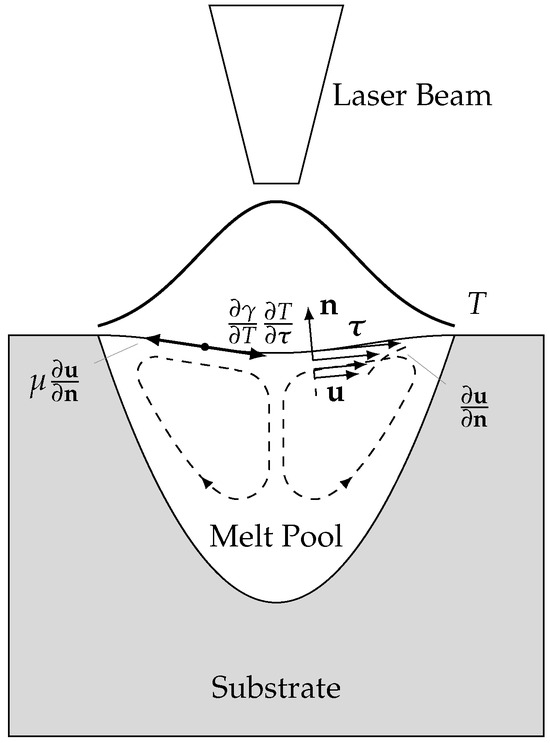
Figure 1.
Schematic illustration of the Marangoni effect observed during laser-based additive manufacturing.
2.4. Parameters of Numerical Experiments
The simulation domain and mesh sizes are crucial to computational modeling in additive manufacturing. In this study, both CFD and cellular automata are performed in a size domain of . In the CFD simulations, adjustable time step sizes were used, with maximum Courant numbers, maximum interface Courant numbers, and maximum diffusion numbers set to 1, 1, and 10, respectively, which is consistent with the default settings in AdditiveFoam. The mesh size for the CFD domain was set to . For the CA simulations, a fixed time step of s was applied, which is one-third of the s used in [32]. The CA mesh size was set to m, slightly coarser than the m used in the same study, to reduce computational cost while maintaining sufficient accuracy. Table 1 and Table 2 contain the parameters for both simulations. To lower the computation cost, fluid flow is turned off in AdditiveFoam. The simulations used 448 Intel(R) Xeon(R) Platinum 8480+ (Sapphire Rapids) CPUs and were run on the Linux Cluster at Leibniz–Rechenzentrum (https://www.lrz.de/ (accessed on 24 May 2025)).

Table 1.
Thermophysical properties of SS316L, values without citation: from [39]. *: as is recommended by AdditiveFoam document.
Table 2.
CA related simulation parameters.
3. Experimental Details
3.1. Specimen Fabrication
Three rectangular blocks, each with six equally sized compartments arranged in two columns and three rows, were fabricated using an AMCM M290 FDR L-PBF system (AMCM GmbH, Starnberg, Germany) under an argon atmosphere. Oxygen levels were maintained below 0.1% to minimize oxidation. The process parameters used during fabrication are summarized in Table 3 and were selected based on prior experimental studies [44], which optimized L-PBF settings for high-resolution 316L stainless steel structures. A standard meander scanning strategy with a layer rotation was applied to reduce texture anisotropy. The platform temperature was controlled at 353 K. The blocks were printed with three wall thicknesses: 0.5 mm, 0.75 mm, and 1.0 mm. The parallel-sheet geometry facilitates the precise extraction of thin metal specimens for microstructural characterization using wire electrical discharge machining (EDM). A schematic of the scan strategy is provided in Figure 2.
Table 3.
Process parameters of experiment.
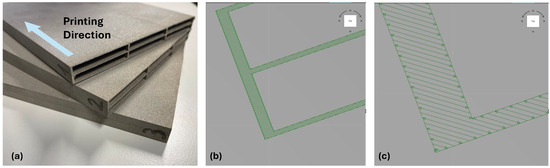
Figure 2.
(a) Printed rectangular blocks with a height of 155 mm, width of 124 mm, and wall thicknesses of 0.5 mm, 0.75 mm, and 1.0 mm; (b) schematic illustration of the scanning strategy; (c) enlarged view showing the laser scan path.
For the EBSD analysis in this study, the 1.0 mm samples were selected for two primary reasons. First, the current process-structure simulations are the first step in a process-structure-property-performance (PSPP) modeling framework that aims to predict the mechanical behavior of 316L L-PBF aortic stents, which have a nominal wall thickness of 1 mm. Second, Wiesent et al. [44] demonstrated that 1 mm-thick samples more accurately reflect bulk-like thermal gradients during solidification. Thinner geometries tend to exaggerate edge effects. Future studies are planned to include thinner geometries to capture size effects both experimentally and computationally.
3.2. Electron Backscatter Diffraction Analysis
Samples for electron backscatter diffraction (EBSD) analysis were prepared using a conventional metallographic technique involving sequential grinding and polishing steps, followed by 5 min polishing with SiO2 nanoparticles (OPS). Characterization was conducted on planes normal and parallel to the build direction (BD). Two experimental EBSD datasets, referred to as Experimental 1 and Experimental 2, were obtained from two adjacent 1 mm × 1 mm × 1 mm specimens extracted from the same 1.0 mm-thick wall block, as described in Section 3.1. The use of adjacent volumes enables the assessment of local microstructural variability under identical processing conditions. Experimental 1 was acquired using a TESCAN Mira field emission scanning electron microscope (SEM). Grain orientation and texture were determined via the EBSD technique using a Velocity Pro (EDAX AMETEK) detector. The SEM operated at U = 20 and I = 1 current during EBSD analysis, with a sample tilt angle of and a working distance of WD = 15 . The detection configuration set to 1 × 1 binning with a region of interest (ROI) of 500 × 500 was set. Experimental 2 was obtained using a Zeiss EVO MA15 SEM (Carl Zeiss Microscopy GmbH, Jena, Germany) coupled with an EDAX EBSD system. The parameters were set as follows: U = 20 , I = 4 , and WD ≈ 20 . The raw EBSD data was processed using commercially available ATEX software (Version 4.13) [45]. Grain boundaries were classified into low angle (2–), medium angle (5–), and high angle (15–) based on their misorientation range. For grain size distribution and grain aspect ratio analysis, a grain tolerance angle of was set, and grains with a size of five pixels were excluded.
4. Results
4.1. Comparison of Experimental and Simulated 3D Crystallographic Textures
As described in Section 3.2, two experimental datasets (Experimental 1 and 2) were obtained from two adjacent 1 mm × 1 mm × 1 mm cubes extracted from the same 1.0 mm-thick wall block. This setup enables a direct comparison of local microstructural variation under identical L-PBF processing conditions. A total of 12 simulations were performed, systematically varying laser absorption rate and nucleation density . Figure 3 presents a three-dimensional crystallographic textures derived from electron backscatter diffraction (EBSD) and compares the crystallographic textures of Experimental 1 and 2 with two simulation cases (Simulation 9: = 0.40; Simulation 6: = 0.35), all evaluated at a constant nucleation density of . For each simulation, microstructural samples were extracted from the center region of the computational domain to avoid boundary effects. The images show representative volumes of 500 × 500 × 500 , highlighting the three principal sample planes—top (XY), front (XZ), and side (YZ)—of L-PBF-fabricated 316L stainless steel specimens. All textures are displayed using an inverse pole figure (IPF) color scheme with respect to the build direction (BD), where red, green, and blue correspond to <001>, <101>, and <111> orientations, respectively.
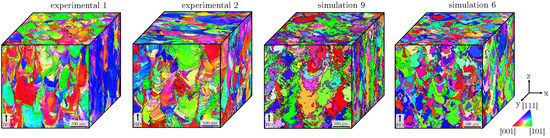
Figure 3.
3D crystallographic texture of two L-PBF-fabricated specimens compared to two simulated crystallographic textures.
The experimental textures reveal characteristic features of L-PBF grain structures, including elongated grains aligned with the build direction and strong crystallographic orientation preferences. Experimental Dataset 1 shows more pronounced texture alignment and fewer misorientations, whereas Experimental Dataset 2 displays slightly greater variability and evidence of grain competition, likely due to localized differences in thermal history during fabrication. Additionally, subtle variations in EBSD sample preparation or surface quality may influence the detectability of fine grains and grain boundaries, contributing to the observed differences. These findings underscore the inherent stochastic nature of the L-PBF process and highlight the value of analyzing multiple regions to robustly validate simulation predictions against experimental microstructures.
These trends are qualitatively reflected in the simulated textures. Simulation 9, modeled with a higher laser absorption rate ( = 0.40), results in stronger texture alignment along BD with visibly columnar grains and distinct orientation bands. In contrast, Simulation 6 ( = 0.35) produces a more equiaxed and diffuse texture, characterized by increased orientation scatter and less pronounced directionality. Although some differences in grain morphology and sharpness remain, the simulations effectively capture the influence of process parameters—especially absorption rate—on texture evolution. This alignment between simulated and measured textures reinforces the predictive capability of the model for capturing grain orientation development in L-PBF-processed parts.
Figure 4 presents comparative visualization of inverse pole figures (IPFs) obtained from experiments and simulations. Each row corresponds to a specific sample surface orientation (XZ, YZ, and XY planes), with the IPFs showing the distribution of crystallographic orientations relative to the X and Z (build) directions using standard stereographic triangles. Texture intensity is expressed in multiples of a random distribution (MRD), with higher values indicating stronger alignment.
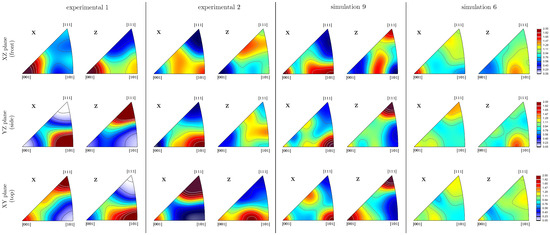
Figure 4.
IPF’s measured using electron backscatter diffraction. Comparison between two experimental datasets and two simulated data sets.
In the XZ-plane (front face), Experimental Dataset 1 exhibits a pronounced <001> fiber texture along both the X and Z directions, with a secondary peak near <101> in Z. This dual-axis alignment indicates strong directional solidification along the laser scan and build axes, driven by steep thermal gradients. In contrast, Experimental Dataset 2 shows a shift in the X-direction texture toward <101> and a broader distribution in Z, centered closer to <111>, reflecting deviations in heat flow and increased grain competition.
Simulation 9 closely matches Experimental 2, showing dominant <101> alignment in X and <111> in Z, suggesting realistic grain competition and orientation selection under moderate thermal gradients. Simulation 6, modeled with reduced absorption, results in diffuse and less intense textures. While a weak <001> component is still visible in X, the Z texture becomes broader and less defined, centered closer to <101>, consistent with diminished directional solidification.
In the YZ-plane (side face), Experimental Dataset 1 reveals a strong <101> orientation in X and a sharp <111> texture in Z, confirming highly directional solidification. Experimental Dataset 2 follows a similar trend, but with broader and less intense distributions, indicating increased variability in local solidification conditions.
Simulation 9 reproduces these trends well, capturing <101> alignment in X and a strong <111> fiber in Z. Simulation 6, again, exhibits broader and weaker textures. A modest <001> component appears in X, while the Z orientation is more spread out between <101> and <111>, reflecting reduced grain selection due to lower thermal gradients.
In the XY-plane (top surface), both experimental datasets exhibit a dominant <111> texture along the X direction, accompanied by secondary intensity near <001>. shows a pronounced <101> component, whereas Experimental 2 shifts toward a more prominent <001> orientation. These differences likely reflect local variations in thermal gradients and melt pool dynamics, which could be due to effects of the scan strategy, hatch spacing, or subtle differences in melt pool overlap across the analyzed regions.
Simulation 9 predicts a primary <101> orientation in the X direction, accompanied by secondary intensity near <001> and a broad spread between <001> and <111>. In the Z direction, it captures a dual-peak texture, with a dominant <111> component and a weaker <001> contribution. In contrast, Simulation 6 exhibits overall weaker and more diffuse textures. A <111> peak is present in the X direction, along with a secondary maximum spanning between <001> and <101>. The Z direction reveals a modest ⟨001⟩ component and a broader distribution between <101> and <111>.
Overall, both simulations qualitatively replicate the main trends observed experimentally across all planes, particularly the influence of laser absorption rate on texture sharpness and directional alignment. Simulation 9 shows better agreement with the experimental data, especially in reproducing the <111> texture in the Z direction and capturing <101> alignment in the X direction under competitive grain growth conditions. Simulation 6, while reflecting general orientation tendencies, exhibits weaker and more diffuse textures due to reduced thermal gradients and less directional solidification. These findings highlight the sensitivity of crystallographic texture to processing parameters and underscore the importance of accurate thermal field modeling and orientation selection mechanisms in predictive microstructure simulations.
4.2. Normalized Texture Index
We used the Normalized Texture Index to quantitatively evaluate the similarity between the grain textures obtained from simulations and those obtained from experiments. The Normalized Texture Index (NTI) is defined as
Here, represents the orientation distribution function (ODF) of the grain textures obtained from experimental data, and f corresponds to those obtained from simulation results. A smaller value of the Normalized Texture Index (NTI) indicates closer alignment between the simulated grain texture and the experimentally measured one. To evaluate overall texture agreement, the NTI is averaged across the three principal planes—, , and —for each combination of absorption rate and nucleation density .
The parameter specifies the plane of analysis. The parameter ranges are defined as for the absorption rate and (in units of ) for the nucleation density. The term is the Normalized Texture Index (NTI) as defined above and is calculated by comparing the simulated orientation distribution function (ODF) for the specified parameters with the corresponding experimental ODF on the same plane s. The resulting scores are presented in Table 4.
Table 4.
Macro average of Normalized Texture Index (NTI) and Earth Mover’s Distance (EMD) of the chord length distribution (CLD) for each combination of absorption rate and nucleation density . Lower values of NTI or EMD indicate closer alignment between the simulated and experimental grain texture or morphology, respectively. To mitigate the effect of skewness in the CLD during EMD computation, the fourth root of the chord length is used, and the resulting distribution is denoted as . We use to denote the Earth Mover’s Distance between the corresponding distributions. Highlighted values indicate the best match in each column. The simulation with , yields the closest texture to both Exp 1 and Exp 2. Morphologically, the simulation with , is closest to Exp 1, while , shows the closest match to Exp 2. An overview of the parameter combinations is provided in Table 5.
The NTI values show that Simulation 6 most closely matches the experimental orientation distribution functions overall. However, Simulation 9 more accurately captures the dominant texture features observed in the IPFs, such as the <111> orientation in the Z direction and the <101> orientation in the X direction. These distinctions highlight the value of combining NTI-based analysis with visual texture evaluation to improve understanding of model accuracy.
4.3. Quantitative Grain Morphology Analysis: Comparison Between Experiments and Simulations
Figure 5 shows the grain size distributions for three orthogonal orientations—YZ, XZ, and XY planes—comparing experimental results (top row) with simulated data (bottom row). In each subplot, Experimental 1 is shown in grey, and Experimental 2 in red; in the simulations, Simulation 9 is grey, and Simulation 6 is red. The histograms display the probability density of grain sizes within the range of 0 to 100 .
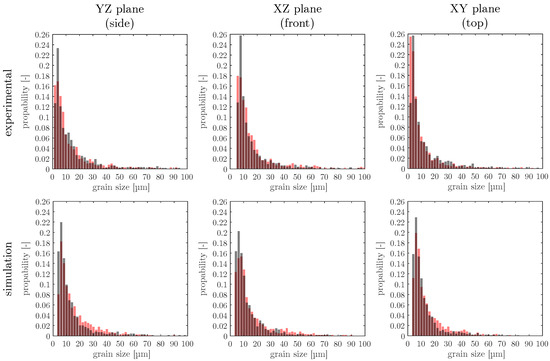
Figure 5.
Grain size distribution for the different orientations (XZ, YZ, and XY plane). Comparison between experimental data and simulated data for the two different datasets (grey: Experimental 1 and simulation 9; red: Experimental 2 and simulation 6).
All distributions are right-skewed, indicating a predominance of fine grains and a decreasing frequency of larger grains. In the experimental data, a higher fraction of very fine grains (<10 ) is observed across all planes, particularly in the XY-plane (top surface), which may reflect rapid cooling and nucleation at the melt pool boundary. Experimental 2 consistently shows a broader distribution and more frequent occurrence of larger grains compared to Experimental 1, suggesting more pronounced grain growth, potentially due to localized heat accumulation or reduced thermal gradients.
In the simulated datasets, Simulation 9 (higher absorption rate) produces grain size distributions that more closely match the experimental curves, particularly in the XZ and YZ planes. Simulation 6, with a lower absorption rate, exhibits slightly broader and more right-shifted distributions, reflecting weaker thermal gradients and reduced directional solidification. Across all planes, the simulations slightly underpredict the fraction of the smallest grains (<10 ), which may be attributed to limitations in the nucleation model or mesh resolution effects.
Overall, the simulations reproduce the general statistical characteristics of grain size evolution in L-PBF, capturing the dominant trend of fine-grained structures with trailing populations of larger grains.
Figure 6 presents the grain aspect ratio distributions as observed from three orthogonal orientations—YZ, XZ, and XY planes—comparing experimental datasets (top row) with simulation results (bottom row). Aspect ratio serves as an indicator of grain elongation and morphological anisotropy, where values closer to 1 represent more equiaxed grains and higher values indicate increasingly elongated structures.
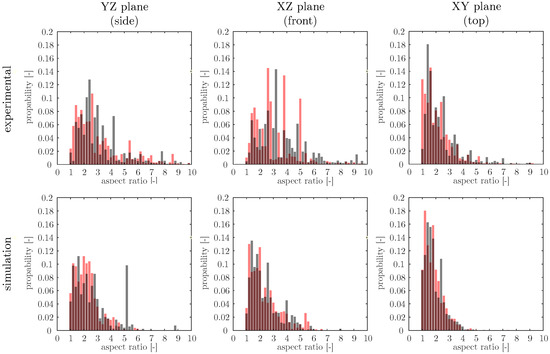
Figure 6.
Aspect ratio distribution for the different orientations (XZ, YZ, and XY planes). Comparison between experimental data and simulated data for the two different datasets (grey: experimental Dataset 1 and simulation 9; red: experimental Dataset 2 and simulation 6).
In the experimental datasets, aspect ratios exhibit broad distributions, particularly in the YZ and XZ planes, where values extend up to 9–10. This indicates a high degree of grain elongation along the build direction and suggests significant morphological variability within the fabricated parts. The XY plane, representing the top surface, shows narrower distributions and a higher frequency of low aspect ratios, which is consistent with the expected transition to more equiaxed grains near the top of the melt pool due to reduced thermal gradients.
The simulated aspect ratio distributions are more compact than those observed experimentally, with most grains exhibiting values below 4 across all planes. Peak frequencies in both experimental and simulated datasets occur within the 1.5–2.5 range, indicating that the model accurately captures the dominant grain shape characteristics. However, the simulations slightly underrepresent grains with higher aspect ratios (>5), particularly in the YZ and XZ planes, where more elongated grains are experimentally observed. This modest discrepancy likely arises from simplifications in the simulation framework, such as the treatment of thermal gradients, melt pool dynamics, or curvature-driven growth mechanisms.
A comparison between simulation cases reveals that Simulation 9, with a higher laser absorption rate ( = 0.40), produces a slightly broader aspect ratio distribution than Simulation 6 ( = 0.35), suggesting enhanced directional grain growth under higher energy input. Despite the slight underestimation of extreme elongation, the simulations reproduce the overall trends well, supporting the model’s capacity to reflect key morphological features observed in L-PBF-fabricated materials. These results highlight the effectiveness of the current modeling approach while also pointing to opportunities for further refinement to better capture grain growth anisotropy.
Table 5 provides a statistical summary of grain size and aspect ratio distributions for both simulated and experimental datasets across the three orthogonal planes (XY, XZ, and YZ). The simulated results are reported for various laser absorption rates ( = 0.30–0.45) and nucleation densities ( = 300– ), while the experimental data correspond to Experimental 1 and 2.
Table 5.
Statistics about grain morphology of XY, XZ, and YZ planes at center of the simulation domain under absorption rate and nucleation density at = . The highlighted row represents the simulation setups in which we conducted in-depth texture analysis.
In the simulations, the minimum grain size consistently remains around 6 , reflecting the mesh resolution limit and post-processing threshold. The mean grain size () exhibits clear dependence on both absorption rate and nucleation density . For example, in the XY plane at = 0.35, increasing from 300 to leads to a reduction in from to , consistent with expectations that higher nucleation promotes finer grains.
However, the influence of absorption rate on grain size is not strictly monotonic. These nonlinear variations suggest a complex interplay between thermal gradients, melt pool dynamics, and grain competition during solidification. Nevertheless, higher absorption rates tend to be associated with coarser grains, particularly in the XZ and YZ planes, where melt pool depth and thermal exposure are more influential. The largest mean grain size among the simulated data occurs at = 0.45 and = in the YZ plane ( = ), while finer microstructures are observed at lower energy inputs and higher nucleation densities.
In terms of aspect ratio, the simulated values range from 0.46 to 0.57, with standard deviations between 0.16 and 0.19, indicating more equiaxed grain shapes under the definition used here (aspect ratio = width/length). In contrast, the experimental aspect ratios are lower, between 0.36 and 0.44, suggesting more elongated, columnar grains, particularly along the build direction. These findings are consistent with the 3D EBSD reconstructions, which show vertically extended grains in the experimental datasets, especially in Experimental 2. The discrepancy may stem from differences in local melt pool conditions, remelting, or epitaxial growth behavior in the physical process that are not fully represented in the current CA simulation framework. Additionally, the simulation may underestimate grain elongation due to simplified assumptions about thermal gradients and grain boundary mobility.
Overall, the statistical analysis confirms that both nucleation density and absorption rate are key parameters in controlling grain size and morphology. The simulation results align well with experimental trends in terms of size distributions and anisotropy, supporting the model’s validity for predicting grain-level features in L-PBF-processed components.
4.4. Earth Mover’s Distance of Chord Length Distribution
The morphological similarities between the grain simulation results and the experimental observations are quantified using the Earth Mover’s Distance (EMD) of the Chord Length Distribution (CLD).
Quantifying morphology based on microstructure metrics such as the equivalent diameter or aspect ratio overlooks important mesostructure details [46]. The chord length, defined as the length of line segments extending throughout the grain from one grain boundary to the next, has the ability to address this limitation, as does its distribution in a sample. Following [46], we compute the angularly resolved CLDs by rotating the sample by an angle before calculating the CLDs using n scan lines along a fixed global x-axis. In this work, and are used.
We quantitatively compare the CLDs of the simulation results with the experimental observations by employing the EMD. EMD can be mathematically formulated as
where P and Q are two probability distributions whose similarity is being investigated. is the set of all joint probability distributions with marginal distributions of P and Q. The distance metric is denoted by . In this work, the Euclidean distance is used.
To compute an overall similarity using EMD for each set of simulation results or experimental data, a CLD is calculated based on statistics of chord length from all and sides. To reduce the sensitivity of EMD calculations to the significant skewness of the chord length distributions (CLDs), we compute EMDs using the fourth root of the chord length, a monotonic increasing transformation. This approach reduces the need for a high-resolution binning grid when comparing CLDs. The resulting EMD scores are presented in Table 4.
The lowest EMD values in Table 4 indicate that the simulation with , most closely matches the chord length distribution of Experimental Dataset 1, while , best aligns with Experimental 2.
5. Discussion
The analysis of crystallographic texture across the three principal planes reveals that the cellular automata (CA) model is capable of qualitatively reproducing key directional trends observed in the experimental data. In particular, Simulation 9 captures dominant features such as the <111> peak in the build direction (Z) and <101> alignment in the scan direction (X), especially in the second experimental dataset. These textures reflect directional solidification driven by thermal gradients and are characteristic of grain growth along preferential crystallographic directions under strong anisotropic conditions in L-PBF. Conversely, Simulation 6 yields more diffuse textures, with broader orientation distributions and reduced intensity, indicating a less pronounced directional growth regime. These observations suggest that the choice of process parameters—especially laser absorption and nucleation density—directly influences the development and sharpness of texture, which is critical for mechanical performance in load-bearing components.
To complement visual inspection of inverse pole figures (IPFs), the normalized texture index (NTI) was employed to quantify the similarity between simulated and experimental orientation distribution functions (ODFs). Interestingly, while Simulation 6 produced the lowest NTI scores (0.437 for Experiment 1 and 0.545 for Experiment 2), visual analysis shows that Simulation 9 more accurately reflects the dominant texture components. This apparent contradiction can be attributed to the NTI’s sensitivity to the full texture distribution, including low-intensity regions that may not be perceptible in IPFs. Simulation 6 matches the broader ODF, while Simulation 9 better reproduces the sharp directional textures that dominate material behavior. These findings underline the importance of using both quantitative metrics and visual interpretation to assess texture fidelity comprehensively.
Analysis of grain size and aspect ratio distributions further supports the texture-based conclusions. Simulated grain sizes fall within the experimental range. Aspect ratio distributions in all cases show good agreement around the dominant range of 1.5–2.5. However, the simulations slightly underrepresent the long tail of highly elongated grains (aspect ratios > 5), particularly in cross-sections perpendicular to the build direction. This modest discrepancy likely arises from the simplified thermal gradient representation in the CA model, which does not fully capture the spatial and temporal variability of heat flow and its influence on grain anisotropy.
To evaluate microstructural similarity from a morphological perspective, the Earth Mover’s Distance (EMD) was used to compare chord length distributions (CLDs). The simulation with = 0.45 and nucleation density of = 1200 yielded the lowest EMD relative to Experiment 1, suggesting a good match for fine-grained, densely packed morphologies. For Experiment 2, the lowest EMD was obtained using the same absorption rate but a lower nucleation density ( = 300), consistent with coarser, less uniform grain structures. These results reinforce the known relationships between nucleation density, grain growth, and morphology: higher nucleation densities promote finer structures through increased grain competition, while lower nucleation densities allow for grain coarsening and elongation. EMD thus complements grain size analysis by quantifying morphological similarity in a spatially resolved manner.
Despite the strong overall performance of the CA model, several limitations and opportunities for improvement remain. The current framework does not account for vaporization-induced recoil pressure, and simulation of Marangoni effects is turned off to save computation cost, both of which significantly influence melt pool shape, flow dynamics, and solidification behavior in L-PBF. These fluid flow effects, along with keyhole formation, pore evolution, and gas entrapment, can alter local grain orientation and morphology, especially near melt pool boundaries—features not captured in the present model. Similarly, the model lacks treatment of post-process phenomena, such as grain growth, recrystallization, and coarsening during heat treatment, which can significantly modify texture and morphology in service-ready components.
Furthermore, while the current CA approach assumes simplified thermal gradients and uniform material properties, incorporating anisotropic growth kinetics, orientation-dependent solidification velocities, and curvature-driven grain boundary motion could greatly enhance predictive accuracy. Multiscale coupling with phase-field models or CFD-based thermal simulations could enable more realistic grain evolution pathways, especially in geometrically complex or functionally graded builds.
In summary, the results demonstrate that the cellular automata (CA) model, when calibrated with appropriate process parameters, is capable of capturing the dominant features of L-PBF microstructure—both in texture and morphology. By combining statistical measures such as the normalized texture index (NTI) and Earth Mover’s Distance (EMD) with visual and directional analyses, a holistic evaluation of simulation fidelity is achieved. These findings underscore the potential of simulation-guided design for critical thin-walled applications, such as aortic stents, where precise control over grain morphology and texture is essential for ensuring mechanical reliability. Ongoing enhancements that integrate thermal-fluid dynamics, anisotropic grain growth behavior, and post-processing effects will further expand the model’s utility for predictive design and optimization in metal additive manufacturing.
6. Conclusions
This study presents a detailed evaluation of grain morphology and texture in L-PBF-processed 316L stainless steel using a cellular automata (CA) simulation framework, validated against experimental EBSD data across three orthogonal planes. By systematically varying laser absorption rate and nucleation density, the model was able to reproduce a wide range of experimentally observed microstructural features.
Key findings include:
- Simulation 9 () best reproduced the dominant <111> and <101> texture components seen in the experiments, particularly in the Z and X directions. Although Simulation 6 () yielded lower normalized texture index (NTI) scores, visual inspection of inverse pole figures (IPFs) confirmed that Simulation 9 more accurately captured the primary texture features critical for mechanical performance.
- Grain size and aspect ratio distributions from simulations showed good agreement with experiments. A high nucleation density combined with a high absorption rate yielded the closest match to the slightly finer-grained microstructure observed in Experimental 1, whereas Experimental 2 was better matched by simulations with a lower nucleation density at the same absorption rate.
- Earth Mover’s Distance (EMD) analysis of chord length distributions confirmed the morphological similarity between simulations and experiments.
- The CA model demonstrates strong capability in predicting both texture and morphology when calibrated with experimentally relevant parameters. However, limitations remain, particularly regarding the modeling of anisotropic grain growth, melt pool dynamics, and post-process effects such as heat treatment.
Future work should focus on enhancing the physical fidelity of the model by incorporating melt pool fluid flow, Marangoni effects, and orientation-dependent growth kinetics. Coupling with thermal-fluid simulations or extending the CA framework to include recrystallization behavior could further improve predictive accuracy and applicability to complex L-PBF geometries, including thin-walled biomedical components such as aortic stents.
Author Contributions
Conceptualization, Y.Q. and A.N.; methodology, Y.Q., M.G. and A.N.; software, Y.Q.; validation, Y.Q. and M.G.; formal analysis, Y.Q. and M.G.; investigation, Y.Q. and M.G.; resources, A.N.; data curation, Y.Q.; writing—original draft preparation, Y.Q.; writing—review and editing, M.G. and A.N.; visualization, Y.Q. and M.G.; supervision, A.N.; project administration, A.N.; funding acquisition, A.N. All authors have read and agreed to the published version of the manuscript.
Funding
This research was funded by the Bavarian State Ministry of Science and the Arts under the project grant “PRESTIGE” as part of the 6th funding round (2021–2024) for applied research and development at universities of applied sciences.
Data Availability Statement
Data are contained within the article.
Acknowledgments
We gratefully acknowledge Haneen Daoud and Agata Kulig, from Neue Materialien Bayreuth GmbH for conducting the EBSD analysis, as well as Philipp Lulla, from the FIT Additive Manufacturing Group for providing the material used in this study. We also thank them, along with Philipp Marx, from OTH Regensburg, for their valuable discussions and support throughout the project. Thanks to the library of the University of Applied Sciences Regensburg for taking the publication fee.
Conflicts of Interest
The authors declare no conflicts of interest.
Abbreviations
The following abbreviations are used in this manuscript:
| L-PBF | Laser powder bed fusion |
| AM | Additive manufacturing |
| PSP | Process-structure-property |
| CA | Cellular automata |
| PFM | Phase field models |
| KMC | Kinetic monte carlo |
| HAZ | Heat-affected zone |
References
- Ahmed, N.; Barsoum, I.; Haidemenopoulos, G.; Al-Rub, R.K. Process parameter selection and optimization of laser powder bed fusion for 316L stainless steel: A review. J. Manuf. Process. 2022, 75, 415–434. [Google Scholar] [CrossRef]
- Gandin, C.A.; Desbiolles, J.L.; Rappaz, M.; Thévoz, P. A three-dimensional cellular automaton-finite element model for the prediction of solidification grain structures. Metall. Mater. Trans. A Phys. Metall. Mater. Sci. 1999, 30, 3153–3165. [Google Scholar] [CrossRef]
- Rappaz, M.; Gandin, C.A. Probabilistic modelling of microstructure formation in solidification processes. Acta Metall. Mater. 1993, 41, 345–360. [Google Scholar] [CrossRef]
- Teferra, K.; Rowenhorst, D.J. Optimizing the cellular automata finite element model for additive manufacturing to simulate large microstructures. Acta Mater. 2021, 213, 116930. [Google Scholar] [CrossRef]
- Baumard, A.; Ayrault, D.; Fandeur, O.; Bordreuil, C.; Deschaux-Beaume, F. Numerical prediction of grain structure formation during laser powder bed fusion of 316 L stainless steel. Mater. Des. 2021, 199, 109434. [Google Scholar] [CrossRef]
- Panwisawas, C.; Qiu, C.; Anderson, M.J.; Sovani, Y.; Turner, R.P.; Attallah, M.M.; Brooks, J.W.; Basoalto, H.C. Mesoscale modelling of selective laser melting: Thermal fluid dynamics and microstructural evolution. Comput. Mater. Sci. 2017, 126, 479–490. [Google Scholar] [CrossRef]
- Baere, D.D.; Mohanty, S.; Hattel, J.H. Microstructural modelling of above β-transus heat treatment of additively manufactured Ti-6Al-4V using cellular automata. Mater. Today Commun. 2020, 24, 101031. [Google Scholar] [CrossRef]
- Zinovieva, O.; Zinoviev, A.; Ploshikhin, V. Three-dimensional modeling of the microstructure evolution during metal additive manufacturing. Comput. Mater. Sci. 2018, 141, 207–220. [Google Scholar] [CrossRef]
- Herriott, C.; Li, X.; Kouraytem, N.; Tari, V.; Tan, W.; Anglin, B.; Rollett, A.D.; Spear, A.D. A multi-scale, multi-physics modeling framework to predict spatial variation of properties in additive-manufactured metals. Model. Simul. Mater. Sci. Eng. 2019, 27, 025009. [Google Scholar] [CrossRef]
- Lian, Y.; Lin, S.; Yan, W.; Liu, W.K.; Wagner, G.J. A parallelized three-dimensional cellular automaton model for grain growth during additive manufacturing. Comput. Mech. 2018, 61, 543–558. [Google Scholar] [CrossRef]
- Lian, Y.; Gan, Z.; Yu, C.; Kats, D.; Kam, W.; Wagner, G.J. A cellular automaton finite volume method for microstructure evolution during additive manufacturing. Mater. Des. 2019, 169, 107672. [Google Scholar] [CrossRef]
- Li, X.; Tan, W. Numerical investigation of effects of nucleation mechanisms on grain structure in metal additive manufacturing. Comput. Mater. Sci. 2018, 153, 159–169. [Google Scholar] [CrossRef]
- Rai, A.; Markl, M.; Körner, C. A coupled Cellular Automaton–Lattice Boltzmann model for grain structure simulation during additive manufacturing. Comput. Mater. Sci. 2016, 124, 37–48. [Google Scholar] [CrossRef]
- Rodgers, T.M.; Madison, J.D.; Tikare, V. Simulation of metal additive manufacturing microstructures using kinetic Monte Carlo. Comput. Mater. Sci. 2017, 135, 78–89. [Google Scholar] [CrossRef]
- Eiken, J.; Böttger, B.; Steinbach, I. Multiphase-field approach for multicomponent alloys with extrapolation scheme for numerical application. Phys. Rev. E Stat. Nonlinear Soft Matter Phys. 2006, 73, 066122. [Google Scholar] [CrossRef]
- Lu, L.X.; Sridhar, N.; Zhang, Y.W. Phase field simulation of powder bed-based additive manufacturing. Acta Mater. 2018, 144, 801–809. [Google Scholar] [CrossRef]
- Keller, T.; Lindwall, G.; Ghosh, S.; Ma, L.; Lane, B.M.; Zhang, F. Methods to Additive Manufacturing of Ni-based Superalloys. Acta Mater. 2017, 139, 244–253. [Google Scholar] [CrossRef] [PubMed]
- Gong, X.; Chou, K. Phase-field modeling of microstructure evolution in electron beam additive manufacturing. Jom 2015, 67, 1176–1182. [Google Scholar] [CrossRef]
- Tourret, D.; Liu, H.; LLorca, J. Phase-field modeling of microstructure evolution: Recent applications, perspectives and challenges. Prog. Mater. Sci. 2022, 123, 100810. [Google Scholar] [CrossRef]
- Kergaßner, A.; Koepf, J.A.; Markl, M.; Körner, C.; Mergheim, J.; Steinmann, P. A Novel Approach to Predict the Process-Induced Mechanical Behavior of Additively Manufactured Materials. J. Mater. Eng. Perform. 2021, 30, 5235–5246. [Google Scholar] [CrossRef]
- Xu, F.; Xiong, F.; Li, M.J.; Lian, Y. Three-Dimensional Numerical Simulation of Grain Growth during Selective Laser Melting of 316L Stainless Steel. Materials 2022, 15, 6800. [Google Scholar] [CrossRef]
- Pinomaa, T.; Lindroos, M.; Walbrühl, M.; Provatas, N.; Laukkanen, A. The significance of spatial length scales and solute segregation in strengthening rapid solidification microstructures of 316L stainless steel. Acta Mater. 2020, 184, 1–16. [Google Scholar] [CrossRef]
- Karayagiz, K.; Johnson, L.; Seede, R.; Attari, V.; Zhang, B.; Huang, X.; Ghosh, S.; Duong, T.; Karaman, I.; Elwany, A.; et al. Finite interface dissipation phase field modeling of Ni–Nb under additive manufacturing conditions. Acta Mater. 2020, 185, 320–339. [Google Scholar] [CrossRef]
- Chadwick, A.F.; Voorhees, P.W. The development of grain structure during additive manufacturing. Acta Mater. 2021, 211, 116862. [Google Scholar] [CrossRef]
- Yang, M.; Wang, L.; Yan, W. Phase-field modeling of grain evolutions in additive manufacturing from nucleation, growth, to coarsening. npj Comput. Mater. 2021, 7, 56. [Google Scholar] [CrossRef]
- Xue, T.; Gan, Z.; Liao, S.; Cao, J. Physics-embedded graph network for accelerating phase-field simulation of microstructure evolution in additive manufacturing. npj Comput. Mater. 2022, 8, 201. [Google Scholar] [CrossRef]
- Liu, P.; Ji, Y.; Wang, Z.; Qiu, C.; Antonysamy, A.; Chen, L.Q.; Cui, X.; Chen, L. Investigation on evolution mechanisms of site-specific grain structures during metal additive manufacturing. J. Mater. Process. Technol. 2018, 257, 191–202. [Google Scholar] [CrossRef]
- Chen, G.; Wang, X.; Yang, X.; Yang, X.; Zhang, Z.; Dai, R.; Gu, J.; Zhang, T.; Wu, G.; Gong, J. An integrated simulation approach for directing the texture control of austenitic stainless steel through laser beam powder bed fusion. J. Mater. Process. Technol. 2025, 336, 118707. [Google Scholar] [CrossRef]
- Xie, Q.; Yan, X.; Yin, S.; Li, X.; Liu, M.; Wang, Y.; Zhuang, L. An extended version of cellular automata model for powder bed fusion to unravel the dependence of microstructure on printing areas for Inconel 625. Addit. Manuf. 2023, 73, 103676. [Google Scholar] [CrossRef]
- Liang, X.; Zhu, J.; Popovich, V.; Hermans, M.; Richardson, I.; Bos, C. A multi-level capture algorithm for accelerating cellular automata predictions of grain structure and texture in additive manufacturing. Addit. Manuf. 2025, 98, 104622. [Google Scholar] [CrossRef]
- Rolchigo, M.; Coleman, J.; Knapp, G.L.; Plotkowski, A. Grain structure and texture selection regimes in metal powder bed fusion. Addit. Manuf. 2024, 81, 104024. [Google Scholar] [CrossRef]
- Rolchigo, M.; Reeve, S.T.; Stump, B.C.; Knapp, G.L.; Coleman, J.; Plotkowski, A.; Belak, J.F. ExaCA: A performance portable exascale cellular automata application for alloy solidification modeling. Comput. Mater. Sci. 2022, 214, 111692. [Google Scholar] [CrossRef]
- Rolchigo, M.; Reeve, S.T.; Stump, B.C.; Coleman, J.; Plotkowski, A. ExaCA v2.0: A versatile, scalable, and performance portable cellular automata application for additive manufacturing solidification. Comput. Mater. Sci. 2025, 251, 113734. [Google Scholar] [CrossRef]
- Coleman, J.; Kincaid, K.; Knapp, G.L.; Stump, B.; Plotkowski, A.J. ORNL/AdditiveFOAM: Release 1.0. Zenodo 2023. [Google Scholar] [CrossRef]
- Gandin, C.A.; Rappaz, M. A 3D Cellular Automaton algorithm for the prediction of dendritic grain growth. Acta Mater. 1997, 45, 2187–2195. [Google Scholar] [CrossRef]
- Trivedi, R.; Kurz, W. Theory of Microstructural Development during Rapid Solidification. Acta Metall. 1986, 34, 823–830. [Google Scholar]
- Goldak, J.A.; Chakravarti, A.P.; Bibby, M. A new finite element model for welding heat sources. Metall. Trans. B 1984, 15, 299–305. [Google Scholar] [CrossRef]
- Lu, N.; Lei, Z.; Yu, X.; Bi, J.; Chen, Y. Effects of melt convection on stray grain formation in single crystal superalloys during directed energy deposition. Addit. Manuf. 2021, 48, 102429. [Google Scholar] [CrossRef]
- Cao, L. Numerical simulation of the impact of laying powder on selective laser melting single-pass formation. Int. J. Heat Mass Transf. 2019. [Google Scholar] [CrossRef]
- Coleman, J.; Plotkowski, A.; Stump, B.C.; Raghavan, N.; Sabau, A.S.; Krane, M.J.M.; Heigel, J.C.; Ricker, R.E.; Levine, L.E.; Babu, S.S. Sensitivity of Thermal Predictions to Uncertain Surface Tension Data in Laser Additive Manufacturing. J. Heat Transf.-Trans. Asme 2020, 142, 122201. [Google Scholar] [CrossRef]
- Antony, K.; Arivazhagan, N.; Senthilkumaran, K. Numerical and experimental investigations on laser melting of stainless steel 316L metal powders. J. Manuf. Process. 2014, 16, 345–355. [Google Scholar] [CrossRef]
- Zhang, Y.; Zhang, J. Modeling of solidification microstructure evolution in laser powder bed fusion fabricated 316L stainless steel using combined computational fluid dynamics and cellular automata. Addit. Manuf. 2019, 28, 750–765. [Google Scholar] [CrossRef]
- Cox, B.; Ghayoor, M.; Doyle, R.P.; Pasebani, S.; Gess, J.L. Numerical model of heat transfer during laser powder bed fusion of 316L stainless steel. Int. J. Adv. Manuf. Technol. 2022, 119, 5715–5725. [Google Scholar] [CrossRef]
- Wiesent, L.; Schultheiß, U.; Lulla, P.; Nonn, A.; Noster, U. Mechanical properties of small structures built by selective laser melting 316 L stainless steel–A phenomenological approach to improve component design. Mater. Werkst. 2020, 51, 1615–1629. [Google Scholar] [CrossRef]
- Beausir, B.; Fundenberger, J.-J. Analysis Tools for Electron and X-Ray Diffraction, ATEX-Software; Université de Lorraine: Metz, France, 2017. Available online: www.atex-software.eu (accessed on 30 May 2025).
- Latypov, M.; Kühbach, M.; Beyerlein, I.J.; Stinville, J.C.; Toth, L.S.; Pollock, T.M.; Kalidindi, S.R. Application of chord length distributions and principal component analysis for quantification and representation of diverse polycrystalline microstructures. Mater. Charact. 2018, 145, 671–685. [Google Scholar] [CrossRef]
Disclaimer/Publisher’s Note: The statements, opinions and data contained in all publications are solely those of the individual author(s) and contributor(s) and not of MDPI and/or the editor(s). MDPI and/or the editor(s) disclaim responsibility for any injury to people or property resulting from any ideas, methods, instructions or products referred to in the content. |
© 2025 by the authors. Licensee MDPI, Basel, Switzerland. This article is an open access article distributed under the terms and conditions of the Creative Commons Attribution (CC BY) license (https://creativecommons.org/licenses/by/4.0/).