Article

Selective Oxidation Depression of Copper-Activated Sphalerite by H2O2 During Chalcopyrite Flotation

1
School of Land Resource Engineering, Kunming University of Science and Technology, Kunming 650093, China
2
National Engineering and Technology Research Center for Development & Utilization of Phosphate Resources, Kunming 650600, China
3
Yunnan Hualian Zinc and Indium Co., Ltd., Wenshan 663700, China
*
Authors to whom correspondence should be addressed.
Metals 2025, 15(7), 813; https://doi.org/10.3390/met15070813
Submission received: 3 June 2025 / Revised: 8 July 2025 / Accepted: 17 July 2025 / Published: 21 July 2025
(This article belongs to the Special Issue Advances in Sustainable Utilization of Metals: Recovery and Recycling)

Abstract

Using hydrogen peroxide (H2O2), a simple and easily accessible reagent, as a selective depressant, flotation separation experiments of chalcopyrite and copper-activated sphalerite were conducted. The micro-flotation tests of single minerals indicated that H2O2 selectively depresses copper-activated sphalerite and exerted almost no depressant effect on chalcopyrite. In the flotation tests of artificially mixed minerals, a copper concentrate with a grade of 29.95% and a recovery of 87.30% was obtained, while the zinc content was only 5.76%, demonstrating a significant separation effect. The results of contact angle measurement, Zeta potential measurement, surface adsorption analysis, and XPS analysis suggested that H2O2 had a stronger oxidation capacity on the surface of copper-activated sphalerite than chalcopyrite, generating hydrophilic hydroxyl groups on the surface of sphalerite and preventing further adsorption of the collector Z-200 on the surface of sphalerite.

1. Introduction

Chalcopyrite and sphalerite commonly occur as intergrown or finely disseminated phases within massive sulfide ores and are often associated with other sulfide minerals such as pyrite and galena [1,2,3]. Flotation is the most mature technique for separating Cu–Zn mixed sulfide ores. Because chalcopyrite floats more readily than sphalerite, the usual approach is to float chalcopyrite while depressing sphalerite. In the past, inorganic depressants such as sodium sulfite, zinc sulfate, or sulfate-based mixtures were commonly used, with lime serving as the pH modifier. Under strong alkaline conditions, zinc sulfate can precipitate as hydrophilic zinc hydroxide on the surface of sphalerite, thereby depressing its flotation [4,5]. However, in an alkaline flotation system, tightly intergrown Cu–Zn sulfides form a galvanic cell: chalcopyrite preferentially releases Cu2+, which deposits onto the sphalerite surface to form a copper-activated coating [6]. This greatly enhances the adsorption of collectors (e.g., xanthates or sodium diethyldithiocarbamate) on sphalerite, causing the activated sphalerite to float alongside chalcopyrite. As a result, copper and zinc become mutually entrained in the copper concentrate, making it difficult to produce high-grade copper and zinc concentrates.
In response to the above issues, researchers have therefore turned to environmentally friendly organic depressants such as starches, polysaccharides, and synthetic polymers [7,8,9]. However, most organic depressants exhibit weak adsorption and poor selectivity toward copper-activated sphalerite. For example, when using high-molecular-weight agents like sodium polyacrylate or carboxymethyl cellulose, sphalerite is only depressed at high dosages, at which point chalcopyrite is also adversely affected [10,11]. Likewise, macromolecular organics such as chitosan derivatives have shown some depression in laboratory tests, but their high cost and inconsistent performance make large-scale industrial application impractical [12,13]. In addition, some researchers have found that different sulfide minerals exhibit varying degrees of susceptibility to oxidation. Commonly used oxidizing agents include oxygen, hydrogen peroxide, hypochlorous acid, and potassium permanganate. An appropriate level of oxidation can enhance the flotation recovery of chalcopyrite, whereas oxidation tends to reduce the floatability of minerals such as sphalerite and pyrite by forming stable, hydrophilic surface coatings of metal oxides or hydroxides [14,15,16]. However, in the context of chalcopyrite–sphalerite separation, the differences in oxidation behavior and the underlying mechanisms between these two minerals remain unclear.
In this study, it was found that under near-neutral pH conditions, the addition of low concentrations of H2O2 to the flotation pulp oxidatively depress copper-activated sphalerite selectively, while exerting negligible depressive effects on chalcopyrite. Through single-mineral micro-flotation tests, contact angle measurements, zeta potential analysis, surface adsorption analysis, solution chemistry calculations, and X-ray photoelectron spectroscopy (XPS) characterization, the mechanism by which H2O2 operates in Cu–Zn flotation separation was elucidated. These results demonstrate that H2O2 is a viable depressant that effectively addresses the long-standing issue of copper-activated sphalerite in chalcopyrite flotation [17,18,19,20]. Moreover, this approach offers a novel pathway for developing more sustainable and economical Cu–Zn separation processes in sulfide mineral processing.

2. Materials and Methods
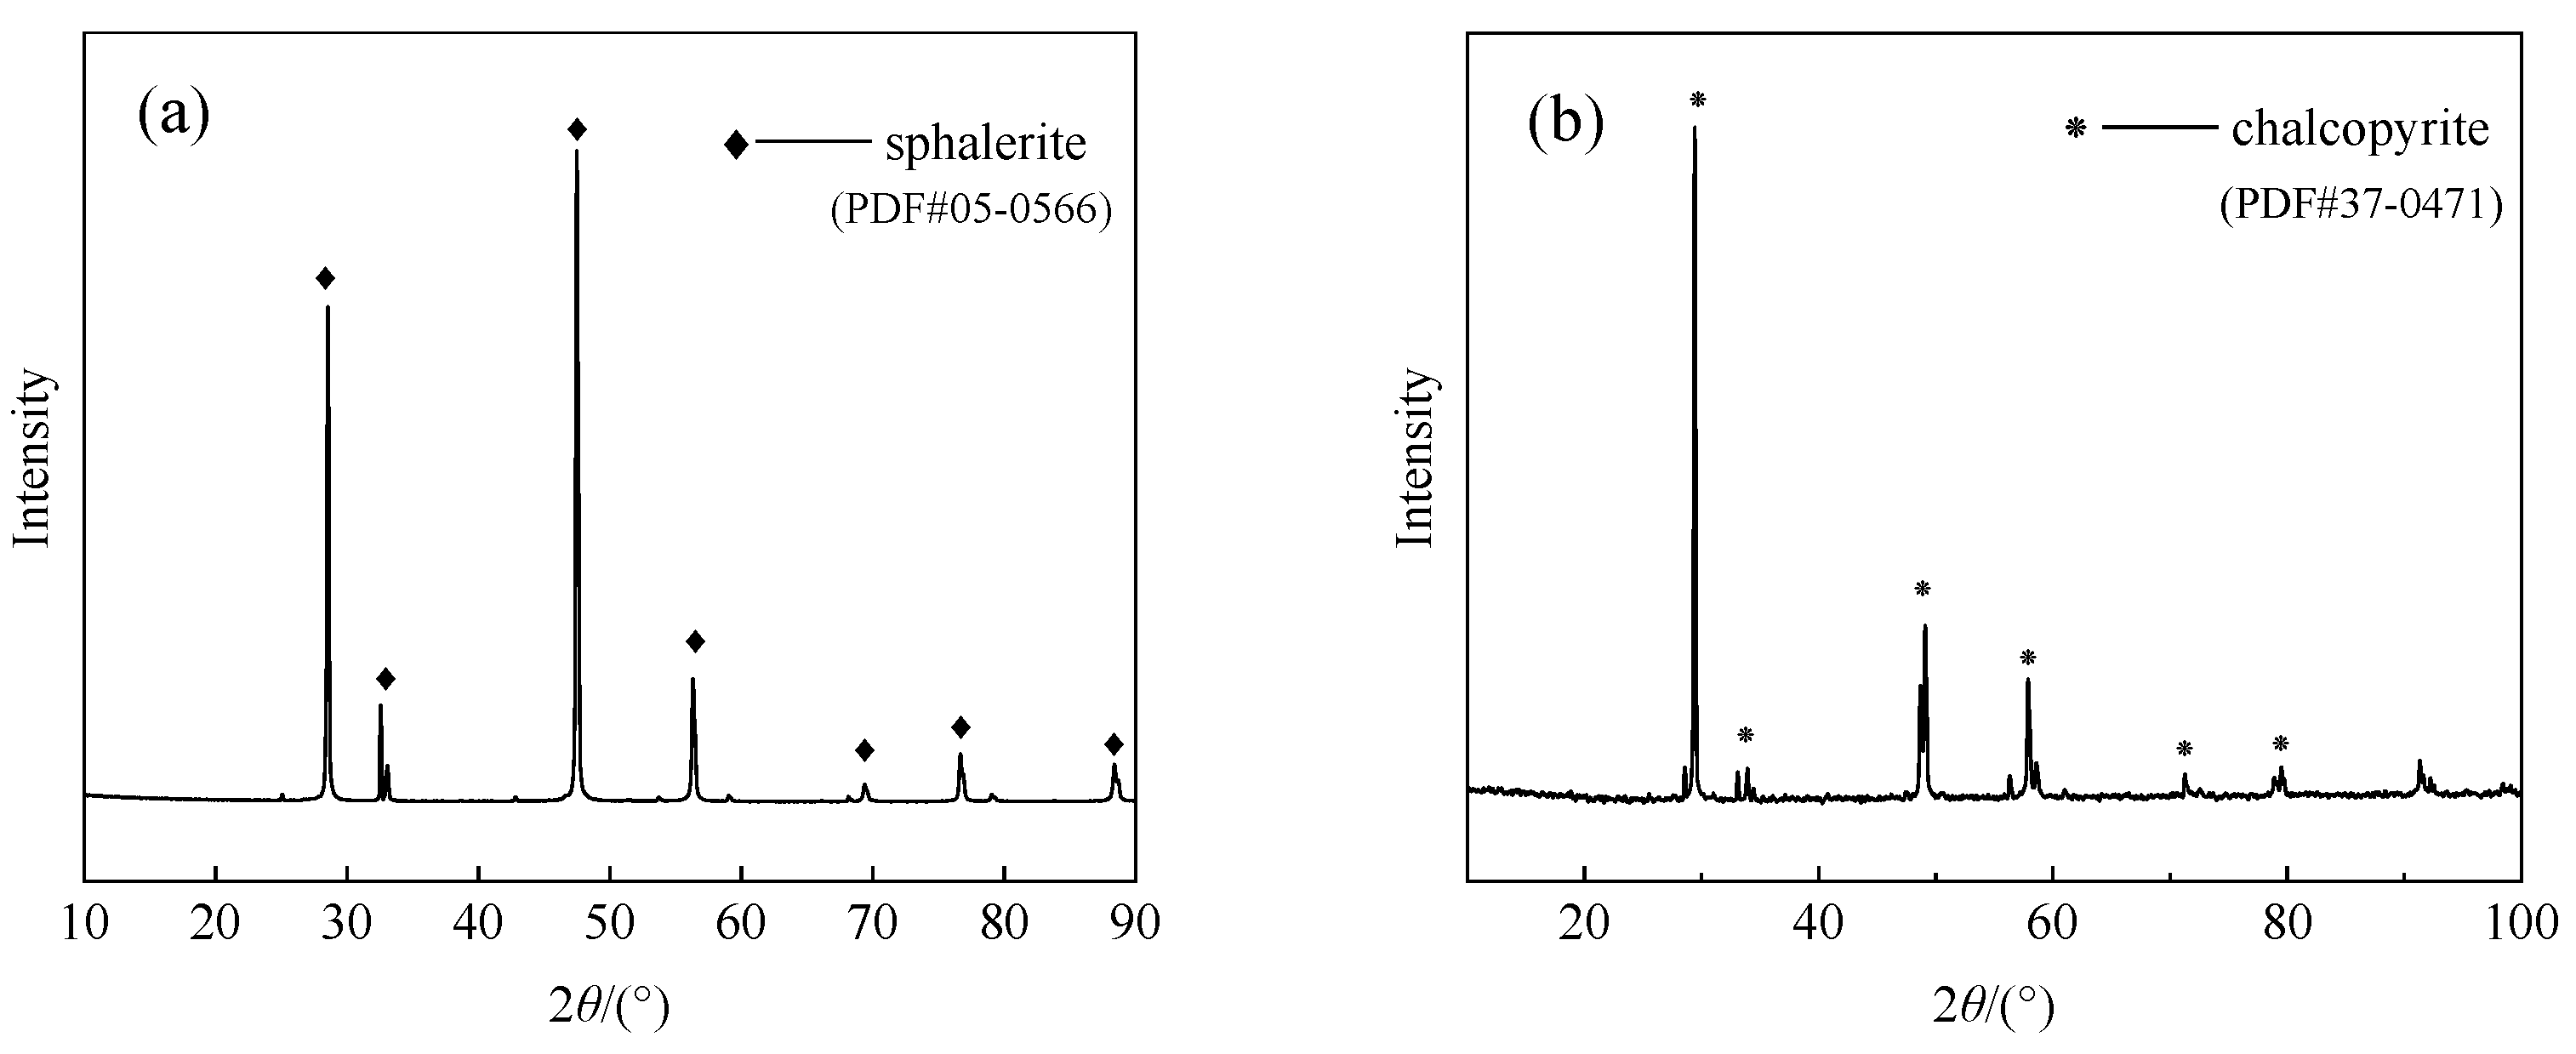
2.1. Materials

The pure mineral samples of chalcopyrite and sphalerite used in this study were obtained from Wenshan Prefecture, Yunnan Province, China. Firstly, the raw ores with good crystallization were manually selected to remove gangue and other impurities, obtaining high-purity samples. Then, the selected samples were ground finely in a ceramic ball mill and sieved dryly with a standard sieve. The mineral particles with a size of 38–74 μm were collected and stored in vacuum bags as samples for micro-flotation experiments. The samples with a size of <38 μm were further ground to <2 μm in an agate mortar for Zeta potential measurement, chemical multi-element analysis, and X-ray diffraction (XRD, Shimadzu XRD-7000S, Kyoto, Japan) analysis.
Table 1 presents the chemical analysis results of the samples. It can be seen from Table 1 that the Cu content of chalcopyrite is 34.32% and the Zn content of sphalerite is 64.01%, indicating that the purity of both chalcopyrite and sphalerite is above 95%. Figure 1 shows the XRD patterns of the analyzed mineral samples. As shown in the figure, the purity of both minerals is very high, with almost no other impurities, meeting the requirements for pure mineral experiments.
During the experiment, the collector used was sodium ethyl xanthate (Z-200), the frother was terpineol oil, the depressant was H2O2, and the activator was copper sulfate (CuSO4). The pulp pH was maintained at natural neutrality, and all experiments were conducted using deionized water. Specifically, Z-200 (≥95.0 wt.% purity) and 3.0 wt.% H2O2 in aqueous solution were both purchased from Macklin Biochemical Technology Co., Ltd. (Shanghai, China); terpineol oil (analytical grade) was obtained from Xilong Chemical Co., Ltd. (Chengdu, China); and CuSO4 (analytical grade) was supplied by Sinopharm Chemical Reagent Co., Ltd. (Shanghai, China).

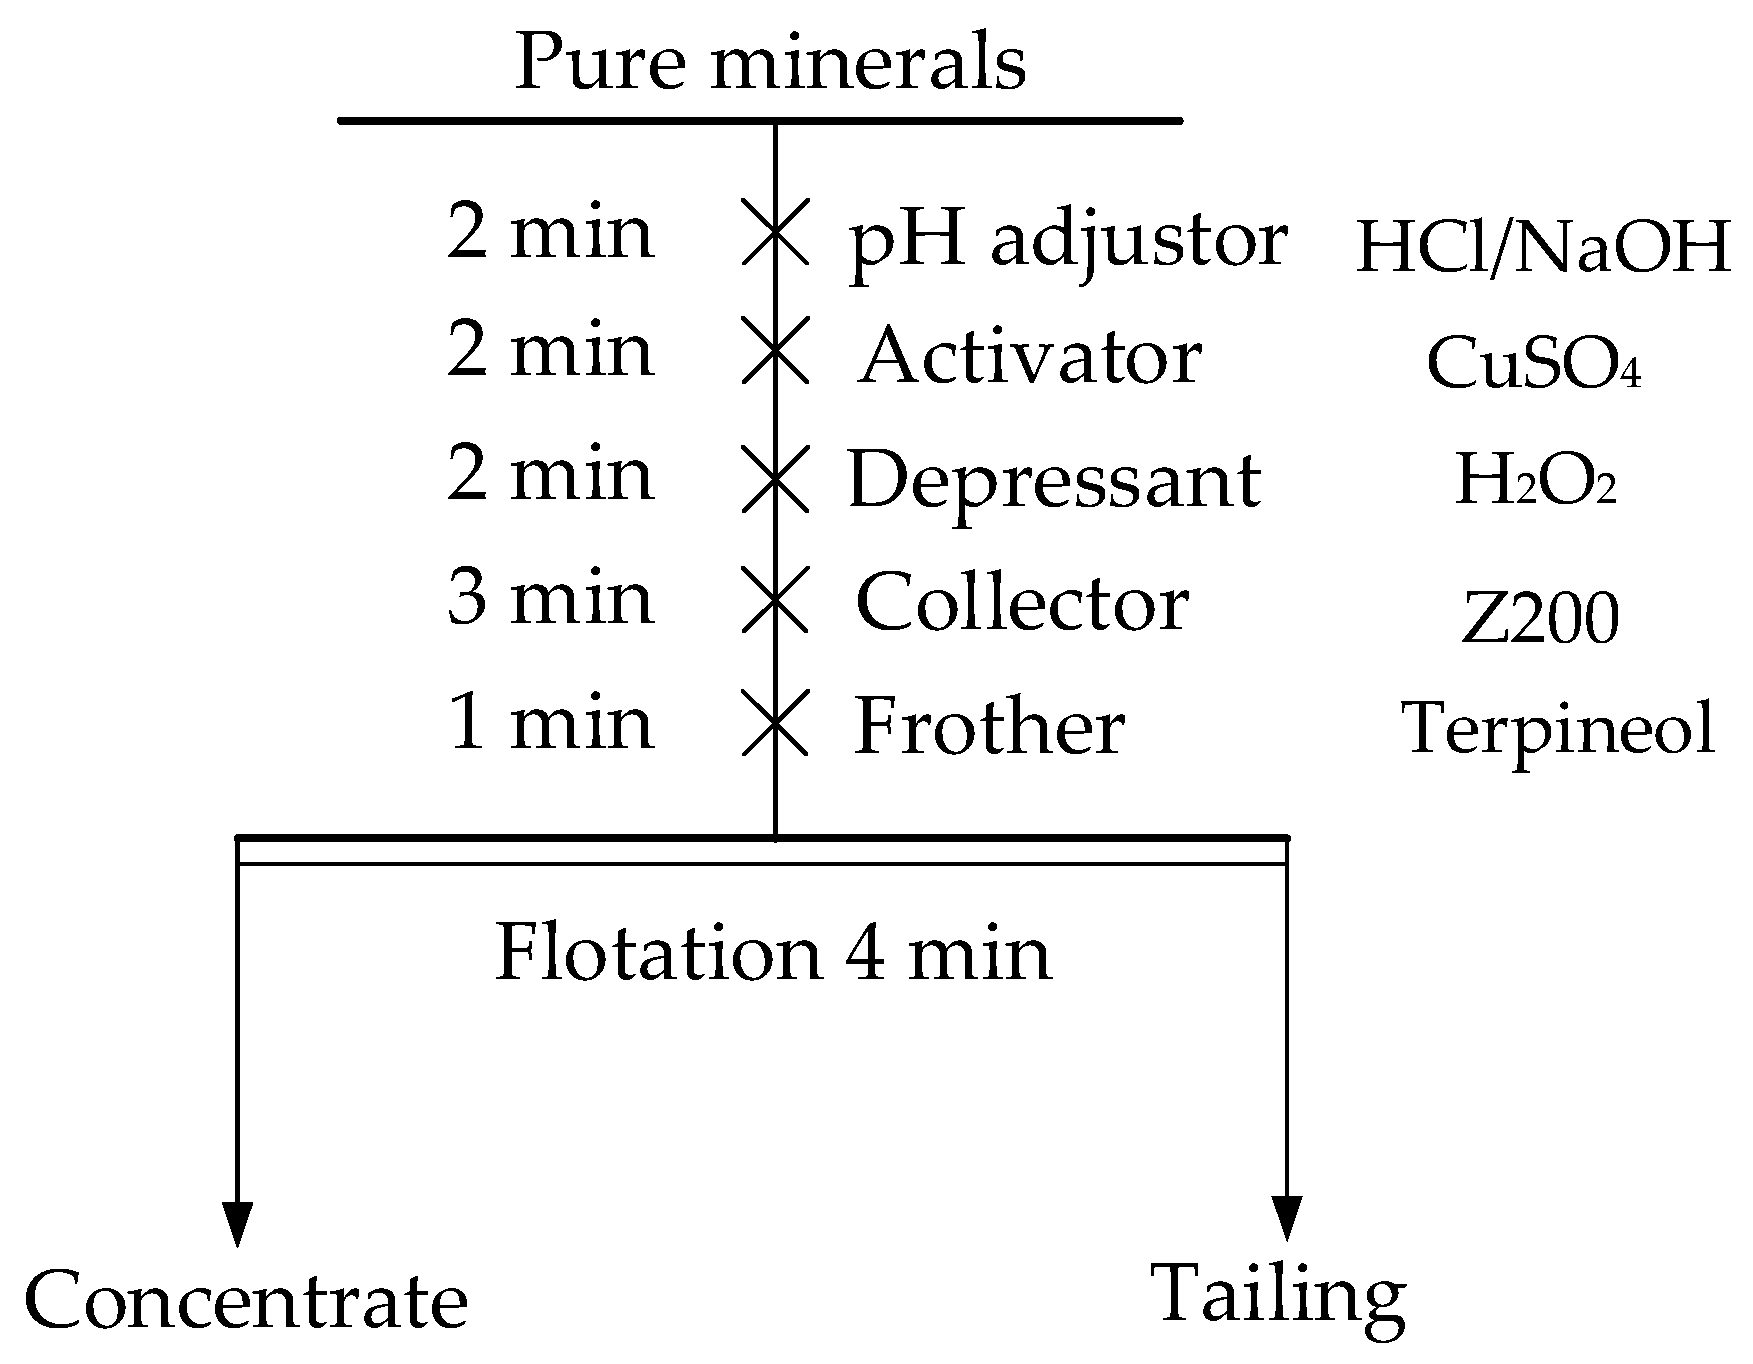
2.2. Micro-Flotation Experiments

All micro-flotation experiments were conducted using an XFG-series laboratory flotation machine (Jitan Machinery Co., Ltd., Jinan, China) with a cell volume of 60 mL and a fixed impeller speed of 1600 rpm. The micro-flotation workflow (Figure 2) began by ultrasonically pre-treating 2.0 g of sample for 2 min to remove the mineral’s surface oxide layer. After sonication, the sample was transferred into the flotation cell, 50 mL of deionized water was added, and the machine was started. Activator (CuSO4, 0.3 wt.%), oxidant/depressant (H2O2, 3.0 wt.%), collector (Z-200, ≥95.0 wt.%), and frother (terpineol oil, ≥65.0 wt.%) were subsequently introduced into the pulp, with corresponding conditioning times of 2 min, 2 min, 3 min, and 1 min, respectively. Flotation was then conducted with air inflation and froth scraping for 4 min. Finally, the concentrate (froth product) and tailings (cell product) were separately filtered, dried, and weighed; recovery was calculated using Equation (1). Grade is determined through multi-element chemical analysis. Each experiment was repeated three times.
ε = m 1 m 1 + m 2 × 100 %
where ε represents flotation recovery (%); m1 represents the mass (g) of the concentrate; m2 represents the mass (g) of tailings.
Definition of terms: Grade refers to the mass fraction of a specific valuable element or mineral in the concentrate, tailings, or raw ore. Recovery refers to the ratio of the total amount of a valuable component recovered from the raw ore during the beneficiation process to the total amount of that component originally present in the raw ore.

2.3. Contact Angle Measurements

In order to evaluate changes in surface wettability before and after reagent treatment, contact angle measurements were performed on chalcopyrite and sphalerite surfaces. The mineral specimens used were high-purity, single-mineral samples, and measurements were conducted on a JY-82C automated video contact angle goniometer (Dingsheng Tester, Dingsheng Group, Yangzhong, China) using the sessile drop method. Rectangular blocks of approximately 1.0 cm × 1.0 cm × 0.5 cm were cut and sequentially polished from coarse to fine using TOA-brand abrasive paper until the surfaces were smooth and flat. The polished samples were then rinsed with deionized water followed by absolute ethanol and dried under a stream of high-purity nitrogen gas. Reagent conditioning was performed in flotation order: each sample was placed in a beaker containing 50 mL of deionized water, after which activator (CuSO4), depressant (H2O2), and collector (Z-200) were added sequentially and stirred for 10 min to ensure a thorough interaction with the mineral surface. Following reagent treatment, each sample was removed, rinsed three times with deionized water to eliminate unadsorbed reagents, and then blown dry under high-purity nitrogen. Finally, a 3–5 μL droplet of deionized water was placed on the mineral surface, and once the droplet stabilized, the contact angle was automatically recorded via video imaging. Each experiment was repeated three times.

2.4. Zeta Potential Measurements

Zeta potential refers to the electric potential at the shear plane of the electric double layer formed around mineral particles in a liquid medium. It reflects the charge interactions between the mineral surface and the surrounding liquid, serving as an indirect indicator of the surface charge characteristics of the particles. To assess how flotation reagents affect surface charge, the Zeta potential of chalcopyrite and Cu-activated sphalerite was measured under different treatments. A Malvern Zetasizer Nano (Malvern Panalytical, Almelo, The Netherlands) was used, with 1 × 10⁻³ mol/L KCl as the background electrolyte. For each test, 0.02 g of mineral (particle size < 2 μm) was mixed into 50 mL of KCl solution and stirred for 1 min. The pH was then adjusted to the target value using 0.1 mol/L NaOH or HCl and stirred for another 2 min. Reagents were added in flotation order—CuSO4, H2O2, and Z-200—each followed by 2 min of stirring. After conditioning, the slurry was left undisturbed for 10 min to allow coarse particles to settle, and the clear supernatant was withdrawn for Zeta potential measurement. Each experiment was repeated three times.

2.5. Surface Adsorption Measurements

To compare reagent adsorption on the mineral surface under different conditions, the total organic carbon (TOC) concentration of the post-reaction solution was measured using a Vario TOC analyzer (Elementar, Langenselbold, Germany). In each test, 50 mL of deionized water and 2.0 g of the mineral sample were placed in the flotation cell, the pH was adjusted to the preset value, and then the pH modifier and collector (Z-200) were added sequentially, with the slurry stirred for 10 min to ensure complete interaction. After conditioning, the supernatant was filtered and retained for TOC analysis. The amount of collector adsorbed on each mineral surface (mg/g) was calculated according to Equation (2) by comparing initial and residual TOC concentrations.
Γ = ( C 0 C 1 ) V CM
Here, Γ is the reagent adsorption amount (mg/g);
C 0 and C 1 are the initial and post-adsorption TOC values (mg/L), respectively;
V is the solution volume (L);
C is the reagent’s carbon content percentage;
M is the mineral sample mass (g).

2.6. XPS Measurements

In each experiment, 2 g of the mineral sample was placed in a beaker and an appropriate amount of deionized water was added. The sample was then subjected to ultrasonic cleaning for 2 min to remove surface oxides. After cleaning, the sample was conditioned in the following order: activator (CuSO4), depressant (H2O2), and collector (Z-200), then filtered and dried in a vacuum oven at 35 °C. Finally, the dried sample was analyzed using a Thermo Scientific Nexsa XPS system (Thermo Fisher Scientific, Waltham, MA, USA) with Al Kα excitation (1486.6 eV). All binding energies were calibrated to the C–C reference peak at 284.8 eV to compensate for the surface-charging effects.

3. Results and Discussion

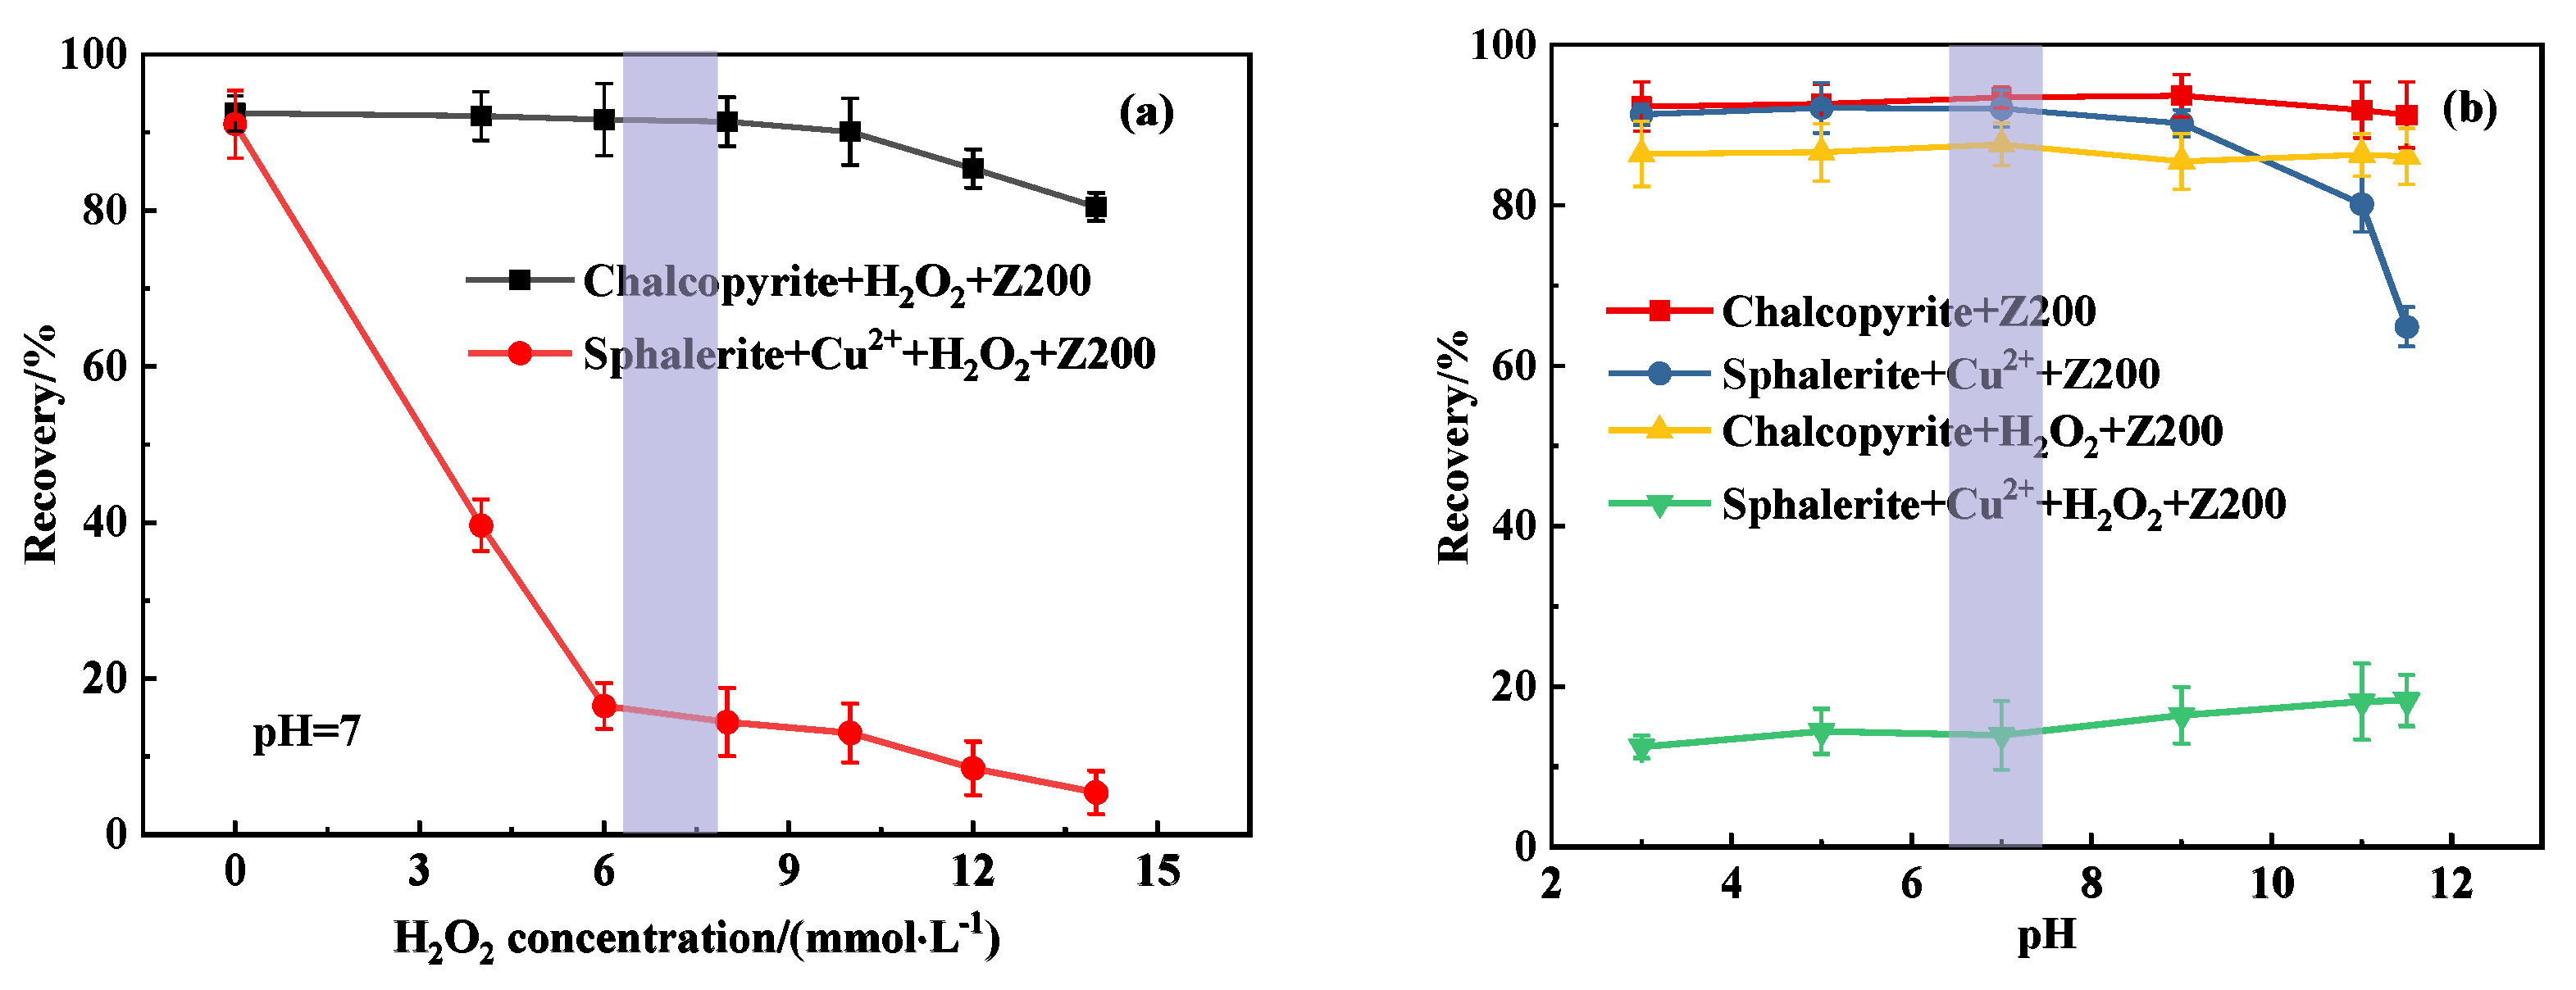
3.1. Single-Mineral Flotation Results

As shown in Figure 3a, under the flotation conditions of pH 7, 10 mg/L Z-200 as collector, 1.5 × 10⁻⁵ mol/L CuSO4 as activator for sphalerite, and 8 mg/L terpineol as frother, the flotation recovery of Cu-activated sphalerite decreases significantly with increasing H2O2 dosage, while chalcopyrite recovery remains nearly unaffected when H2O2 is below 8 mmol/L. Specifically, both minerals exhibit good floatability at low H2O2 concentrations; however, as the H2O2 dosage increases, the recovery of activated sphalerite drops sharply—from 90.06% to 14.42% at 8 mmol/L—whereas chalcopyrite recovery decreases by only 1.07%, remaining at a high level. Under these conditions, effective separation between chalcopyrite and Cu-activated sphalerite can be achieved.
Figure 3b further illustrates the recovery of individual minerals under varying pH conditions with Z-200 (10 mg/L), both alone and with the addition of H2O2 (8 mmol/L) + Z-200 (10 mg/L). Cu-activated sphalerite shows strong suppression under mildly acidic-to-neutral conditions in the presence of H2O2, resulting in low recovery. This suppression weakens at higher pH, likely due to the decreased stability of H2O2 in alkaline media, where it readily decomposes into O2 and H2O, reducing its oxidative inhibition capacity. In contrast, chalcopyrite maintains high recovery across the entire pH range, with only a modest decrease (~5%) upon H2O2 addition, indicating minimal impact.
These results suggest that H2O2 selectively suppresses Cu-activated sphalerite with minimal effect on chalcopyrite. This is likely because H2O2, as a strong oxidant, preferentially oxidizes copper and zinc sulfide species on the sphalerite surface. The resulting hydrophilic oxidation products, such as Zn(OH)2 and Cu(OH)2, form surface films that hinder collector adsorption and depress flotation [21]. In comparison, H2O2 has limited influence on chalcopyrite, possibly due to the inability to form stable hydrophilic films on its surface at low-to-moderate dosages. However, at higher H2O2 concentrations, chalcopyrite recovery also begins to decline, indicating a threshold beyond which oxidative effects become significant [22].

3.2. Flotation Results of Artificially Mixed Minerals

To verify the selective depression effect of H2O2, chalcopyrite and Cu-activated sphalerite were mixed in a 1:1 mass ratio. Under neutral conditions (pH 7) with 10 mg/L Z-200, 8 mmol/L H2O2, and 1.5 × 10⁻⁵ mol/L CuSO4, the flotation separation of the two minerals was investigated, as shown in Figure 4 and Table 2. Without H2O2, Cu2+ activation renders Z-200 equally effective on both sulfide minerals, yielding an elevated flotation product recovery of 94.99% and making separation difficult. After adding H2O2, the Cu grade in the copper concentrate increased from 16.17 wt.% to 29.95 wt.% (recovery = 87.30%), while the Zn grade dropped from 29.54 wt.% to 5.76 wt.%. Conversely, the zinc concentrate reached 54.12 wt.% Zn with a 91.02% recovery. These results demonstrate that H2O2 enables effective separation of Cu-activated sphalerite from chalcopyrite in mixed ores, showing strong practical applicability for industrial flotation.

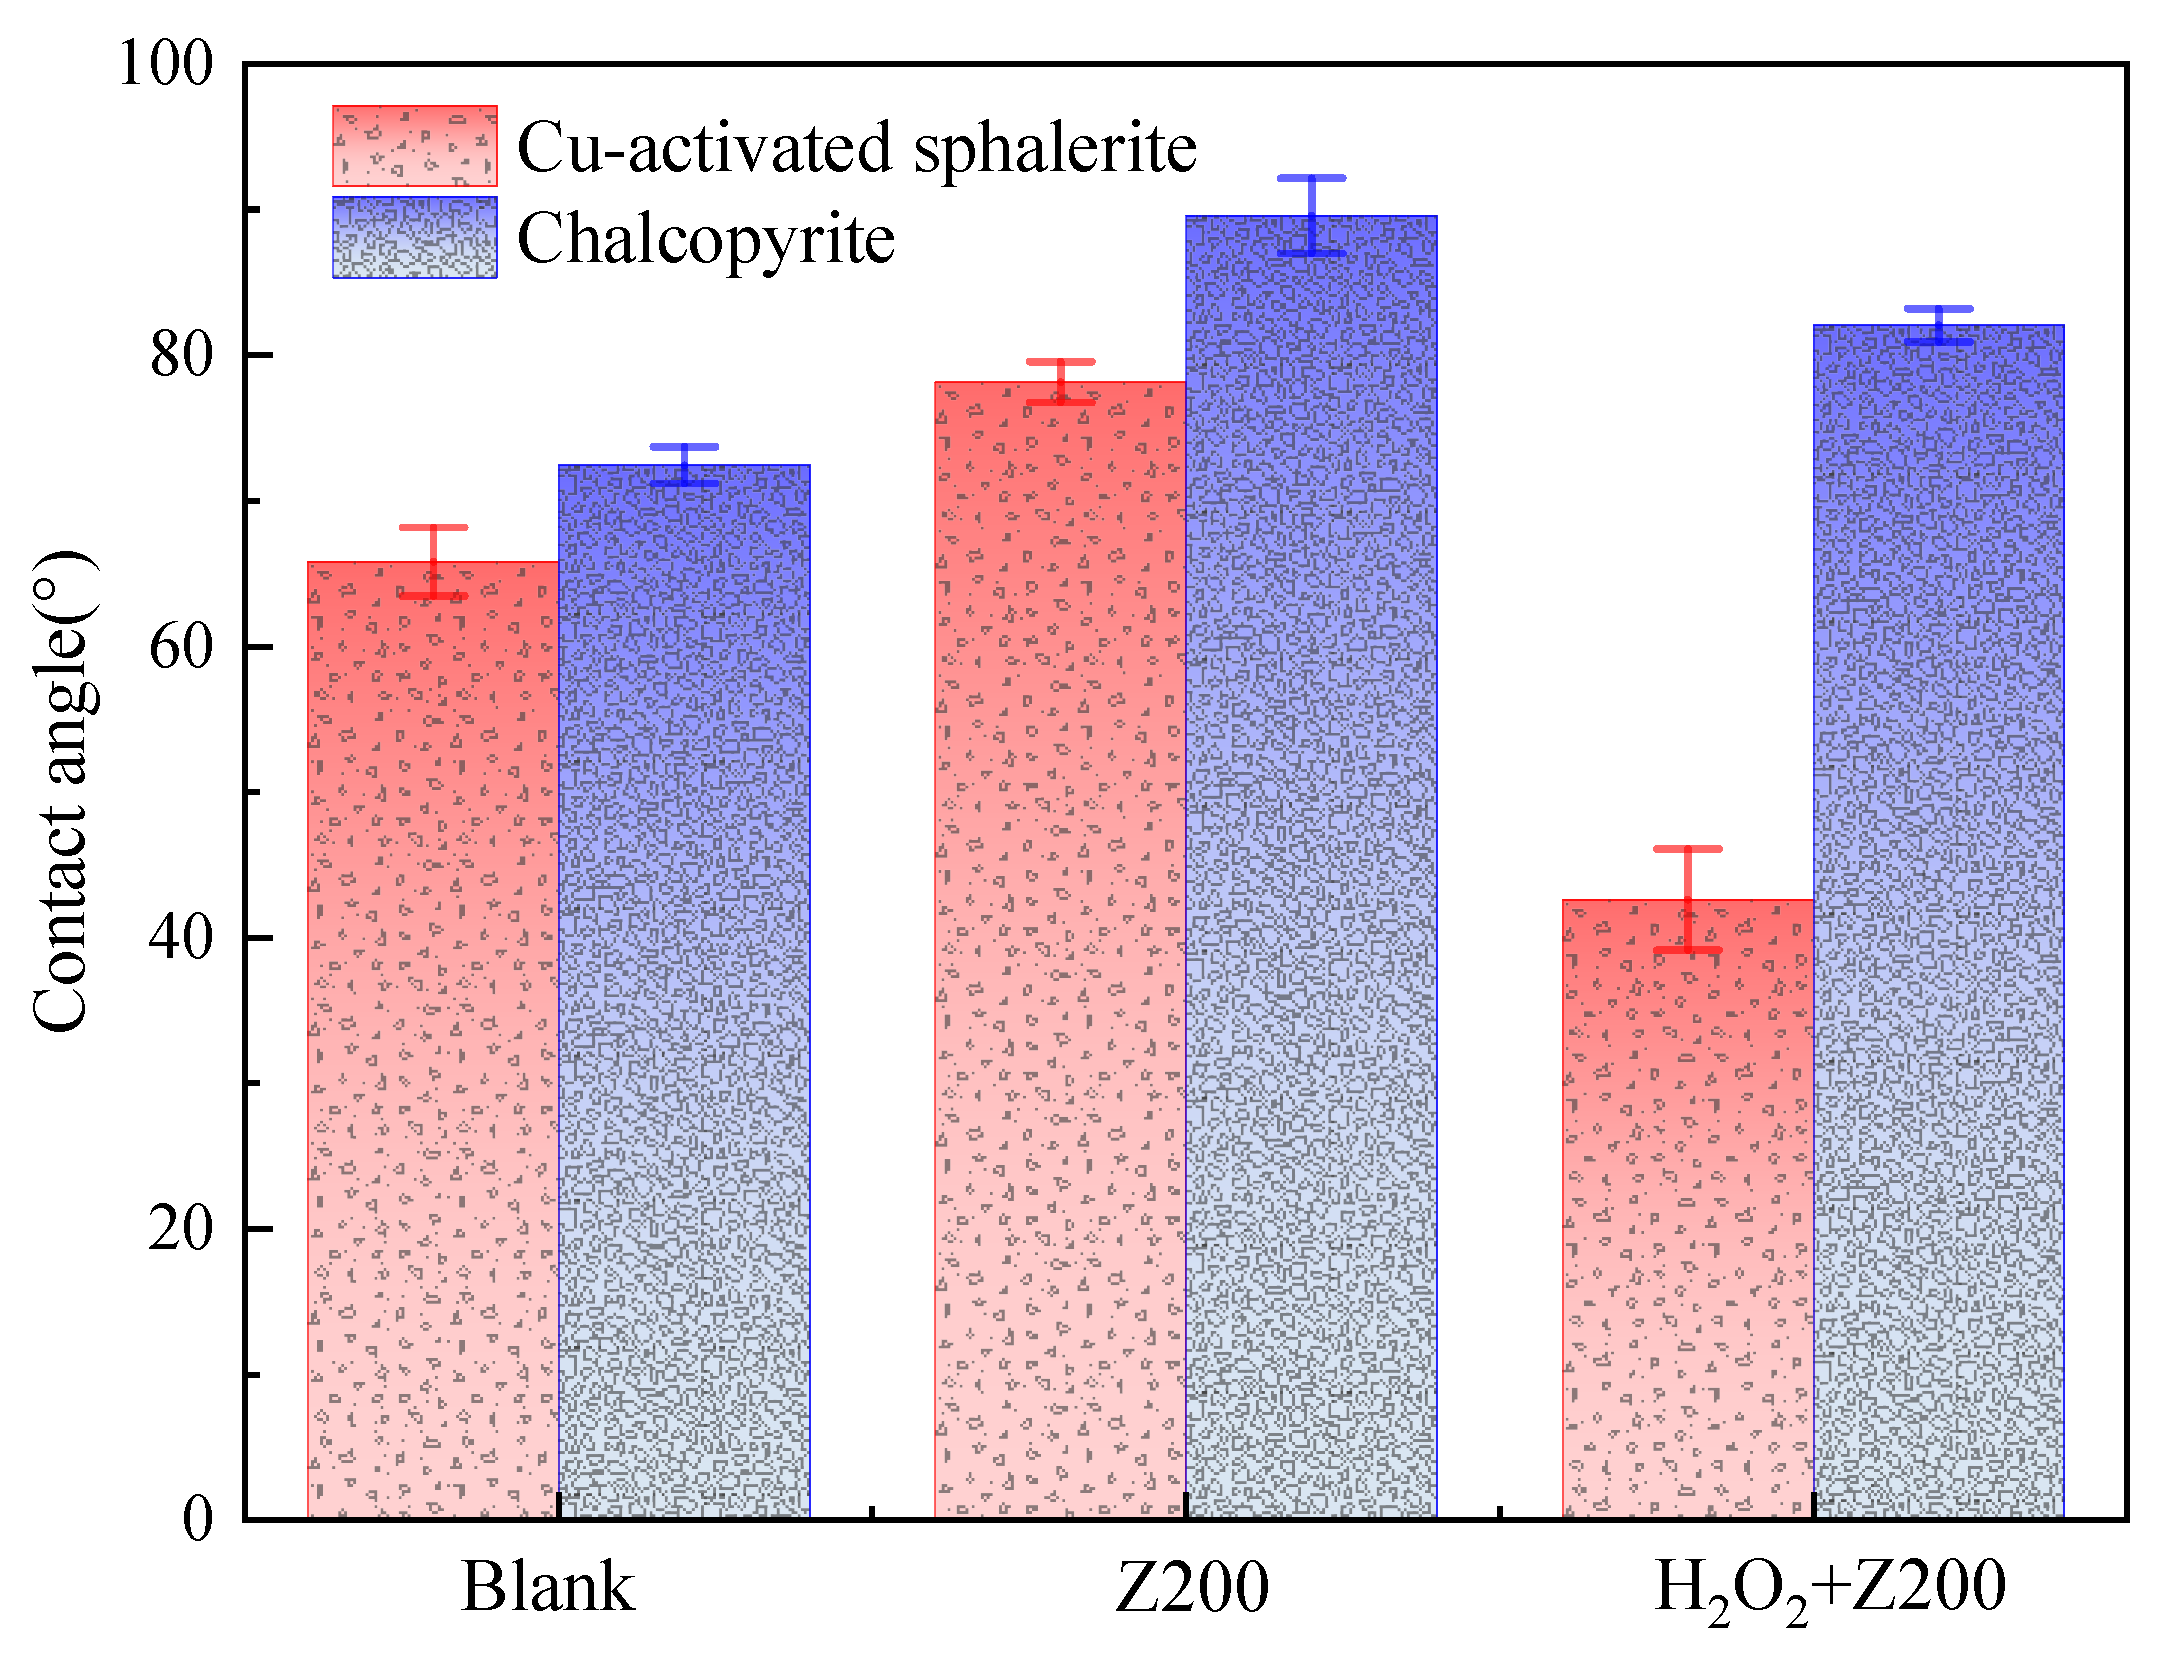
3.3. Contact Angle Test Results

According to flotation principles, mineral floatability is governed by surface hydrophobicity, which is typically evaluated by contact angle measurements—higher contact angles indicate greater hydrophobicity and improved floatability [23,24,25]. Therefore, contact angles of chalcopyrite and Cu-activated sphalerite were measured under three conditions: without reagents, with Z-200, and with combined Z-200 and H2O2 treatment, as shown in Figure 5.
Under reagent-free conditions, the contact angles of Cu-activated sphalerite and chalcopyrite were approximately 66.54° and 71.52%, respectively, indicating good inherent hydrophobicity. Upon addition of the collector Z-200, the contact angles increased significantly to 77.51° for Cu-activated sphalerite and 90.07° for chalcopyrite, suggesting effective adsorption of Z-200 and enhanced hydrophobicity for both minerals. However, with the combined application of Z-200 and H2O2, the minerals exhibited distinct differences in surface wettability. The contact angle of Cu-activated sphalerite dropped sharply to 43.56°, indicating a substantial reduction in hydrophobicity, likely due to oxidative reactions with H2O2 forming hydrophilic hydroxyl species on the surface. In contrast, chalcopyrite maintained a contact angle of 82.13°, suggesting minimal surface alteration by H2O2. This selective change in wettability provides the basis for effective flotation separation of chalcopyrite from Cu-activated sphalerite in mixed mineral systems.

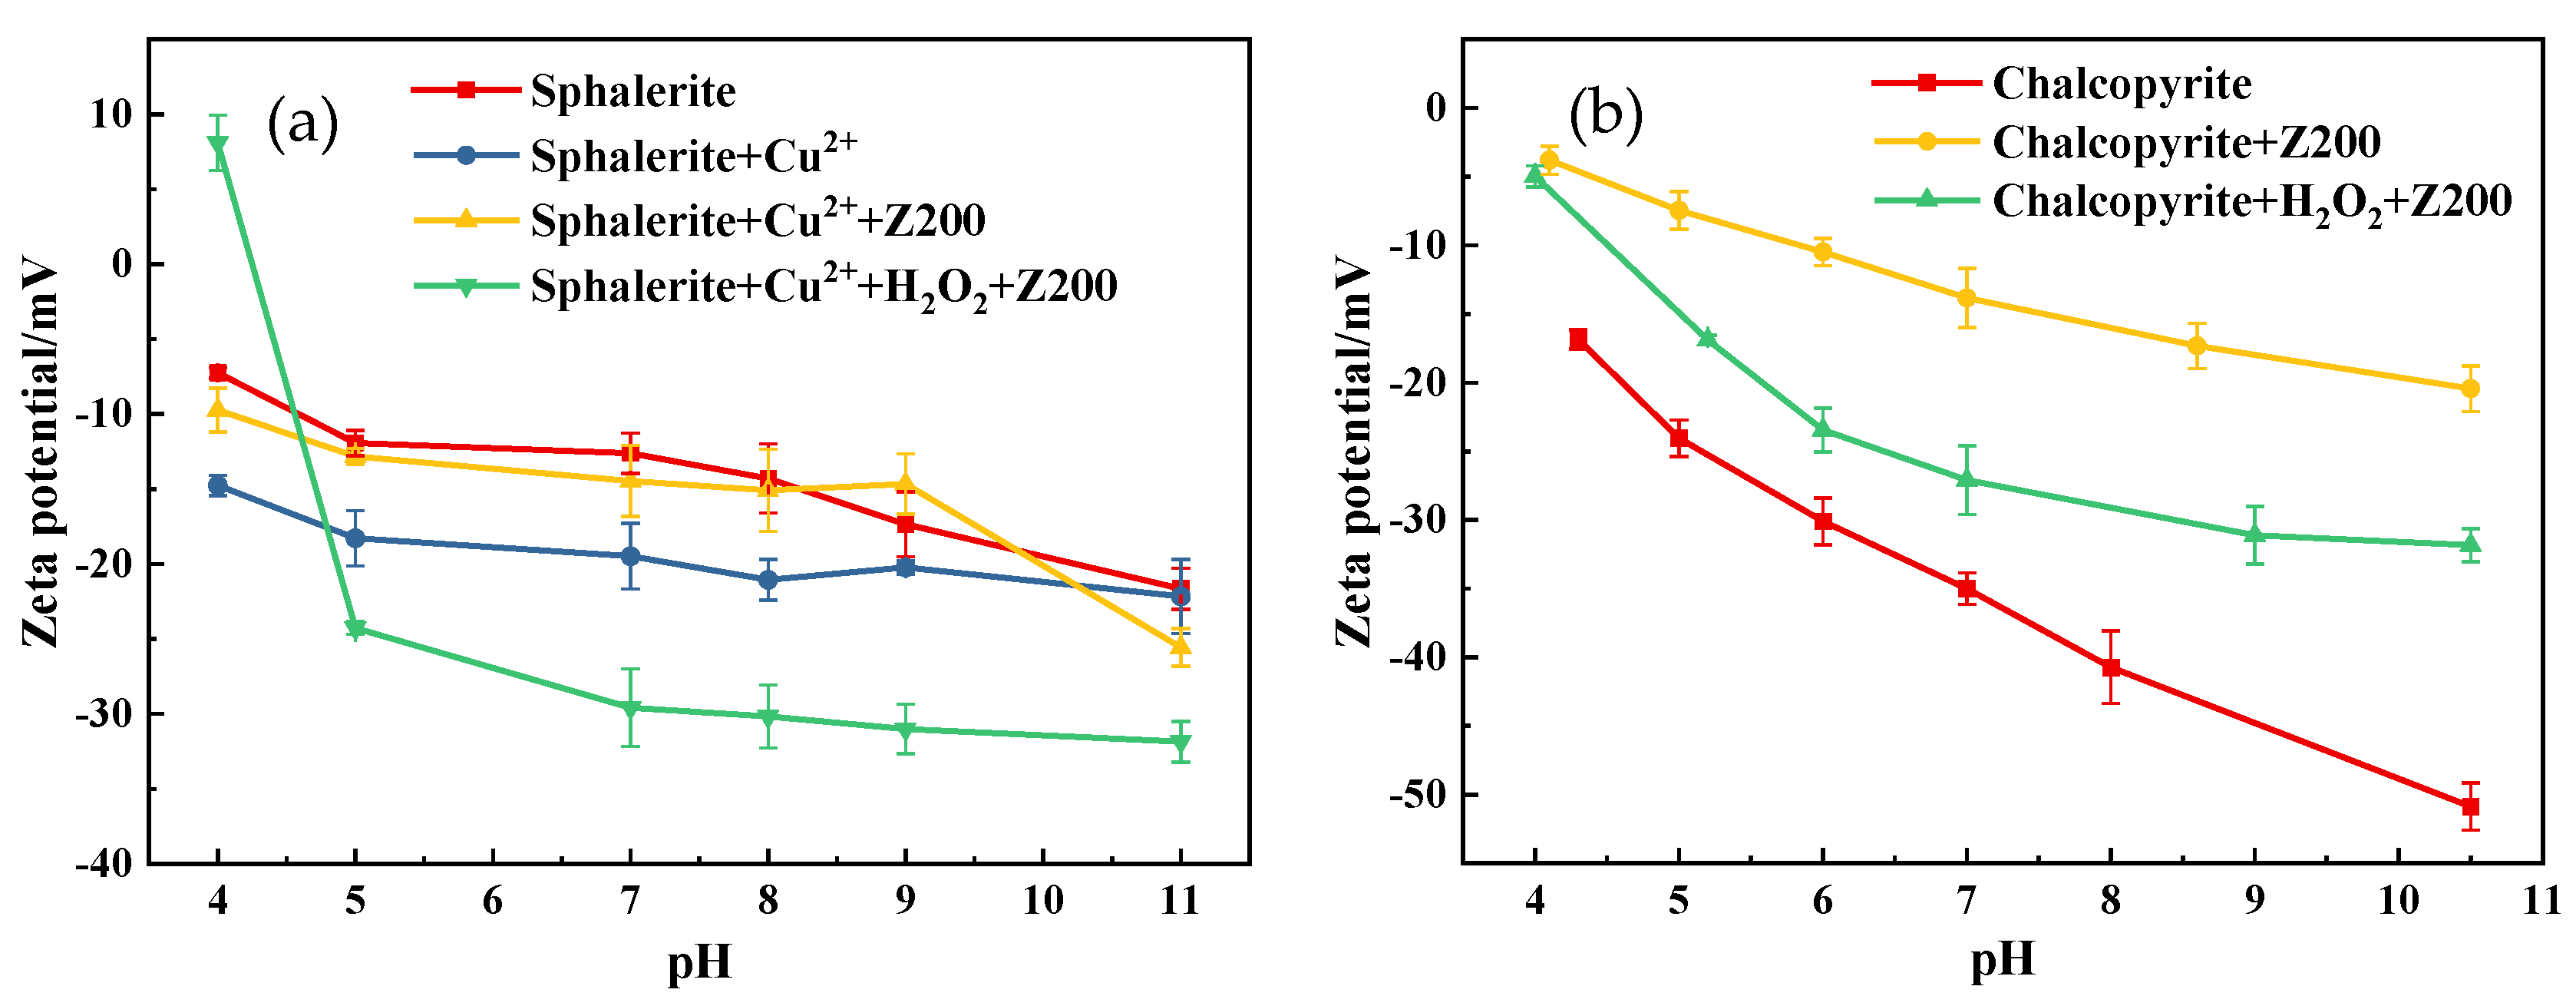
3.4. Zeta Potential Test Results

As shown in Figure 6a, as pH increases from 4 to 11, the zeta potential of sphalerite decreases gradually from approximately −7 mV to −22 mV. Cu-activated sphalerite exhibits overall more negative zeta potentials (roughly −10 mV to −23 mV) compared with unactivated sphalerite. Adsorbed Cu2+ on the sphalerite surface likely forms copper sulfide or hydroxide complexes, rendering the surface more negative and more hydrophobic, which favors subsequent collector adsorption [4]. After adding Z-200, the zeta potential of Cu-activated sphalerite experiences a slightly positive shift, possibly because the Cu–thionocarbamate complex is overall electrically neutral or slightly positive, forming a passive layer that partially neutralizes surface negative charge. Upon addition of H2O2, surface oxidation produces oxides or hydroxides (e.g., Zn–OH, Cu–OH), as well as possibly strongly negative sulfur–oxygen species (such as surface SO42− or ZnSO4), causing further negative shifts in zeta potential [26].
In Figure 6b, chalcopyrite’s zeta potential decreases from about −17 mV at pH 4.3 to −50 mV at pH 10.5 [27]. At all pH values, chalcopyrite’s zeta potential is more negative than that of sphalerite, primarily because its surface Fe2+/Cu+ hydrolysis is stronger, yielding more negatively charged oxide or hydroxide species [28,29]. After adding Z-200, its adsorption on chalcopyrite is stronger than on sphalerite, forming a more stable adsorption layer and producing a larger positive shift in zeta potential. With H2O2+Z-200 treatment, H2O2 also oxidizes chalcopyrite to form metal hydroxides, shifting its zeta potential negatively. However, because sphalerite is more easily oxidized and its oxidation products carry stronger negative charge, the negative shift in zeta potential is less pronounced than for sphalerite [30,31]. Moreover, it has been reported that the effect of zeta potential variation on flotation performance is less significant than that of contact angle, which more directly reflects the surface hydrophobicity of minerals [32].

3.5. Surface Adsorption Analysis
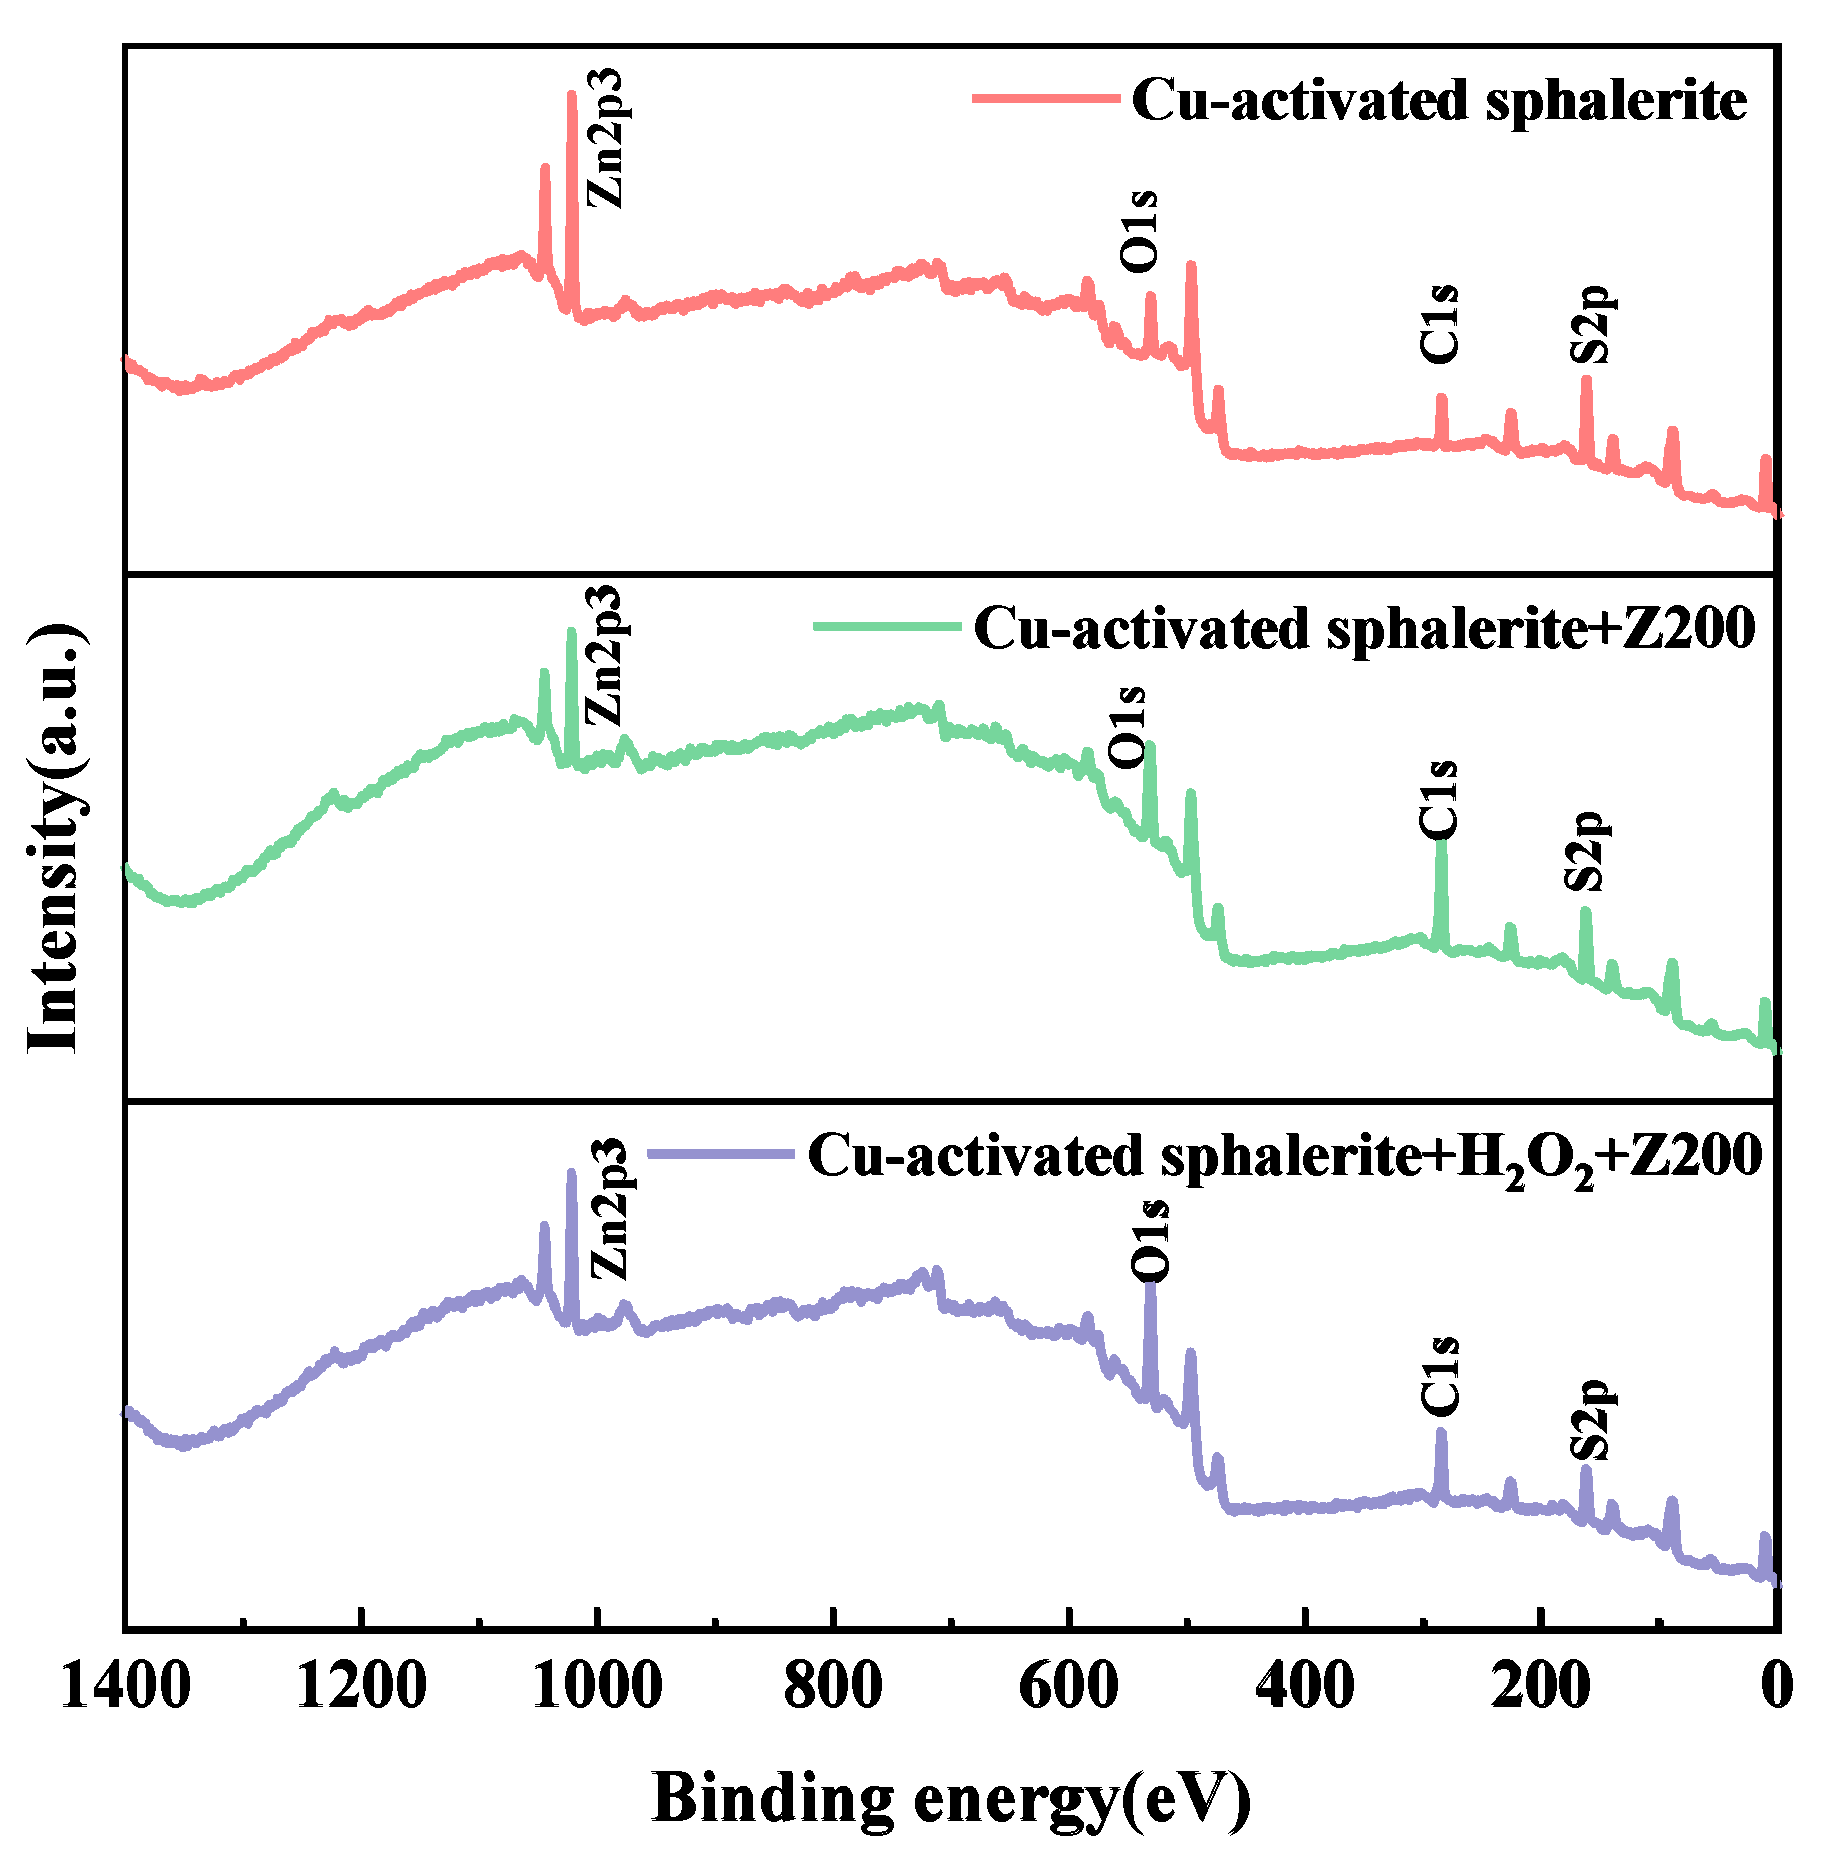
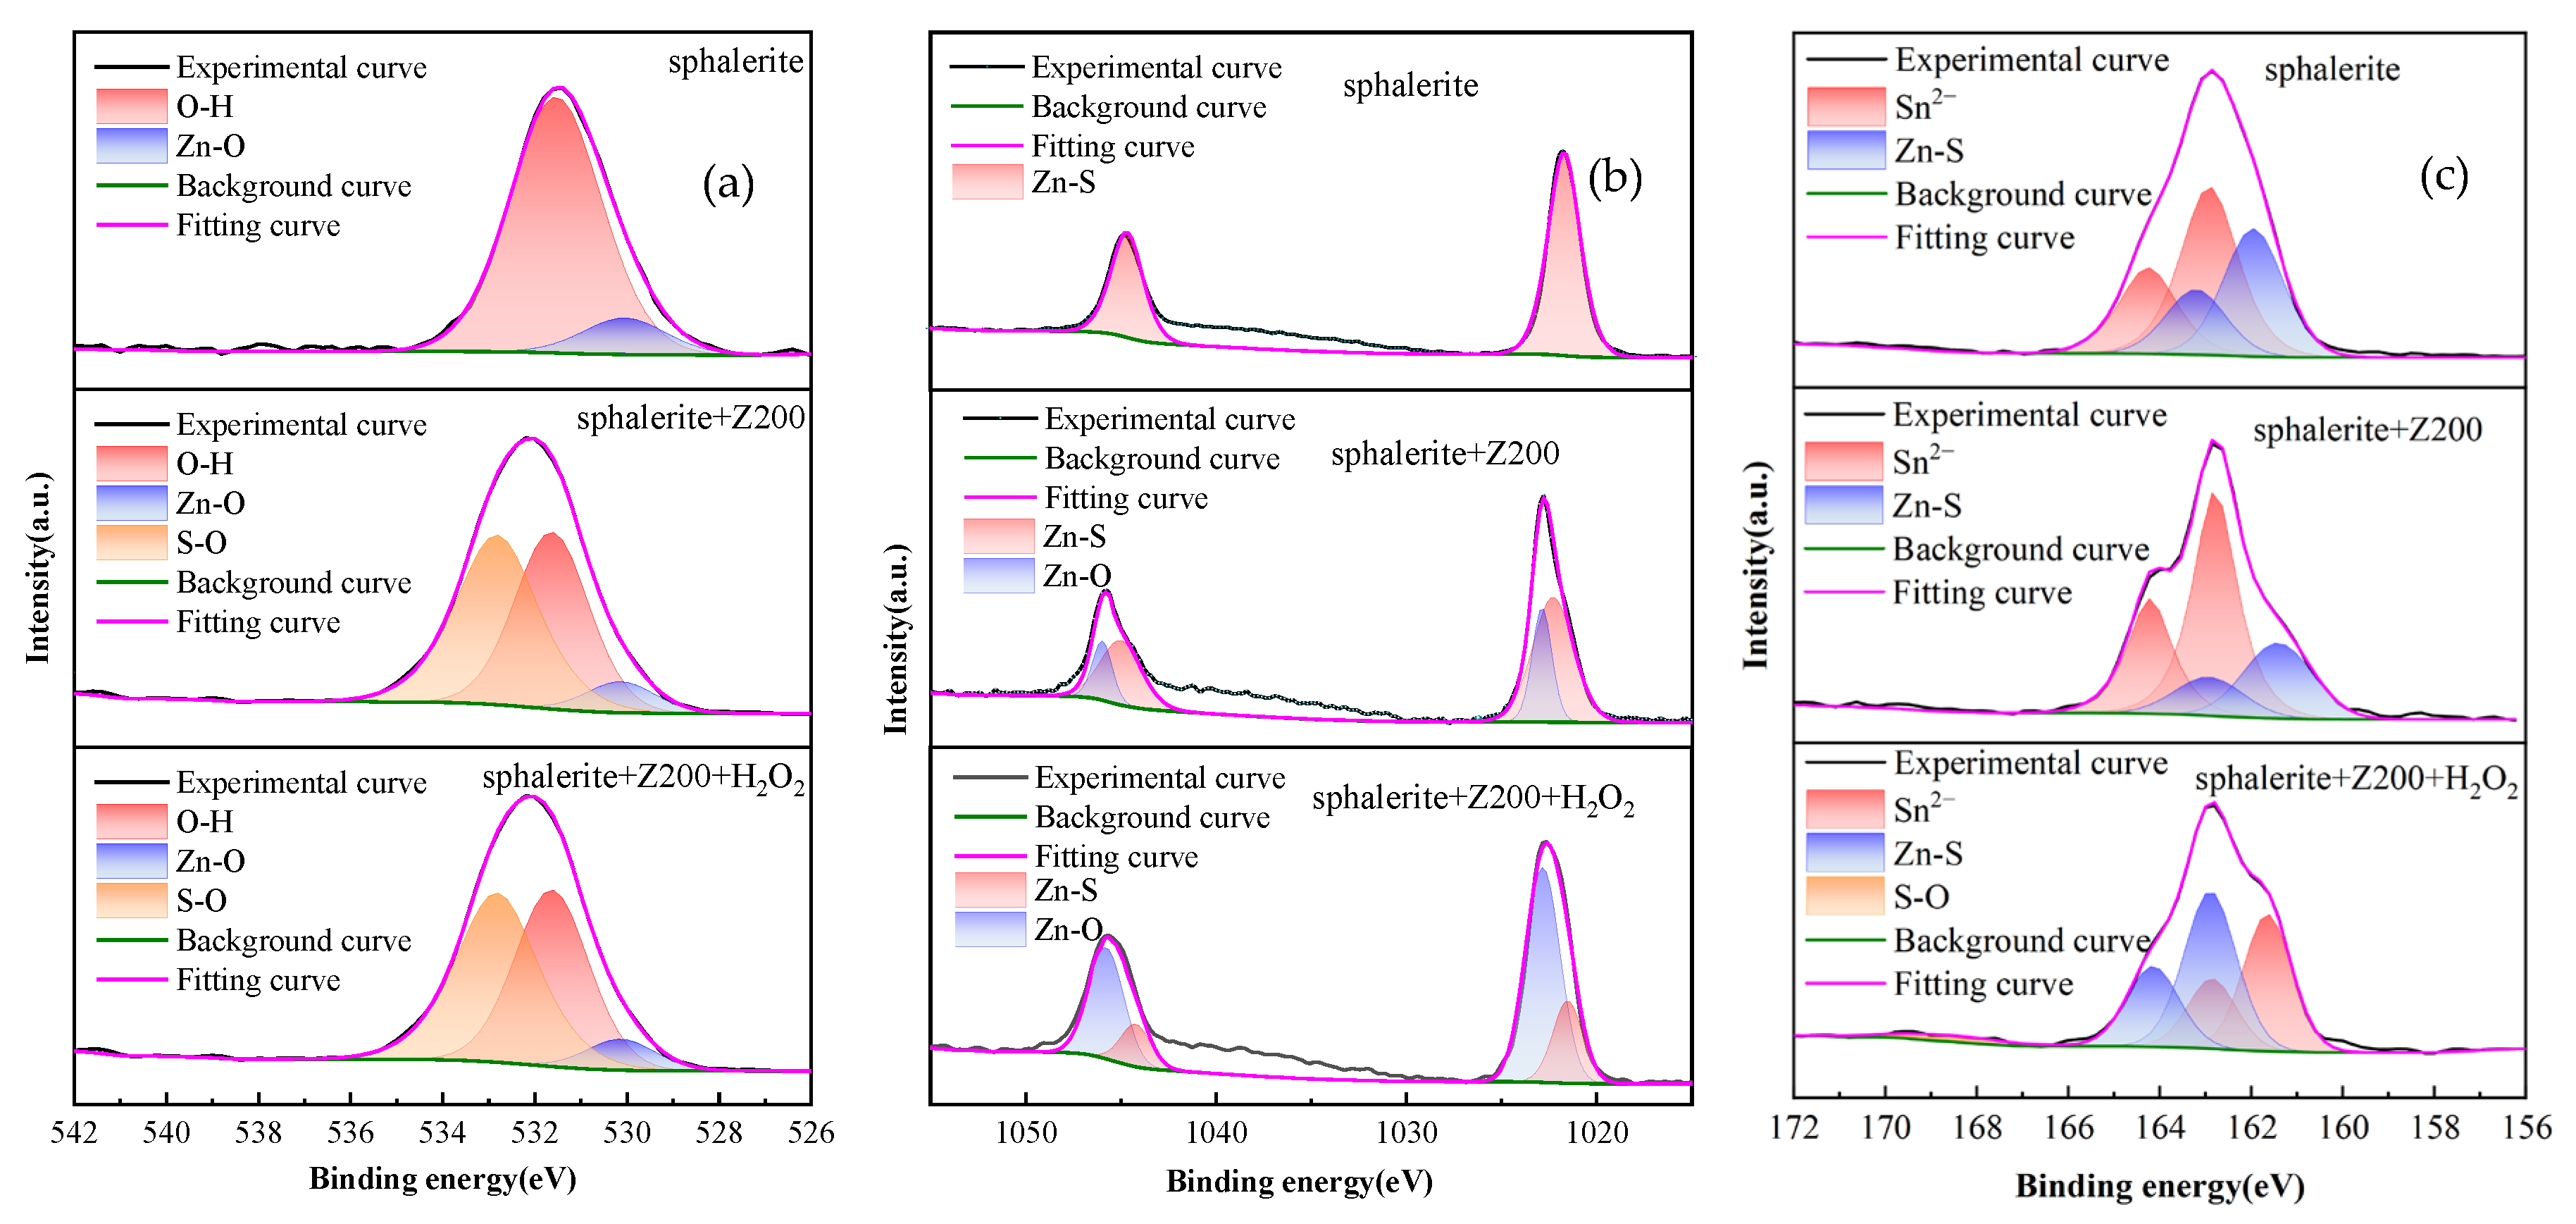
Table 3 shows that without H2O2, Z-200 adsorbed 0.0911 mg/g on chalcopyrite and 0.0528 mg/g on Cu-activated sphalerite, indicating strong adsorption on both minerals but greater affinity for chalcopyrite. After adding H2O2, Z-200’s adsorption on Cu-activated sphalerite dropped to 0.0144 mg/g (a 72.7% decrease), demonstrating that H2O2 strongly inhibits collector adsorption on Cu-activated sphalerite. In contrast, chalcopyrite’s adsorption decreased to 0.0767 mg/g (about a 16% decrease), indicating only a minor effect of H2O2 on its collector uptake. These results explain the large difference in floatability after H2O2 addition, enabling effective flotation separation of the two minerals, consistent with the flotation data [33,34].

3.6. XPS Analysis

XPS analyses were performed on Cu-activated sphalerite before and after interaction with Z-200 and with Z-200+H2O2 to elucidate the mechanisms of Z-200 and H2O2 on the mineral surface. In X-ray photoelectron spectroscopy (XPS) analysis, the C 1s, O 1s, Zn 2p, and S 2p orbitals, which exhibit strong signals and high sensitivity, are selected as representative peaks for C, O, Zn, and S, respectively. This facilitates the acquisition of clear spectral peaks and enables reliable quantitative analysis [35]. The results are shown in Figure 7 and Table 4.
On the untreated Cu-activated sphalerite surface, the atomic concentrations of C, O, Zn, and S were 39.60%, 20.41%, 20.67%, and 19.32%, respectively. After adding Z-200, the C content increased from 39.60 at. % to 56.66 at. %, indicating adsorption of the carbon-rich Z-200 on the mineral surface. The O content also rose, likely due to oxygen in the adsorbed Z-200. Concurrently, Zn and S concentrations decreased markedly, suggesting that Z-200 chemically interacted with surface Zn and S, masking these elements. When both H2O2 and Z-200 were applied, the C content dropped to 40.41%, demonstrating that H2O2 inhibited Z-200 adsorption. In contrast, O increased sharply to 34.45%, showing that H2O2’s strong oxidation enhanced surface oxidation, which is detrimental to collector adsorption. Compared to untreated sphalerite, Zn and S contents decreased by 8.77% and 8.91%, respectively, implying that H2O2 corroded and dissolved the sphalerite surface, forming oxygen-containing metal oxides.
To more clearly present changes in elemental concentrations and chemical environments before and after interaction with Z-200 and Z-200 +H2O2, the fractional peak fitting and content changes in O1s, Zn 2p, and S 2p under different conditions were analyzed, as shown in Figure 8 and Table 5, Table 6 and Table 7.
Figure 8a shows two fitted O 1s peaks for Cu-activated sphalerite at 530.09 eV and 531.54 eV, corresponding to Zn–O and O–H, respectively [36]. After adding Z-200, a new peak emerges at 533.00 eV (S–O), while the Zn–O atomic concentration decreases and O–H increases, likely due to the adsorption of Z-200. The presence of functional groups such as thiocarbonyl (C=S) and ether oxygen (–O–) in Z-200 contributes to the increased surface concentrations of sulfur and oxygen. When Cu-activated sphalerite interacts with Z-200 and H2O2, Zn–O and O–H concentrations drop significantly and S–O rises sharply, indicating strong surface oxidation by H2O2, resulting in the formation of hydroxyl and sulfoxy compounds [37].
In Figure 8b, the Cu-activated sphalerite shows Zn 2p3/2 and Zn 2p1/2 main peaks, with Zn 2p3/2 at 1021.72 eV corresponding to Zn–S; no other Zn species are detected [38]. After Z-200 treatment, a new Zn–O peak appears at 1022.17 eV with an atomic concentration of 38.46%, while Zn–S decreases to 61.54% and its binding energy shifts by −0.41 eV, indicating that surface Zn atoms participate in chemical reactions [39]. When Cu-activated sphalerite interacts with both Z-200 and H2O2, the concentration of Zn–O atoms rises significantly to 75.09%, demonstrating that H2O2 strongly oxidizes the sphalerite surface, forming a large amount of zinc oxide [40].
Figure 8c shows the fitted S 2p spectra for Cu-activated sphalerite. Two peaks appear at 161.24 eV and 162.05 eV, corresponding to Zn–S and Sn2− species, with atomic concentrations of 42.96% and 57.04%, respectively [41,42]. After Z-200 treatment, the binding energies of Zn–S and Sn2− shift downward by 0.47 eV and 0.11 eV, respectively, while atomic concentrations of Zn–S decreases and Sn2− increases, likely due to Z-200 adsorption, consistent with the O 1 s analysis. When Z-200 and H2O2 are both applied, a new peak at 168.31 eV appears, attributed to S–O. Combined with the O 1s results, this indicates that H2O2 induces the formation of sulfate species on the sphalerite surface, albeit at a low concentration of 3.12% [43].

4. Conclusions

In the flotation separation of copper–zinc mixed ores, the dissolved copper ions in the pulp undesirably activate sphalerite, making the floatability of copper and zinc ores similar and difficult to separate. In this study, H2O2 was identified as an efficient depressant for copper–zinc separation, capable of replacing conventional sulfate-based depressants without pH adjustment, featuring a simple reagent scheme and no harmful byproducts, in line with green beneficiation principles. Through pure mineral flotation, contact angle tests, surface adsorption analysis, zeta potential analysis, and XPS analysis, the mechanism of H2O2 on chalcopyrite and sphalerite was investigated. The main findings are summarized as follows:
(1) Both Cu-activated sphalerite and chalcopyrite exhibit good floatability. After adding H2O2, Cu-activated sphalerite is strongly depressed, while chalcopyrite is minimally affected. In the flotation of mixed ores, when the dosage of the collector Z-200 was 10 mg·L−1 and that of the depressant H2O2 was 8 mmol·L−1, a copper concentrate with a Cu grade of 29.95% and a recovery of 87.30% was obtained, along with a zinc concentrate containing 54.12% Zn and a recovery of 91.02%. These results indicate a significant separation between copper and zinc under the given conditions.
(2) H2O2 addition greatly increases the hydrophilicity of Cu-activated sphalerite but has little effect on chalcopyrite. This is because H2O2 oxidized the Cu-activated sphalerite, leading to the formation of hydrophilic oxides that covered the mineral surface, while the surface of chalcopyrite remained hydrophobic. As a result, the surface property difference between copper-activated sphalerite and chalcopyrite was enhanced, enabling their flotation separation.
(3) H2O2 exerts a strong oxidative effect on Cu-activated sphalerite. After H2O2 addition, the O atomic concentration increases significantly while Zn and S concentrations decrease concurrently. This is due to surface oxidation by H2O2 producing metal oxides and sulfate species that cover the mineral surface, and the reduced C concentration further confirms that H2O2 inhibits Z-200 adsorption.

Author Contributions

Conceptualization, X.X. and X.T.; methodology, X.T. and P.F.; software, Q.S. and Y.M.; validation, Y.M. and B.H.; formal analysis, P.F. and H.F.; investigation, X.X. and Z.L.; resources, X.T. and X.X.; data curation, Y.M. and Z.L.; writing—original draft preparation, P.F.; writing—review and editing, P.F., X.T. and Q.S.; visualization, Q.S.; supervision, X.X.; project administration, B.H. and H.F.; funding acquisition, X.T. All authors have read and agreed to the published version of the manuscript.

Funding

This research was funded by National Natural Science Foundation of China (Nos. 52174252 and 5236040243), Deep Earth National Science and Technology Major Project (No. 2024ZD1004006), and Major Science and Technology Projects in Yunnan Province (202302AB080010).

Data Availability Statement

Data will be made available on request.

Conflicts of Interest

Bin Han, Haitao Fu and Zhiming Lu are employed by Yunnan Hualian Zinc and Indium Co., Ltd. The remaining authors declare that the research was conducted in the absence of any commercial or financial relationships that could be construed as a potential conflict of interest.

References

  1. Wei, B.H.; Mao, Y.Q.; Wang, L.; Shen, P.L.; Wang, H.; Liu, D.W. Sources, Performance and Mechanisms of Metal Ions in the Flotation Process of Copper, Lead, and Zinc Ores: A Review. Minerals 2024, 14, 1105. [Google Scholar] [CrossRef]
  2. Piao, Y.C.; He, F.Y.; Pang, Z.R.; Shang, Y.B.; Luo, K.H.; Zhu, Y.G.; Gao, X.Y.; Zhang, X.R. Flotation Mechanism of Sphalerite by Sulfuration–Amine Method. Minerals 2023, 13, 673. [Google Scholar] [CrossRef]
  3. Bao, L.Y.; Liu, W.A.; Liu, W.B.; Guo, Y.; Chen, Z.X. Experimental and interaction mechanism with novel depressant lysine for the removal of copper ions activation on sphalerite surface. Miner. Eng. 2025, 226, 109247. [Google Scholar] [CrossRef]
  4. Chandra, A.P.; Gerson, A.R. A review of the fundamental studies of the copper activation mechanisms for selective flotation of the sulfide minerals, sphalerite and pyrite. Adv. Colloid Interface Sci. 2009, 145, 97–110. [Google Scholar] [CrossRef]
  5. Aikawa, K.; Ito, M.; Orii, N.; Jeon, S.; Park, I.; Haga, K.; Kamiya, T.; Takahashi, T.; Sunada, K.; Sakakibara, T.; et al. Flotation of Copper Ores with High Cu/Zn Ratio: Effects of Pyrite on Cu/Zn Separation and an Efficient Method to Enhance Sphalerite Depression. Minerals 2022, 12, 1103. [Google Scholar] [CrossRef]
  6. Nooshabadi, A.J.; Rao, K.H. Formation of hydrogen peroxide by sulphide minerals. Hydrometallurgy 2014, 141, 82–88. [Google Scholar] [CrossRef]
  7. Feng, B.; Guo, Y.T.; Zhang, W.P.; Peng, J.X.; Wang, H.H.; Huang, Z.Q.; Zhou, X.T. Flotation separation behavior of chalcopyrite and sphalerite in the presence of locust bean gum. Miner. Eng. 2019, 143, 105940. [Google Scholar] [CrossRef]
  8. Wang, C.T.; Liu, R.Q.; Wu, M.R.; Zhai, Q.L.; Luo, Y.J.; Jing, N.W.; Xie, F.F.; Sun, W. Selective separation of chalcopyrite from sphalerite with a novel depressant fenugreek gum: Flotation and adsorption mechanism. Miner. Eng. 2022, 184, 107653. [Google Scholar] [CrossRef]
  9. Zhu, H.Y.; Yang, B.Q.; Martin, R.; Zhang, H.Q.; He, D.S.; Luo, H.H. Flotation separation of galena from sphalerite using hyaluronic acid (HA) as an environmental-friendly sphalerite depressant. Miner. Eng. 2022, 187, 107771. [Google Scholar] [CrossRef]
  10. Silvestre, M.O.; Pereira, C.A.; Galery, R.; Peres, A.E.C. Dispersion effect on a lead-zinc sulphide ore flotation. Miner. Eng. 2009, 22, 752–758. [Google Scholar] [CrossRef]
  11. Zhao, K.; Ma, C.; Gu, G.H.; Gao, Z.Y. Selective Separation of Chalcopyrite from Galena Using a Green Reagent Scheme. Minerals 2021, 11, 796. [Google Scholar] [CrossRef]
  12. Wei, Q.; Jiao, F.; Dong, L.Y.; Liu, X.D.; Qin, W.Q. Selective depression of copper-activated sphalerite by polyaspartic acid during chalcopyrite flotation. Trans. Nonferrous Met. Soc. China 2021, 31, 1784–1795. [Google Scholar] [CrossRef]
  13. Huang, P.; Cao, M.; Liu, Q. Selective depression of sphalerite by chitosan in differential Pb-Zn flotation. Int. J. Miner. Process. 2013, 122, 29–35. [Google Scholar] [CrossRef]
  14. Chen, Y.; Feng, B.; Zhong, C.; Wang, Z. Effect and mechanism of the xanthate/H2O2 addition order on flotation separation of chalcopyrite and sphalerite. Miner. Eng. 2022, 188, 107851. [Google Scholar] [CrossRef]
  15. Suyantara, G.P.W.; Hirajima, T.; Miki, H.; Sasaki, K.; Yamane, M.; Takida, E.; Kuroiwa, S.; Imaizumi, Y. Effect of Fenton-like oxidation reagent on hydrophobicity and floatability of chalcopyrite and molybdenite. Colloids Surf. A Physicochem. Eng. Asp. 2018, 554, 34–48. [Google Scholar] [CrossRef]
  16. Xia, L.; Hart, B.R. Correlation between the hydrogen peroxide formed during grinding and the oxidized species present on the surface of sphalerite. Miner. Eng. 2019, 130, 165–170. [Google Scholar] [CrossRef]
  17. Liu, J.; Feng, B.; Guo, W.; Chen, Y. Utilizing H2O2 for the selective flotation separation of chalcopyrite and galena with their surface pre-adsorbed with Isopropyl Ethyl Thiocarbamate. Sep. Purif. Technol. 2024, 330, 125477. [Google Scholar] [CrossRef]
  18. Zhang, L.; Liu, J.; Ma, Z.; Peng, W.; Huang, Y.; Wang, W.; Cao, Y. Recent advances in oxidation pretreatment and flotation separation of metal sulfide ores. Green Smart Min. Eng. 2025, 2, 142–155. [Google Scholar] [CrossRef]
  19. Nooshabadi, A.J.; Rao, K.H. Formation of hydrogen peroxide by chalcopyrite and its influence on flotation. Miner. Metall. Process. 2013, 30, 212–219. [Google Scholar] [CrossRef]
  20. Suyantara, G.P.W.; Berdakh, D.; Miki, H.; Hirajima, T.; Sasaki, K.; Ochi, D.; Aoki, Y. Effect of hydrogen peroxide on selective flotation of chalcocite and enargite. Int. J. Min. Sci. Technol. 2023, 33, 703–716. [Google Scholar] [CrossRef]
  21. Chen, Z.; Yoon, R.-H. Electrochemistry of copper activation of sphalerite at pH 9.2. Int. J. Miner. Process. 2000, 58, 57–66. [Google Scholar] [CrossRef]
  22. Flores, D.J.; Graber, T.A.; Angel-Castillo, A.H.; Hernández, P.C.; Taboada, M.E. Use of Hydrogen Peroxide as Oxidizing Agent in Chalcopyrite Leaching: A Review. Metals 2025, 15, 531. [Google Scholar] [CrossRef]
  23. Cui, Y.F.; Jiao, F.; Qin, W.Q.; Wang, C.; Li, X.C. Flotation separation of sphalerite from galena using eco-friendly and efficient depressant pullulan. Sep. Purif. Technol. 2022, 295, 121013. [Google Scholar] [CrossRef]
  24. Aikawa, K.; Ito, M.; Segawa, T.; Jeon, S.; Park, I.; Tabelin, C.B.; Hiroyoshi, N. Depression of lead-activated sphalerite by pyrite via galvanic interactions: Implications to the selective flotation of complex sulfide ores. Miner. Eng. 2020, 152, 106367. [Google Scholar] [CrossRef]
  25. Sun, H.; Zhang, Z.; Wang, Y.; Liu, F.; Liu, S.; Liu, G. Flotation Separation of Chalcopyrite from Sphalerite with 3-amyl-4-amino-1,2,4-triazole-5-thione and Its Underlying Mechanism. Min. Metall. Eng. 2021, 41, 51–56. [Google Scholar]
  26. Cheng, T.; Wang, T.; Shen, Z.; Ma, S.; Shi, S.; Deng, J.; Deng, J. The depression mechanism of magnesium on the flotation of sphalerite with different iron contents: DFT and experimental studies. Sep. Purif. Technol. 2025, 353, 128379. [Google Scholar] [CrossRef]
  27. Zhang, C.H.; He, T.S.; Chen, W.; Bu, X.Z.; Wang, S.; Tian, X.Z. The Auxiliary Effect of Copper Ions on the Depressant Effect of Sodium Thioglycolate in Chalcopyrite Flotation. Minerals 2020, 10, 157. [Google Scholar] [CrossRef]
  28. Rios, L.A.; Barraza, M.J.; Robles, P.A.; Quezada, G.R. Chalcopyrite Flotation, Molecular Design and Smart Industry: A Review. Int. J. Mol. Sci. 2025, 26, 3613. [Google Scholar] [CrossRef]
  29. Sun, X.S.; Yu, J.W.; Zhang, W.Y.; Li, P.Y.; Li, Y.J.; Han, Y.X. Flotation separation of chalcopyrite from pyrite and sphalerite using a novel collector: An experimental and mechanism investigation. Appl. Surf. Sci. 2024, 661, 160059. [Google Scholar] [CrossRef]
  30. Ignatkina, V.A.; Bocharov, V.A.; Aksenova, D.D.; Kayumov, A.A. Zeta potential of the surface of ultrafine sulfides and floatability of minerals. Russ. J. Non-Ferr. Met. 2017, 58, 95–100. [Google Scholar] [CrossRef]
  31. Hong, G.; Choi, J.; Han, Y.; Yoo, K.S.; Kim, K.; Kim, S.B.; Kim, H. Relationship between Surface Characteristics and Floatability in Representative Sulfide Minerals: Role of Surface Oxidation. Mater. Trans. 2017, 58, 1069–1075. [Google Scholar] [CrossRef]
  32. Gomez-Flores, A.; Heyes, G.W.; Ilyas, S.; Kim, H. Prediction of grade and recovery in flotation from physicochemical and operational aspects using machine learning models. Miner. Eng. 2022, 183, 107627. [Google Scholar] [CrossRef]
  33. Zhai, Q.L.; Hu, Y.W.; Liu, R.Q.; Sun, W. Investigation of pullulan polysaccharide as a sphalerite depressant for chalcopyrite separation: Flotation behavior and interfacial adsorption mechanism. Adv. Powder Technol. 2024, 35, 104621. [Google Scholar] [CrossRef]
  34. Yu, J.; Zhang, X.L.; Liu, X.X.; Xu, X.L.; Chen, X.Y.; He, H.Y.; Zhang, Y.; Peng, R.; Shen, P.L.; Liu, D.W. A novel eco-friendly depressant Scutellaria Baicalensis Extract SBE and its performance on flotation separation of chalcopyrite from sphalerite: A combined experimental and mechanism investigation. Chem. Phys. 2025, 591, 112541. [Google Scholar] [CrossRef]
  35. Kwoka, M.; Kulis-Kapuscinska, A.; Zappa, D.; Comini, E.; Szuber, J. Novel insight on the local surface properties of ZnO nanowires. Nanotechnology 2020, 31, 465705. [Google Scholar] [CrossRef]
  36. Jnido, G.; Ohms, G.; Viöl, W. Deposition of Zinc Oxide Coatings on Wood Surfaces Using the Solution Precursor Plasma Spraying Process. Coatings 2021, 11, 183. [Google Scholar] [CrossRef]
  37. Jiang, L.; Feng, B.; Liu, J.; Guo, Y.; Corin, K.C.; Mabounda, J. Influence of surface oxidation rate on the flotation of sphalerite and galena inhibited by gum arabic. Process. Saf. Environ. Prot. 2024, 192, 998–1007. [Google Scholar] [CrossRef]
  38. Pauly, N.; Yubero, F.; Espinós, J.P.; Tougaard, S. XPS primary excitation spectra of Zn 2p, Fe 2p, and Ce 3d from ZnO, α-Fe2O3, and CeO2. Surf. Interface Anal. 2019, 51, 353–360. [Google Scholar] [CrossRef]
  39. Li, J.L.; Li, G.L.; Liu, Z.C.; Ning, S.; Liu, R.Z. Interface-coupled PbSO4 dissolution and PbS precipitation and its effect on sulfidization flotation of anglesite. Trans. Nonferrous Met. Soc. China 2023, 33, 3503–3513. [Google Scholar] [CrossRef]
  40. Cabrera-German, D.; Molar-Velázquez, G.; Gómez-Sosa, G.; de la Cruz, W.; Herrera-Gomez, A. Detailed peak fitting analysis of the Zn 2p photoemission spectrum for metallic films and its initial oxidation stages. Surf. Interface Anal. 2017, 49, 1078–1087. [Google Scholar] [CrossRef]
  41. Kartio, I.J.; Basilio, C.I.; Yoon, R.-H. An XPS study of sphalerite activation by copper. Langmuir 1998, 14, 5274–5278. [Google Scholar] [CrossRef]
  42. Pratt, A. Fine Structure in XPS and XANES Spectra Acquired from a Series of Sphalerite Samples. ECS Trans. 2010, 28, 95–103. [Google Scholar] [CrossRef]
  43. Ejtemaei, M.; Nguyen, A.V. Characterisation of sphalerite and pyrite surfaces activated by copper sulphate. Miner. Eng. 2017, 100, 223–232. [Google Scholar] [CrossRef]
Figure 1. XRD pattern of sphalerite (a) and chalcopyrite (b).
Metals 15 00813 g001
Figure 2. Flowsheet of micro-flotation experiments.
Metals 15 00813 g002
Figure 3. Effect of different depressant dosage (a) and pH (b) on chalcopyrite and sphalerite surfaces: Both (a,b) are single-mineral flotation.
Metals 15 00813 g003
Figure 4. Flotation results of artificially mixed minerals of chalcopyrite and copper-activated sphalerite (pH = 7, H2O2 dosage 8 mmol/ L).
Metals 15 00813 g004
Figure 5. Surface contact angles of chalcopyrite and Cu-activated sphalerite.
Metals 15 00813 g005
Figure 6. Zeta potential of chalcopyrite (a) and sphalerite (b) as function of pH before and after treatment with flotation reagents.
Metals 15 00813 g006
Figure 7. XPS scanning of Cu-activated sphalerite surfaces before and after reaction with Z-200 and mixtures of Z-200 and H2O2.
Metals 15 00813 g007
Figure 8. XPS spectra of O 2p (a), Zn 2p (b), and S 2p (c) on the Cu-activated sphalerite surface before and after reaction with Z-200 and Z-200 +H2O2.
Metals 15 00813 g008
Table 1. Results of chemical compositions analysis of sphalerite and chalcopyrite.
Content/wt.%ZnCuFeSPbSi
Sample
Sphalerite64.01<0.0051.4933.750.0310.34
Chalcopyrite0.02434.3230.3234.120.0680.27
Table 2. Results of flotation separation of artificially mixed minerals.
Concentration of Depressant H2O2/(mmol·L−1)ProductYield/wt.%Grade/%Recovery/%
CuZnCuZn
0Cu concentrate94.99 16.17 29.54 95.84 91.46
Zn concentrate5.01 13.31 52.33 4.16 8.54
Feed100.00 16.03 30.68 100.00 100.00
8Cu concentrate48.11 29.95 5.76 87.30 8.98
Zn concentrate51.89 4.04 54.12 12.70 91.02
Feed100.00 16.51 30.85 100.00 100.00
Table 3. Results of surface adsorption.
Test ConditionC0/mgC1/mgV/LC/%M/g Γ   mg/g
Sphalerite+Cu2++Z-2002.901.800.0552.13%20.0528
Sphalerite+Cu2++H2O2+Z-2002.802.500.0144
Chalcopyrite+Z-2002.901.000.0911
Chalcopyrite+H2O2+Z-2002.801.200.0767
Table 4. Atomic concentration of Cu-activated sphalerite surface before and after reaction with Z-200 and mixtures of Z-200 and H2O2 from XPS high-resolution spectra.
SamplesAt.%
C1sO1sZn2pS2p
Cu-activated sphalerite39.60 20.41 20.67 19.32
Cu-activated sphalerite+Z-20056.66 26.02 5.47 11.84
Cu-activated sphalerite+H2O2+Z-20043.24 34.45 11.90 10.41
Table 5. Percentage of O species on the Cu-activated sphalerite surface.
SamplesZn–OO–HS–O
B.E./eVAt.B.E./eVAt.B.E./eVAt.
Cu-activated sphalerite530.0611.43531.5488.52-0.00
Cu-activated sphalerite+Z-200530.5031.25531.7852.74533.0016.01
Cu-activated sphalerite+H2O2+Z-200530.136.49531.6340.16532.8244.77
Table 6. Percentage of Zn species on the Cu-activated sphalerite surface.
SamplesZn–SZn–O
B.E./eVAt.%B.E./eVAt.%
Cu-activated sphalerite1021.72100.00-0.00
Cu-activated sphalerite+Z-2001021.3161.541022.1738.46
Cu-activated sphalerite+H2O2+Z-2001021.5324.911022.8475.09
Table 7. Percentage of S species on the Cu-activated sphalerite surface.
SamplesZn–SSn2−S–O
B.E./eVAt.%B.E./eVAt.%B.E./eVAt.%
Cu-activated sphalerite161.2142.96162.0557.04-0.00
Cu-activated sphalerite+Z-200160.7431.44161.9468.56-0.00
Cu-activated sphalerite+H2O2+Z-200161.6443.24162.8953.63168.313.12
Disclaimer/Publisher’s Note: The statements, opinions and data contained in all publications are solely those of the individual author(s) and contributor(s) and not of MDPI and/or the editor(s). MDPI and/or the editor(s) disclaim responsibility for any injury to people or property resulting from any ideas, methods, instructions or products referred to in the content.

