Article

Microstructure, Porosity, and Bending Fatigue Behaviour of PBF-LB/M SS316L for Biomedical Applications

1
School of Mechanical and Aerospace Engineering, Queen’s University Belfast, Belfast BT9 5AH, UK
2
Department of Industrial and Systems Engineering, Hong Kong Polytechnic University, Hong Kong, China
3
School of Materials Science and Engineering, Shenyang University of Technology, Shenyang 110870, China
*
Author to whom correspondence should be addressed.
These authors contributed equally to this work.
Metals 2025, 15(6), 650; https://doi.org/10.3390/met15060650
Submission received: 27 April 2025 / Revised: 5 June 2025 / Accepted: 9 June 2025 / Published: 11 June 2025

Abstract

Bending fatigue significantly affects the mechanical stability and lifespan of biomedical implants, such as bone plates and orthopaedic fixation devices, which undergo cyclic loading in the human body. This study examines the microstructure, porosity, and bending fatigue properties of PBF-LB/M SS316L. Samples were analysed across three faces (top, front, and side) using optical microscopy (OM) and scanning electron microscopy (SEM) to observe microstructural features and porosity. Elemental composition was measured by energy-dispersive X-ray spectroscopy (EDX). Phase structures and grain orientations were characterised via X-ray diffraction (XRD) and electron backscatter diffraction (EBSD). Four-point bending fatigue tests, conducted under two loading conditions, below and slightly above the yield point, demonstrated that defects inherent to the PBF-LB/M process, particularly micropores and unmelted powder particles, strongly influence fatigue crack initiation. Real-time monitoring of crack initiation and propagation on the external sample surface was performed using a high-speed digital microscope. These findings indicate the influence of microstructural defects on fatigue performance in PBF-LB/M SS316L, supporting the design and development of more reliable patient-specific biomedical implants.

1. Introduction

The growing demand for patient-specific medical implants has increased the use of additive manufacturing (AM), or 3D printing, in the biomedical field. Conventionally manufactured (CM) implants usually come in standardised sizes and shapes, often requiring surgical adjustments [1,2,3]. In contrast, AM manufacturing enables implants to be custom-made according to individual patient anatomies, potentially improving implant integration and clinical outcomes [4,5,6]. Laser powder bed fusion of metals (PBF-LB/M) is a common AM method for producing metallic implants. In PBF-LB/M, a laser selectively melts layers of metal powder in an inert atmosphere (argon or nitrogen) to minimise oxidation and contamination [7]. PBF-LB/M is well suited for producing complex shapes with desirable mechanical properties, making it ideal for load-bearing implants like bone plates [8,9]. Nevertheless, PBF-LB/M introduces defects such as internal voids or pores, which can compromise mechanical integrity [10]. This is particularly important for implants experiencing repetitive physiological loads, such as bone plates used in fracture stabilisation.
Fatigue failures occur in both AM and CM implants. Fantin et al. [11] reported fatigue failure in a stainless-steel femoral bone plate due to insufficient bone healing, causing increased implant stress. Guerra-Fuentes et al. [12] found fatigue failure in a CM SS316L supracondylar blade plate resulting from screw failures and subsequent stress concentrations. Sudhakar [13] further demonstrated that material flaws, including inclusions in CM implants and porosity in AM implants, significantly affect fatigue life, with porosity particularly acting as a stress concentrator that initiates fatigue cracks.
AM implants generally demonstrate comparable static strengths to CM implants. However, the fatigue performance is less predictable due to manufacturing defects such as porosity, incomplete fusion defects, and variations in phase structure and grain orientation. These factors significantly influence fatigue life by affecting crack initiation and propagation [14,15,16]. Liang et al. [6] reported reduced fatigue performance in PBF-LB/M SS316L samples under rotational bending due to near-surface fusion defects. Rivolta et al. [17] performed rotating bending tests on as-built and machined PBF-LB/M SS316L samples. They found that subsurface defects had a more significant impact on fatigue life compared to surface defects, owing to the ductility of the material. Concli et al. [18] assessed both high- and low-cycle fatigue behaviours and observed crack nucleation primarily near the surface, attributed to surface characteristics or defects.
Variations in the chemical composition of powders used in PBF-LB/M significantly influence mechanical properties because chemical composition directly affects material microstructure and mechanical response. Blinn et al. [19] demonstrated that even slight differences in chemical composition can result in notable variations in both static and fatigue performance of PBF-LB/M SS316L samples. PBF-LB/M processing conditions involve thermal gradients and complex thermal histories. These conditions create anisotropic grain structures that significantly affect mechanical properties due to directional dependency in grain alignment affecting load-bearing capabilities. Kong et al. [20] conducted uniaxial compressive tests on bulk and lattice PBF-LB/M SS316L samples. They reported reduced compressive strength in the build direction due to the orientation of elongated grains. Marattukalam et al. [21] investigated different laser scanning strategies and found that crystallographic texture significantly affects hardness, Young’s modulus, and ultimate tensile strength. Dixit et al. [22] examined the influence of sample orientation during printing (X, Y, XY45°, Z, ZX45°). They observed distinct crystallographic textures across orientations, with the XY45° orientation exhibiting the highest tensile strength due to the predominance of <111> grain orientation.
Fatigue behaviour of 316L stainless steel is influenced by phase transformations occurring under cyclic loading. Although classified as fully austenitic with generally favourable mechanical properties, 316L can undergo martensitic transformations during cyclic loading. These transformations, particularly at grain boundaries, lead to increased brittleness and potential sites for fatigue initiation, thus influencing implant reliability. Ganesh et al. [23] observed strain-induced martensite on fracture surfaces in laser-deposited 316L tested via single edge notch bending. Their findings confirmed that martensitic transformation significantly contributes to fracture behaviour. Previous studies on fatigue in PBF-LB/M SS316L typically focused on high-cycle (elastic regime) or low-cycle (plastic regime) fatigue conditions, or occasionally both. Evaluating both regimes is important to fully understand implant performance under various loading conditions. For example, Jaskari et al. [24] studied high-cycle bending fatigue in samples with varying porosity levels to evaluate fatigue performance under elastic loading conditions. Chen et al. [25] evaluated low-cycle fatigue under combined mechanical and thermal loads, providing valuable insights into fatigue behaviour within plastic deformation regimes.
However, clinical conditions frequently subject orthopaedic implants to complex mechanical loads that induce deformation spanning both elastic and early plastic regimes. Realistic scenarios such as sudden impacts, accidental falls, or vigorous activities routinely cause implants to experience slight plastic deformation beyond the elastic limit. Winwood et al. [26] highlighted the importance of understanding fatigue behaviour within this elastic-to-early plastic transition, where fatigue damage commonly initiates. Thus, investigating fatigue across elastic and early plastic regimes is critical for realistic implant evaluation. This study employs four-point bending tests, supported by microstructural and porosity analyses, to examine fatigue initiation and crack propagation in high-aspect-ratio PBF-LB/M SS316L samples under clinically relevant loading conditions.

2. Materials and Methods

2.1. Raw Materials and PBF-LB/M Printing

Spherical stainless steel (SS316L) powder (SLM Solutions, Luebeck, Germany) was used as the base material. Particle size analysis was conducted using a Malvern Morphologi 4 particle analyser (Version 10.32) (Malvern Panalytical, Malvern, UK), resulting in a volume-based median particle size (D50) of 30.1 μm, with D10 and D90 values of 19.6 μm and 46.1 μm, respectively. The particle size distribution is presented in Figure 1. Before fabrication, the powder was dried at 80 °C for 24 h to reduce moisture content to approximately 5.4%. High-aspect-ratio samples (100 mm × 20 mm × 3.5 mm) were printed using an SLM 125HL system (SLM Solutions, Germany), equipped with a continuous fibre laser (wavelength: 1070 nm). Optimised printing parameters and scanning strategies previously developed by the authors [27] were employed to produce samples with densities exceeding 99%. The rectangular sample geometry was selected to simulate the shape and dimensions typical of bone plates.

2.2. Sample Preparation

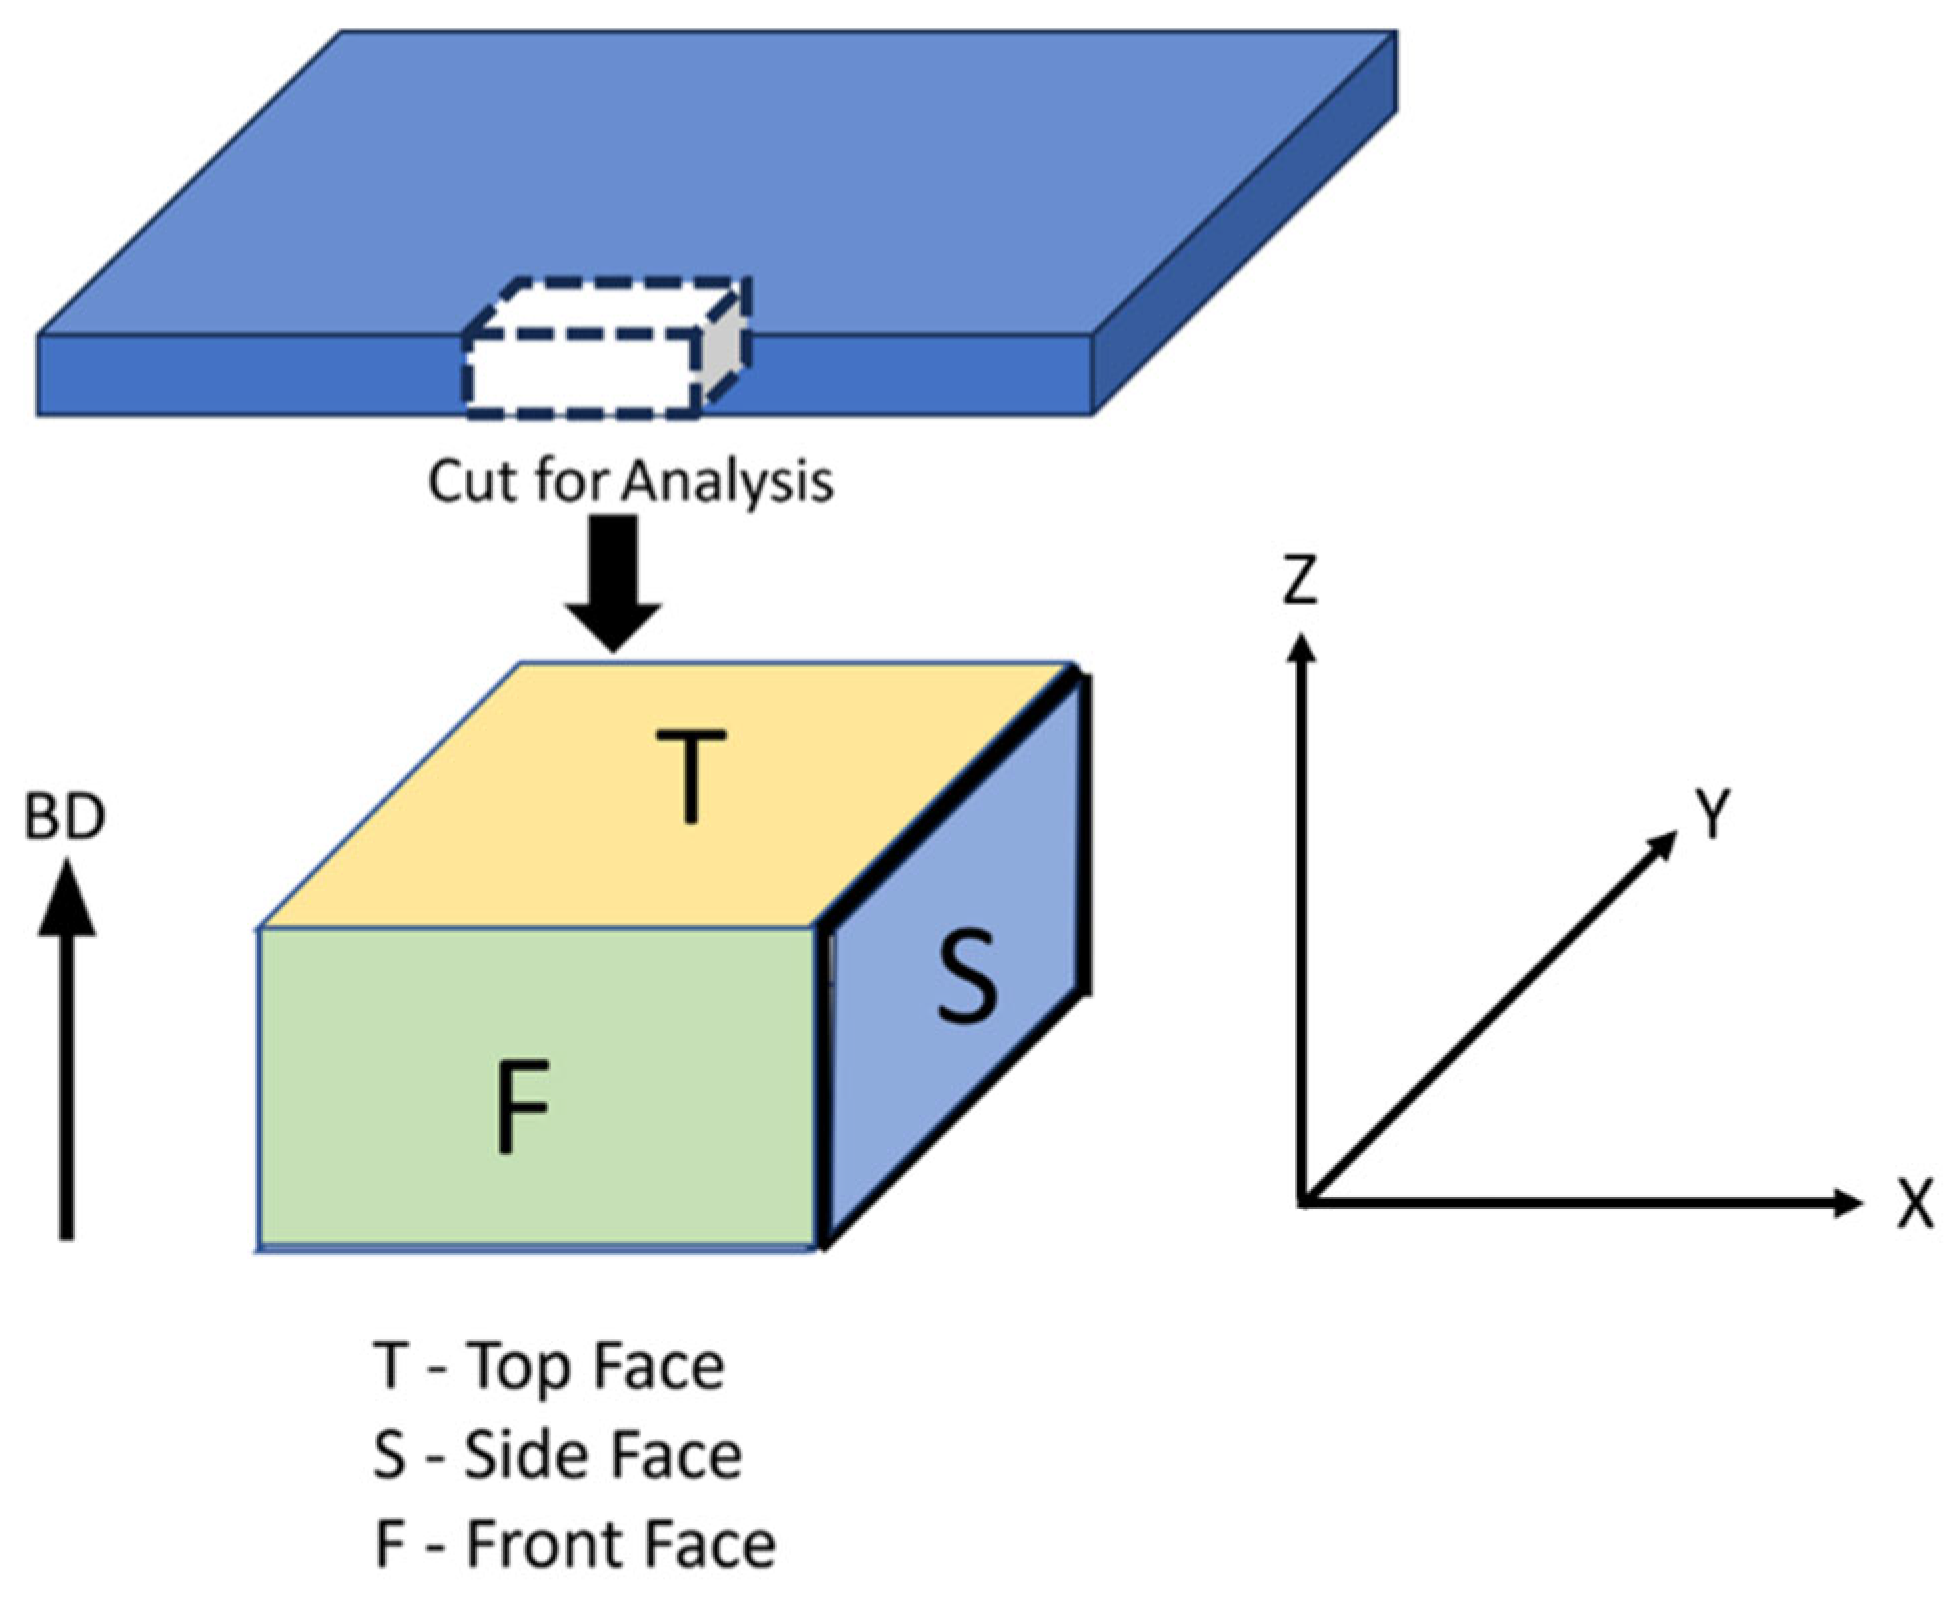
A representative portion of the printed samples was sectioned to expose three distinct faces: top, front, and side (Figure 2). Each face was individually analysed to evaluate orientation-dependent features. After sectioning, samples were hot-mounted in acrylic resin and polished using a Buehler Double Head Polisher (Buehler, Bluff, IL, USA). Polishing involved sequential grinding with silicon carbide abrasive papers (P320, P400, P600, P800, and P1200 grit), followed by diamond polishing suspensions of progressively finer particle sizes (9 µm, 3 µm, and 1 µm) to achieve a mirror-like finish suitable for microscopy. The polished samples were then chemically etched with aqua regia (12% hydrochloric acid, 28% nitric acid, 60% distilled water) for 5 min to clearly reveal grain boundaries. Finally, samples were gently rinsed with distilled water and carefully cleaned using cotton swabs to avoid surface damage.

2.3. Microstructural and Elemental Characterisation (OM, SEM, and EDX)

2.3.1. Optical Microscopy (OM)

Optical microscopy (OM) was utilised to examine melt pool morphology on the top, front, and side faces of the samples. Micrographs were captured at magnifications of 100×, 200×, and 400× to identify differences in melt pool geometry indicative of variations in thermal conditions and porosity distribution. Qualitative analysis concentrated on distinguishing melt pool shapes, grain structure features, and larger porosity defects. Due to OM resolution constraints, detailed grain structure analysis was subsequently conducted via SEM. Quantitative measurements of melt pool depth were conducted following ASTM E112-13 [28]. Melt pool depths and porosity analyses were carried out using ImageJ software (Version 1.54d) on micrographs captured at 100× magnification. A total of 18 pores were identified in 7 analysed micrographs. These pores were within the resolution limits of OM and clearly distinguishable from other microstructural features or potential contamination. Within ImageJ, the micrographs were set to 8-bit and manually thresholded using a threshold value that allowed the binary image to accurately represent the morphology of the pore. The “Analyse Particles” function provided the shape descriptors for each pore. Pores with an area below 15 µm2 were omitted from the analysis as they were difficult to distinguish from other microstructural features.
Porosity was classified by measuring circularity, aspect ratio, and Feret diameter of individual pores. Each pore was categorised as either gas porosity or laser-induced porosity based on established shape descriptors from existing literature [29,30]. Gas pores were defined as having high circularity (>0.7), low aspect ratios (1–1.3), and smaller Feret diameters, indicating spherical shapes arising from gas entrapment. Laser-induced pores exhibited larger variations in shape descriptors, with low-to-moderate circularity (<0.7), moderate-to-high aspect ratios (1.5–12.2), and larger Feret diameters due to the formation mechanisms of the pores. The laser-induced porosity category includes both types of irregular pore—lack-of-fusion and keyhole porosity. They have been grouped together as they share morphological characteristics that may impact fatigue response—larger size and irregularly shaped with sharp corners and edges, facilitating a heightened stress concentration effect. Of the 18 pores analysed, 8 were identified to be gas porosities, with the remaining 10 falling into the laser-induced pore category. Average values of these descriptors were calculated for each porosity type.

2.3.2. SEM and EDX

High-resolution microstructural characterisation was performed using a Tescan VEGA3 Scanning Electron Microscope (SEM, Tescan, Brno, Czech Republic). SEM imaging was conducted at magnifications ranging from 10,000× to 14,000× to analyse microporosity across the different sample faces. Additionally, energy-dispersive X-ray spectroscopy (EDX) was conducted to confirm the elemental composition, emphasising the key alloying elements (Fe, Cr, Ni, Mn, C, and O) present in the printed samples. The standard error (SE) reported in the EDX elemental analysis was calculated based on the average of more than 10 individual measurements (n > 10) taken from each sample face.

2.4. Crystallographic Structure and Phase Analysis (XRD and EBSD)

X-ray diffraction (XRD) analysis was performed using a Rigaku SmartLab X-ray Diffractometer (Rigaku, Tokyo, Japan) with Cu Kα radiation (λ = 1.5406 Å) operated at 45 kV and 200 mA. XRD scans were conducted at a speed of 2°/min, covering a 2θ diffraction angle range from 20° to 80°, to verify the crystalline phases and confirm the face-centred cubic (FCC) structure characteristic of austenitic stainless steel. Electron backscatter diffraction (EBSD, Oxford Instruments, Abingdon, UK) analysis was conducted at an accelerating voltage of 20 kV with a specimen tilt angle of 70° to characterise crystallographic orientations and grain structures on the top, front, and side faces of the PBF-LB/M samples. Euler orientation maps, inverse pole figure (IPF) maps, and phase distributions were generated. Data collection was performed at approximately 40 Hz with a hit rate exceeding 98% for all faces. Crystallographic orientations were defined using the Bunge rotation convention.

2.5. Four-Point Bending Tests and Fatigue Testing

2.5.1. Sample Preparation and Geometry

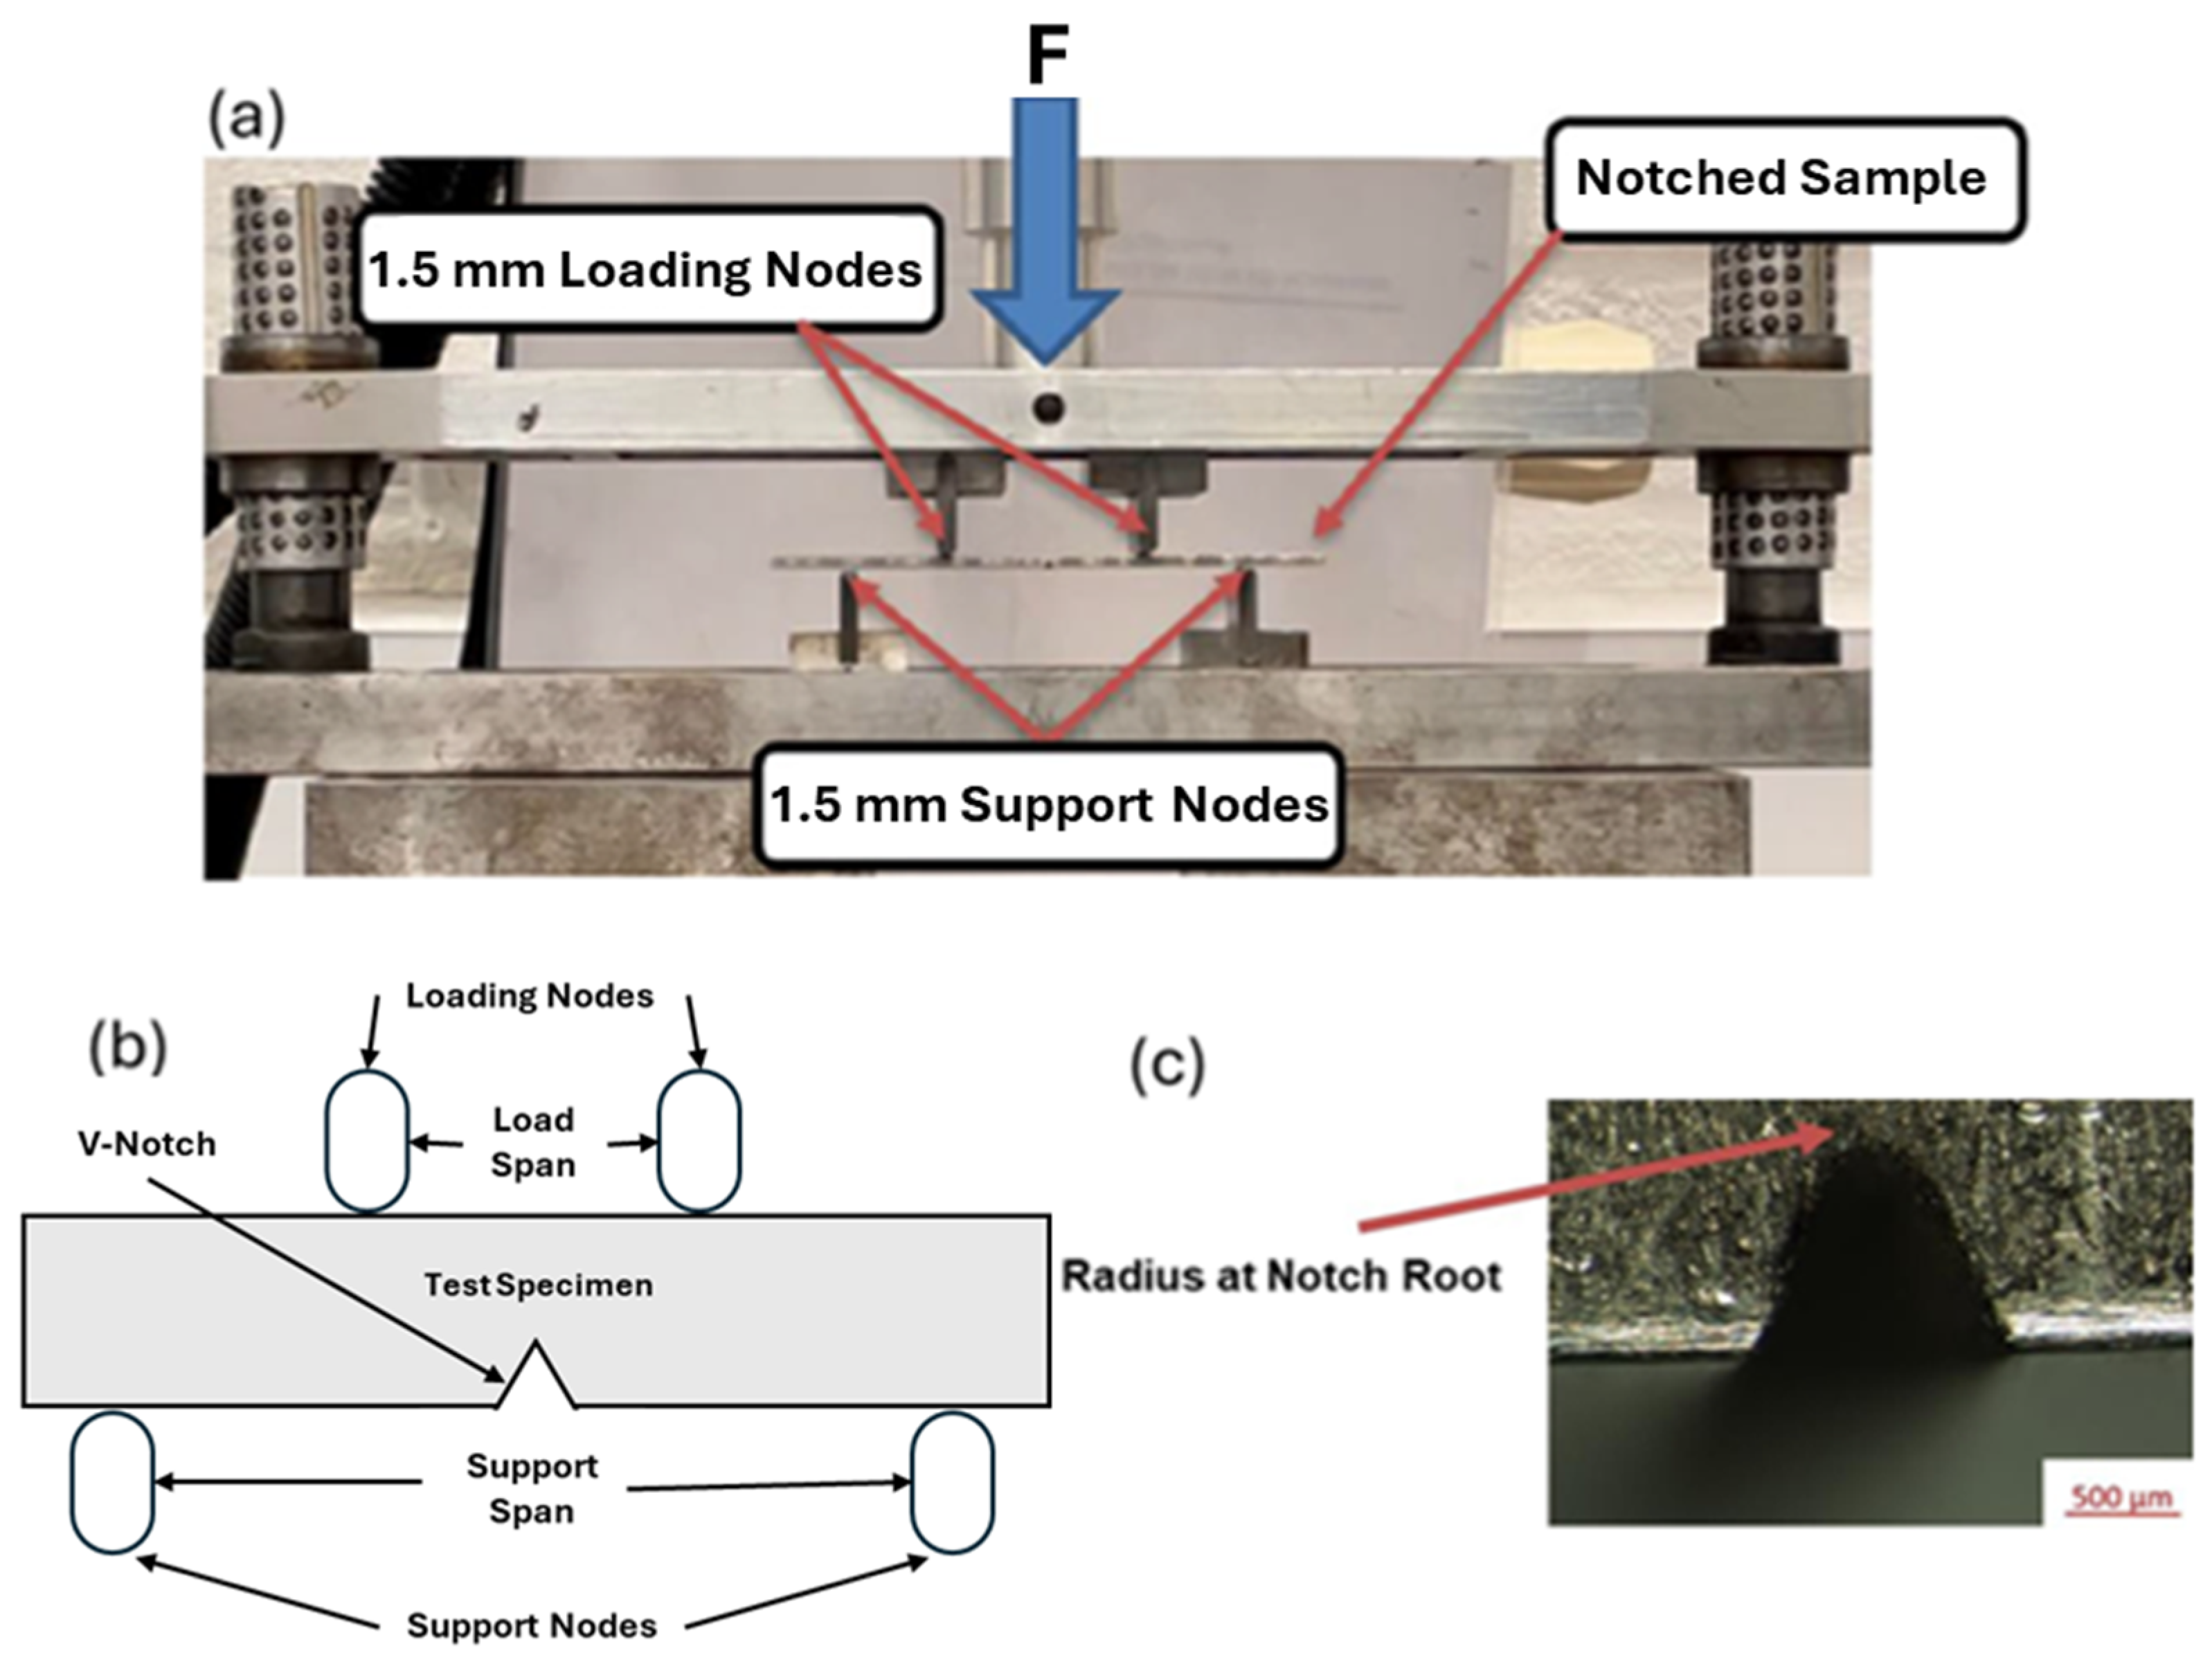
Single-edge notched bend (SENB) specimens of PBF-LB/M SS316L were used for quasi-static bending and fatigue tests. A four-point bend test was selected to simulate a bone plate fracture fixation, as a tibia fracture fixation was shown to be subject to bending loads imparting simultaneous tensile and compressive stresses [31]. A V-notch was introduced via Electrical Discharge Machining (EDM) wire cutting following ISO 12108 [32] guidelines to localise crack initiation and facilitate crack monitoring.
Figure 3a,b illustrate the four-point bending test setup, loading and support node arrangement, and SENB specimen geometry. Figure 3c provides details of the V-notch geometry, which has a notch width and depth of 1 mm. Due to inherent surface roughness from the PBF-LB/M printing process, samples were initially printed oversized (3.5 mm thick) and machined down to a final thickness of 2 mm using EDM wire cutting, resulting in a final geometry of approximately 82 mm × 20 mm × 2 mm.

2.5.2. Quasi-Static Four-Point Bending Tests

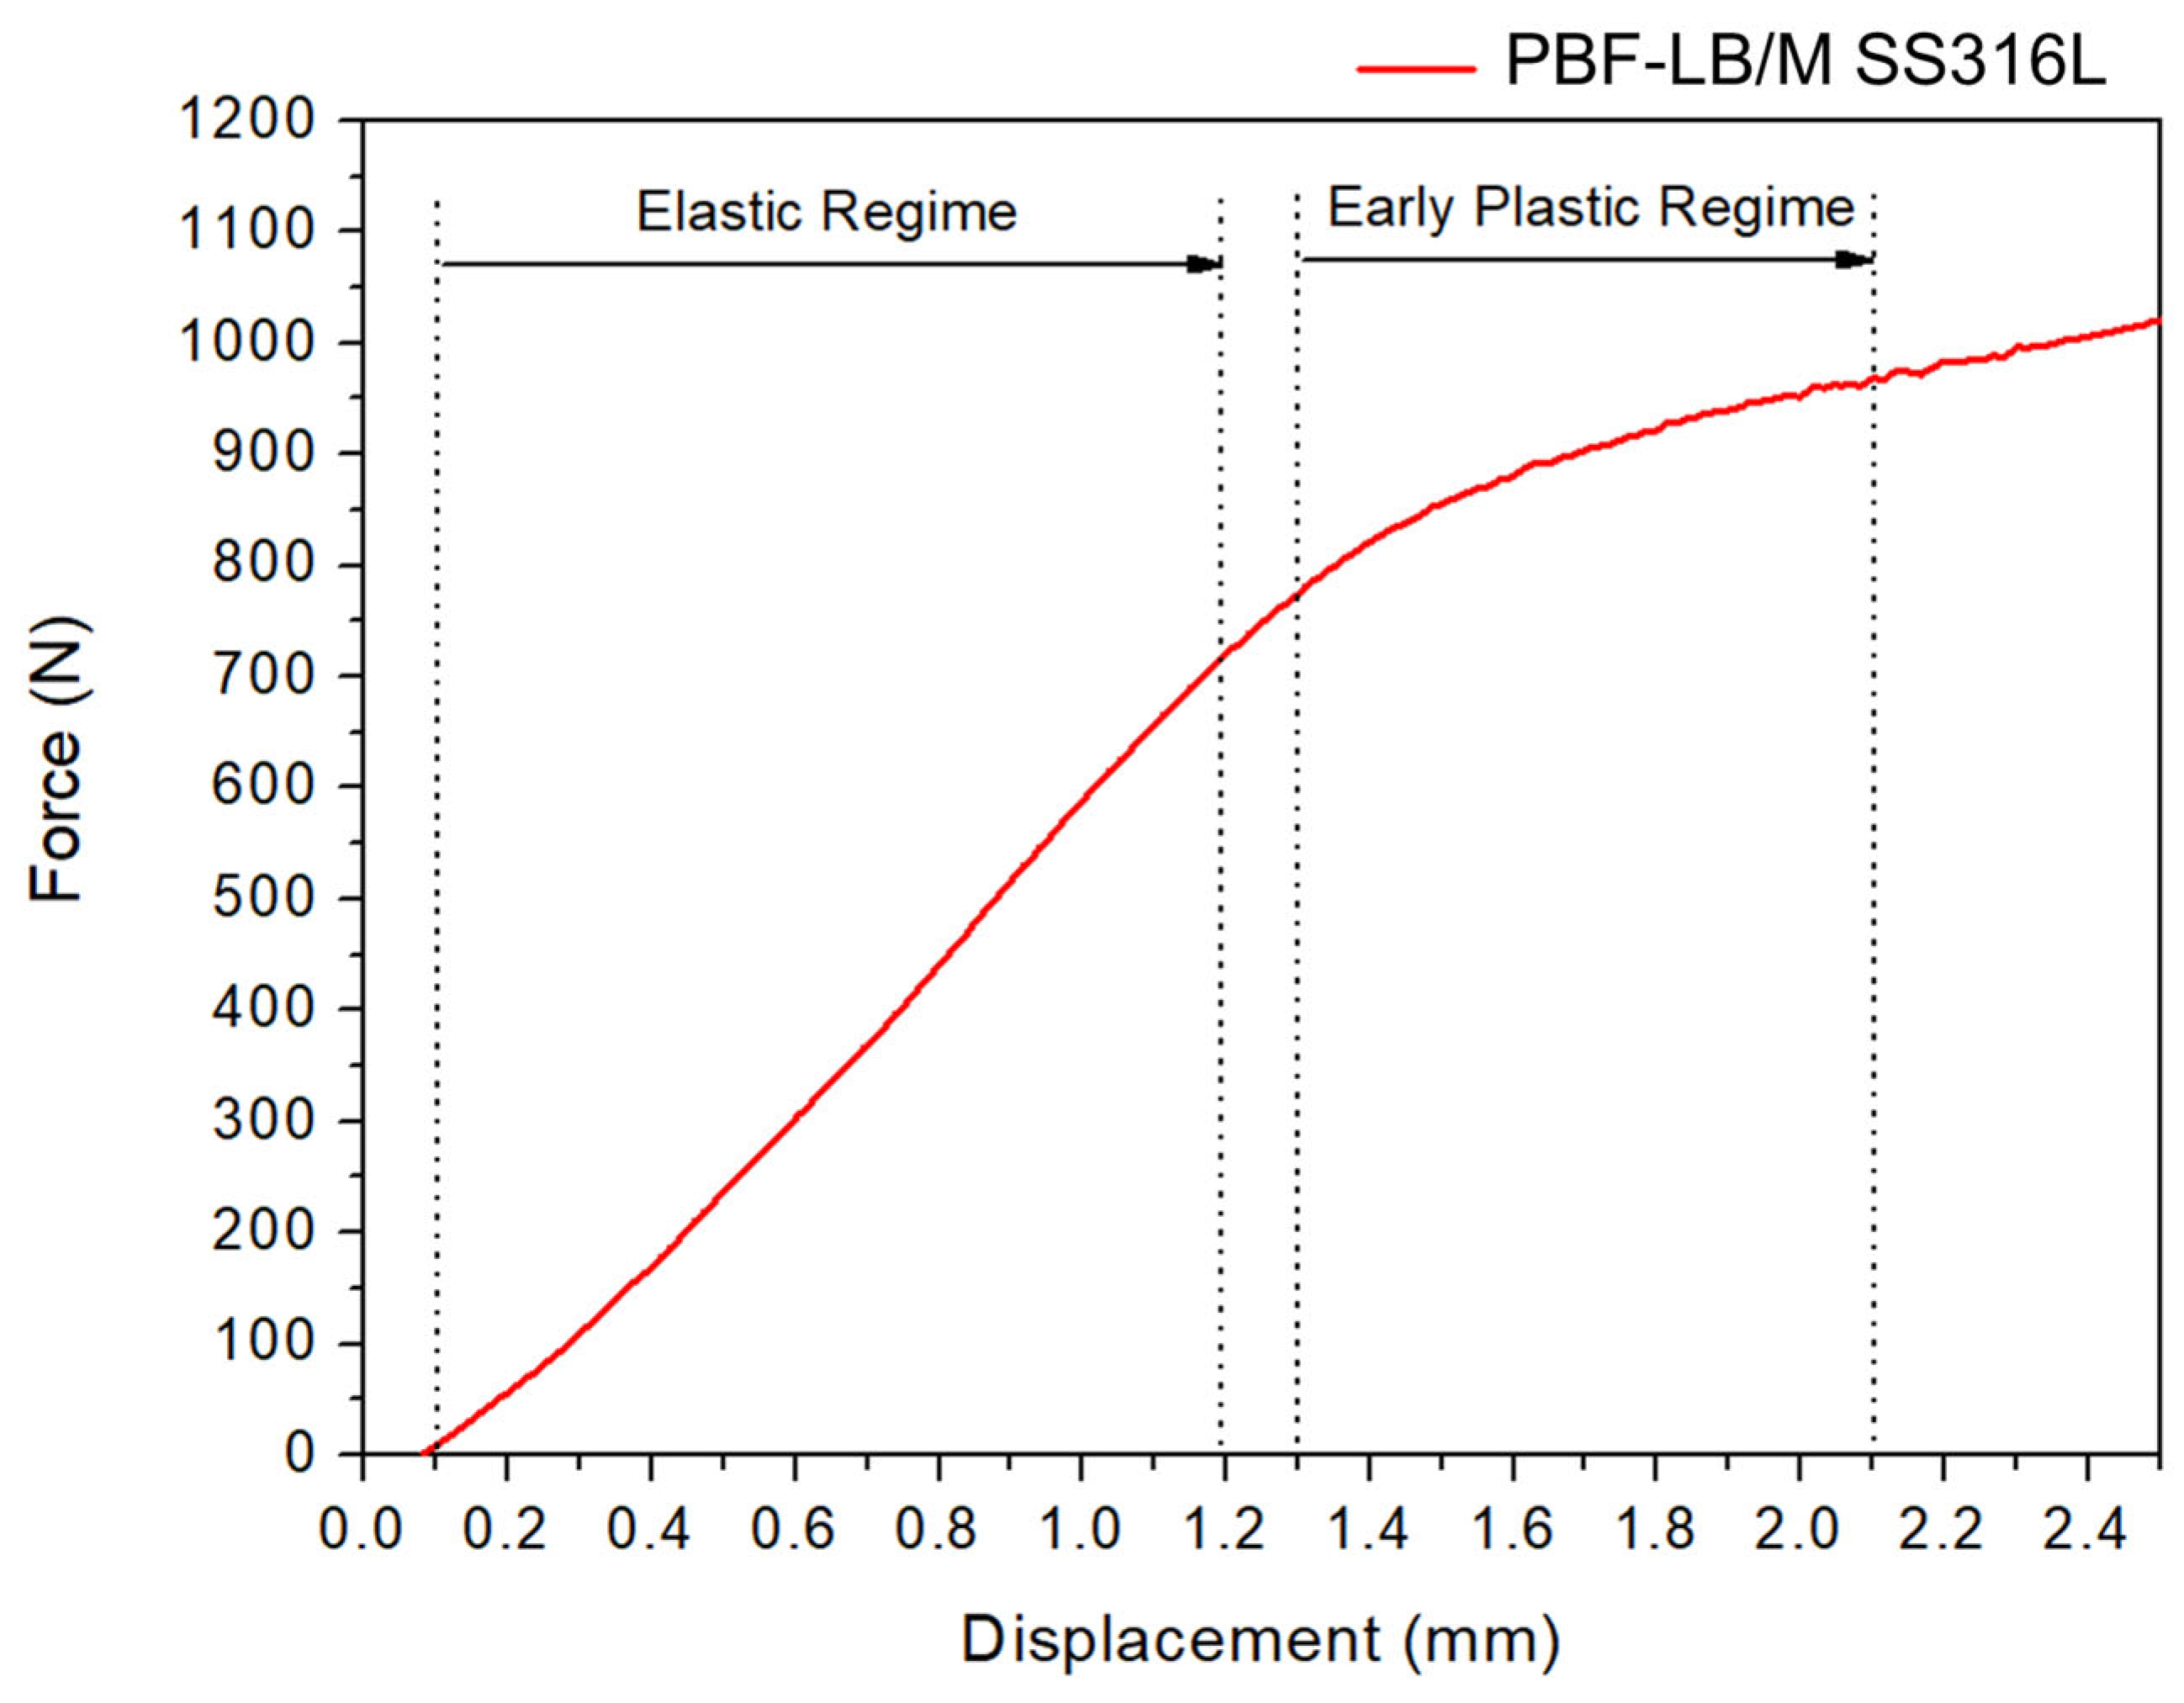
Quasi-static four-point bending tests were performed to determine the elastic and early plastic deformation regimes used for fatigue testing. Tests were carried out using an Instron test frame at a loading rate of 45 mm/min. Load and displacement data were continuously recorded at intervals of 0.01 s. Elastic and early plastic deformation regimes were defined from the recorded load–displacement data, as illustrated in Figure 4. Note that the displacement offset observed at approximately 0.1 mm resulted from initial preloading to ensure consistent sample–fixture contact before testing.

2.5.3. Fatigue Testing Parameters

Displacement-controlled fatigue tests were conducted using elastic and early plastic deformation regimes derived from quasi-static tests. Elastic-regime tests employed displacement cycles of 0.1–1.2 mm, cycling within the elastic region of the quasi-static test, while early-plastic-regime tests were cycled from 1.3 to 2.1 mm, cycling within the early plastic region of the quasi-static test. In displacement-controlled fatigue testing, the stress ratio (R) constantly changes as the sample deforms under successive cycles. In this case, the initial stress ratios are presented. For the elastic regime, initially R = 0.01 and for the early plastic regime, initially R = 0.8. Frequencies of 5 Hz, 10 Hz, 15 Hz, and 20 Hz were evaluated; a frequency of 10 Hz was identified as optimal for accurate displacement control and efficient test duration. Fatigue tests were performed on an Instron servo-hydraulic fatigue testing machine at room temperature and ambient humidity. Peak load and displacement values for each fatigue cycle were recorded. A minimum of three samples were tested for each condition (elastic and early plastic regimes) to ensure reliability.

2.5.4. Real Time Crack Monitoring

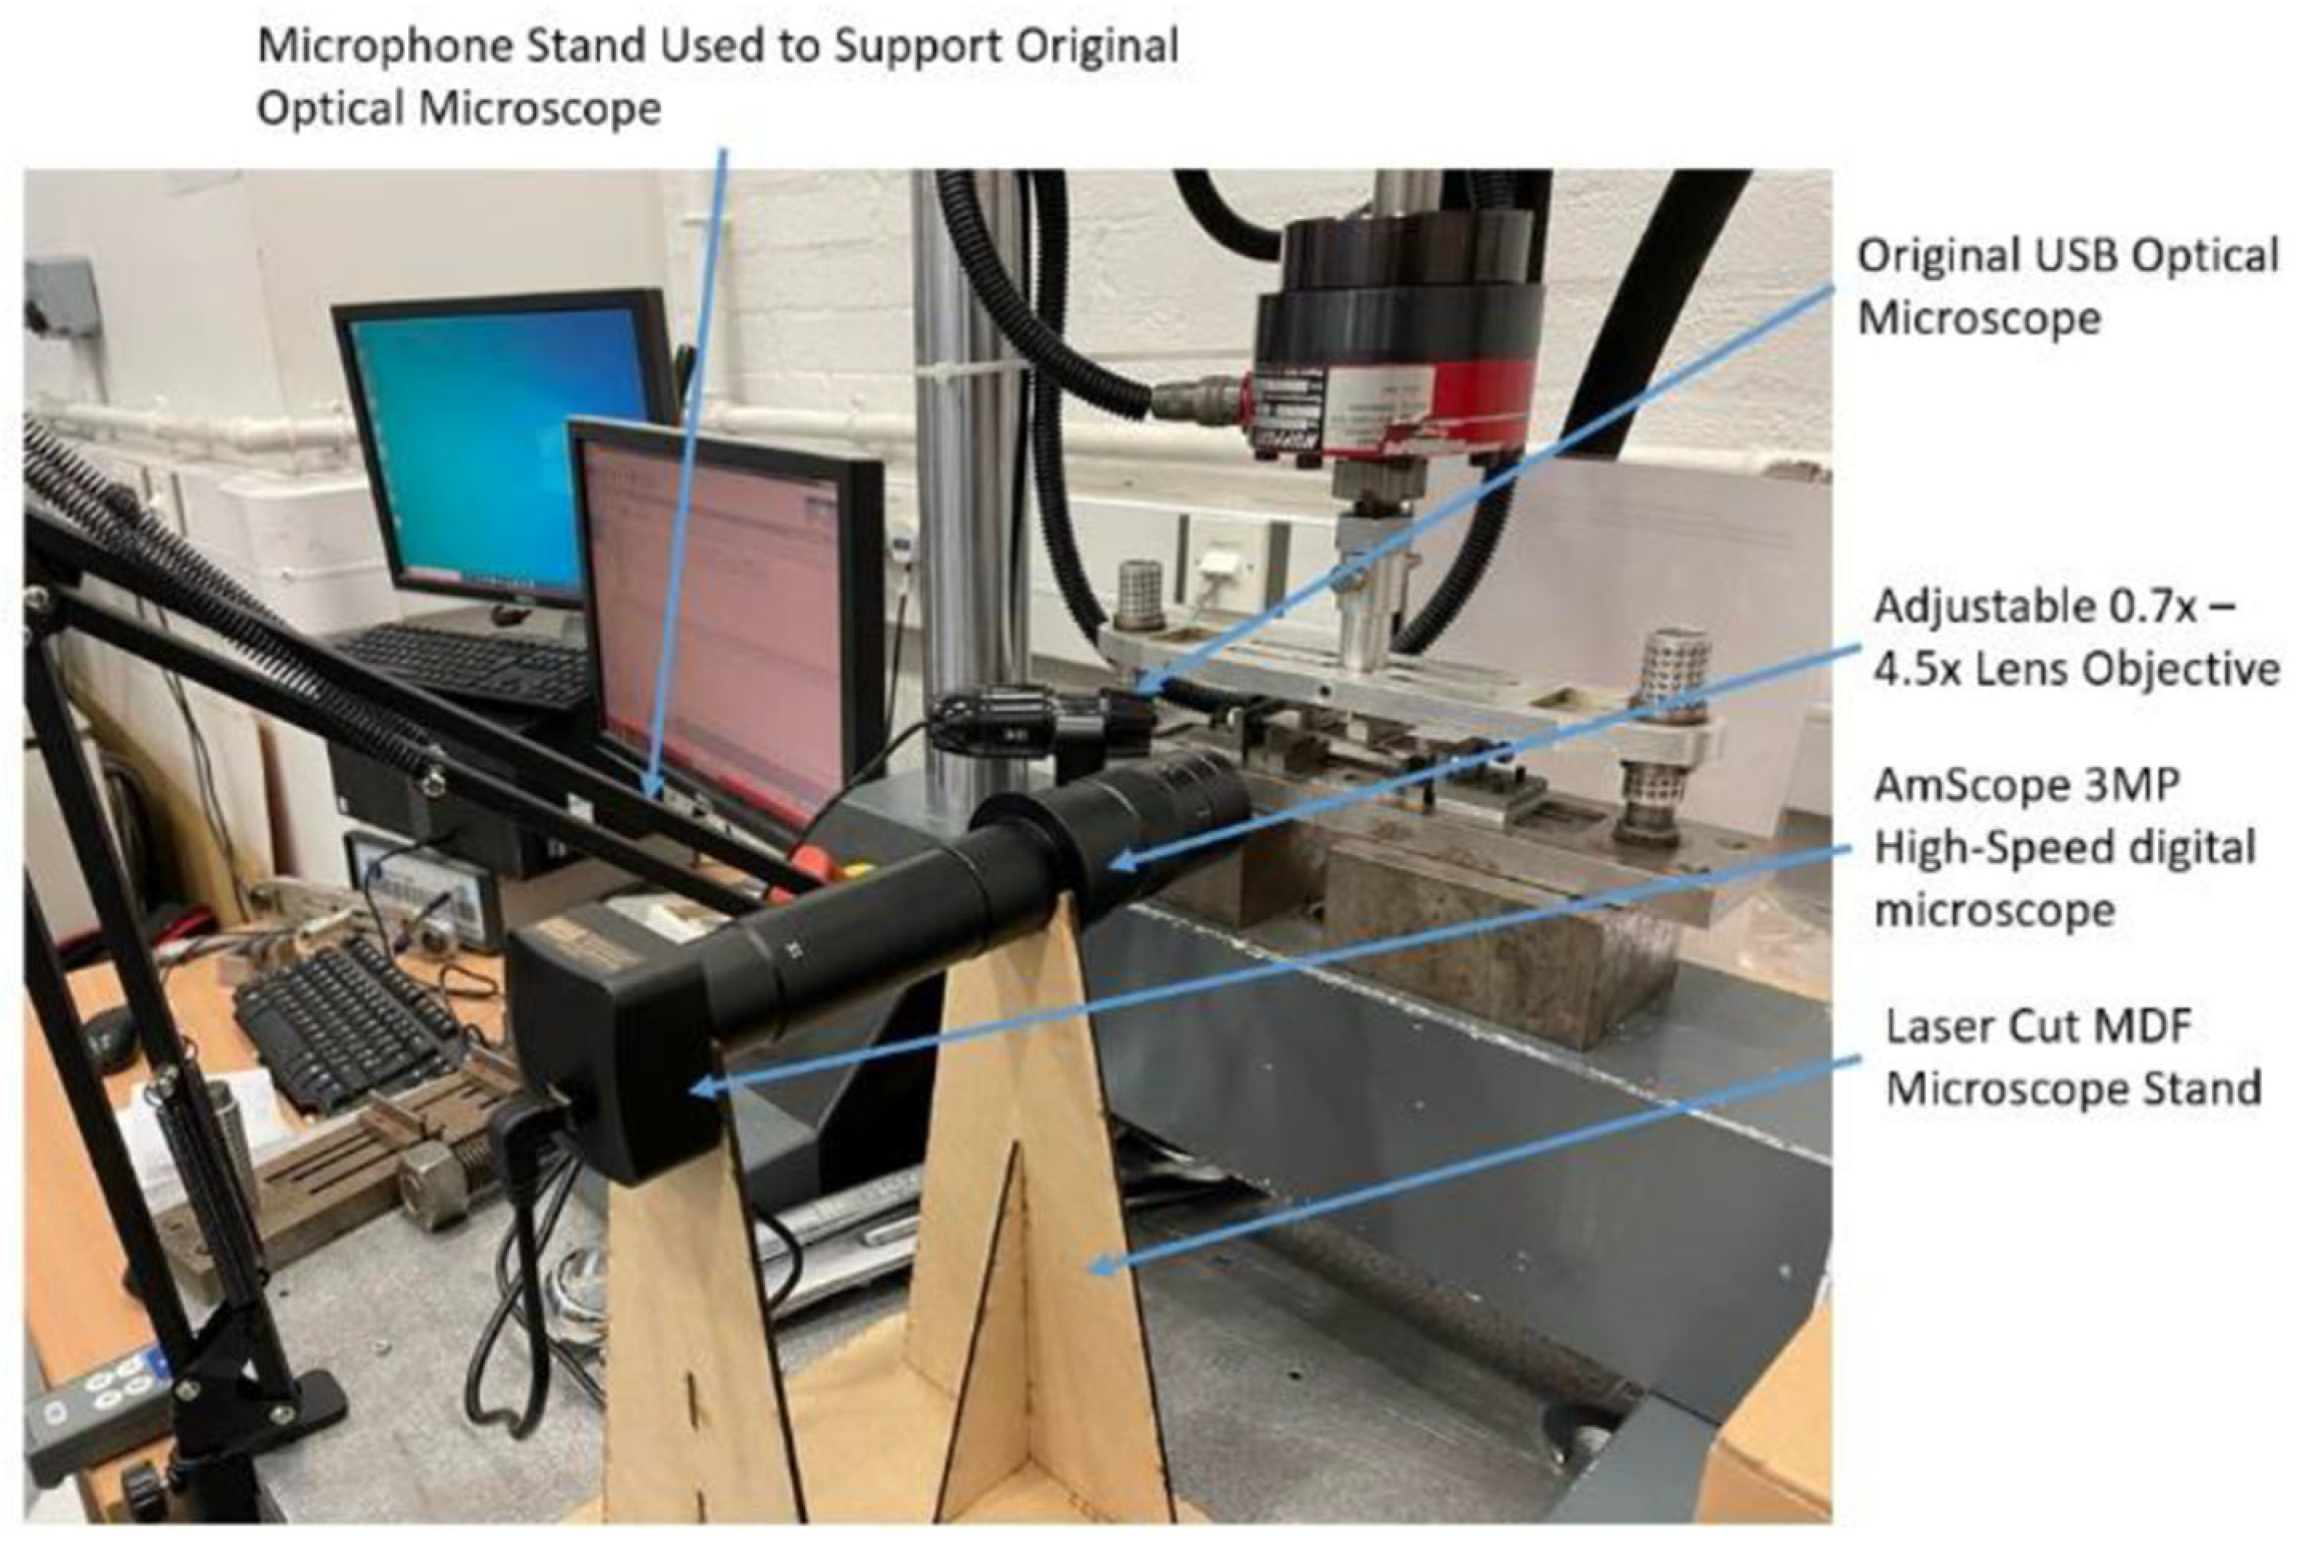
Real-time monitoring of crack initiation and propagation was performed using an AmScope 3MP High-Speed digital microscope (AmScope, Irvine, CA, USA). The experimental arrangement used for real-time crack monitoring is illustrated in Figure 5. Due to challenges in obtaining continuous high-quality images, tests were periodically paused to manually capture detailed images of crack progression. Tests automatically terminated either upon specimen fracture or after completing 1 million cycles. Post-testing fracture surface morphologies and crack paths were examined via SEM, as detailed in Section 2.5.5.

2.5.5. SEM Fractography Analysis

Fracture surfaces of samples tested under elastic and early plastic fatigue conditions were analysed using SEM. Low-magnification images (50×) were first taken to identify crack initiation points, propagation paths, and final fracture zones. High-magnification images (1000×) were then captured to closely examine specific fracture features, such as fatigue striations, ductile fracture characteristics, and defects influencing crack growth.

3. Results

3.1. OM Melt Pool Morphology and Measurements

Analysis of OM images for the PBF-LB/M samples showed distinct variations in melt pool characteristics on the top, front, and side faces. The top face exhibited a “chessboard” morphology with visible laser scan paths (Figure 6a), characterised by discontinuities along scan tracks, limited overlap, and clear scanning patterns. Gas porosity was also observed. In contrast, the side and front faces displayed a “fish-scale” morphology, presenting cross-sectional views of vertically aligned melt pools (Figure 6b,c). These faces showed continuous melt pool boundaries with minimal porosity. Columnar grains aligned parallel to the build direction were distinctly visible on the front face (Figure 6b). The fish-scale morphology appeared more defined and organised on the front face, while the side face displayed elongated melt pools interspersed with fish-scale features.
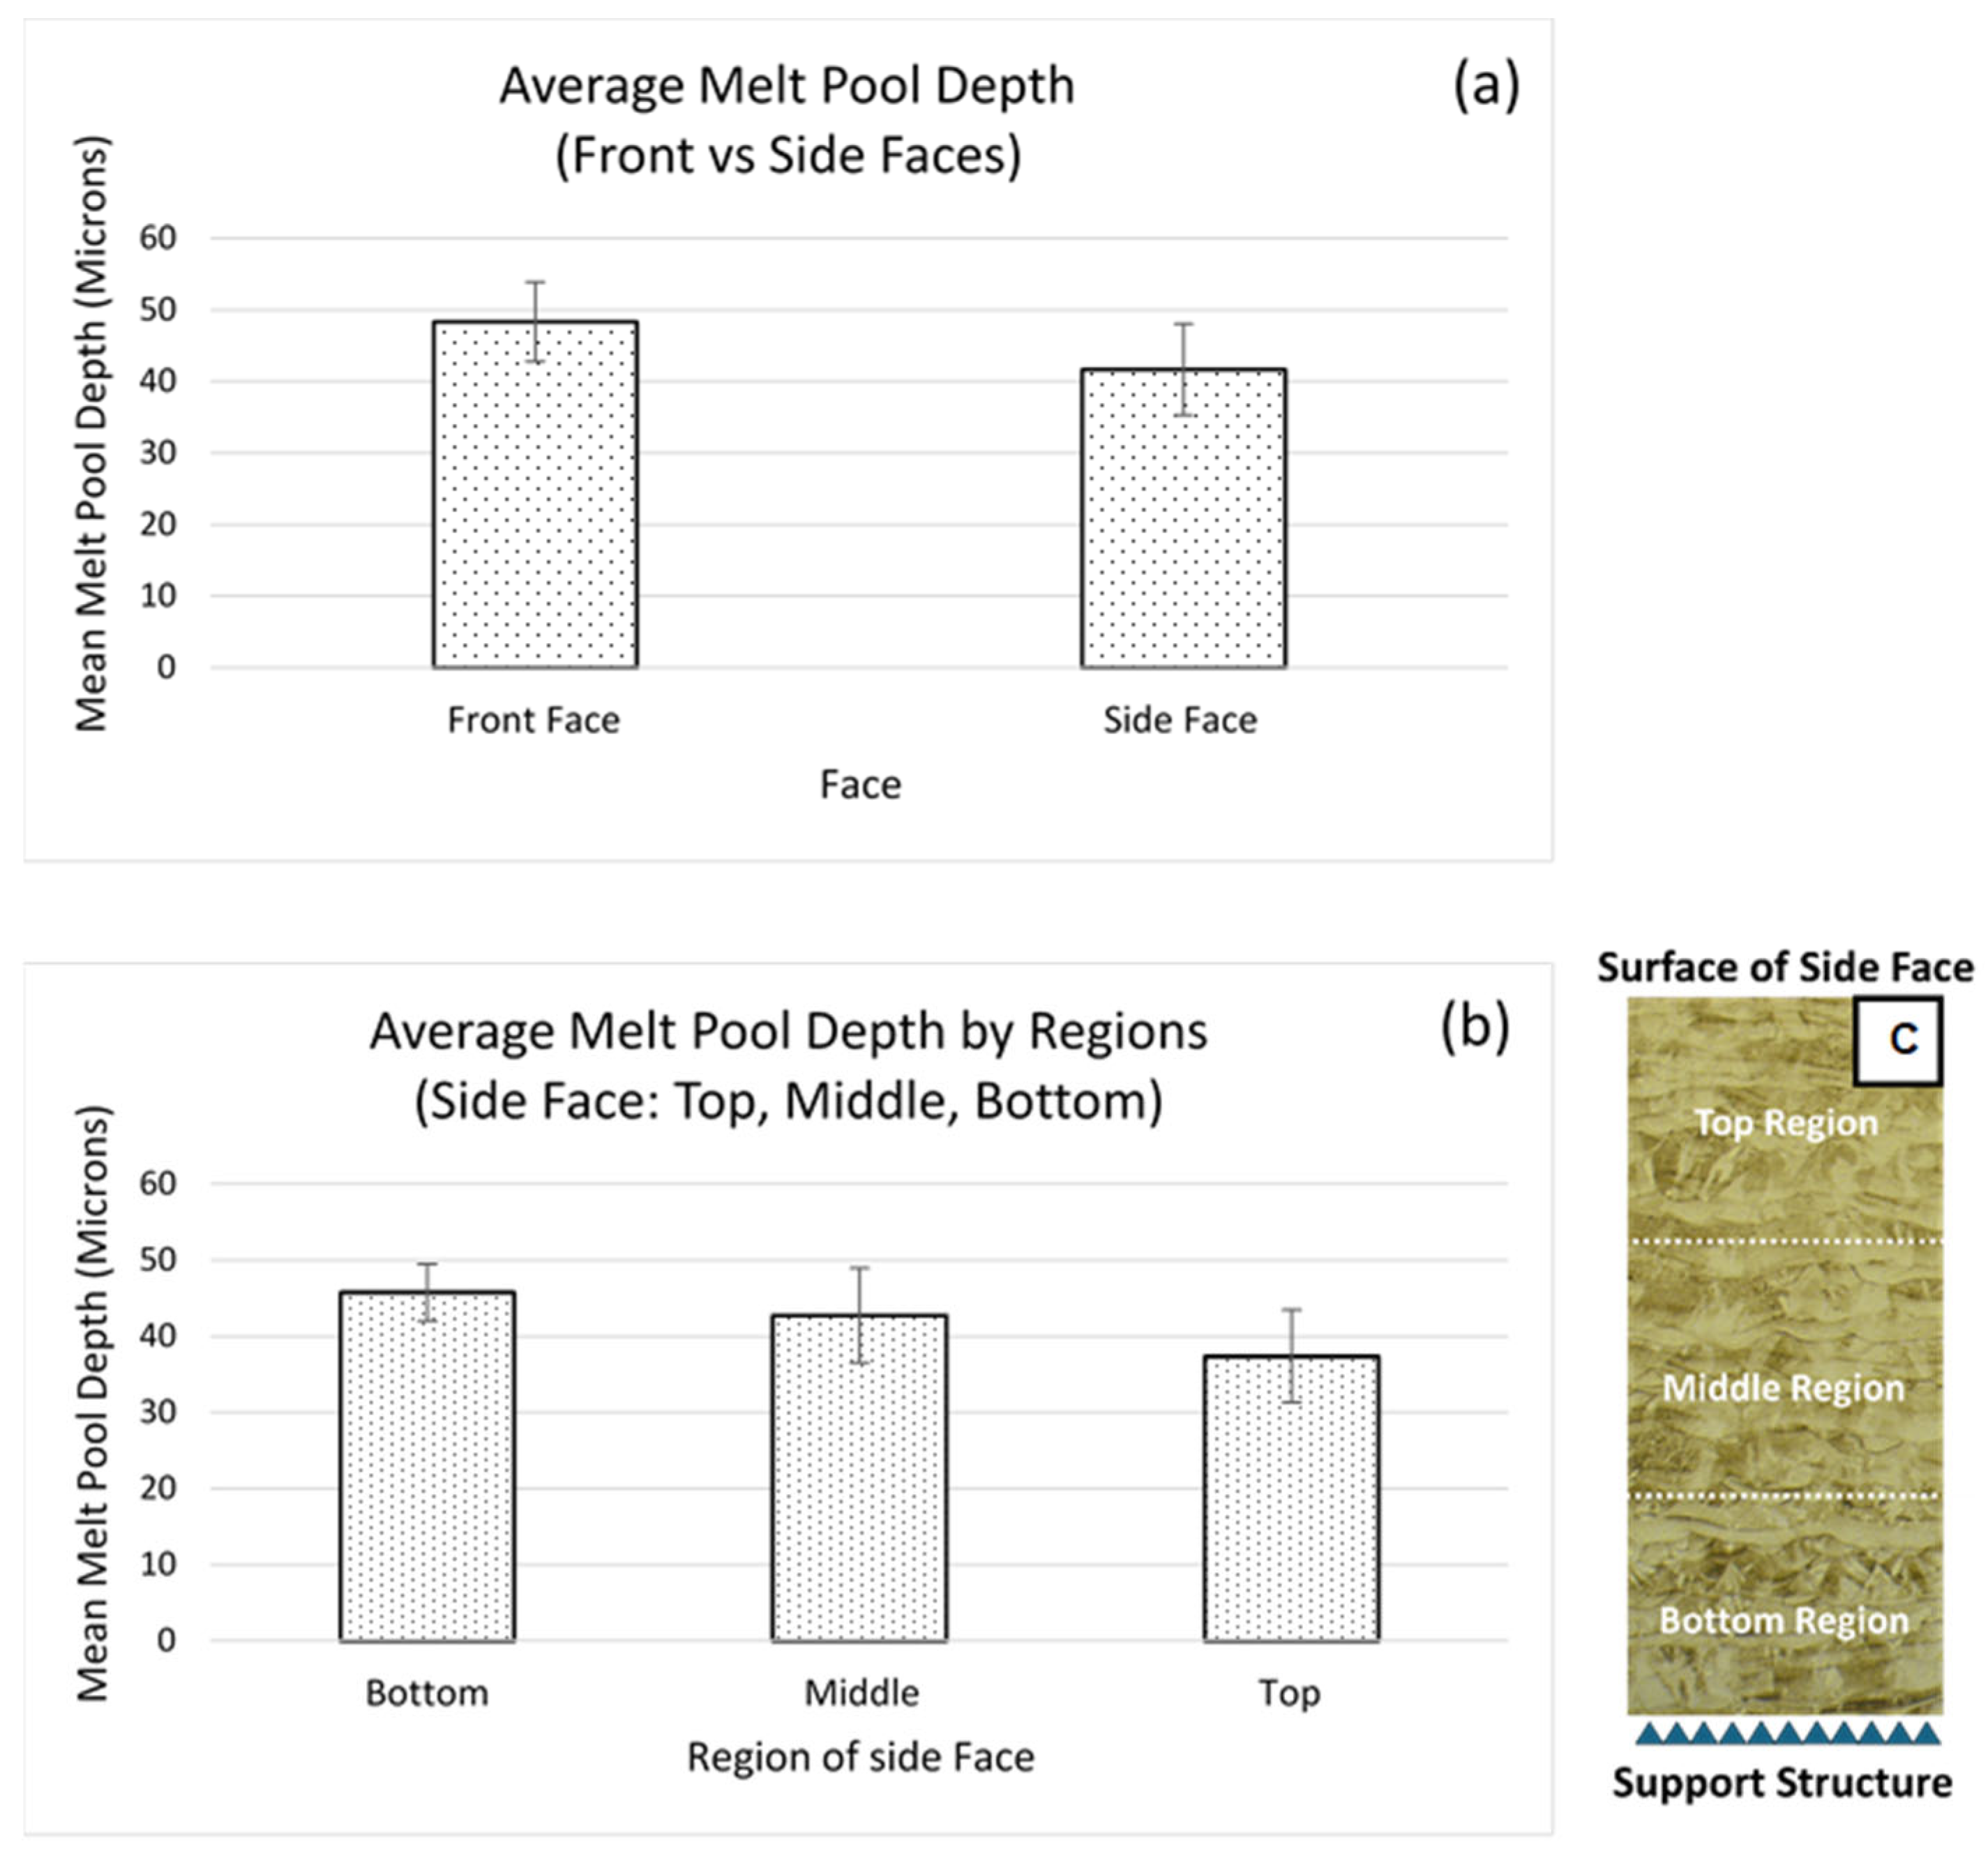
Quantitative analysis results of melt pool depth are summarised in Figure 7. Depth measurements were assessed on the side and front faces due to clear cross-sectional visibility. Depth measurements on the front face included 121 intercepts, resulting in an average depth of 48 µm ± 5.6 µm (Figure 7a). On the side face, 234 intercepts were measured across the bottom (71 intercepts), middle (76 intercepts), and top (87 intercepts) regions, averaging 41 µm ± 6.4 µm (Figure 7b). Figure 7b shows a linear correlation between melt pool depth and distance from the build plate. Figure 7c provides a visual reference for the specific regions (bottom, middle, top) used in these measurements on the side face. The deepest melt pools were found at the bottom region near the support structure, which had lower variability. These findings align with observations by Leary et al. [33], suggesting enhanced heat dissipation facilitated using a support structure. The average melt pool depth on the front face was 14% larger than on the side face, indicating distinct melt pool formation dynamics between these faces. Additionally, the front face exhibited lower variability (±5.6 µm) compared to the side face (±6.4 µm), reflecting more uniform melt pool formation.

3.2. OM Porosity Morphology and Quantification

3.2.1. Porosity Morphology and Distribution

Following the evaluation of microstructural attributes, the next step is to examine defects identified within the samples. Understanding defect types within the sample assists in assessing the fatigue behaviour of specimens. The analysis of porosity focuses on morphology, position, and distribution of pores. OM images indicate significant densification on all faces. However, defects persist on each face. Pores smaller than 15 µm2 were excluded from the analysis, as they were difficult to categorise and distinguish from darker regions related to microstructure or melt pool boundaries. Figure 8 displays OM images of sample faces, each showing different degrees of porosity. On the top face (Figure 8a), numerous pores of varying sizes and shapes were identified. Energy-induced pores, indicated by dashed red arrows, are predominantly located at melt pool edges and exhibit irregular shapes. Gas pores, marked with solid blue arrows, were observed within melt pools and exhibit higher circularity.
The front face (Figure 8b, 400× magnification) showed near-total densification, with only one gas pore detected (solid blue arrow). The front face image required higher magnification (400×) due to minimal porosity, enabling clearer visual identification of defects. The side face (Figure 8c) exhibited a more complex porosity pattern. Gas porosities (solid blue arrows) within melt pools showed high circularity and smaller Feret diameters. Irregularly shaped energy-induced pores (dashed red arrows), located at melt pool edges, were elongated and related to fluctuations in energy input. The distribution and morphology of porosity indicate that despite high densification, process-related defects remain, potentially affecting mechanical properties and fatigue resistance.

3.2.2. Quantitative Analysis of Pore Shape Descriptors

In a comprehensive analysis of pore characteristics, several key shape descriptors, including Feret diameter, circularity, aspect ratio, and √Area, were evaluated to identify correlations critical for understanding defect morphology. Each plot in Figure 9 includes a trend line and corresponding equation with an R2 value indicating the strength of the correlation.
Certain parameter relationships, such as Feret diameter versus aspect ratio, √Area versus aspect ratio, and circularity versus √Area, showed negligible statistical significance, with R2 values under 0.35. In contrast, moderate correlations were observed for circularity versus Feret diameter (Figure 9a) and circularity versus aspect ratio (Figure 9b), exhibiting R2 values of 0.63 and 0.52, respectively. The negative correlation in Figure 9a indicates larger pores typically have lower circularity, suggesting they are more irregularly shaped. Similarly, the negative correlation in Figure 9b implies that pores with higher circularity have lower aspect ratios, further confirming their rounded morphology.
Additionally, a strong positive correlation (R2 = 0.82) was identified between √Area and Feret diameter (Figure 9c), confirming the intuitive relationship between pore size and linear measurements. Although general trends were identified, five individual pores with similar sizes (Feret diameters ranging from 34 to 37 µm) exhibited substantial differences in other shape descriptors. Aspect ratios varied significantly from 1.6 to 12.3, circularity ranged widely from 0.15 to 0.52, and √Area varied between 8.5 and 22.6 µm. This substantial variation highlights the necessity of utilising multiple shape descriptors rather than relying solely on size when characterising pores. The multi-parameter approach provides a more accurate assessment of the potential impact of porosity on material fatigue performance.
Figure 10a–c present average values of key shape descriptors for each porosity type, validating classification criteria used in this study and quantifying typical pore morphologies. Gas porosities exhibit high circularity (>0.7), low aspect ratios (1–1.3), and the smallest Feret diameters (9.2 µm), aligning closely with descriptions from Wang et al. [29], confirming their spherical shape and small size. Conversely, laser-induced porosities exhibit low circularity (<0.45), significantly higher aspect ratios (3.91), and larger Feret diameters (32.6 µm), confirming their irregular morphology. Additionally, an analysis of defect locations revealed distinct distribution patterns: gas porosities were predominantly found within the melt pool boundaries, whereas laser-induced defects were commonly located along melt pool edges. This pattern is consistent with observations reported by Sanaei and Fatemi [34], further supporting established knowledge regarding porosity formation mechanisms in PBF-LB/M processes.

3.3. SEM Microstructure and Microporosity

SEM analysis provided detailed insights into the microstructural characteristics observed on different faces of the PBF-LB/M samples (Figure 11).
The top face (Figure 11a) exhibited substantial microporosity, mostly smaller than 1 µm, clearly concentrated at cellular boundaries. These micropores appear as distinct, dark voids located at interfaces between cellular structures, which are formed by rapid solidification due to constitutional supercooling and solute partitioning [35]. Melt pool boundaries were also visible but relatively indistinct. In contrast, the front face (Figure 11b) showed minimal microporosity and highly uniform, clearly defined cellular structures, suggesting improved local solidification. The side face (Figure 11c) presented moderately elongated cellular structures aligned with the build direction. Microporosity was observed here but appeared smaller and less extensive compared to the top face, again primarily concentrated along cellular boundaries. The SEM images confirm that microporosity is closely associated with cellular boundaries and reveal clear differences in cellular morphologies across different build orientations.

3.4. EDX Elemental Composition Analysis

EDX was conducted to determine the elemental composition of the PBF-LB/M samples. Table 1 presents the average composition (wt%) of the front, side, and top faces of the samples.
The primary constituents, such as Fe, Cr, and Ni, were consistent across all faces, indicating uniformity in the main alloying elements and conformance to typical compositional specifications for standard SS316L. However, EDX analysis has inherent limitations in accurately detecting and quantifying lighter elements, such as carbon and oxygen. Accurate determination of these elements would require specialised analytical methods (e.g., XPS), which are beyond the scope of this study. Therefore, the reported results primarily represent the heavier metallic alloying constituents.

3.5. XRD Phase Structure Analysis

XRD analysis was conducted to identify and compare crystalline phases in the PBF-LB/M and conventional SS316L samples (Figure 12).
Prominent peaks were identified at approximately 43.6°, 50.7°, and 74.7°, corresponding to the (111)γ, (200)γ, and (220)γ austenitic reflections, respectively, confirming a predominantly austenitic (FCC) structure in both samples. Peak broadening observed in the PBF-LB/M sample is attributed to residual stresses and grain refinement resulting from the rapid cooling rates inherent in the PBF-LB/M process. A ferritic (BCC) phase was also identified by the (200) α-ferrite diffraction peak around 65°, with higher intensity observed in the PBF-LB/M sample. Additionally, minor peaks indicated the presence of chromium carbide (Cr7C3) and the intermetallic compound Mn3Ni2Si. The carbide peak detected in the PBF-LB/M sample aligns with elevated carbon levels identified by EDX. Particularly, the Mn3Ni2Si intermetallic peak exhibited higher intensity in the PBF-LB/M sample, suggesting localised segregation conditions favourable for intermetallic formation, despite the rapid solidification conditions typically associated with PBF-LB/M fabrication.

3.6. EBSD Grain Orientation and Morphology Analysis

EBSD analyses were conducted to examine grain orientations and morphological characteristics of PBF-LB/M SS316L samples on the top, front, and side faces. Figure 13 presents EBSD Euler maps illustrating grain morphology and crystallographic orientations on the (a) top face, (b) front face, and (c) side face. Columnar grains aligned with the build direction were clearly observed on the front and side faces, marked by dashed lines, resulting from directional heat flow and thermal gradients during the printing process. Columnar grains were absent on the top face, consistent with typical PBF-LB/M processes in which grain elongation occurs primarily perpendicularly to the build plate.
Additionally, the side face displayed a region with distinct preferred crystallographic orientation, highlighted by a red-dominant region. This observation aligns with previous research by Andreau et al. [36], indicating shifts toward preferred orientations with increased distance from the build plate. Grain size was noted to decrease with increasing distance from the build plate on the front face, a trend not observed on the side face.
Further EBSD analysis using IPF colour orientation maps (Figure 14) provided additional details on crystallographic textures. IPF-X, IPF-Y, and IPF-Z maps for the top face showed mixed grain orientations moderately favouring (001) and (101) planes, consistent with the absence of columnar grains. The front face exhibited moderate textures primarily oriented towards (001)-(111), confirming vertical grain elongation along the build direction as previously observed. The side face displayed the strongest crystallographic texture, predominantly aligned along the (001) direction vertically, with horizontal alignment toward the (101)-(111) planes, clearly reflecting pronounced directional grain growth.
Phase fraction analysis, summarised in Table 2, indicates that the sample predominantly comprises Fe-FCC (>98%) with minor phases, including Fe-BCC, Cr-based carbides (Cr23C6 and Cr7C3), and indexing ambiguities classified as zero solutions, possibly representing grain boundaries, local segregations, or fine grains below EBSD resolution.
The dominance of the Fe-FCC phase confirms stable and consistent microstructure formation under the selected PBF-LB/M parameters.
The EBSD analysis confirms and complements the XRD findings by mapping the dominant FCC structure along with minor BCC and carbide phases on the top face of the PBF-LB/M sample. While EBSD directly identifies these phases and provides spatial distribution, certain microstructural details, such as grain refinement and residual stresses indicated by peak broadening, are better captured by XRD. It is noted that XRD detected a minor Mn3Ni2Si intermetallic phase that was not included in the EBSD phase configuration, as this phase is uncommon and not typically available in standard EBSD databases. Given its unexpected occurrence, it was not targeted during the initial EBSD setup. This highlights the importance of combining EBSD with XRD for comprehensive microstructural analysis under rapid solidification conditions.
When considered alongside the previously reported PBF-LB/M scanning strategy for this sample [27], the mixed orientation texture observed on the top face can be attributed to alternating horizontal and vertical scanning patterns, which encourage multiple grain nucleation sites and isotropic grain growth within individual layers. The moderate columnar growth on the front face and pronounced crystallographic texture on the side face result directly from the significant thermal gradients and epitaxial grain growth inherent to the PBF-LB/M process. Such microstructural anisotropy is likely to affect mechanical properties, particularly fatigue performance.

3.7. Bending Fatigue Behaviour and Crack Propagation

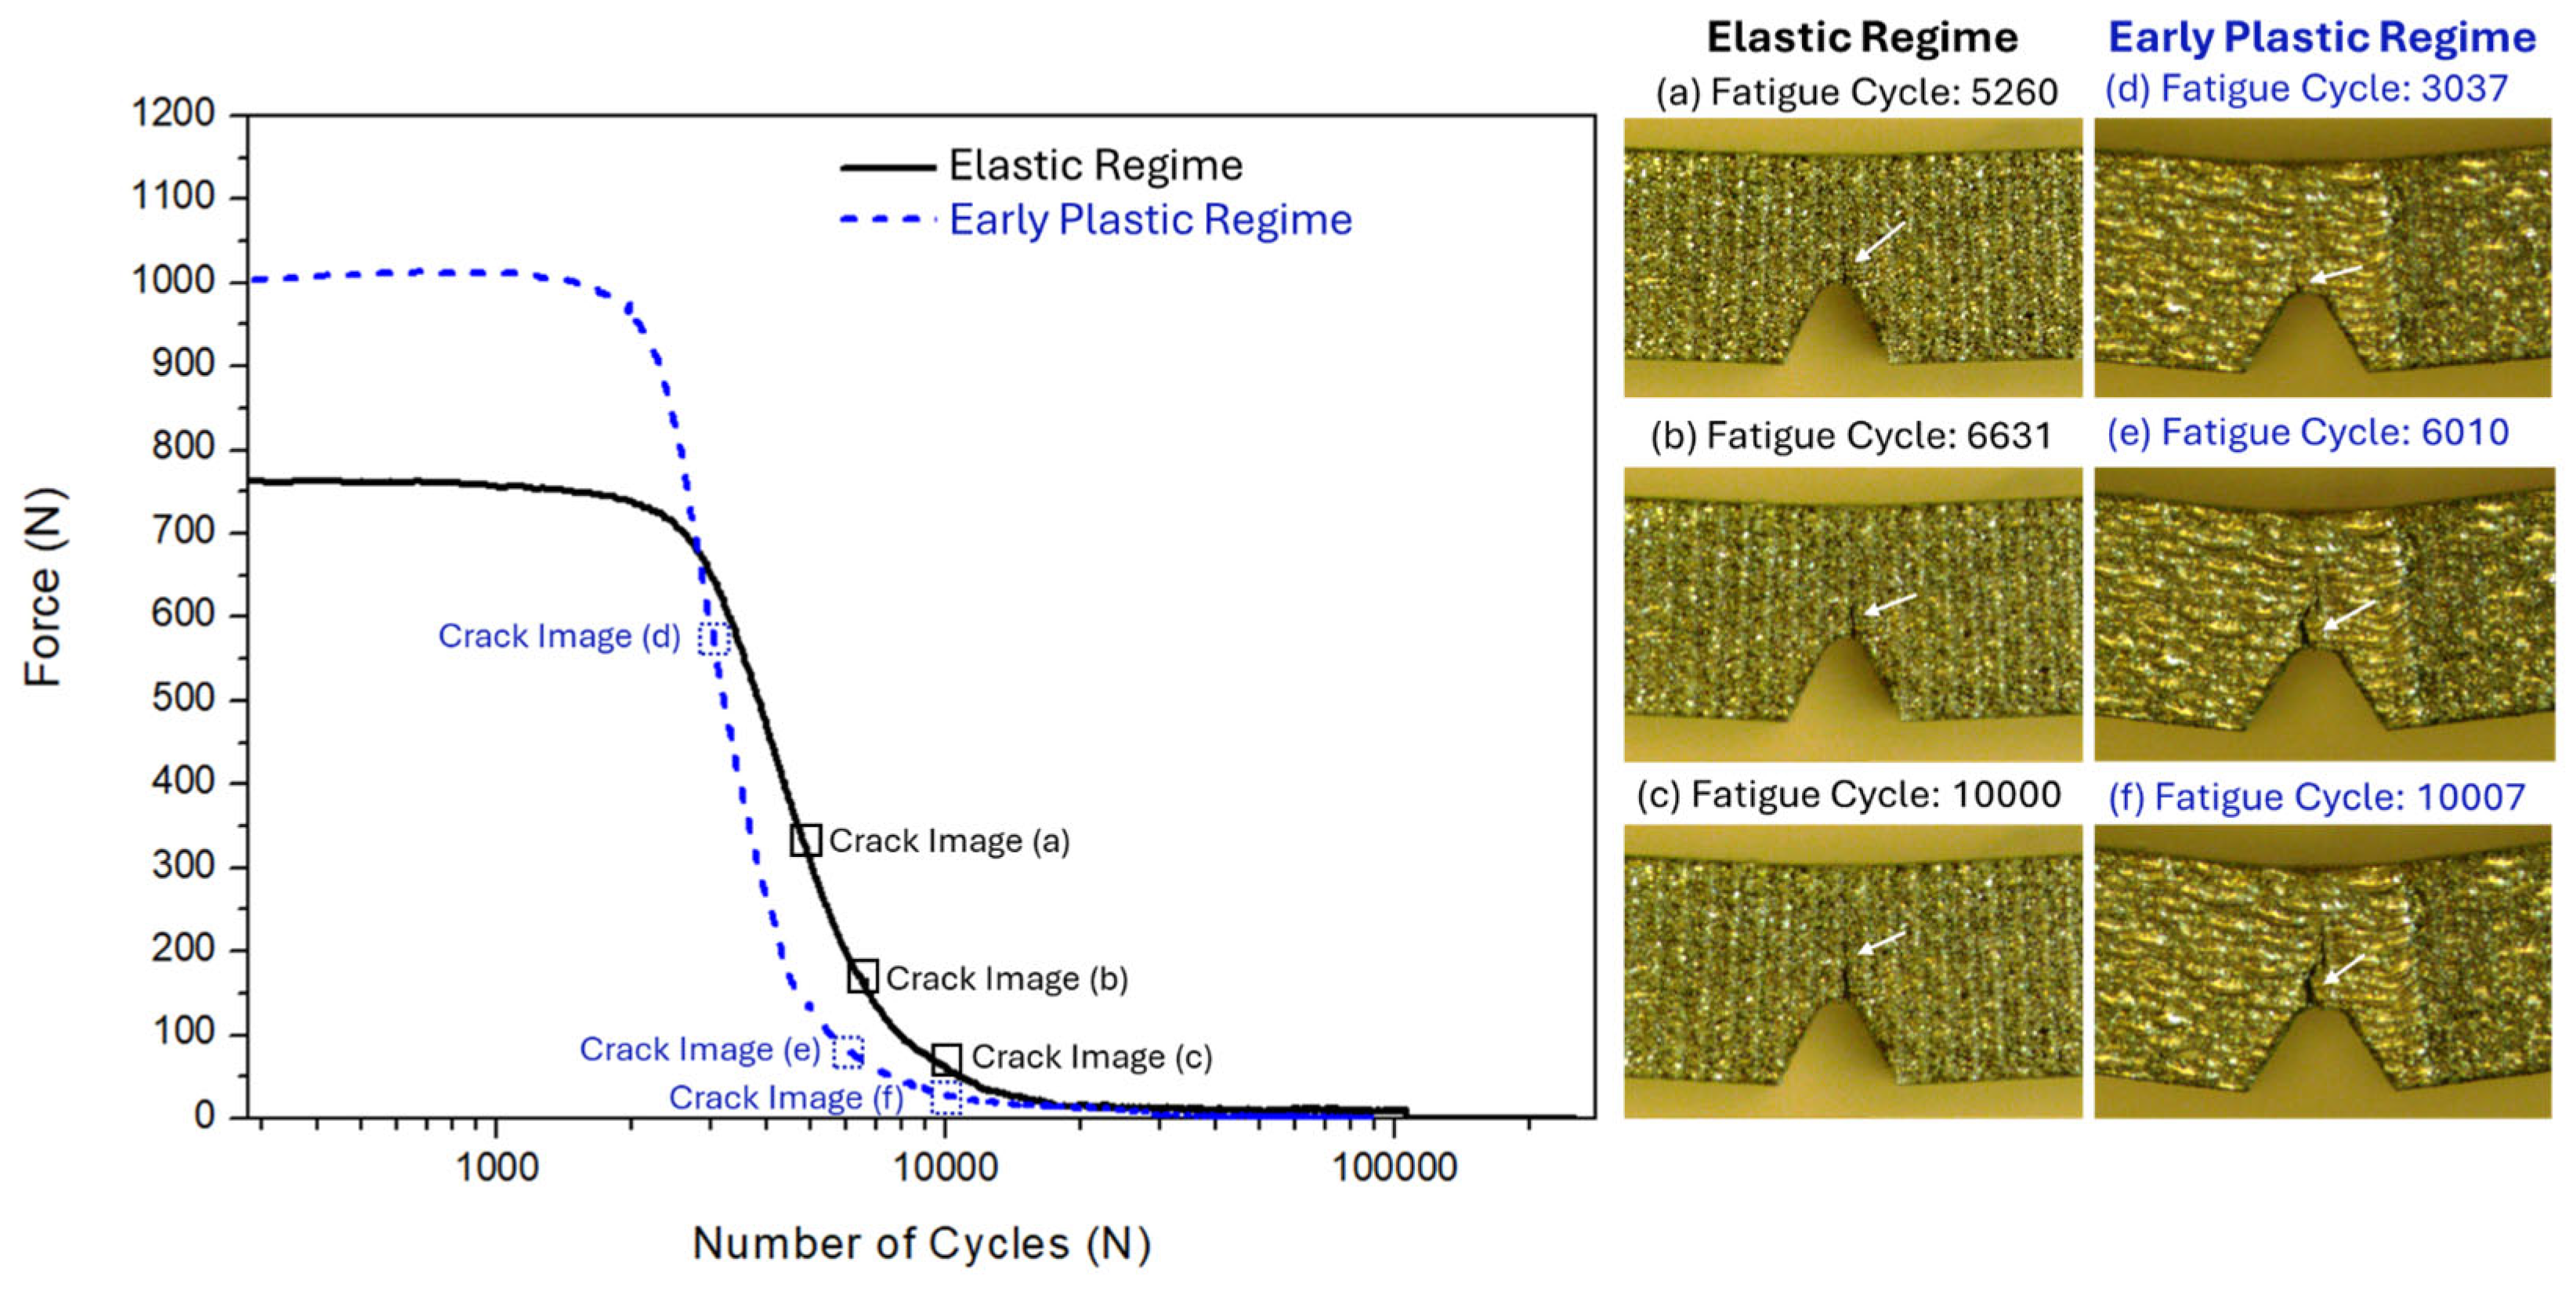
Bending fatigue tests were conducted to evaluate the fatigue behaviour of PBF-LB/M SS316L samples. Static bending tests defined baseline deformation characteristics, identifying elastic and early plastic deformation regimes. The bending fatigue curves (Figure 15) illustrate the differences between samples tested in the elastic regime (0.1–1.2 mm) and those tested in the early plastic regime (1.3–2.1 mm).
During static bending tests (Figure 4), the elastic limit occurred at approximately 700 N with a displacement of 1.2 mm, while the early plastic deformation regime extended up to about 900 N at 2.1 mm displacement. In cyclic fatigue tests conducted under displacement control, the measured peak cyclic forces were slightly higher, approximately 750 N in the elastic regime and 1000 N in the early plastic deformation regime, compared to static bending tests. This increase in cyclic peak force arises due to higher instantaneous strain rates associated with cyclic loading, demonstrating the strain-rate sensitivity of SS316L. Additionally, repeated cyclic loading induced localised strain-hardening, temporarily increasing the material stiffness.
Within the elastic regime, stable cyclic forces were maintained up to approximately 1800 cycles, followed by a decline indicating damage accumulation. Macroscopic cracks were visually detected at about 5260 cycles, with subsequent progressive crack propagation evident at higher cycles. Fatigue cracks propagating in this regime exhibited straighter and more consistent paths due to smaller, more uniform plastic zones at the crack tip, limiting crack tip deformation and stress redistribution, resulting in stable and predictable crack paths. The accompanying images (Figure 15a–c) show the progression of external macroscopic cracks in the elastic regime corresponding to specific cycle counts. In contrast, tests within the early plastic deformation regime showed stable cyclic forces only up to approximately 1200 cycles, with a rapid decline thereafter, indicating more profound internal damage. Macroscopic cracks became externally visible around 3037 cycles and continued to propagate rapidly. Crack propagation in this regime followed irregular or deflected paths due to larger, more heterogeneous plastic zones around the crack tip, causing uneven stress redistribution and irregular propagation patterns. The progression of external macroscopic cracks in the early plastic regime is illustrated in Figure 15d–f.
The delayed external visibility of macroscopic cracks in both regimes suggests internal microstructural damage occurred earlier. Under cyclic loading, internal micro-cracks accumulated and grew progressively due to localised stress concentrations and material imperfections (e.g., porosity), becoming externally visible only after substantial internal damage. Consequently, the measured force began to decline before macroscopic cracks became visible, indicating that internal damage had progressed significantly ahead of external crack appearance.
Using a failure criterion defined as a drop to 10% of the initial measured cyclic peak force, samples in the elastic regime failed at approximately 2850 cycles, while those tested in the early plastic regime failed earlier, at around 2280 cycles. The shorter fatigue life in the early plastic deformation regime was mainly due to increased plastic deformation, causing higher local stress concentrations, increased strain amplitudes, and accelerated internal crack initiation. Fatigue performance was relatively limited in both regimes, mainly due to stress concentrations from the V-notched samples, designed to facilitate stress concentration effects and crack monitoring.
It is important to note that direct comparisons of fatigue strength with previously published studies remain challenging due to substantial differences in experimental conditions [37], including sample geometry, surface finishing, processing parameters (e.g., laser energy density and scanning strategies), and fatigue loading conditions (e.g., load levels, load ratios, frequency, and testing methods like axial, rotating–bending, or four-point bending fatigue). Nonetheless, the literature generally indicates lower fatigue strength for additively manufactured SS316L compared to conventionally manufactured counterparts [38]. This reduced fatigue performance primarily arises from inherent defects (as detailed in the following sections). Therefore, to achieve fatigue strengths comparable to conventionally manufactured components, optimised processing parameters combined with appropriate post-processing treatments, such as heat treatments, hot isostatic pressing (HIP), or surface finishing, are typically required [37].

3.8. SEM Fracture Surfaces After Bending Fatigue Tests

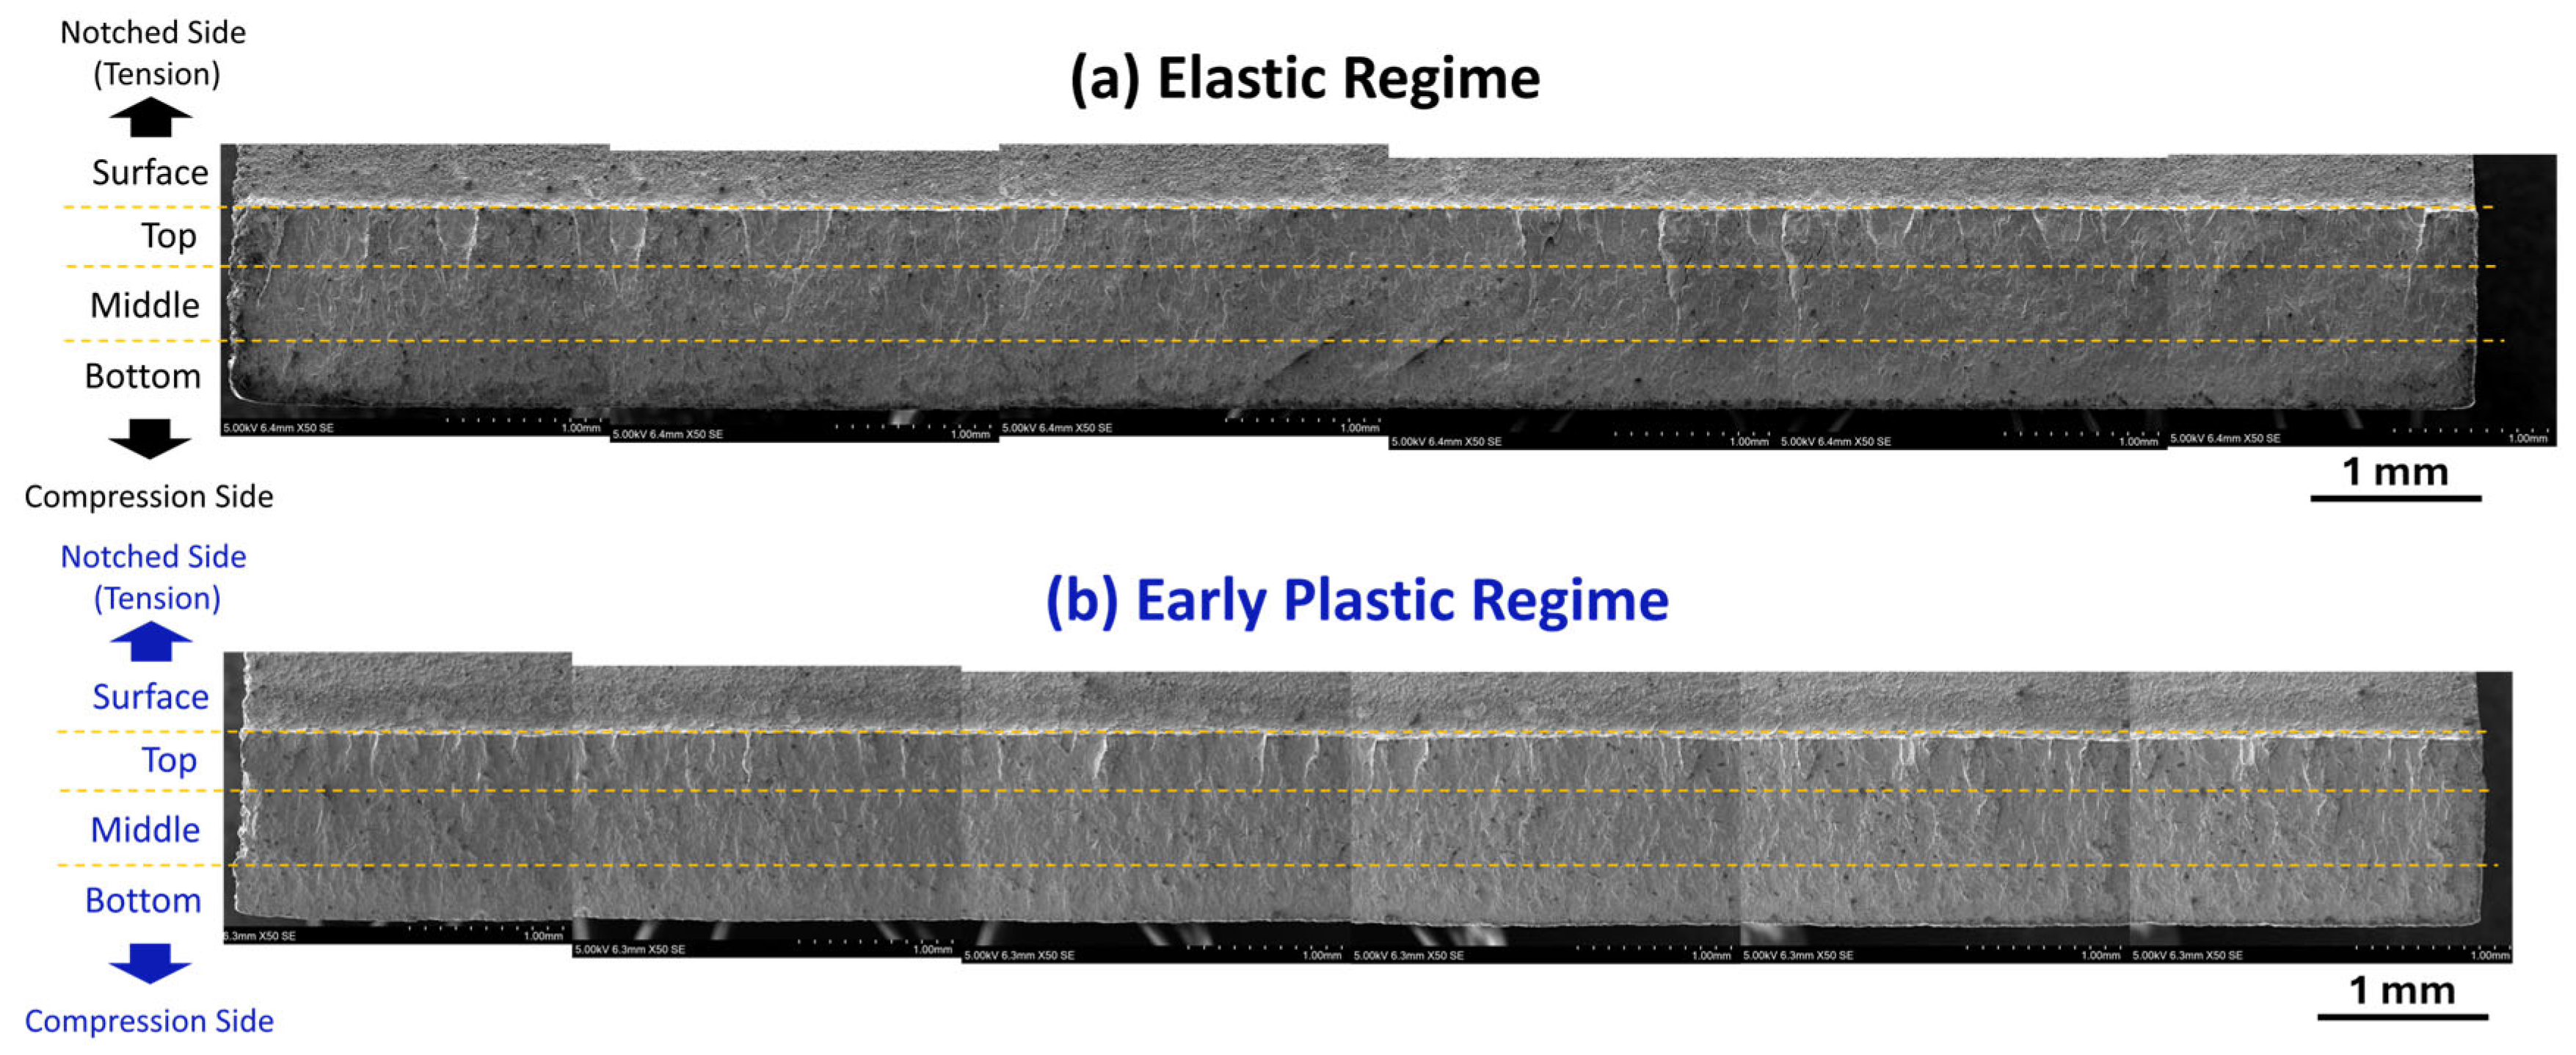
Figure 16 shows merged cross-sectional SEM images of fracture surfaces from samples tested under elastic and early plastic bending fatigue conditions. The images highlight four key regions examined, namely, surface, top, middle, and bottom, extending from the notched tensile side toward the compression side. During bending fatigue tests, tensile stresses at the notch initiate cracks, whereas compressive stresses on the opposite side inhibit crack growth.
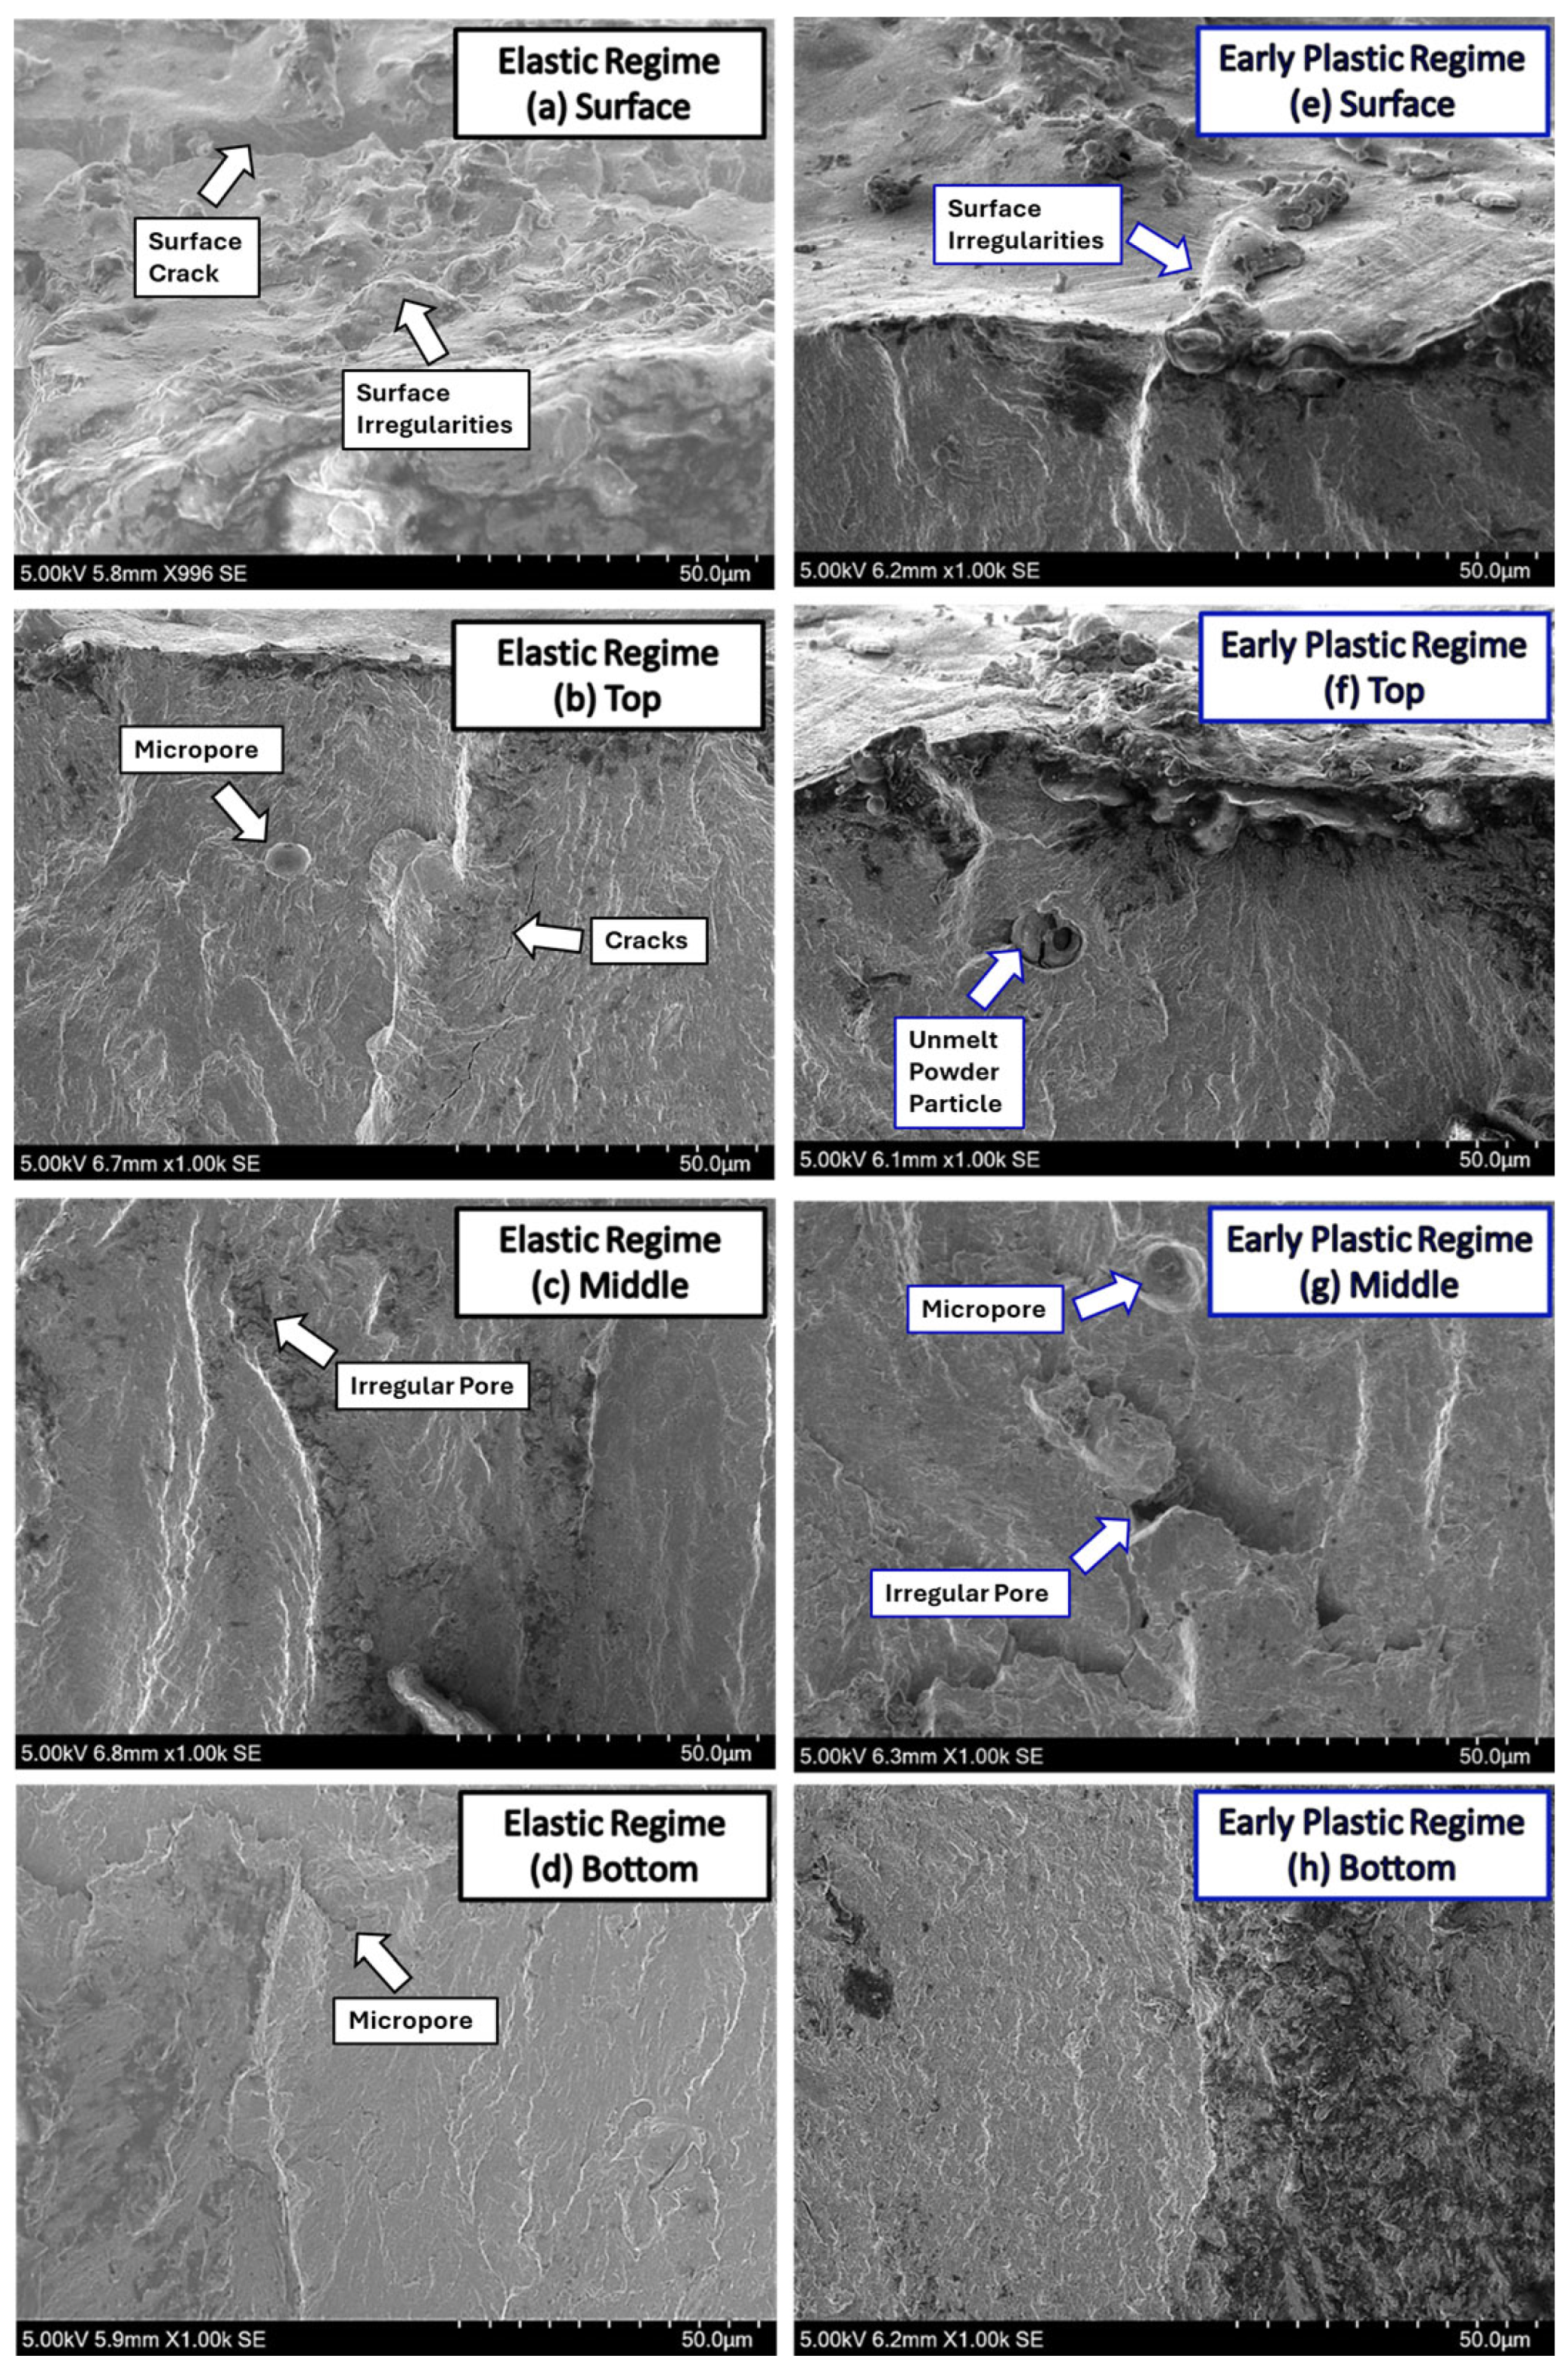
Figure 17 presents lower-magnification SEM images (1000×) illustrating fracture morphologies at various depths within samples tested under elastic and early plastic bending fatigue regimes. These images clearly show variations in fracture morphology across the sample thickness, from the outer surface (initially under tension) toward the inner surface (initially under compression). Key fracture features, including surface irregularities, micropores, unmelted powder particles, cracks, and areas of flat, brittle fracture surfaces, are indicated by arrows.
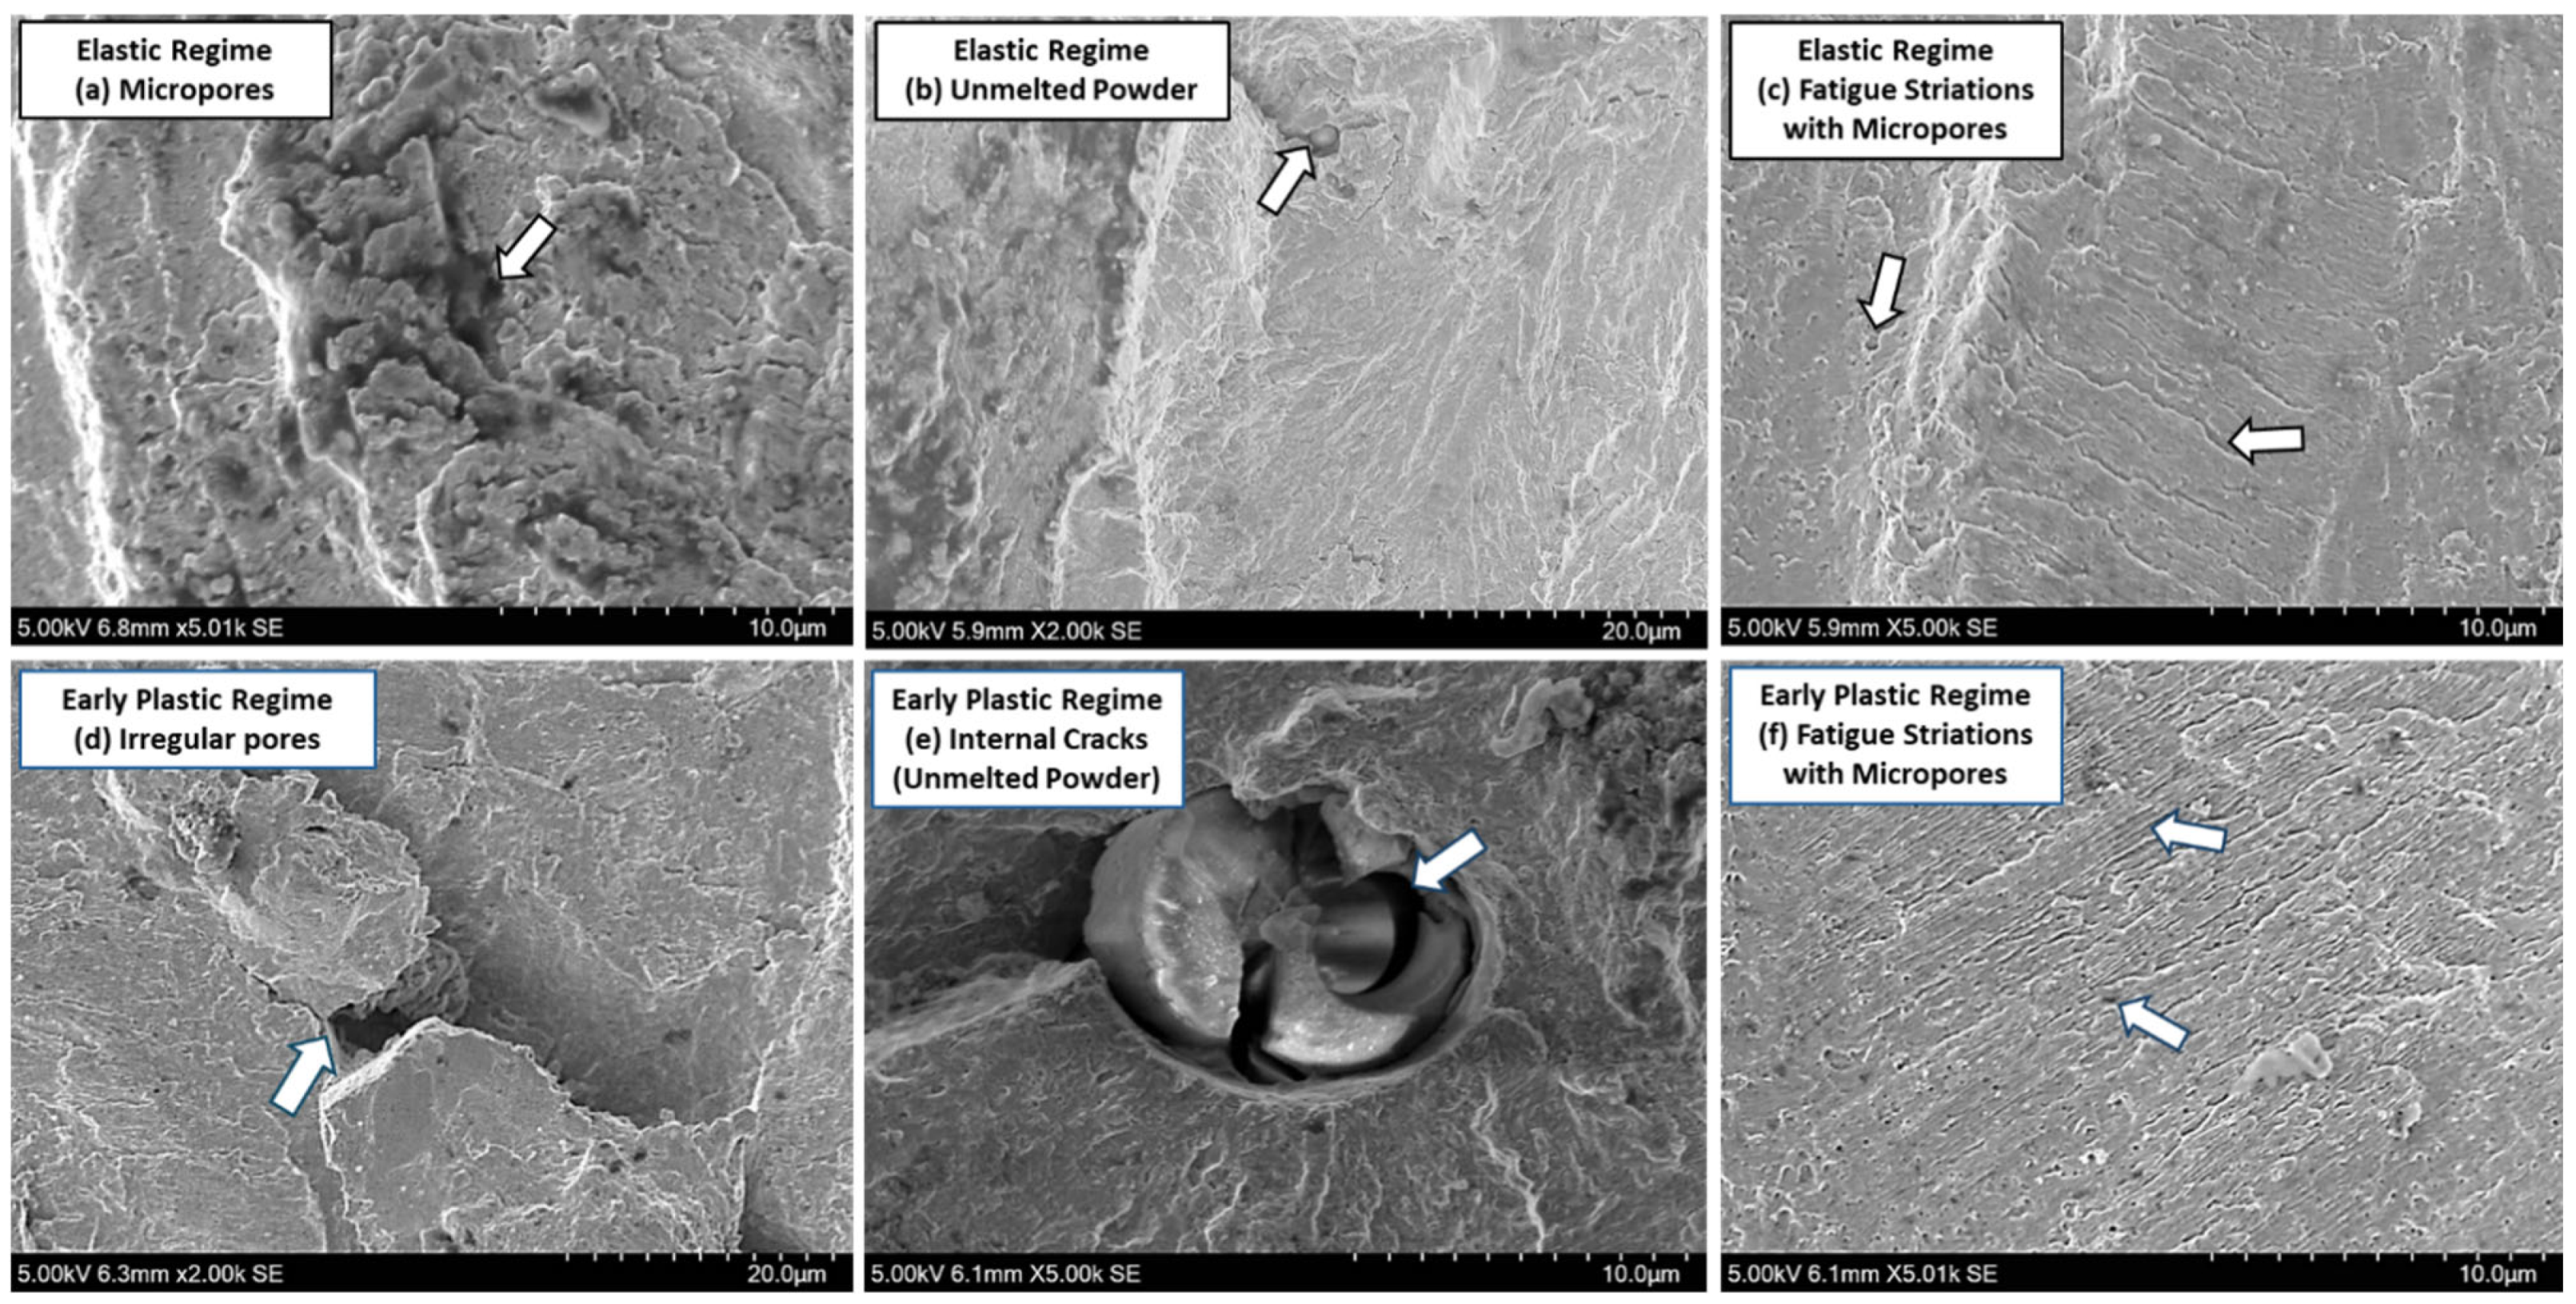
For more detailed insights into specific fatigue-related features, Figure 18 provides higher-magnification SEM fractographs (2000× to 5000×). Under the elastic regime (below the yield point), fracture surfaces exhibited micropores (Figure 18a), unmelted powder particles (Figure 18b), and clear fatigue striations associated with micropores (Figure 18c). Samples tested under the early plastic regime (just beyond the yield point) similarly revealed irregular pores (Figure 18d), internal cracks within unmelted powder particles (Figure 18e), and distinct fatigue striations accompanied by micropores (Figure 18f). Both loading regimes exhibited comparable fracture morphologies dominated by fatigue processes. These observations indicate that fatigue crack initiation was primarily influenced by manufacturing-induced defects, particularly micropores and unmelted powder particles.

3.9. Comprehensive Microstructure and Chemical Analyses

Comprehensive microstructural analyses (Section 3.1, Section 3.2, Section 3.3, Section 3.4, Section 3.5 and Section 3.6) were conducted to interpret the fatigue behaviour observed in bending fatigue tests (Section 3.7 and Section 3.8).

3.9.1. Microstructural and Porosity Findings

PBF-LB/M as a manufacturing method produces a hierarchical structure of melt pools, grains, and the solidification structure. OM images indicated face-dependent melt pool morphologies: a chessboard pattern on the top face and fish-scale patterns on the front and side faces. Variations in melt pool morphology and cooling conditions influenced the resulting grain structure and the quality of consolidation, subsequently determining the locations of fatigue crack initiation and influencing crack propagation paths. The solidification structure is unique to PBF-LB/M SS316L when compared to conventional SS316L, and may improve fatigue resistance, offering resistance to slip and leading to crack branching. Porosity observed at melt pool boundaries, clearly identified in OM images, acted as preferential sites for fatigue crack initiation. SEM analysis further revealed micropores concentrated along grain boundaries, especially on the top surface, providing additional sites for potential fatigue crack initiation.
EDX analysis confirmed the primary alloying elements (Fe, Cr, Ni) and indicated elevated carbon content, particularly on the front face. However, due to limitations such as surface contamination, detection sensitivity, and spectral peak overlap, EDX alone cannot reliably quantify carbon or confirm carbide formation without additional supporting evidence. XRD analysis provided such additional evidence by identifying a predominantly FCC austenitic structure with minor ferritic phases and chromium carbides (Cr7C3). However, carbides were not directly visible in SEM images, likely because their size was below the resolution limits at the employed magnifications. As a result, despite XRD confirmation, the direct role of carbides in influencing fatigue fracture remains unclear and requires further investigation.

3.9.2. Influence of Microstructure on Bending Fatigue Behaviour

The fatigue behaviour observed in this study was closely related to microstructural defects such as unmelted powder particles and micropores formed during the PBF-LB/M process. Under elastic bending conditions (below yield point), fatigue cracks mainly initiated at micropores due to local stress concentrations around these defects. Previous studies [6,39] showed that the shape and size of pores significantly affect local stress levels. Larger, irregular pores, often formed by the laser melting process, typically cause higher stress concentrations due to their sharp edges compared to smaller, spherical gas pores. Because bending creates the highest tensile stress near surfaces farthest from the neutral axis, defects located in these areas became critical sites for fatigue crack initiation [6]. Additionally, grain structures formed by directional solidification during PBF-LB/M could also affect fatigue performance [40,41,42]. Columnar grains aligned with the build direction may influence how easily cracks initiate and propagate during cyclic loading. The fine cellular structures created by rapid cooling in PBF-LB/M can help slow crack growth by limiting the movement of defects (dislocations) at lower stresses.

3.9.3. Relative Influence of Microstructural Factors

A comparative ranking of microstructural factors influencing the bending fatigue behaviour is proposed. Micropores, particularly irregular pores, along with unmelted powder particles were identified as the most influential factors under both elastic and early plastic loading conditions, clearly supported by observed fatigue crack initiation at these defects due to local stress concentrations. Grain anisotropy, characterised by columnar grains aligned with the build direction (confirmed by EBSD), was also identified as a contributing factor. However, its direct impact on fatigue fracture was not conclusively observable in SEM analysis, and thus further experimental confirmation is necessary. Other microstructural factors, such as chromium carbides (detected by XRD), refined cellular solidification structures, and melt pool morphology, remain speculative. The exact roles of these features require further targeted investigation to confirm their influence on fatigue performance.

4. Conclusions

Microstructural and porosity analyses of PBF-LB/M SS316L were performed to evaluate bending fatigue performance under two distinct loading conditions: an elastic regime (below yield stress) and an early plastic regime (slightly above yield stress). Despite achieving high densification (>99%), residual defects, including micropores and unmelted powder particles, persisted due to inherent limitations of the PBF-LB/M process. SEM analyses demonstrated that these defects, particularly irregular pores, significantly influenced fatigue crack initiation. XRD confirmed a predominantly FCC-austenitic structure with minor ferritic phases and chromium carbides (Cr7C3), although carbides were not directly visible in SEM observations. Chemical composition of the primary alloying elements (Fe, Cr, Ni) remained consistent across all sample faces. Grain structures varied by sample orientation, exhibiting columnar grains parallel to the build direction on the front and side faces, and isotropic grains on the top face. However, explicit evidence of grain orientation influencing crack propagation paths was not conclusively observed, highlighting areas requiring further investigation. Fatigue life was found to be shorter in the early plastic regime, with irregular crack propagation observed on external surfaces. Although direct fatigue strength comparisons remain challenging due to varied experimental conditions reported in the literature, achieving fatigue performance comparable to conventional manufacturing generally requires optimised processing and appropriate post-processing treatments to mitigate inherent additive manufacturing defects.

Author Contributions

Conceptualisation, C.-W.C.; Methodology, C.K., W.X., B.F., C.W. and C.-W.C.; Validation, C.K., W.X., B.F., C.W. and C.-W.C.; Formal analysis, C.K., W.X., B.F. and S.D.; Investigation, C.K., W.X., B.F. and C.W.; Resources, H.-C.M. and C.-W.C.; Data curation, C.K., W.X., B.F. and C.-W.C.; Writing—original draft preparation, C.K., W.X. and S.D.; Writing—review and editing, H.-C.M. and C.-W.C.; Visualisation, C.K., W.X. and B.F.; Supervision, H.-C.M. and C.-W.C.; Project administration, C.-W.C.; Funding acquisition, H.-C.M. and C.-W.C. All authors have read and agreed to the published version of the manuscript.

Funding

This research was funded by the Research Grants Council of the Hong Kong Special Administrative Region (grant number 152131/18E) and Queen’s University Belfast (grant number R8448MEE). Support from the infrastructure of Queen’s University Belfast, The Hong Kong Polytechnic University, and the University Research Facility in 3D Printing (U3DP) is also acknowledged.

Data Availability Statement

The raw data supporting the conclusions of this article will be made available by the authors on request.

Conflicts of Interest

The authors declare no conflicts of interest.

References

  1. Lee, J.-A.; Koh, Y.-G.; Kang, K.-T. Biomechanical and Clinical Effect of Patient-Specific or Customized Knee Implants: A Review. J. Clin. Med. 2020, 9, 1559. [Google Scholar] [CrossRef] [PubMed]
  2. Moret, C.S.; Schelker, B.L.; Hirschmann, M.T. Clinical and Radiological Outcomes after Knee Arthroplasty with Patient-Specific versus Off-the-Shelf Knee Implants: A Systematic Review. J. Pers. Med. 2021, 11, 590. [Google Scholar] [CrossRef] [PubMed]
  3. O’Connor, M.I.; Kransdorf, M.J. Customized Knee Arthroplasty and the Role of Preoperative Imaging. Am. J. Roentgenol. 2013, 201, W443–W450. [Google Scholar] [CrossRef] [PubMed]
  4. Nagpure, D.; Asutkar, S. 3D Printing in Surgery: Transforming Patient-Specific Solutions. Multidiscip. Rev. 2024, 8, 2025154. [Google Scholar] [CrossRef]
  5. Stendal, J.; Fergani, O.; Yamaguchi, H.; Espallargas, N. A Comparative Tribocorrosion Study of Additive Manufactured and Wrought 316L Stainless Steel in Simulated Body Fluids. J. Bio Tribo Corros. 2018, 4, s40735-s017. [Google Scholar] [CrossRef]
  6. Liang, X.; Hor, A.; Robert, C.; Salem, M.; Lin, F.; Morel, F. High. Cycle Fatigue Behavior of 316L Steel Fabricated by Laser Powder Bed Fusion: Effects of Surface Defect and Loading Mode. Int. J. Fatigue 2022, 160, 106843. [Google Scholar] [CrossRef]
  7. Kotrych, D.; Angelini, A.; Bohatyrewicz, A.; Ruggieri, P. 3D Printing for Patient-Specific Implants in Musculoskeletal Oncology. EFORT Open Rev. 2023, 8, 331–339. [Google Scholar] [CrossRef]
  8. Pilliar, R.M.; Cameron, H.U.; Binnington, A.G.; Szivek, J.; Macnab, I. Bone Ingrowth and Stress Shielding with a Porous Surface Coated Fracture Fixation Plate. J. Biomed. Mater. Res. 1979, 13, 799–810. [Google Scholar] [CrossRef]
  9. Chua, M.; Chui, C.-K. Optimization of Patient-Specific Design of Medical Implants for Manufacturing. Procedia CIRP 2016, 40, 402–406. [Google Scholar] [CrossRef]
  10. Yadav, D.; Garg, R.; Ahlawat, A.; Chhabra, D. 3D Printable Biomaterials for Orthopedic Implants: Solution for Sustainable and Circular Economy. Resour. Policy 2020, 68, 101767. [Google Scholar] [CrossRef]
  11. Fantin, L. de B.; Moreira, M.F.; de Souza, J.M.P. Failure Analysis of a Fractured Stainless Steel Femoral Bone Plate. Eng. Fail. Anal. 2025, 173, 109466. [Google Scholar] [CrossRef]
  12. Guerra-Fuentes, L.; Garcia-Sanchez, E.; Juarez-Hernandez, A.; Hernandez-Rodriguez, M.A.L. Failure Analysis in 316L Stainless Steel Supracondylar Blade Plate. Eng. Fail. Anal. 2015, 57, 243–247. [Google Scholar] [CrossRef]
  13. Sudhakar, K.V. Metallurgical Investigation of a Failure in 316L Stainless Steel Orthopaedic Implant. Eng. Fail. Anal. 2005, 12, 249–256. [Google Scholar] [CrossRef]
  14. Polak, S.; Beever, L.; Wade, A.; Fukuoka, M.; Worth, A.J. Biomechanical Comparison of Titanium Alloy Additively Manufactured and Conventionally Manufactured Plate-Screw Constructs. N. Zealand Vet. J. 2024, 72, 17–27. [Google Scholar] [CrossRef]
  15. Wu, K.; Li, B.; Guo, J. Fatigue Crack Growth and Fracture of Internal Fixation Materials in In Vivo Environments—A Review. Materials 2021, 14, 176. [Google Scholar] [CrossRef]
  16. Zhang, H.; Chiang, R.; Qin, H.; Ren, Z.; Hou, X.; Doll, G.; Vasudevan, V.; Dong, Y.; Ye, C. The Effects of Ultrasonic Nanocrystal Surface Modification on the Fatigue Performance of 3D-Printed Ti64. Int. J. Fatigue 2017, 103. [Google Scholar] [CrossRef]
  17. Rivolta, B.; Gerosa, R.; Panzeri, D. Selective Laser Melted 316L Stainless Steel: Influence of Surface and Inner Defects on Fatigue Behavior. Int. J. Fatigue 2023, 172, 107664. [Google Scholar] [CrossRef]
  18. Concli, F.; Gerosa, R.; Panzeri, D.; Fraccaroli, L. High and Low Cycle Fatigue Properties of Selective Laser Melted AISI 316L and AlSi10Mg. Int. J. Fatigue 2023, 177, 107931. [Google Scholar] [CrossRef]
  19. Blinn, B.; Krebs, F.; Ley, M.; Gläßner, C.; Smaga, M.; Aurich, J.C.; Teutsch, R.; Beck, T. Influence of the Chemical Composition of the Used Powder on the Fatigue Behavior of Additively Manufactured Materials. Metals 2019, 9, 1285. [Google Scholar] [CrossRef]
  20. Kong, D.; Ni, X.; Dong, C.; Zhang, L.; Man, C.; Cheng, X.; Li, X. Anisotropy in the Microstructure and Mechanical Property for the Bulk and Porous 316L Stainless Steel Fabricated via Selective Laser Melting. Mater. Lett. 2019, 235, 1–5. [Google Scholar] [CrossRef]
  21. Marattukalam, J.J.; Karlsson, D.; Pacheco, V.; Beran, P.; Wiklund, U.; Jansson, U.; Hjörvarsson, B.; Sahlberg, M. The Effect of Laser Scanning Strategies on Texture, Mechanical Properties, and Site-Specific Grain Orientation in Selective Laser Melted 316L SS. Mater. Des. 2020, 193, 108852. [Google Scholar] [CrossRef]
  22. Dixit, S.; Liu, S.; Murdoch, H.A.; Smith, P.M. Investigating Build Orientation-Induced Mechanical Anisotropy in Additive Manufacturing 316L Stainless Steel. Mater. Sci. Eng. A 2023, 880, 145308. [Google Scholar] [CrossRef]
  23. Ganesh, P.; Kaul, R.; Sasikala, G.; Kumar, H.; Venugopal, S.; Tiwari, P.; Rai, S.; Prasad, R.C.; Kukreja, L.M. Fatigue Crack Propagation and Fracture Toughness of Laser Rapid Manufactured Structures of AISI 316L Stainless Steel. Metallogr. Microstruct. Anal. 2014, 3, 36–45. [Google Scholar] [CrossRef]
  24. Jaskari, M.; Mäkikangas, J.; Järvenpää, A.; Mäntyjärvi, K.; Karjalainen, P. Effect of High Porosity on Bending Fatigue Properties of 3D Printed AISI 316L Steel. Procedia Manuf. 2019, 36, 33–41. [Google Scholar] [CrossRef]
  25. Chen, Y.; Wang, X.; Shen, J.; Peng, Y.; Jiang, Y.; Yang, X.; Leen, S.B.; Gong, J. Deformation Mechanisms of Selective Laser Melted 316L Austenitic Stainless Steel in High Temperature Low Cycle Fatigue. Mater. Sci. Eng. A 2022, 843, 143123. [Google Scholar] [CrossRef]
  26. Winwood, K.; Zioupos, P.; Currey, J.D.; Cotton, J.R.; Taylor, M. The Importance of the Elastic and Plastic Components of Strain in Tensile and Compressive Fatigue of Human Cortical Bone in Relation to Orthopaedic Biomechanics. J. Musculoskelet. Neuronal Interact. 2006, 6, 134–141. [Google Scholar]
  27. Xie, W.; Hussain, I.; Man, H.-C.; Chan, C.-W. Adoption of Appropriate Scanning Strategy on Selective Laser Melting of Stainless Steel 316L to Enable Healthy Mesenchymal Stem Cells Response. J. Laser Appl. 2023, 35, 022019. [Google Scholar] [CrossRef]
  28. ASTM E112-13(2021); Standard Test Methods for Determining Average Grain Size. ASTM International: West Conshohocken, PA, USA, 2021. Available online: https://compass.astm.org/document/?contentCode=ASTM%7CE0112-13R21%7Cen-US&proxycl=https%3A%2F%2Fsecure.astm.org&fromLogin=true (accessed on 18 October 2023).
  29. Wang, S.; Ning, J.; Zhu, L.; Yang, Z.; Yan, W.; Dun, Y.; Xue, P.; Xu, P.; Bose, S.; Bandyopadhyay, A. Role of Porosity Defects in Metal 3D Printing: Formation Mechanisms, Impacts on Properties and Mitigation Strategies. Mater. Today 2022, 59, 133–160. [Google Scholar] [CrossRef]
  30. Liu, J.; Song, Y.; Chen, C.; Wang, X.; Li, H.; Zhou, C.; Wang, J.; Guo, K.; Sun, J. Effect of Scanning Speed on the Microstructure and Mechanical Behavior of 316L Stainless Steel Fabricated by Selective Laser Melting. Mater. Des. 2020, 186, 108355. [Google Scholar] [CrossRef]
  31. Minns, R.J.; Bremble, G.R.; Campbell, J. A Biomechanical Study of Internal Fixation of the Tibial Shaft. J. Biomech. 1977, 10, 569–579. [Google Scholar] [CrossRef]
  32. ISO 12108:2018; Metallic Materials—Fatigue Testing—Fatigue Crack Growth Method. International Organization for Standardization: Geneva, Switzerland, 2018. Available online: https://www.iso.org/standard/73809.html (accessed on 24 March 2025).
  33. Leary, M.; Maconachie, T.; Sarker, A.; Faruque, O.; Brandt, M. Mechanical and Thermal Characterisation of AlSi10Mg SLM Block Support Structures. Mater. Des. 2019, 183, 108138. [Google Scholar] [CrossRef]
  34. Sanaei, N.; Fatemi, A. Defects in Additive Manufactured Metals and Their Effect on Fatigue Performance: A State-of-the-Art Review. Prog. Mater. Sci. 2021, 117, 100724. [Google Scholar] [CrossRef]
  35. Qu, H.; Li, J.; Zhang, F.; Bai, J. Anisotropic Cellular Structure and Texture Microstructure of 316L Stainless Steel Fabricated by Selective Laser Melting via Rotation Scanning Strategy. Mater. Des. 2022, 215, 110454. [Google Scholar] [CrossRef]
  36. Andreau, O.; Koutiri, I.; Peyre, P.; Penot, J.-D.; Saintier, N.; Pessard, E.; De Terris, T.; Dupuy, C.; Baudin, T. Texture Control of 316L Parts by Modulation of the Melt Pool Morphology in Selective Laser Melting. J. Mater. Process. Technol. 2019, 264, 21–31. [Google Scholar] [CrossRef]
  37. Avanzini, A. Fatigue Behavior of Additively Manufactured Stainless Steel 316L. Materials 2022, 16, 65. [Google Scholar] [CrossRef]
  38. Chepkoech, M.; Omoniyi, P.; Owolabi, G. Fatigue Response of Additive-Manufactured 316L Stainless Steel. Metals 2024, 14, 988. [Google Scholar] [CrossRef]
  39. Zhang, W.; Pommier, S.; Curtit, F.; Léopold, G.; Courtin, S. Mode I Crack Propagation under High Cyclic Loading in 316L Stainless Steel. Procedia Mater. Sci. 2014, 3, 1197–1203. [Google Scholar] [CrossRef]
  40. Deev, A.A.; Kuznetcov, P.A.; Petrov, S.N. Anisotropy of Mechanical Properties and Its Correlation with the Structure of the Stainless Steel 316L Produced by the SLM Method. Phys. Procedia 2016, 83, 789–796. [Google Scholar] [CrossRef]
  41. Carassus, H.; Guérin, J.D.; Morvan, H.; Haugou, G.; Sadat, T.; Guérard, S.; Markiewicz, E. An Experimental Investigation into Influences of Build Orientation and Specimen Thickness on Quasi-Static and Dynamic Mechanical Responses of Selective Laser Melting 316L Stainless Steel. Mater. Sci. Eng. A 2022, 835, 142683. [Google Scholar] [CrossRef]
  42. Aiza, I.; Baldi, C.; de la Vega, F.M.; Sebastiani, S.; Veronese, N.E.; Yousefi, M.; Mosallanejad, M.H.; Maleki, E.; Guagliano, M.; Iuliano, L.; et al. Effects of Build Orientation and Inclined Features on Physical, Microstructural and Mechanical Properties of Powder Bed Fusion Additively Manufactured Metallic Parts. Prog. Mater. Sci. 2025, 147, 101357. [Google Scholar] [CrossRef]
Figure 1. Volume-based particle size distribution (%) of the SS316L powder used for PBF-LB/M.
Metals 15 00650 g001
Figure 2. Schematic illustration showing the orientation of the top (T), side (S), and front (F) sample faces relative to the build direction (BD) in the PBF-LB/M process. The coordinate axes (X, Y, Z) provide spatial references for subsequent microstructural characterisation of these faces.
Metals 15 00650 g002
Figure 3. (a) Photograph of the four-point bending test setup showing loading and support nodes, (b) schematic illustration highlighting loading and support span positions and SENB sample geometry (Adapted from Ref. [28]), and (c) optical microscopy image showing the V-notch geometry and radius at the notch root produced by EDM wire cutting.
Metals 15 00650 g003
Figure 4. Load–displacement curve from quasi-static four-point bending tests of PBF-LB/M SS316L, indicating the elastic (0.1–1.2 mm) and early plastic (1.3–2.1 mm) deformation regimes used to determine displacement ranges for fatigue tests.
Metals 15 00650 g004
Figure 5. Experimental setup for real-time crack monitoring during fatigue testing, showing the positioning of the high-speed digital microscope and the USB optical microscope used for illumination and image capturing.
Metals 15 00650 g005
Figure 6. OM images at 200× magnification illustrating characteristic morphologies of each face: (a) top, (b) front, and (c) side. Unique features specific to each face are highlighted by white arrows.
Metals 15 00650 g006
Figure 7. Quantitative assessment of melt pool dimensions: (a) average melt pool depth on the front and side faces, (b) average melt pool depth in different regions of the side face, and (c) OM image regions used for measurements.
Metals 15 00650 g007
Figure 8. OM images of various faces: (a) top (200×), (b) front (400×), and (c) side (200×), exhibiting porosity. Gas pores are marked with solid blue arrows; energy-induced pores are indicated by dashed red arrows.
Metals 15 00650 g008
Figure 9. Comparisons between key shape descriptors to determine relationships: (a) circularity vs. Feret diameter, (b) circularity vs. aspect ratio, and (c) √Area vs. Feret diameter.
Metals 15 00650 g009aMetals 15 00650 g009b
Figure 10. Comparison of (a) circularity, (b) aspect ratio, and (c) maximum Feret diameter among porosity types.
Metals 15 00650 g010
Figure 11. SEM images showing the microstructural features from different faces: (a) top face, (b) front face, and (c) side face.
Metals 15 00650 g011
Figure 12. XRD patterns comparing phase structures of the PBF-LB/M and conventional SS316L samples. The black curve represents the top face of the PBF-LB/M sample.
Metals 15 00650 g012
Figure 13. EBSD Euler maps illustrating grain morphology and crystallographic orientations on the (a) top face, (b) front face, and (c) side face of PBF-LB/M samples. White dashed lines mark columnar grain structures aligned with the build direction. The highlighted area on the side face indicates a region of preferred crystallographic orientation.
Metals 15 00650 g013
Figure 14. EBSD IPF orientation maps for the (a) front face (XZ-plane, parallel to the build direction), (b) side face (YZ-plane, parallel to the build direction, orthogonal to scanning direction), and (c) top face (XY-plane, perpendicular to the build direction) of PBF-LB/M SS316L. Rows (i–iii) represent crystallographic orientations relative to the X, Y, and Z directions, respectively. The inset FCC colour triangle indicates the corresponding crystallographic directions associated with each colour.
Metals 15 00650 g014
Figure 15. Bending fatigue curves of PBF-LB/M SS316L tested under displacement control in the elastic and early plastic deformation regimes, showing force reduction with increasing fatigue cycles. Insets (a–c) and (d–f) correspond to specific cycle counts, illustrating the progression of macroscopic fatigue cracks (white arrows) for samples tested in elastic and early plastic regions, respectively.
Metals 15 00650 g015
Figure 16. Merged cross-sectional SEM images (50×) of fracture surfaces showing clearly defined regions (surface, top, middle, and bottom) for samples tested under (a) elastic and (b) early plastic loading regimes.
Metals 15 00650 g016
Figure 17. Lower-magnification SEM fractographs at the surface, top, middle, and bottom regions for samples tested under elastic (ad) and early plastic (eh) loading regimes.
Metals 15 00650 g017
Figure 18. High-magnification SEM fractographs illustrating fatigue crack features under elastic (ac) and early plastic (df) loading regimes: (a) crack initiation from micropores; (b) cracks propagating around unmelted powder particle; (c) clear fatigue striations accompanied by micropores; (d) crack propagation around irregular pores; (e) internal cracks within an unmelted powder particle; and (f) distinct fatigue striations with micropores. White arrows highlight the described features, indicating fatigue-dominated fracture morphology.
Metals 15 00650 g018
Table 1. Average elemental composition (wt%) of different faces measured by EDX analysis (n > 10).
FaceFe (wt%)Cr (wt%)Ni (wt%)Mn (wt%)C (wt%)O (wt%)Others:
Mo, Si, S (wt%)
Top66.0 ± 0.1716.0 ± 0.0410.1 ± 0.071.2 ± 0.021.2 ± 0.020.8 ± 0.114.7 ± 0.18
Front65.0 ± 0.2816.1 ± 0.0410.0 ± 0.071.3 ± 0.075.1 ± 0.080.9 ± 0.151.6 ± 0.13
Side66.2 ± 0.2216.3 ± 0.0610.0 ± 0.061.2 ± 0.053.8 ± 0.170.8 ± 0.081.7 ± 0.20
Table 2. Phase fraction percentages for the top, front, and side faces. The predominant phase is Fe-FCC, with minor presence of Fe-BCC, Cr-based carbides (Cr23C6 and Cr7C3), and indexing ambiguities represented by zero solutions.
Phase NameTopFrontSide
Fe-BCC0.040.030.03
Fe-FCC98.3598.7199.07
Cr23C60.070.070.05
Cr7C30.030.020.02
Zero Solutions1.511.170.83
Disclaimer/Publisher’s Note: The statements, opinions and data contained in all publications are solely those of the individual author(s) and contributor(s) and not of MDPI and/or the editor(s). MDPI and/or the editor(s) disclaim responsibility for any injury to people or property resulting from any ideas, methods, instructions or products referred to in the content.