Article

The Effect of Yttrium Addition on the Solidification Microstructure and Sigma Phase Precipitation Behavior of S32654 Super Austenitic Stainless Steel

Collaborative Innovation Center of Steel Technology, University of Science and Technology Beijing, Beijing 100083, China
*
Author to whom correspondence should be addressed.
Metals 2025, 15(7), 798; https://doi.org/10.3390/met15070798
Submission received: 5 June 2025 / Revised: 30 June 2025 / Accepted: 14 July 2025 / Published: 15 July 2025
(This article belongs to the Special Issue Synthesis, Processing and Applications of New Forms of Metals)

Abstract

This study focuses on S32654 super austenitic stainless steel (SASS) and systematically characterizes the morphology of the sigma (σ) phase and the segregation behavior of alloying elements in its as-cast microstructure. High-temperature confocal scanning laser microscopy (HT-CSLM) was employed to investigate the effect of the rare earth element yttrium (Y) on the solidification microstructure and σ phase precipitation behavior of SASS. The results show that the microstructure of SASS consists of austenite dendrites and interdendritic eutectoid structures. The eutectoid structures mainly comprise the σ phase and the γ2 phase, exhibiting lamellar or honeycomb-like morphologies. Regarding elemental distribution, molybdenum displays a “concave” distribution pattern within the dendrites, with lower concentrations at the center and higher concentrations at the sides; when Mo locally exceeds beyond a certain threshold, it easily induces the formation of eutectoid structures. Mo is the most significant segregating element, with a segregation ratio as high as 1.69. The formation mechanism of the σ phase is attributed to the solid-state phase transformation of austenite (γ → γ2 + σ). In the late stages of solidification, the concentration of chromium and Mo in the residual liquid phase increases, and due to insufficient diffusion, there are significant compositional differences between the interdendritic regions and the matrix. The enriched Cr and Mo cause the interdendritic austenite to become supersaturated, leading to solid-state phase transformation during subsequent cooling, thereby promoting σ phase precipitation. The overall phase transformation process can be summarized as L → L + γ → γ → γ + γ2 + σ. Y microalloying has a significant influence on the solidification process. The addition of Y increases the nucleation temperature of austenite, raises nucleation density, and refines the solidification microstructure. However, Y addition also leads to an increased amount of eutectoid structures. This is primarily because Y broadens the solidification temperature range of the alloy and prolongs grain growth perio, which aggravates the microsegregation of elements such as Cr and Mo. Moreover, Y raises the initial precipitation temperature of the σ phase and enhances atomic diffusion during solidification, further promoting σ phase precipitation during the subsequent eutectoid transformation.

1. Introduction

Super austenitic stainless steels (SASS) exhibit excellent corrosion resistance in extreme environments such as high-concentration chloride (Cl) media and low-velocity erosion conditions. Consequently, they have been widely applied in marine engineering equipment, pharmaceutical systems, chemical processes, and core components of advanced nuclear reactor systems [1,2]. SASS continues to evolve toward higher alloying levels and improved performance. Although the increase in alloying elements can significantly improve their overall properties, it also promotes the precipitation of various secondary phases [3,4]. S32654 is a representative high-alloy SASS. Due to its higher alloy content, it performs comparably to nickel-based alloys in extremely complex and harsh corrosive environments while offering better cost efficiency [5]. However, its high degree of alloying leads to coarse microstructures and severe casting segregation during solidification, with complex types of precipitated phases, posing significant challenges for industrial production [6,7]. Studies indicate that when the chromium (Cr) content in stainless steel exceeds a certain threshold (typically above 20 wt.%), the precipitation of the sigma (σ) phase becomes inevitable [8]. In SASS, the σ phase precipitation is one of the main causes of material property degradation. Even small amounts of σ phase can significantly reduce toughness and cause embrittlement, which has received considerable attention [9].
Microalloying is considered an economical and effective method for controlling secondary phases. Among these, rare earth elements such as cerium (Ce) and yttrium (Y) are regarded as beneficial additives that help improve the microstructure and properties of stainless steels [10]. The addition of small amounts of Ce (50–100 ppm) to 27Cr–7Ni stainless steel can delay the precipitation of harmful secondary phases, thereby enhancing its corrosion resistance and mechanical properties [11]. Zhang et al. found that the addition of Ce in S32654 SASS significantly refines the dendritic structure and the σ phase [12]. This refinement mechanism is mainly attributed to the synergistic effect between Ce inclusions and solute Ce: the presence of Ce improves the eutectic precipitation conditions of the σ phase, promoting its nucleation, while the refinement of the dendritic structure restricts its subsequent growth space [10]. Wang et al. [13] further pointed out that adding Ce to S31254 SASS accelerates the nucleation and precipitation of the δ phase in the interdendritic residual liquid. Ce enriches at the solid–liquid interface front, increasing the undercooling of the residual liquid and effectively inhibiting the formation of the σ phase. The regulatory effect of yttrium has also attracted growing research interest. Wang J. et al. [14] found that Y can effectively suppress the precipitation of the σ phase and Cr2N phase at grain boundaries during the aging treatment of 6Mo SASS, significantly improving its intergranular corrosion resistance and mechanical properties. Moreover, Y can notably enhance the high-temperature oxidation resistance of SASS [15]. However, some studies have also indicated that excessive addition of rare earth elements may promote the formation of certain precipitated phases, adversely affecting material properties [16].
The precipitation mechanism and extent of the σ phase directly influence the performance of SASS. In stainless steels, the σ phase mainly forms through three routes [17]: (1) continuous or discontinuous precipitation from ferrite: δ → σ; (2) eutectoid decomposition of ferrite: δ → γ2 + σ; and (3) eutectoid decomposition of austenite: γ → γ2 + σ. Marin R. [18], studying the solidification path of S31254 SASS, showed that the σ phase forms in the solid state via the eutectoid decomposition of δ ferrite: δ → σ + γ2. Perricone M.J. et al. [8] pointed out that in austenitic stainless steels with an AF solidification mode (L → L + γ → L + γ + δ → γ + δ), the formation of the σ phase can be explained by the solid-state eutectoid decomposition of δ ferrite. Lee C. [19] and Banovic [20] noted that the σ phase in the solidification microstructure forms due to solute segregation of Mo and Cr elements, precipitating from the residual liquid at the final stage of solidification through a eutectic reaction.
Although there has been extensive research on the precipitation of the σ phase in SASS, the precipitation mechanism of the σ phase during the solidification of S32654 remains somewhat controversial. Previous studies have mostly focused on low-Mo-content SASS, primarily investigating the σ phase precipitation and related mechanisms during aging. Currently, research on the effect of yttrium on the solidification microstructure and σ phase precipitation in S32654 is relatively scarce. This study systematically characterizes the morphology, distribution, and precipitation features of the σ phase in as-cast S32654. Using High-temperature confocal scanning laser microscopy (HT-CLSM), the effect of the rare earth element Y on the solidification microstructure and σ phase precipitation was investigated, revealing the regulatory mechanism by which Y controls σ phase precipitation during the solidification of S32654. This research lays a theoretical foundation and provides practical guidance for optimizing the solidification microstructure of SASS and improving material quality.

2. Experiment Procedure

The raw materials used in this study were super austenitic stainless steel ingots melted in a vacuum induction melting (VIM) furnace, with their chemical compositions listed in Table 1. The original sample is designated as S32654, while another set of samples with an addition of 0.0037 wt.% yttrium is designated as S32654Y. The nitrogen content in the ingots was measured using an oxygen–nitrogen–hydrogen analyzer, and the rare earth yttrium content was determined by inductively coupled plasma mass spectrometry (ICP-MS). The contents of other elements were measured by inductively coupled plasma optical emission spectrometry (ICP-OES). After cutting from the ingots, the specimens were first ground with sandpaper and mechanically polished, followed by surface treatment using an electrolytic etching process under the conditions of 10% oxalic acid solution, 2.5 V voltage, 0.1 A/cm2 current density, and a duration of 120 s. The as-cast microstructure morphology was observed using a LEICA DM2700M (Leica Microsystems GmbH, Wetzlar, Germany) optical microscope. Secondary dendrite arm spacing and phase fractions were analyzed and quantified using ImageJ (v1.8.0) software. Detailed microstructural features were examined with a ZEISS Gemini 500 (Carl Zeiss AG, Oberkochen, Germany) field emission scanning electron microscope (FE-SEM), and the chemical composition of secondary phases and inclusions were characterized by an energy-dispersive spectrometer (EDS) equipped with an ULTIM MAX 40 (Oxford Instruments NanoAnalysis, High Wycombe, UK) system. To observe the three-dimensional morphology of the precipitated phases, the specimens underwent electrolytic etching for 5 min (10% oxalic acid, 10 V voltage, 0.1 A/cm2 current density), followed immediately by thorough rinsing with plenty of water, then wiping with alcohol and drying with air. Finally, the morphology of the precipitates was observed under the SEM.
The solidification and solid-state phase transformation processes of SASS were observed in situ using a high-temperature laser confocal scanning microscope (VL2000DX HT-CLSM, Yonekura Manufacturing Co., Ltd., Yokohama, Kanagawa, Japan). The experimental samples were cylindrical specimens with a diameter of 7.5 mm and a height of 3.5 mm. The samples were first heated to 1500 °C and held for 5 min, then cooled at a controlled rate of 30 °C/min to 1200 °C, followed by rapid cooling to room temperature. After the HT-CLSM experiments, the morphology and elemental distribution of the samples were analyzed using a FE-SEM. The bottom surfaces of the HT-CLSM samples were subjected to electrolytic etching, and their microstructures were observed by optical microscopy. Electron backscatter diffraction (EBSD) analysis was performed using an Oxford Symmetry S2 (Oxford Instruments NanoAnalysis, High Wycombe, UK) system. Prior to EBSD, the samples were mechanically polished and then electrolytically polished using a mixed solution of 10% perchloric acid and 90% anhydrous ethanol by volume. In addition, thermodynamic calculations of SASS were conducted using Thermo-Calc software (TCFE10 database, 2022a, Thermo-Calc Software AB, Solna, Sweden) with the TCFE10 database to aid in understanding its phase transformation behavior and phase stability. Microhardness testing was performed on the samples using a test load of 9.8 N and a dwell time of 15 s. Nine points were measured on each sample, and the average microhardness value was calculated along with the corresponding error range.

3. Result and Discussions

3.1. Solidification Mode

The microstructure of austenitic stainless steels mainly depends on the compositional balance between austenite-stabilizing and ferrite-stabilizing elements, especially the contents of Ni and Cr. These elements influence the solidification process of the alloy to a certain extent. The effect of alloying elements on the microstructure of austenitic stainless steel is commonly described by the equivalents of nickel (Nieq) and chromium (Creq), which are used to establish different solidification modes [21]. According to the classical Creq/Nieq formula, the SASS used in this study has a Creq of 35.1, a Nieq of 34.1, and a Creq/Nieq ratio of 1.03 [22]. Based on this, the SASS exhibits an A-type solidification mode, where austenite forms first from the liquid phase: L → (γ + L) → γ, resulting in a fully austenitic solidified microstructure. It should be noted that the solidification mode of austenitic stainless steels is influenced not only by alloy composition but also by processing parameters such as temperature gradient, cooling rate, and solid–liquid interface growth rate.
Nieq = Ni% + 30C% + 30N% + 0.5Mn% + 0.25Cu%
Creq = Cr% + 1.5Mo% + 1.5Si%

3.2. Thermodynamic Calculations

The microstructure and properties of SASS undergo significant changes due to phase transformations and precipitation behaviors during solidification, and phase diagrams are important tools for analyzing the equilibrium phase transformations of materials. This study obtained the curve of stable phase fractions in the SASS matrix alloy as a function of temperature through thermodynamic calculations, as shown in Figure 1. The matrix microstructure is primarily austenite, with the main precipitated phases including the σ phase, Cr2N phase, Laves phase, and hcp phase. At temperatures above 1348 °C, the system consists solely of the liquid phase. When the temperature drops below 1348 °C, the γ phase begins to precipitate, and its fraction rapidly increases with further cooling. Upon further cooling to 1341 °C, a eutectic reaction occurs, L → γ + δ, and the δ phase starts to precipitate. Subsequently, the δ phase gradually transforms into the γ phase and completely disappears below 1276 °C. As the temperature continues to decrease, the γ phase transforms into the σ phase, which becomes the primary precipitated phase in SASS. At 1000 °C, the mass fraction of the σ phase reaches 15.8 wt.%.

3.3. Microstructure

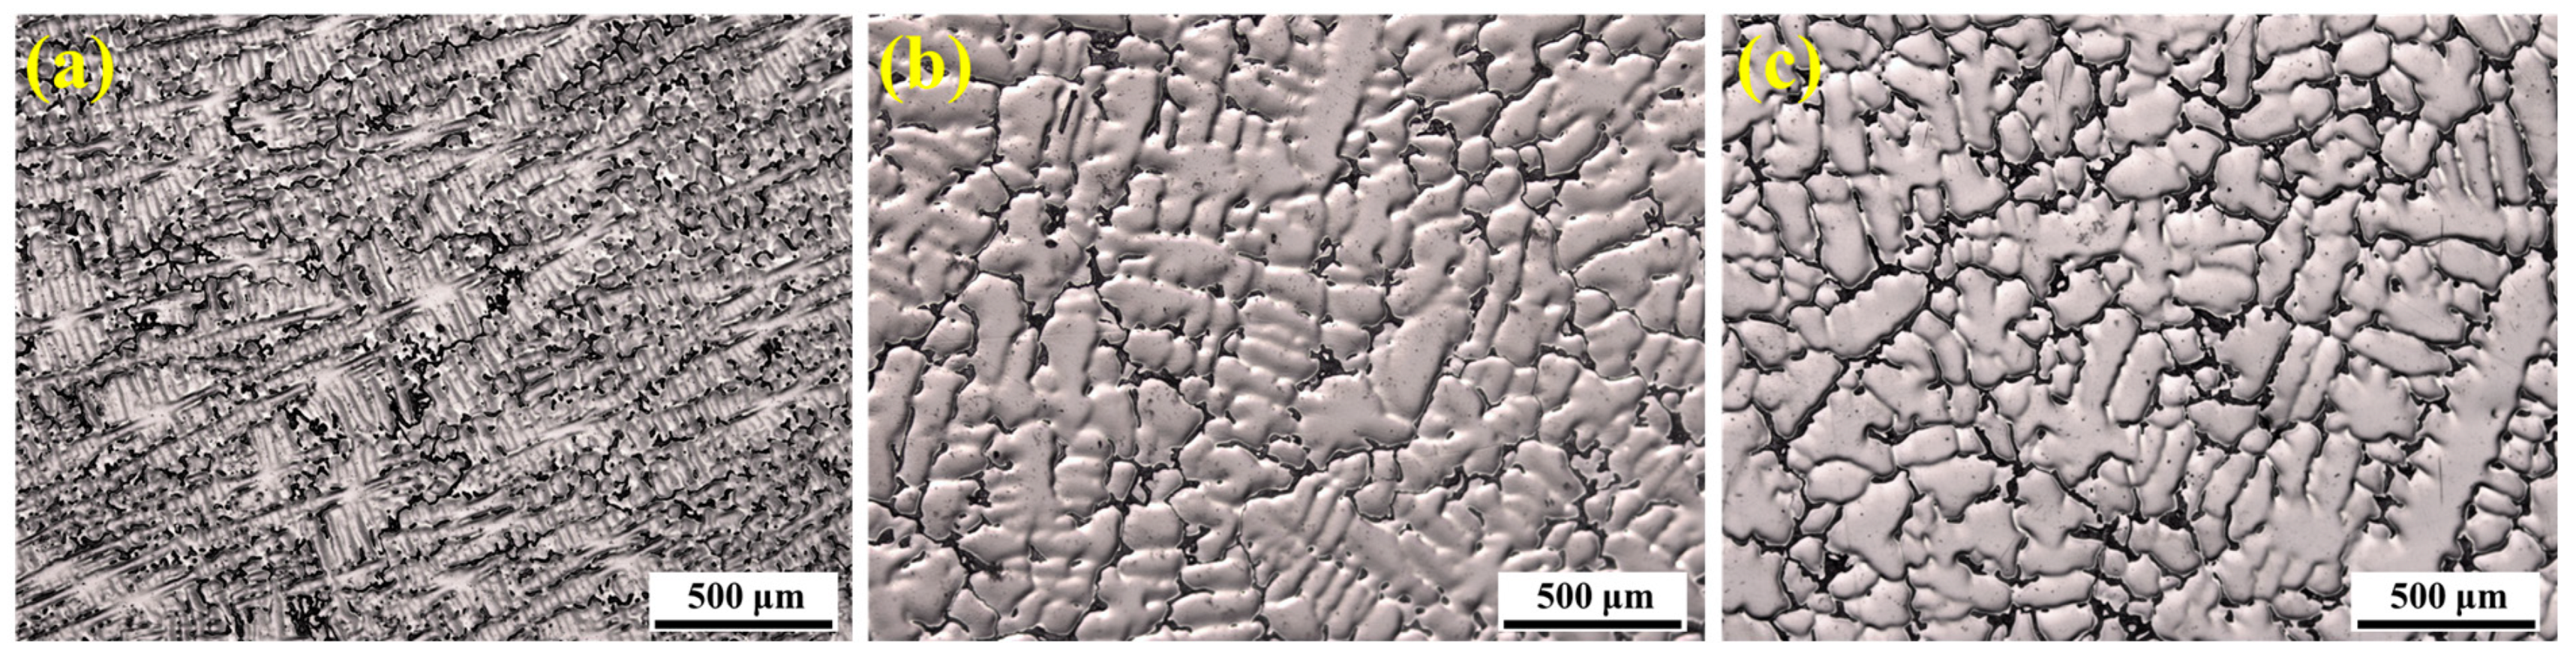
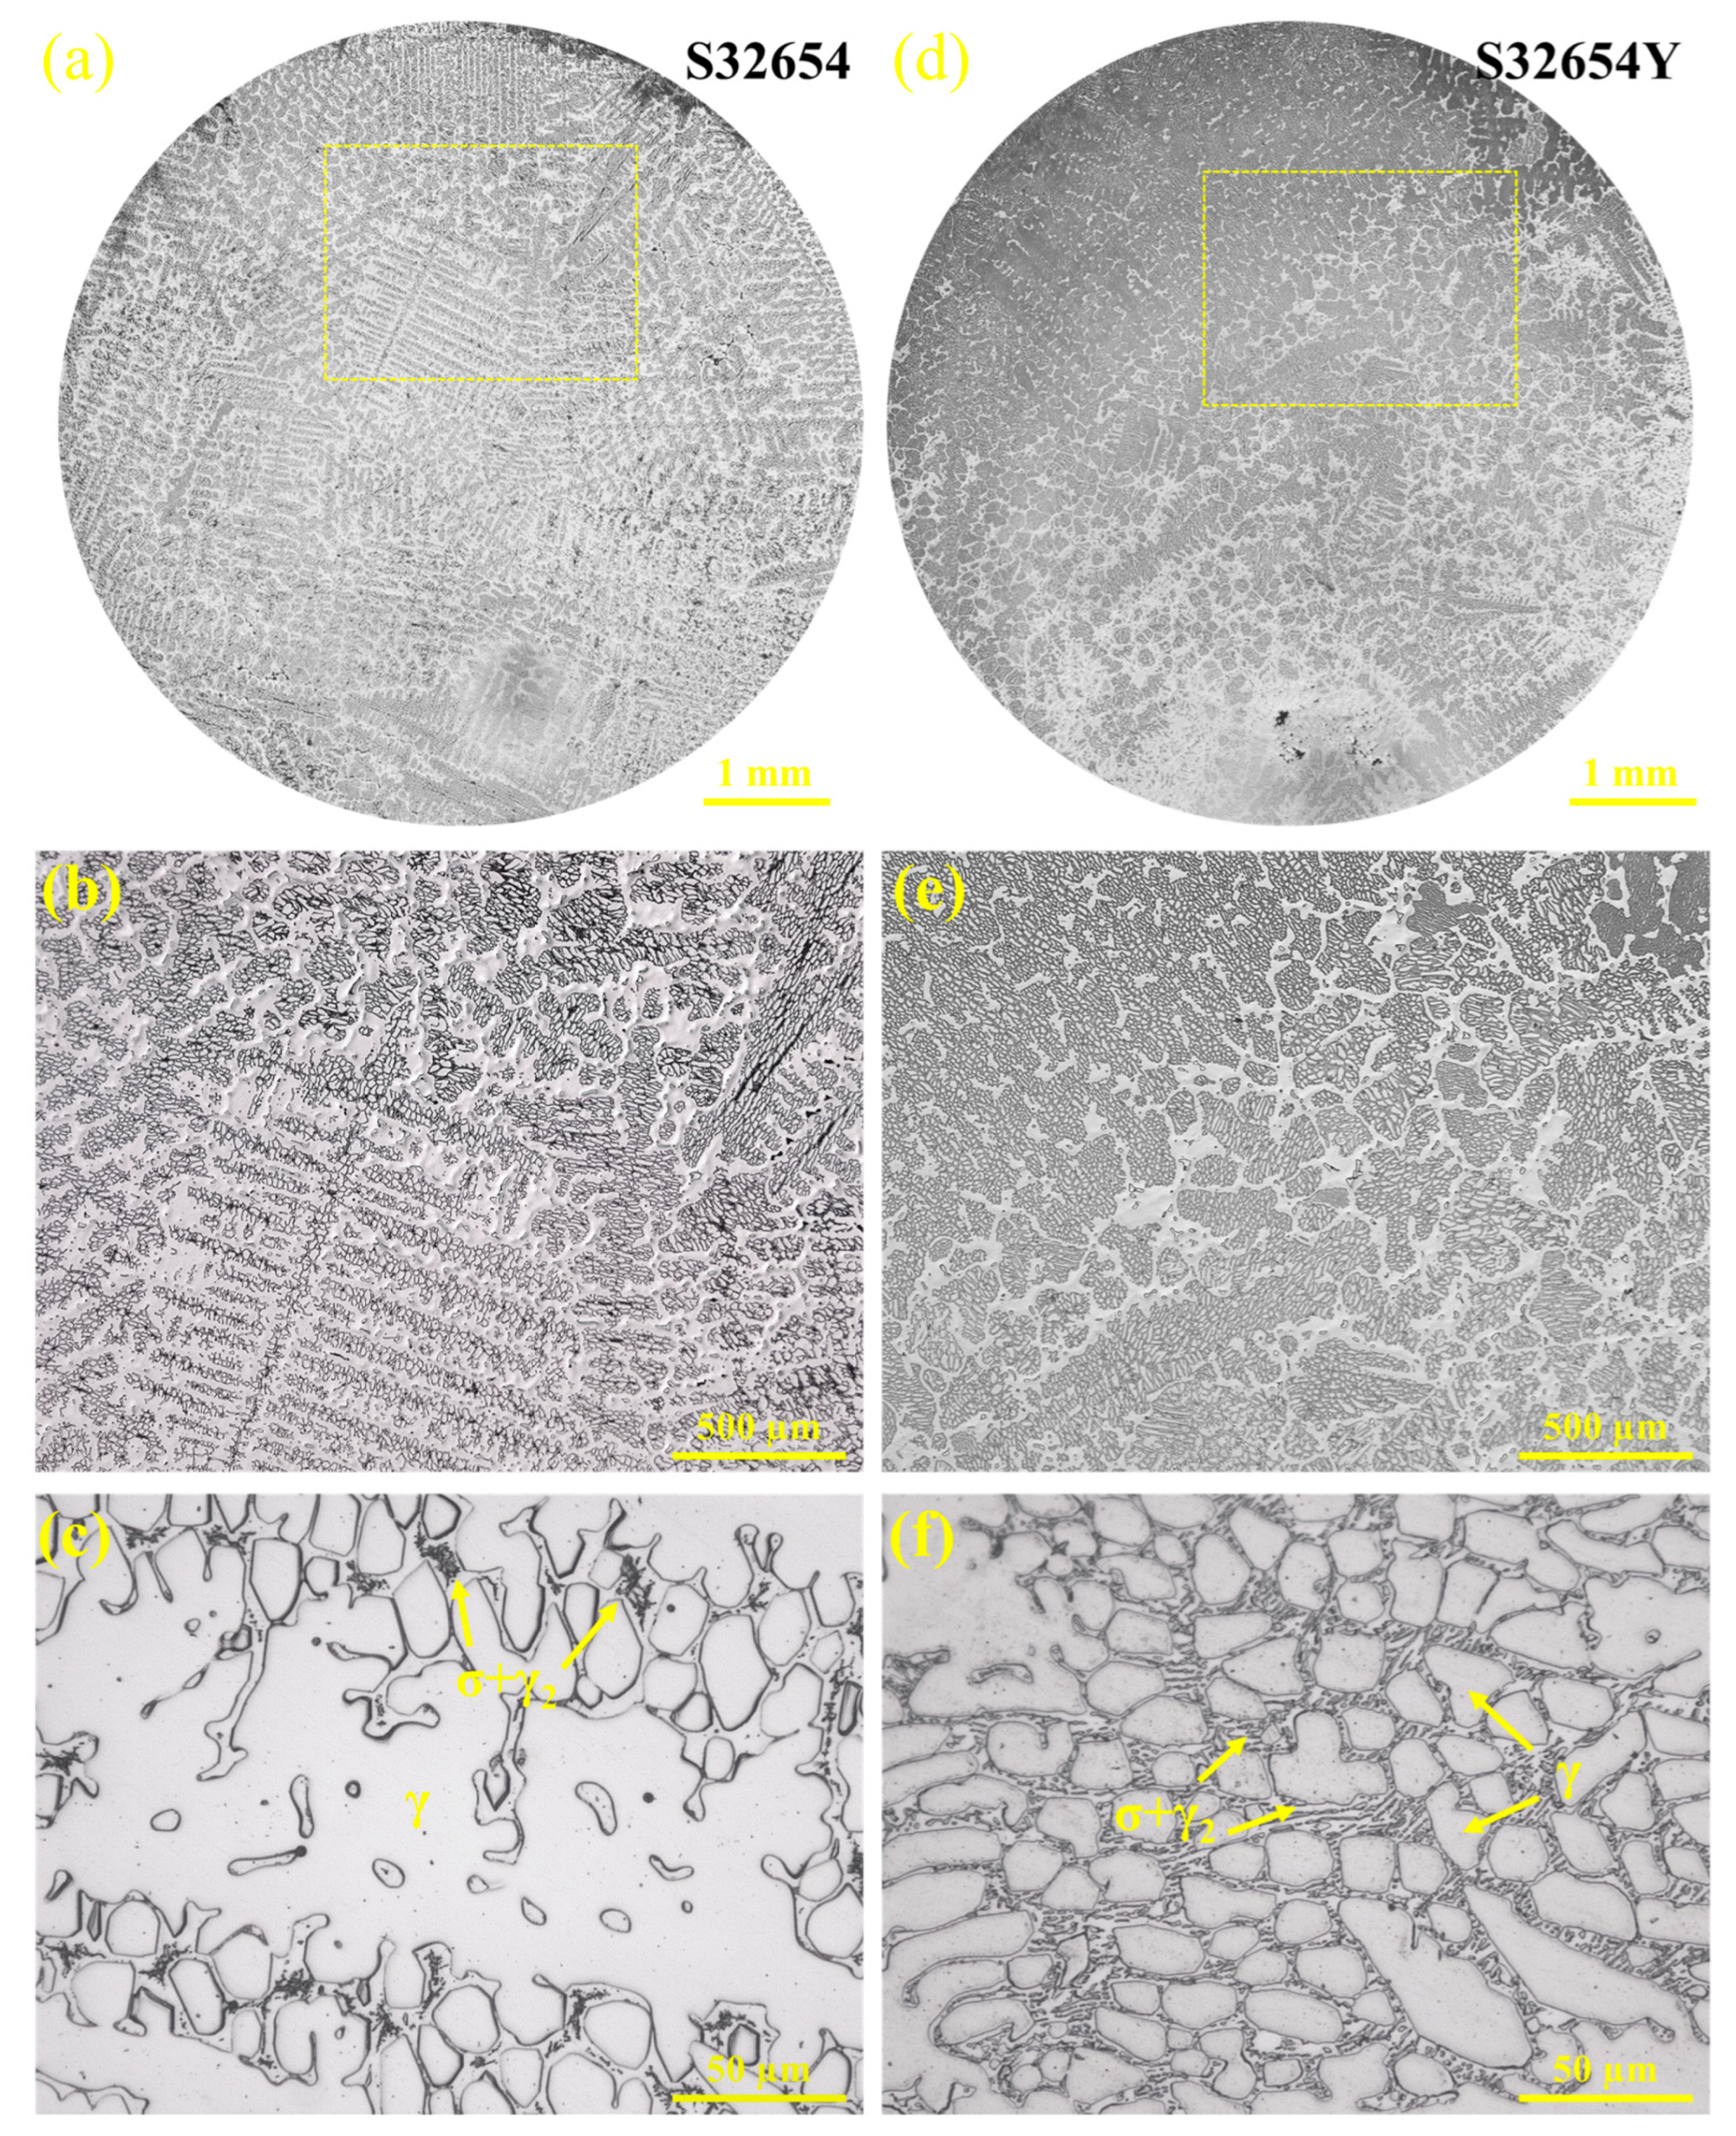
The dendritic microstructure at different locations of the S32654 ingot was observed using OM, as shown in Figure 2. The results indicate that a large number of black precipitates exist between the dendrites. Significant differences were observed in the dendrite morphology and secondary dendrite arm spacing at different locations. At the edge of the ingot, the solidification rate was relatively high, resulting in a well-developed and fine dendritic structure with numerous secondary dendrite arms. At the midpoint of the ingot radius (R/2), the reduced solidification rate caused obvious coarsening of the secondary dendrite arms. The center of the ingot exhibited an equiaxed grain structure with a coarser solidification microstructure. Overall, from the edge to the center, as the cooling rate decreased, the morphology of the precipitates changed from discrete to more continuous, and the size of irregularly shaped precipitates significantly increased.
During the alloy-solidification process, the growth of dendrites significantly influences macrosegregation, microsegregation, and pore distribution, which ultimately affect the mechanical properties of the material [
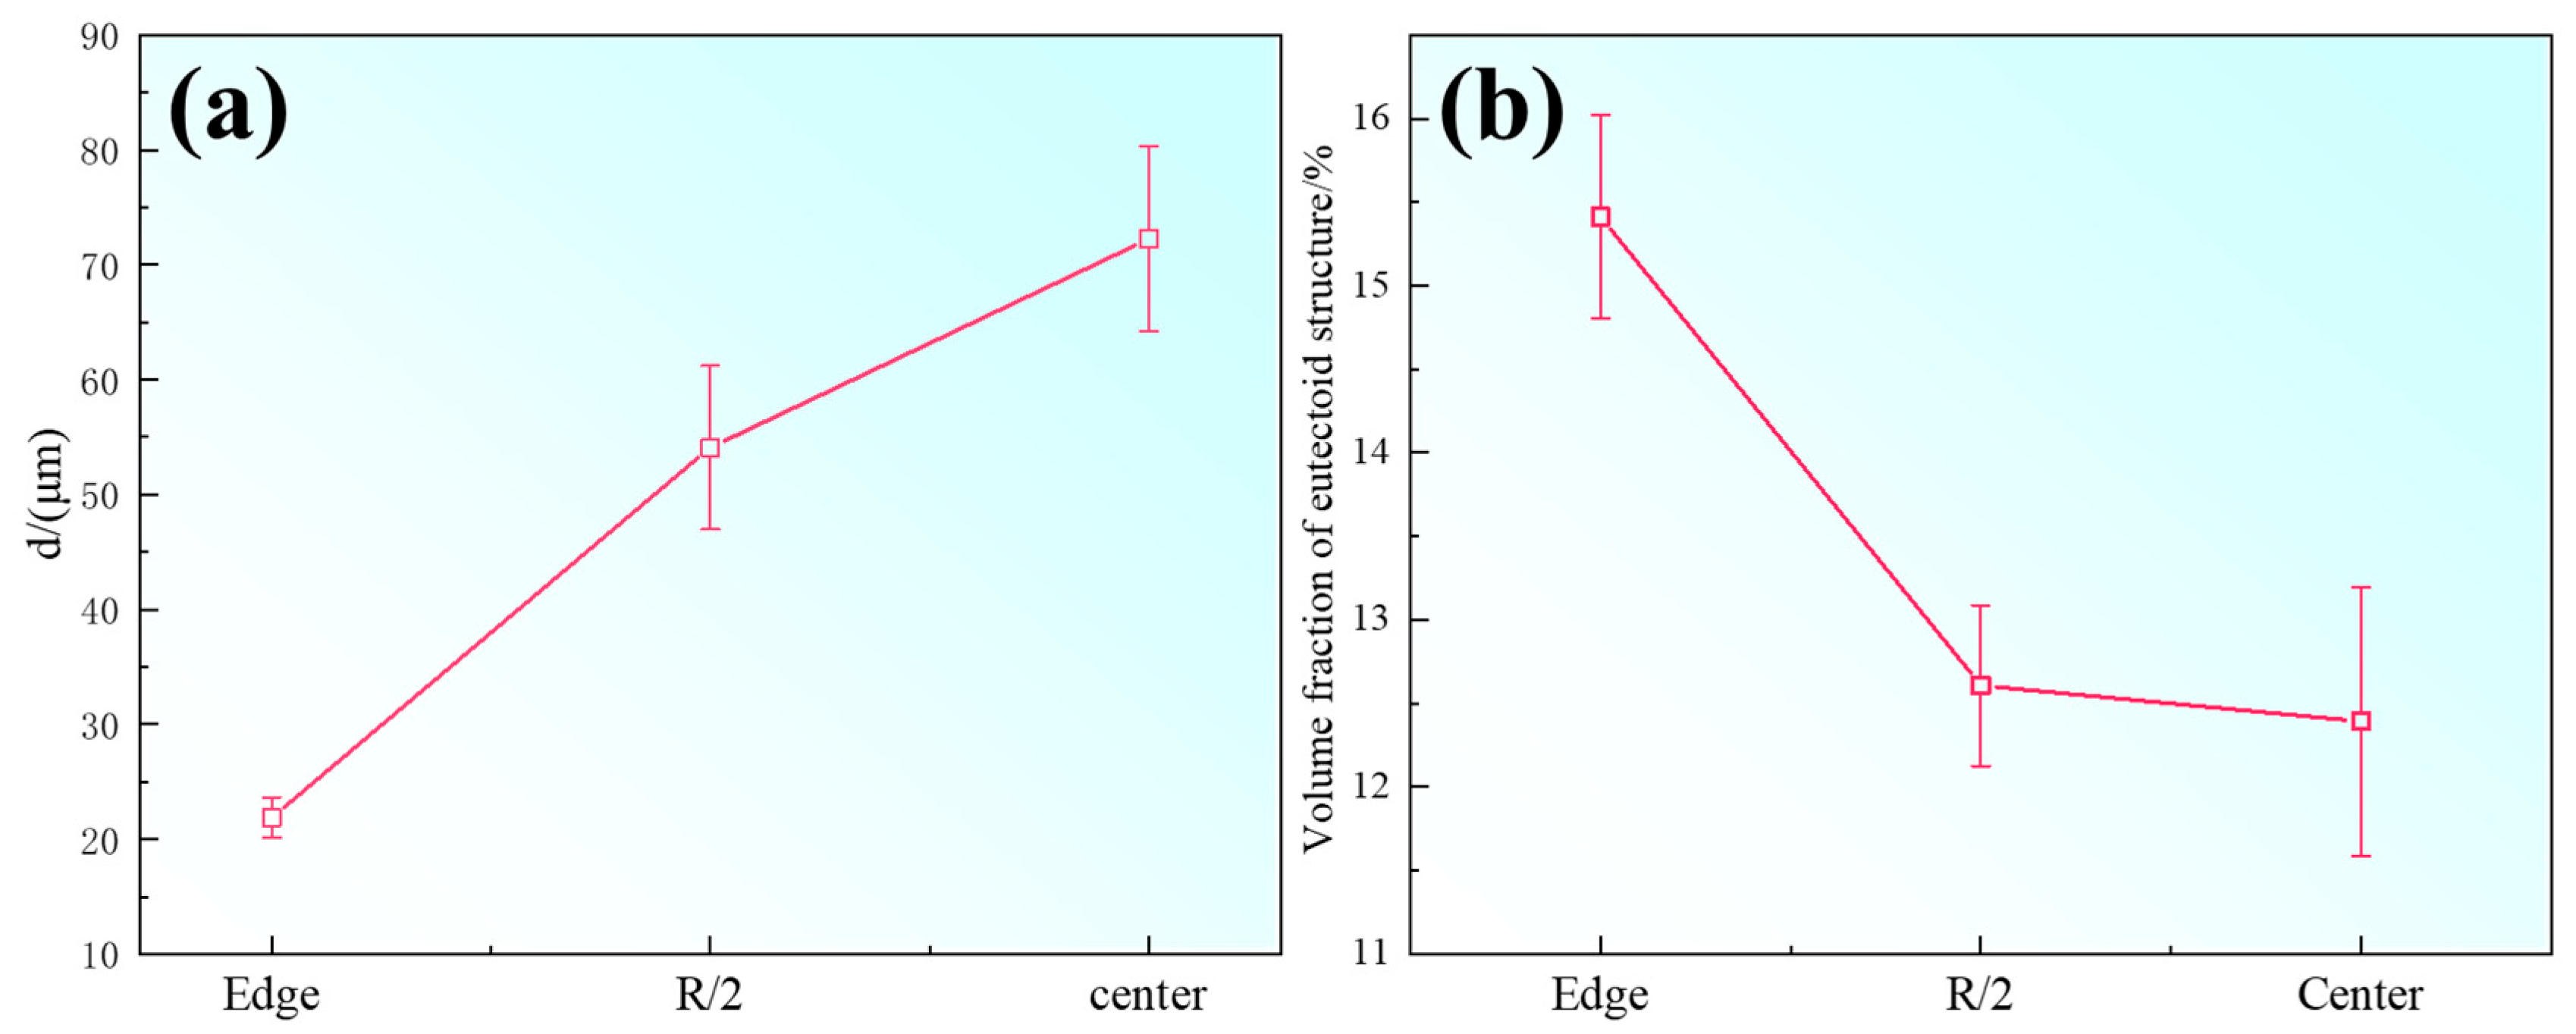
23]. The secondary dendrite arm spacing (SDAS) is an important indicator reflecting the degree of dendritic refinement. The SDAS at different locations of the ingot was measured, and the results are shown in Figure 3a. As the cooling rate decreases from the ingot edge toward the center, the secondary dendrite arm spacing increases significantly. Generally, a smaller SDAS corresponds to a narrower range of elemental segregation, making it easier to achieve microstructural homogenization of the stainless steel through solution treatment. Additionally, microscopic shrinkage porosity and inclusion distributions tend to be finer and more uniform, which is crucial for improving the performance of stainless steel.
Meanwhile, the volume fraction of eutectoid phases at different ingot locations was also measured, with results shown in Figure 3b. The volume fraction of eutectoid phases in the edge region is significantly higher than that at the center, showing an opposite trend to the variation of SDAS. Previous studies have shown [24] that in SASS ingots, the σ phase is mainly formed by the eutectoid decomposition of austenite. Under rapid cooling conditions, although overall diffusion is limited, the small dendrite spacing impedes the uniform diffusion of alloying elements (such as Cr and Mo), leading to severe local segregation; the σ phase forms precisely in these severely segregated interdendritic regions. With extended time and slower cooling at the ingot center, sufficient diffusion occurs, homogenizing element distribution and thereby reducing the conditions favorable for σ phase precipitation.
The microstructure morphology of the σ phase is shown in Figure 4. As illustrated in Figure 4a, there is a distinct interface between the σ phase and the γ phase. The eutectoid structure exhibits a clear honeycomb morphology, while the γ2 phase appears as a lamellar distribution. Figure 4b shows two cracks that penetrate through the γ2 phase and propagate along the σ phase, reflecting the hard and brittle nature of the σ phase. Its precipitation in the steel leads to material embrittlement. Konosu et al. [25] observed hot cracks in stainless steel weldments and found that cracks propagated along the γ/σ interface, which is the initial fracture site with low ductility and also a key nucleation site for the σ phase. Further observations revealed that the γ2 phase exhibits two distinct morphologies: one is a coral-like agglomeration (Figure 4c), and the other is a lamellar distribution on the plane (Figure 4d).
After deep etching, the SEM morphology of the eutectoid structure is shown in Figure 4e,f. The eutectoid structure between dendrites, after etching, forms a network of pits, while the matrix remains relatively intact. From Figure 4f, the corrosion traces of the lamellar eutectoid structure are evident; the σ phase has been etched away, whereas the γ2 phase is preserved. To further investigate the phase composition of the eutectoid structure, EBSD characterization was performed on the SASS, with results shown in Figure 4g–i. In these images, the σ phase is marked in blue, the γ austenite in green, and the γ2 phase is distributed as granular particles on the surface of the σ phase, forming a honeycomb structure.

3.4. Segregation Behavior

Typically, the σ phase formed during solidification is significantly coarser than that formed by solid-state phase transformation. Due to its large size, even solution treatment cannot fully dissolve the solidification σ phase, and the residual σ phase markedly deteriorates the material’s hot workability. Therefore, reducing elemental segregation in the solidification microstructure and effectively controlling σ phase precipitation are key factors for the stable production of the S32654 alloy [5]. 
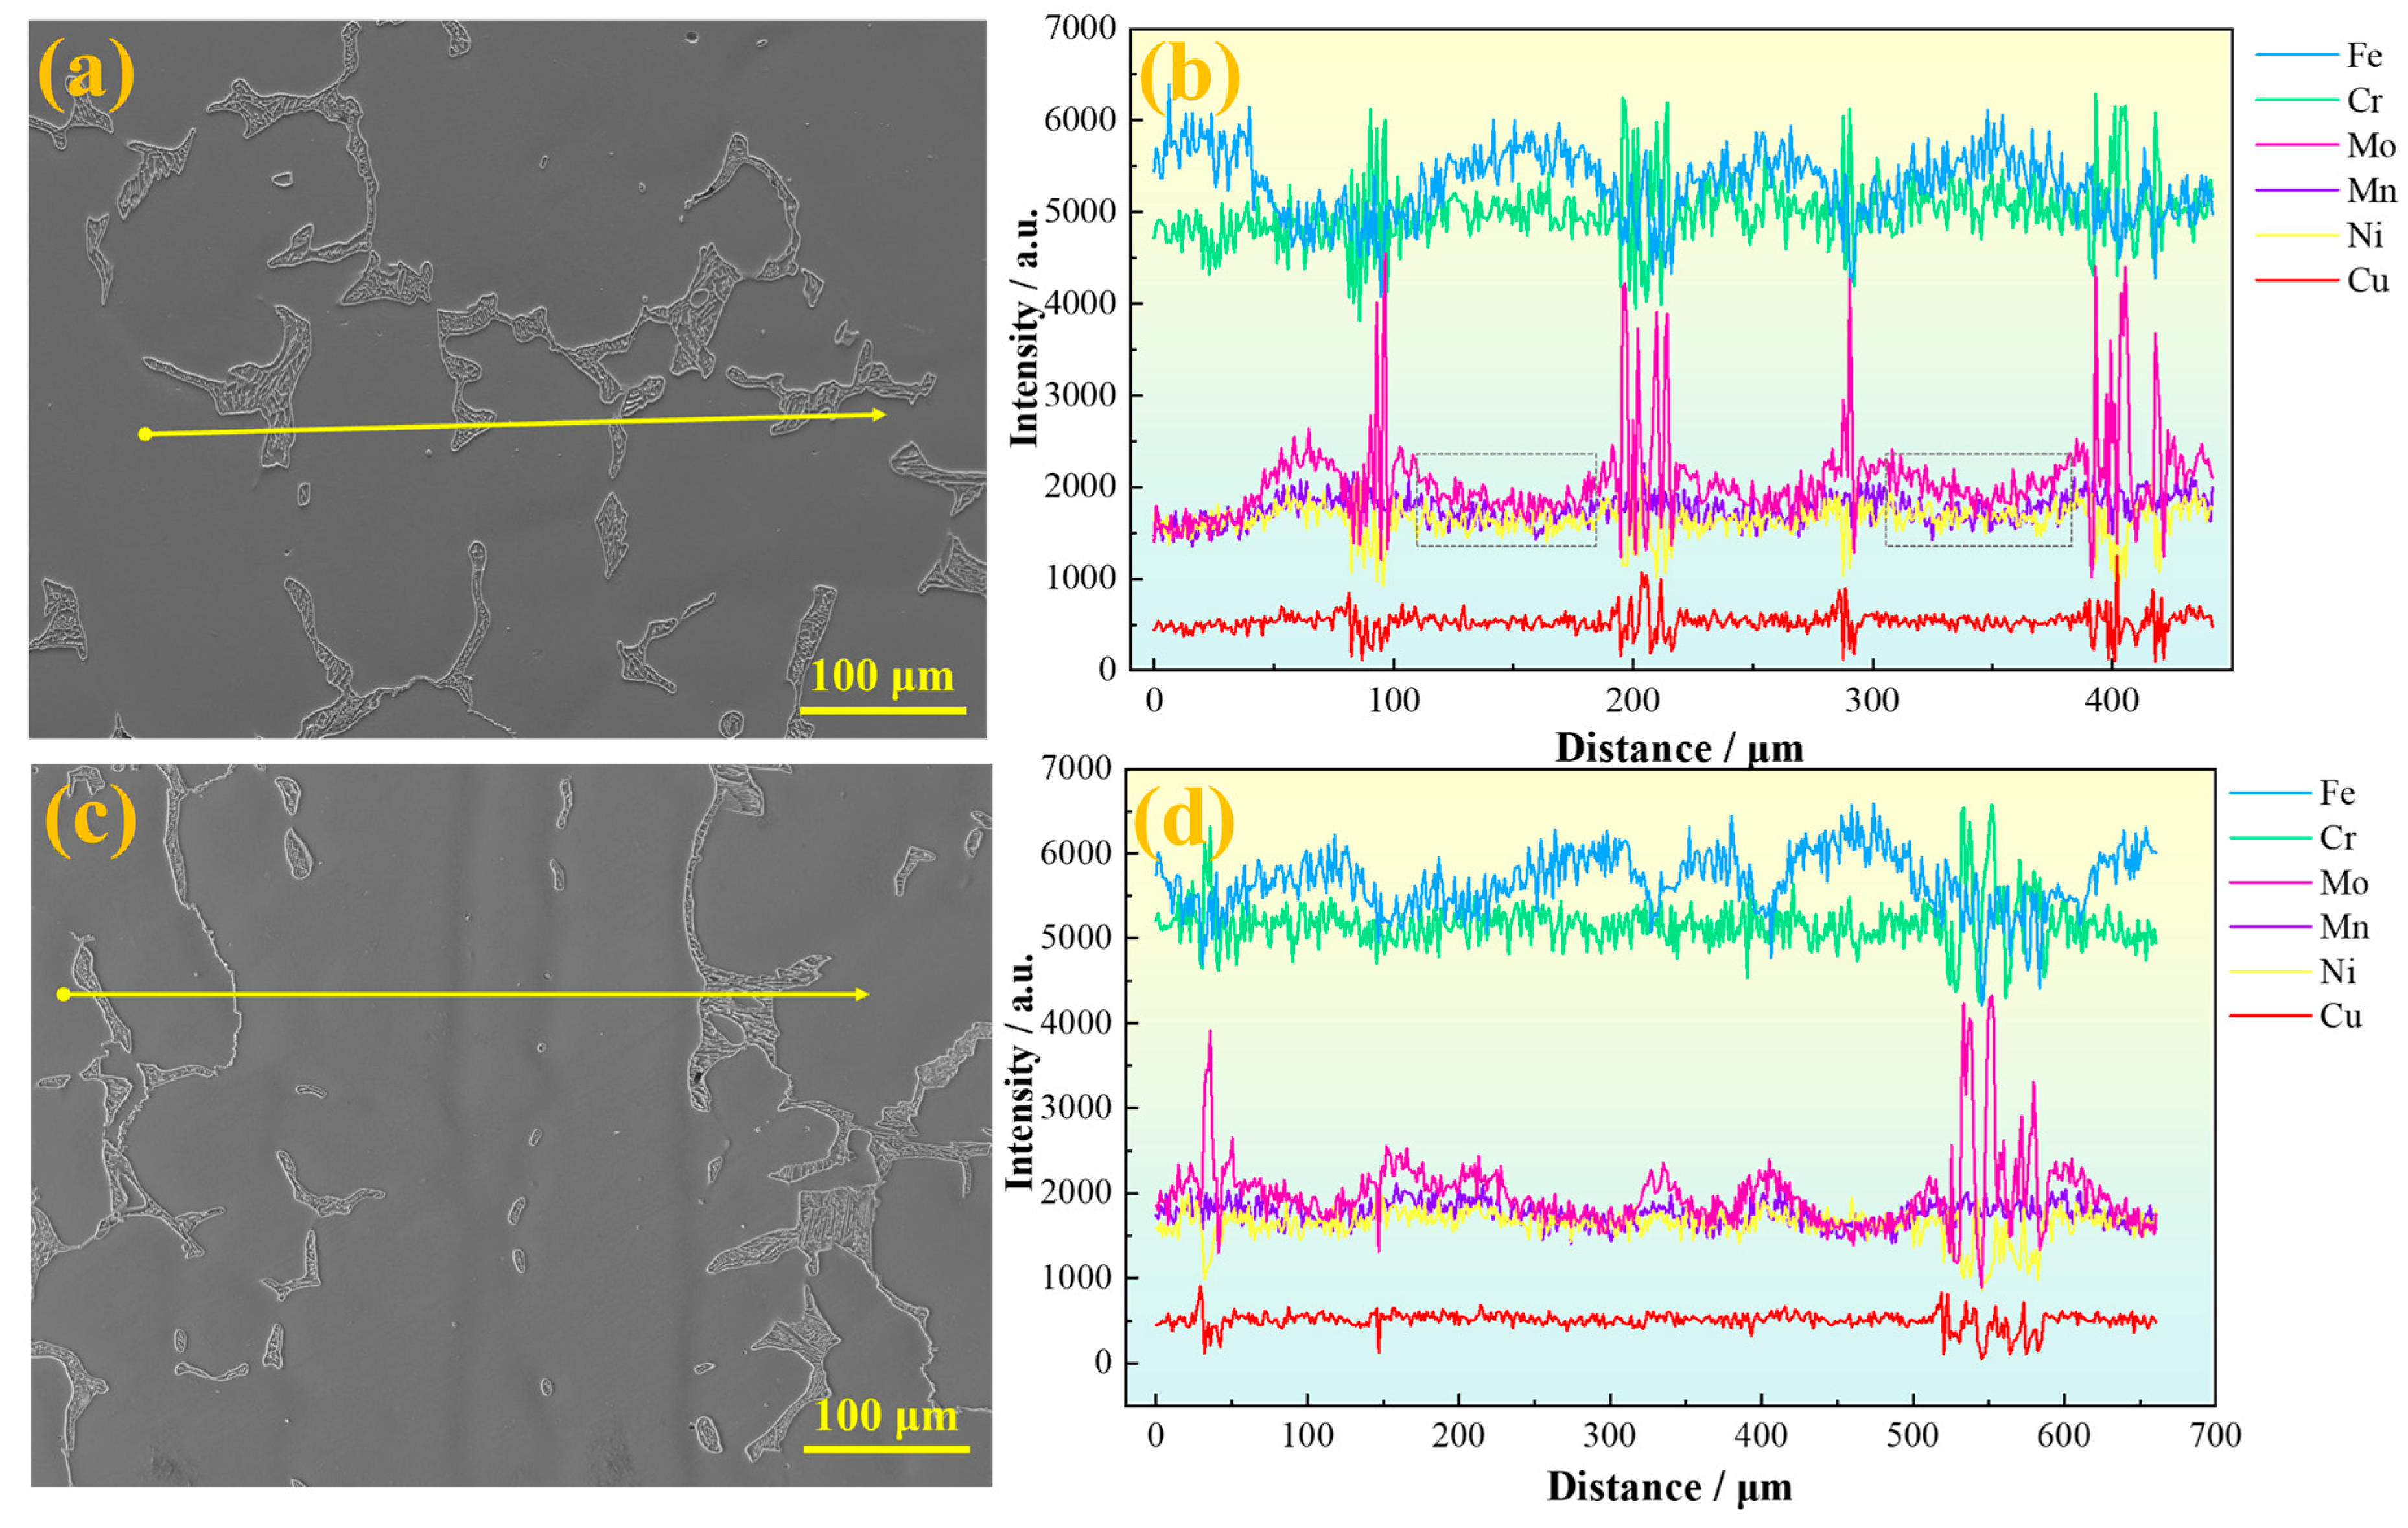
Figure 5a,b present line scan results parallel to the primary dendrite growth direction of the sample. Significant compositional fluctuations of various elements are observed in the secondary dendrite arm regions, especially around the eutectoid structure, where element contents vary drastically. Among these, Mo, Cr, and Fe exhibit pronounced fluctuations, while Mn shows relatively minor variations. As indicated by the gray box in Figure 5b, the distribution curve of Mo on the austenite matrix shows a typical concave profile, with a lower concentration at the center and higher concentrations at both edges. This pattern results from Mo’s partition coefficient being less than 1: dendrites first solidify from the liquid, with the central dendrite region forming earliest, causing the lowest Mo concentration there. The interdendritic regions solidify later, retaining Mo-enriched residual liquid that eventually forms Mo-rich segregated areas. During dendrite lateral growth, solute elements like Mo are progressively rejected toward the dendrite sides and interdendritic zones, further intensifying segregation.
Figure 5c,d show line scan results perpendicular to the dendrite trunk direction. It can be seen that Mo exhibits obvious positive segregation in the interdendritic regions. Slight Mo enrichment is also observed in the austenite regions at the center of secondary dendrites, although eutectoid structures have not yet formed there. The greater the amplitude of Mo content fluctuation, the easier it is for eutectoid structures to be induced in the interdendritic areas. Since SASS inherently contains a high Mo content, and Mo tends to segregate in interdendritic regions, combined with the relatively low diffusion rates of other alloying elements in austenite, this further aggravates Mo segregation and ultimately promotes the precipitation of brittle σ phase [26].
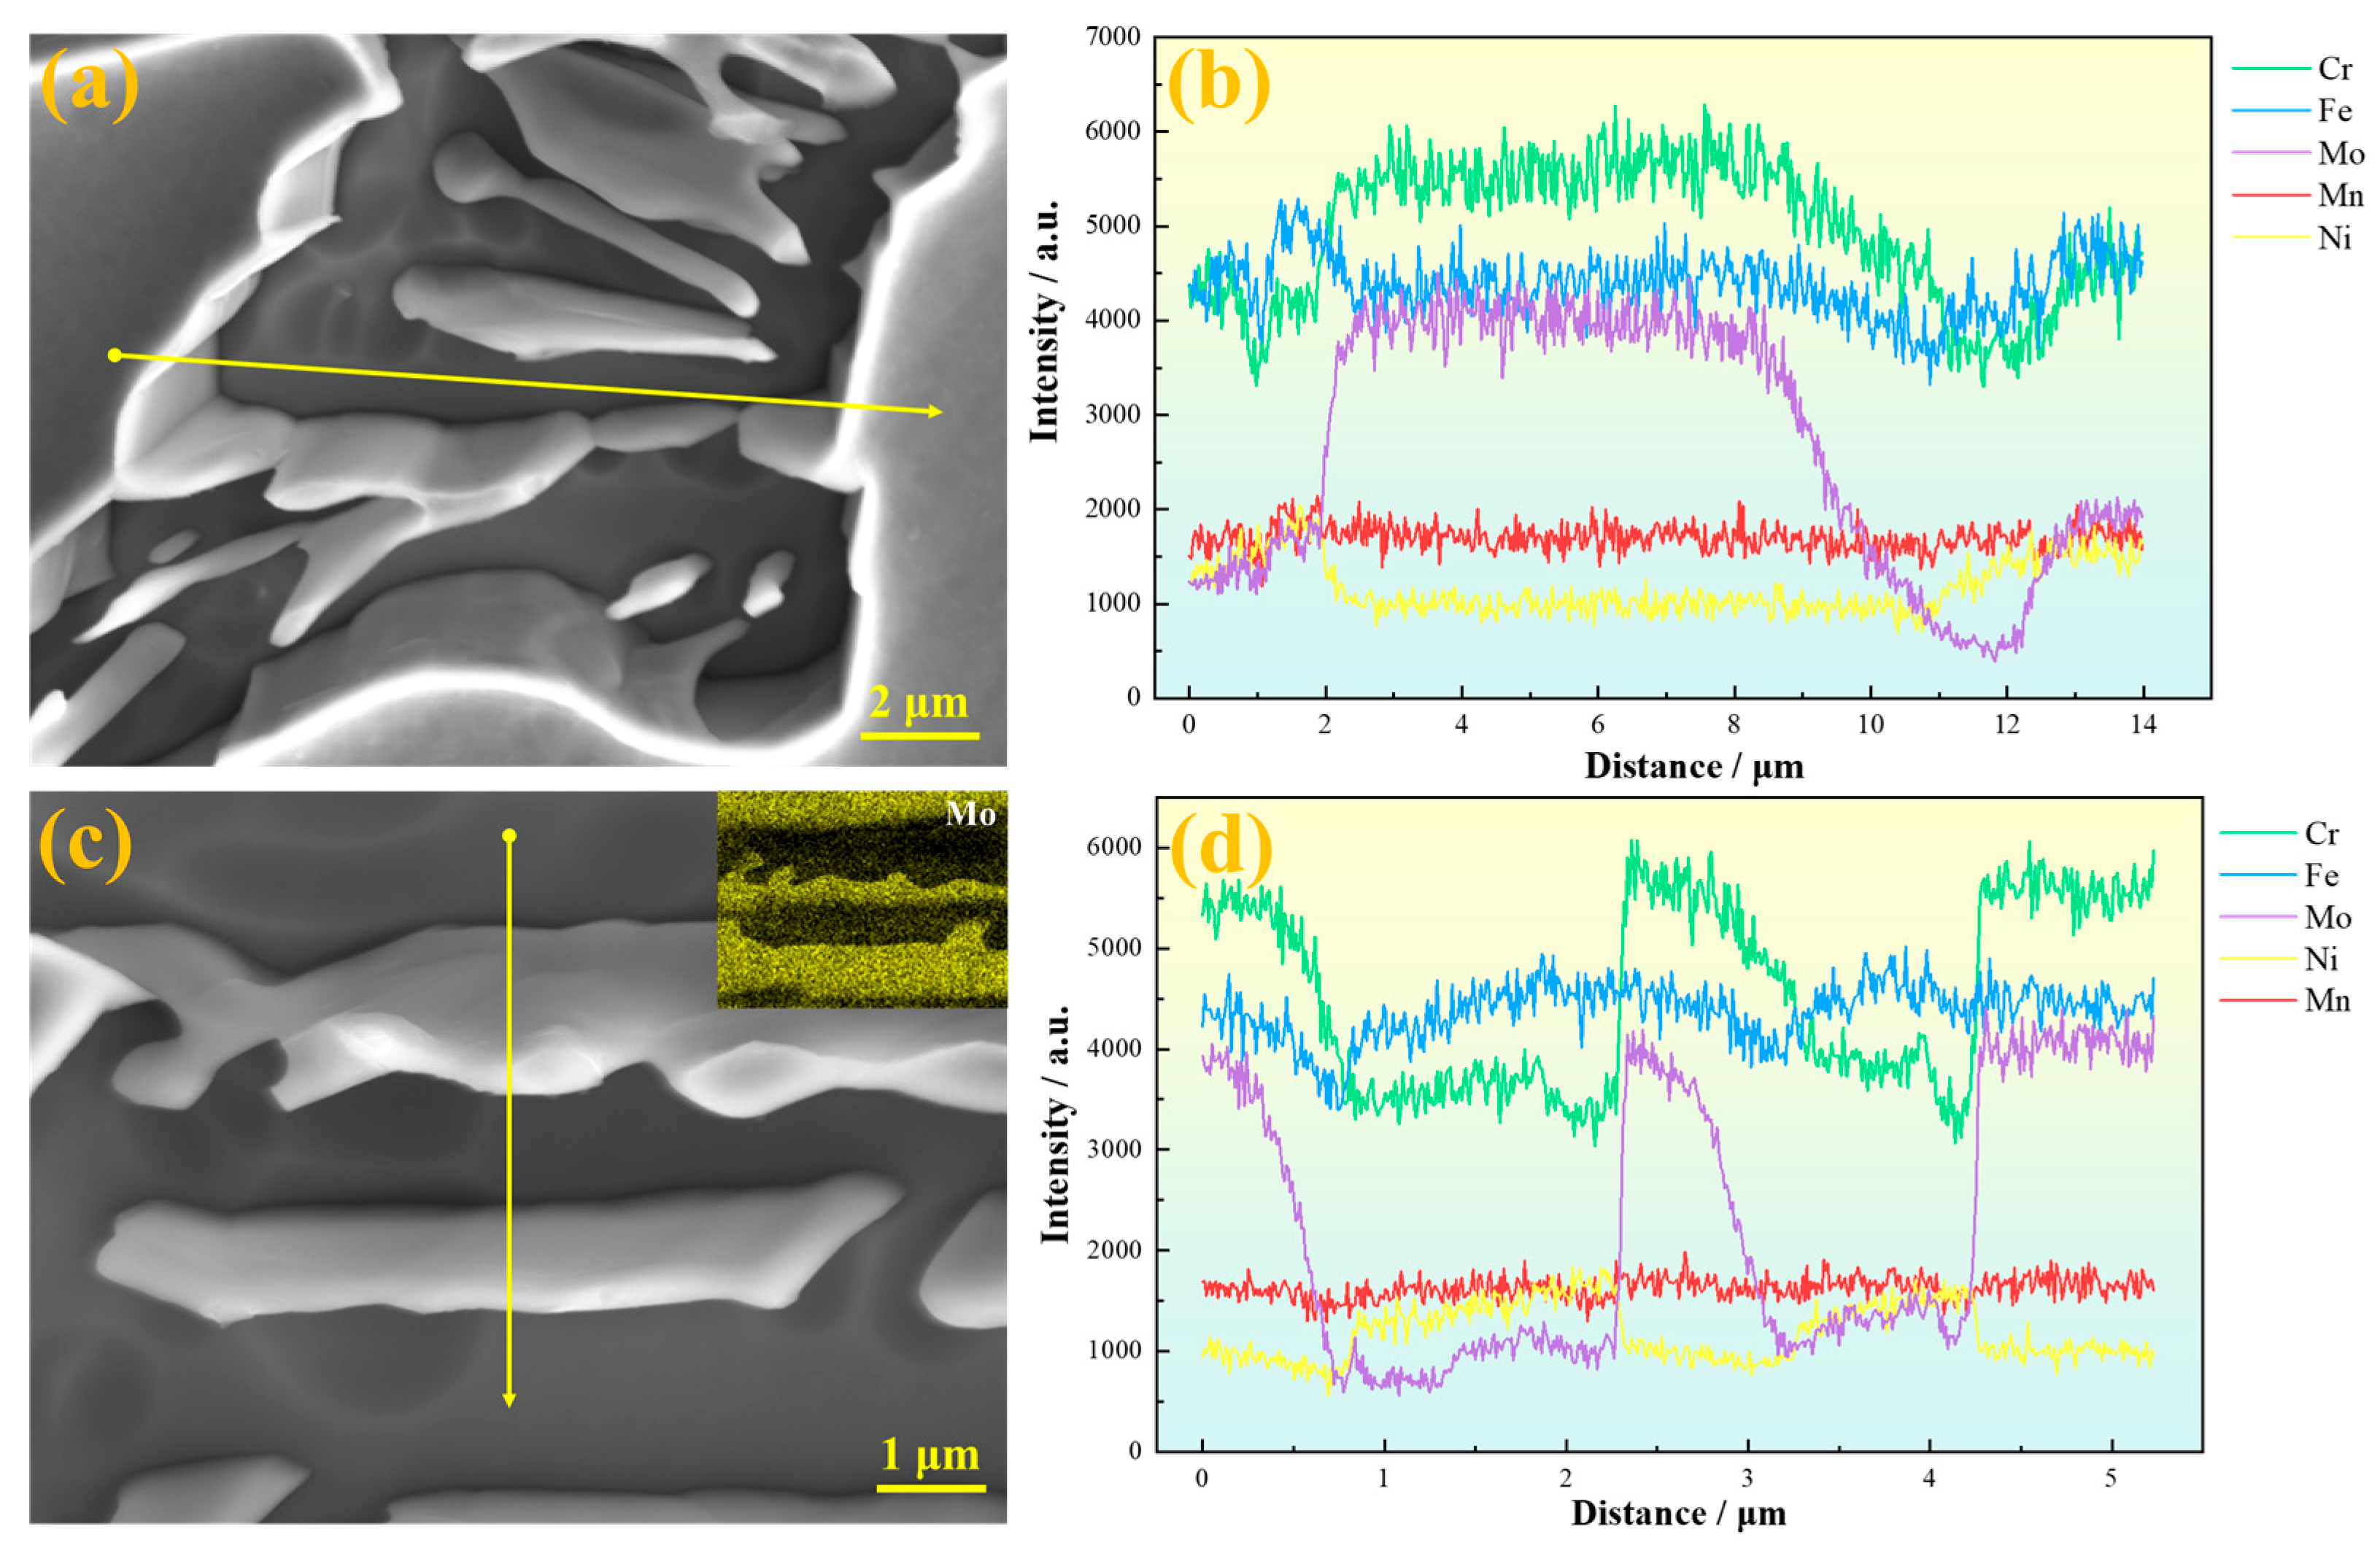
To further clarify the elemental distribution around the eutectoid structure, energy-dispersive spectroscopy (EDS) analysis was conducted, and the results are shown in Figure 6. The line scan path in Figure 6a crosses the austenitic matrix and σ phase, revealing a clear depletion of Cr and Mo elements around the σ phase, with Mo depletion being more pronounced. This elemental depletion significantly reduces the pitting corrosion resistance in these regions. Figure 6c,d present line scan results within the eutectoid structure. A distinct compositional gradient is observed at the γ2/σ phase interface. Cr and Mo elements are relatively uniformly distributed in the γ2 phase, whereas their distributions fluctuate within the σ phase, indicating a relatively faster diffusion rate of Cr and Mo in the γ2 phase. Furthermore, the EDS area scan shown in the upper right corner of Figure 6c corroborates these findings, with the most pronounced contrast in Mo content between the γ2 and σ phases, consistent with the line scan results.
The compositional inhomogeneity caused by dendritic segregation leads to microstructural differences, which significantly affect the material’s properties. To characterize the degree of microsegregation in the solidified structure of SASS, the segregation ratio at the center of the ingot was measured using EDS point scanning:
K = C interdendritic C dendritie   arm
C interdendritic represents the average elemental concentration in the interdendritic region, while C dendritie   arm denotes the average concentration in the dendrite arms, which is used to quantify the degree of microsegregation in the solidified structure. Twenty regions each were selected in the interdendritic and dendrite cores for compositional analysis to reduce experimental error. The measurement results are shown in Figure 7a. The results indicate that the degree of elemental segregation follows the order: Mo > Ni > Mn > Fe > Cr. Among them, Mo exhibits the most severe segregation with a segregation ratio of 1.69. Besides Mo, Ni also shows significant segregation behavior, with a segregation ratio of 0.85, indicating notable Ni enrichment during solidification.
The average compositions of the σ phase, γ phase, and γ2 phase in SASS were statistically analyzed, with the results shown in Figure 7b. Here, Cγ2 and Cσ represent the elemental contents in the γ2 phase and σ phase, respectively, and Cσ/Cγ2 denotes their content ratio. The results indicate that Mo exhibits the largest difference in content between the γ2 and σ phases, with a Cσ/Cγ2 ratio reaching 3.19; next is Ni, with a Cσ/Cγ2 ratio of 0.49. Therefore, besides the diffusion behavior of Mo and Cr, the diffusion characteristics of Ni in the S32654 alloy should also not be overlooked. Comparing the compositions of austenite and γ2 phases reveals that the γ2 phase contains more Ni and Mn but less Cr and Mo. This suggests that during σ phase precipitation, a large amount of Mo and Cr preferentially segregate into the σ phase, accompanied by the depletion of Ni and Mn, leading to a relative increase in Ni content in the γ2 phase. It is worth noting that due to the lower content of corrosion-resistant elements such as Cr and Mo in the newly formed γ2 phase, its pitting resistance equivalent number (PREN) significantly decreases, resulting in relatively poor corrosion resistance of the γ2 phase [27].

3.5. In Situ Observation of Melting and Solidification Processes Under High Temperature Confocal Microscopy

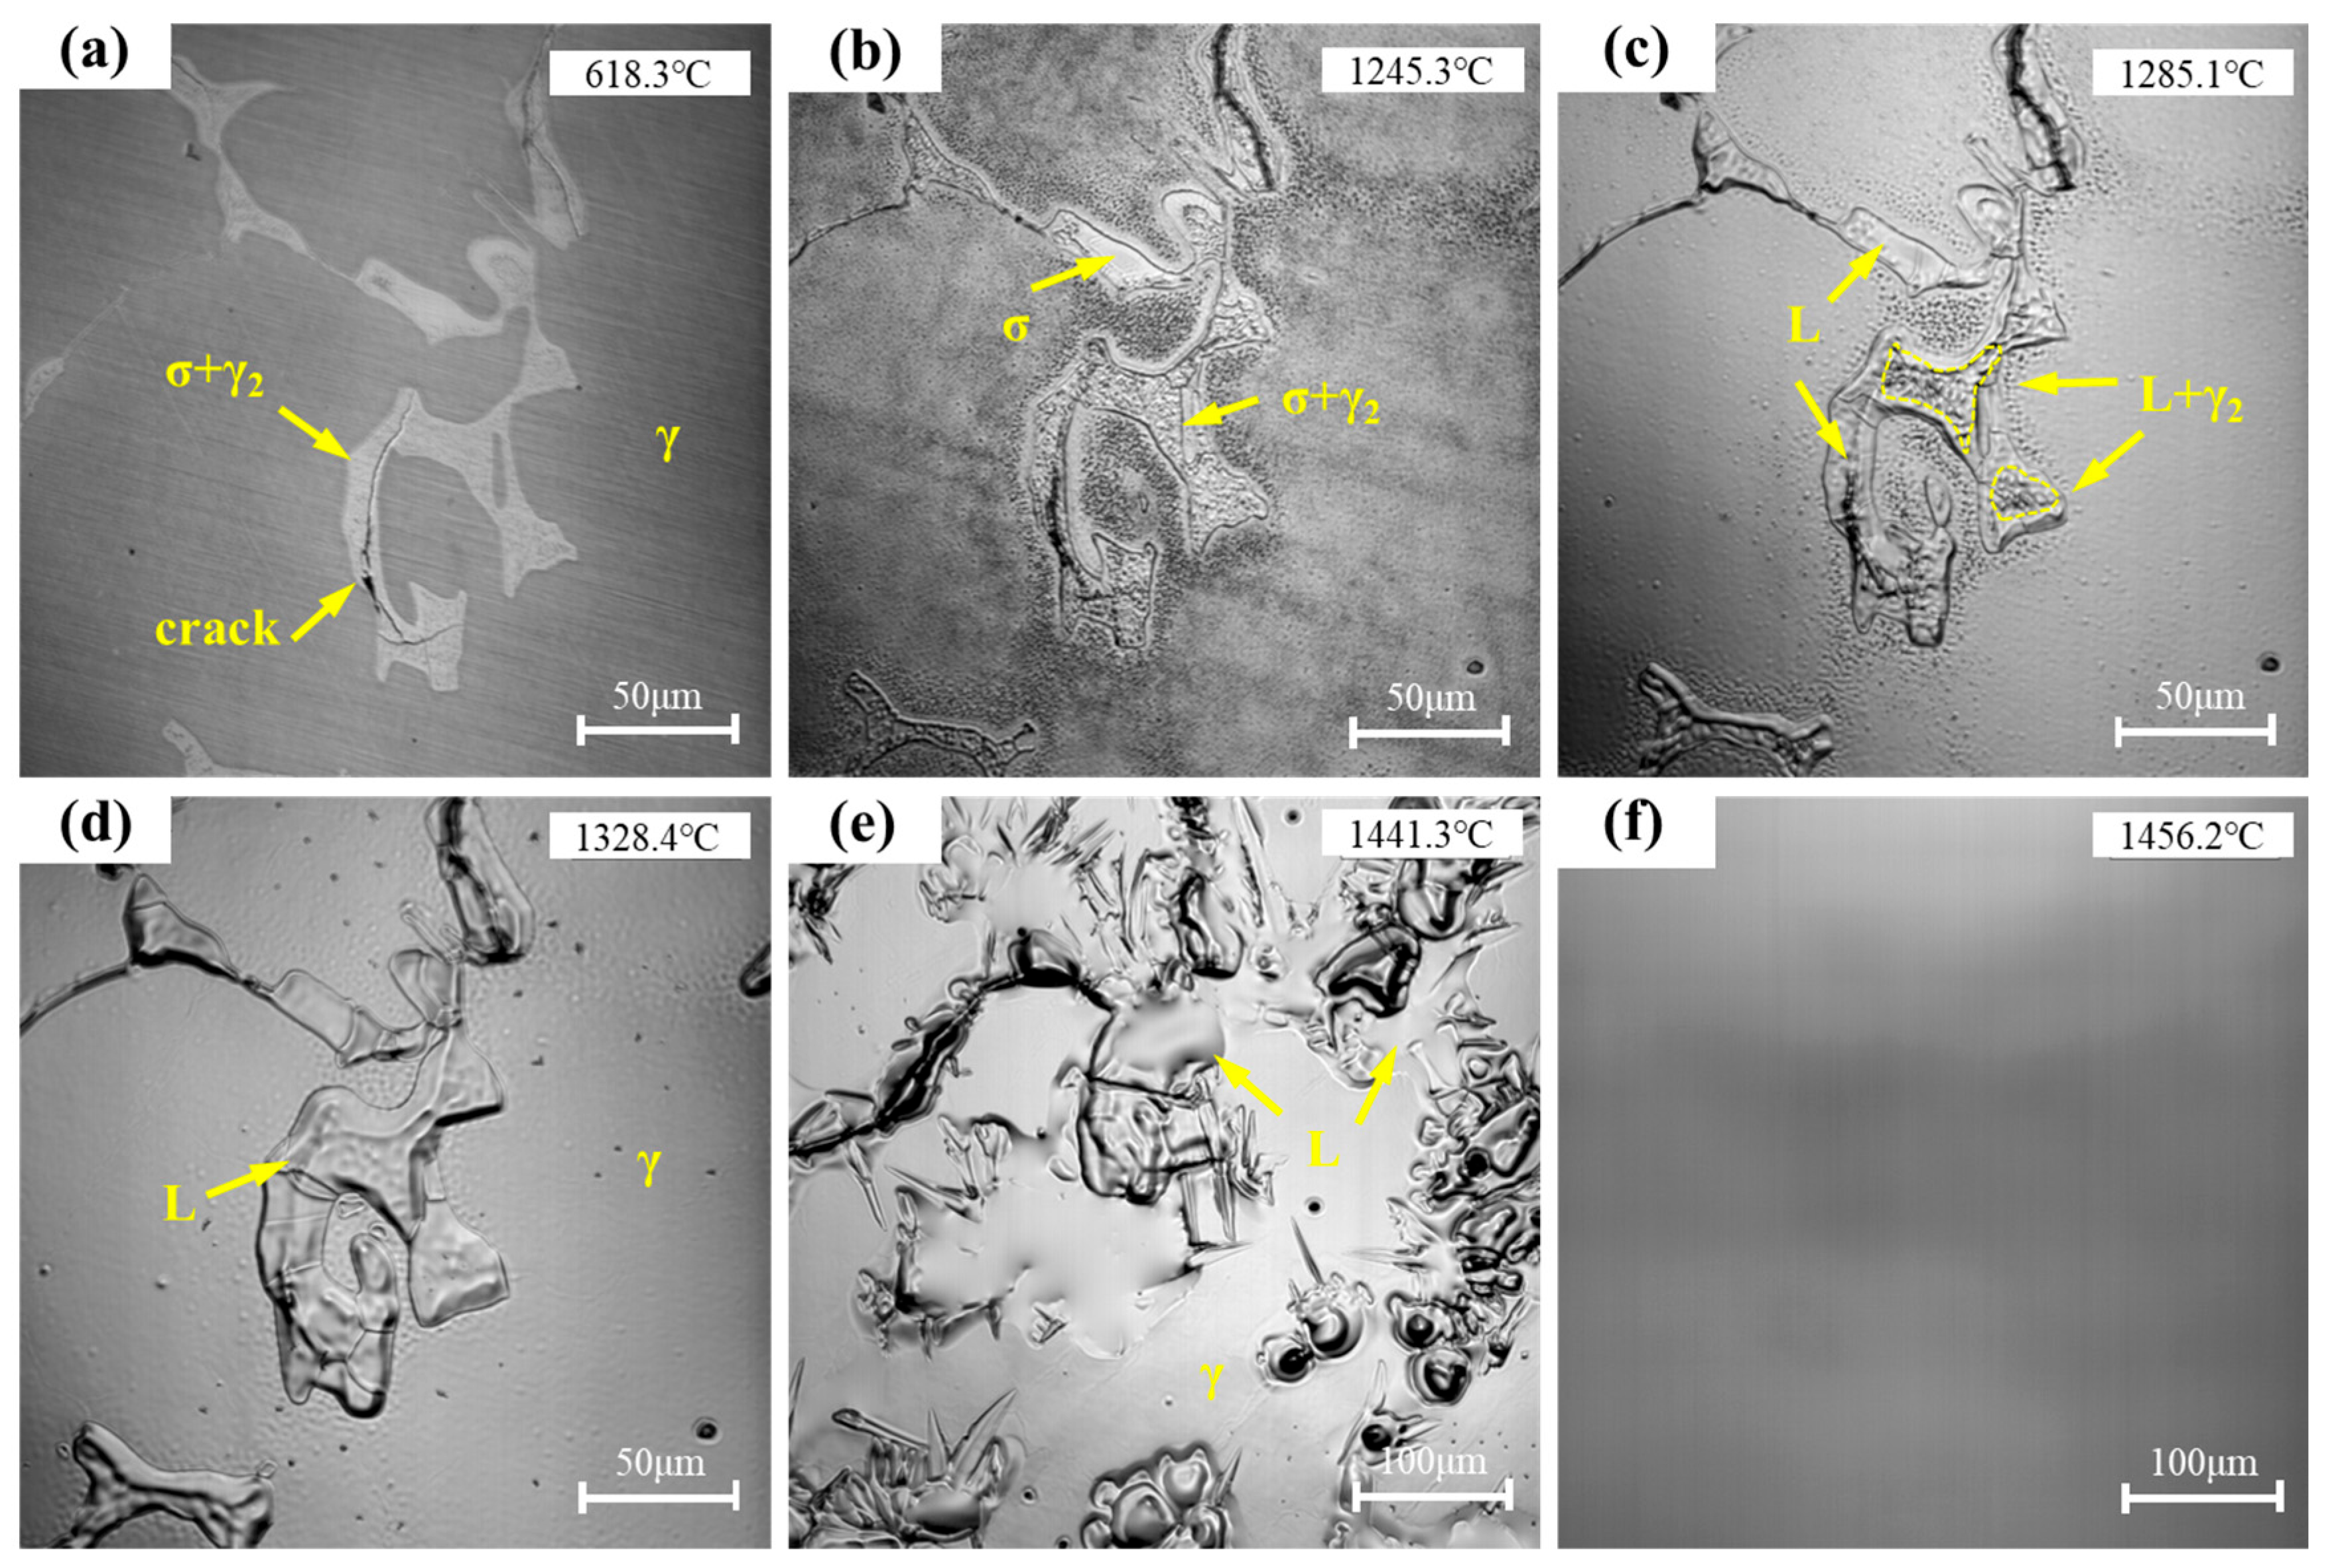
To investigate the dissolution behavior of precipitates, nucleation during solidification, and the grain growth process in SASS, in situ heating observations of the S32654Y sample were conducted using HT-CLSM. Figure 8 shows the representative microstructural evolution of the sample during heating. When the temperature reached 618.3 °C, numerous secondary phases were observed distributed on the austenite matrix (Figure 8a). As the temperature increased to 1245.3 °C, the σ phase in the interdendritic regions began to dissolve (Figure 8b); with further heating to 1285.1 °C, the γ2 phase gradually started to dissolve (Figure 8c); at 1328.4 °C, the γ2 phase was completely dissolved into the matrix (Figure 8d). Studies have shown that if the alloy is heated slowly and held below the eutectoid temperature for sufficient time, the secondary phases can gradually dissolve under solid-state conditions without melting. However, when the temperature rapidly rises and exceeds the eutectoid point, the secondary phases are prone to liquefaction. Subsequently, as the temperature increased to 1441.3 °C, the melt pool rapidly expanded, and the austenite matrix began to dissolve more rapidly (Figure 8e); finally, at 1456.2 °C, the dendritic morphology completely disappeared, and the sample fully transformed into a liquid state (Figure 8f). These results indicate that the σ phase and γ2 phase have different dissolution temperature ranges, with the σ phase dissolving prior to the γ2 phase, and the γ2 phase dissolving significantly earlier than the melting of the austenite matrix.
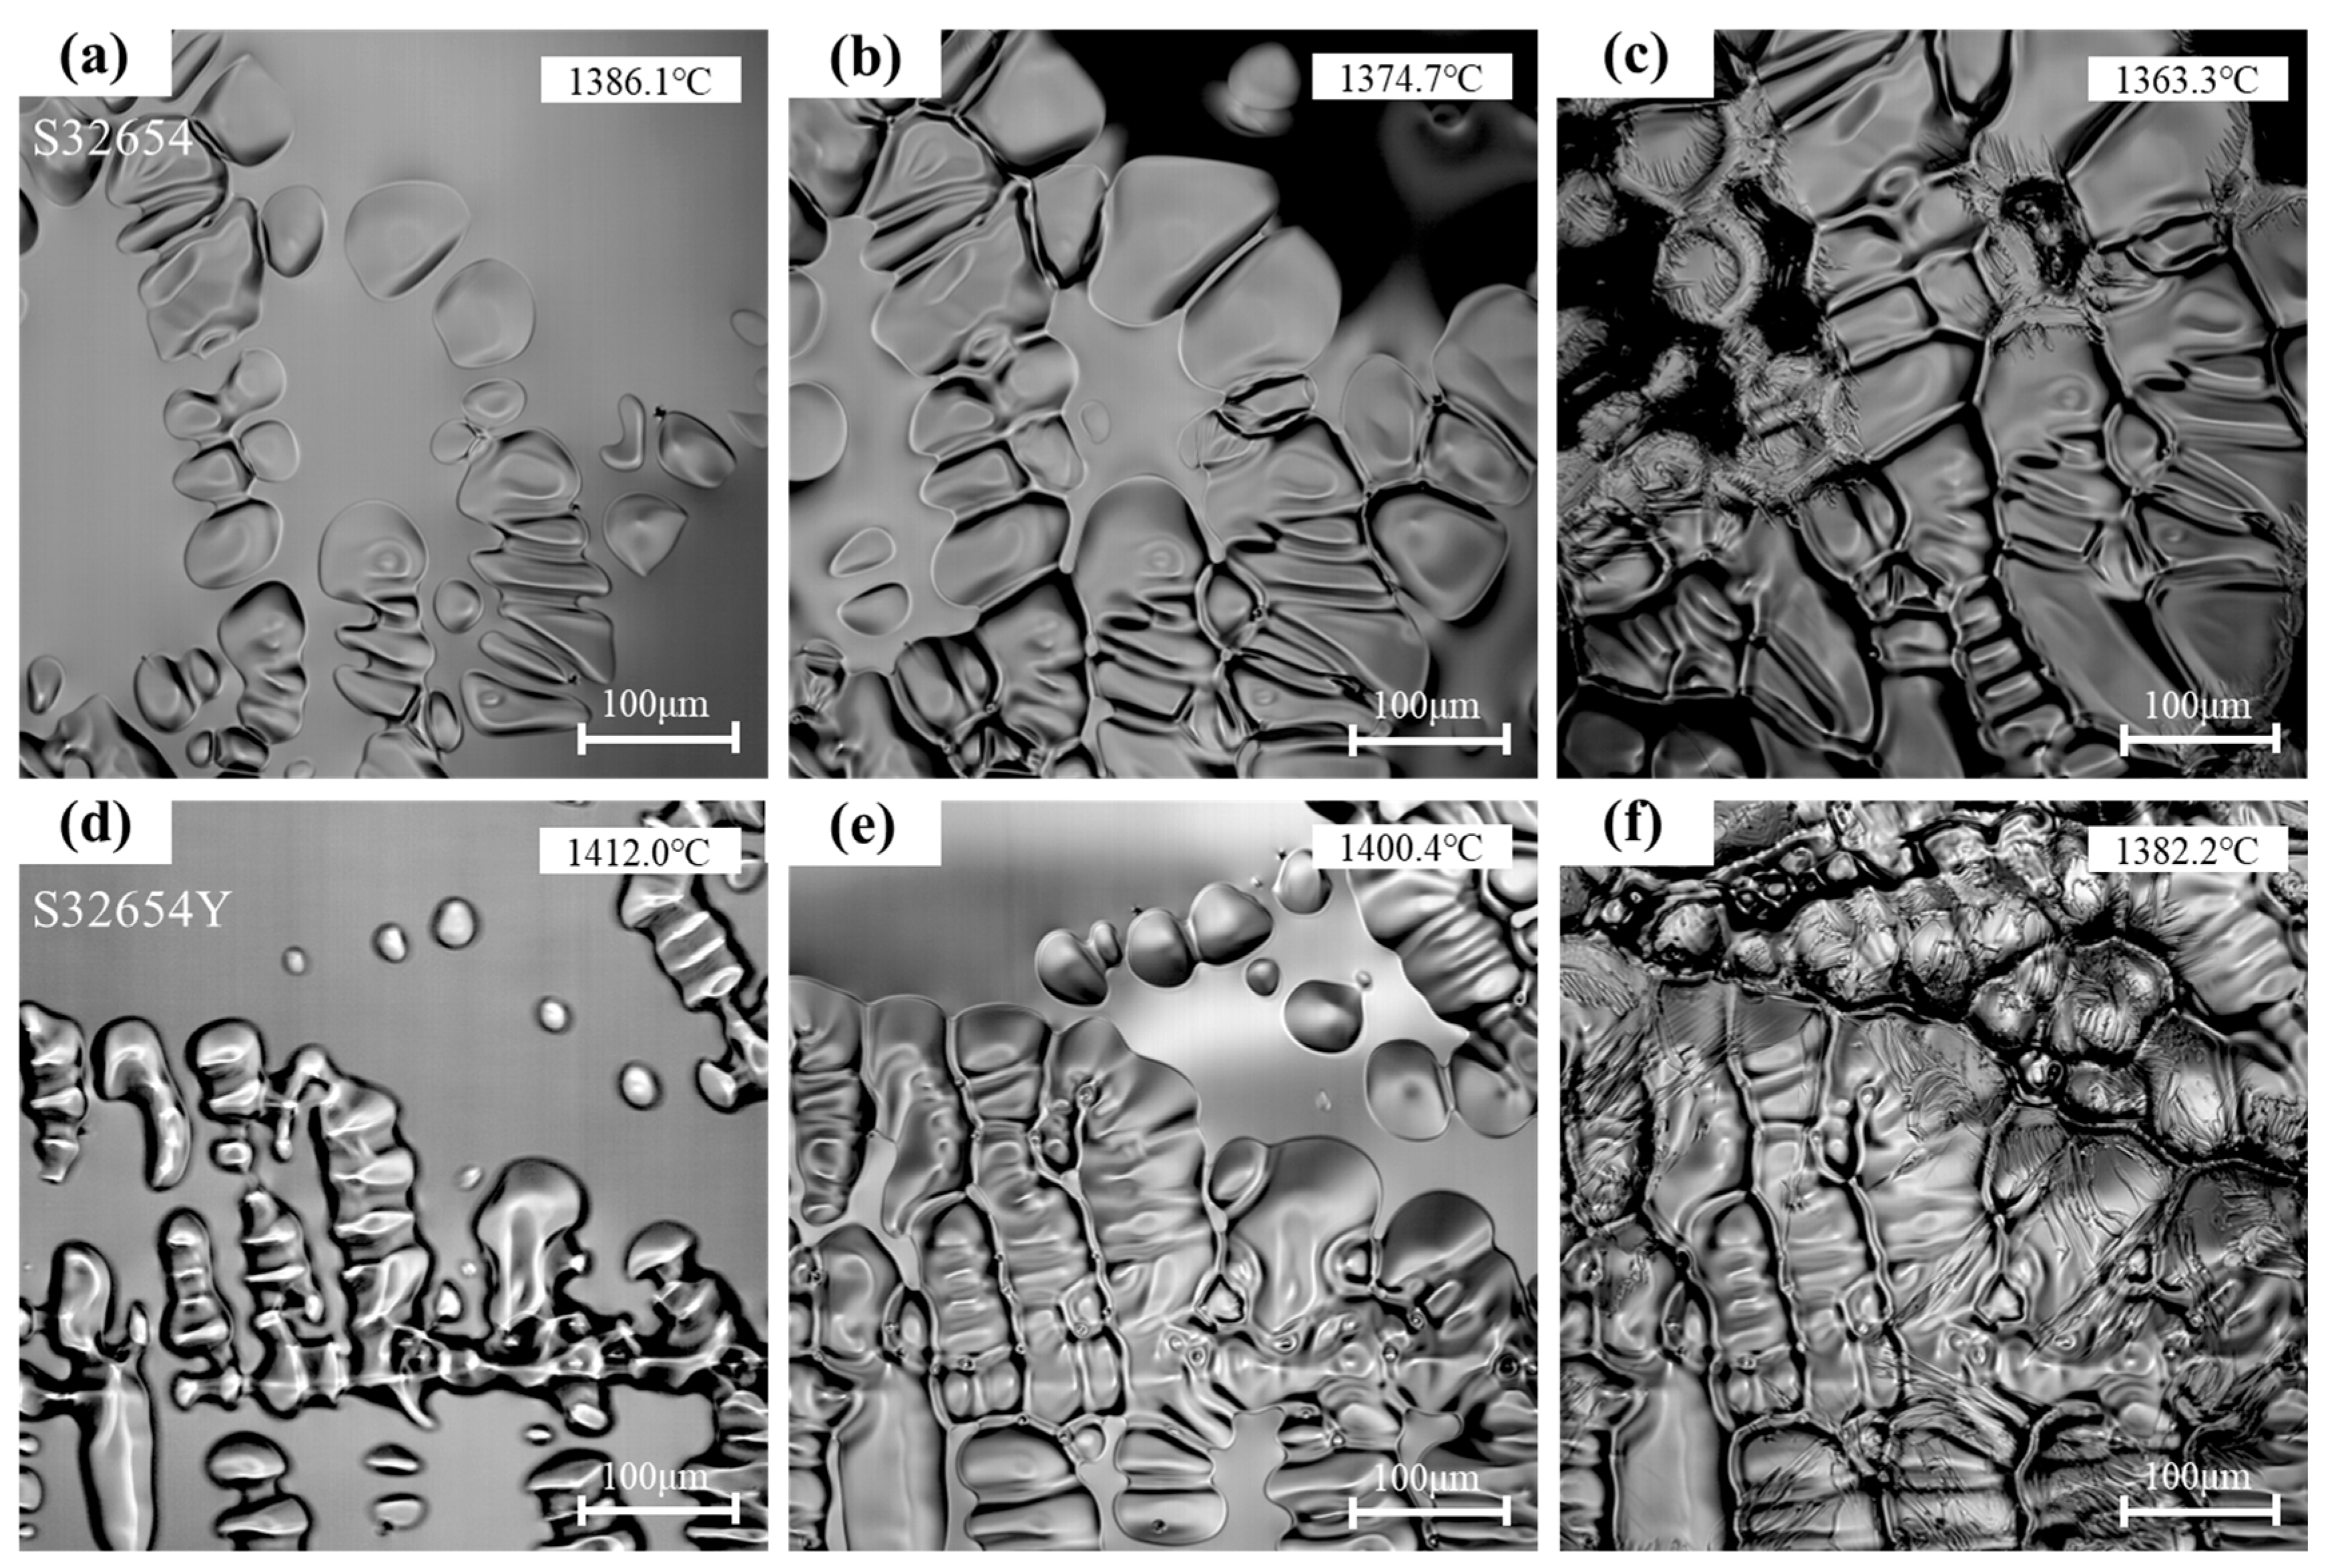
The solidification processes of the two samples were observed in situ using a HT-CLSM, as shown in Figure 9 and Figure 10. The corresponding temperature and time changes during solidification were synchronously recorded and marked in the figures. The HT-CLSM analysis results are summarized in Table 2, where Tn represents the initial nucleation temperature, Ts the complete solidification temperature, ΔT the solidification temperature range, and t the time required for complete solidification. For the S32654 alloy, the molten steel began initial nucleation upon undercooling to 1410.6 °C (Figure 9a). Twelve seconds after nucleation onset, a large number of austenite nuclei formed within the field of view, with a nucleation density of 103.2 nuclei/mm2 (Figure 9b). As solidification progressed, the nuclei rapidly grew and increased in number. During further cooling (Figure 10a), austenite dendrites gradually formed and extended toward the liquid phase, with the solid phase fraction continuously increasing (Figure 10b). Finally, when the temperature dropped to 1363.3 °C, the liquid phase completely transformed into solid, marking the end of the solidification process (Figure 10c). The solidification temperature range of this alloy was 47.2 °C, and the total solidification time was 90.4 s.
In contrast, the S32654Y sample exhibited significant differences during solidification. As shown in Figure 9d–f, initial solidification of this sample began at 1435.5 °C (Figure 9d), with a nucleation temperature notably higher than that of the sample without rare earth additions. This indicates that microalloying with the rare earth element Y promotes the formation of the austenite phase. Studies have shown that rare earth elements can form fine inclusions at the early stages of solidification, providing nucleation sites that effectively enhance the heterogeneous nucleation of the austenite phase. Previous research [12] points out that inclusions formed by rare earth elements typically possess good lattice matching, which is one of the key factors promoting austenite nucleation.
After 12 s of initial nucleation (Figure 9e), the nucleation surface density of austenite reaches 193.5 nuclei/mm2, and the grain size is 13.4 μm, indicating that the addition of rare earth Y can significantly promote the solidification nucleation of SASS and effectively reduce the grain size. As the temperature gradually decreases, the solid–liquid interface continuously advances into the interdendritic regions, with the residual liquid phase gradually diminishing and forming a connected network (Figure 10d,e). Ultimately, the residual liquid in the interdendritic regions completely solidifies. The complete solidification temperature of S32654Y is 1384.1 °C, with a solidification temperature range of 51.4 °C and a solidification time of 102.1 s. The addition of rare earth Y broadens the solidification temperature range and extends the grain growth period, resulting in a more uniform and finer final solidification microstructure. Previous studies have confirmed that rare earth elements contribute to the refinement of the SASS solidification microstructure. For example, Ce inclusions exhibit good lattice matching with austenite, effectively promoting heterogeneous nucleation [28].
As shown in Figure 10c,f, both samples formed feather-like structures at the final stage of solidification. Obvious grain boundary migration phenomena can be observed, with fine lines indicating the traces left by migrating grain boundaries. The migrating grain boundaries (MGBs) formed during the final stage of solidification are a special type of grain boundary characterized by high interfacial energy, making them more prone to migration. During migration, grain boundaries tend to develop a crystallographically aligned and straight morphology, thereby reducing the system’s overall energy. In this process, new grain boundaries separate from the original subgrain boundaries (SGBs) [29].
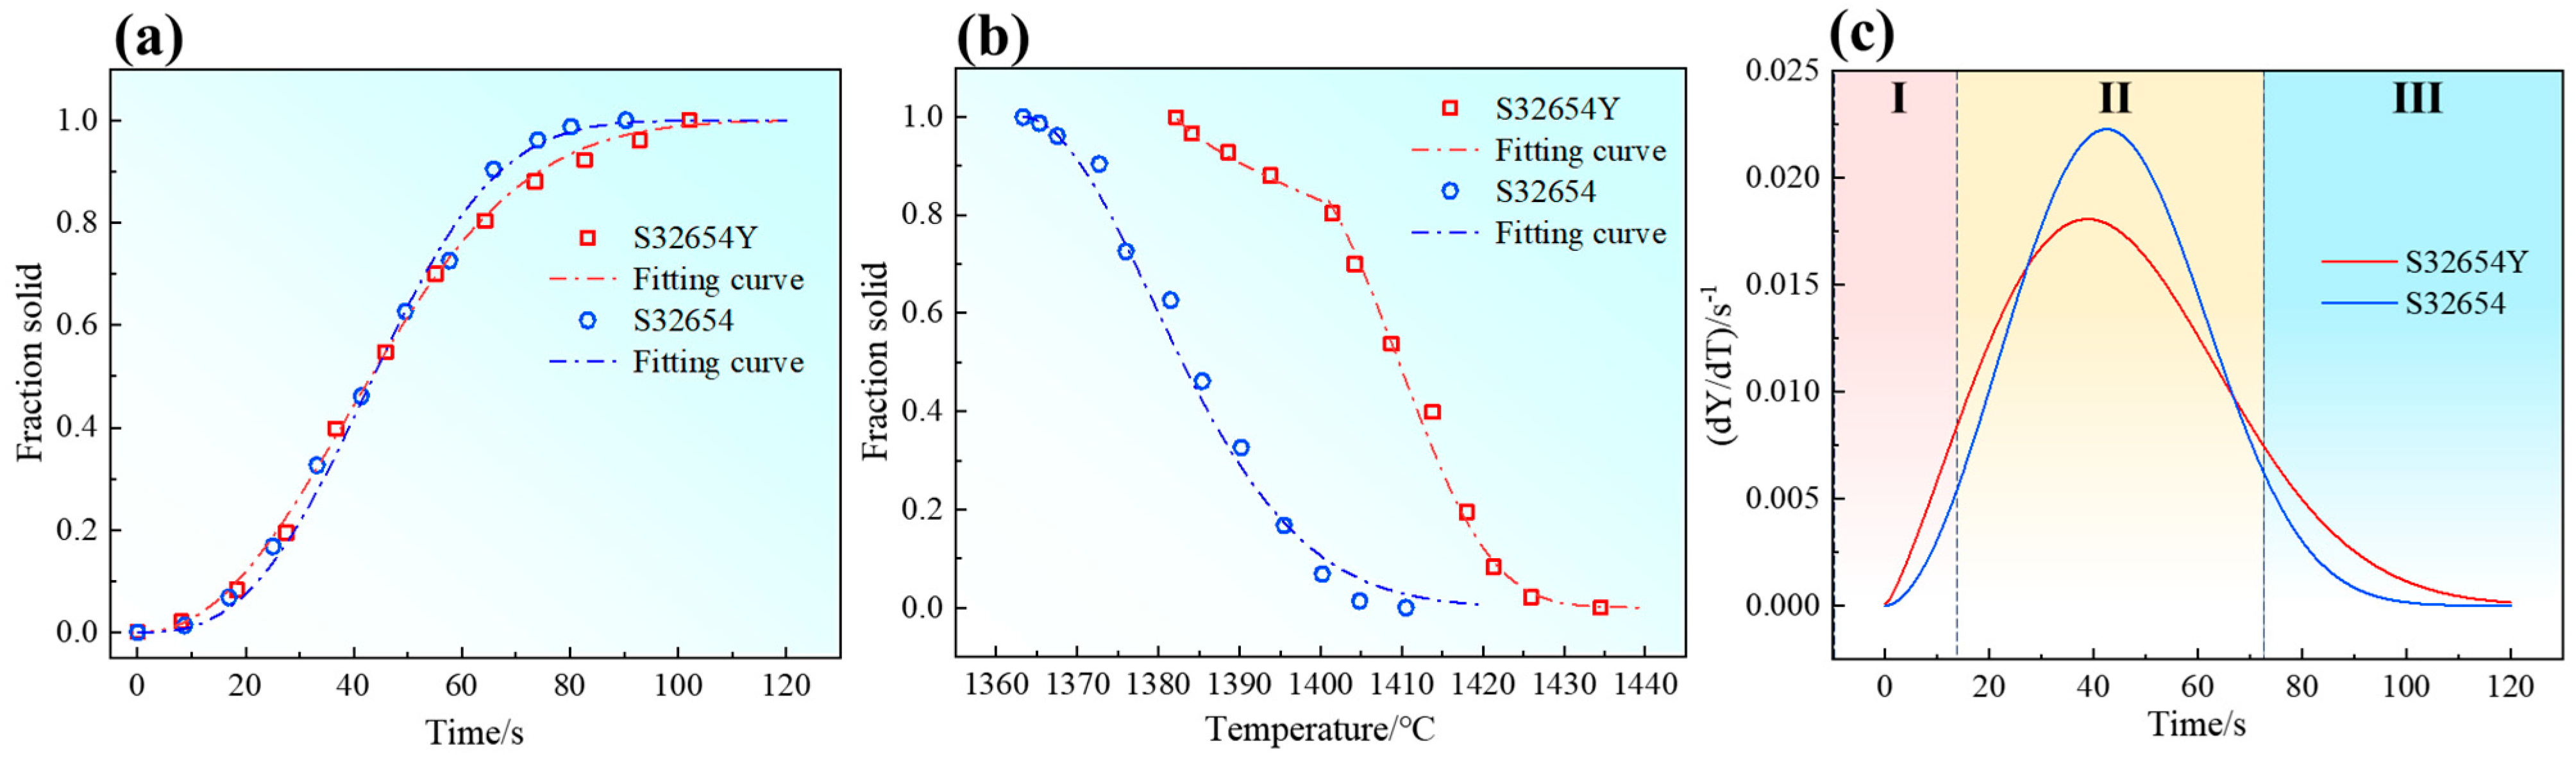
The relationship between the solid phase fraction and time during solidification is shown in Figure 11a. To quantitatively describe the nucleation and growth behavior of the new phase, this study employs the Johnson–Mehl–Avrami–Kolmogorov (JMAK) theory for analysis. The JMAK equations are given in Equations (4) and (5), where the Avrami exponent n can be used to analyze the nucleation mechanism during solidification [30]. The solidification rate constant k reflects the transformation rate. Based on Equation (4), the experimental data were fitted, and the fitting results are summarized in Table 3.
Y = 1 exp k t n
ln ln 1 Y = n ln t + lnk
In the equations, t is the solidification time, n is the Avrami exponent, and k is the solidification rate constant. The Avrami exponents for the two samples are 2.78 and 2.38, respectively, both indicating a site-saturated nucleation mechanism. The relationship between the solid fraction and temperature is given by Equation (6), where A and B are constants, Y is the solid fraction, T is the temperature, and Ts is the solidus temperature. The fitting results are shown in Table 4.
Y = e A T T s B
Figure 11b,c show the solid fraction–time fitting curves and solidification rate–time curves, respectively. The solidification process of the samples can be divided into three stages: the initial solidification stage, the steady solidification stage, and the final solidification stage. In the initial stage, due to low undercooling, the phase transformation rate is relatively slow. As the temperature continues to decrease, undercooling increases, significantly enhancing the transformation rate and leading to rapid solidification. In the later stage, as Cr and Mo segregation becomes more pronounced, the compositional difference between the remaining liquid and solid phases increases markedly. The austenitic matrix must absorb more solute atoms enriched in the residual liquid, which significantly slows the solidification rate. The addition of rare earth Y accelerates the initial solidification process and increases the nucleation rate, but also prolongs the final solidification time. As a result, the duration of element segregation increases, leading to more severe segregation at the end of solidification.
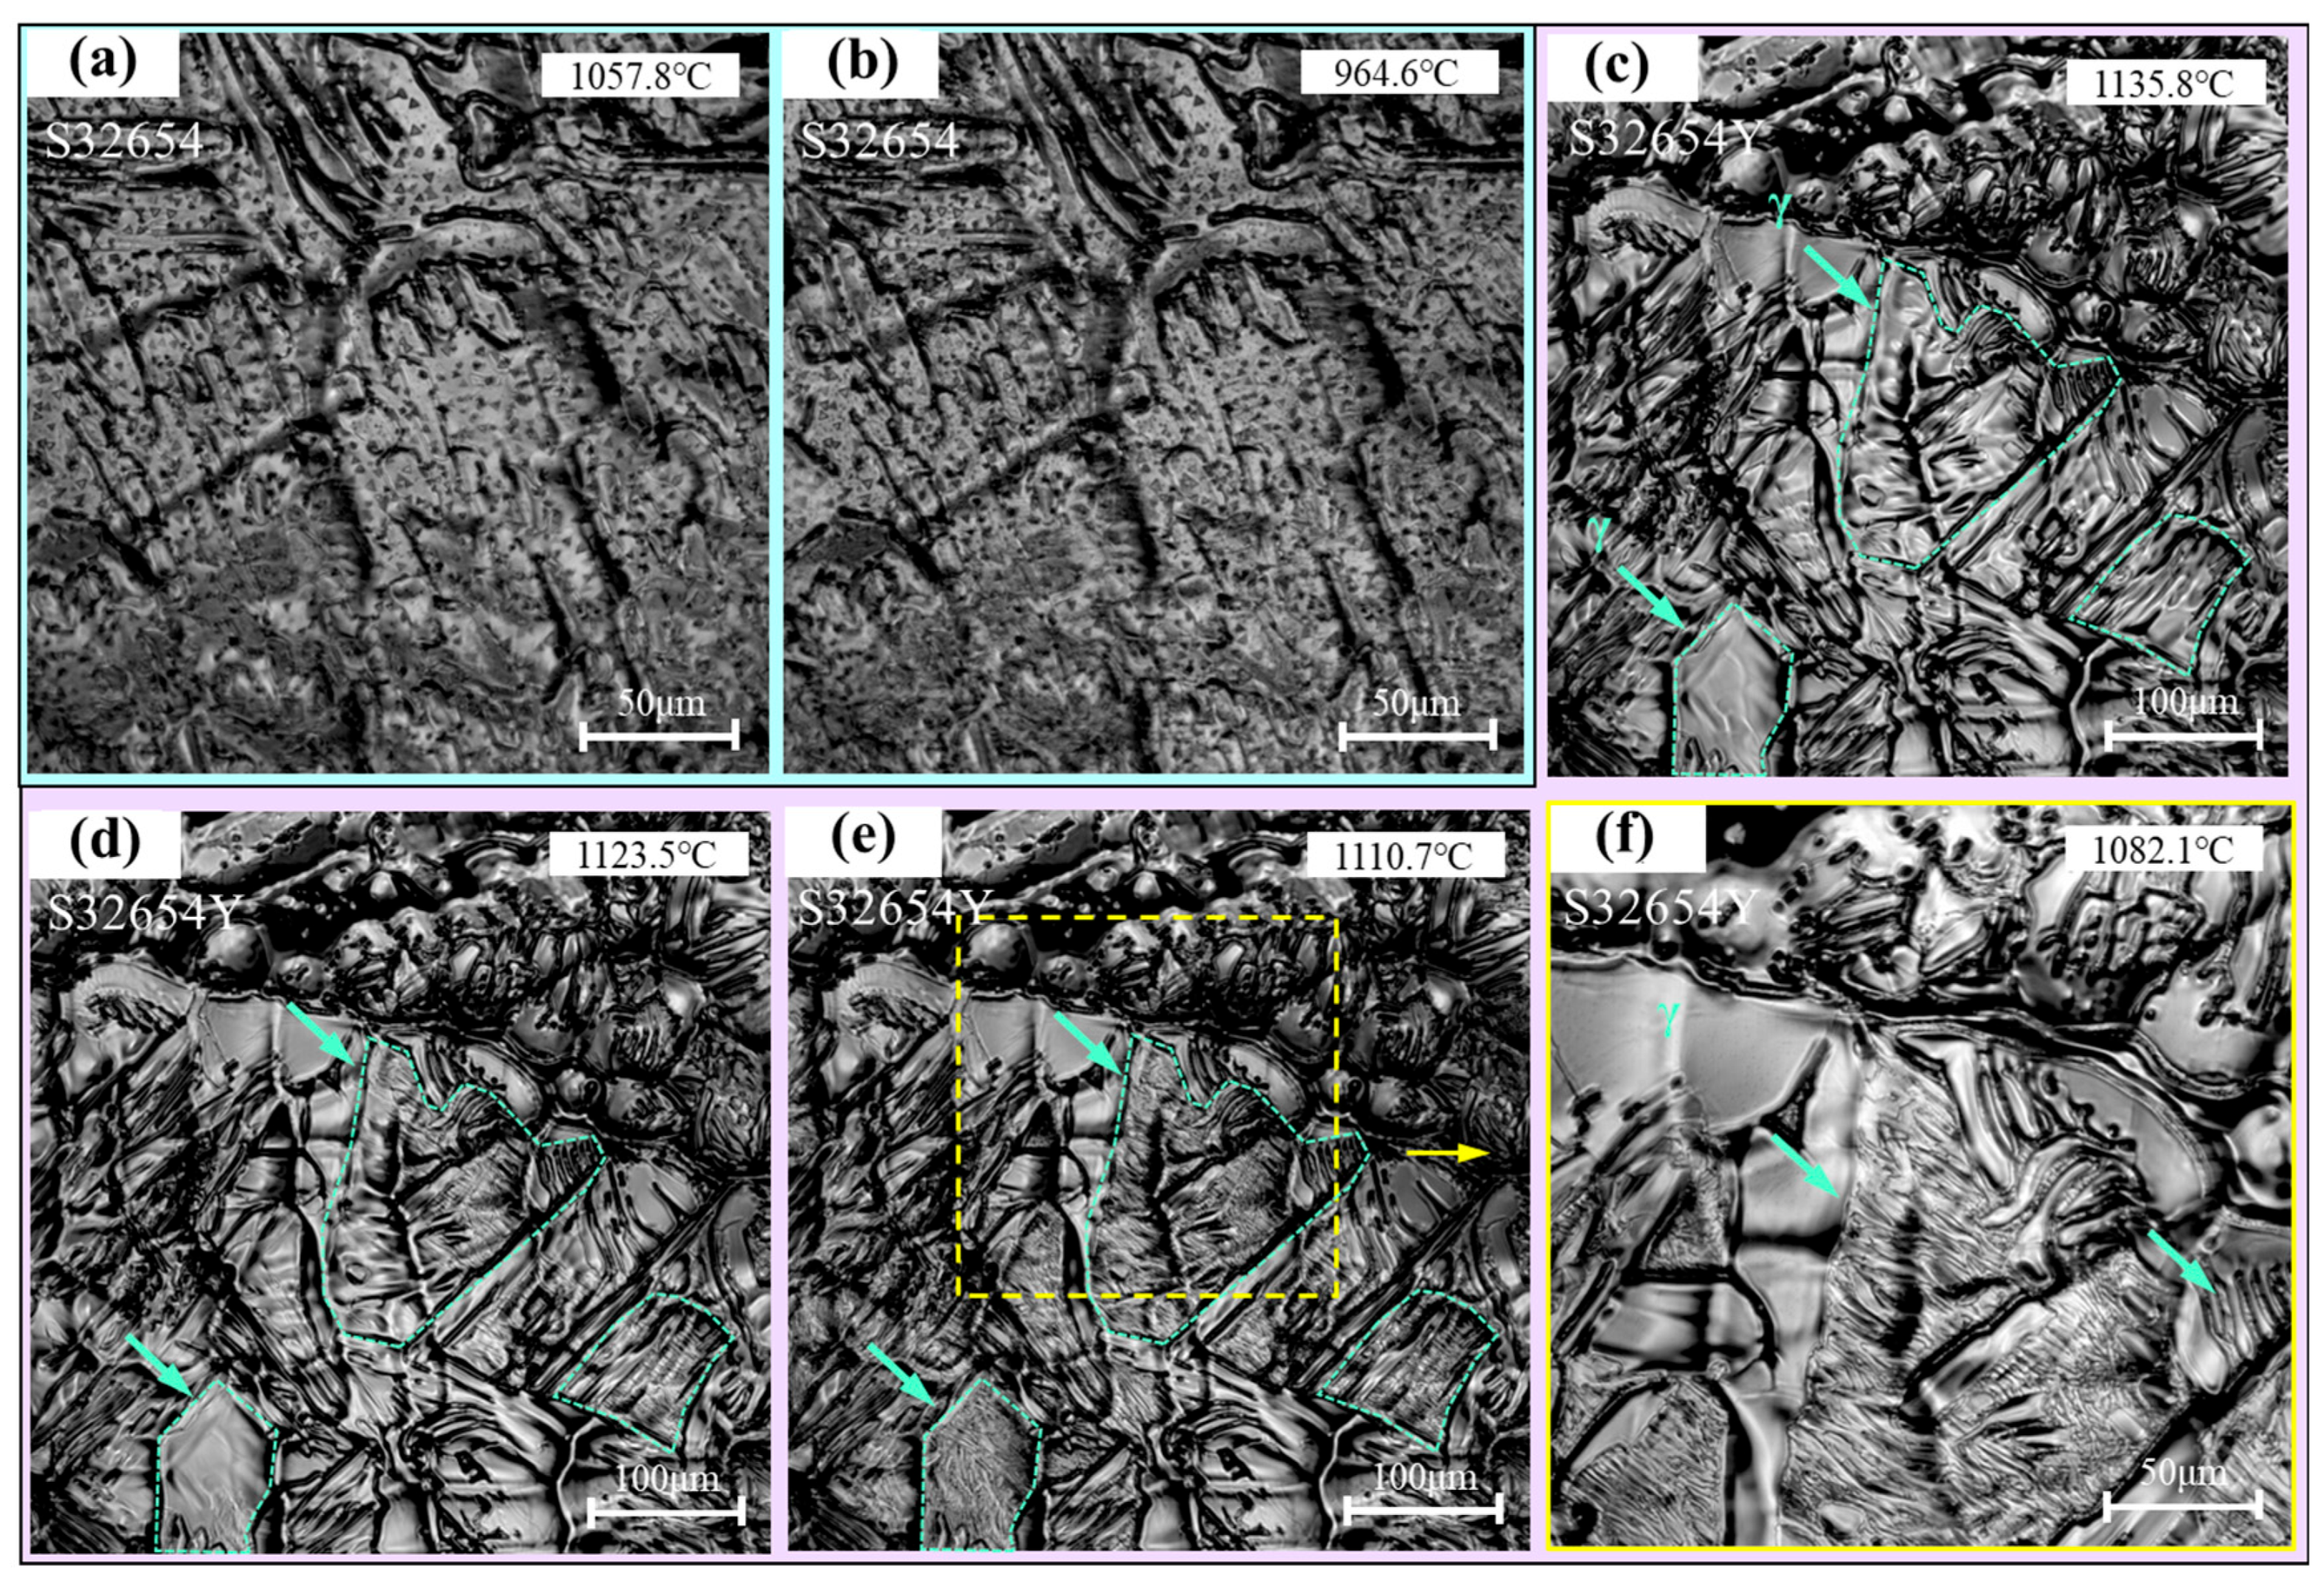
The solid-state phase transformation process of the samples is shown in Figure 12. For the S32654 sample, when cooled to 964.6 °C (Figure 12b), a sudden phase transformation occurs, resulting in the precipitation of a large amount of lamellar structures, primarily distributed between the feather-like structures. In contrast, for the S32654Y sample, as shown in Figure 12c, no phase transformation is observed when the temperature drops to 1135.8 °C. Subsequently, when the temperature decreases to 1123.5 °C (Figure 12d), lamellar structures begin to precipitate, as indicated by the green arrows. Further cooling to 1110.7 °C completes the precipitation of the lamellar structures, and the phase transformation occurs at a very fast rate. Figure 12f is a magnified view of Figure 12e, clearly showing the precipitation of a secondary phase between the feather-like structures, while the feather-like structures themselves remain unchanged. In addition, some of the secondary phase precipitates directly from the austenitic dendrites.

3.6. Formation Mechanism of the σ Phase

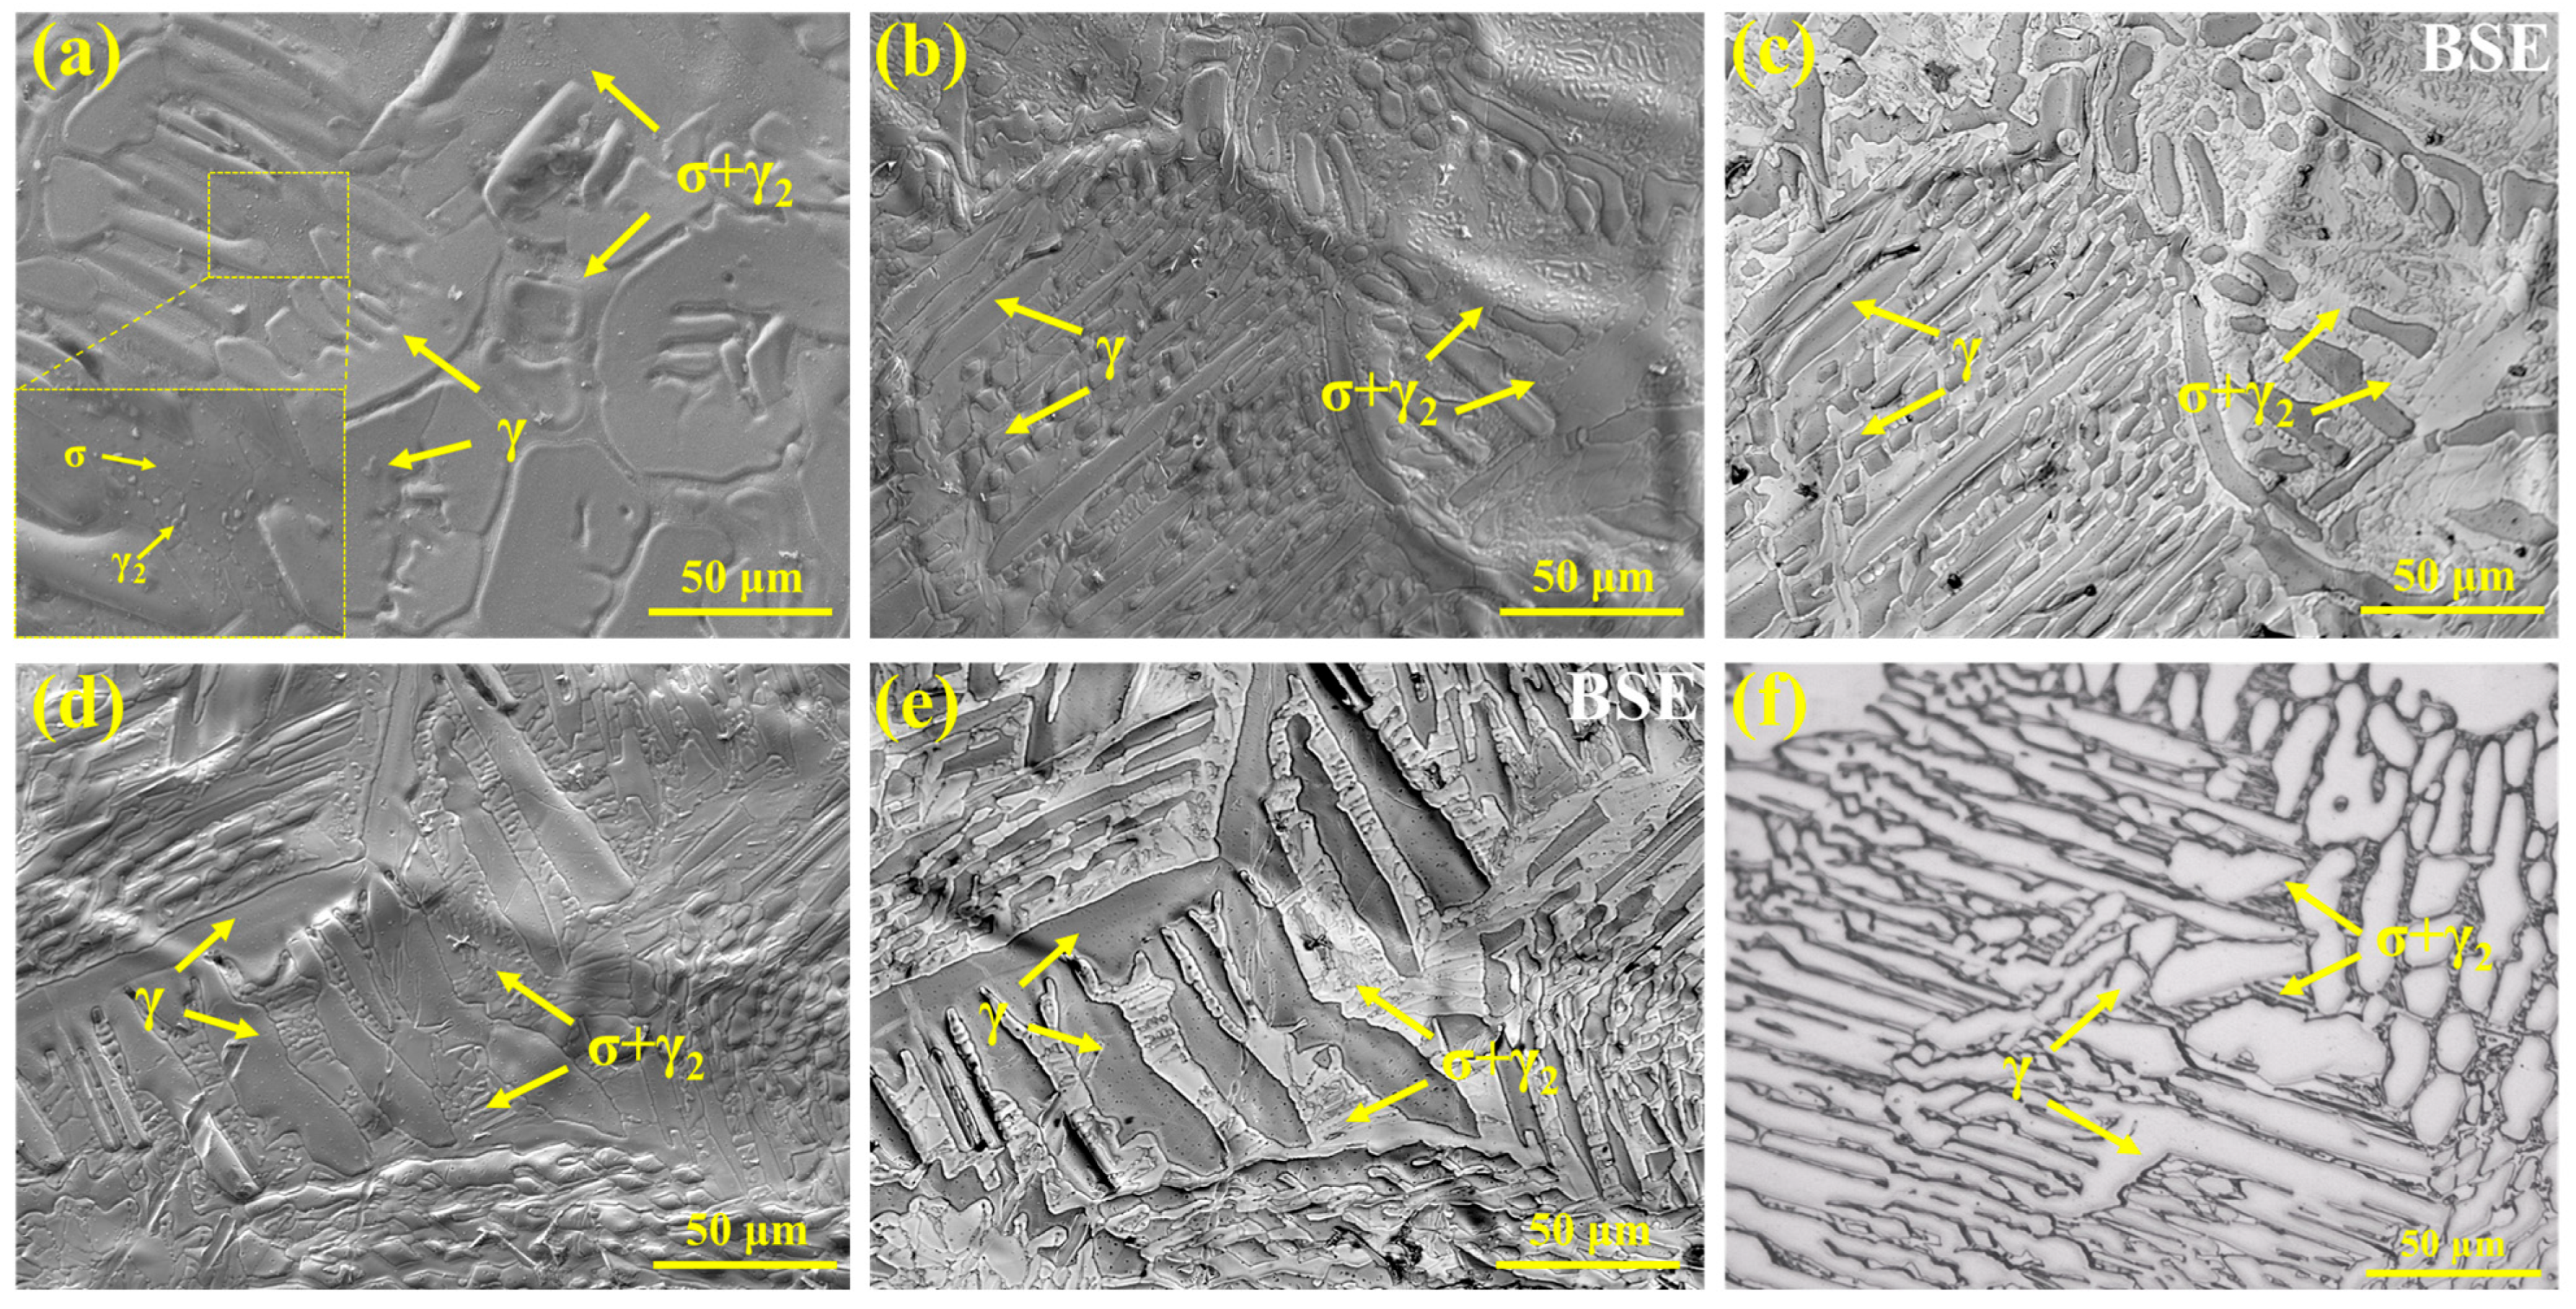
The microstructure of the samples observed using high-temperature in situ confocal microscopy is shown in Figure 13. For the S32654 sample, a large number of dendritic structures can be seen on the surface, with the dendrites slightly protruding above the surface. Their morphology corresponds to the feather-like structures shown in Figure 12 (Figure 13a). Lamellar structures are distributed between the dendrites, appearing as depressions. As shown in Figure 13b, the solidification microstructure of the S32654Y sample is finer and exhibits typical eutectoid characteristics, primarily distributed between the feather-like and granular structures. The particles within the eutectoid structure are γ2 phase. Figure 13c is the corresponding backscattered electron (BSE) image of Figure 13b, revealing two distinct contrast regions: the brighter areas represent the σ phase, while the darker areas correspond to the austenite phase. Figure 13d,e clearly show the morphological features of the austenitic dendrites and the interdendritic σ phase. Figure 13f presents the microstructure of the S32654Y sample after metallographic preparation, showing a morphology highly consistent with the in situ microstructure observed in the lower left region of Figure 13c, both consisting of austenitic dendrites and interdendritic eutectoid structures.
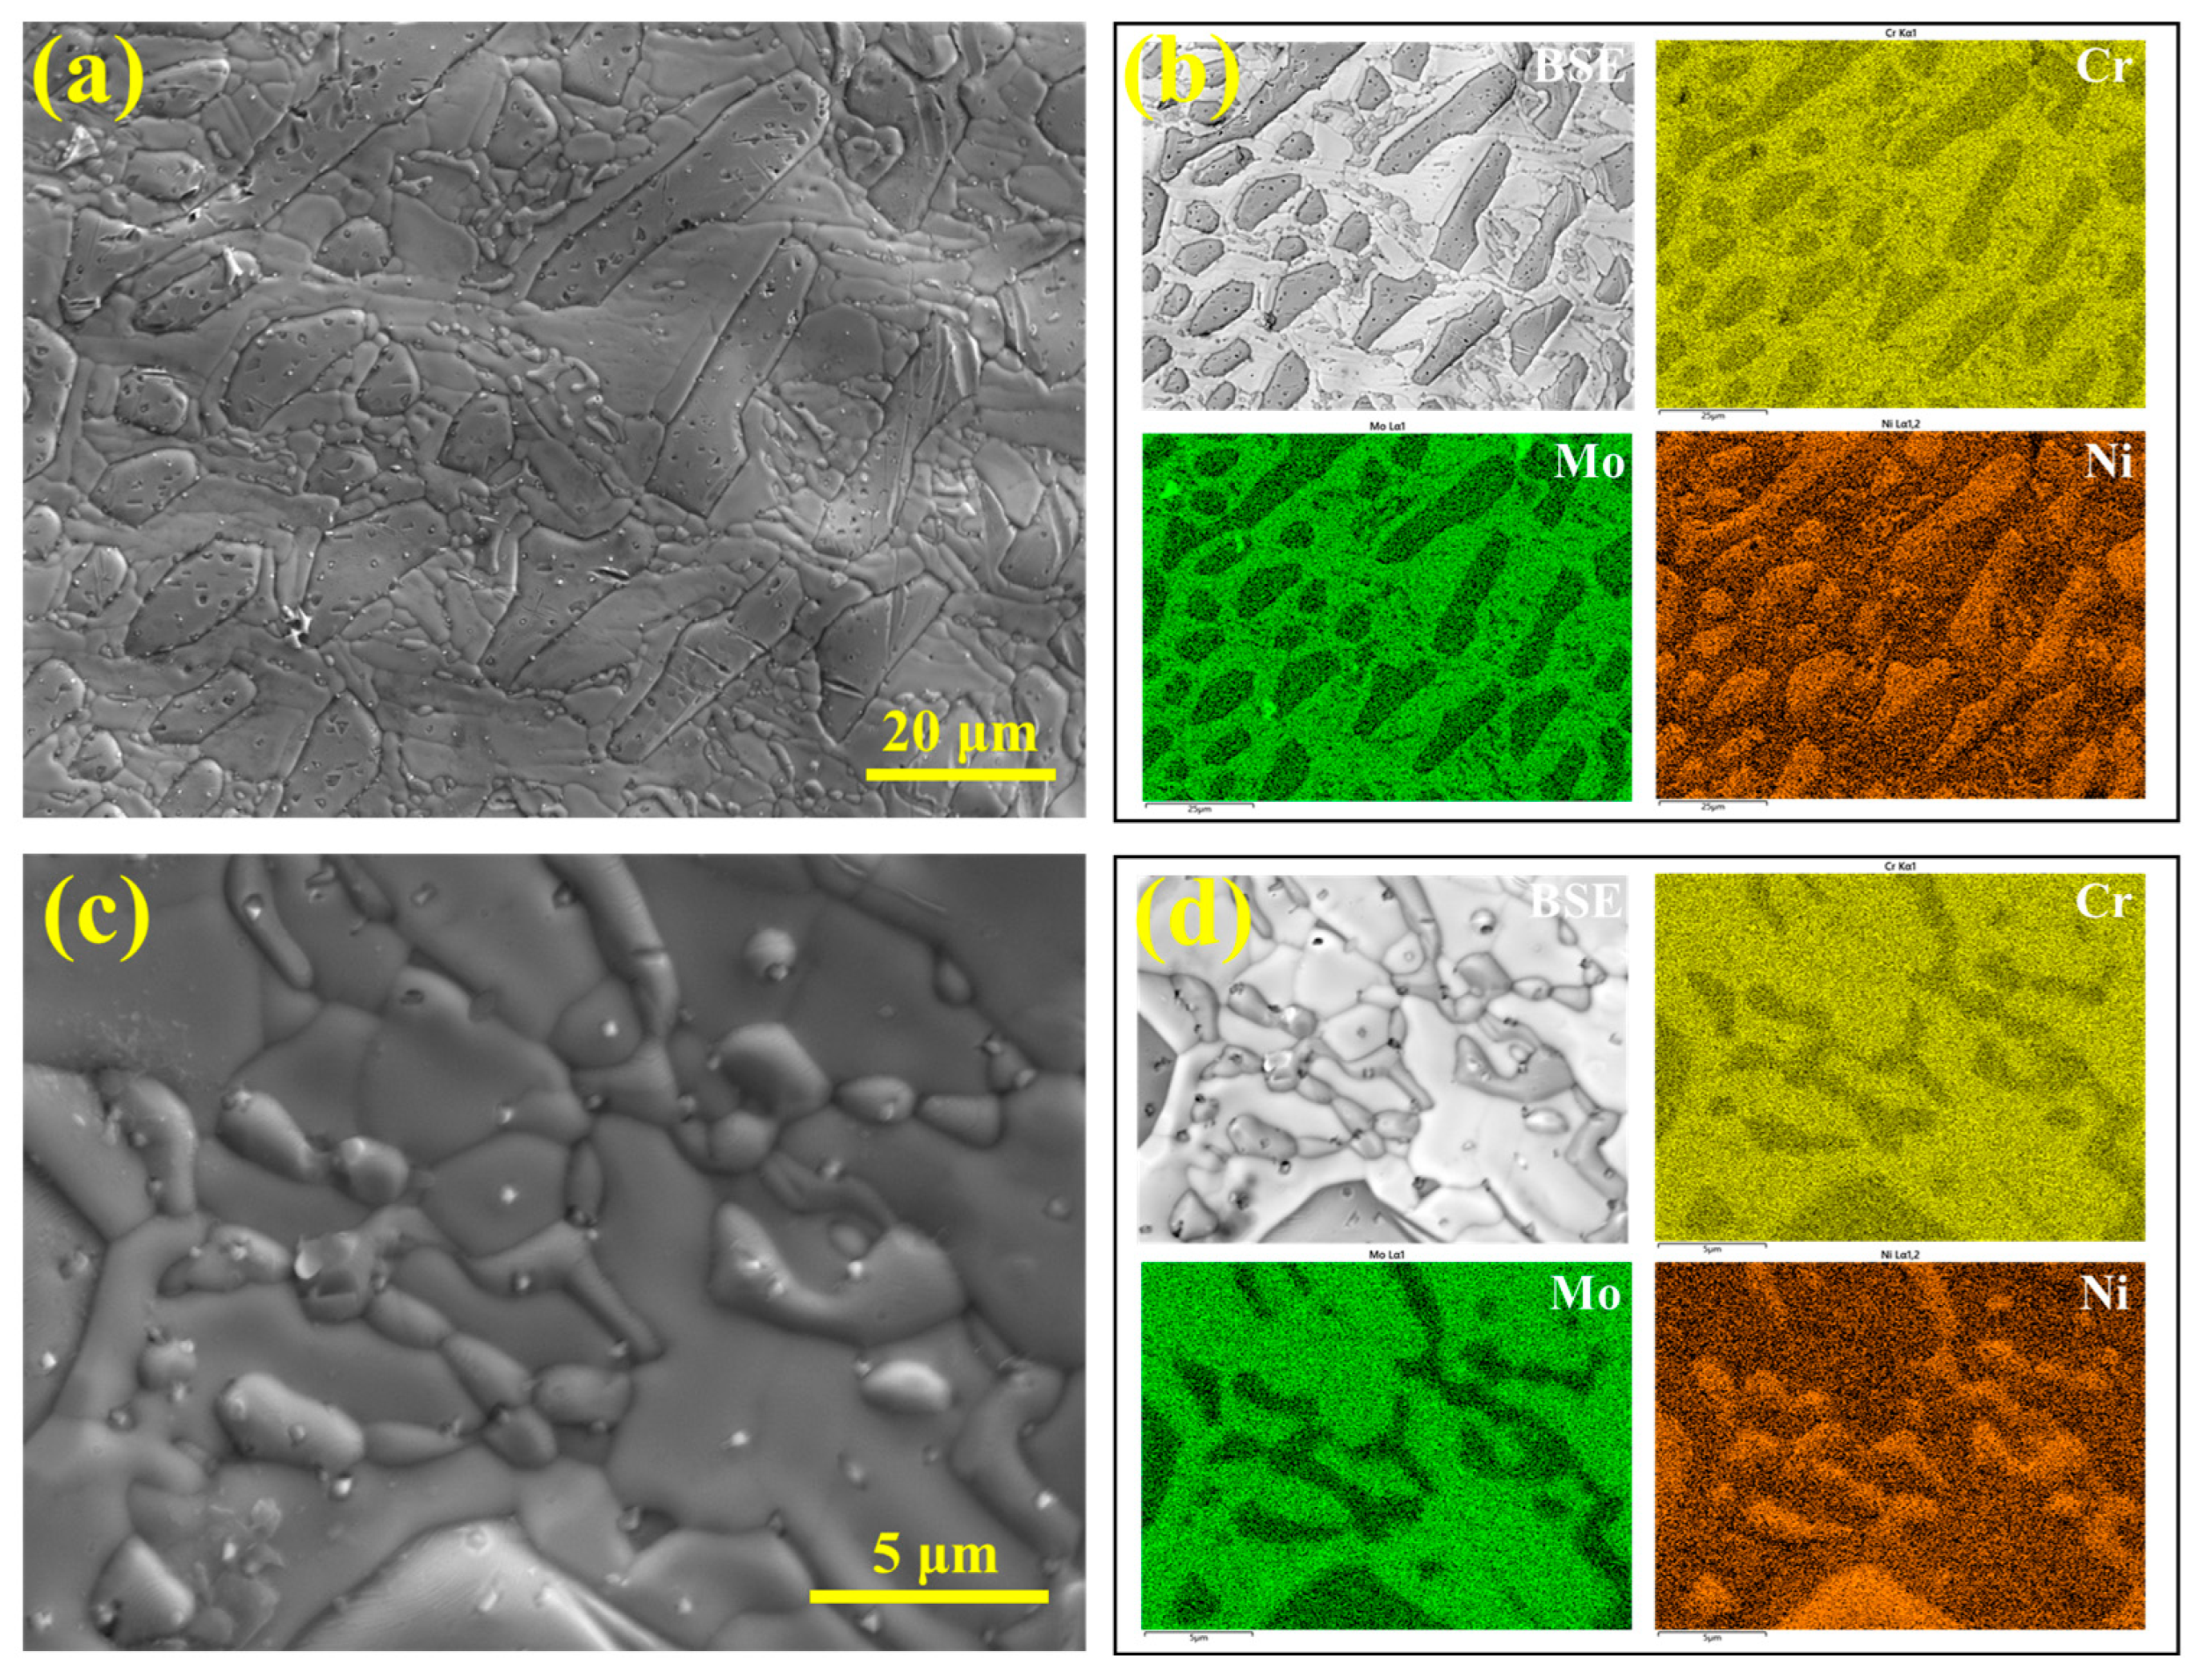
To further characterize the eutectoid microstructure, EDS was used to analyze its composition, as shown in Figure 14a,b. The results indicate that the eutectoid structure is rich in Cr and Mo, while the granular austenite is enriched in Ni. Figure 14c,d present the EDS analysis within the eutectoid structure, revealing that the granular phase corresponds to the Ni-rich γ2 phase. Therefore, the σ phase is not directly precipitated from the enrichment of σ-forming elements in the liquid phase, but rather forms through a eutectoid reaction at the final stage of solidification. No ferrite phase was observed during solidification, indicating that the eutectoid decomposition of ferrite (δ → σ + γ2) is not responsible for the formation of the σ phase.
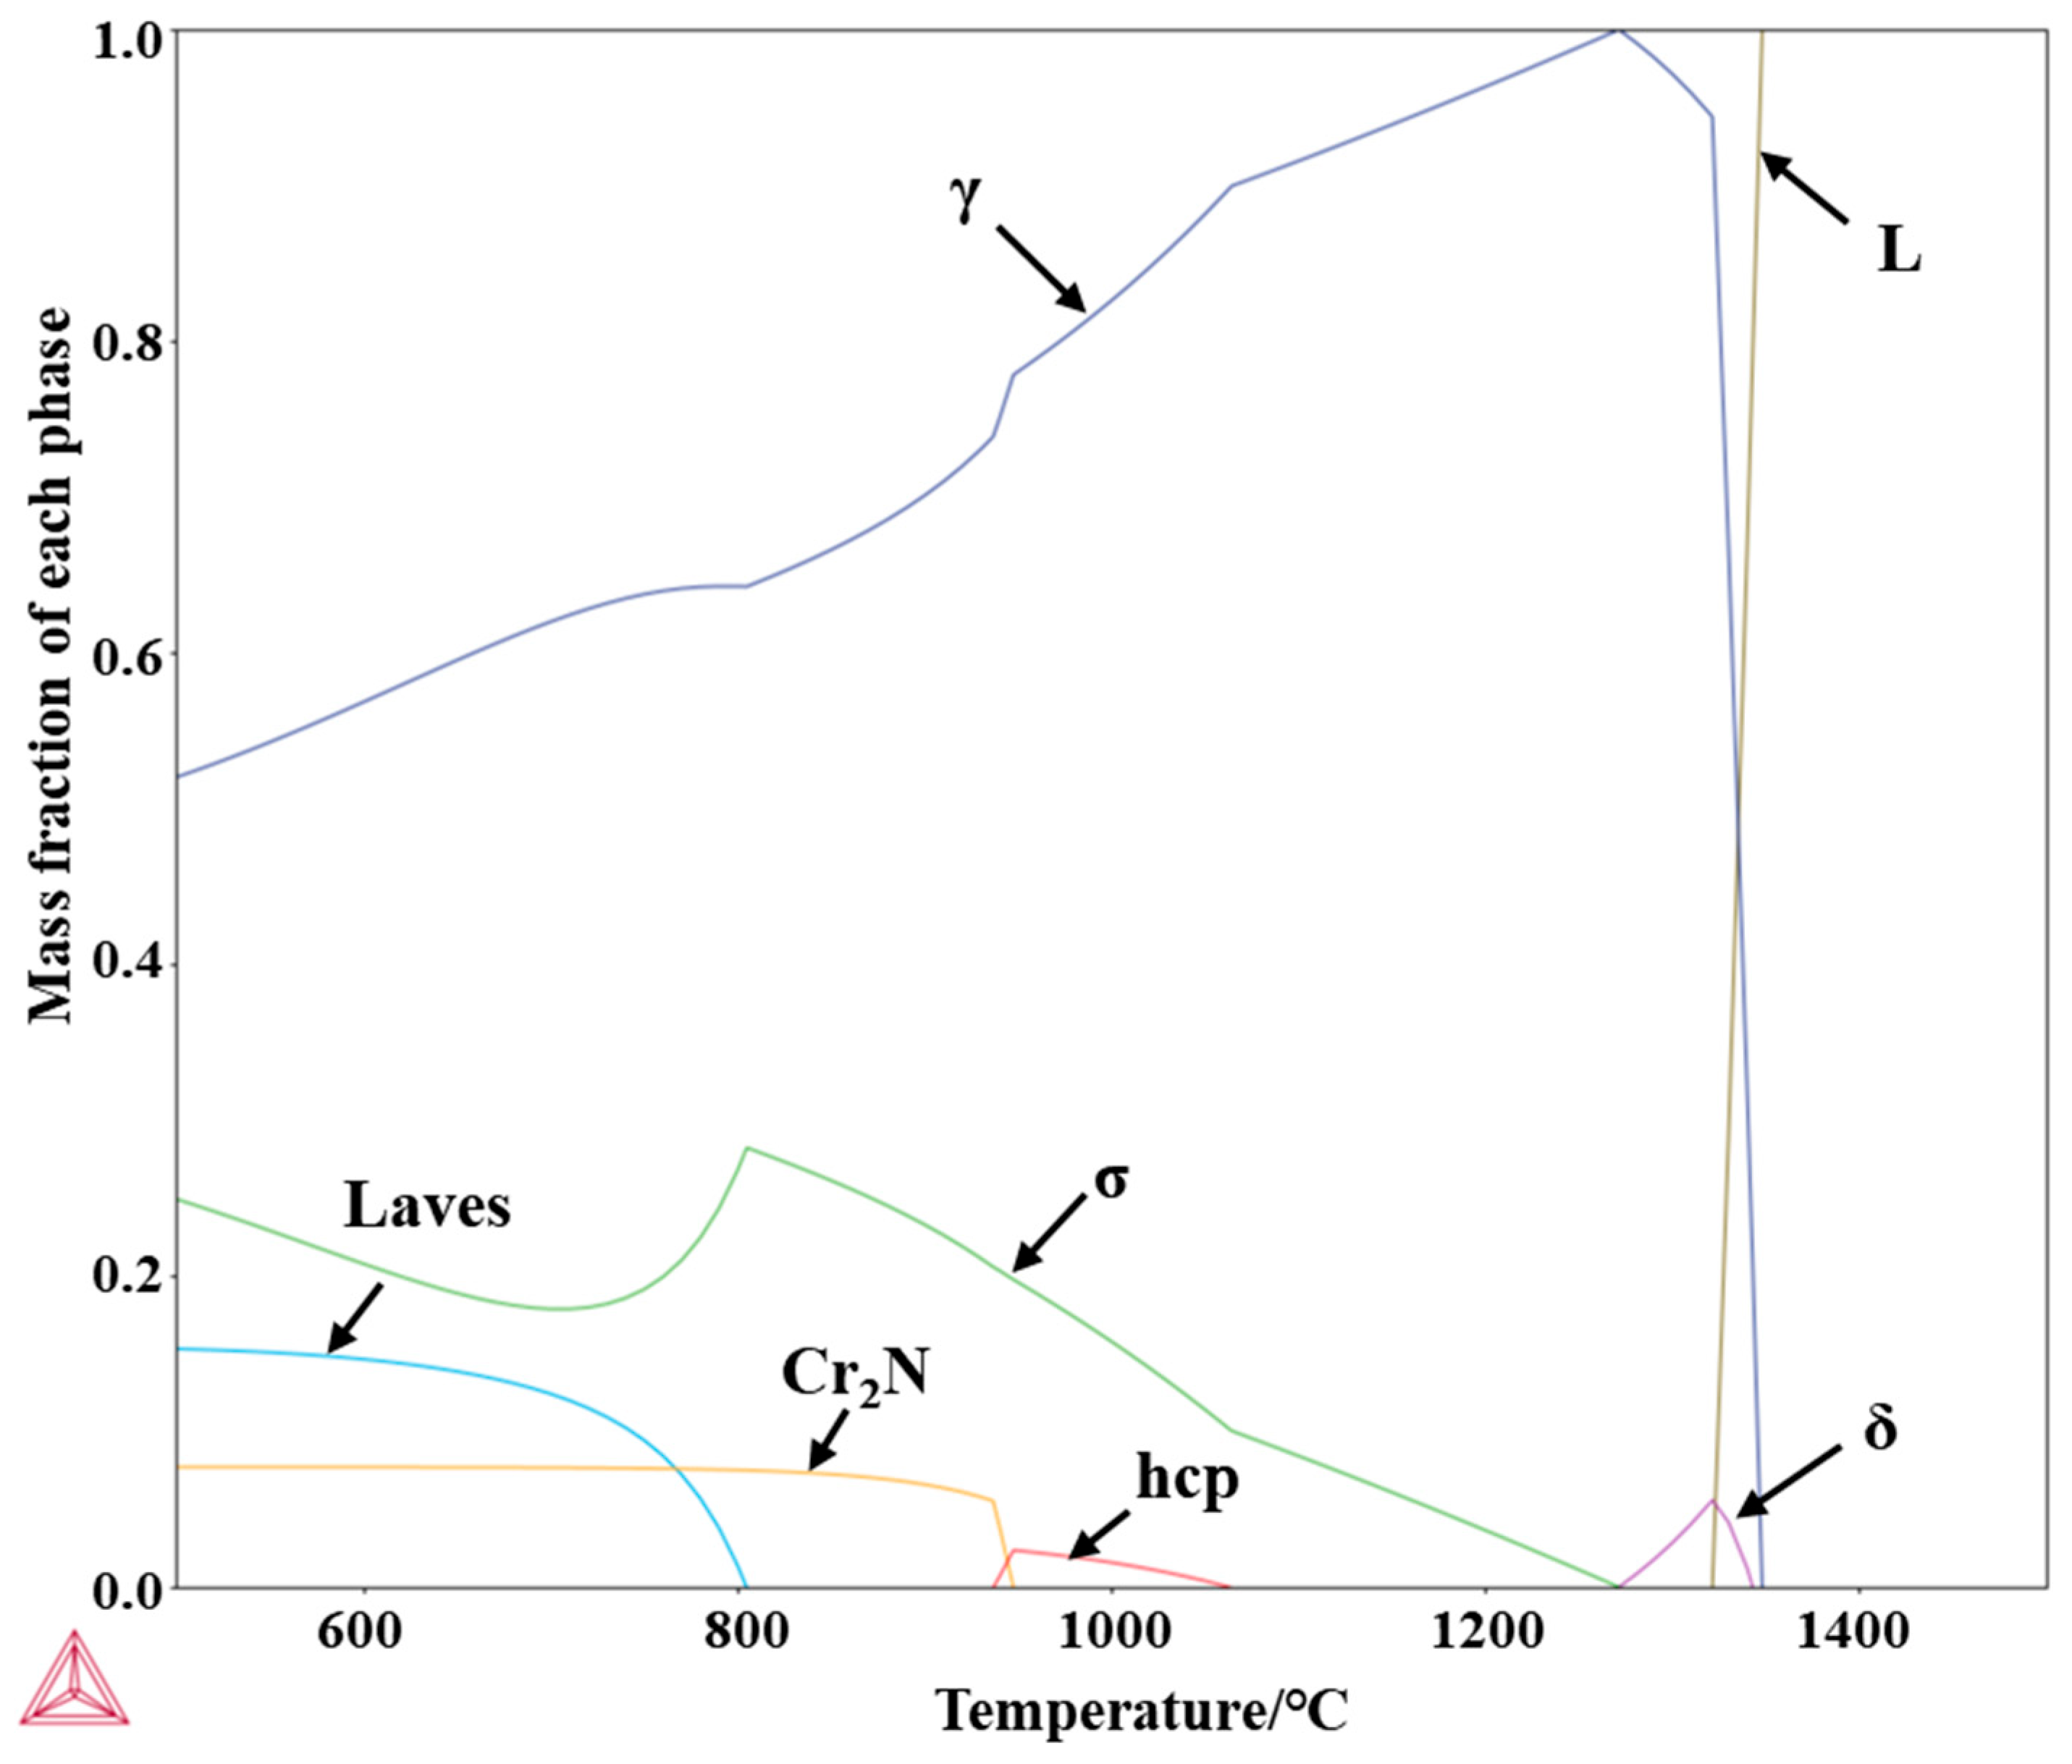
Based on the phase composition analysis of super austenitic stainless steel, the σ phase is formed through a solid-state phase transformation of austenite at approximately 1124 °C (using the S32654Y sample as an example), specifically via the reaction γ → γ2 + σ. The γ2 phase is distributed in a lamellar or granular form within the gaps of the σ phase. Due to Cr and Mo depletion and Ni enrichment in the austenite near the σ phase region, the surrounding austenite becomes unstable and transforms into the γ2 phase upon σ phase precipitation. This transformation originates from the high Cr and Mo content in the austenite formed from the residual liquid. During non-equilibrium solidification, Cr and Mo atoms lack sufficient time to diffuse and thus accumulate in the residual liquid, leading to significant compositional differences between the interdendritic regions (residual liquid) and the matrix after solidification. Grain boundary migration and volume expansion result in a “protrusion” phenomenon. The austenite in interdendritic regions becomes supersaturated; when the temperature drops to a critical point, these alloying elements can no longer remain dissolved in austenite, and a solid-state transformation occurs during cooling, releasing energy and forming the σ phase. This entire process can be described as L → L + γ → γ → γ + γ2 + σ. This sequence aligns with thermodynamic calculations, indicating that upon cooling, the σ phase can directly precipitate from the γ matrix under thermodynamic equilibrium conditions. When the carbon and nitrogen contents are below the critical threshold, the σ phase precipitates directly at the austenite grain boundaries through a typical solid-state reaction [17].
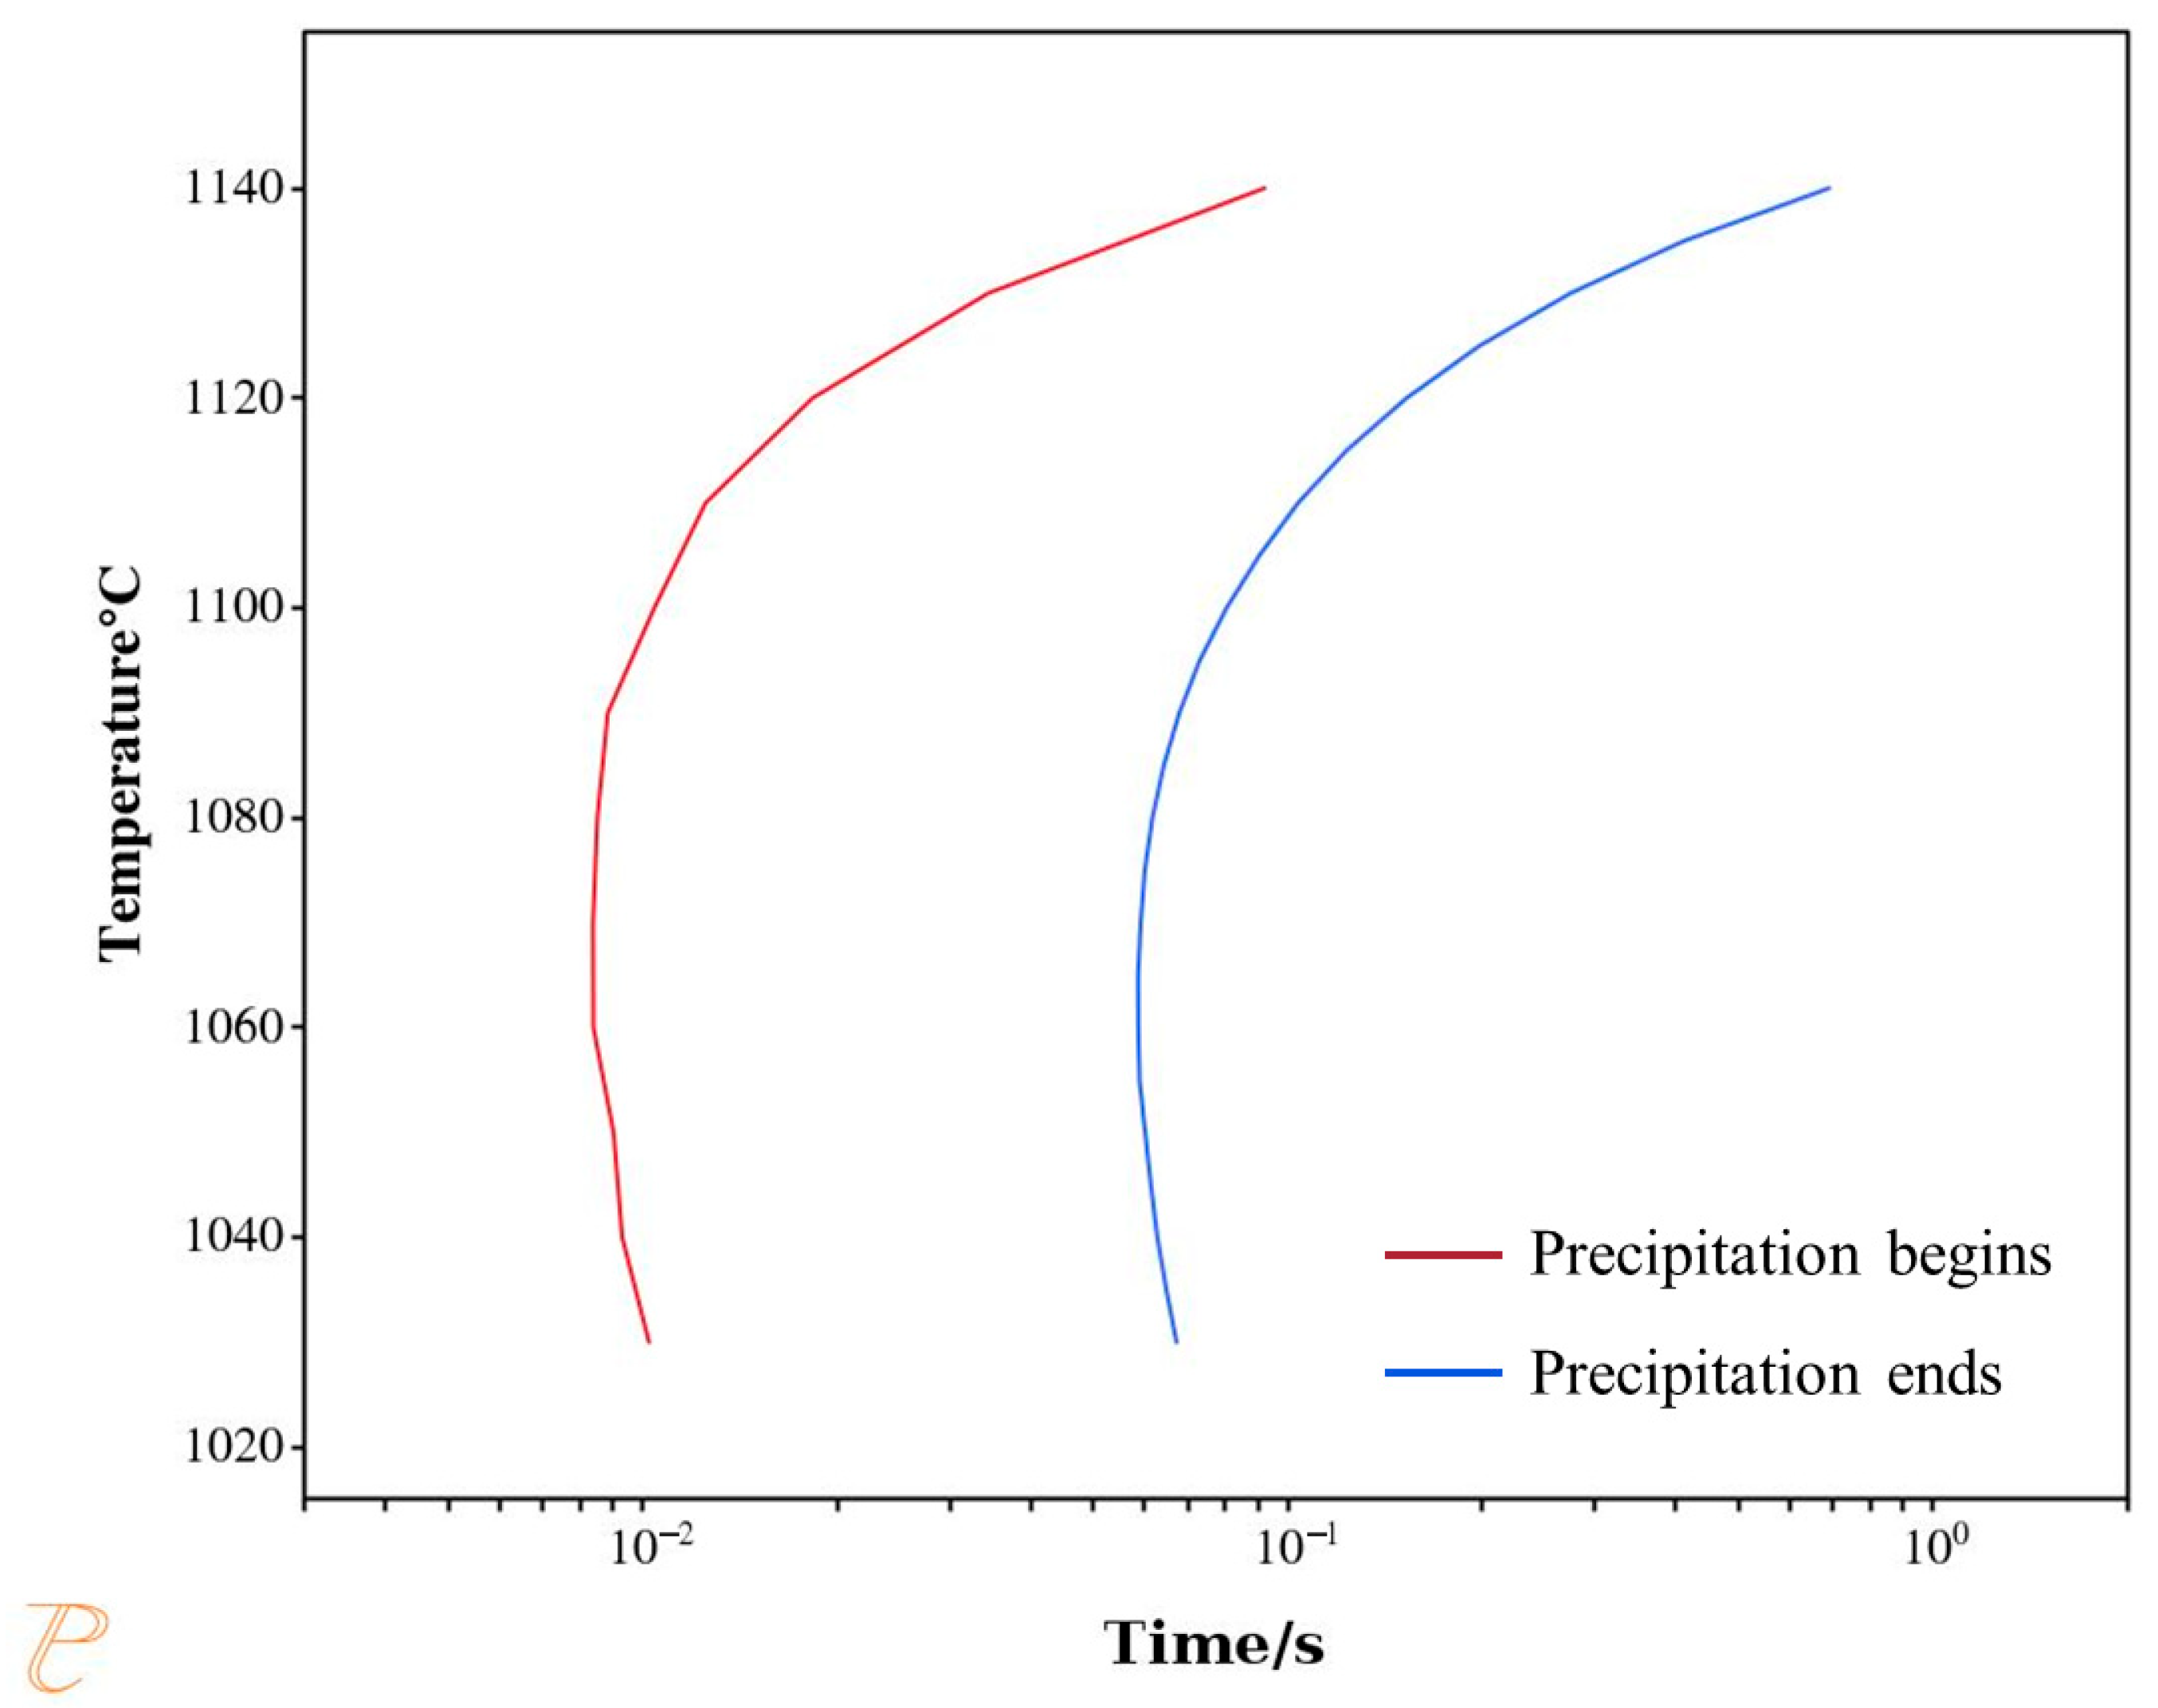
The kinetics of phase transformation play a crucial role in controlling the microstructure and properties of materials. The time required for isothermal transformations can be characterized using a Time–Temperature–Transformation (TTT) diagram. Figure 15 presents the TTT curve for the precipitation of the σ phase from austenite. The red curve represents the onset time of σ phase precipitation, while the blue curve corresponds to the completion time of the precipitation reaction. As shown in the figure, the σ phase precipitates at a very fast rate—even a short residence time within the calculated temperature range can lead to its rapid formation. This result is consistent with the aforementioned in situ observations. Therefore, relying solely on rapid cooling is insufficient to effectively suppress σ phase precipitation. Additionally, the “nose temperature” for σ phase precipitation is 1070 °C, at which the precipitation rate reaches its maximum.
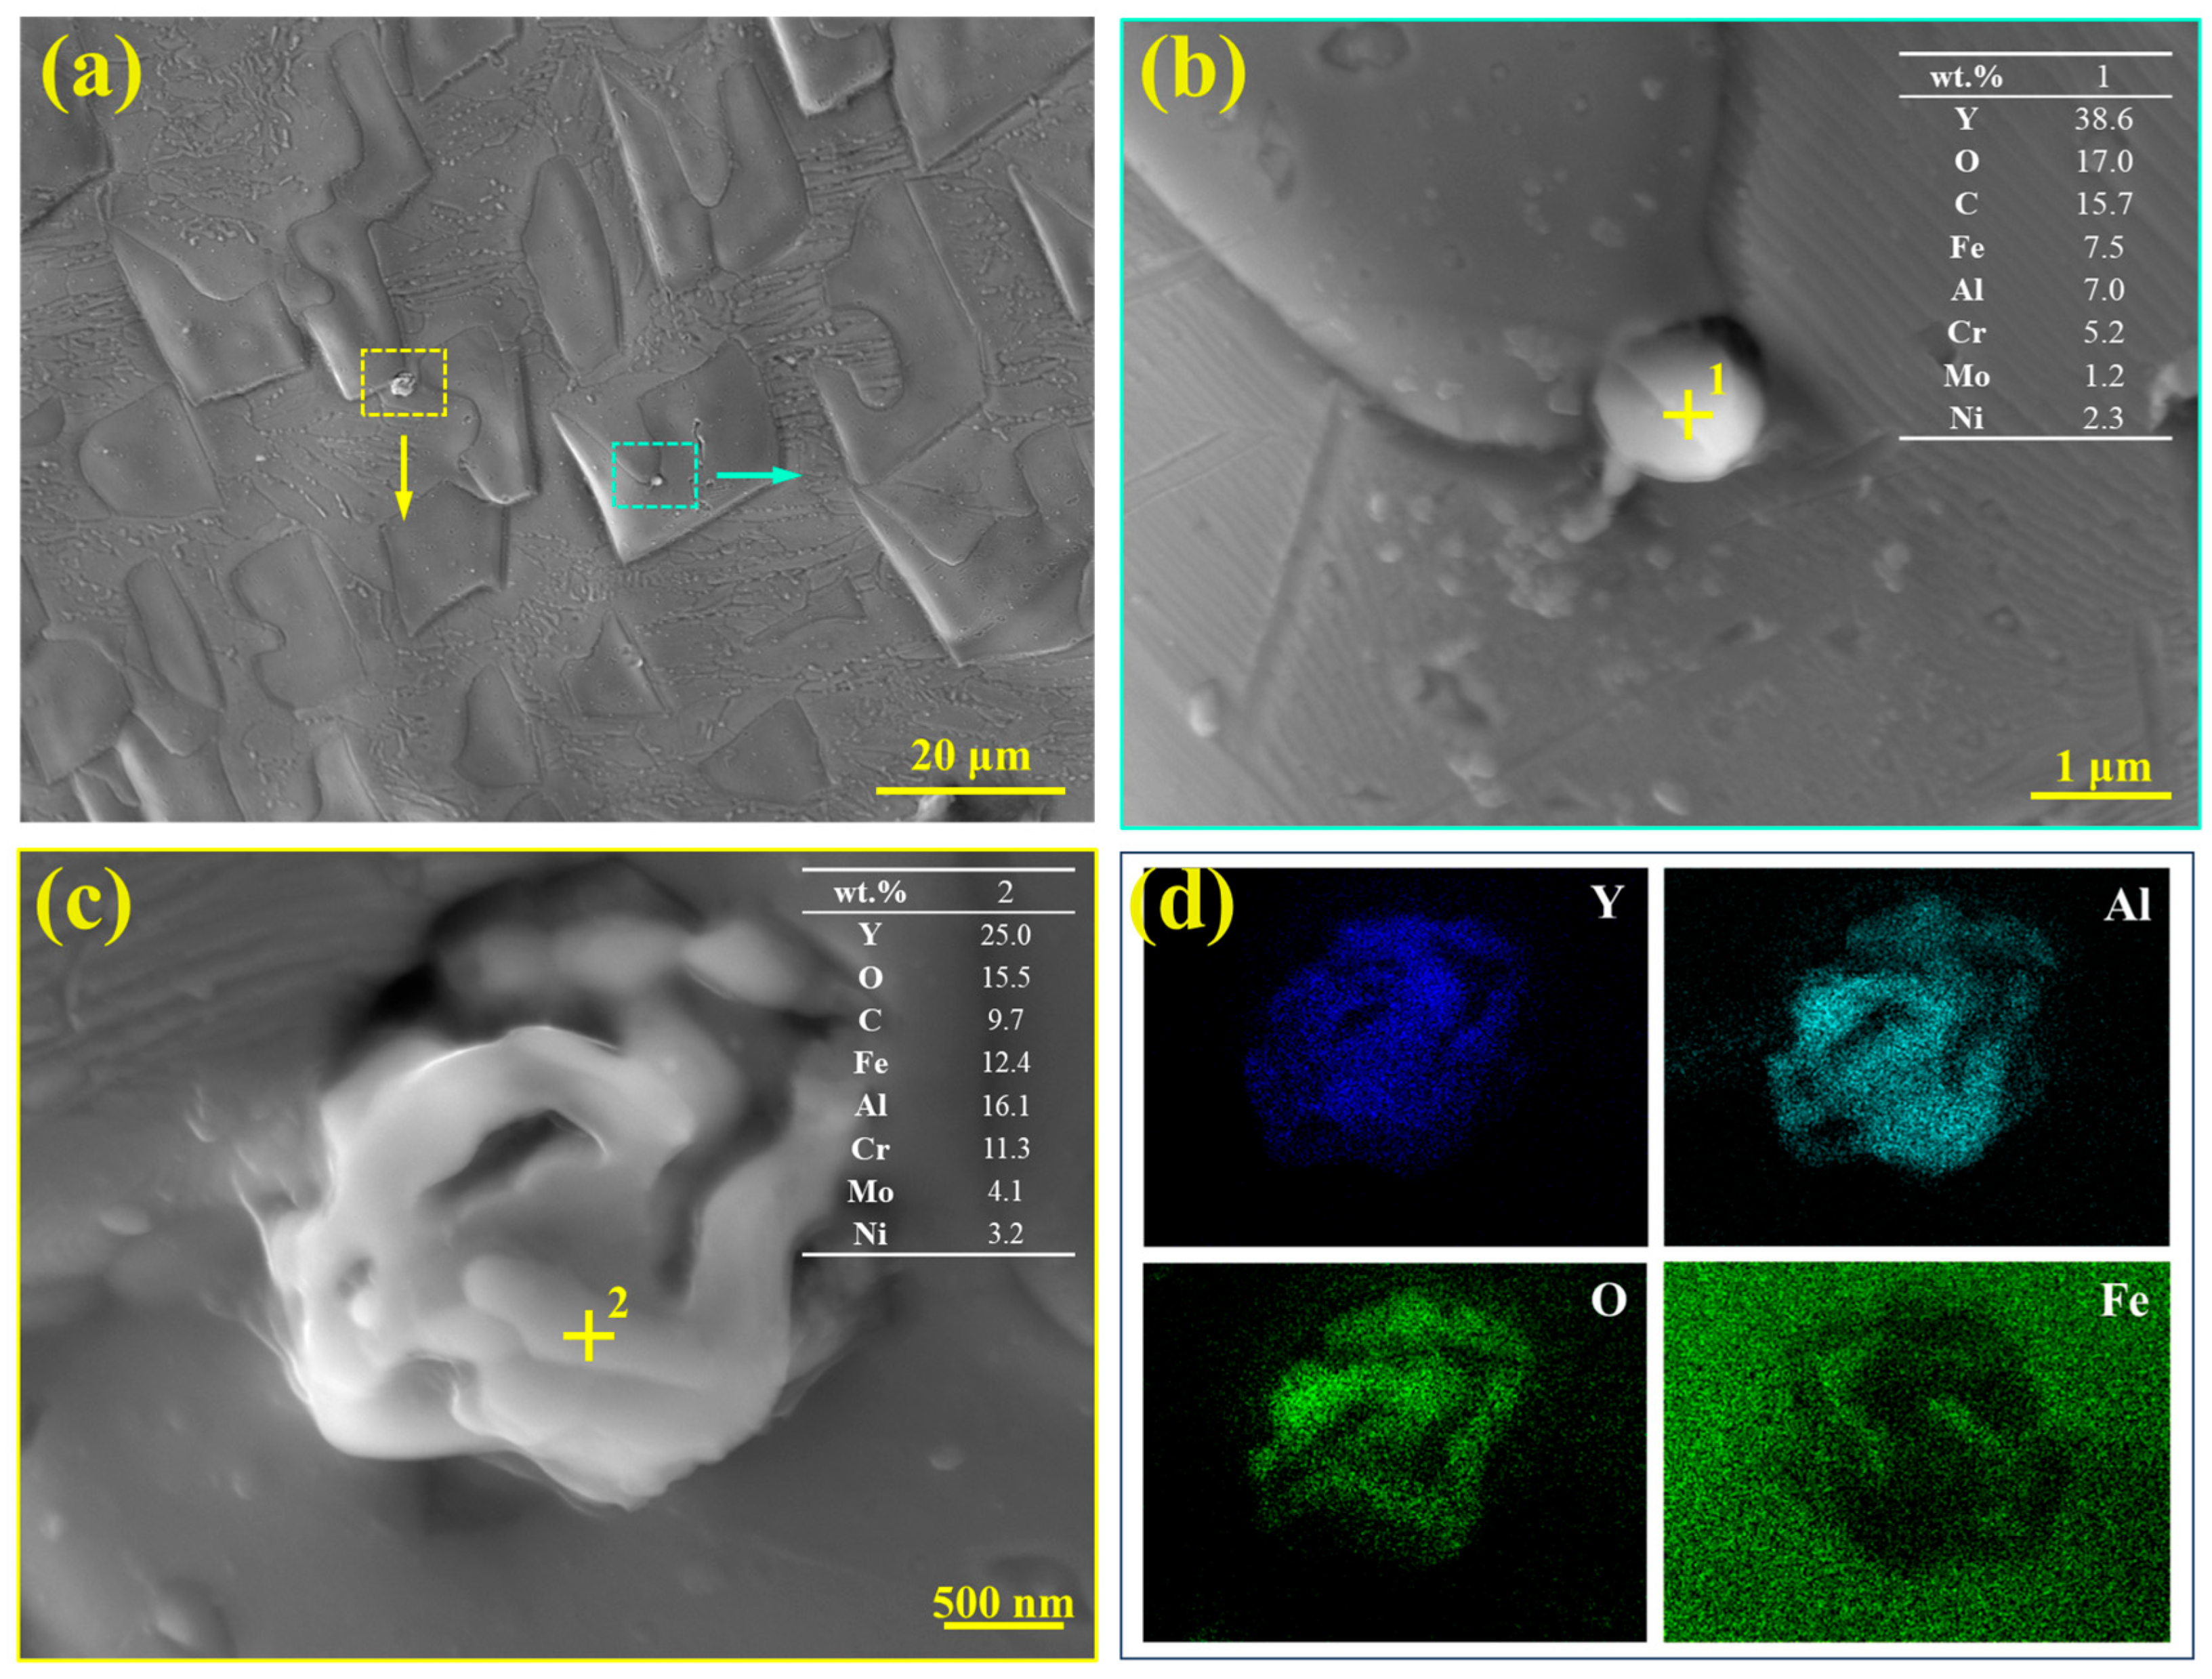
Further observations revealed the presence of some inclusions in the S32654Y sample, as shown in Figure 16. Small-sized inclusions can be seen at the γ/σ phase interface. Figure 16b,c show the high-magnification morphology of the inclusions and the results of EDS point analysis, respectively. The inclusion at Point 1 appears as a spherical particle, while that at Point 2 is in a clustered form. Based on their main elemental composition (Y, Al, and O), these inclusions can be identified as rare-earth-containing oxide inclusions. The EDS elemental mapping in Figure 16d further confirms that the inclusions are mainly composed of Y, Al, and O, suggesting that their principal phase is likely YAlO3. As reported in previous studies, rare earth additions typically promote the formation of inclusions with good lattice matching to the austenite matrix, which can serve as heterogeneous nucleation sites and thereby promote grain refinement [28]. In addition, rare earth elements have high surface activity and tend to accumulate at the solid–liquid interface ahead of the solidification front, reducing the surface tension of the molten steel and suppressing grain growth. These inclusions may also act as potential heterogeneous nucleation sites for σ phase precipitation, influencing its transformation behavior.

3.7. The Effect of Rare Earth Element Y on Solidification Microstructure and Microhardness

The metallographic structures of the samples observed via HT-CLSM are shown in Figure 17. Significant differences are evident between the two samples. Figure 17a displays an OM image of the entire cross-section of the S32654 sample, showing the formation of typical dendritic structures, with no other phases observed—confirming the in situ precipitation process of the σ phase. Figure 17b, a magnified view of (a), clearly reveals the austenitic dendrites and the eutectoid structures between them. Figure 17d presents the OM microstructure of the S32654Y sample, in which the structure is mainly composed of cellular crystals; the interiors of the cells contain granular austenite and eutectoid structures.
Statistical results in Table 5 indicate that although rare earth element Y refines the austenite grains and secondary dendrite arm spacing, the eutectoid content increases. This is because Y extends the solidification temperature range and grain growth time, promoting the microsegregation of σ-phase-forming elements such as Cr and Mo. The addition of rare earth Y increases the number of heterogeneous nucleation sites, and raises both the initial solidification temperature and the σ phase precipitation temperature, thereby enhancing atomic diffusion during solidification and promoting the extensive precipitation of the σ phase in the subsequent eutectoid transformation. Related studies have shown that inclusions formed by rare earth elements also act as heterogeneous nucleation sites for the σ phase, and Y may alter the energy state of the matrix and lower the nucleation barrier for σ phase formation [12]. Zhang S [31] reported that rare earth Ce can increase the precipitation temperature of the σ phase and enhance the activity of Cr and Mo during its initial formation, thus facilitating σ phase nucleation.
Compared with mold-cast samples, the eutectoid content in HT-CLSM samples is higher. This is primarily due to the faster solidification rate in HT-CLSM samples, which prevents sufficient diffusion of solute elements according to thermodynamic equilibrium, leading to significant local enrichment of Cr, Mo, and other elements at grain boundaries and interdendritic regions. During the subsequent phase transformation stage, these highly concentrated enriched zones provide favorable compositional conditions for the formation of the σ phase.
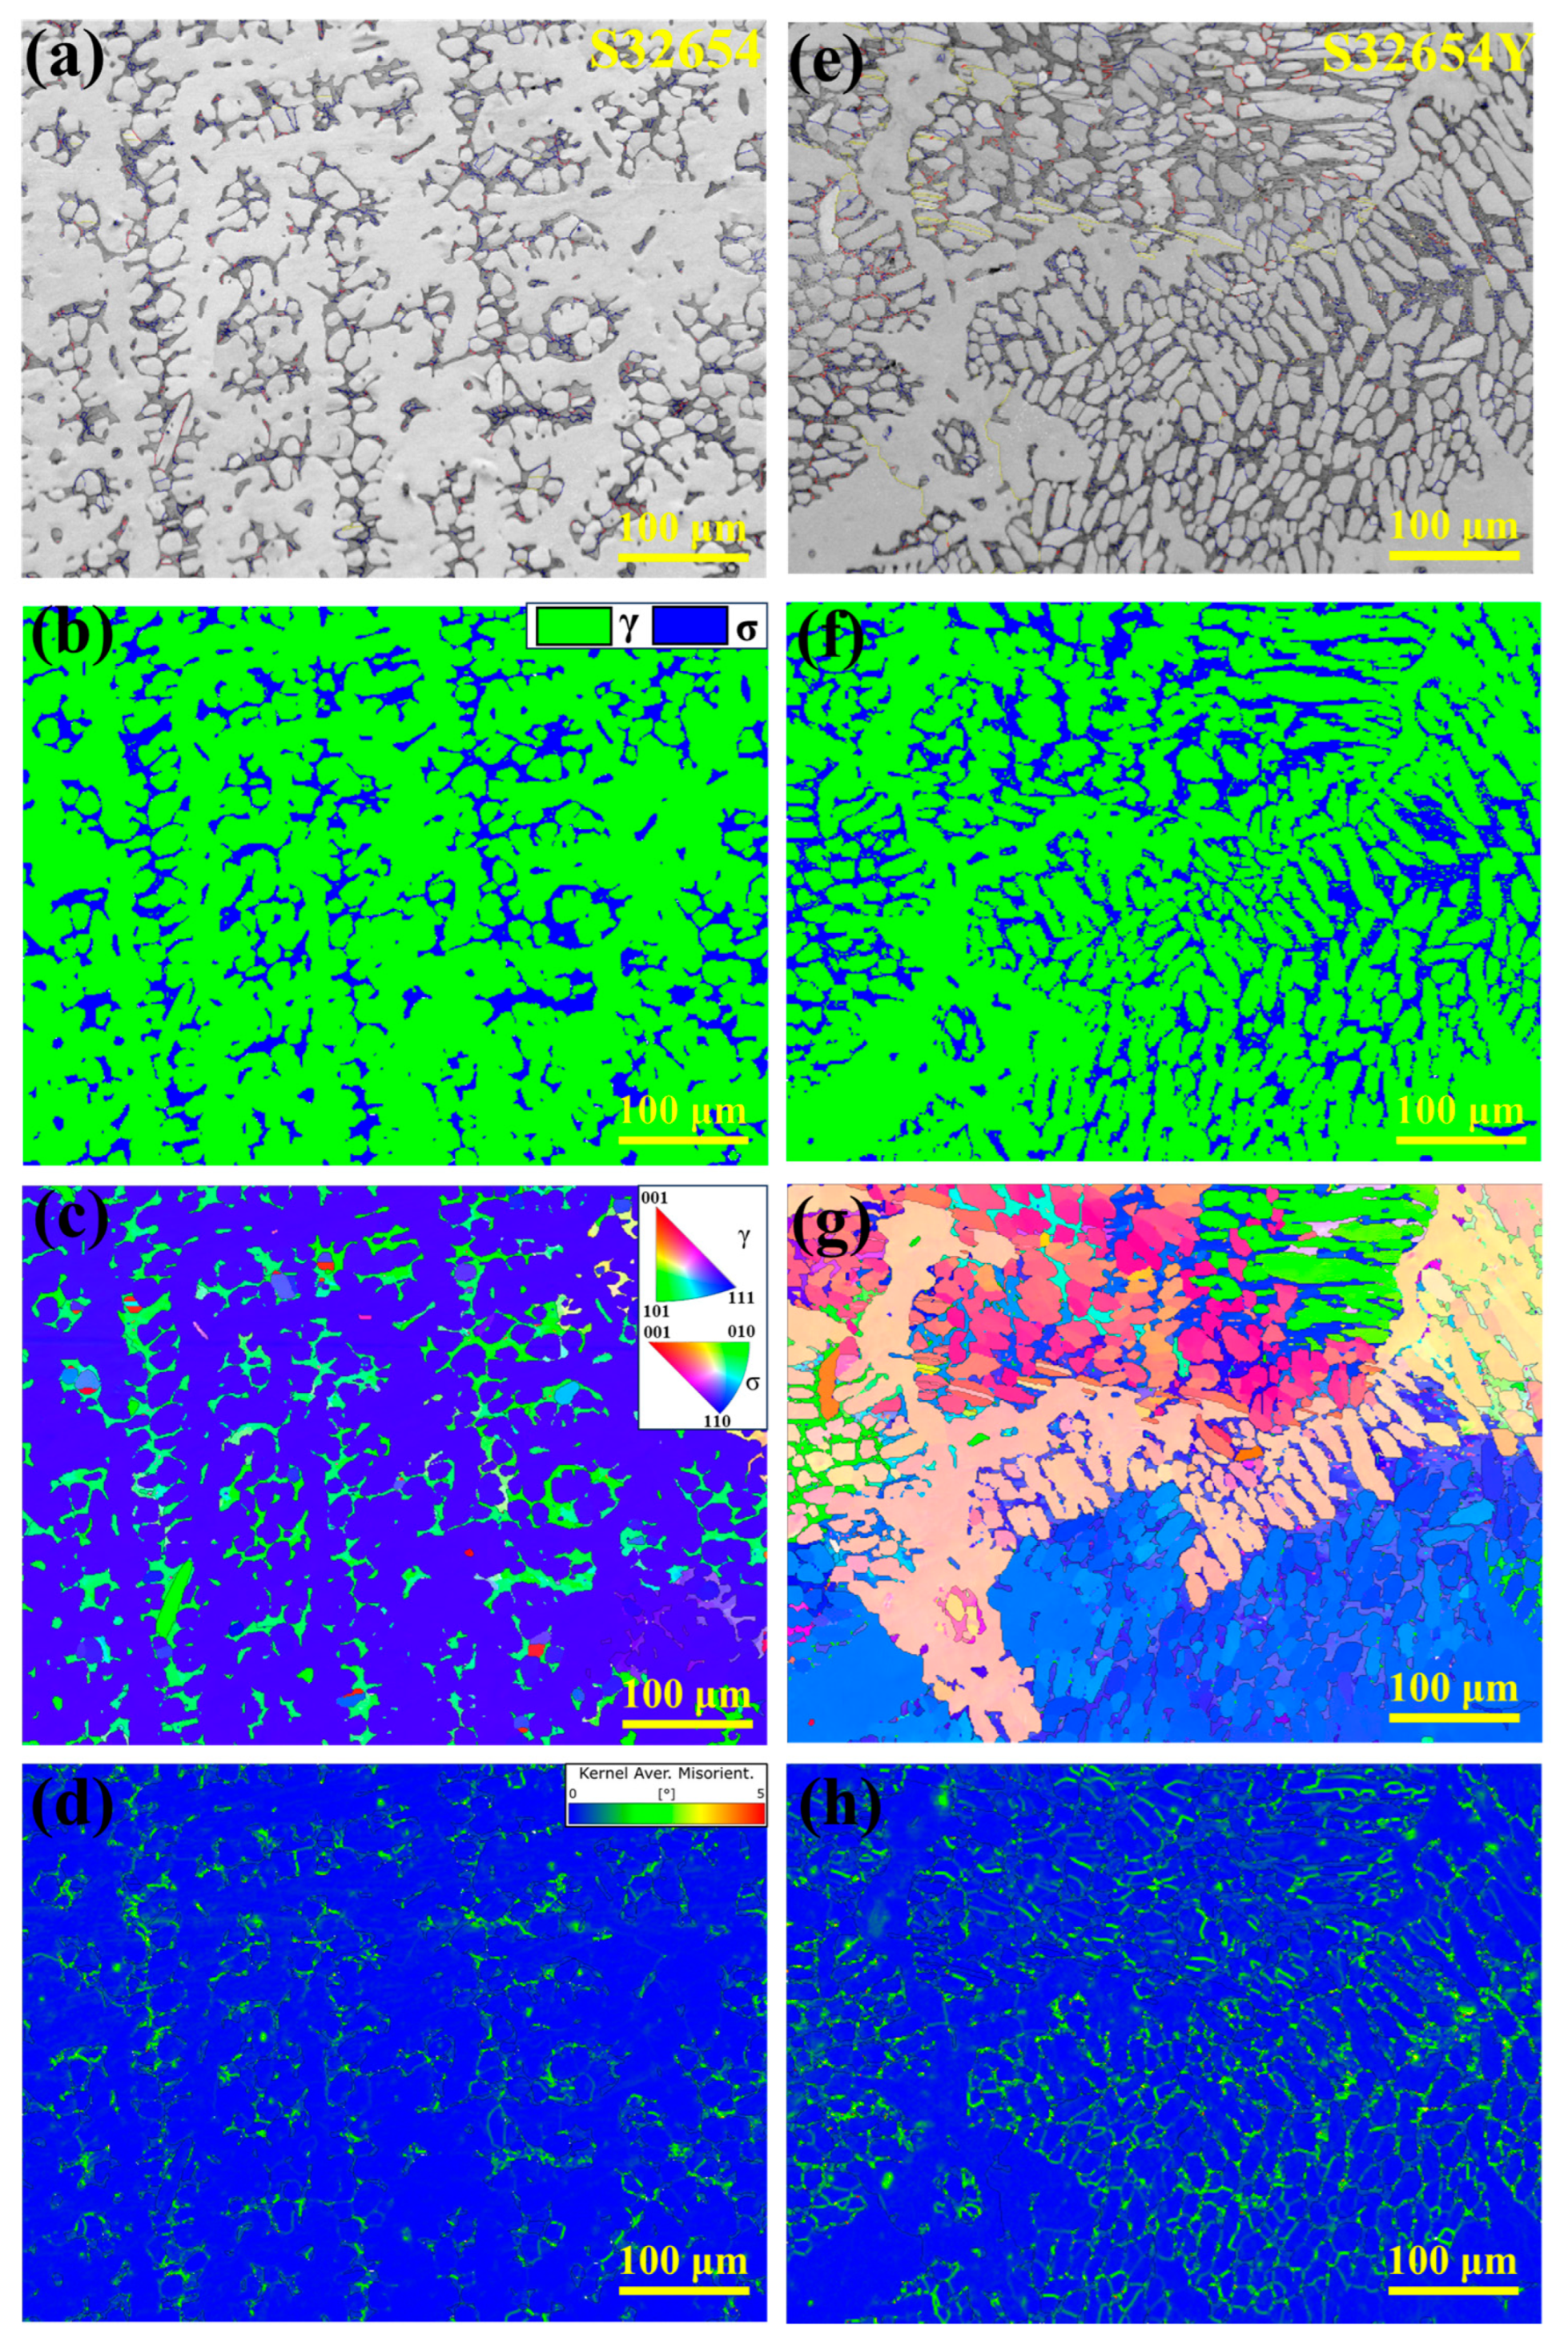
To further investigate the microstructural characteristics of the HT-CLSM samples, EBSD analysis was conducted on the central regions of both samples, as shown in Figure 18. The grain boundary fractions and σ phase contents were quantitatively analyzed and are summarized in Table 6. Understanding the nature of different boundaries or interfaces in SASS is crucial. Figure 18a,e show the IQ maps of the two samples. In this study, grain boundaries with a misorientation angle greater than 15° are defined as high-angle grain boundaries (HAGBs), shown as red lines in the figures; those with misorientation between 2° and 15° are defined as low-angle grain boundaries (LAGBs), shown in blue; coincidence site lattice (CSL Σ3) boundaries are indicated in yellow.
Among the grain boundary characteristics of both samples, LAGBs dominate throughout the interfacial region, while the S32654Y sample exhibits a higher proportion of HAGBs. 
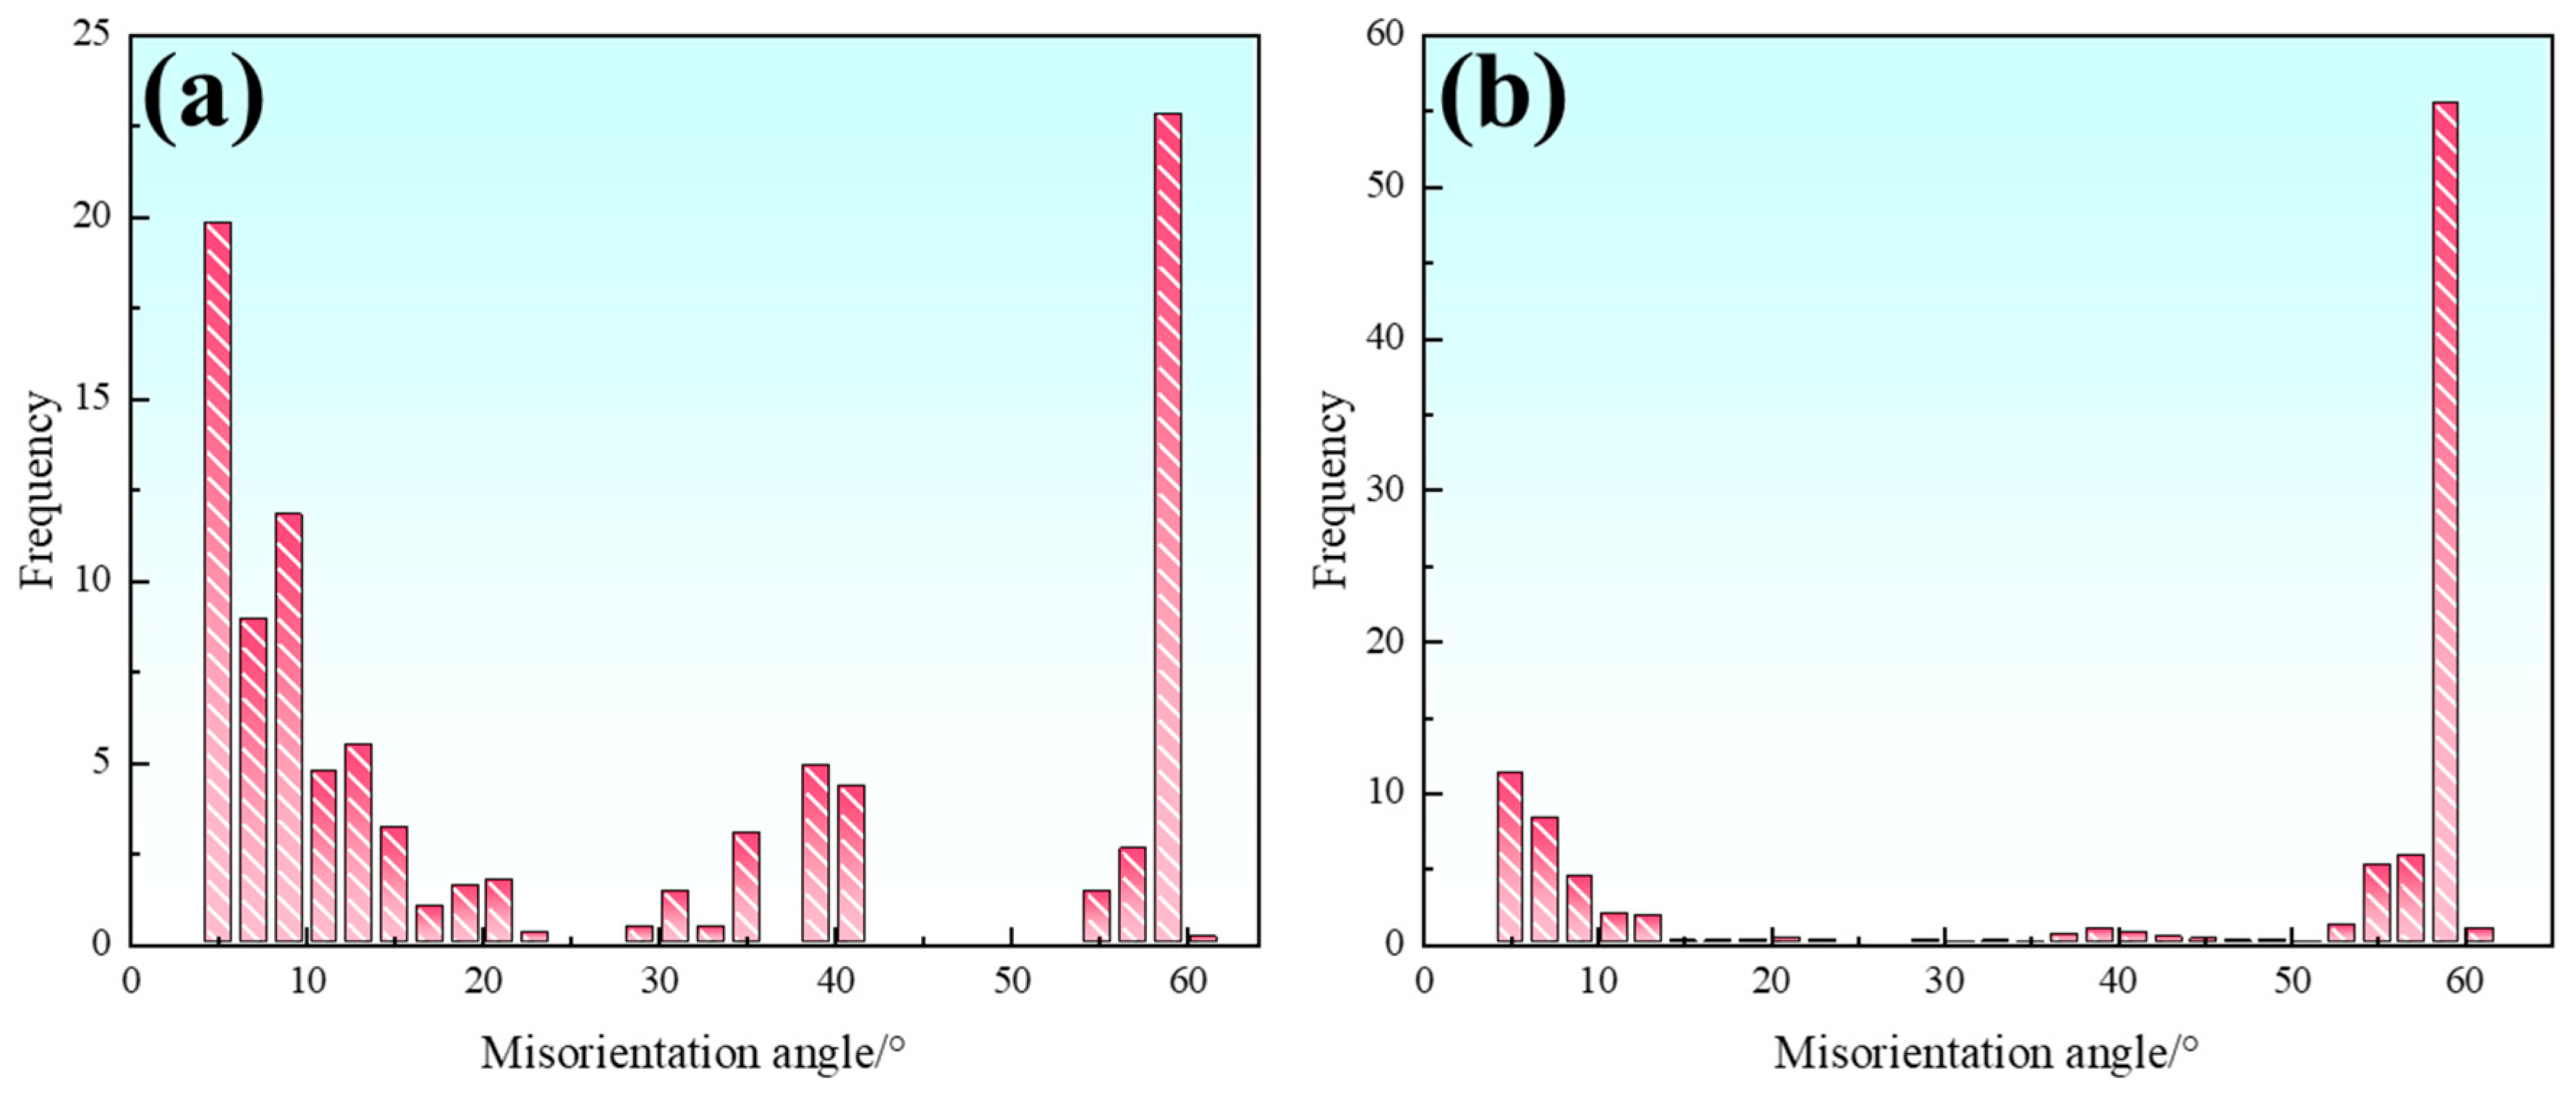
Figure 19 displays the statistical distribution of misorientation angles in the austenite phase of both samples, showing that the S32654Y sample contains a higher fraction of CSL Σ3 boundaries. CSL boundaries possess a high degree of atomic order and low grain boundary energy, thus offering better stability within the material. The addition of rare earth element Y increases local solute undercooling and induces interfacial energy fluctuations in the dendritic regions, thereby promoting the formation of twin dendrites. Moreover, CSL boundaries are considered to impede crack propagation to some extent, contributing to improved toughness in SASS.
As shown in Figure 18b,f, the σ phase is mainly distributed in the interdendritic regions of austenite. The volume fraction of the σ phase in the S32654 sample is 15.1%, whereas in the S32654Y sample it reaches 20.4%, indicating that the addition of rare earth element Y promotes the precipitation of the σ phase during solidification. This is consistent with the previously reported statistical results of the eutectic phase fraction. Figure 18c,g show the grain orientation maps (IPF maps), illustrating the distribution of grain orientations. The austenite in the S32654 sample exhibits relatively uniform orientation, presenting a single dendritic structure, whereas the S32654Y sample contains multiple dendrites with a clearly visible feather-like morphology, further confirming that rare earth Y effectively refines the solidification microstructure. Figure 18d,h present the local average misorientation (KAM) maps, which indicate that strain is mainly concentrated in the σ phase regions, suggesting the presence of significant local stresses within the σ phase.
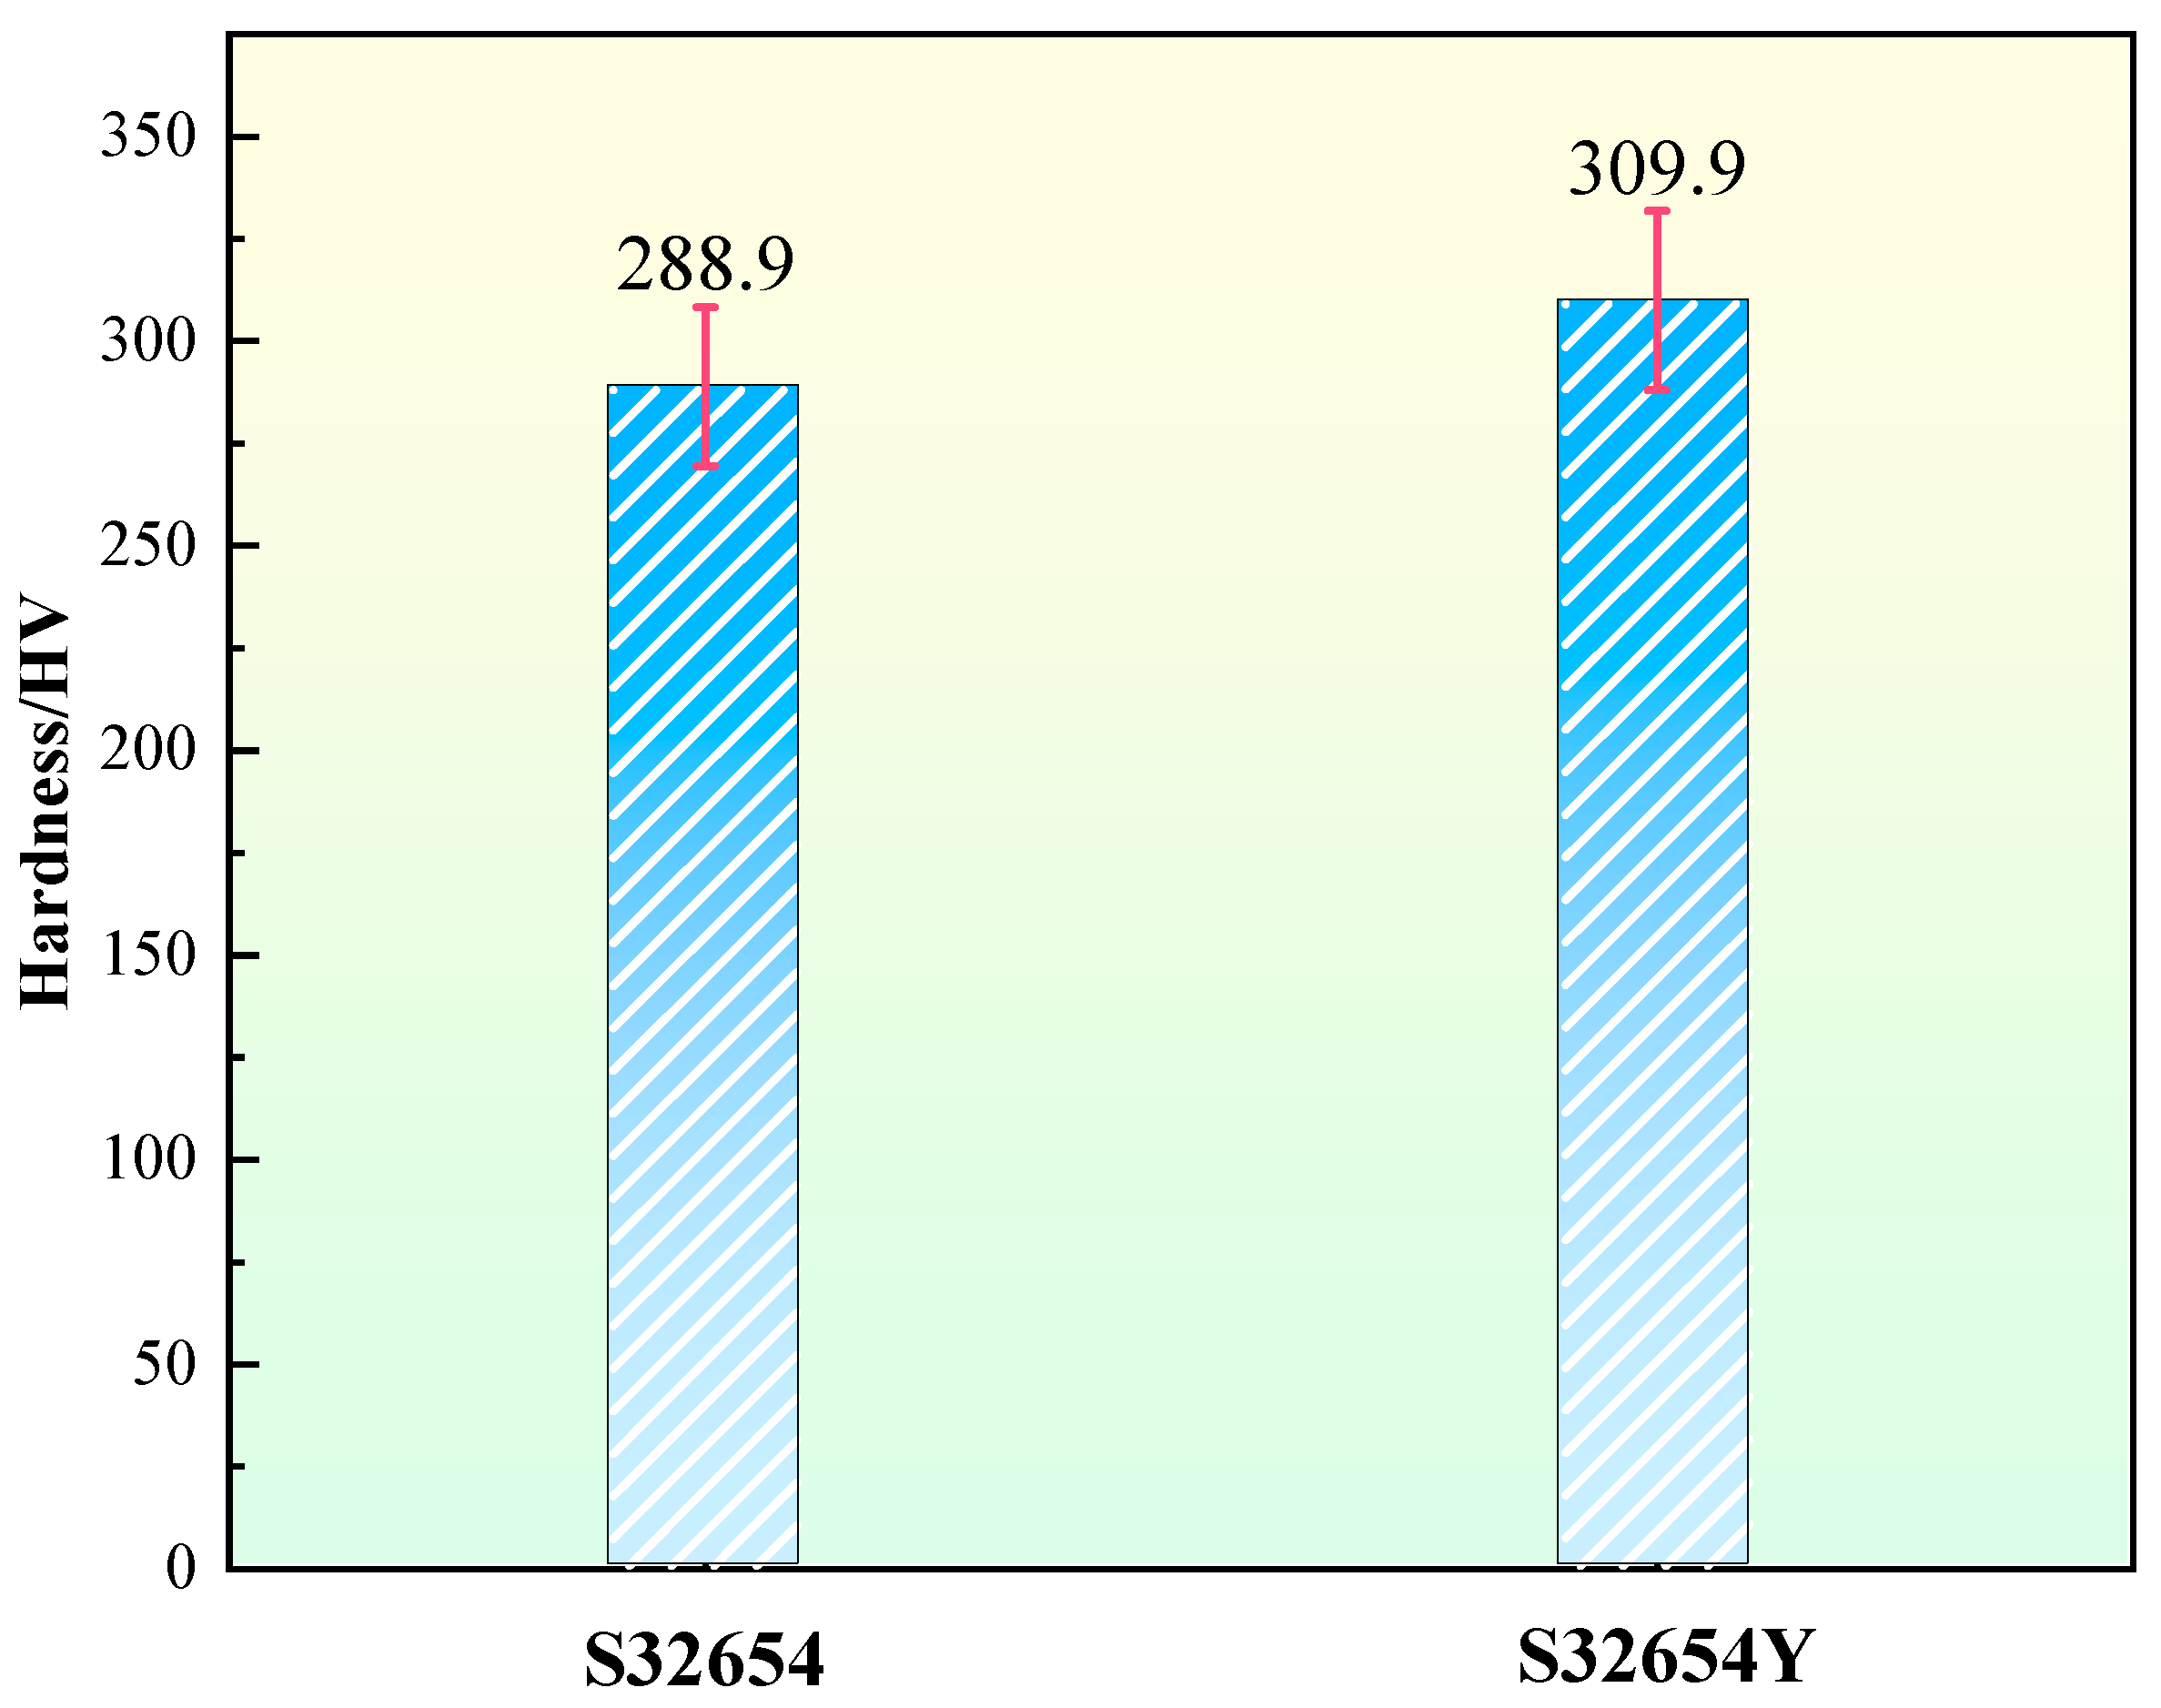
The microhardness of the two samples is shown in Figure 20. It can be observed that after the addition of the rare earth element Y, the microhardness of the sample increased from 288.9 HV to 309.9 HV. The hardness improvement is mainly attributed to two factors: first, the σ phase itself has a hardness much higher than that of the austenitic matrix, and its precipitation significantly enhances the overall hardness of the material; second, the introduction of rare earth elements promotes the refinement of secondary dendrites in the microstructure, which also contributes to the increase in microhardness.
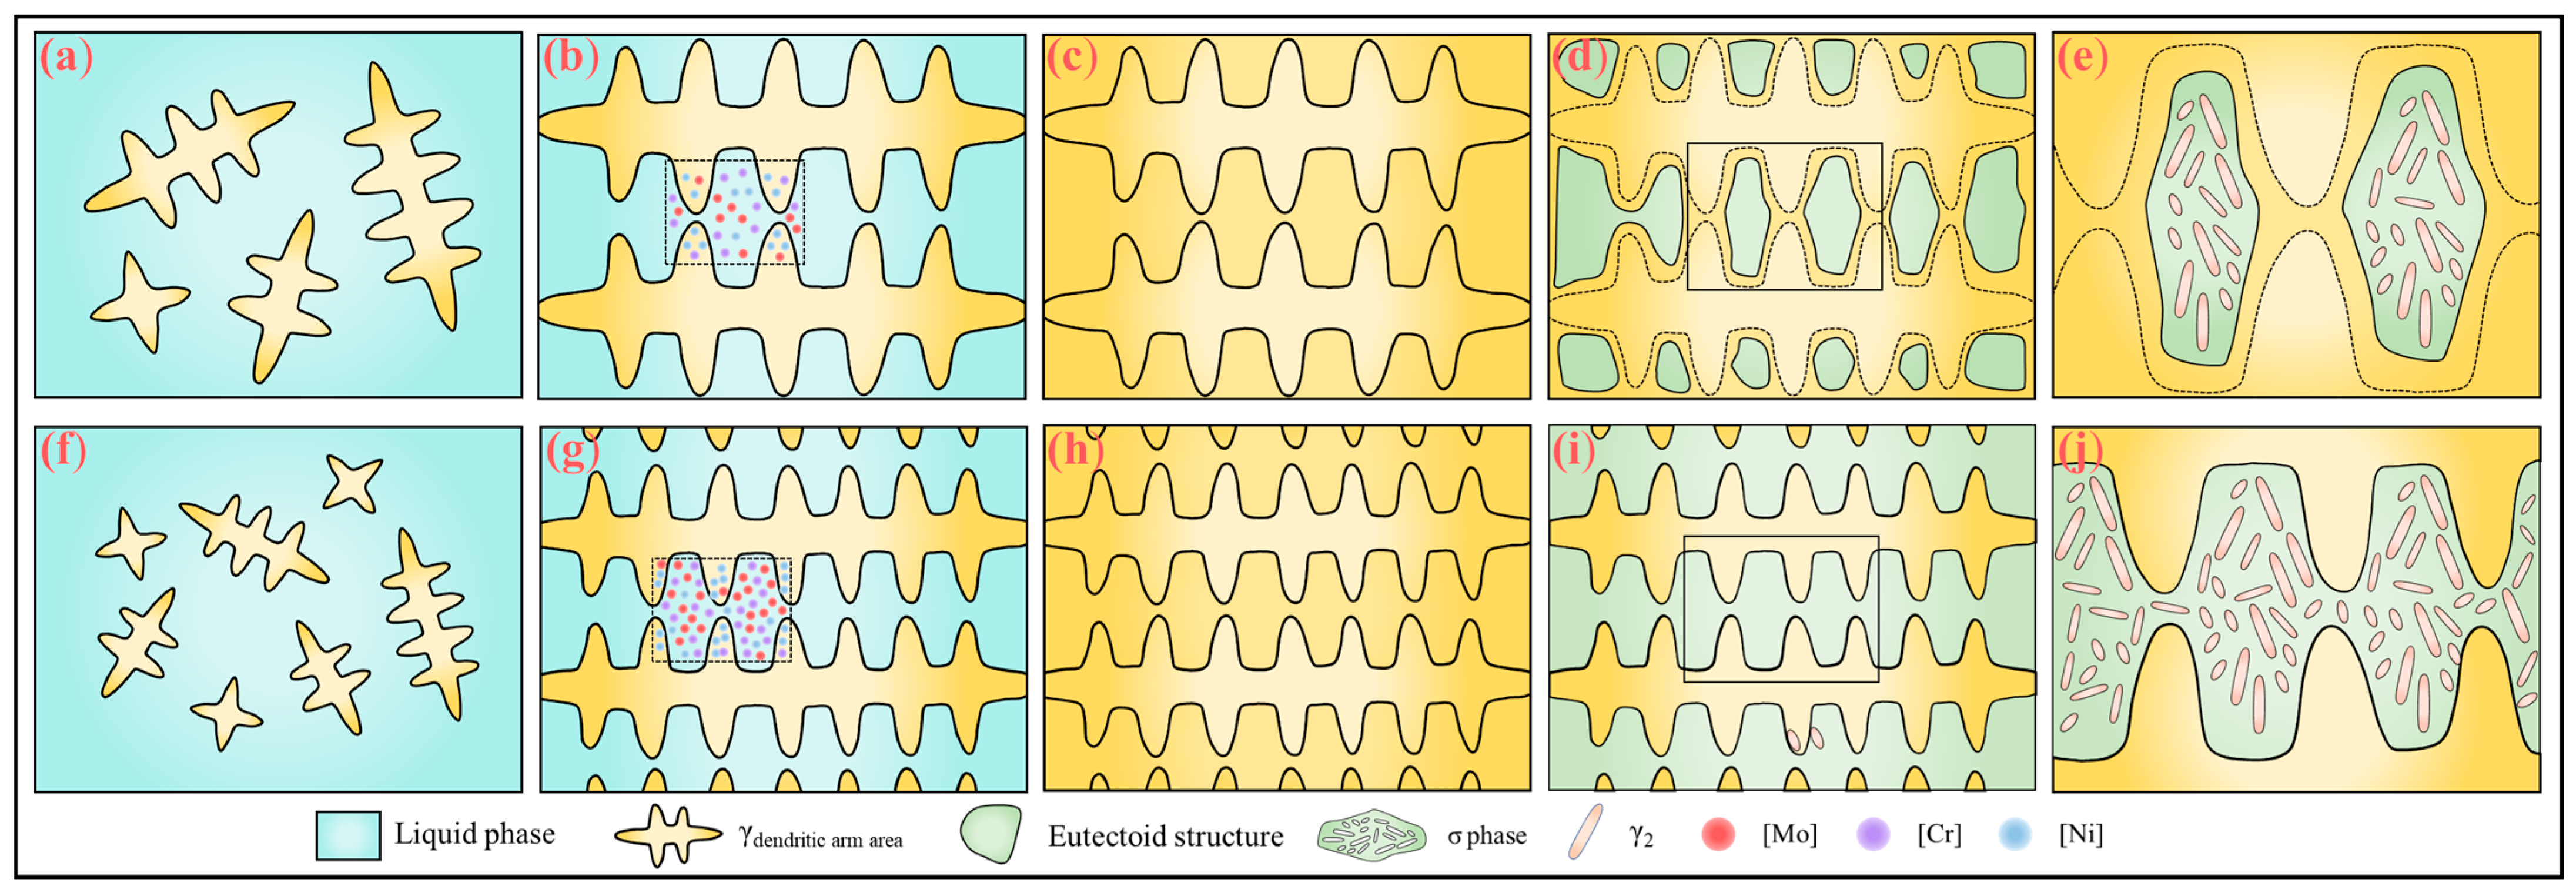
Figure 21 illustrates a schematic diagram of the mechanism by which the rare earth element Y affects the solidification microstructure and σ phase precipitation behavior in SASS. In the early stage of solidification (Figure 21a,f), rare earth inclusions act as heterogeneous nucleation sites, facilitating the nucleation of austenite and raising the nucleation starting temperature. With the introduction of rare earth Y (Figure 21b,g), the alloy’s solidification temperature range is broadened, and the grain growth time is extended, which intensifies the segregation of Cr and Mo elements in the interdendritic regions. At the end of solidification (Figure 21c,h), the microstructure transforms into fully austenitic. During the subsequent eutectic transformation stage (Figure 21d,i), the addition of rare earth elements raises the eutectic transformation temperature and promotes the precipitation of the σ phase. Meanwhile, rare earth inclusions may also serve as heterogeneous nucleation sites for the σ phase, leading to an increase in σ phase content. Additionally, due to dendrite refinement, the growth space for the σ phase is limited, resulting in a smaller σ phase size. In summary, through the synergistic effect of rare earth inclusions and solute Y, the solidification microstructure of the sample is refined, but the σ phase content increases (Figure 21e,j).

4. Conclusions

  • The solidification microstructure of SASS exhibits a typical dendritic morphology, primarily consisting of austenite dendrites and interdendritic eutectoid structures. The eutectoid structure is composed of the σ phase and the γ2 phase, displaying layered or cellular morphologies. Along the cross-section from the edge to the center, the secondary dendrite arm spacing gradually increases, whereas the volume fraction of the eutectoid structure decreases.
  • The distribution of Mo within the dendrites shows a “concave” profile, with lower concentration at the center and higher concentrations at the sides. When locally enriched, Mo tends to promote the formation of eutectoid structures. Mo exhibits the highest degree of segregation among the alloying elements, with a segregation ratio reaching 1.69, indicating significant segregation during solidification. The Mo content difference between the σ and γ2 phases is the most pronounced.
  • The σ phase forms through a solid-state transformation of austenite (γ → γ2 + σ). At the final stage of solidification, the residual liquid transforms into austenite enriched in Cr and Mo. Due to insufficient diffusion, elemental distribution between the interdendritic regions and the matrix becomes markedly inhomogeneous. The interdendritic austenite, being supersaturated with alloying elements, undergoes a solid-state phase transformation upon further cooling, leading to the precipitation of the σ phase. The transformation pathway can be summarized as L → L + γ → γ → γ + γ2 + σ. The TTT curve and in situ observation results both indicate that the precipitation rate of the σ phase is extremely fast.
  • Microalloying with rare earth element Y has a significant effect on the solidification process. The introduction of Y leads to the formation of rare earth inclusions, which notably increase the nucleation temperature of austenite and enhance the nucleation density, thereby promoting the formation of austenite and refining the solidification microstructure. However, the presence of Y also results in an increased volume fraction of eutectoid structures. This is attributed to the broadened solidification temperature range and prolonged grain growth time, which exacerbate microsegregation of σ-forming elements such as Cr and Mo. Additionally, the addition of Y increases the precipitation temperature of the σ phase and enhances atomic diffusion during solidification, further promoting σ phase precipitation during the eutectic transformation, consequently increasing the microhardness.

Author Contributions

Conceptualization, J.X., G.T. and A.Z.; methodology, J.X. and S.Y.; software, D.W.; validation, D.W., S.Y. and J.W.; investigation, J.X. and D.W.; resources, S.Y. and K.C.; visualization, K.C. and S.Y.; formal analysis, K.C.; supervision, D.W. and A.Z.; data curation, J.X., J.W. and A.Z.; writing—original draft preparation, J.X., D.W. and A.Z.; writing—review and editing, J.W. and G.T.; project administration, A.Z.; funding acquisition, A.Z. All authors have read and agreed to the published version of the manuscript.

Funding

This research was funded by the Fundamental Research Funds for the Central Universities (Grant No. FRF-BD-23-02) and the National Natural Science Foundation of China (Grant No. U1810207).

Data Availability Statement

The original contributions presented in this study are included in the article. Further inquiries can be directed to the corresponding author.

Conflicts of Interest

The authors declare no conflicts of interest.

References

  1. Hsieh, C.-C.; Wu, W. Overview of Intermetallic Sigma (σ) Phase Precipitation in Stainless Steels. ISRN Met. 2012, 2012, 732471. [Google Scholar] [CrossRef]
  2. Li, S.; Zhang, C.; Lu, J.; Chen, R.; Chen, D.; Cui, G. A Review of Progress on High Nitrogen Austenitic Stainless-Steel Research. Mater. Express 2021, 11, 1901–1925. [Google Scholar] [CrossRef]
  3. Zhang, S.; Li, H.; Jiang, Z.; Zhang, B.; Li, Z.; Wu, J.; Fan, S.; Feng, H.; Zhu, H. Effects of Cr and Mo on Precipitation Behavior and Associated Intergranular Corrosion Susceptibility of Superaustenitic Stainless Steel S32654. Mater. Charact. 2019, 152, 141–150. [Google Scholar] [CrossRef]
  4. Anburaj, J.; Nazirudeen, S.S.M.; Narayanan, R.; Anandavel, B.; Chandrasekar, A. Ageing of Forged Superaustenitic Stainless Steel: Precipitate Phases and Mechanical Properties. Mater. Sci. Eng. A 2012, 535, 99–107. [Google Scholar] [CrossRef]
  5. Lo, K.H.; Shek, C.H.; Lai, J.K.L. Recent Developments in Stainless Steels. Mater. Sci. Eng. R Rep. 2009, 65, 39–104. [Google Scholar] [CrossRef]
  6. Qian, M.; DuPont, J.N. Microsegregation-Related Pitting Corrosion Characteristics of AL-6XN Superaustenitic Stainless Steel Laser Welds. Corros. Sci. 2010, 52, 3548–3553. [Google Scholar] [CrossRef]
  7. Lee, T.-H.; Kim, S.-J.; Jung, Y.-C. Crystallographic Details of Precipitates in Fe-22Cr-21Ni-6Mo-(N) Superaustenitic Stainless Steels Aged at 900 °C. Met. Mater. Trans. A 2000, 31, 1713–1723. [Google Scholar] [CrossRef]
  8. Perricone, M.J.; Anderson, T.D.; Robino, C.V.; DuPont, J.N.; Michael, J.R. Effect of Composition on the Formation of Sigma during Single-Pass Welding of Mo-Bearing Stainless Steels. Met. Mater. Trans. A 2007, 38, 1976–1990. [Google Scholar] [CrossRef]
  9. Yamashita, S.; Ike, K.; Yamasaki, K.; Wei, F.-G.; Wang, K.; Ogura, T.; Saida, K. Relationship between Ferrite–Austenite Phase Transformation and Precipitation Behavior of Sigma Phase in Super Duplex Stainless Steel Weldment. Weld. World 2022, 66, 351–362. [Google Scholar] [CrossRef]
  10. Zou, D.; Li, M.; Li, Y.; Hui, P.; He, C. Precipitation Behavior of Sigma and Ferrite Phases During Solidification in 254SMO Stainless Steel: Effect of Ce Elements. Met. Mater. Int. 2025, 1–12. [Google Scholar] [CrossRef]
  11. Kim, S.M.; Kim, J.S.; Kim, K.T.; Park, K.-T.; Lee, C.S. Effect of Ce Addition on Secondary Phase Transformation and Mechanical Properties of 27Cr–7Ni Hyper Duplex Stainless Steels. Mater. Sci. Eng. A 2013, 573, 27–36. [Google Scholar] [CrossRef]
  12. Zhang, S.; Yu, J.; Li, H.; Jiang, Z.; Geng, Y.; Feng, H.; Zhang, B.; Zhu, H. Refinement Mechanism of Cerium Addition on Solidification Structure and Sigma Phase of Super Austenitic Stainless Steel S32654. J. Mater. Sci. Technol. 2022, 102, 105–114. [Google Scholar] [CrossRef]
  13. Wang, Q.; Wang, L.; Sun, Y.; Zhao, A.; Zhang, W.; Li, J.; Dong, H.; Chou, K. The Influence of Ce Micro-Alloying on the Precipitation of Intermetallic Sigma Phase during Solidification of Super-Austenitic Stainless Steels. J. Alloys Compd. 2020, 815, 152418. [Google Scholar] [CrossRef]
  14. Wang, J.; Tian, H.; Liu, Z.; Han, P. Effect of Yttrium Addition on Precipitated Phase, Corrosion Resistance, and Mechanical Behavior of 6Mo Superaustenitic Stainless Steel. Mater. Lett. 2023, 352, 135174. [Google Scholar] [CrossRef]
  15. Zhang, S.; Li, H.; Jiang, Z.; Feng, H.; Wen, Z.; Ren, J.; Han, P. Unveiling the Mechanism of Yttrium Significantly Improving High-Temperature Oxidation Resistance of Super-Austenitic Stainless Steel S32654. J. Mater. Sci. Technol. 2022, 115, 103–114. [Google Scholar] [CrossRef]
  16. Li, J.G.; Wang, N.; Liu, J.D.; Xu, W. Influence of Rare Earth Elements (Y, La and Ce) on the Mechanical Properties and Oxidation Resistance of Nickel-Based Superalloys: A Critical Review. J. Mater. Sci. Technol. 2024, 195, 9–21. [Google Scholar] [CrossRef]
  17. Xiong, J.; Li, T.; Yuan, X.; Mao, G.; Yang, J.; Yang, L.; Xu, J. Improvement in Weldment of Dissimilar 9% CR Heat-Resistant Steels by Post-Weld Heat Treatment. Metals 2020, 10, 1321. [Google Scholar] [CrossRef]
  18. Marin, R.; Combeau, H.; Zollinger, J.; Dehmas, M.; Rouat, B.; Lamontagne, A.; Loukachenko, N.; Lhenry-Robert, L. σ-Phase Formation in Super Austenitic Stainless Steel During Directional Solidification and Subsequent Phase Transformations. Met. Mater. Trans. A 2020, 51, 3526–3534. [Google Scholar] [CrossRef]
  19. Lee, C.; Lee, Y.; Lee, C.; Hong, S. Precipitation Behavior of the Sigma Phase with Ni and Mn Content Variations in Superaustenitic Stainless Steel Weld Metal. Mater. Charact. 2018, 144, 148–154. [Google Scholar] [CrossRef]
  20. Adams, K.D.; DuPont, J.N.; Marder, A.R. The Influence of Centerline Sigma (σ) Phase on the Through-Thickness Toughness and Tensile Properties of Alloy AL-6XN. J. Mater. Eng. Perform. 2007, 16, 123–130. [Google Scholar] [CrossRef]
  21. Perron, A.; Toffolon-Masclet, C.; Ledoux, X.; Buy, F.; Guilbert, T.; Urvoy, S.; Bosonnet, S.; Marini, B.; Cortial, F.; Texier, G.; et al. Understanding Sigma-Phase Precipitation in a Stabilized Austenitic Stainless Steel (316Nb) through Complementary CALPHAD-Based and Experimental Investigations. Acta Mater. 2014, 79, 16–29. [Google Scholar] [CrossRef]
  22. Ferrandini, P.L.; Rios, C.T.; Dutra, A.T.; Jaime, M.A.; Mei, P.R.; Caram, R. Solute Segregation and Microstructure of Directionally Solidified Austenitic Stainless Steel. Mater. Sci. Eng. A 2006, 435–436, 139–144. [Google Scholar] [CrossRef]
  23. Hao, Y.; Cao, G.; Li, C.; Liu, W.; Li, J.; Liu, Z.; Gao, F. Solidification Structures of Fe–Cr–Ni–Mo–N Super-Austenitic Stainless Steel Processed by Twin-Roll Strip Casting and Ingot Casting and Their Segregation Evolution Behaviors. ISIJ Int. 2018, 58, 1801–1810. [Google Scholar] [CrossRef]
  24. Xiao, J.; Zhang, Y.; Zhang, W.; Zhao, A. Precipitation Mechanism of σ Phase in S32654 Super Austenitic Stainless Steel. Mater. Lett. 2023, 349, 134834. [Google Scholar] [CrossRef]
  25. Konosu, S.; Mashiba, H.; Takeshima, M.; Ohtsuka, T. Effects of Pretest Aging on Creep Crack Growth Properties of Type 308 Austenitic Stainless Steel Weld Metals. Eng. Fail. Anal. 2001, 8, 75–85. [Google Scholar] [CrossRef]
  26. Enomoto, M.; Hayashi, K. Modeling the Growth of Austenite in Association with Cementite during Continuous Heating in Low-Carbon Martensite. J. Mater. Sci. 2018, 53, 6911–6921. [Google Scholar] [CrossRef]
  27. Zou, D.; Han, Y.; Zhang, W.; Yu, J. Sigma Phase Precipitation and Properties of Super-Duplex Stainless Steel UNS S32750 Aged at the Nose Temperature. J. Wuhan Univ. Technol.-Mater. Sci. Ed. 2011, 26, 182–185. [Google Scholar] [CrossRef]
  28. Chen, L.; Ma, X.; Wang, M.; Xue, H. Effect of RE on Molybdenum Partitioning and Resultant Mechanical and Microstructural Behavior of a Duplex Stainless Steel during Hot Working Condition. J. Rare Earths 2015, 33, 107–112. [Google Scholar] [CrossRef]
  29. Liu, H.; Lu, S.; Zhang, Y.; Chen, H.; Chen, Y.; Qian, M. Migration of Solidification Grain Boundaries and Prediction. Nat. Commun. 2022, 13, 5910. [Google Scholar] [CrossRef] [PubMed]
  30. Liu, F.; Sommer, F.; Mittemeijer, E.J. Analysis of the Kinetics of Phase Transformations; Roles of Nucleation Index and Temperature Dependent Site Saturation, and Recipes for the Extraction of Kinetic Parameters. J. Mater. Sci. 2007, 42, 573–587. [Google Scholar] [CrossRef]
  31. Yu, J.; Zhang, S.; Li, H.; Jiang, Z.; Feng, H.; Zhang, B.; Zhu, H.; Dai, Y. Influence Mechanism of Cerium Addition on Precipitation Behaviour of Super Austenitic Stainless Steel S32654. J. Mater. Res. Technol. 2023, 24, 7108–7120. [Google Scholar] [CrossRef]
Figure 1. Curve of stable phase content changing with temperature (calculated by Thermo-Calc software).
Metals 15 00798 g001
Figure 2. Dendrite structures at different locations of SASS: (a) edge; (b) R/2; (c) center.
Metals 15 00798 g002
Figure 3. (a) Secondary dendrite spacing at different locations of the ingot; (b) statistical results of eutectoid volume fraction.
Metals 15 00798 g003
Figure 4. (a) Honeycomb-like eutectic structure; (b) crack passing through the eutectic structure; (c) coral-like γ2 phase; (d) lamellar γ2 phase; (e,f) deep corrosion morphologies of SASS; (g) BC map; (h) phase composition map; (i) IPF map.
Metals 15 00798 g004
Figure 5. (a,b) EDS line scan images along the dendrite trunk; (c,d) EDS line scan images perpendicular to the dendrite trunk. (The yellow arrows in the figure indicate the regions of line scanning. The gray dashed lines represent the regions with fluctuations in Mo content within the austenite).
Metals 15 00798 g005
Figure 6. (a,b) EDS line scan images of the γ/σ phase interface; (c,d) EDS line scan images of the γ2/σ phase interface.
Metals 15 00798 g006
Figure 7. (a) Segregation coefficient; (b) chemical composition of σ phase, γ phase, and γ2 phase.
Metals 15 00798 g007
Figure 8. In situ observation of the S32654Y melting process: (a) second-phase particles are distributed on the matrix; (b) the σ phase between dendrites begins to dissolve; (c) the γ2 phase gradually starts to dissolve; (d) the γ2 phase is completely dissolved; (e) the austenitic matrix dissolves rapidly; (f) the sample is completely melted.
Metals 15 00798 g008
Figure 9. In situ observation of SASS solidification process S32654 (a) beginning of solidification, (b) solidification 12 s, (c) solidification 25 s; S32654Y (d) beginning of solidification, (e) solidification 12 s, (f) solidification 25 s.
Metals 15 00798 g009
Figure 10. In situ observation of SASS solidification process; S32654 (a) solidification 40 s, (b) solidification 60 s, (c) solidification completion; S32654Y (d) solidification 40 s, (e) solidification 60 s, (f) solidification completion.
Metals 15 00798 g010
Figure 11. (a) Solid fraction–time fitting curve; (b) solid fraction–temperature fitting curve; (c) solidification speed–time curve. (I—Initial solidification stage; II—Steady-state solidification stage; III—Final solidification stage.)
Metals 15 00798 g011
Figure 12. Solid-state phase transition process: (a,b) S32654; (cf) S32654Y.
Metals 15 00798 g012
Figure 13. (a) SEM morphology of S32654; (be) SEM morphology of S32654Y; (f) OM morphology of S32654Y.
Metals 15 00798 g013
Figure 14. EDS surface scanning results of S32654Y sample: (a,b) eutectoid structure; (c,d) inside of eutectoid structure.
Metals 15 00798 g014
Figure 15. The TTT curve for σ phase precipitation (calculated using Thermo-Calc software).
Metals 15 00798 g015
Figure 16. (ac) SEM morphologies and EDS point analysis results of rare earth inclusions in the S32654Y sample; (d) EDS elemental mapping of the rare earth inclusions.
Metals 15 00798 g016
Figure 17. Metallographic morphology of HT-CLSM samples: (ac) S32654; (df) S32654Y.
Metals 15 00798 g017
Figure 18. EBSD analysis results of S32654 sample: (a) IQ map, (b) phase composition map, (c) phase composition map, (d) KAM map; EBSD analysis results of S32654Y sample: (e) IQ map; (f) phase composition map; (g) phase composition map; (h) KAM map.
Metals 15 00798 g018
Figure 19. Statistical distribution of misorientation angles in austenite: (a) S32654; (b) S32654Y.
Metals 15 00798 g019
Figure 20. Microhardness of the sample.
Metals 15 00798 g020
Figure 21. Schematic diagram of the effect mechanism of Y addition on the solidification microstructure and σ phase in SASS: (ae) S32654; (fj) S32654Y.
Metals 15 00798 g021
Table 1. Chemical composition wt.%.
CSiMnCrNiMoNCuFe
0.0090.056.1624.2018.826.560.3880.43Bal.
Table 2. Analysis results of the solidification process.
SamplesTn/°CTs/°CΔT/°CGrain Density/mm2
(12 s)
Grain Size/μm
(12 s)
t/s
S326541410.51363.347.2103.214.190.4
S32654Y1435.51384.151.4193.513.4102.1
Table 3. JMAK model fitting results.
nkR2
S326542.781.78 × 10−50.998
S32654Y2.387.01 × 10−50.996
Table 4. Kinetic fitting results.
ABR2
S326541.13 × 10−42.8580.986
S32654Y7.39 × 10−63.4570.983
1.96 × 10−20.7820.985
Table 5. Metallographic statistics of HT-CLSM samples.
Fraction of Eutectoid Structure/%Secondary Dendrite Spacing/μm
S3265426.1 ± 3.115.5 ± 2.6
S32654Y35.6 ± 6.011.8 ± 2.3
Table 6. The statistical table of grain boundary fractions and σ phase content in the samples.
LAGB/%HAGB/%CSL Σ3/%Fraction of σ Phase/%
S3265475.924.16.315.1
S32654Y70.529.550.220.4
Disclaimer/Publisher’s Note: The statements, opinions and data contained in all publications are solely those of the individual author(s) and contributor(s) and not of MDPI and/or the editor(s). MDPI and/or the editor(s) disclaim responsibility for any injury to people or property resulting from any ideas, methods, instructions or products referred to in the content.

