Article

On the Optimization of T6 Heat Treatment Parameters of a Secondary Al-Si-Cu-Mg Foundry Aluminum Alloy: A Microstructural and Mechanical Characterization

Department of Engineering (DE), University of Ferrara, Via Saragat 1, 44122 Ferrara, Italy
*
Author to whom correspondence should be addressed.
Metals 2025, 15(7), 742; https://doi.org/10.3390/met15070742
Submission received: 30 May 2025 / Revised: 17 June 2025 / Accepted: 29 June 2025 / Published: 30 June 2025

Abstract

Foundry aluminum-silicon (Al-Si) alloys, especially those containing Cu and/or Mg, are widely used in casting processes for fabricating lightweight parts. This study focuses on the optimization of the solution heat treatment parameters within the T6 heat treatment of an innovative AlSi7Cu0.5Mg0.3 secondary alloy, aiming at achieving energy savings and reducing the environmental impact related to the production of foundry components for the automotive industry. Different combinations of solution times and temperatures lower than those typically adopted in industrial practice were evaluated, and their effects on tensile properties were investigated on samples machined from as-cast and T6-treated castings produced by pouring the alloy into a steel permanent mold. Thermal analysis (TA) and differential thermal analysis (DTA) were performed to monitor the solidification sequence of microstructural phases as well as their dissolution on heating according to the proposed solution heat treatments. Microstructural analysis by light microscopy (LM) and scanning electron microscopy (SEM), together with Brinell hardness testing, was also carried out to assess the effects of heat treatment parameters. The results suggested that a shorter solution heat treatment set at a temperature lower than that currently adopted for the heat treatment of the studied alloy can still ensure the required mechanical properties while improving productivity and reducing energy consumption.

1. Introduction

Aluminum-silicon (Al-Si) foundry alloys are commonly used to produce a large variety of components for the automotive industry due to their excellent castability, high strength/weight ratio, and corrosion resistance. Among them, the AlSi7Cu0.5Mg0.3 alloy is often used to produce a wide selection of automotive cast parts such as engine blocks and structural parts of vehicles. Achieving the desired mechanical properties in these castings requires careful control of the solidification process and appropriate post-processing, particularly heat treatment. In hypoeutectic Al-Si-Cu-Mg alloys, solidification begins with the development of primary α-Al dendrites and the formation of a dendritic network, followed by the main eutectic reaction (α-Al + β-Si) and the formation of secondary intermetallic phases. These secondary phases play a crucial role in determining both the as-cast microstructure and the subsequent microstructural and mechanical properties reached after heat treatment. Several studies [1,2,3,4,5,6] described the formation of Cu- and Mg-rich phases such as θ-Al2Cu, Q-Al5Mg8Cu2Si6, and β-Mg2Si in Al-Si alloys containing a controlled amount of Cu and/or Mg. The addition of Mg can promote the transformation of the blocky θ-Al2Cu phase into the Q-Al5Mg8Cu2Si6 phase at the end of primary solidification [4]. The β-Mg2Si phase appears in different morphologies depending on Mg content, and its structure can be further influenced by Sr addition, which leads to skeletal growth and may reduce the overall amount of the phase [5,6].
In Al-Si-Mg alloys, the π-Al8FeMg3Si6 phase shows a Chinese script or blocky morphology and is often formed on the β-Al5FeSi platelet-like phase [7,8]. It is well known that Fe is the most deleterious contaminating element in Al-Si alloys, and due to its low solubility, it tends to form β-Al5FeSi platelets during primary solidification. Indeed, the β-Al5FeSi phase is assumed to act as a stress raiser, generating points of weak coherence with a negative impact on mechanical properties [1,9,10]. Typically, the Fe content is very low in primary Al alloys, but the growing emphasis on environmental sustainability and energy efficiency has led to a widespread use of recycled Al alloys in the automotive industry. The recycling of Al consumes only about 5 % of electricity and produces amounts of CO2 lower than those generated during the production of primary Al. Nevertheless, the most important drawback of Al recycling is the increased level of Fe (>0.2 wt. %) in its alloys, which can negatively affect the mechanical properties. Hence, to counteract the formation of the brittle β-Al5FeSi phase in alloys with high Fe content, chemical modifiers such as Co, Cr, Mn, Mo, and Ni are conventionally added. Among them, Mn is the most widely used because it promotes the formation of the α-Al15(Fe, Mn, Cu)3Si2 phase with a Chinese script morphology instead of the platelet-like β-Al5FeSi phase [10,11,12]. When the Fe content is rather high, it is suggested to guarantee a Mn/Fe ratio equal to 0.5.
In terms of post-processing of cast products, hypoeutectic Al-Si-Cu-Mg alloys are usually heat-treated to enhance their mechanical resistance. Especially, the T6 heat treatment, which includes solution heat treatment (SHT) and quenching followed by artificial aging (AA), is the most applied to sand and gravity die-cast Al-Si alloys. The purpose of the SHT is to dissolve in the matrix most of the Cu- and/or Mg-containing phases formed during primary solidification, homogenize the alloying elements, and spheroidize eutectic Si particles [7]. The subsequent age hardening, usually carried out at 150–210 °C, causes the precipitation from the supersaturated solid solution obtained after quenching of finely dispersed reinforcing phases, resulting in increased mechanical strength due to the ability of these precipitates to stop mobile dislocations [7]. Hence, fundamental is the appropriate dissolution of Cu- and/or Mg-rich phases during SHT to guarantee the full aging potential of the alloy. The coarse secondary phases formed during primary solidification of Al-Si alloys dissolve and transform during SHT, depending on their composition and the set temperatures.
Some authors focused their attention on the study of SHT parameters, as well as holding time and temperature variation, considering the effects on the microstructural features that are directly correlated with the mechanical performance of the alloy. Researchers investigated the thermal stability and the transformation behavior of secondary intermetallic phases. The β-Mg2Si phase can be fully dissolved through SHT performed at 540 °C on the A356 and A357 alloys, but becomes more stable with increasing Mg content [13]. When Mg content is low (0.3–0.4 wt. %), the SHT carried out at 540 °C may convert the π-Al8FeMg3Si6 phase into the β-Al5FeSi one, whereas if the Mg concentration is high (0.6–0.7 wt. %) there will be no transformations, and the process may even be reversed [10,14,15,16]. Moreover, θ-Al2Cu and Q-Al5Mg8Cu2Si6 dissolve at different rates, with the eutectic α-Al + θ-Al2Cu intermetallic dissolving more easily than the blocky θ-Al2Cu phase [2,17], and the Q-phase requiring longer SHT in high-Cu alloys [18]. Fe-rich intermetallics are particularly resistant to dissolution during SHT; α-Al15(Fe, Mn, Cu)3Si2 remains virtually unaffected, while β-Al5FeSi may undergo gradual fragmentation and partial dissolution only after long exposure at high temperature [19].
The dissolution rate of the secondary intermetallic phases during solution heat treatment increases with increasing heat treatment temperature; a high temperature also improves the homogenization of the alloying elements and the spheroidization of eutectic Si particles [7]. The strength that can be obtained after AA increases as the temperature increases, because of a higher maximum solubility of solute obtainable in the metal matrix. The maximum temperature at which the solution heat treatment can be performed on Al-Si-Cu-Mg alloys strictly depends on Cu and Mg concentrations and it is limited by the risk of incipient melting of the intermetallic phases formed during the last stage of primary solidification, such as the θ-Al2Cu and Q-Al5Mg8Cu2Si6 ones [7], which can compromise mechanical integrity. The solution temperatures that can be used without localized incipient melting depend on both the casting solidification rate and the heating rate of SHT. The former affects the fraction, size, morphology, and type of Cu-rich phases, while the latter affects the time available for the dissolution of Cu-rich intermetallics.
In the present study, the effects of reduced time and temperature for the SHT of a secondary AlSi7Cu0.5Mg0.3 foundry Al alloy are investigated. The alloy was poured into steel molds by gravity casting and the cast parts were subjected to different T6 heat treatments according to innovative SHT parameters. The current T6 heat treatment parameters, i.e., SHT at 535 °C for 5 h, quenching in water at 70 °C, and AA at 165 °C for 4 h, were assumed as a reference. The novelty of the present work is the optimization of SHT parameters of a secondary Al-Si-Cu-Mg alloy to improve the efficacy of the T6 heat treatment by reducing heating times and temperatures. In turn, this allows energy savings, low gas consumption in furnaces, and reduction in environmental emissions. The effectiveness of the proposed heat treatment parameters was evaluated in terms of their capability to guarantee the necessary dissolution of the secondary intermetallic phases directly involved in precipitation hardening during AA.

2. Materials and Methods
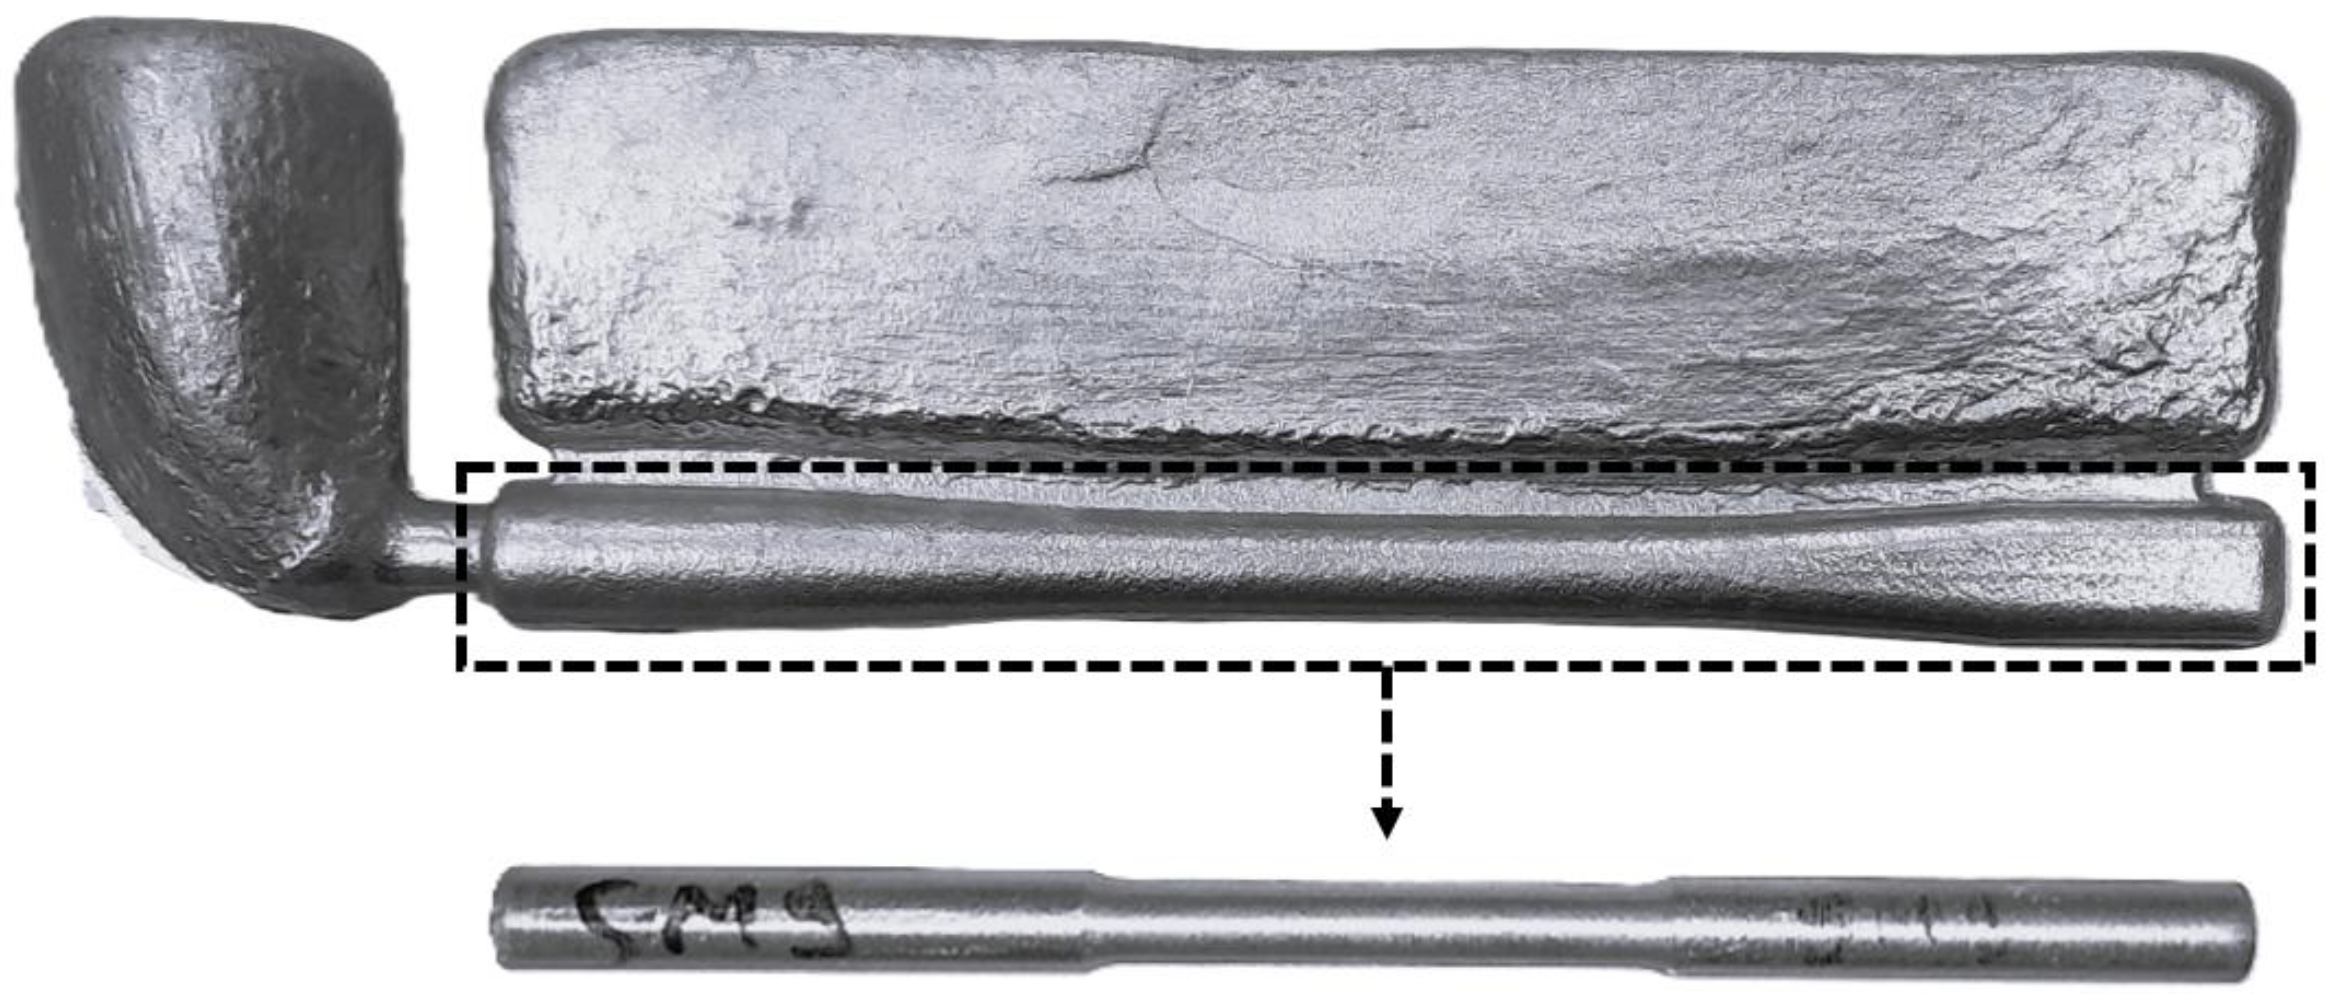
2.1. Materials

An experimental AlSi7Cu0.5Mg0.3 alloy was produced by the addition of Si and a secondary AlSi9Cu3(Fe) alloy to 99.7 % pure Al. The alloy was Sr modified using bars of AlSr10 master alloy, grain-refined by an AlTi5B1 master alloy, and degassed for 10 min by argon inert gas. The chemical composition measured by the ARL iSpark 8820 (Thermo Fisher Scientific Inc., Waltham, MA, USA) optical emission spectrometer (OES) is reported in Table 1.
The molten alloy was poured into a steel mold specifically designed for manufacturing castings with the shape as shown in Figure 1. After reaching thermal stability by pouring several disposable castings, a total of 25 castings were made for the purposes of the present investigation. Tensile samples were subsequently drawn from the lower portion of the castings (enclosed in the black-dotted box in Figure 1) and machined to obtain proportional test specimens having a circular cross-section of 9 mm in diameter. The gauge length was set to five times the diameter and equal to 45 mm, in agreement with the UNI EN ISO 6892-1:2019 and ASTM E8M standards [20,21]. Five tensile specimens were maintained in the as-cast condition (AC), while the others were subject to tailored heat treatments, carried out according to the parameters described in the following.

2.2. Thermal Analysis

Thermal analyses were carried out by pouring the molten material into a steel cup internally coated with refractory paint and preheated at 300 °C. The temperature was measured with a K-type thermocouple, protected by a sheath in stainless steel and located at the center of the cup in agreement with the Newtonian method [22,23,24]. The temperatures were recorded from 700 °C to 400 °C at a frequency of 4 Hz using an OMEGA TC 08 (Omega, Norwalk, CT, USA) Channel USB Thermocouple Data Acquisition Module and the Picolog 6 (Pico Technology, Cambridgeshire, UK) software. The acquired data were then processed to obtain the cooling curve and its derivatives by using a purpose-built R2024b MATLAB code. According to Djurdjevic et al. [22,25], the cooling rate was evaluated just prior to the nucleation point of the α-Al primary phase, while the solidification rate was calculated as the ratio between liquidus and solidus temperature and the total solidification time.

2.3. Heat Treatments

A SHT at 535 °C for 5 h followed by water quenching at 70 °C and AA at 165 °C for 4 h was considered as the reference heat treatment (namely ST1), since in foundry practice the above-mentioned parameters are widely adopted to produce automotive components made of AlSi7Cu0.5Mg0.3 alloy.
The new T6 heat treatments (namely ST2, ST3, and ST4) were customized by carrying out solution heat treatments at different combinations of time and temperature by using a Remet E-79N (Remet, Casalecchio di Reno, Bologna, Italy) muffle furnace, followed by water quenching at 70 °C. The AA was fixed and performed at 165 °C for 4 h in a Binder ED115 (Binder, Tuttlingen, Germany) furnace. The investigated heat treatment conditions are collected in Table 2, together with the corresponding designation. Three tensile specimens were heat treated for each condition.

2.4. Tensile and Hardness Testing

The tensile tests were performed according to the ISO 6892-1 standard [20] by a Galdabini Quasar 50 (Galdabini, Cardano al Campo, Varese, Italy) electromechanical testing machine with a 50 kN loading cell. The tensile properties, including the yield strength (YS), the ultimate tensile strength (UTS), and the elongation at fracture (A5%), were directly determined from the software implemented in the testing machine.
Brinell hardness tests were performed on the as-cast and T6 heat-treated samples according to the UNI EN ISO 6506-1:2015 standard [26] by a Qness 60 CHD MASTER+ (QATM, Golling, Austria) equipment, with a load of 612.9 N and a 2.5 mm diameter spherical indenter. At least five measurements were performed on the cross-section of the tensile specimens.

2.5. TG-DTA Simultaneous Thermal Analysis

Simultaneous thermogravimetric (TG) and differential thermal analysis (DTA) were performed by a Netzsch STA 409 (Netzsch-Gerätebau, Selb, Germany) simultaneous thermal analyzer. For the TG-DTA simultaneous thermal analysis, samples with a controlled mass, as collected in Table 3, were drawn from the tensile specimens in AC, ST2, ST3, and ST4 conditions. The samples were then heated from room temperature up to 700 °C with a heating rate of 10 °C/min in an oxidizing atmosphere. For each condition, the melting temperature of the intermetallic phases, as well as those of the α-Al phase and eutectic structure were detected through the analysis of the endothermic peaks generated by the DTA signal during heating. As suggested by Boettinger et al. [27], the onset temperature T o n s e t of each peak was established, even though the liquidus temperature was evaluated at the maximum amplitude of the peak corresponding to the melting of the primary α-Al phase. On the other hand, thermogravimetric analysis made it possible to assess any potential mass loss or gain of the sample during the heating process. Experimental data obtained from the analysis were processed using a purpose-built MATLAB code.

2.6. Microstructural Analysis

The fracture surfaces of tensile specimens were investigated by a Zeiss EVO MA 15 (Carl Zeiss Microscopy, Jena, Germany) scanning electron microscope (SEM), equipped with a lanthanum hexaboride (LaB6) emitter, with an accelerating voltage ranging from 15 to 20 kV. The microscope was also coupled to an Oxford X-Max 50 (Oxford Instruments, Abingdon-on-Thames, UK) energy dispersive microprobe for semi-quantitative analyses (EDS). The SEM micrographs were recorded in both secondary electrons (SE) imaging and backscattered electrons (BSE) imaging. The secondary electrons are the result of the inelastic collision of the primary beam’s electrons with the electrons of the material, and are used for the topographic imaging. Conversely, the backscattered electrons are generated by the primary beam’s electrons involved in elastic interactions; thus, they are sensitive to the atomic number of the material’s atoms and they give information on the material’s composition.
Metallographic samples were cut out perpendicularly to the fracture surfaces of tensile specimens, embedded in a conductive resin, and prepared according to standard grinding and polishing procedures. The HF 0.5 vol. % etching reagent was used for enhancing contrast imaging of Si particles and intermetallic phases. Qualitative and quantitative metallography was performed in bright field observation mode on a Leica DMi8A (Leica Microsystems, Wetzlar, Germany) light microscope (LM) coupled to the LAS v4.13 software. Secondary dendrite arm spacing (SDAS) measurements were performed on micrographs acquired at 100× magnification, by identifying and measuring small groups of well-defined secondary dendrite arms. As suggested by Wang [28], for each sample the SDAS was assumed to be the mean value of a number of secondary dendrite arm spacing measurements in the range of 500–1000. Moreover, the eutectic Si particles in the microstructure were quantified in terms of their aspect ratio (AR) and equivalent diameter (Deq), and a total of 5000 to 10,000 particles were measured for each specimen [28]. The aspect ratio and equivalent diameter of eutectic Si particles were, respectively, calculated according to the following equations:
AR = (Major Axis)/(Minor Axis),
Deq = √(4A/π),
where Major Axis and Minor Axis refer to the ellipse that best fits the eutectic Si particle, and A is the area of the eutectic Si particle. The 30-day free trial software version of Minitab was used to calculate the probability density functions (PDFs) of both AR and Deq of each Si particle.
At last, the microstructural characterization was also carried out by the same scanning electron microscope to determine the semi-quantitative chemical composition of the intermetallic phases. In this regard, the EDS mapping of elemental distribution was specifically performed to address the effects of the different SHT conditions on the dissolution degree of these phases.

3. Results

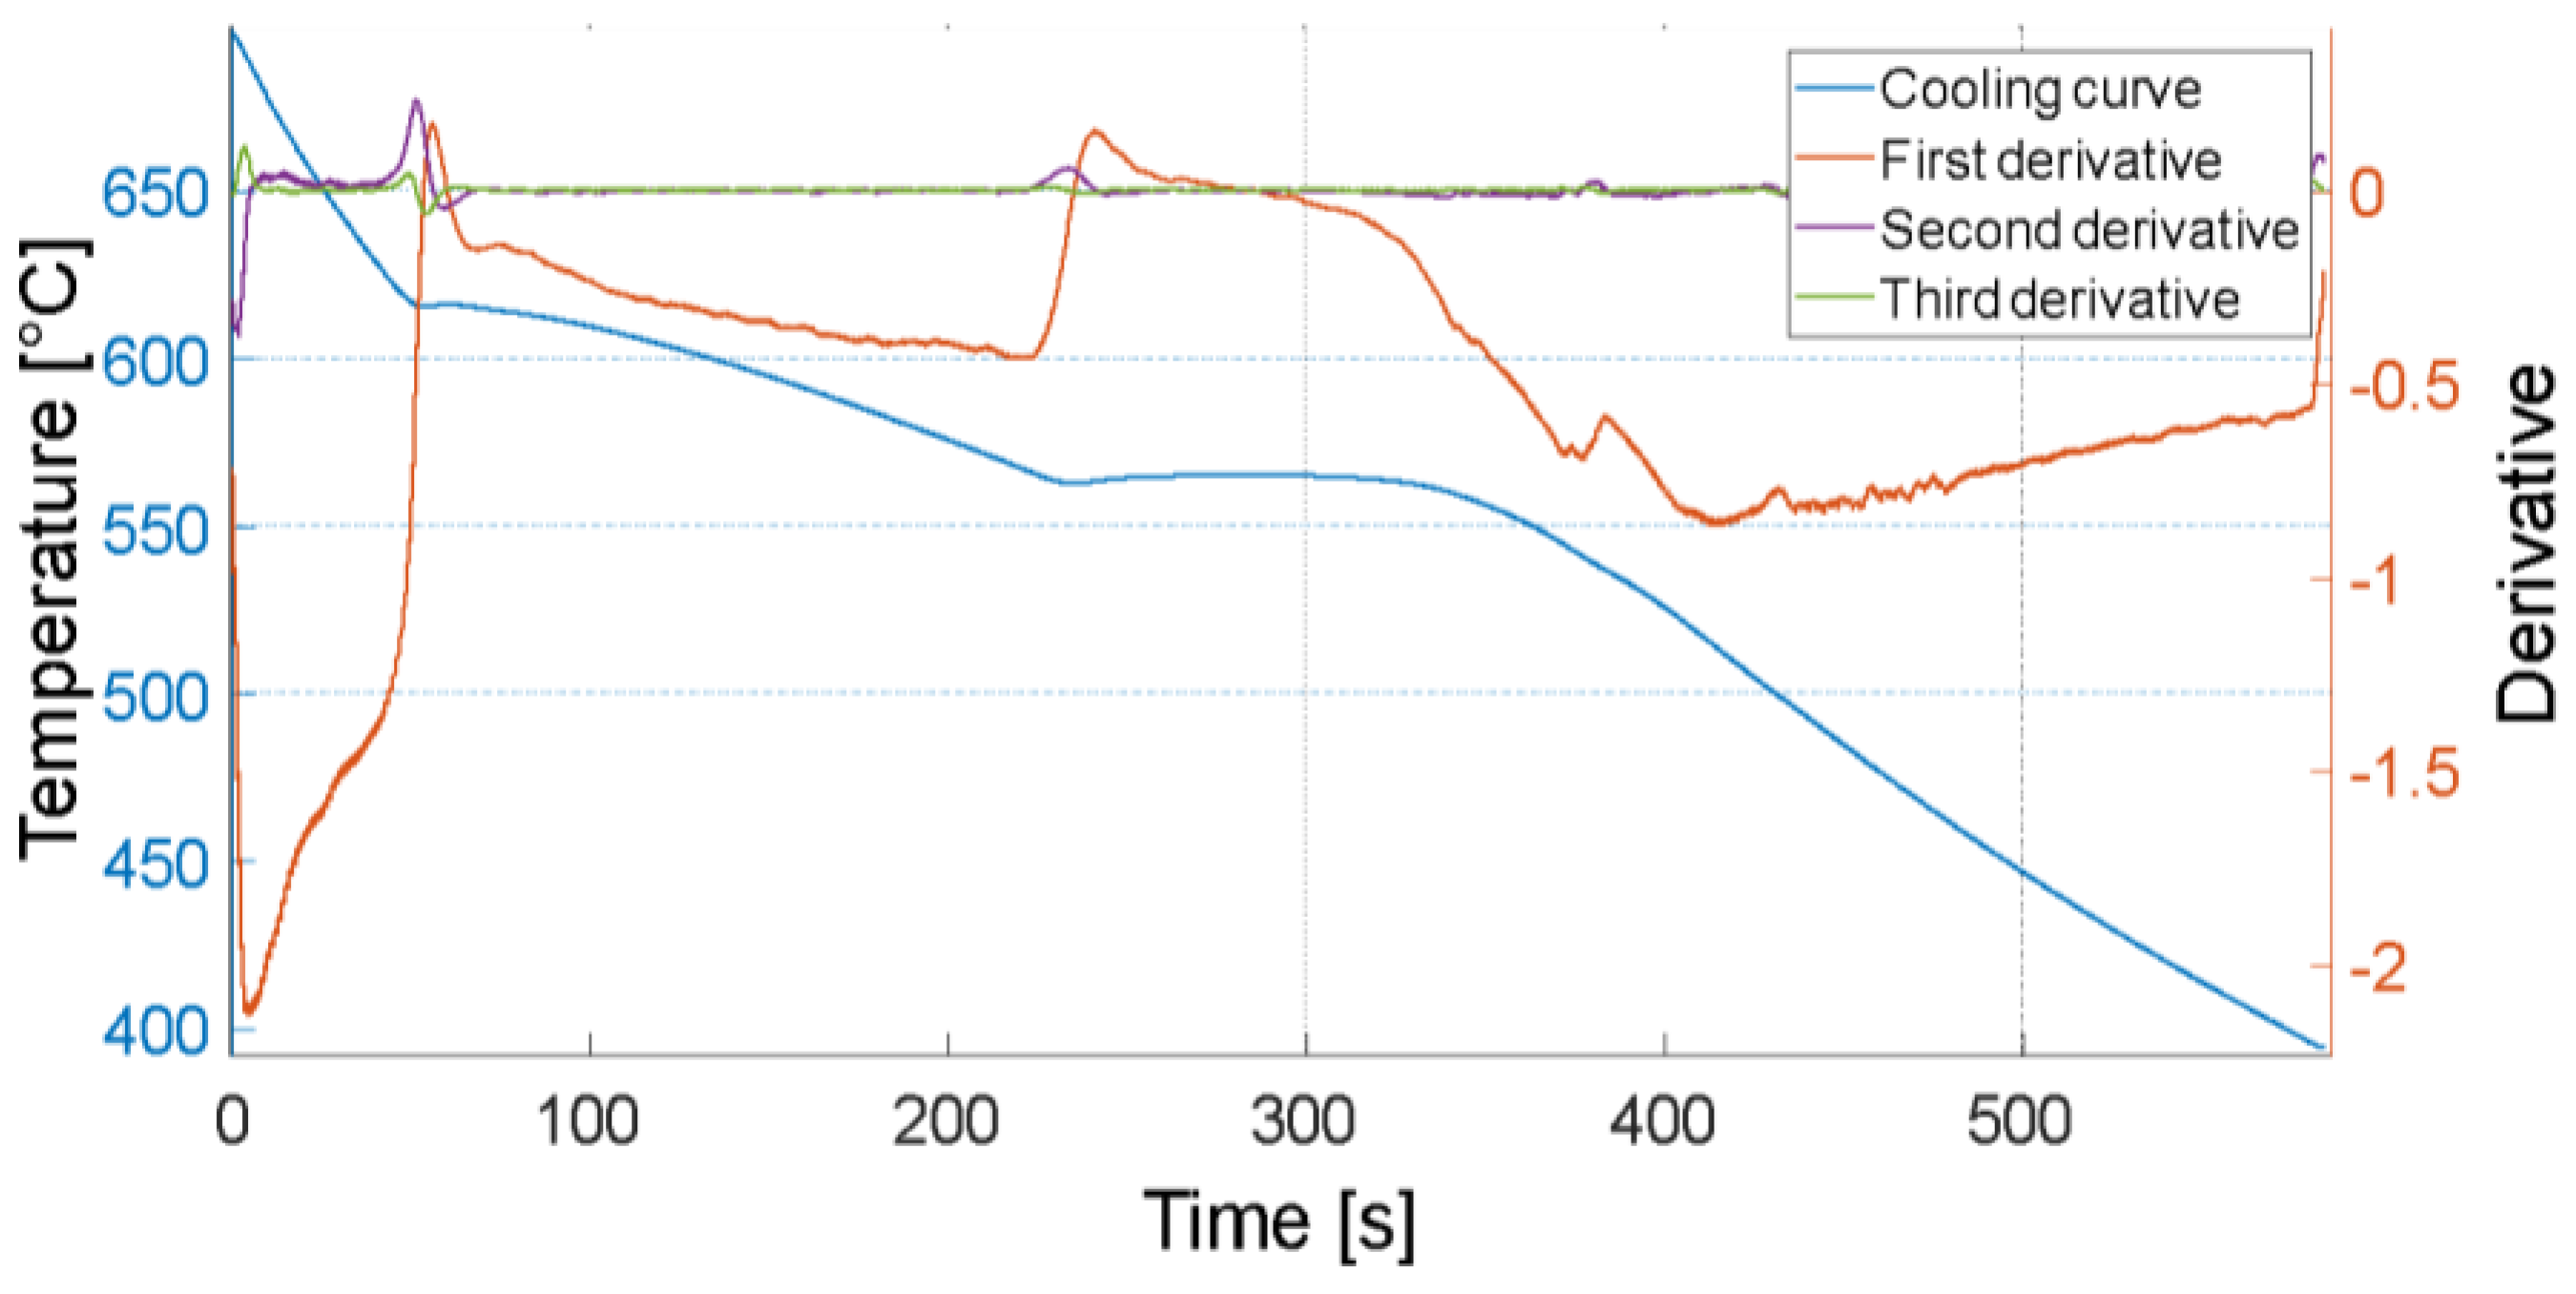
3.1. Thermal Analysis

Figure 2 shows the representative solidification curve (in blue) of the AlSi7Cu0.5Mg0.3 alloy acquired during Newtonian thermal analyses.
The first (in red), the second (in purple), and the third (in green) derivatives of the solidification curve are also reported. The calculated cooling and solidification rates were 2 °C/s and 0.3 °C/s, respectively. According to Djurdjevic [11], the intersection points between zero axes and second or third derivatives of the solidification curve were used to detect the nucleation temperatures of the primary α-Al phase, α-Al + β-Si eutectic structure, and intermetallic phases. These intersection points were located near the most prominent peaks of the first derivative curve. The observations of Backerud et al. [1] and those of Shabestari and Ghodrat [29] concerning the typical solidification sequences of Al-Si-Cu-Mg alloys were used to associate the determined nucleation temperatures within the solidification curve to the phase transformations reported in Table 4.
The first structure to be formed during primary solidification is the α-Al phase (white arrows in Figure 3), i.e., the matrix which mainly consists of an α-Al dendritic network. The solidification of the α-Al + β-Si eutectic structure then occurs (black arrows in Figure 3), together with the precipitation of the Fe-rich β-Al5FeSi and α-Al15(Fe, Mn, Cu)3Si2 intermetallic phases. The α-Al15(Fe, Mn, Cu)3Si2 phase usually forms when the Mn/Fe ratio is higher than 0.5, and with the addition of Cr. Considering that in the studied alloy the Fe content is equal to 0.22 wt. %, and the Mn and Cr contents are 0.11 wt. % and 0.0091 wt. %, respectively, this phase may be expected. In addition, the α-Al15(Fe, Mn, Cu)3Si2 phase can partially replace the β-Al5FeSi secondary phases. Moreover, the π-Al8FeMg3Si6 and β-Mg2Si phases form just before the solidus temperature, which was determined, according to Djurdjevic [11], by analyzing the zeros of the derivatives immediately after the formation of the last post-eutectic phases involved in primary solidification, i.e., Cu- and/or Mg-rich phases such as θ-Al2Cu and Q-Al5 Mg8Cu2Si6.

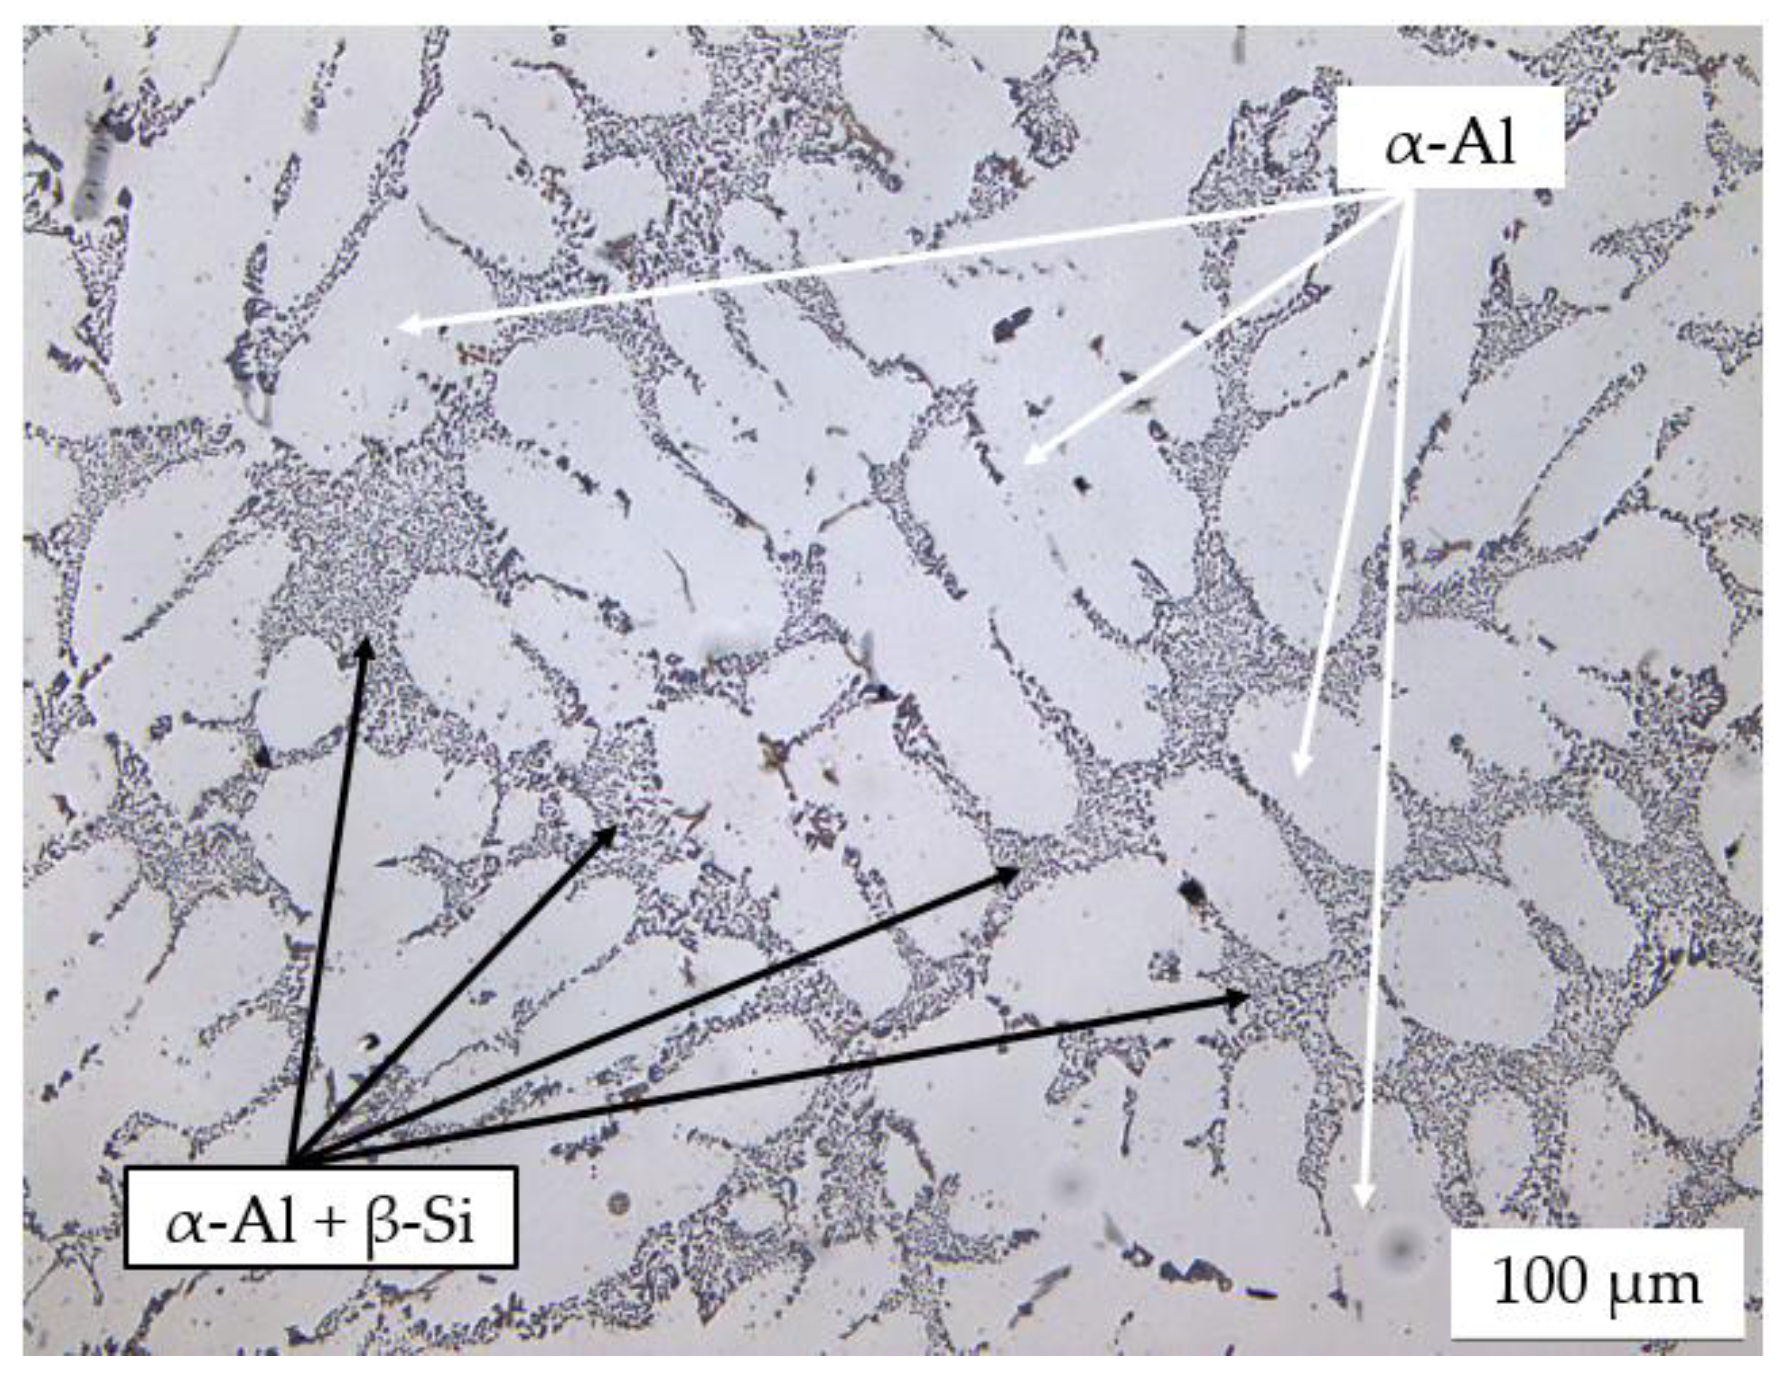
3.2. Microstructural Analysis

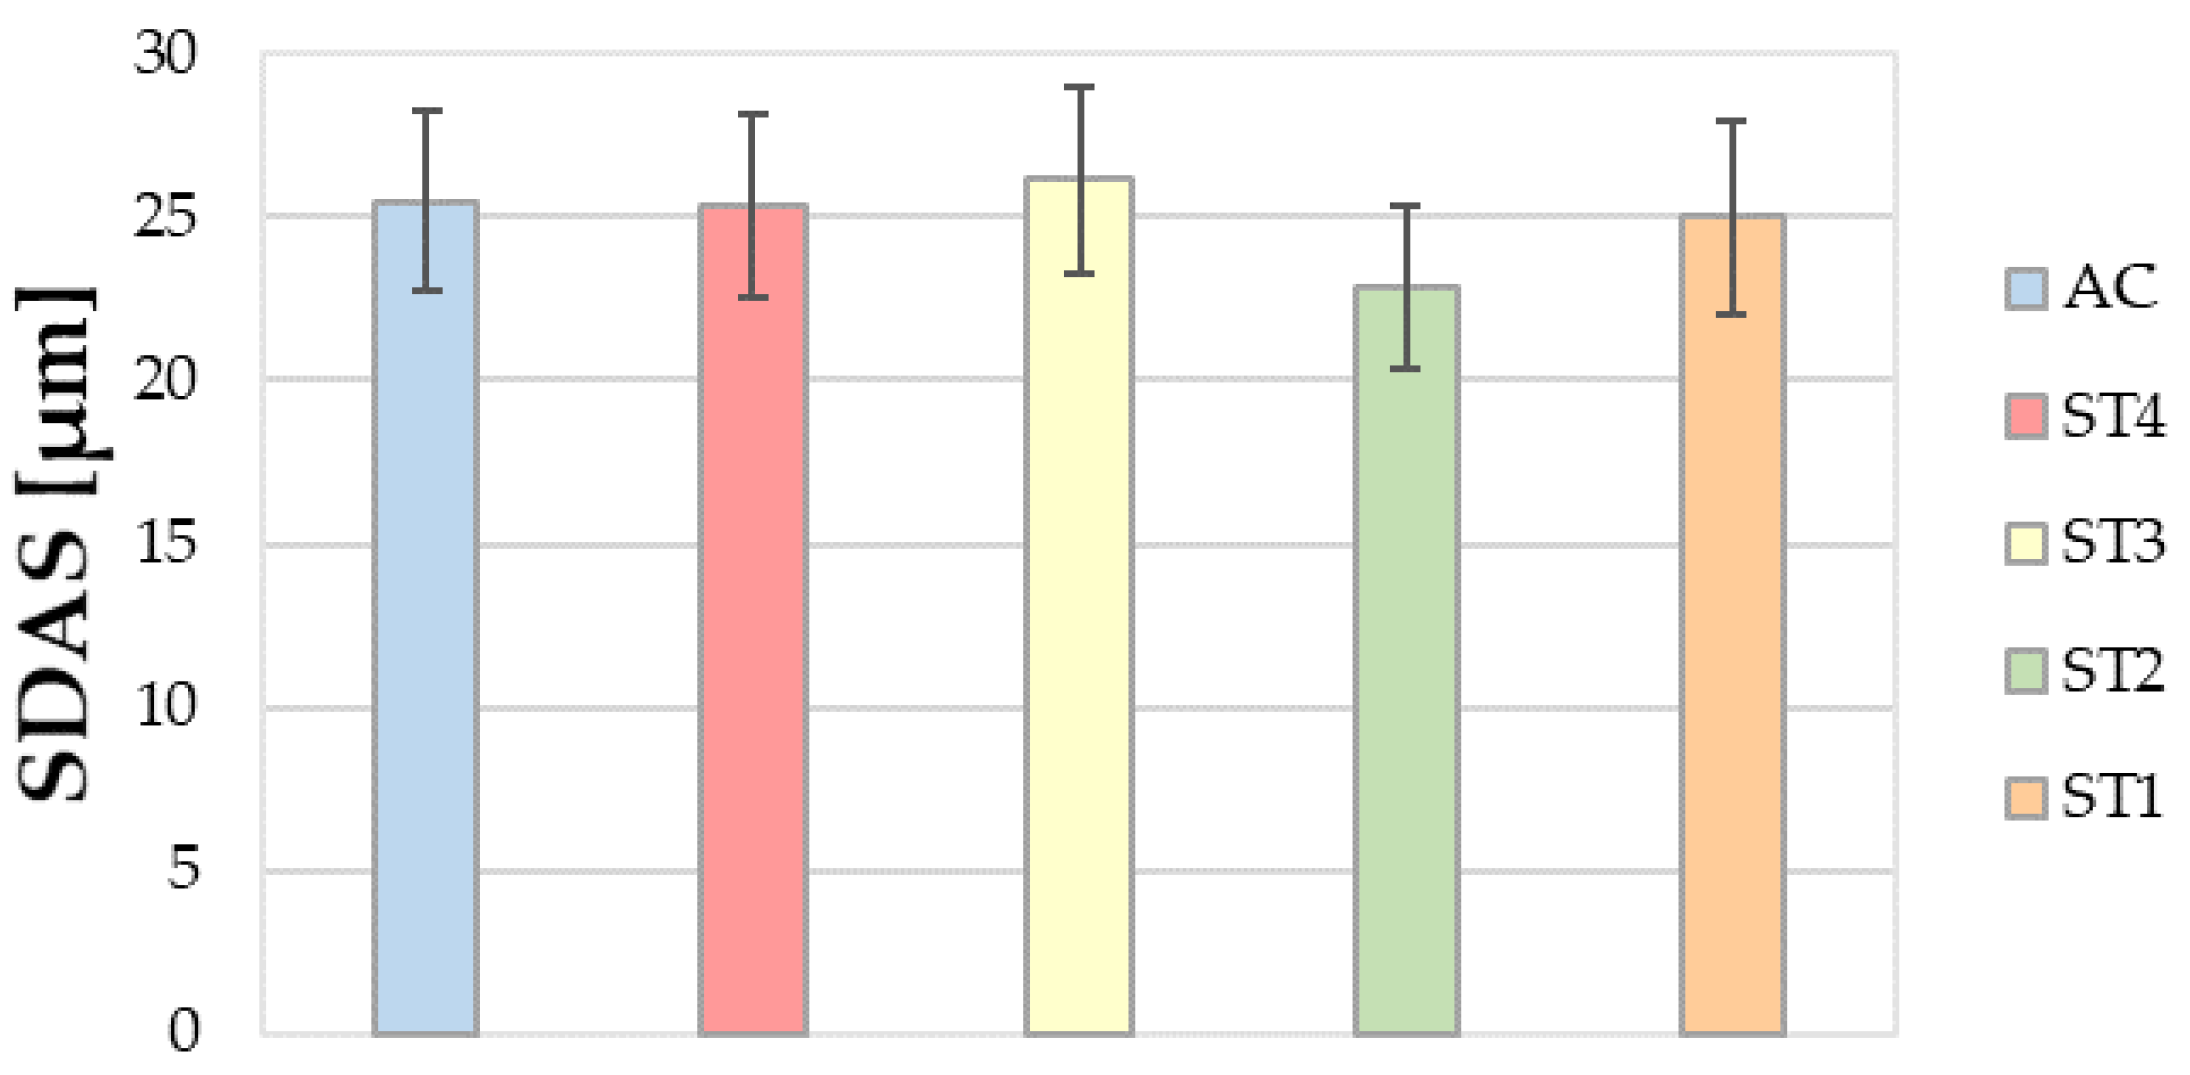
3.2.1. SDAS Measurements

Figure 4 shows the mean values of SDAS measured on tensile specimens in the as-cast and T6 heat-treated conditions. As expected, it was confirmed that the SDAS was unaffected by the heat treatments, showing mean values in the range of 23–26 μm irrespective of the adopted time and temperature parameters during SHT. Hence, the cooling rate experienced by the material during solidification was the dominant factor affecting the SDAS. The castings from which the raw tensile specimens were taken underwent the same cooling conditions during solidification and thus showed identical microstructures prior to the T6 heat treatment.

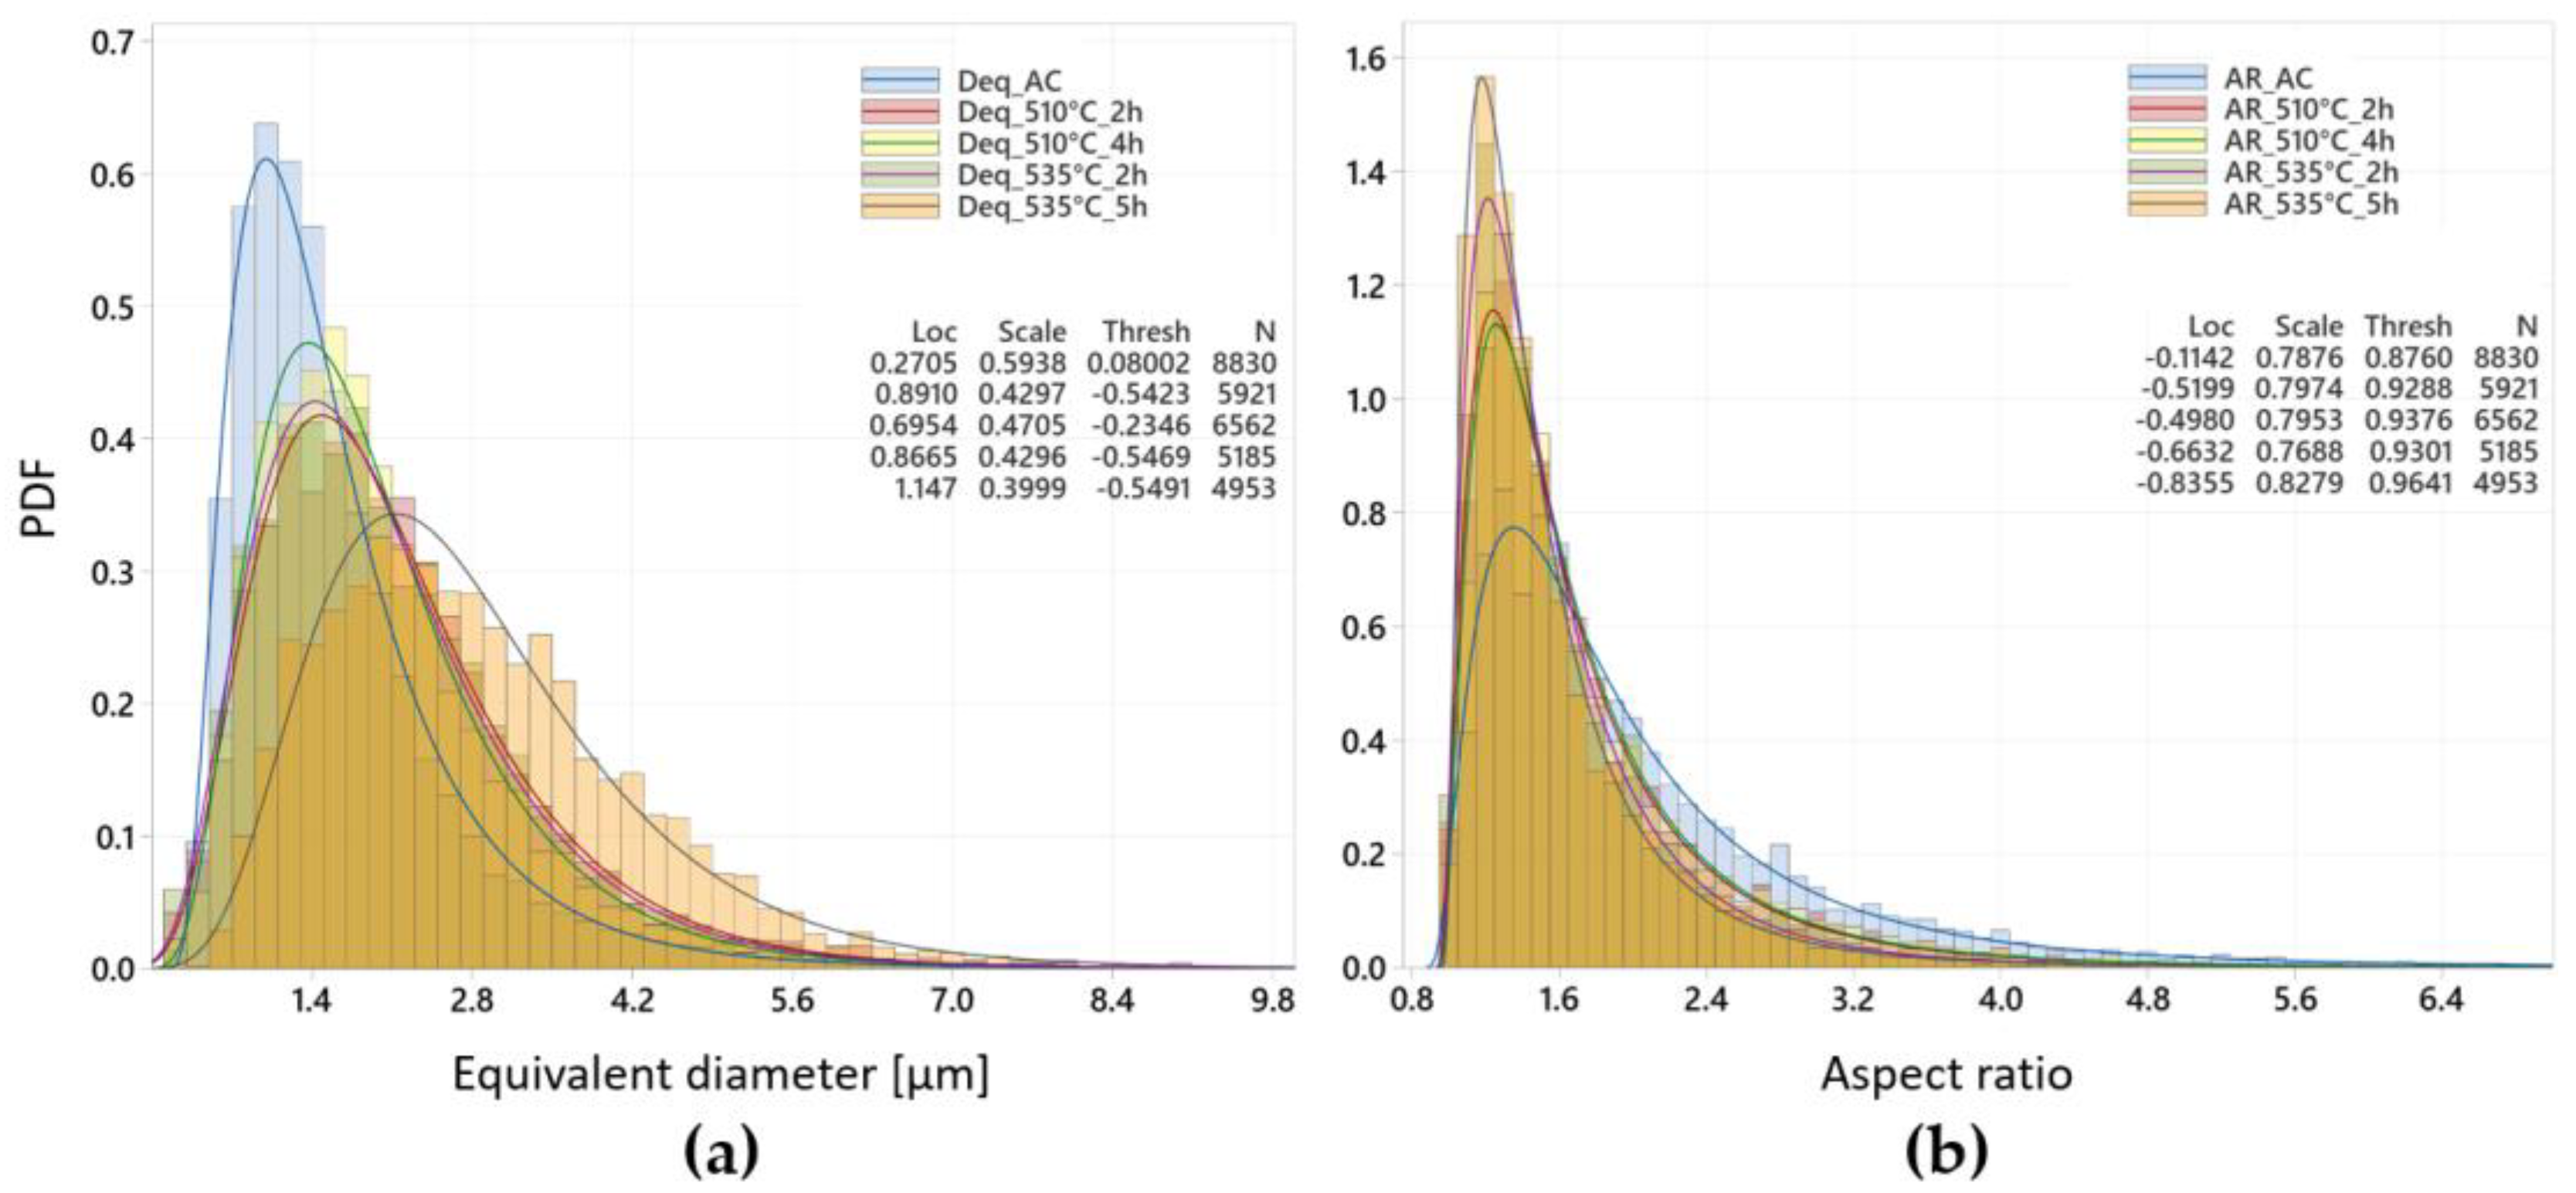
3.2.2. Quantitative Analysis of Eutectic Si Particles

Solution heat treatment is known to promote the spheroidization of eutectic Si particles with respect to the as-cast condition [30,31]. During this treatment, eutectic Si particles first fragment and spheroidize, then coarsen with the increase in holding time. Figure 5 shows the three-parameter lognormal distributions of both Deq and AR of the eutectic Si particles referring to the samples in the as-cast and T6 heat-treated conditions.
The distributions of Deq show that longer times and/or higher temperatures of SHT promote more extensive fragmentation, spheroidization, and coalescence of eutectic Si particles that progressively coarsen. The peak then moves to the right with the increase in time and/or temperature, while the distribution flattens. In addition, the peak values within the three-parameter lognormal distribution of AR increase and move to the left with increasing times and temperatures of SHT, confirming that solution heat treatment promotes more spherical eutectic Si particles. This result is in good agreement with the observations made by Choi et al. [31].

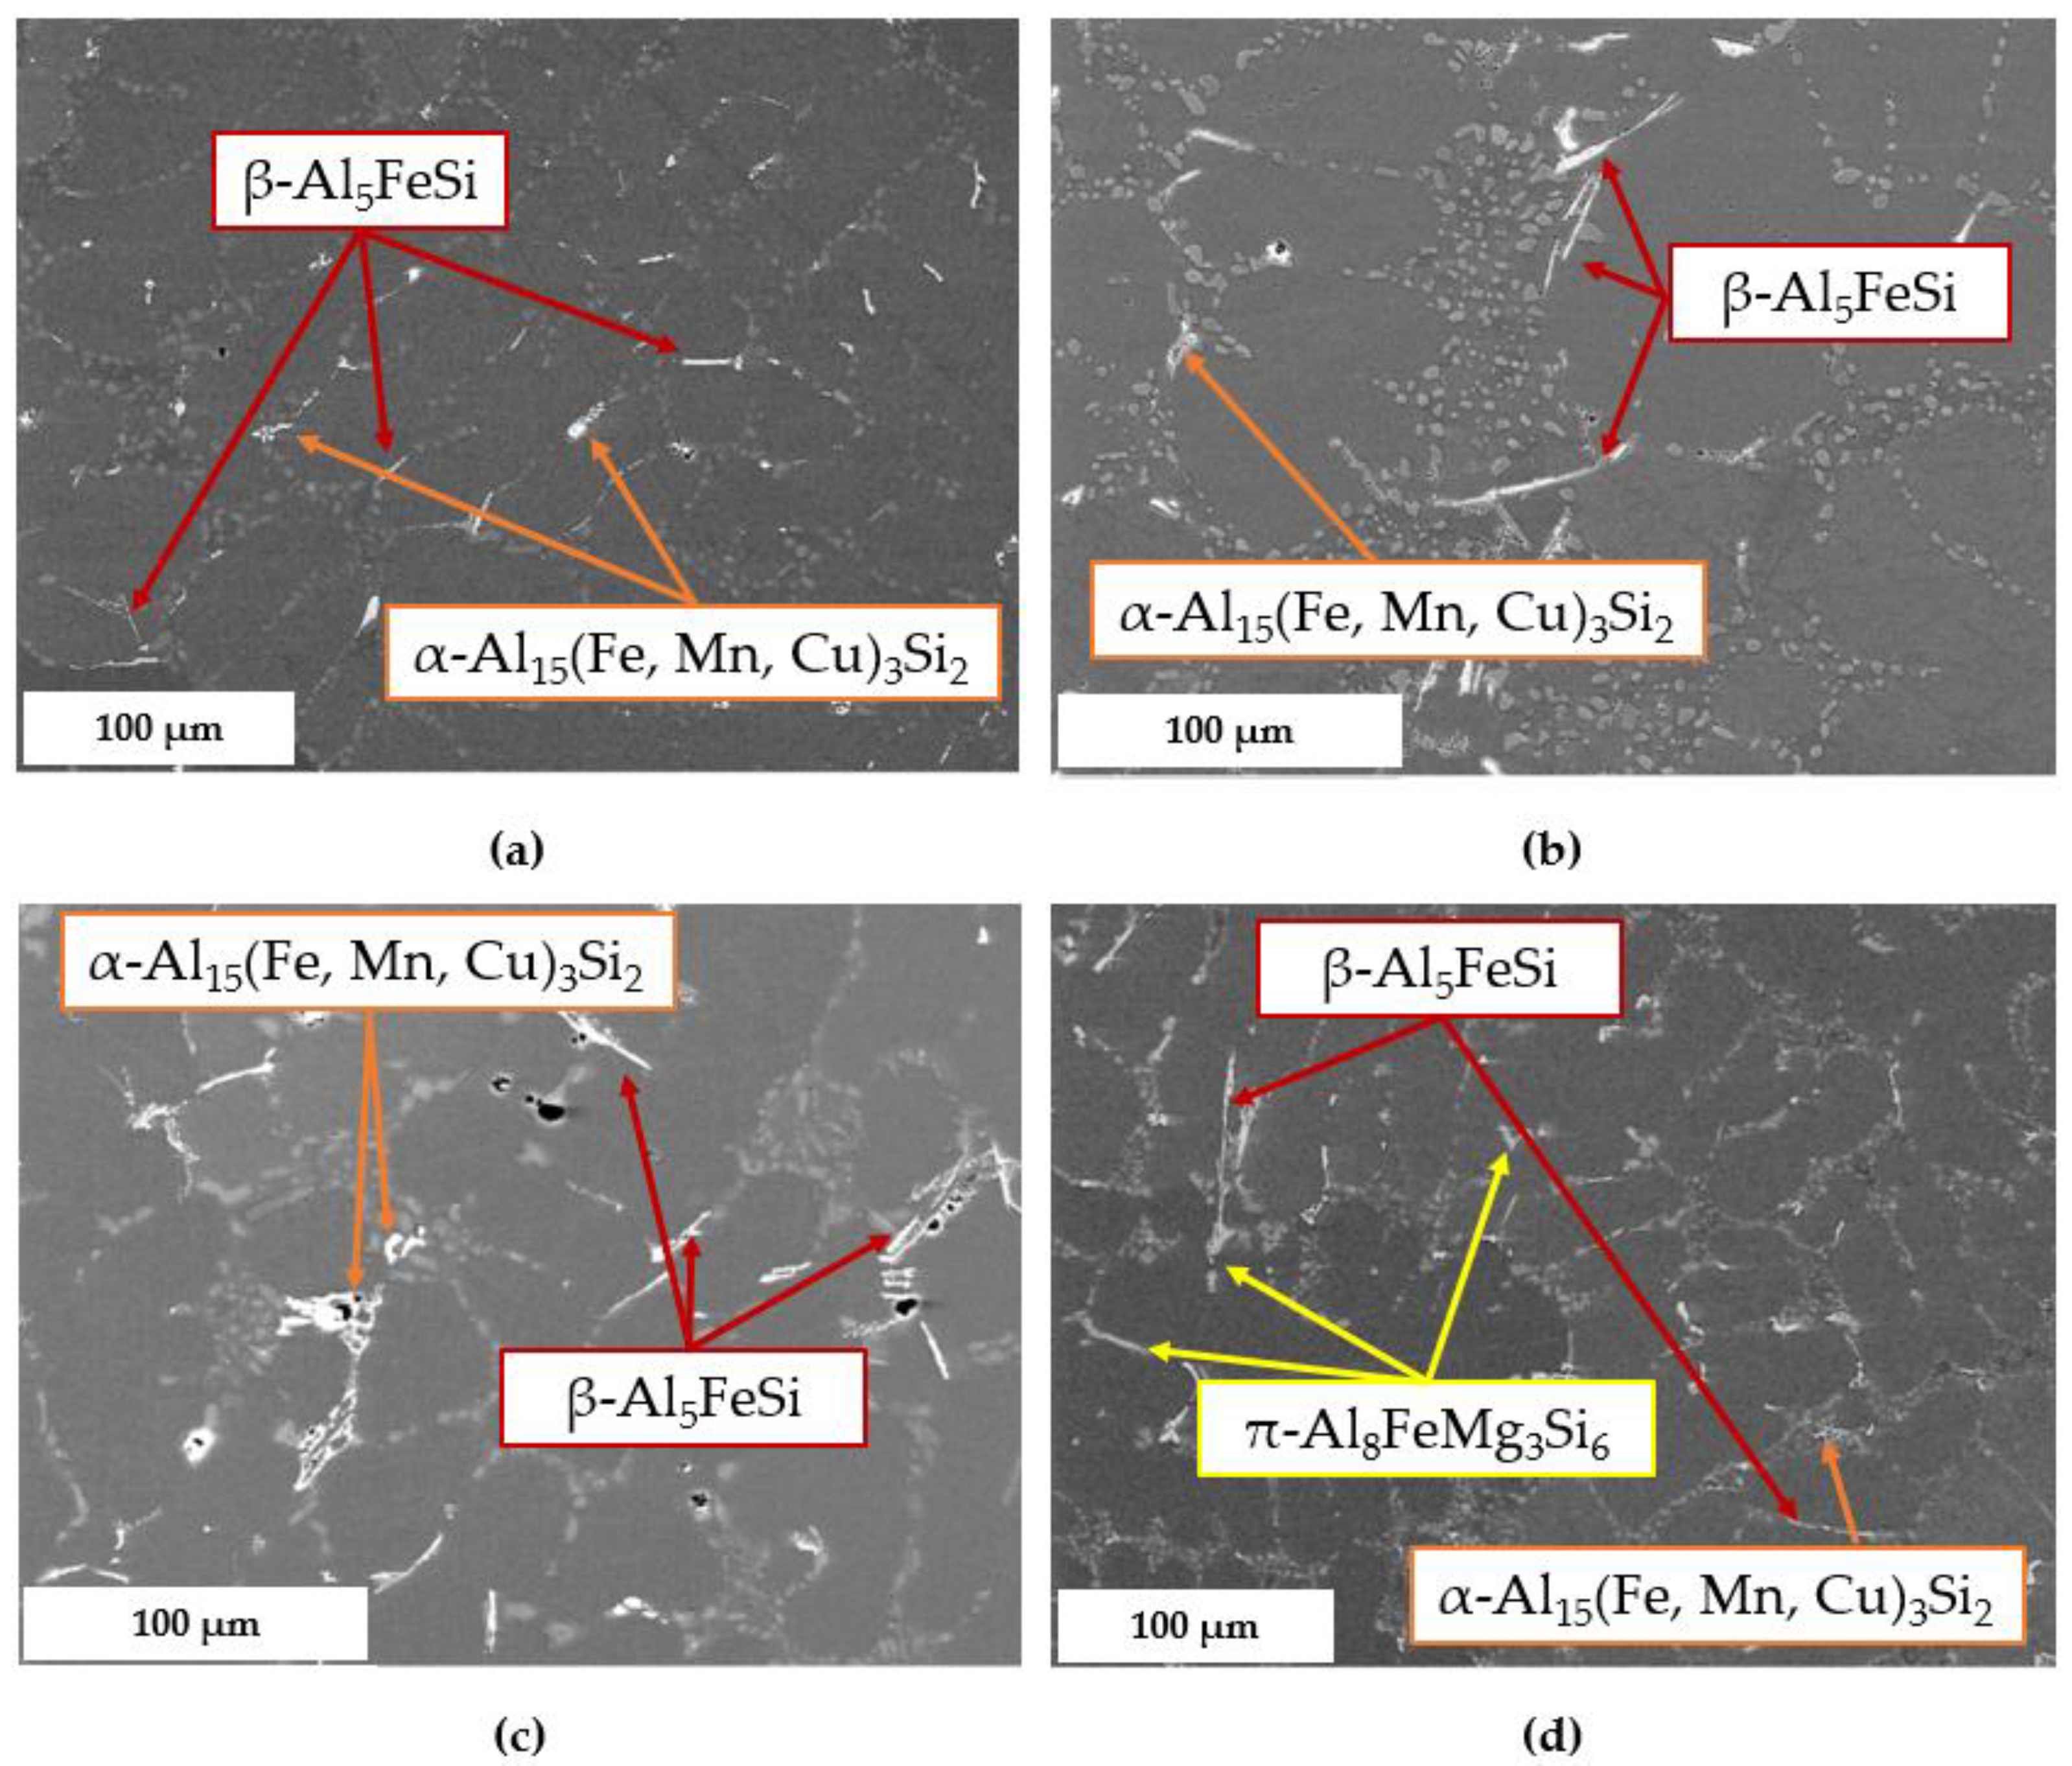
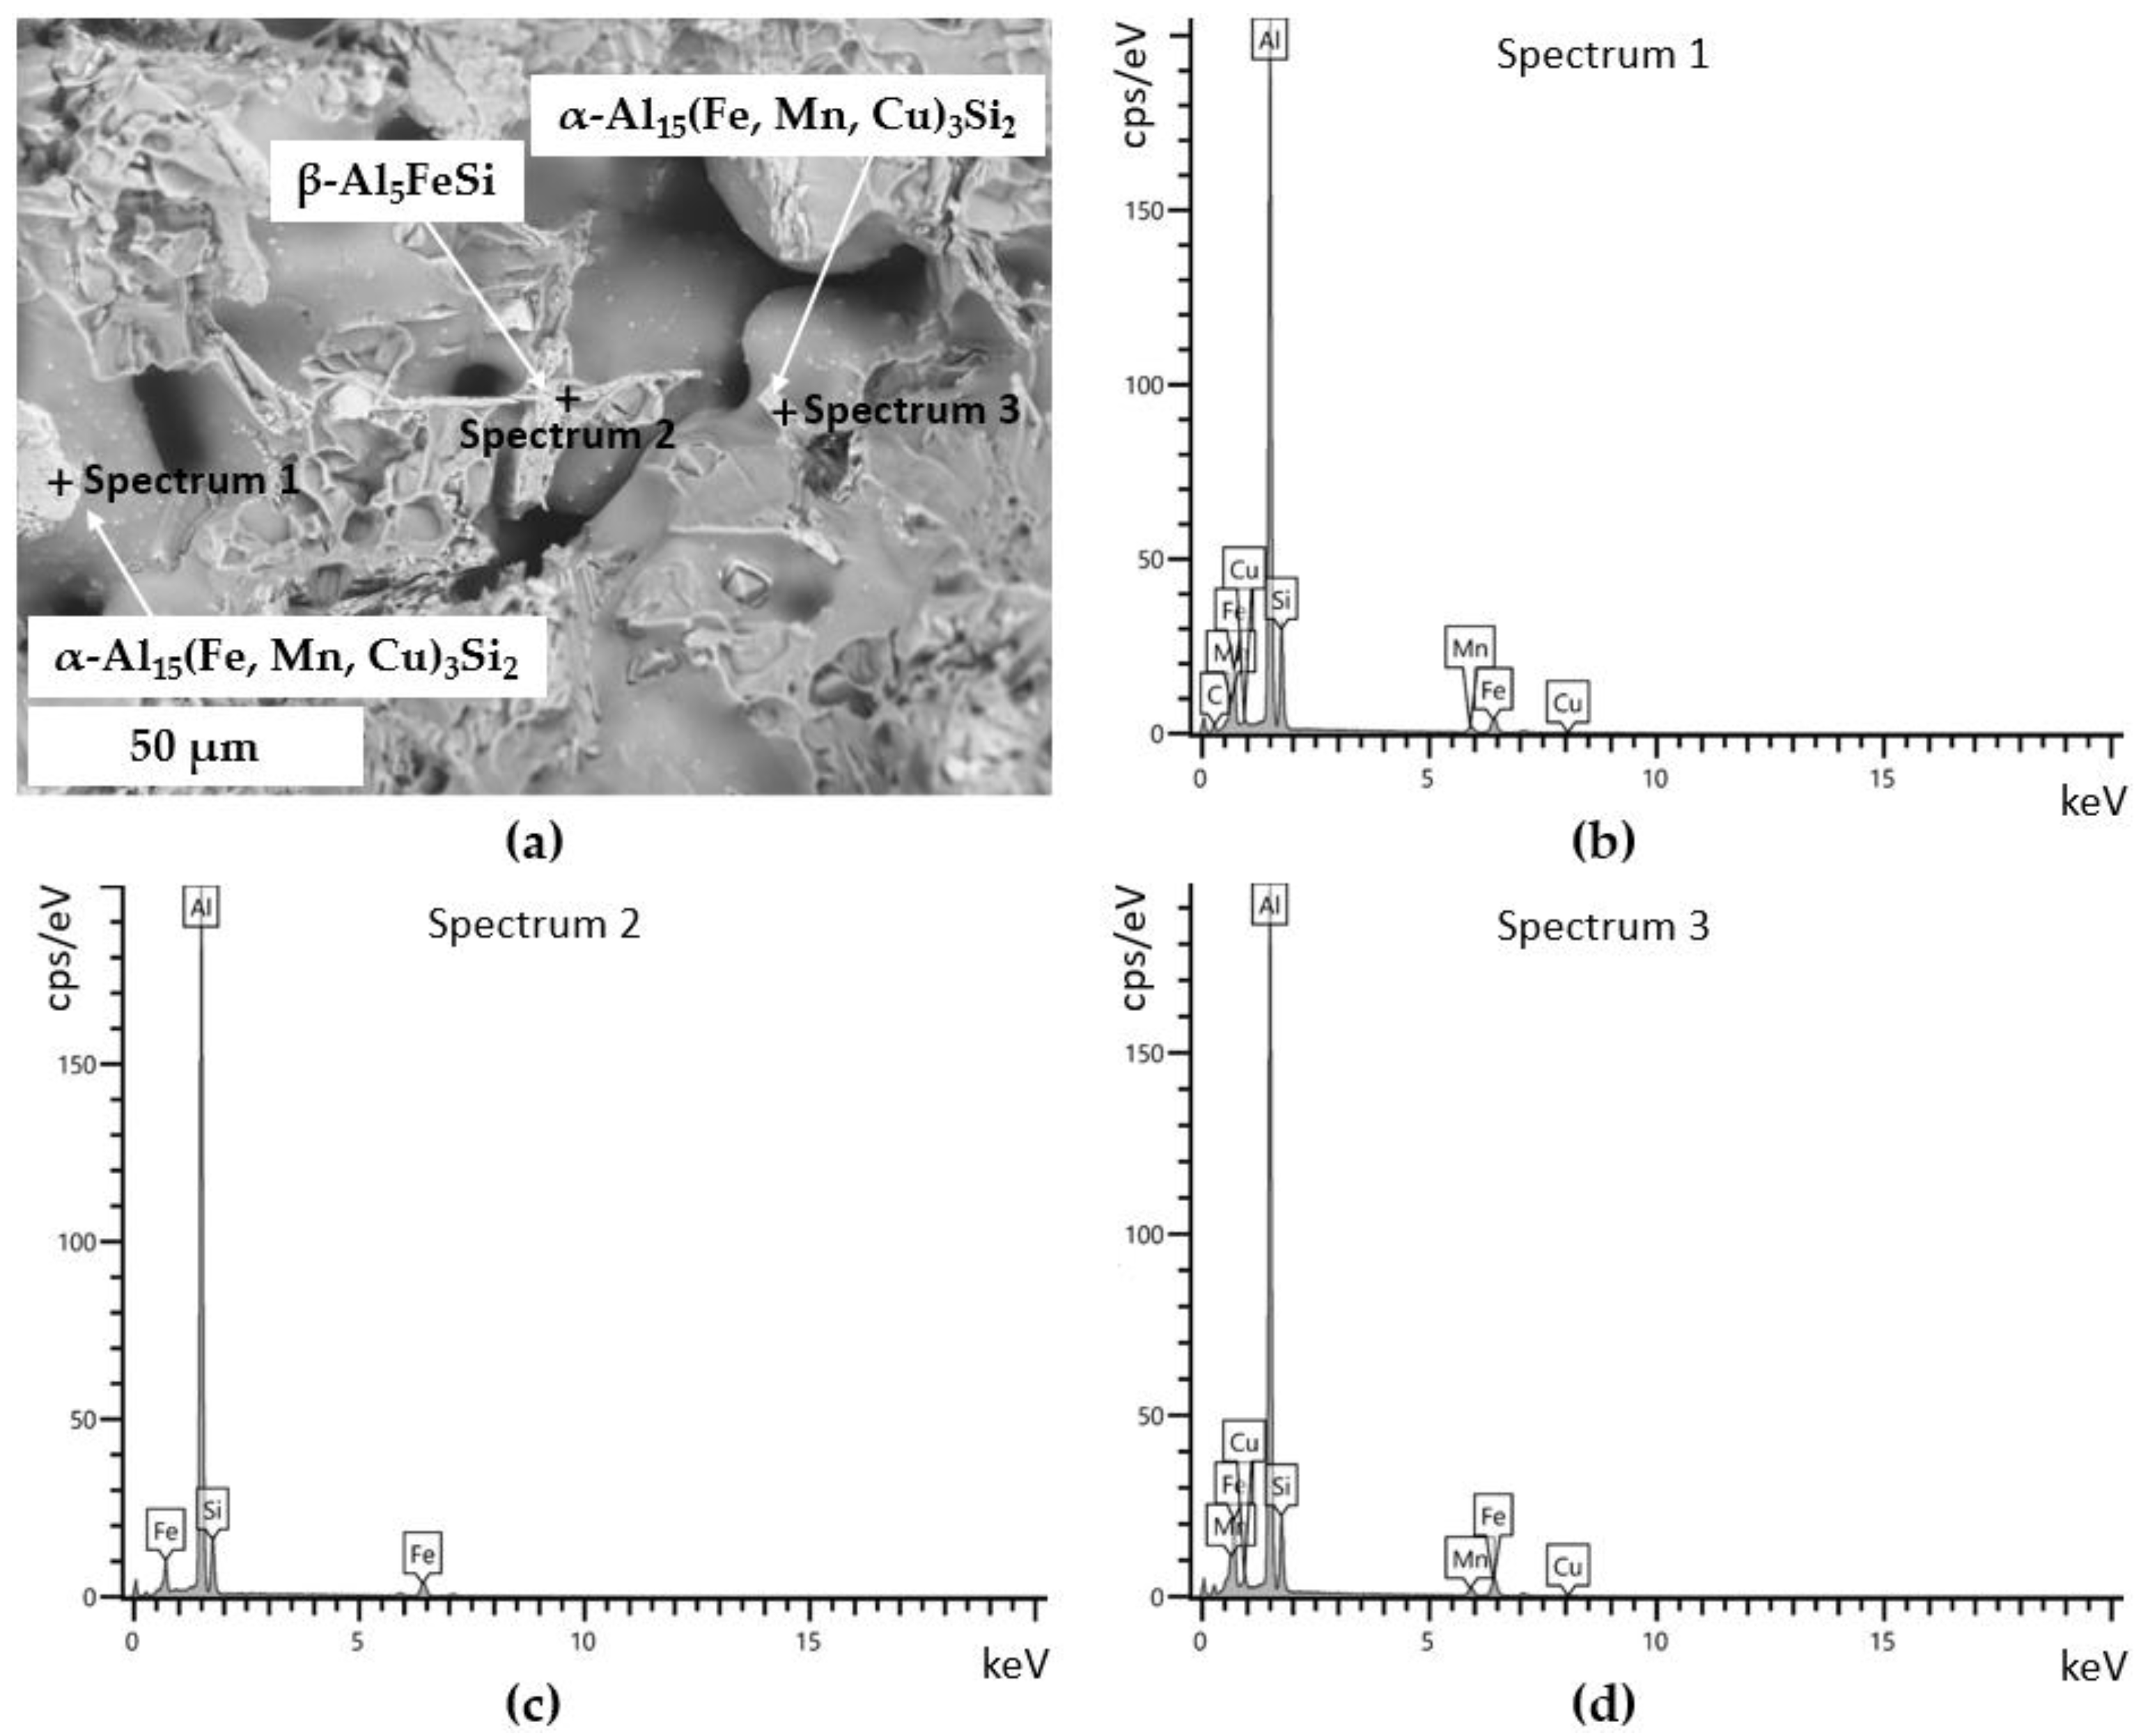
3.2.3. Secondary Intermetallic Phases

The analysis of secondary intermetallic phases was performed by light and scanning electron microscopy. The microstructure of the alloy in the as-cast conditions (Figure 6 and Figure 7a) shows the presence of α-Al15(Fe, Mn, Cu)3Si2 precipitates exhibiting a Chinese script morphology, together with plate-like β-Al5FeSi phase often coupled to π-Al8FeMg3Si6 intermetallics. The layered images of X-ray maps in Figure 7b,c suggest the presence of low amounts of Cu- and/or Mg-rich θ-Al2Cu, Q-Al5Mg8Cu2Si6, and Al2CuMg phases, with the latter having a typical round morphology. This agrees with previously reported data by Lasa and Rodriguez-Ibabe [32]. Both θ-Al2Cu and Q-Al5Mg8Cu2Si6 phases show a blocky morphology, while no evidence of β-Mg2Si intermetallic particles was found. The low amount of the β-Mg2Si phase may be related to the limited Mg content and the presence of Cu in the alloy [33]. In addition, as pointed out by Samuel et al. [4,33], the β-Mg2Si intermetallics are also difficult to detect in the as-cast condition since the modification with Sr can reduce the amount of such precipitates.
Similarly to the results in [19], the microstructural investigation of the samples in the T6 heat-treated conditions confirmed the presence of Fe-rich phases, such as the β-Al5FeSi and α-Al15(Fe, Mn, Cu)3Si2 ones, which were almost unaffected by the solution heat treatments (Figure 8). In addition, as can be seen in the LM micrographs and in the layered images of X-ray maps reported in Figure 9, for all SHTs no evidence of Cu- and/or Mg-rich θ-Al2Cu, Q-Al5Mg8Cu2Si6, β-Mg2Si, and Al2CuMg phases was detected, even though some traces of undissolved π-Al8FeMg3Si6 phase could be identified for the specimens in ST4 condition. Moreover, no incipient melting of secondary phases was observed, thus indicating that the proposed SHTs effectively dissolved the secondary intermetallic phases involved in enhancing the mechanical properties of the alloy through AA.
Even the ST4 treatment, conducted at the lowest temperature and for the shortest time, guarantees a homogeneous Cu distribution within the matrix and fully dissolves the low-melting post-eutectic θ-Al2Cu and Q-Al5Mg8Cu2Si6 phases. The layered images of X-ray maps in Figure 9, corresponding to the same zones depicted in Figure 8, show that neither sufficiently high-Cu enrichment was found to detect θ-Al2Cu precipitates, nor enough enrichment of both Cu and Mg was identified to assess the presence of Q-Al5Mg8Cu2Si6 or Al2CuMg intermetallics. As shown in Figure 8d, ST4 was unable to completely dissolve the π-Al8FeMg3Si6 particles because of the low temperature and short duration of the SHT with respect to ST1, ST2, and ST3. Indeed, it was observed that zones with higher Mg levels often coincided with regions richer in Fe. As proved also by Sjölander et al. [7,34,35], this phase is not included among the Cu- and/or Mg-rich intermetallics that normally contribute to precipitation hardening during AA. Accordingly, the ST4 may also guarantee an effective reinforcement of the material through AA.

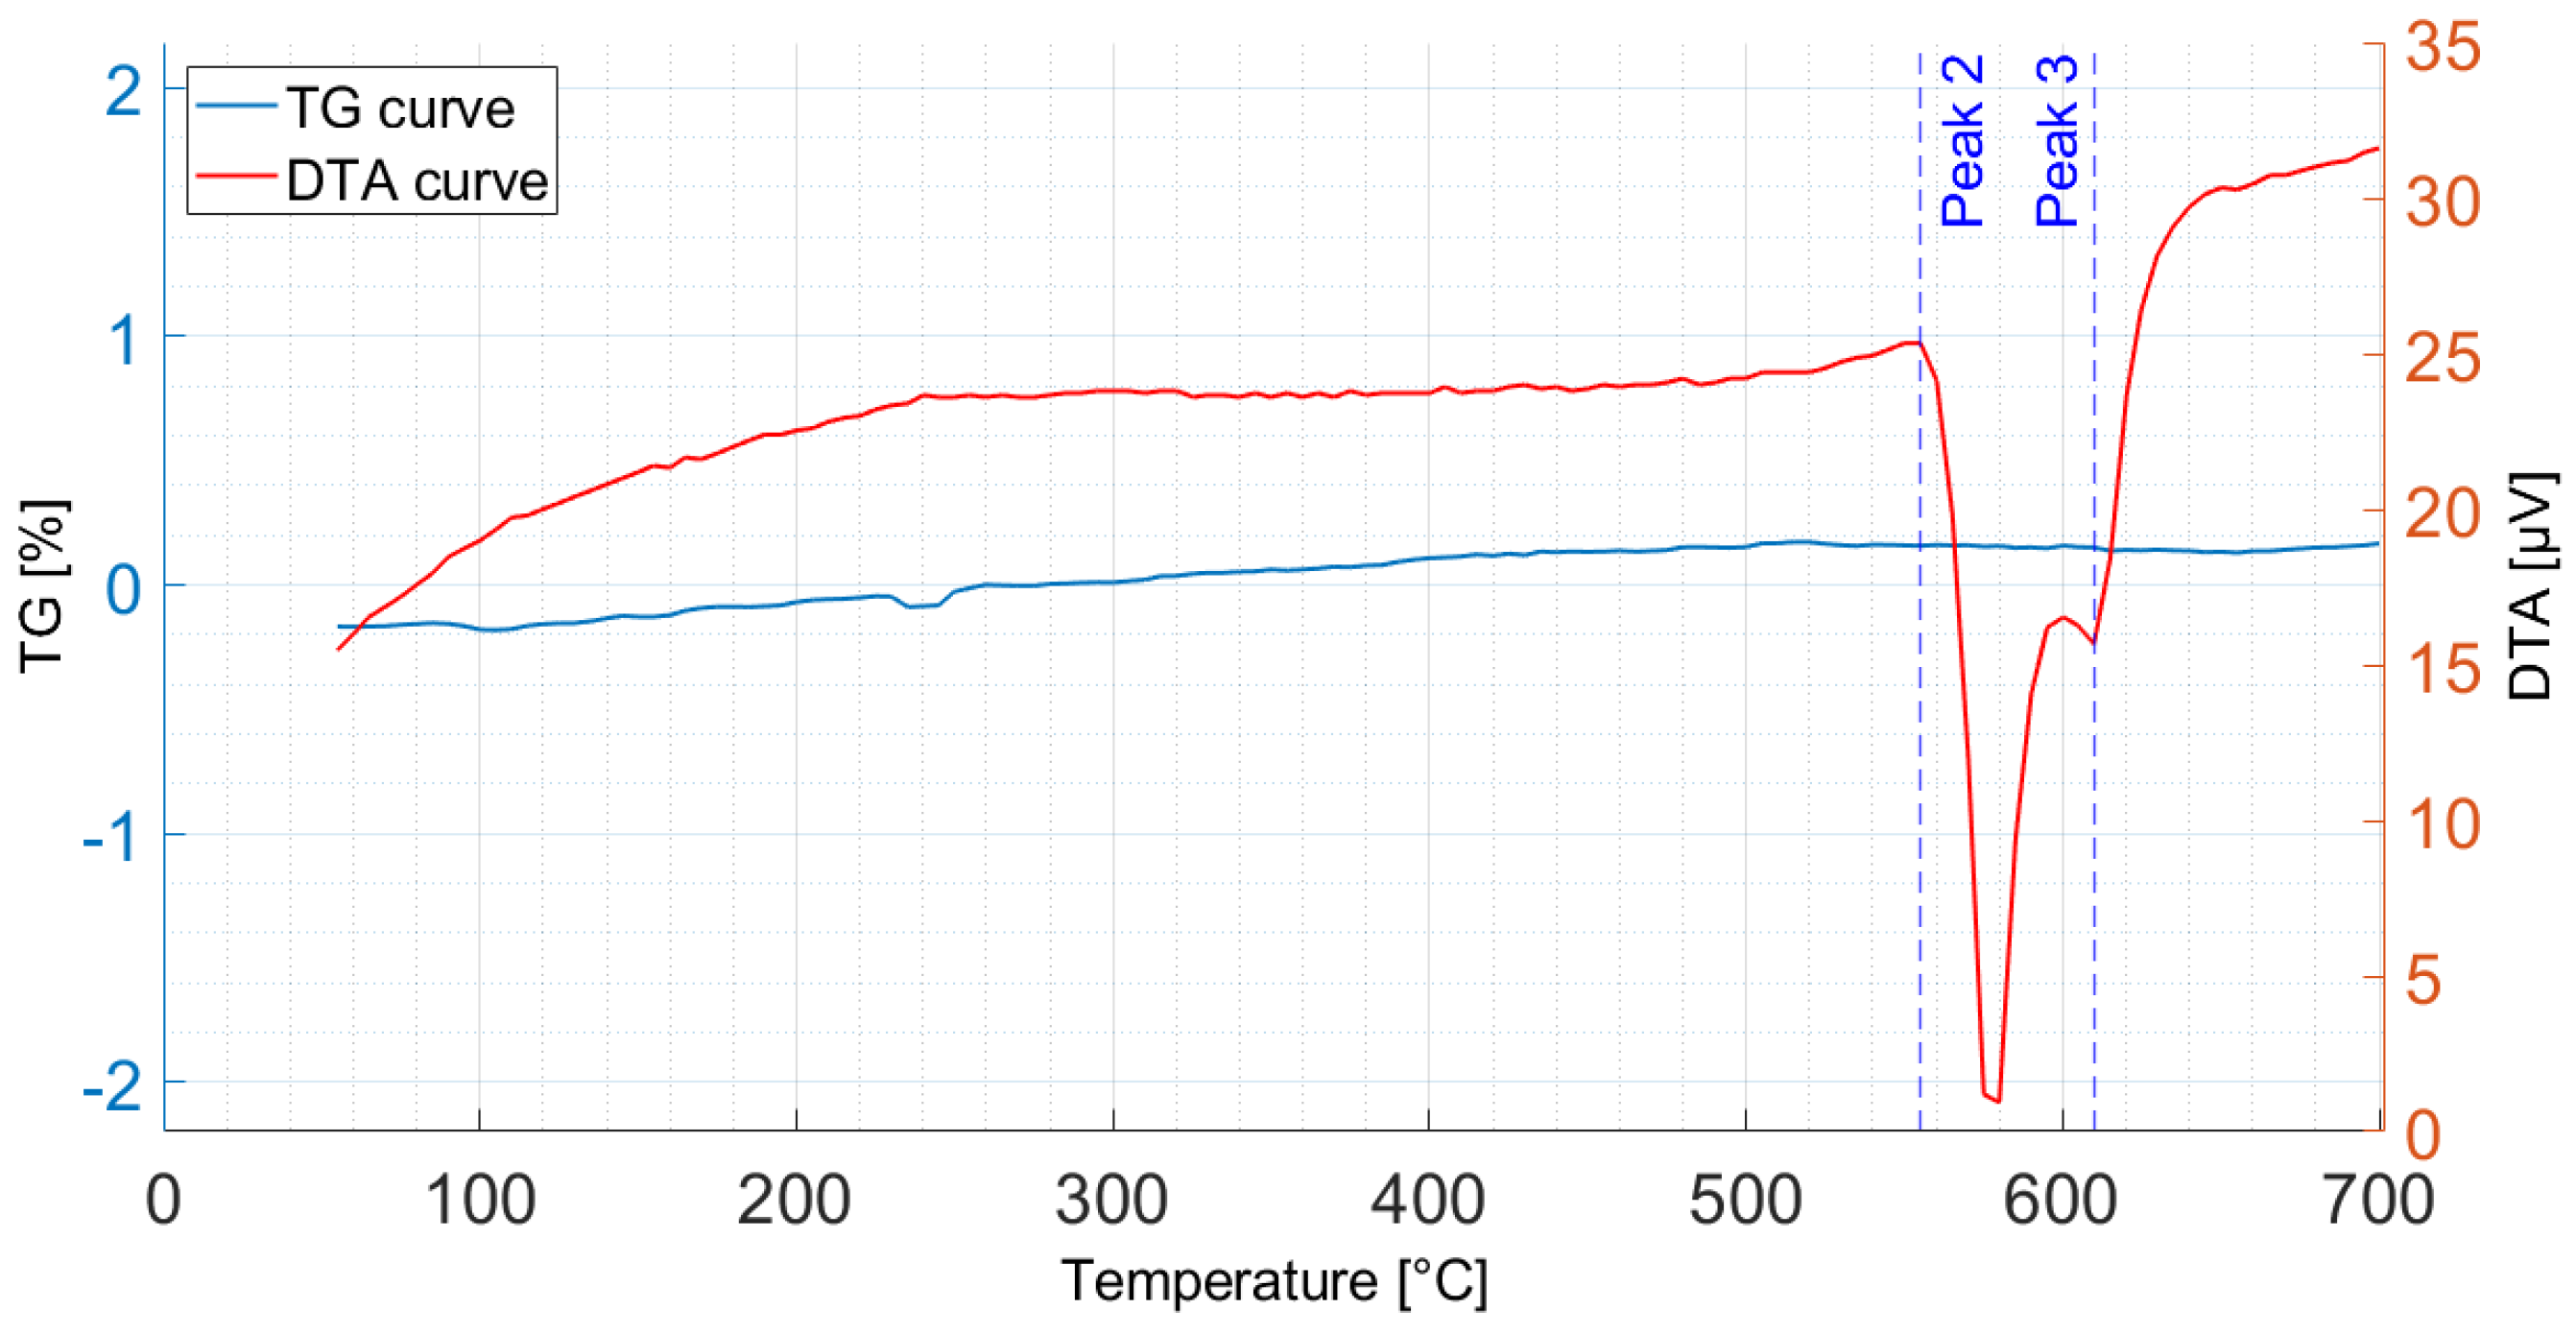
3.3. Simultaneous Thermogravimetric and Differential Thermal Analysis

The DTA signal (in red) of the as-cast sample shows three endothermic peaks that are detected as Peak 1, Peak 2, and Peak 3 in Figure 10. Peak 3 is specifically correlated to the melting of the primary α-Al phase occurring at 610 °C and located at the maximum amplitude of the endothermic peak, as proposed by Boettinger et al. [27]. As pointed out by Javidani et al. [18], the onset temperatures of Peak 1 and Peak 2, located at the point where the curve diverts from the theoretical baseline that could be eventually associated to the DTA curve, refer to the melting of the π-Al8FeMg3Si6 and β-Mg2Si intermetallics at 540 °C, and of the α-Al + β-Si eutectic structure at 555 °C, respectively. According to [27], as concerns Peak 3, whose temperature is located at its maximum amplitude, it is associated with the melting of the α-Al phase. For the investigated alloy, the melting of the eutectic structure is sufficiently far from the melting temperature of the α-Al phase, so no overlapping phenomena occur. Moreover, no other endothermic peaks were detected, and this is probably related to the small amounts of low-melting post-eutectic phases such as θ-Al2Cu and Q-Al5Mg8Cu2Si6. Probably, the low amount of Cu and Mg in the alloy (i.e., 0.44 wt. % and 0.34 wt. %, respectively), together with the limited sensitivity of the DTA equipment, did not allow for the detection of the incipient melting of the above-mentioned phases [36].
Comparing the DTA curves (in red) of the T6 heat-treated samples reported in Figure 11, Figure 12 and Figure 13 (referring to samples in ST2, ST3, and ST4 conditions, respectively), the liquidus temperature remains at 610 °C as for the as-cast sample, whereas the α-Al + β-Si structure begins to melt at 550–555 °C. Conversely to the as-cast sample, whose DTA signal showed a clear third endothermic peak at 540 °C due to melting of the π-Al8FeMg3Si6 and β-Mg2Si intermetallics, the DTA curves of the heat-treated samples virtually eliminate this peak, suggesting that the new T6 heat treatments were able to dissolve π-Al8FeMg3Si6 and β-Mg2Si phases. In fact, they were not involved in incipient melting since they were already dissolved in the matrix during the previous solution heat treatment. These observations are consistent with SEM analysis, even though the EDS maps performed on the alloy in the ST4 condition revealed only a partial dissolution of π-Al8FeMg3Si6 particles. The absence of the first endothermic peak in the DTA signal in Figure 13 could thus be attributed to very small amounts of π-Al8FeMg3Si6 still present within the microstructure, below the detection limit of the TG-DTA technique. Hence, the ST4 condition seems to allow a non-complete dissolution of the π-Al8FeMg3Si6 phase, but not enough to be critical for AA.
Furthermore, limited amounts of the low-melting post-eutectic θ-Al2Cu and Q-Al5Mg8Cu2Si6 phases were already present in the sample in the as-cast condition, whereas the TG-DTA curves in Figure 11, Figure 12 and Figure 13 displayed no endothermic peaks due to their incipient melting. This evidence further confirms the results of the microstructural analysis that showed a complete dissolution of these intermetallics. Based on the experimental findings, despite the shortest time (2 h) and the lowest temperature (510 °C), the ST4 solution heat treatment is effective in dissolving most of the secondary phases which are then involved in the precipitation hardening during aging.
The results of the TG-DTA analysis are reinforced by those previously reported in [18,34]. These works demonstrated that the thermal stability of θ-Al2Cu and Q-Al5Mg8Cu2Si6 phases increases with higher Cu and/or Mg contents, enlarging their volume fraction and lessening their dissolution degree into the α-Al matrix. Moreover, Javidani et al. [18] noted that, for an AlSi7 alloy containing 0.5 wt. % Cu and 0.3 wt. % Mg, a solution heat treatment temperature of 510 °C is enough to destabilize θ-Al2Cu and Q-Al5Mg8Cu2Si6 phases and solubilize them into the matrix.
It is worth noting that the TG curves (in blue) reported in Figure 10, Figure 11, Figure 12 and Figure 13 exhibit a roughly constant increase in the mass for specimens in all conditions up to a temperature of about 550 °C, corresponding to the melting of the α-Al + β-Si eutectic structure. The TG curves then reach a plateau remaining stable up to 700 °C. According to the study conducted by Beder et al. [37] on an AlSi10Mg alloy, the increase in mass of the samples during heating could be attributed to the formation of Al oxide (Al2O3) on the surface of the specimens. The Pilling-Bedworth ratio, used to understand whether the oxide films formed by metals are protective or non-protective and applied to an AlSi10Mg alloy similar to that investigated in this work, suggests that the surface oxide layer formed during heating is protective for the material. The same authors further emphasized that the oxidation mechanism of Al during heating proceeds very slowly up to a temperature of about 550 °C, and oxidation decreases between 550 °C and 600 °C, as confirmed by the thermogravimetric curves in Figure 10, Figure 11, Figure 12 and Figure 13. Thus, Al undergoes oxidation during heating, but the oxidation itself is limited by the protective Al2O3 layer responsible for the mass increase observed up to 550 °C. Therefore, Al could exhibit a moderate resistance to oxidation up to its melting point.

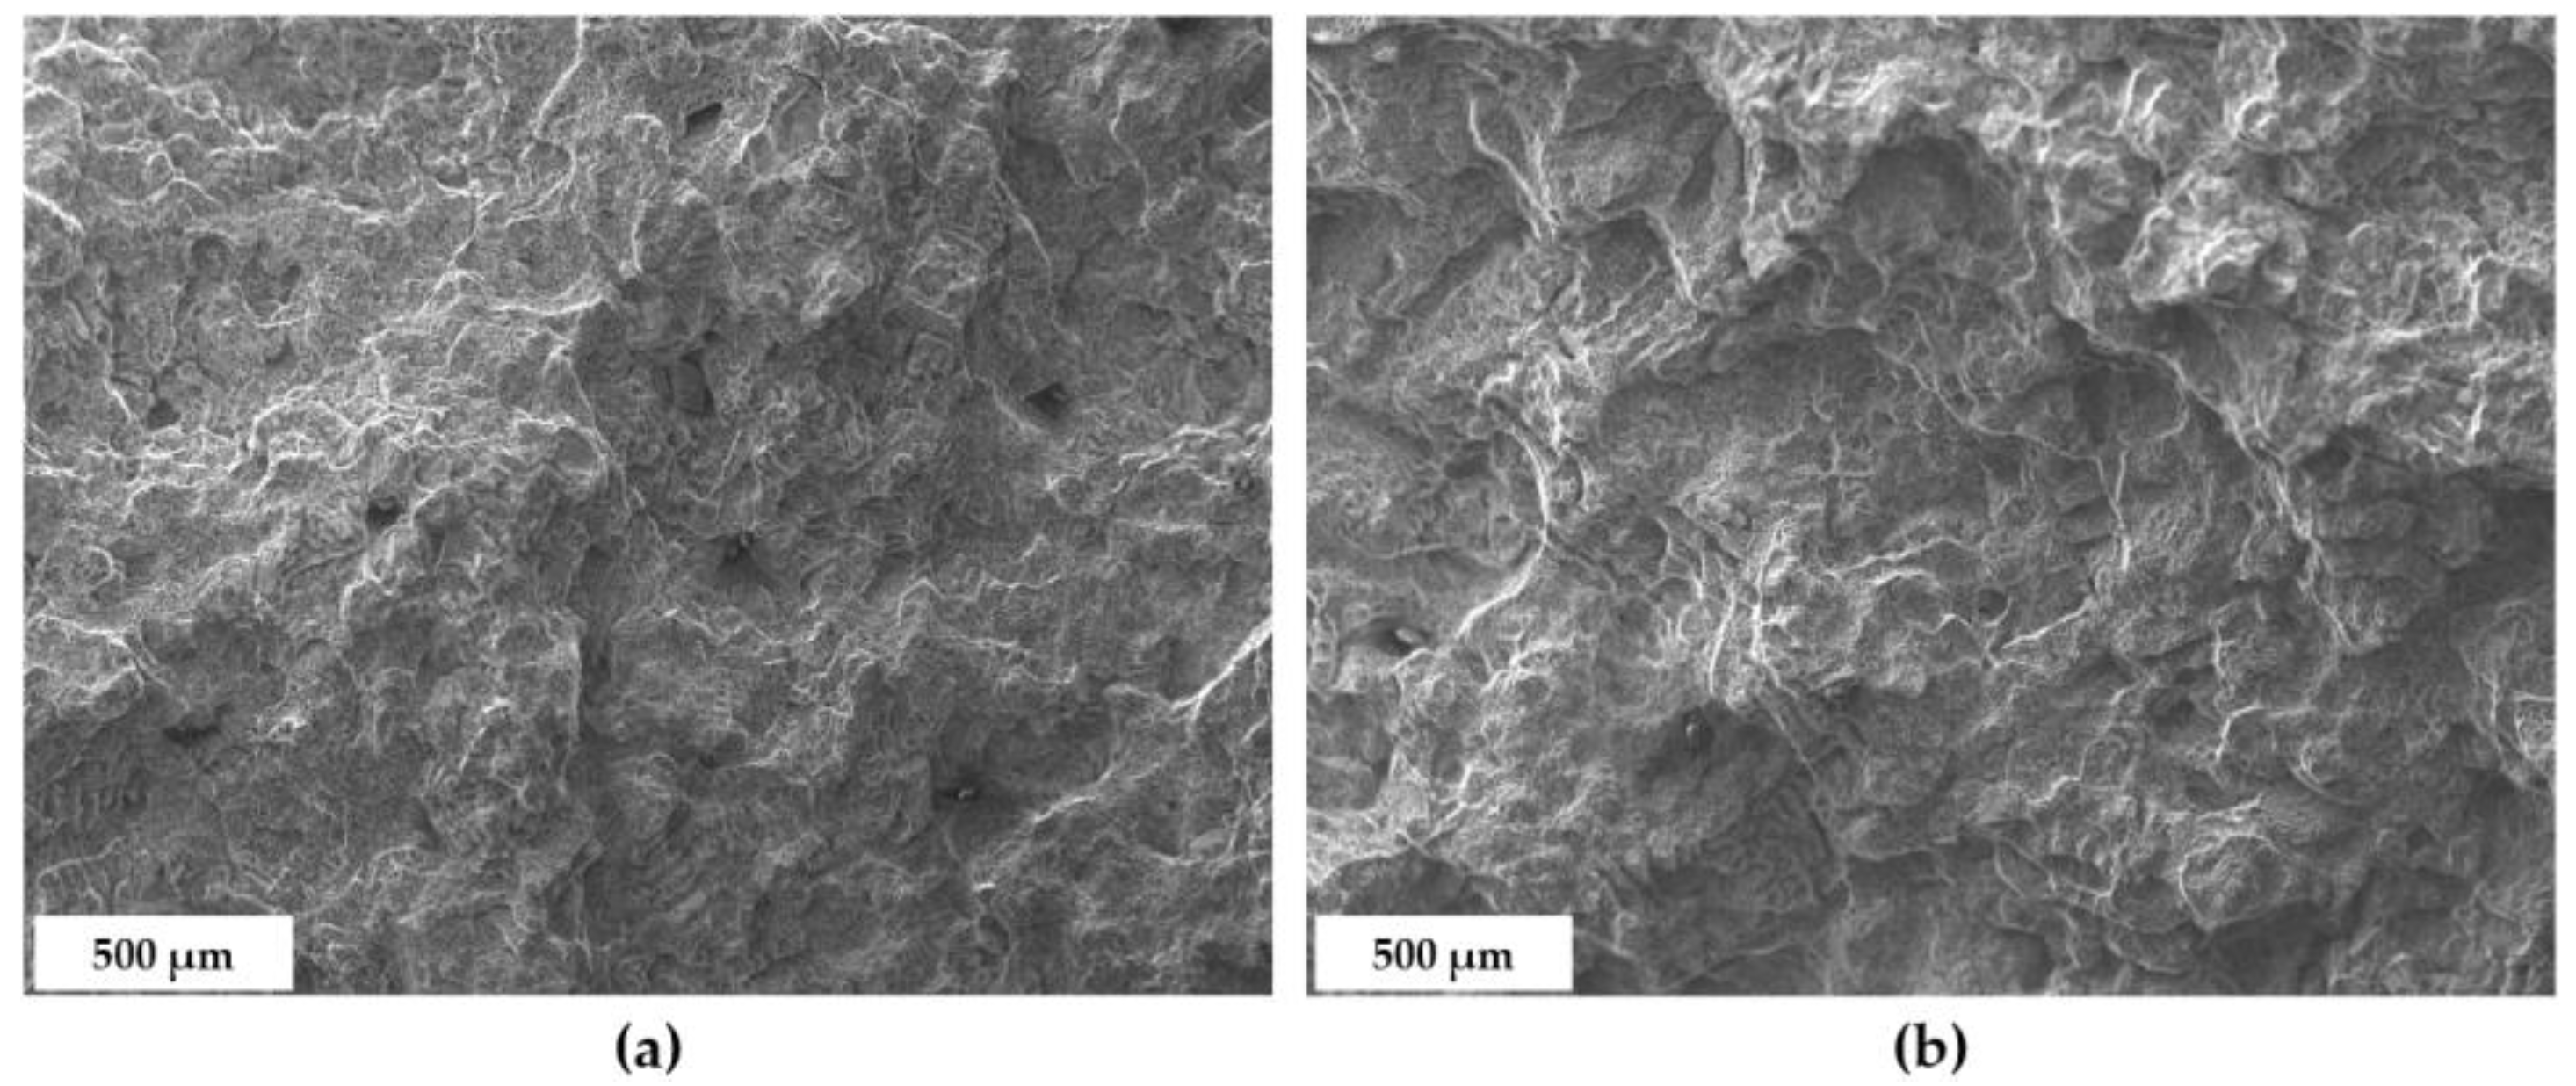
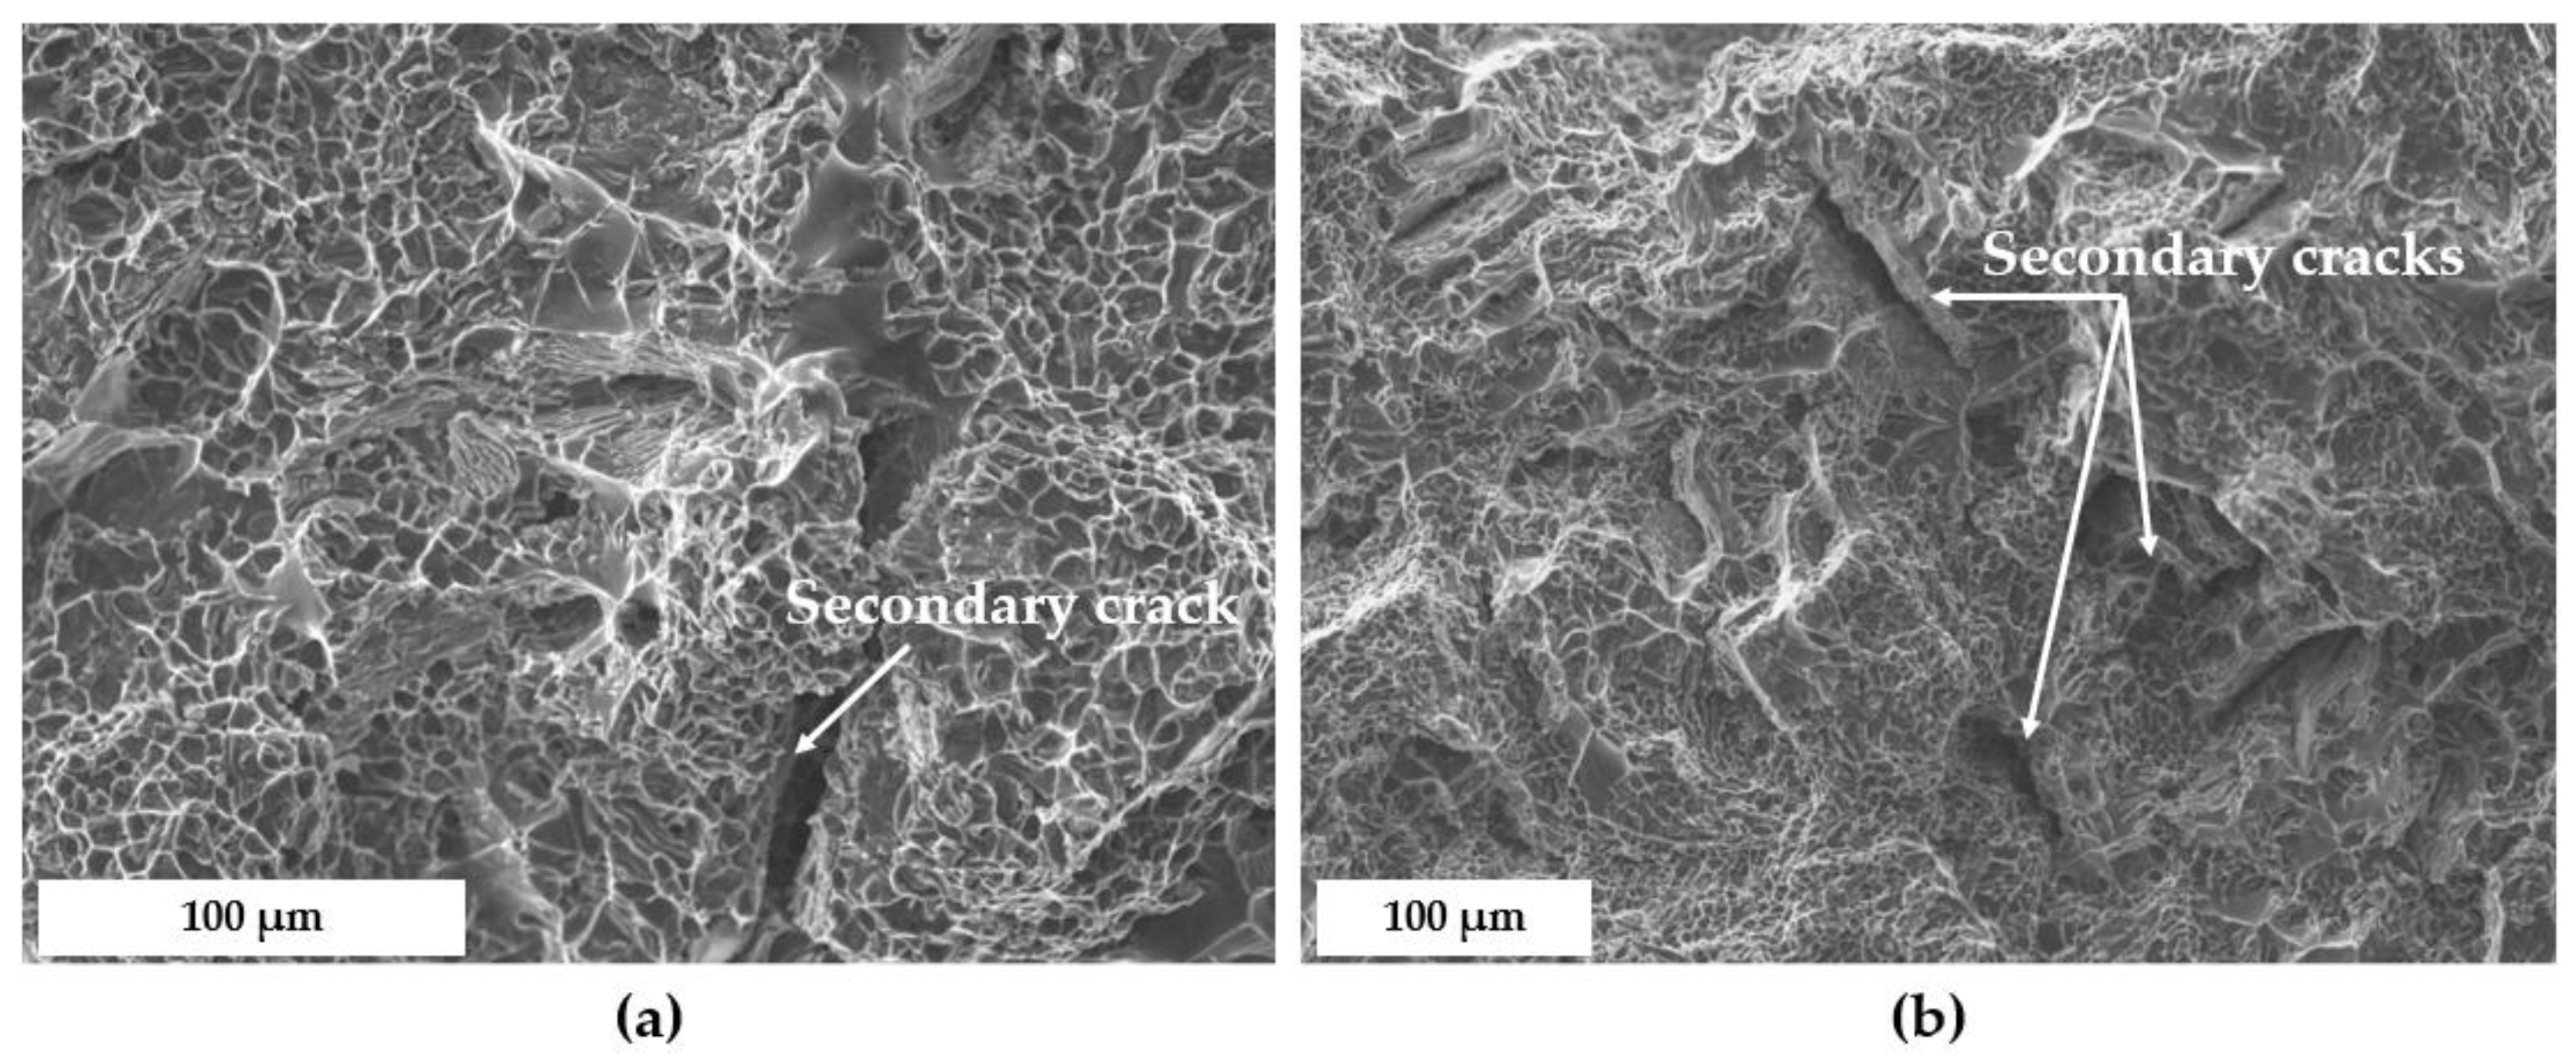
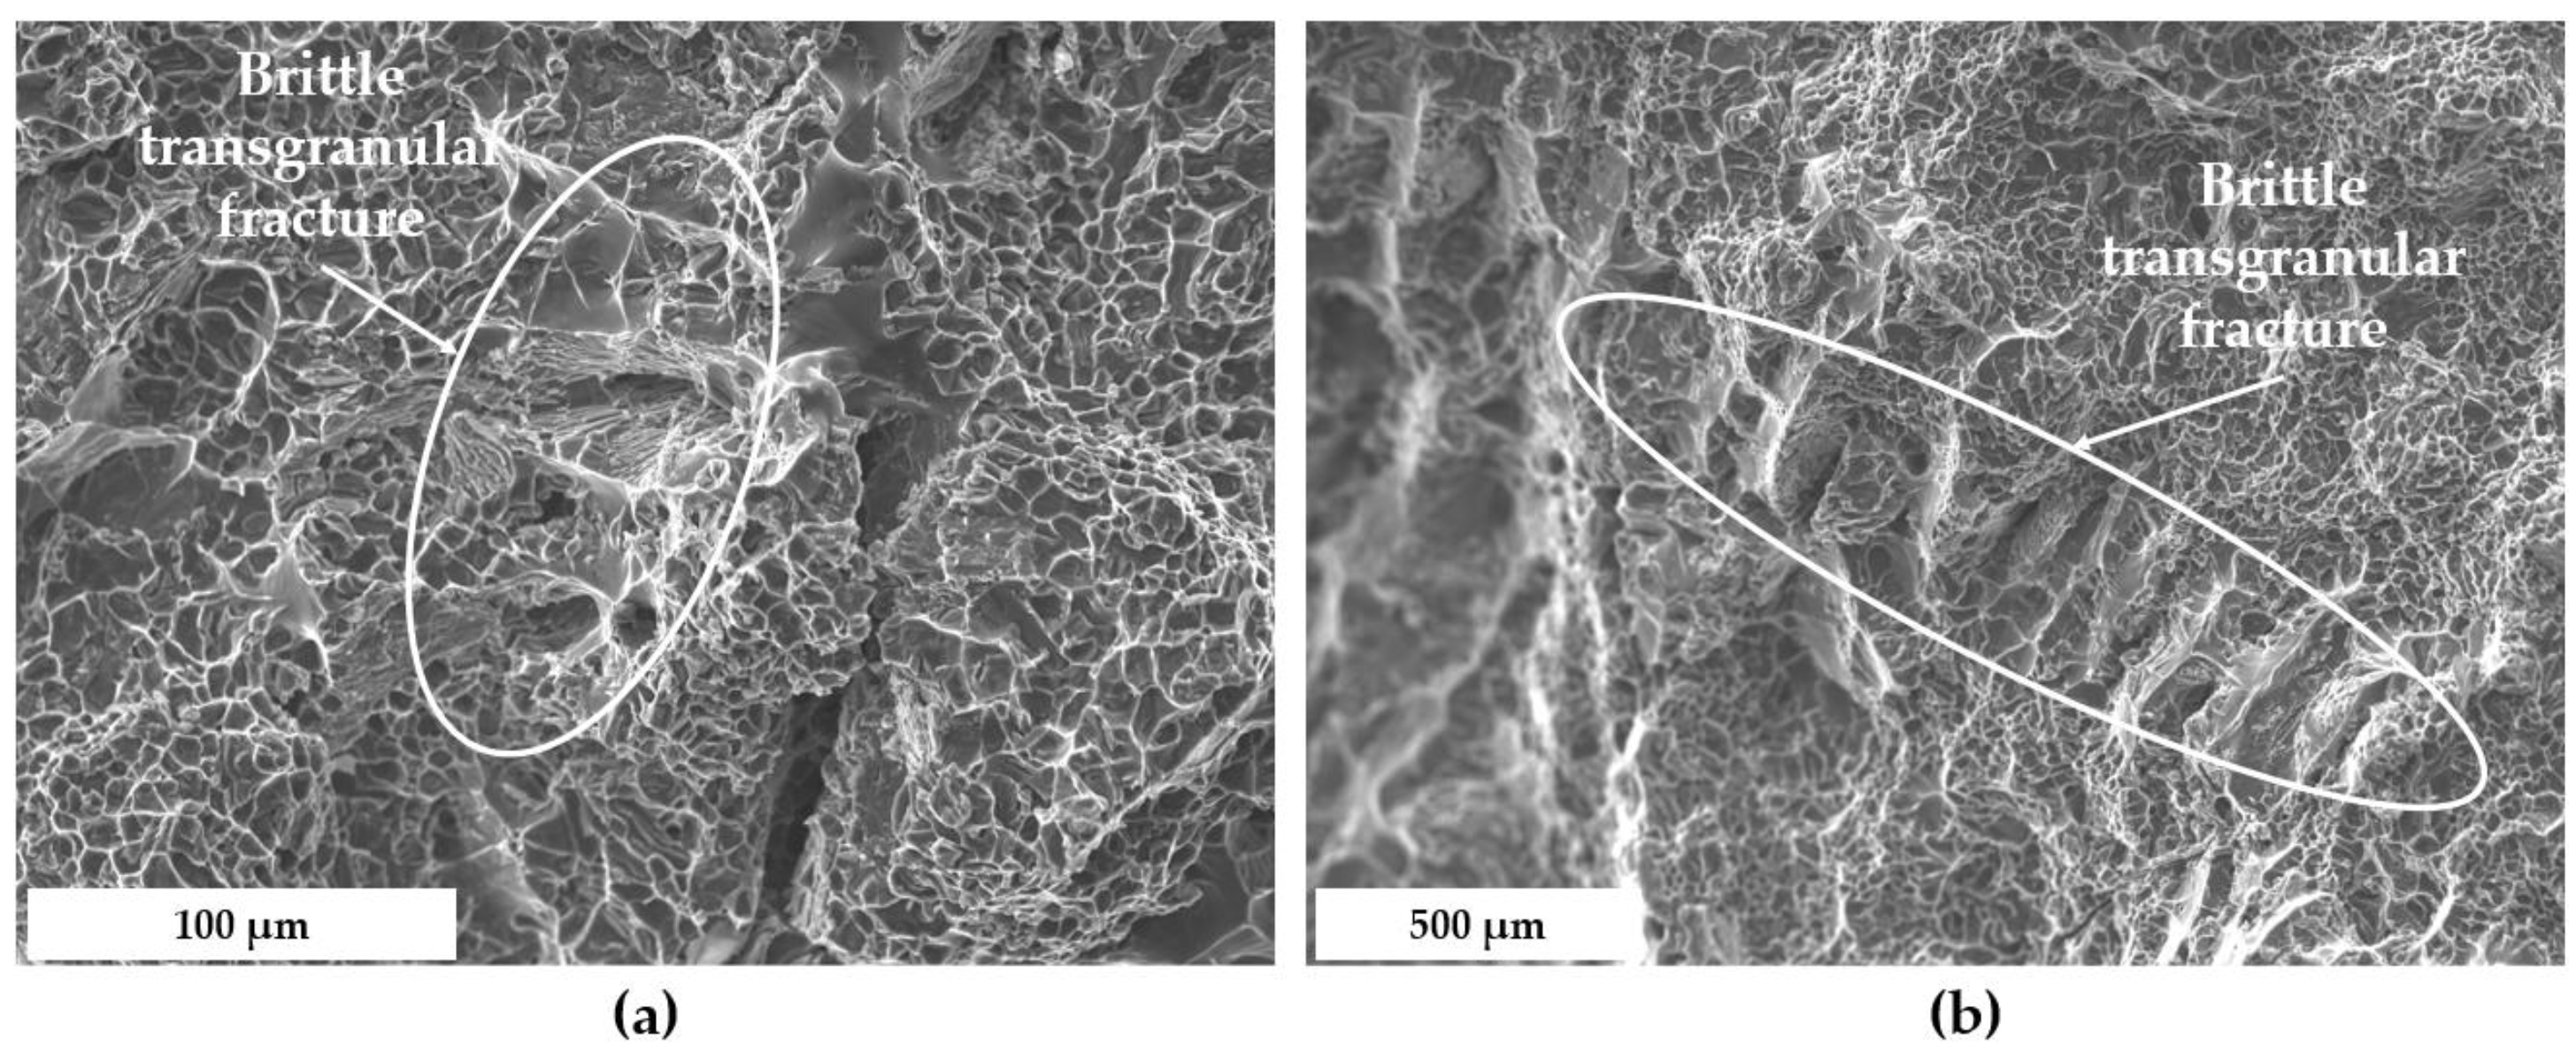
3.4. Fractographic Analysis

After tensile tests, the morphological and metallurgical features of the fracture surfaces were investigated according to all different heat treatment conditions. Especially, the ST1 condition is here compared with the ST4 condition, which is characterized by the shortest time (2 h) and the lowest temperature (510 °C) among the proposed SHT heat treatments. The SE micrographs of the fracture surfaces of tensile specimens (Figure 14) show a fibrous surface for both ST1 (Figure 14a) and ST4 (Figure 14b) conditions, thus suggesting a predominant ductile failure mechanism of the material.
In addition, the SE micrographs at high magnification highlight the presence of several small dimples (Figure 15), resulting from the growth and subsequent coalescence of microvoids assisted by the cracking of eutectic Si particles (Figure 16), thus further proving the ductile failure of the alloy. Dimples in the ST1 condition seem to be qualitatively larger than those in the ST4 condition. This is consistent with the increase in the Deq of Si particles due to the highest temperature and longest time of SHT that occurred in ST1. Secondary cracks were also identified within the fracture surfaces in both ST1 and ST4 conditions. Occasionally, brittle transgranular fractures were observed due to a linkage mechanism involving microcracks within eutectic Si particles (Figure 17) and cleavage-like features, resulting in flatter fracture regions. This morphology is similar to that observed by Wang [28] on fracture surfaces of tensile specimens made of A356 and A357 alloys and subjected to T6 heat treatment.
Finally, small interdendritic shrinkage cavities were identified on the fracture surfaces of tensile specimens in ST1 and ST4 conditions, associated with the presence of Fe-rich β-Al5FeSi and α-Al15(Fe, Mn, Cu)3Si2 phases, as suggested by the EDS analysis reported in Figure 18 and Figure 19.

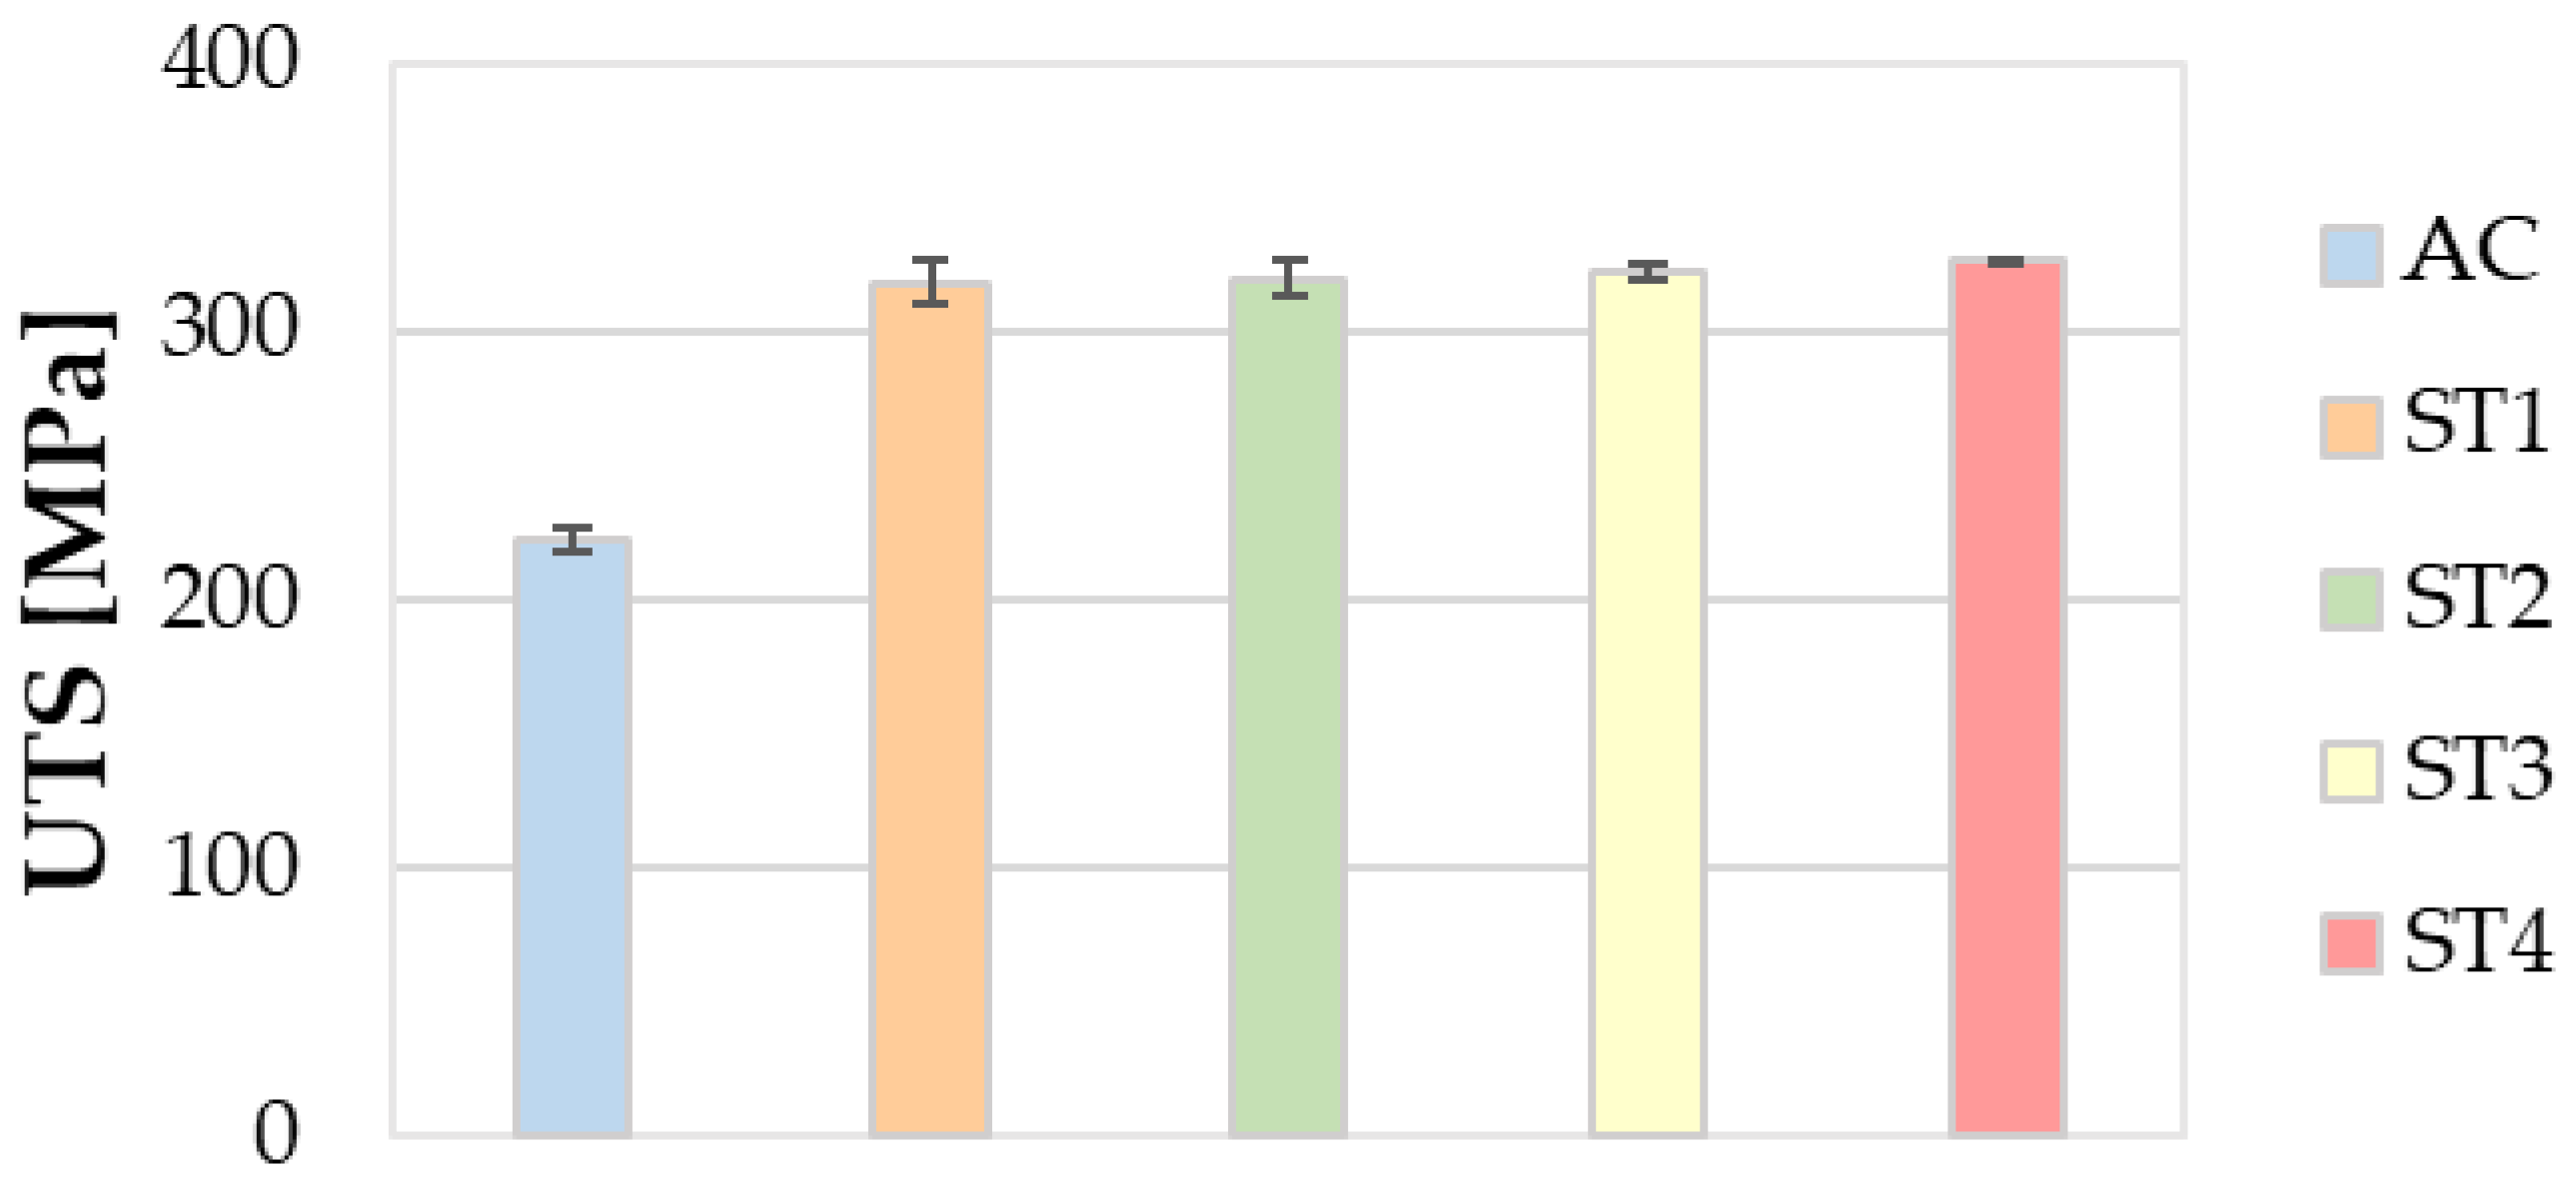
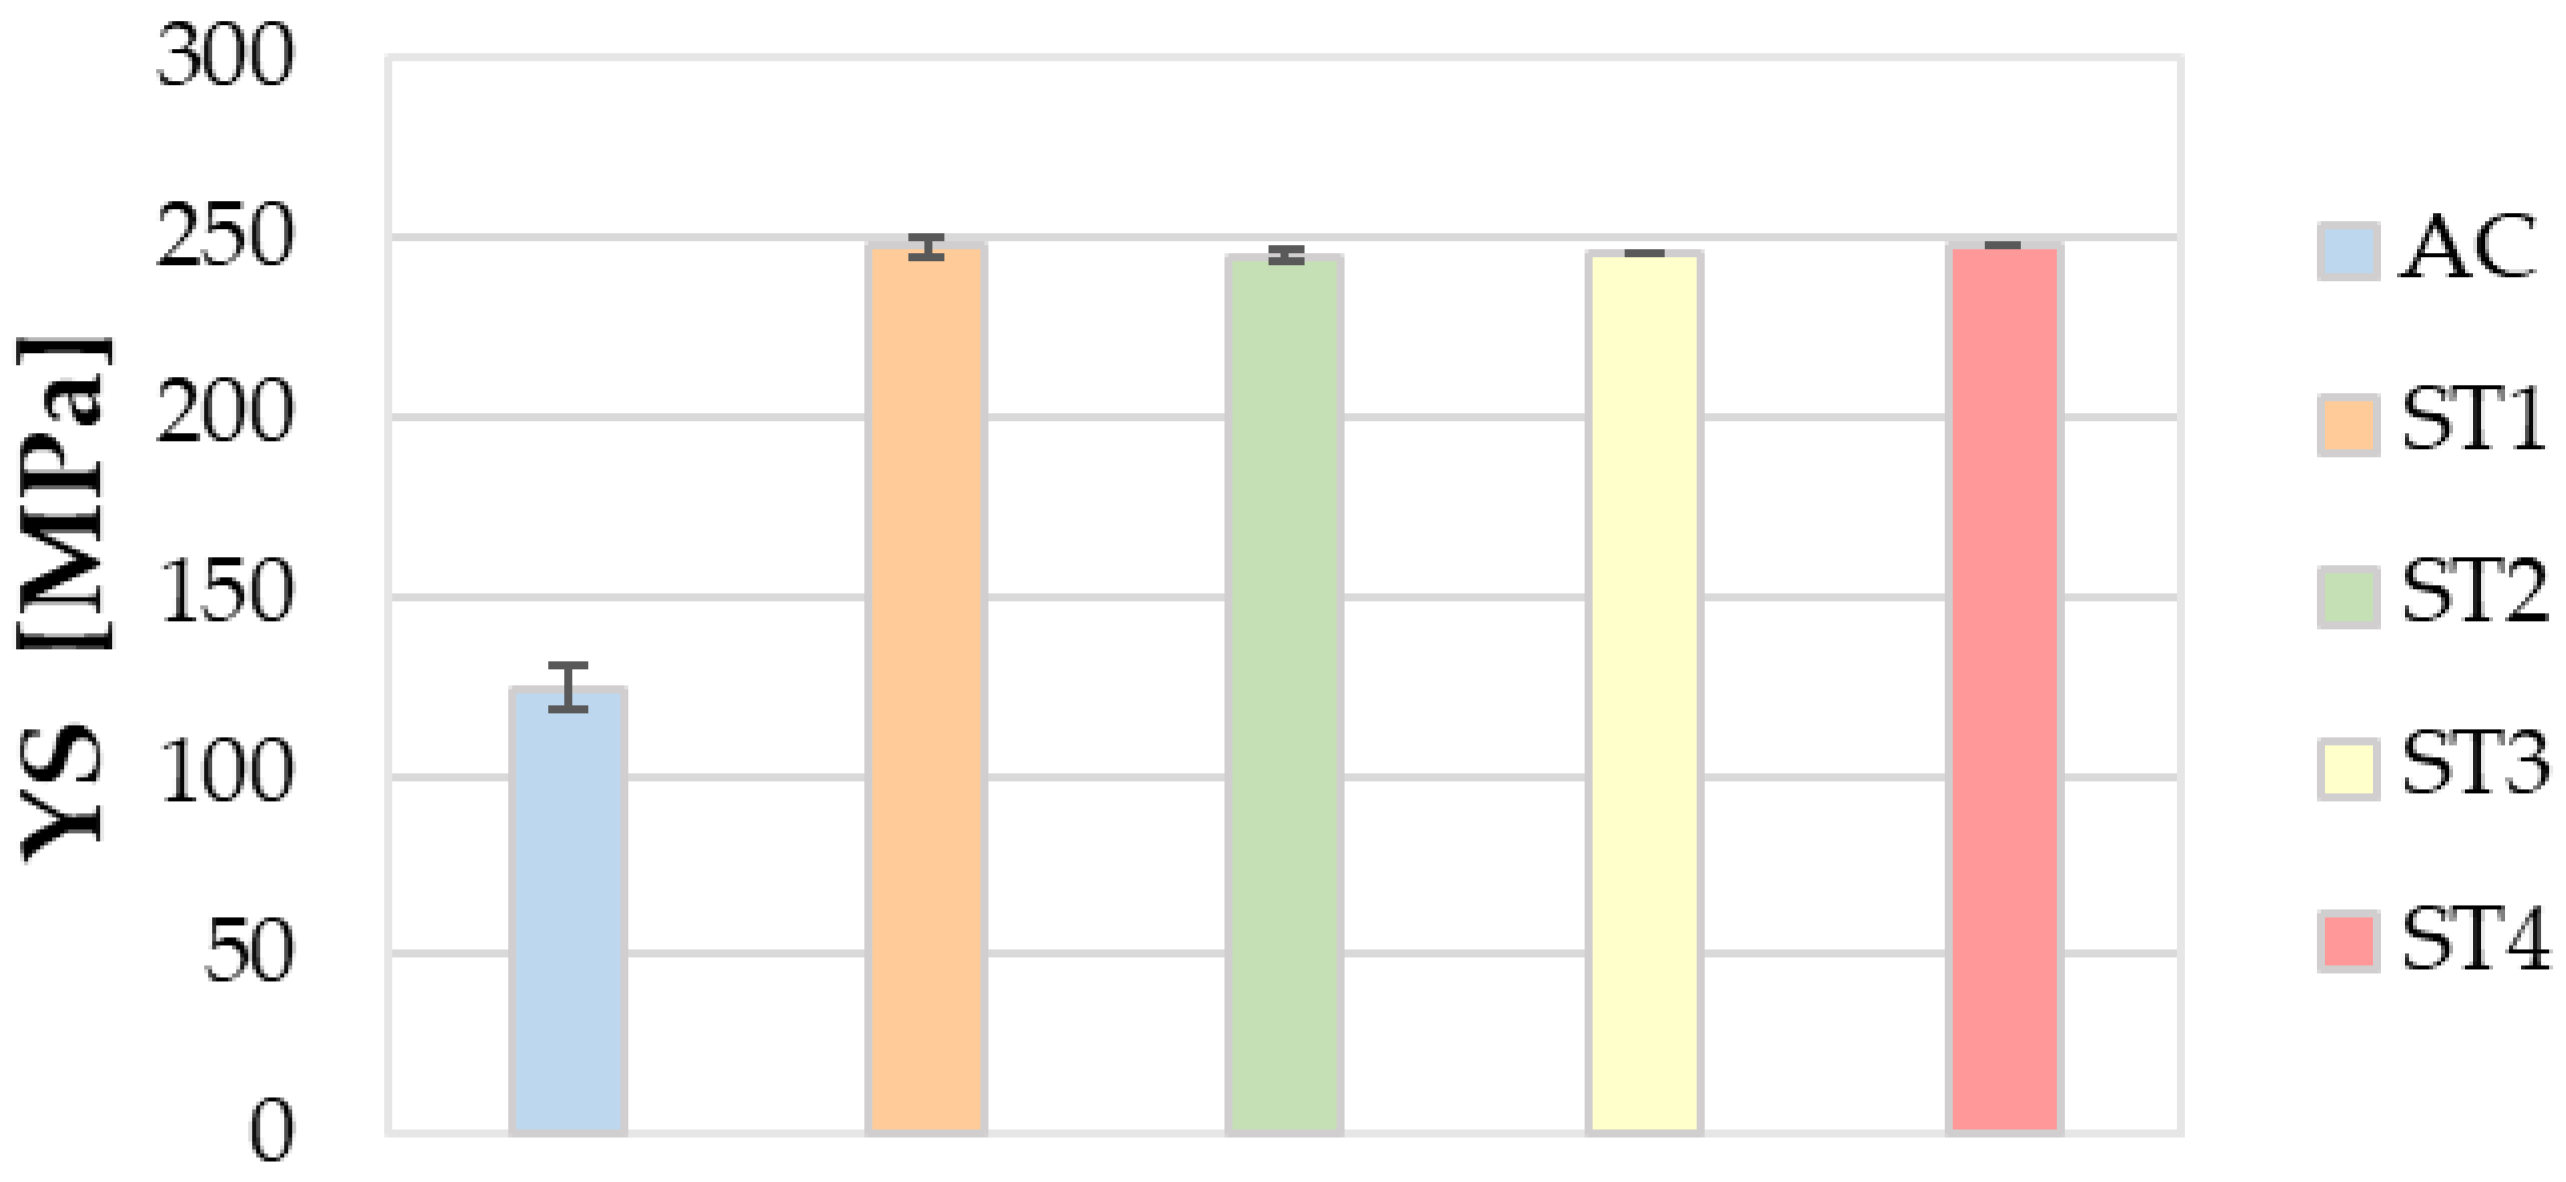
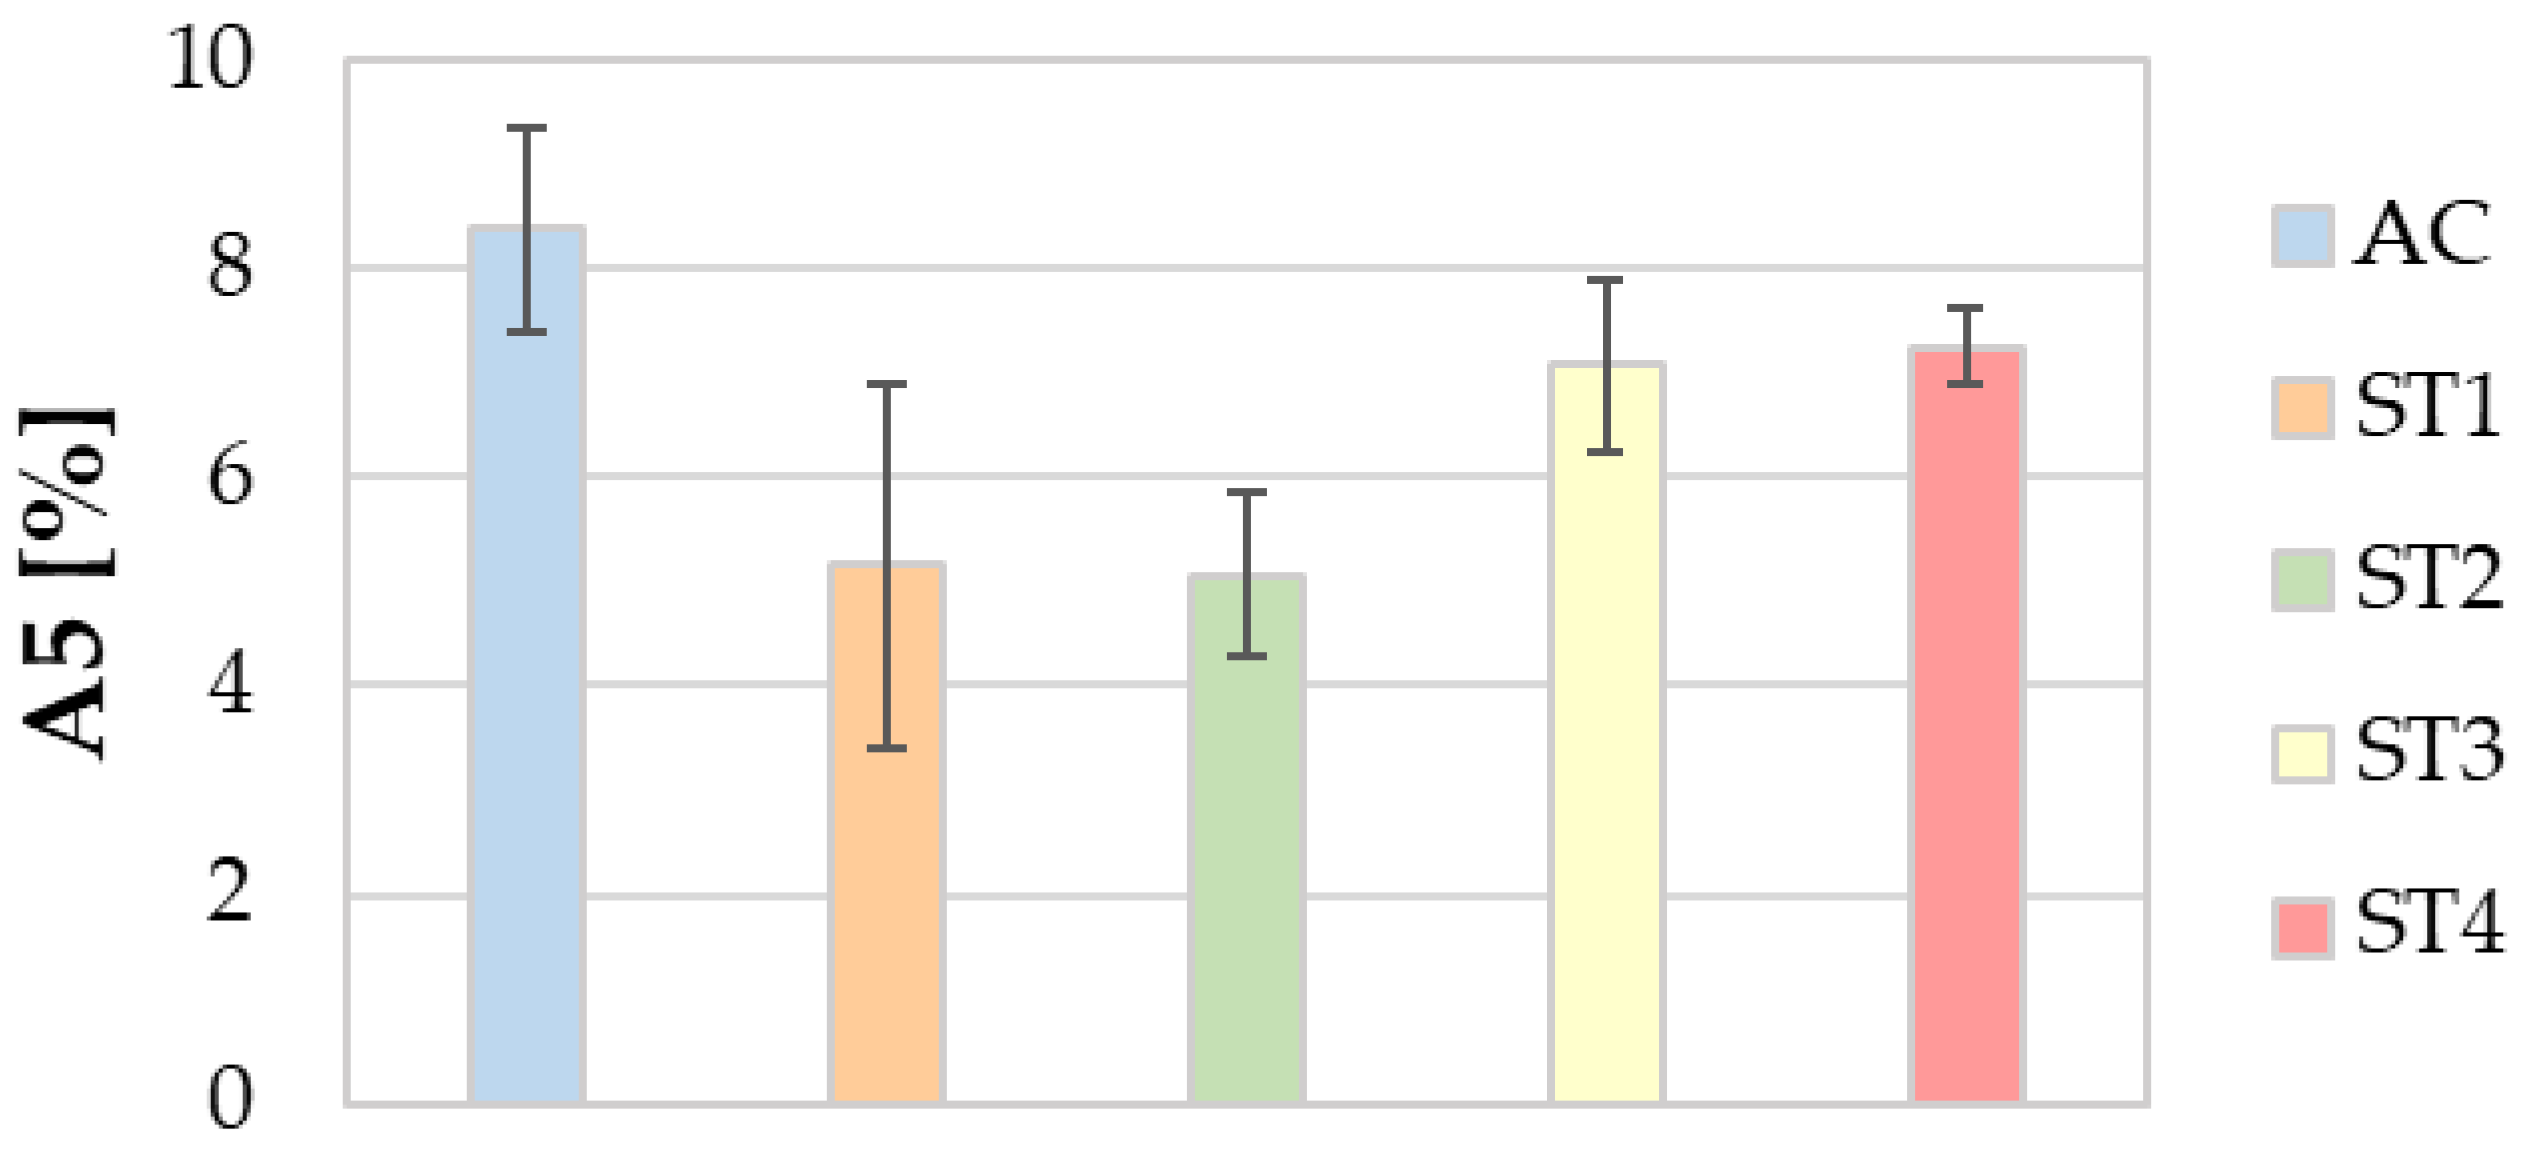
3.5. Mechanical Properties

Figure 20 collects the mean values of UTS measured on tensile specimens in the as-cast and T6 heat-treated conditions. Despite the different SHT parameters, specimens in all T6 heat-treated conditions showed mean UTS values more than 40 % higher than those in the AC condition, due to the precipitation of finely dispersed intermetallic phases that occurred during aging.
It is known in the literature that strengthening in Al-Si-Cu-Mg alloys is guaranteed by the synergic effect of β (Mg2Si), θ (Al2Cu) or Q (Al5Mg8Cu2Si6) submicrometric secondary phases, which act as a barrier for the sliding of dislocations during tensile testing [7,34,35]. Choi et al. [31] also suggested that the improved strength in the T6 heat-treated condition is due to the morphological changes occurring in the eutectic Si particles during SHT, in terms of both the increase in Deq and the decrease in AR. This agrees with the collected experimental data of this study. The solution heat treatments investigated in this work are all effective in enhancing the strength of the alloy, and this can also be observed by comparing the results in Figure 21. The standard deviations for UTS and YS values are very narrow, and none of the proposed solution heat treatment parameters can be ascribed as the best in enhancing the tensile strength of the material.
Conversely to UTS and YS values, the different combinations of solution time and temperature proved to be strongly effective in the ductility of the alloy. Data collected in Figure 22 shows that the alloy in the AC condition exhibits the highest ductility. This result may be strictly correlated to the larger size of eutectic Si particles after T6 heat treatment, as also highlighted by Wang et al. [28,38]. In general, the increase in temperature and time of the SHT determines the coarsening of Si particles, as proved by their Deq distributions, but at the same time causes the increase in Si cracking during loading. The highest decrease in ductility was found for the ST1 condition, even if with a wide standard deviation. Indeed, for the solution heat treatments performed at a temperature higher than that of the ST4 condition, the eutectic Si particles coarsen, thus reducing ductility. The results show that a decrease in the temperature of the solution heat treatment from 535 °C to 510 °C, enhances the ductility of the alloy, thus reducing the gap with the AC condition.
The results of the Brinell hardness tests exhibited a trend similar to that found for YS and UTS. In Figure 23, no remarkable differences are detectable among the investigated heat treatment conditions, except for their ability to increase the hardness of the alloy with respect to the AC condition, as already proved in the literature [34,39,40].
Hence, the best combination of mechanical strength and ductility was reached by the ST4 treatment, which is then the most productive and energy-saving proposed heat treatment route.

4. Conclusions

In this study, different times and temperatures for the solution heat treatment of an innovative AlSi7Cu0.5Mg0.3 secondary Al alloy were investigated aiming to achieve energy savings and reduce the environmental impact related to the production of foundry Al alloy components for the automotive industry. Based on the results, the following conclusions can be drawn:
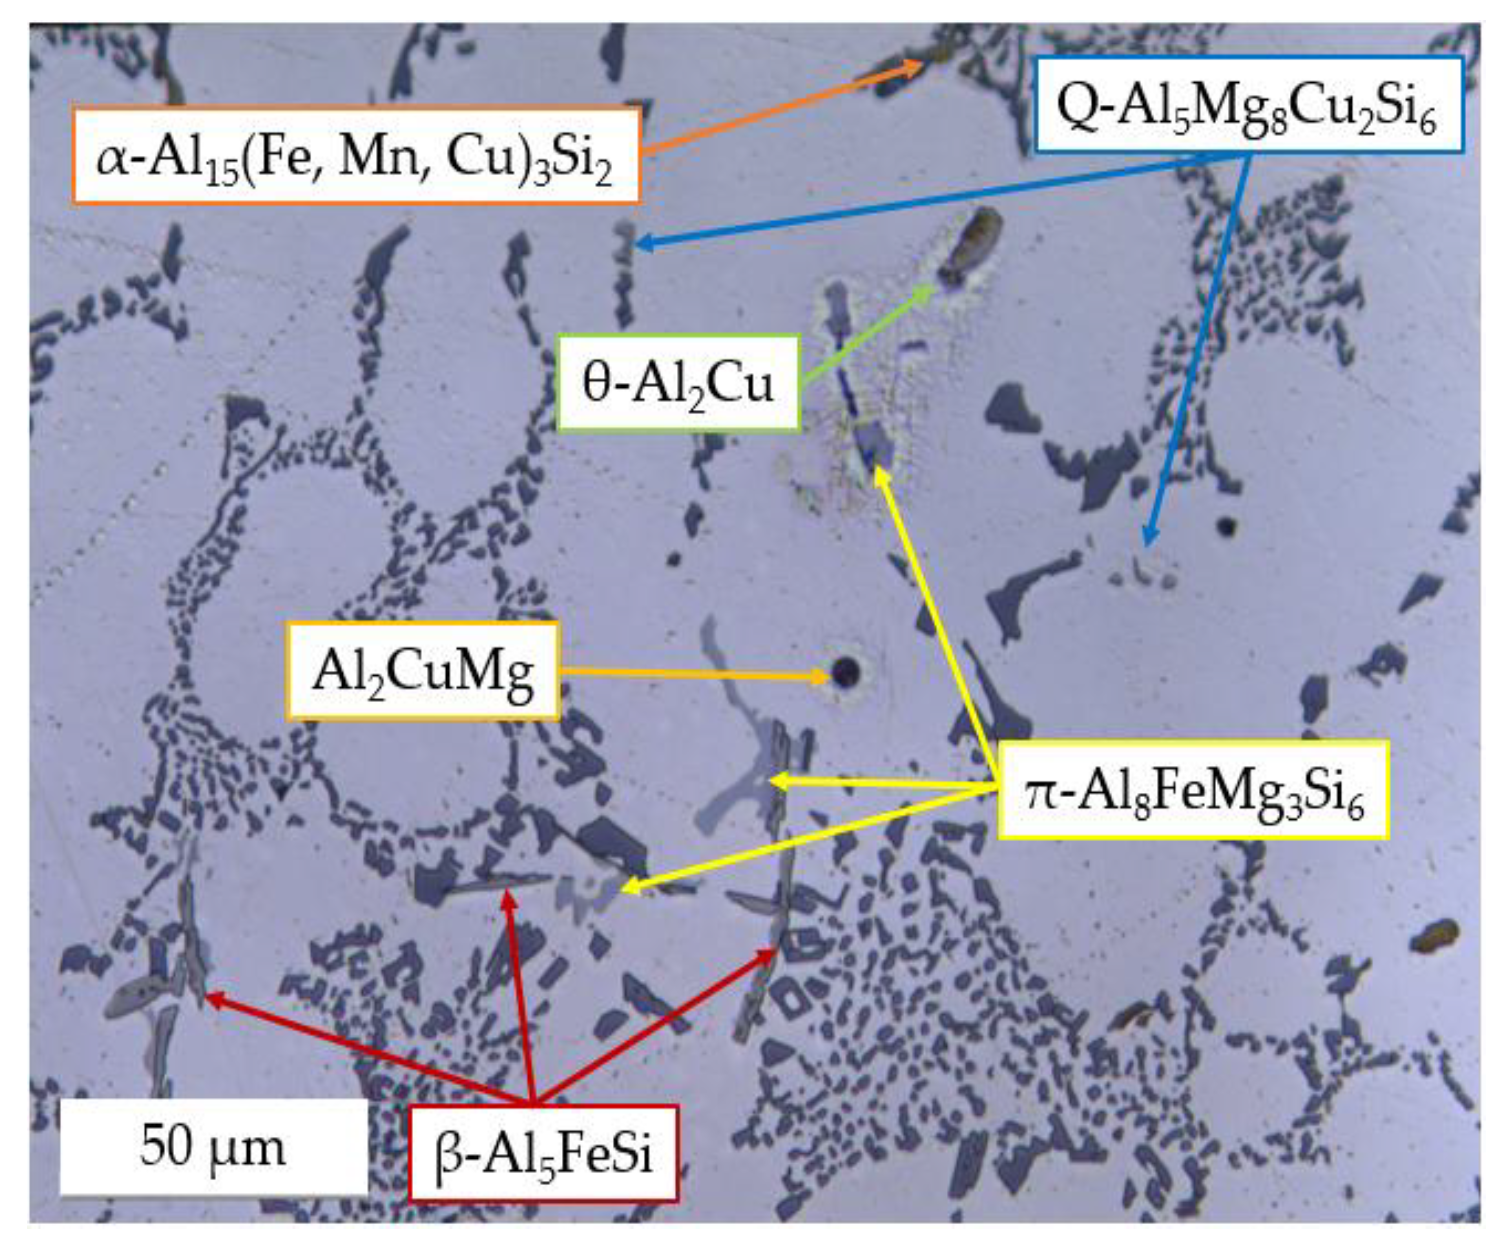
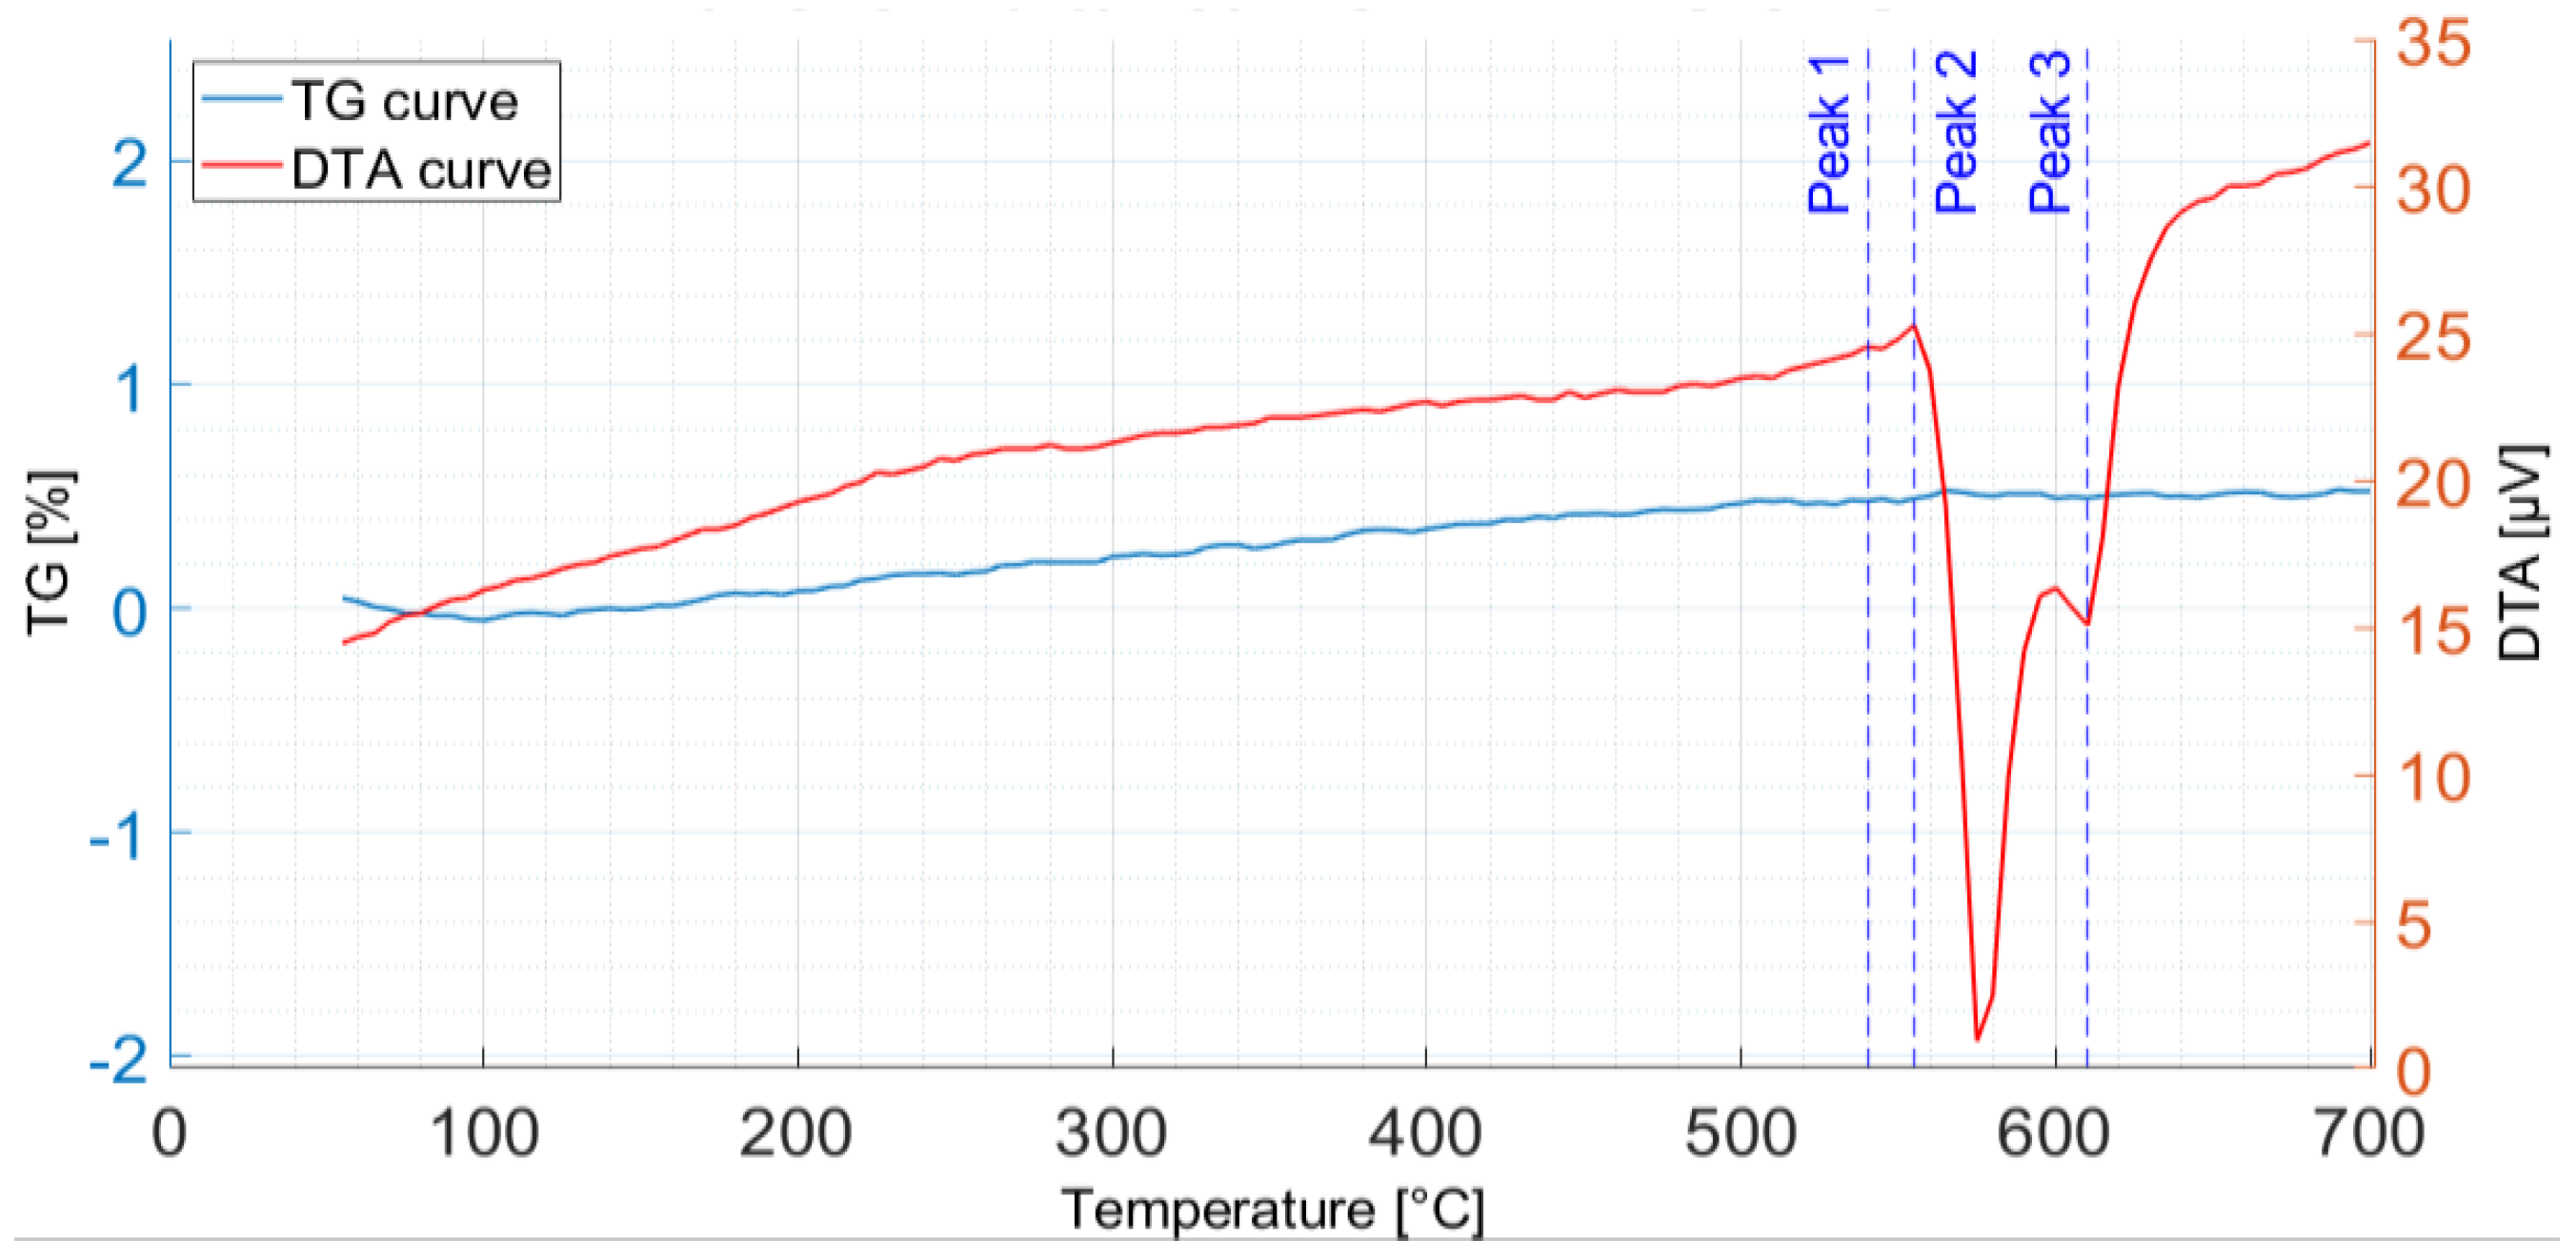
  • Concerning the solidification sequence of the examined alloy, thermal analysis proved the formation of the primary α-Al phase, the α-Al + β-Si eutectic structure, the Fe-rich β-Al5FeSi and α-Al15(Fe, Mn, Cu)3Si2 intermetallics, the π-Al8FeMg3Si6 and β-Mg2Si precipitates, and the low-melting post-eutectic θ-Al2Cu and Q-Al5Mg8Cu2Si6 phases. Except for the β-Mg2Si, the presence of these phases within the as-cast microstructure was also confirmed by light and scanning electron microscopy.
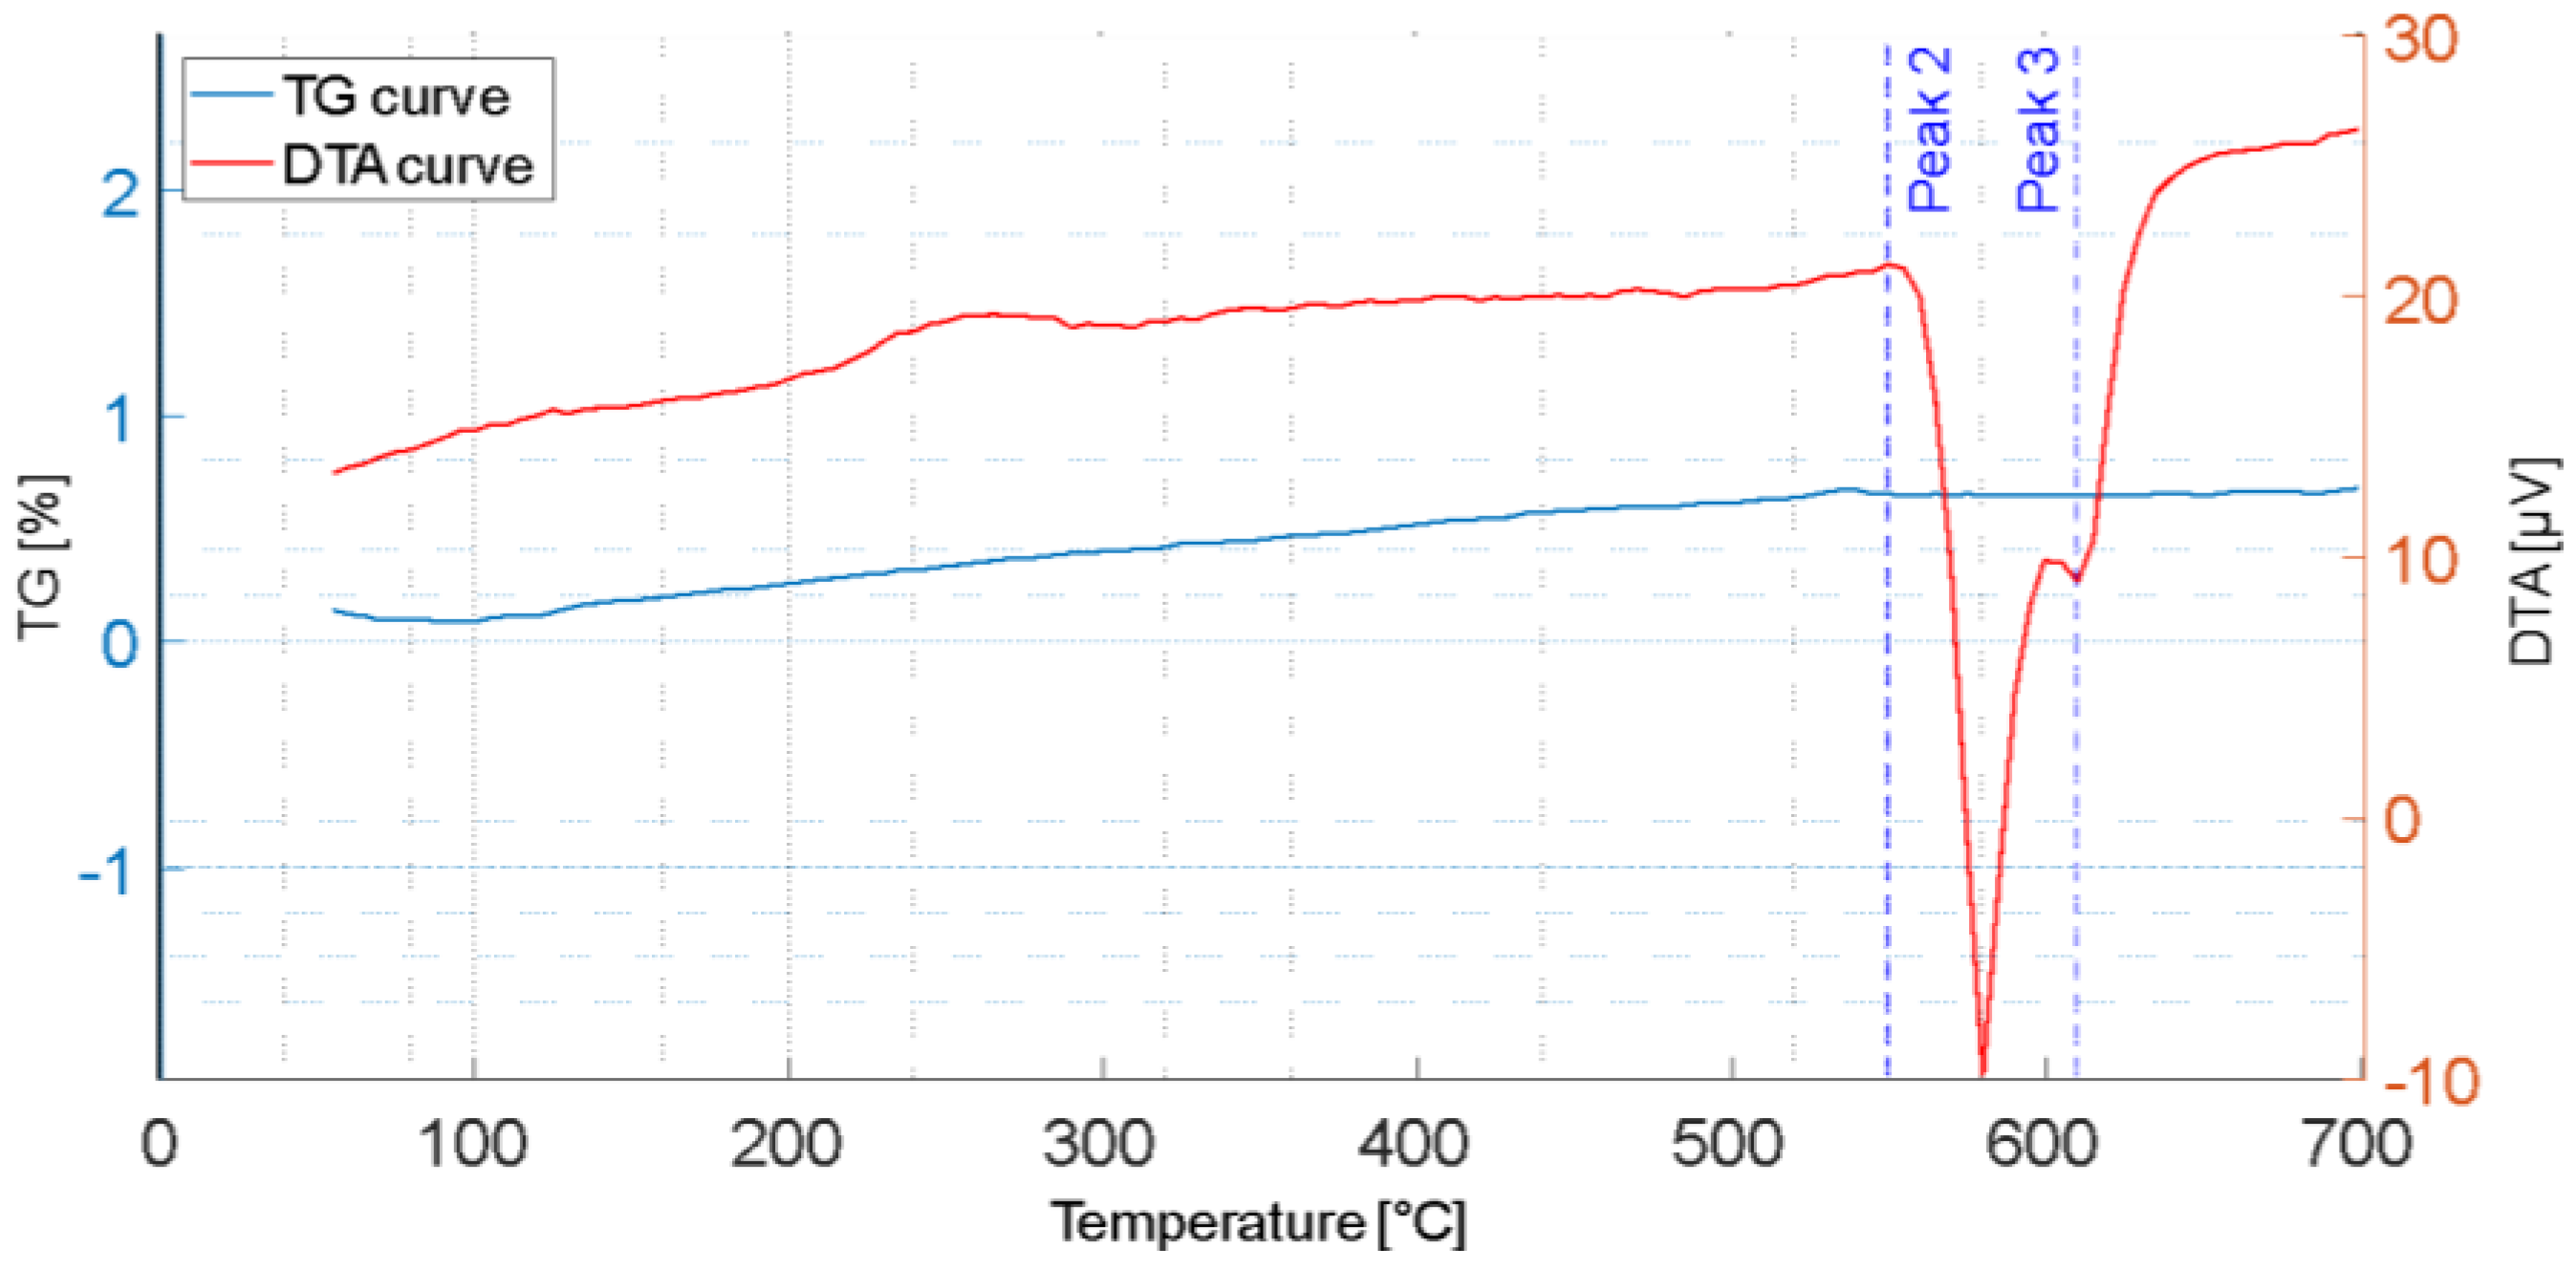
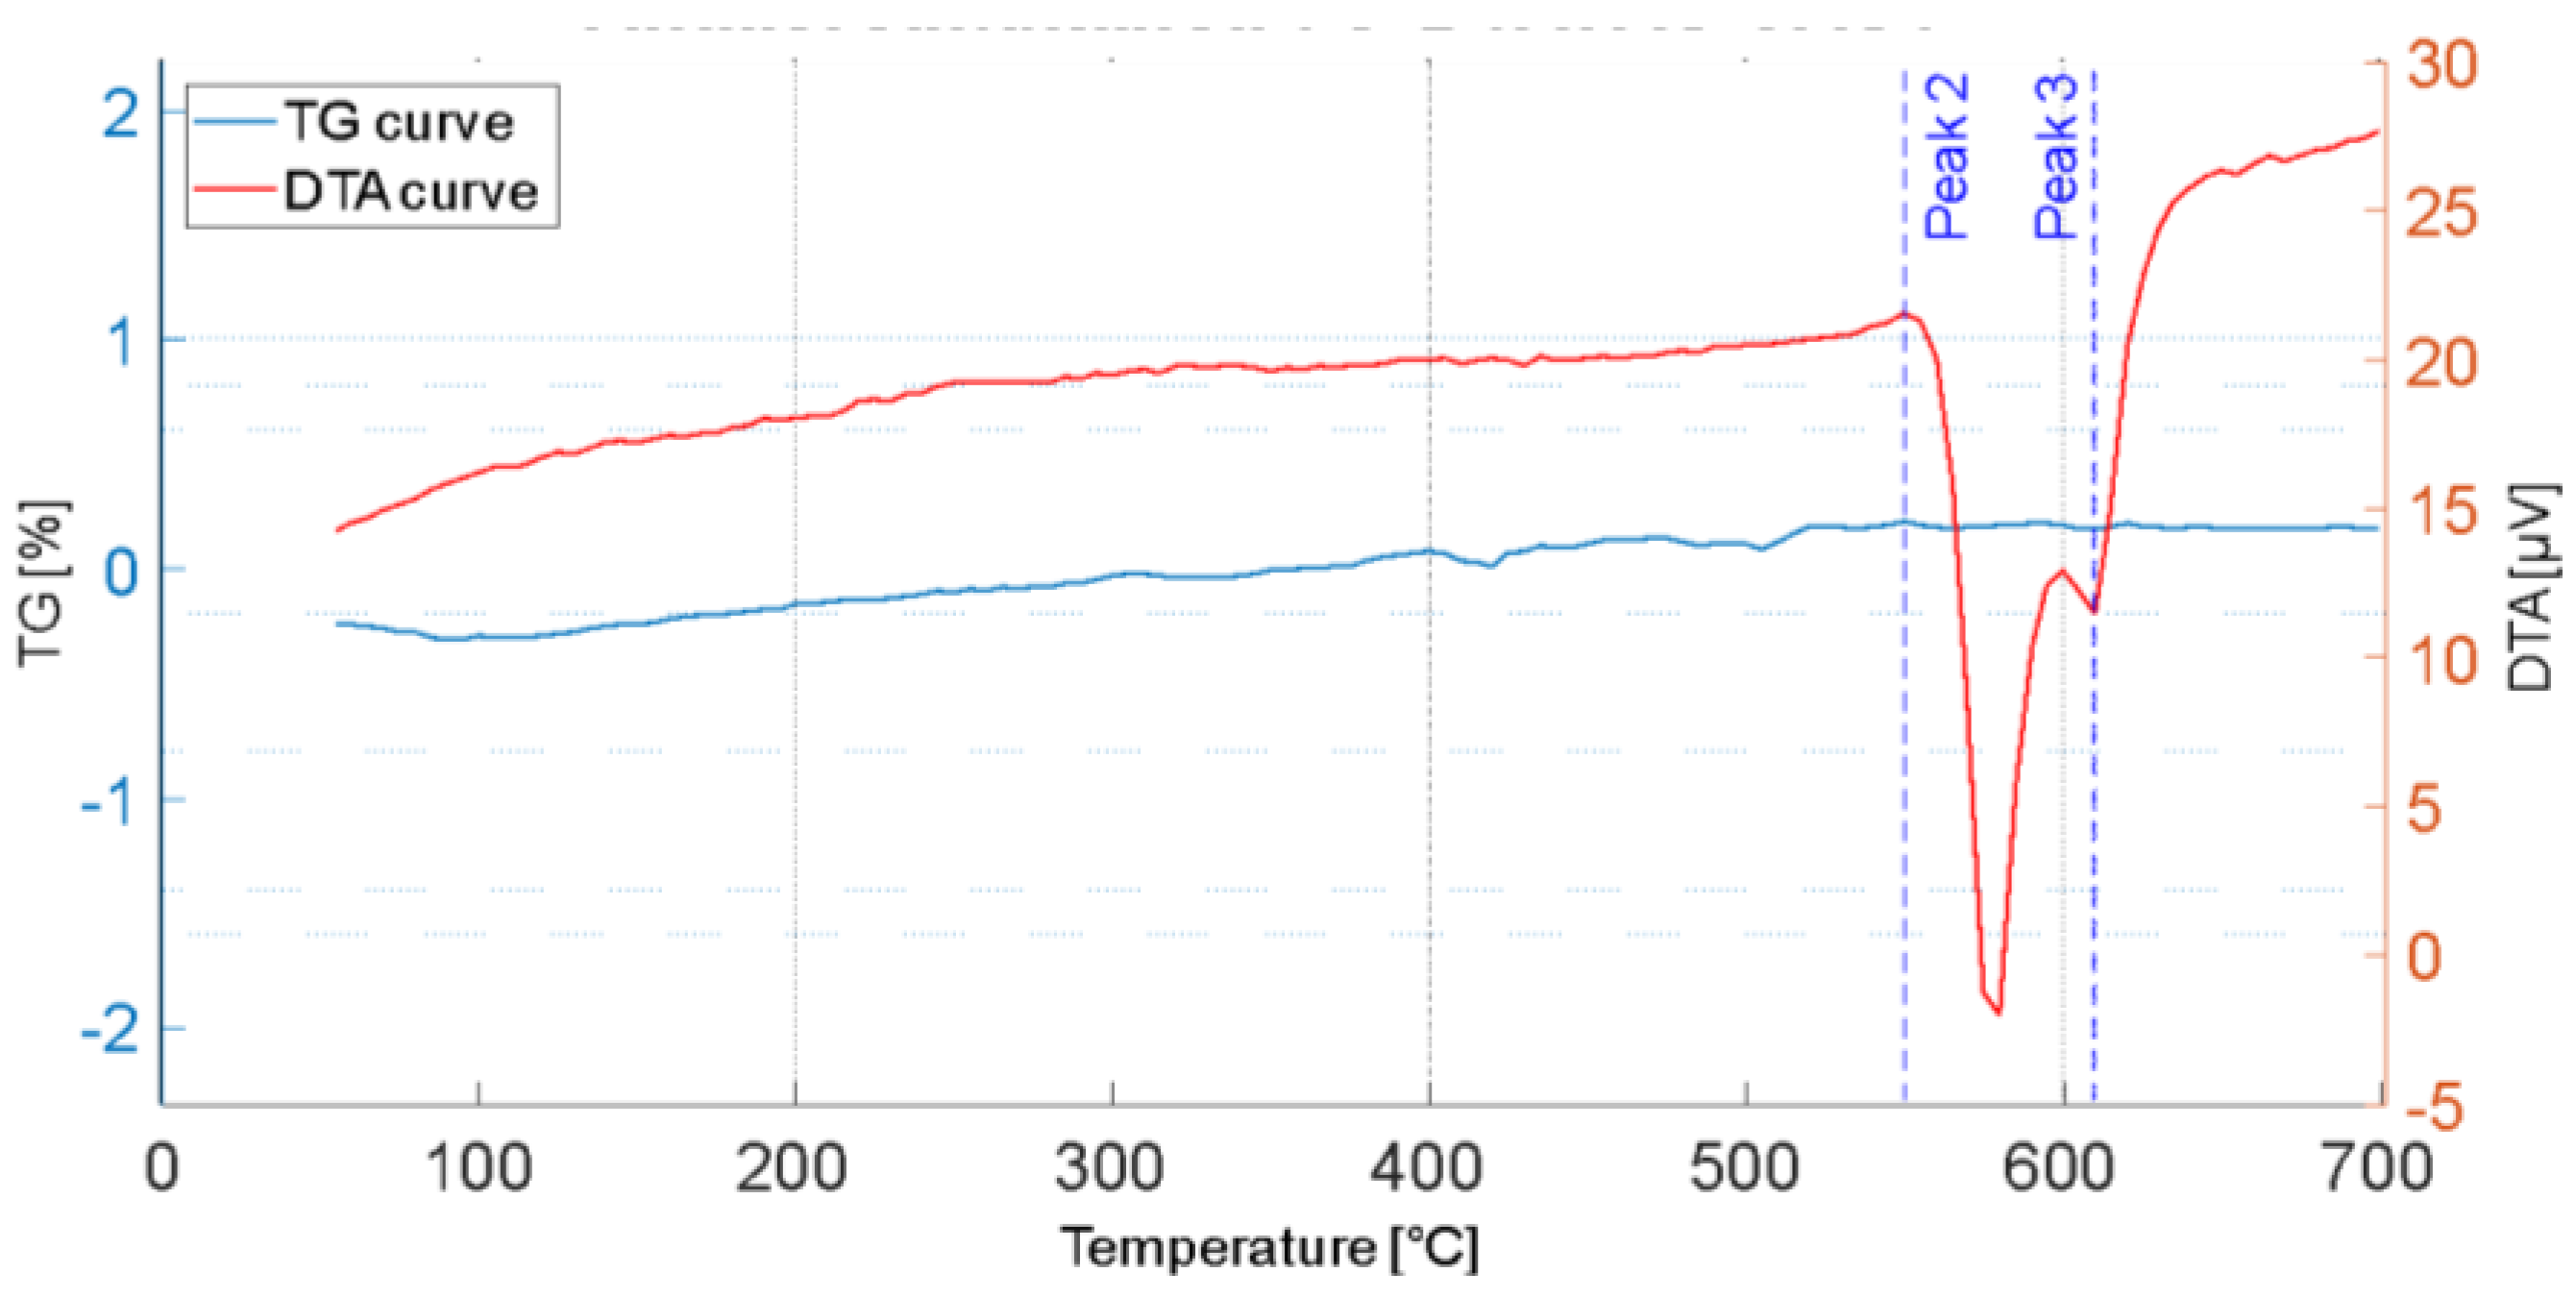
  • The DTA analyses showed that the proposed SHT parameters are effective in dissolving the secondary phases formed during the first solidification, thus enhancing the mechanical properties after the subsequent AA.
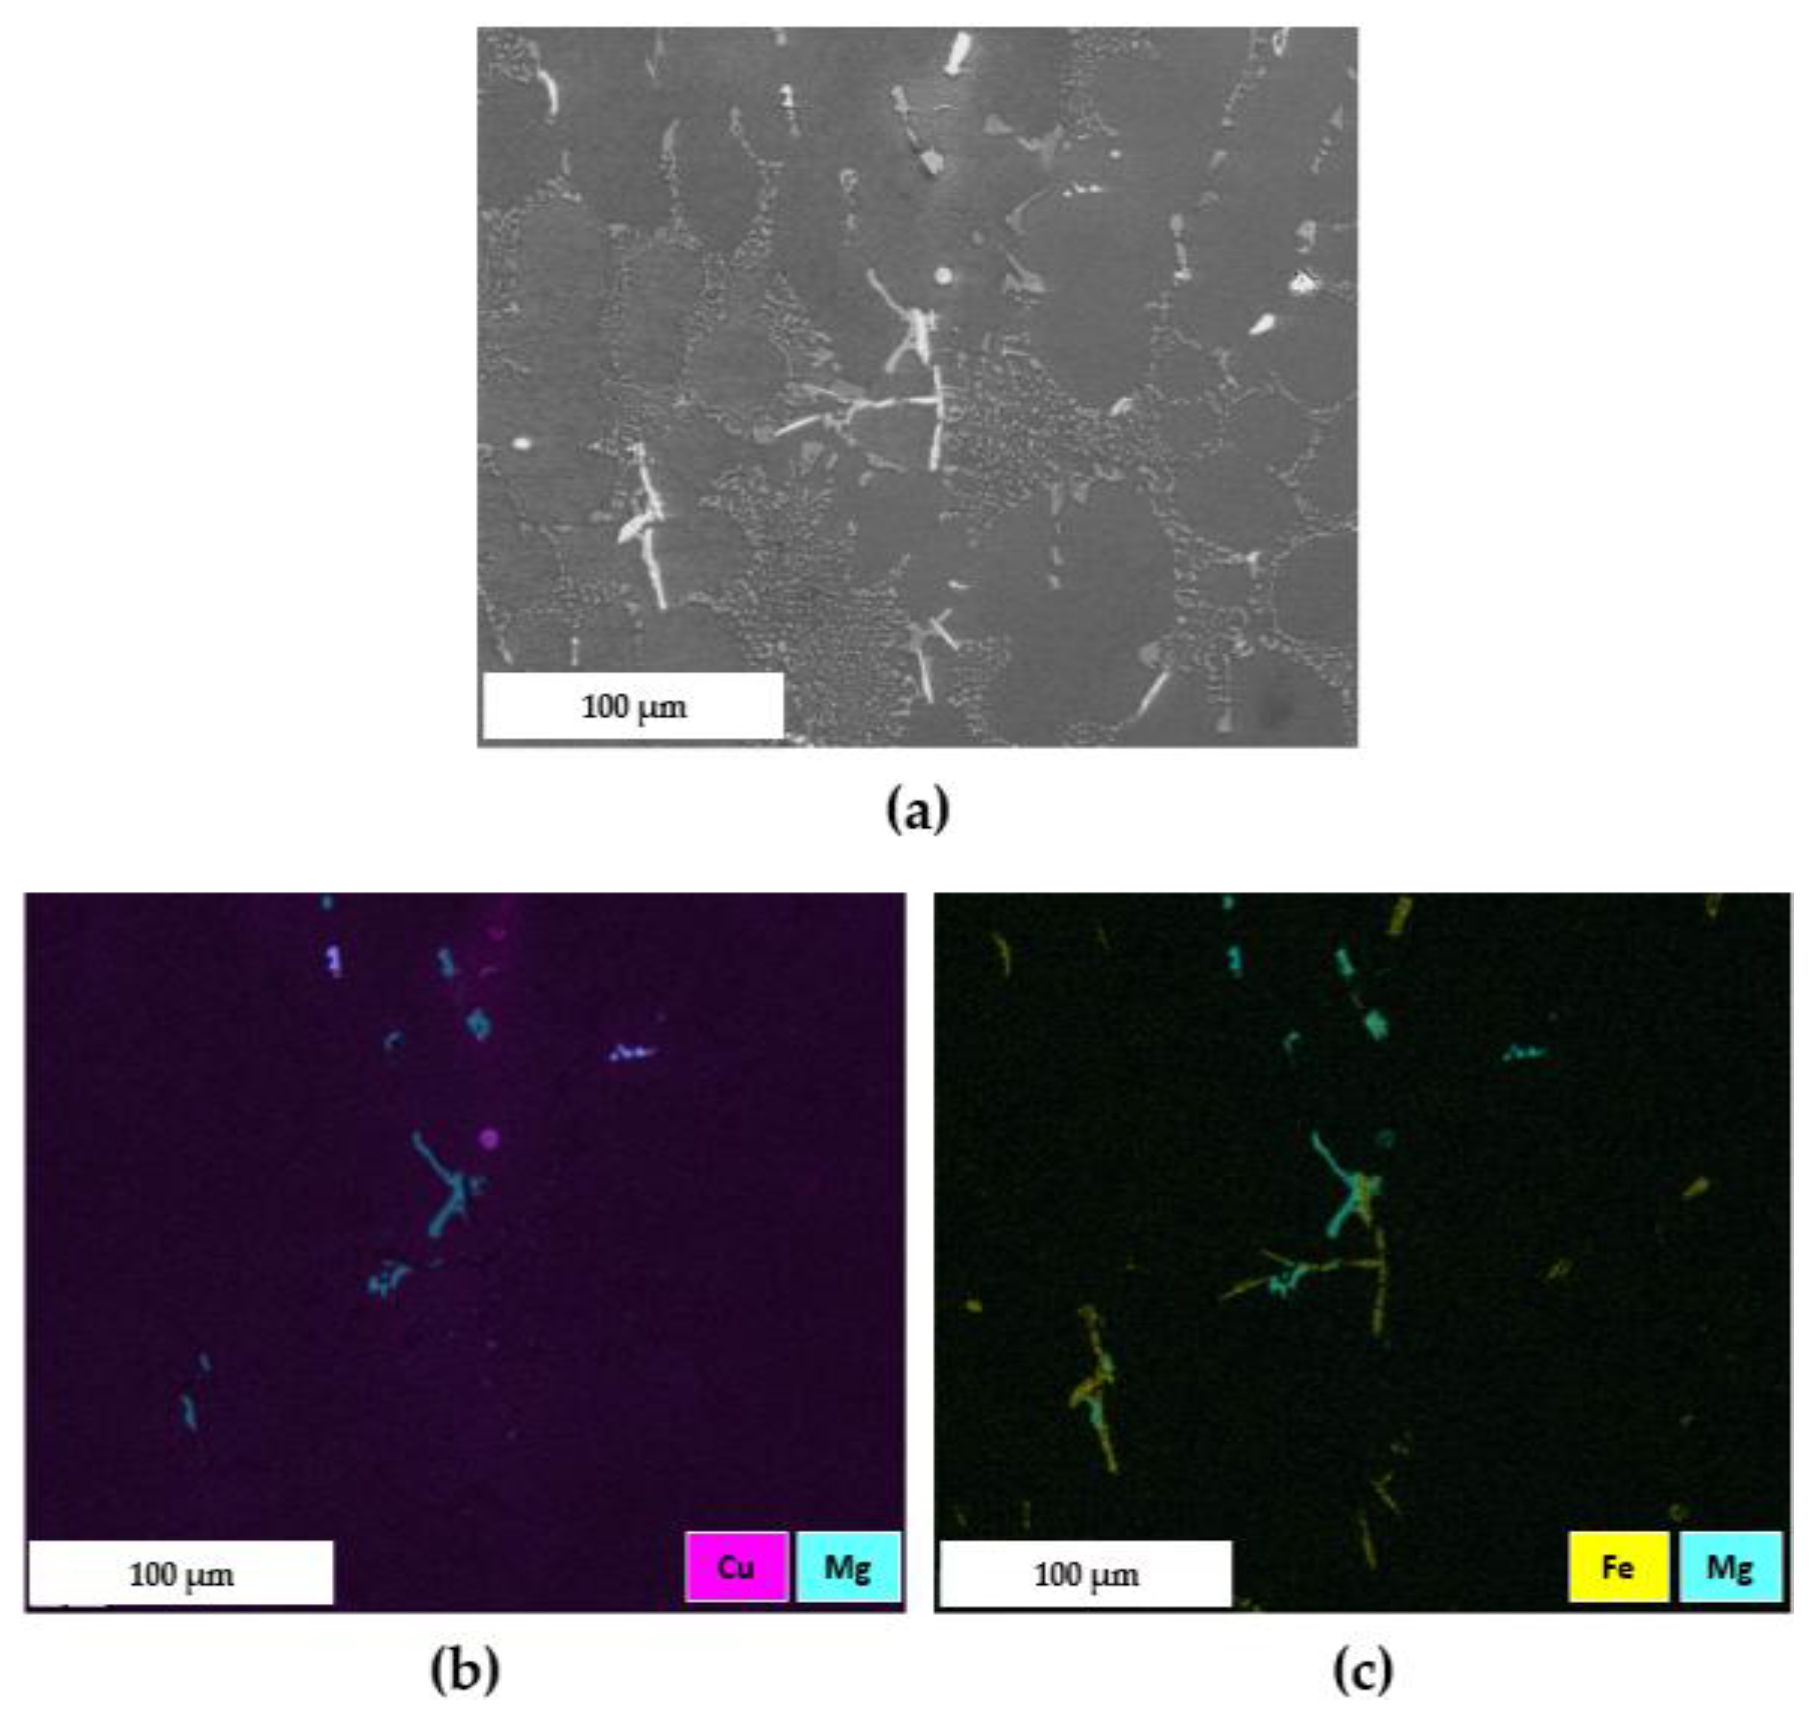
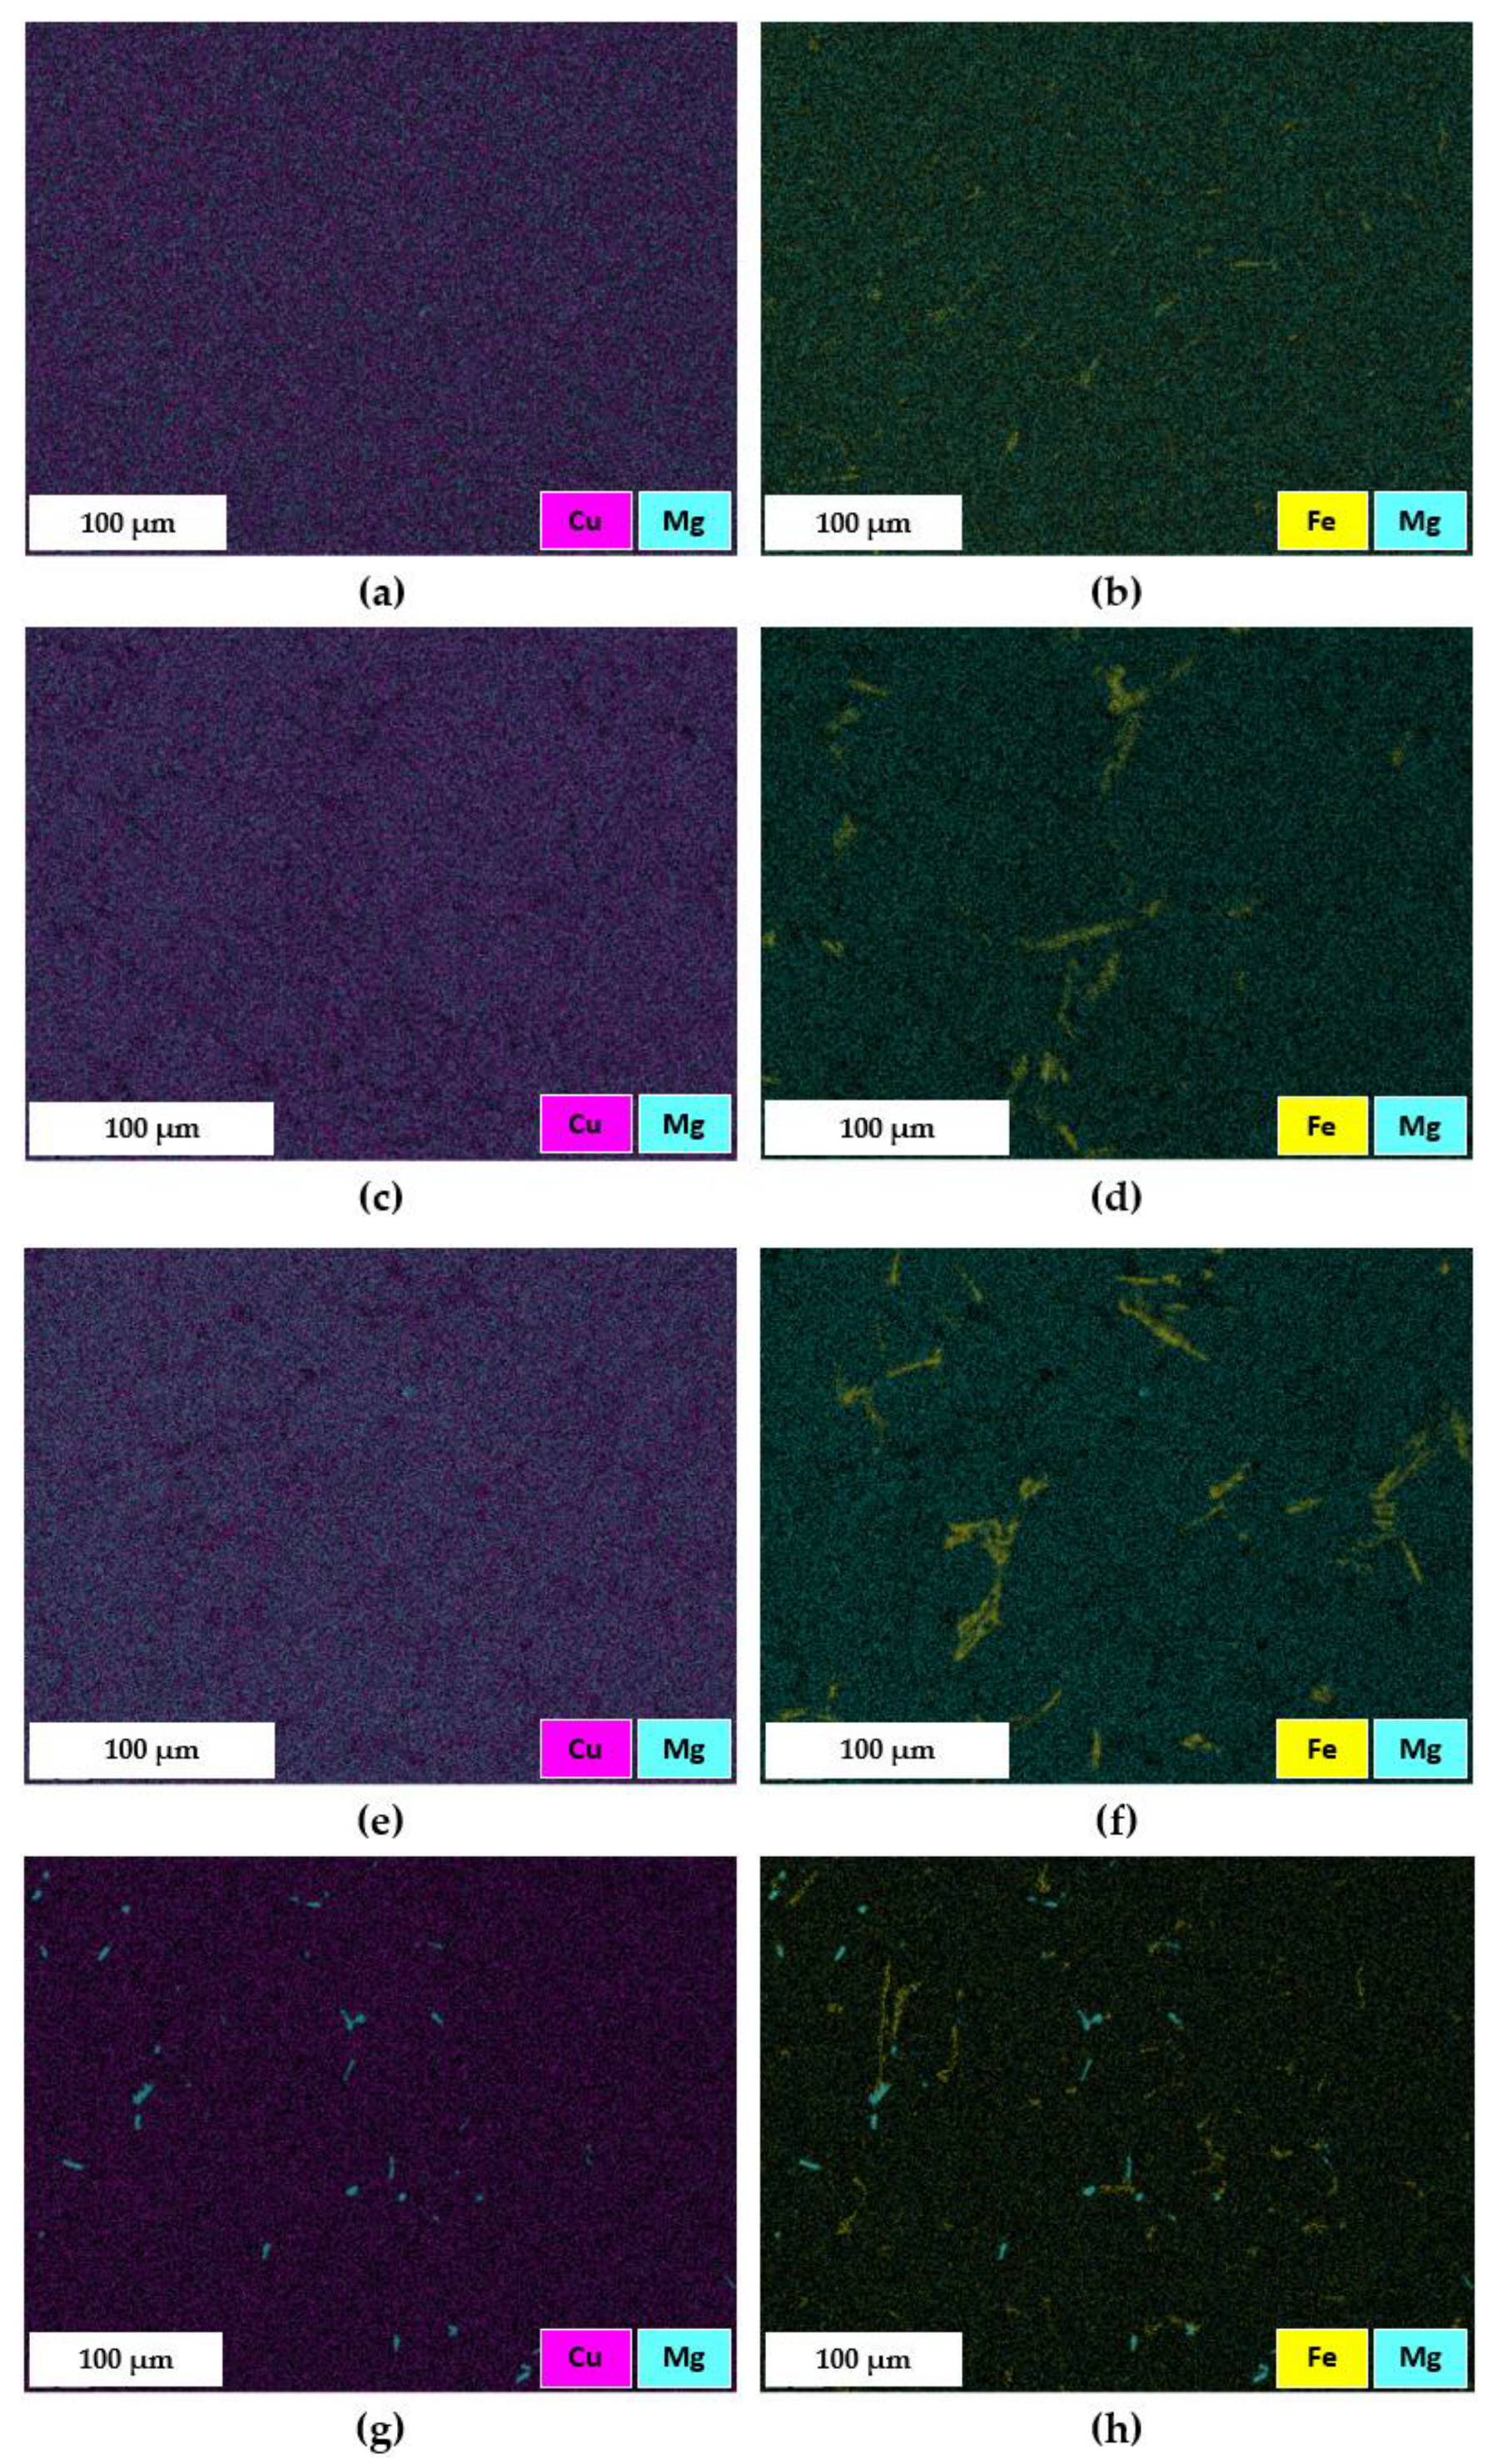
  • The EDS maps proved that the ST4 treatment, carried out at 510 °C for 2 h, caused only a partial dissolution of the π-Al8FeMg3Si6 phase into the α-Al matrix. Nevertheless, the strengthening effect was guaranteed by the dissolution of β (Mg2Si), θ (Al2Cu) or Q (Al5Mg8Cu2Si6) intermetallic phases, thus to the synergic effect of Mg and Cu in the subsequent precipitation hardening during AA.
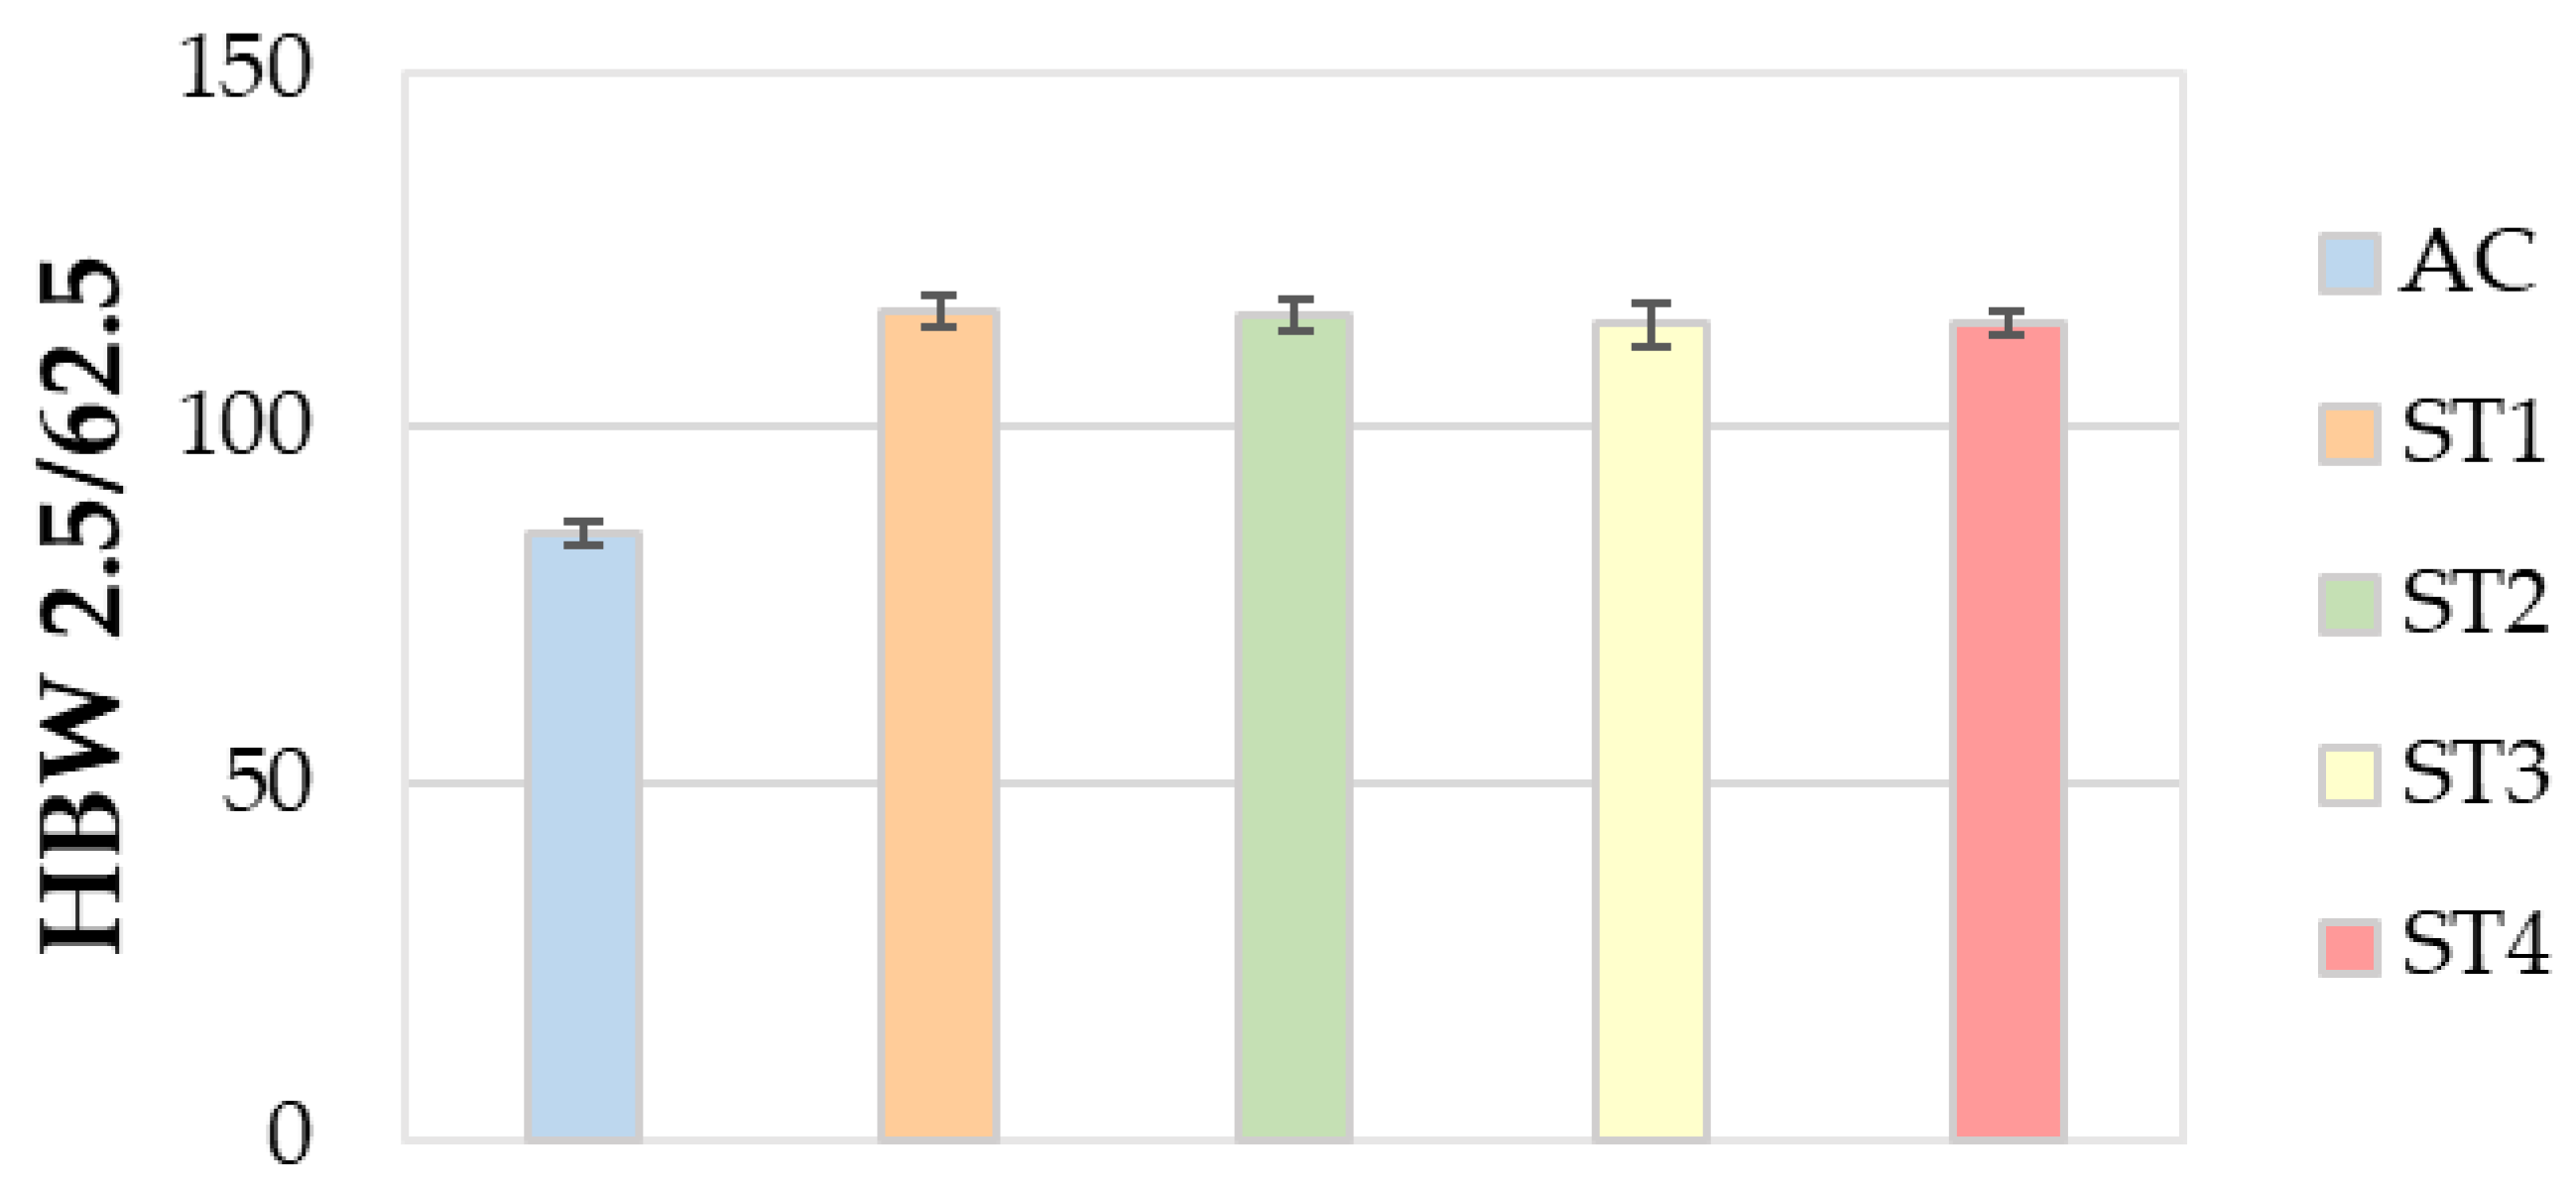
  • Regarding the mechanical properties, the ST4 treatment guarantees a relevant enhancement of both the tensile strength and hardness, without leading to a remarkable decrease in ductility.
  • Finally, the ST4 treatment helps to improve productivity and lower energy and/or gas consumption in furnaces, along with environmental emissions, thanks to the reduction in times and temperatures of solution heat treatment, with respect to the ST1 one performed at 535 °C for 5 h.

Author Contributions

Conceptualization, M.M. and F.B.; methodology, M.M. and F.B.; validation, M.M., L.A., F.B., C.M. and C.S.; formal analysis, M.M., F.B. and C.S.; investigation, L.A., F.B. and C.S.; resources, M.M.; data curation, M.M., L.A. and F.B.; writing—original draft preparation, M.M. and L.A.; writing—review and editing, F.B., C.M. and C.S.; visualization, M.M. and L.A.; supervision, M.M. and C.S.; project administration, M.M.; funding acquisition, M.M. All authors have read and agreed to the published version of the manuscript.

Funding

This research was funded by a FIRD 2023 project of the Department of Engineering of the University of Ferrara, grant number 2023-FAR.L-FIRD_DE_BD_001.

Data Availability Statement

The raw data supporting the conclusions of this article will be made available by the authors upon request.

Acknowledgments

The authors gratefully acknowledge Fonderia San Possidonio srl, represented by Eng. Roberto Spagnolo for the fruitful cooperation and the experimental support during the preparation of the castings investigated in this research work. The authors wish to extend special thanks to Luca Lusvarghi for the support offered by making available the analyzer for DTA and TG analyses. The authors would like to thank the National Recovery and Resilience Plan (NRRP), Mission 04 Component 2 Investment 1.5—NextGenerationEU, Call for tender n. 3277 dated 30 December 2021; Award Number: 0001052 dated 23 June 2022.

Conflicts of Interest

The authors declare no conflicts of interest.

References

  1. Backerud, L.; Chai, G.; Tamminen, J. Solidification Characteristics of Aluminium Alloys: Foundry Alloys 2; Skanaluminium: Stockholm, Sweden, 1990; ISBN 0874331196/9780874331196. [Google Scholar]
  2. Li, Z.; Samuel, A.M.; Samuel, F.H. Effect of alloying elements on the segregation and dissolution of CuAl2 phase in Al-Si-Cu 319 alloys. J. Mater. Sci. 2003, 38, 1203–1218. [Google Scholar] [CrossRef]
  3. Samuel, E.H.; Samuel, A.M.; Doty, H.W. Factors controlling the type and morphology of Cu-containing phases in 319 Al alloy. AFS Trans. 1996, 30, 893–901. [Google Scholar]
  4. Samuel, A.M.; Ouellet, P.; Samuel, F.H.; Doty, H.W. Microstructural interpretation of thermal analysis of commercial 319 Al alloy with Mg and Sr additions. AFS Trans. 1997, 105, 951–962. [Google Scholar]
  5. Stunovà, B.B. Strontium as a structure modifier for non-binary Al–Si alloy. Acta Polytech. 2012, 52, 26–32. [Google Scholar] [CrossRef] [PubMed]
  6. Wang, D.; Zhang, H.; Han, X.; Shao, B.; Li, L.; Cui, J. The analysis of strontium modification on microstructure and mechanical properties of Al-25%Mg2Si in situ composite. J. Mater. Eng. Perform. 2017, 26, 4415–4423. [Google Scholar] [CrossRef]
  7. Sjölander, E.; Seiffedine, S. The heat treatment of Al-Si-Cu-Mg casting alloys. J. Mater. Process. Technol. 2010, 210, 1249–1259. [Google Scholar] [CrossRef]
  8. Sjölander, E.; Seiffedine, S. Optimization of solution treatment of cast Al-7Si-0.3Mg and Al-8Si-3Cu-0.5Mg alloys. Metall. Mater. Trans. A 2013, 45, 1916–1927. [Google Scholar] [CrossRef]
  9. Shivkumar, S.; Wang, L.; Apelian, D. Molten metal processing of advanced cast aluminum alloys. JOM 1991, 43, 26–32. [Google Scholar] [CrossRef]
  10. Cao, X.; Campbell, J. Morphology of β-Al5FeSi phase in Al-Si cast alloys. Mater. Trans. 2006, 47, 1303–1312. [Google Scholar] [CrossRef]
  11. Mahta, M.; Emamy, M.; Daman, A.; Keyvani, A.; Campbell, J. Precipitation of Fe-rich intermetallics in Cr- and Co-modified A413 alloy. Int. J. Cast Met. Res. 2005, 18, 73–79. [Google Scholar] [CrossRef]
  12. Mondolfo, L.F. Aluminum Alloys: Structure and Properties; Butterworth: London, UK, 1976; ISBN 1483144828/9781483144825. [Google Scholar]
  13. Rometsch, P.A.; Arnberg, L.; Zhang, D.L. Modelling dissolution of Mg2Si and homogenisation in Al–Si–Mg casting alloys. Int. J. Cast Met. Res. 1999, 12, 197–220. [Google Scholar] [CrossRef]
  14. Dons, A.L.; Pedersen, L.; Brusethaug, S. Modelling the microstructure of heat treated AlSi foundry alloys. Aluminium 2000, 76, 294–297. [Google Scholar]
  15. Taylor, J.A.; St John, D.H.; Barresi, J.; Couper, M.J. Influence of Mg content on the microstructure and solid solution chemistry of Al–7%Si–Mg casting alloys during solution treatment. Mater. Sci. Forum 2000, 331–337, 277–282. [Google Scholar] [CrossRef]
  16. Wang, Q.G.; Davidson, C.J. Solidification and precipitation behaviour of Al–Si–Mg casting alloys. J. Mater. Sci. 2001, 36, 739–750. [Google Scholar] [CrossRef]
  17. Samuel, A.M.; Gauthier, J.; Samuel, F.H. Microstructural aspects of the dissolution and melting of Al2Cu phase in Al–Si alloys during solution heat treatment. Metall. Mater. Trans. A 1996, 27, 1785–1798. [Google Scholar] [CrossRef]
  18. Javidani, M.; Larouche, D.; Chen, X.G. Evolution of intermetallic phases in multicomponent Al-Si foundry alloys containing different Cu, Mg and Fe content. AFS Trans. 2014, 14, 1–9. [Google Scholar]
  19. Crowell, N.; Shivkumar, S. Solution treatment effects in cast Al–Si–Cu alloys. AFS Trans. 1995, 107, 721–726. [Google Scholar]
  20. ISO 6892-1:2019; Metallic Materials—Tensile Testing—Part 1: Method of Test at Room Temperature. ISO: Geneva, Switzerland, 2019.
  21. ASTM E8/E8M-21; Standard Test Methods for Tension Testing of Metallic Materials. ASTM International: West Conshohocken, PA, USA, 2021. [CrossRef]
  22. Stefanescu, D.M. Thermal analysis—Theory and applications in metalcasting. Int. J. Met. 2015, 9, 7–22. [Google Scholar] [CrossRef]
  23. Djurdjevic, M.B.; Odanovic, Z.; Talijan, N. Characterization of the solidification path of AlSi5Cu(1–4 wt.%) alloys using cooling curve analysis. Aluminum: Shaping and Forming. JOM 2011, 63, 51–57. [Google Scholar] [CrossRef]
  24. Fortini, A.; Lattanzi, L.; Merlin, M.; Garagnani, G.L. Comprehensive evaluation of modification level assessment in Sr-modified aluminium alloys. Int. J. Met. 2018, 12, 697–711. [Google Scholar] [CrossRef]
  25. Djurdjevic, M.B.; Vicario, I.; Huber, G. Review of thermal analysis applications in aluminium casting plants. Rev. Metal. 2014, 50, e021. [Google Scholar] [CrossRef]
  26. ISO 6506-1:2014; Metallic Materials—Brinell Hardness Test—Part 1: Test Method. ISO: Geneva, Switzerland, 2014.
  27. Boettinger, W.J.; Kattner, U.R.; Moon, K.W.; Perepezko, J.H. Chapter Five: DTA and heat-flux DSC measurements of alloy melting and freezing. In Methods for Phase Diagram Determination; Zhao, J.-C., Ed.; Elsevier Ltd.: Amsterdam, The Netherlands, 2007; pp. 151–221. ISBN 978-0-08-044629-5. [Google Scholar]
  28. Wang, Q.G. Microstructural effects on the tensile and fracture behavior of aluminum casting alloys A356/357. Metall. Mater. Trans. A 2003, 34, 2887–2899. [Google Scholar] [CrossRef]
  29. Shabestari, S.G.; Ghodrat, S. Assessment of modification and formation of intermetallic compounds in aluminum alloy using thermal analysis. Mater. Sci. Eng. A 2007, 467, 150–158. [Google Scholar] [CrossRef]
  30. Apelian, D.; Shivkumar, S.; Sigworth, G. Fundamental aspects of heat treatment of cast Al–Si–Mg alloys. AFS Trans. 1989, 137, 727–742. [Google Scholar]
  31. Choi, S.W.; Kim, Y.M.; Lee, K.M.; Cho, H.S.; Hong, S.K.; Kim, Y.C.; Kang, C.S.; Kumai, S. The effects of cooling rate and heat treatment on mechanical and mechanical and thermal characteristics of Al–Si–Cu–Mg foundry alloys. J. Alloys Compd. 2014, 617, 654–659. [Google Scholar] [CrossRef]
  32. Lasa, L.; Rodriguez-Ibabe, J.M. Evolution of the main intermetallic phases in Al-Si-Cu-Mg casting alloys during solution treatment. J. Mater. Sci. 2004, 39, 1343–1355. [Google Scholar] [CrossRef]
  33. Ganesh, M.R.S.; Reghunath, N.; Levin, M.J.; Prasad, A.; Doondi, S.; Shankar, K.V. Strontium in Al–Si–Mg Alloy: A Review. Met. Mater. Int. 2022, 28, 1–40. [Google Scholar] [CrossRef]
  34. Javidani, M. Effect of Cu, Mg and Fe on Solidification Processing and Microstructure Evolution of Al-7Si Based Foundry Alloys. Ph.D. Thesis, Université Laval, Québec, QC, Canada, 2015. Available online: http://hdl.handle.net/20.500.11794/26146 (accessed on 16 January 2025).
  35. Li, Y.J.; Brusethaug, S.; Olsen, A. Influence of Cu on the Mechanical Properties and Precipitation Behavior of AlSi7Mg0.5 Alloy During Aging Treatment. Scr. Mater. 2006, 54, 99–103. [Google Scholar] [CrossRef]
  36. Klančnik, G.; Medved, J.; Mrvar, P. Differential Thermal Analysis (DTA) and Differential Scanning Calorimetry (DSC) as a Method of Material Investigation. RMZ Mater. Geoenviron. 2010, 57, 127–142. [Google Scholar]
  37. Beder, M.; Akçay, S.B.; Varol, T.; Çuvalci, H. The Effect of Heat Treatment on the Mechanical Properties and Oxidation Resistance of AlSi10Mg Alloy. Arab. J. Sci. Eng. 2024, 49, 15335–15346. [Google Scholar] [CrossRef]
  38. Hunt, W.H., Jr.; Brockenbrough, J.R.; Magnusen, P.E. An Al-Si-Mg composite model system: Microstructural effects on deformation and damage evolution. Scr. Metall. Mater. 1991, 25, 15–20. [Google Scholar] [CrossRef]
  39. Sokolowski, J.H.; Sun, X.C.; Byczynski, G.; Northwood, D.O.; Penrod, D.E.; Thomas, R.; Esseltine, A. Removal of Copper-Phase Segregation and the Subsequent Improvement in Mechanical Properties of Cast 319 Aluminum Alloys by a Two-Stage Solution Heat Treatment. J. Mater. Process. Technol. 1995, 53, 385–392. [Google Scholar] [CrossRef]
  40. Sangchan, A.; Plookphol, T.; Wannasin, J.; Wisutmethangoon, S. Effect of Strontium on Microstructure and Mechanical Properties of Semi-Solid A356 Al Alloy. Adv. Mater. Res. 2014, 893, 353–356. [Google Scholar] [CrossRef]
Figure 1. Example of casting fabricated for the purposes of the present investigation. The tensile specimens were drawn from the zone enclosed in the black-dotted box.
Metals 15 00742 g001
Figure 2. Representative solidification curve (in blue) together with calculated first (in red), second (in purple), and third (in green) derivative curves of the AlSi7Cu0.5Mg0.3 alloy.
Metals 15 00742 g002
Figure 3. LM micrograph of the AlSi7Cu0.5Mg0.3 alloy in the as-cast condition. White and black arrows indicate the α-Al phase and the α-Al + β-Si eutectic structure, respectively.
Metals 15 00742 g003
Figure 4. Mean values of SDAS measured on tensile samples in the as-cast and T6 heat-treated conditions. Standard deviations are reported as error bars.
Metals 15 00742 g004
Figure 5. Three-parameter lognormal distributions of (a) Deq and (b) AR of the eutectic Si particles.
Metals 15 00742 g005
Figure 6. LM micrograph of the microstructure of the AlSi7Cu0.5Mg0.3 alloy in the as-cast condition. The red, dark orange, bright orange, yellow, green, and blue arrows indicate the β-Al5FeSi, α-Al15(Fe, Mn, Cu)3Si2, Al2CuMg, π-Al8FeMg3Si6, θ-Al2Cu, and Q-Al5Mg8Cu2Si6 phases, respectively.
Metals 15 00742 g006
Figure 7. (a) BSE micrograph of the zone in Figure 6; (b) layered image of X-ray maps of Cu and Mg; (c) layered image of X-ray maps of Fe and Mg.
Metals 15 00742 g007
Figure 8. BSE micrographs of the alloy in the (a) ST1, (b) ST2, (c) ST3, and (d) ST4 conditions. The red and orange arrows indicate the Fe-rich β-Al5FeSi and α-Al15(Fe, Mn, Cu)3Si2 secondary phases, respectively, whereas the yellow ones show the π-Al8FeMg3Si6 secondary phase.
Metals 15 00742 g008
Figure 9. Layered images of X-ray maps of the zones in Figure 8: (a,b) Cu-Mg and Fe-Mg maps of samples in ST1 condition; (c,d) Cu-Mg and Fe-Mg maps of samples in ST2 condition; (e,f) Cu-Mg and Fe-Mg maps of samples in ST3 condition; (g,h) Cu-Mg and Fe-Mg maps of samples in ST4 condition.
Metals 15 00742 g009
Figure 10. TG-DTA curves of the sample in the as-cast condition.
Metals 15 00742 g010
Figure 11. TG-DTA curves of the sample in ST2 condition.
Metals 15 00742 g011
Figure 12. TG-DTA curves of the sample in ST3 condition.
Metals 15 00742 g012
Figure 13. TG-DTA curves of the sample in ST4 condition.
Metals 15 00742 g013
Figure 14. SE micrographs at low magnification of the fracture surfaces of tensile specimens in (a) ST1 and (b) ST4 conditions.
Metals 15 00742 g014
Figure 15. SE micrographs at high magnification showing the details of secondary cracks on the fracture surfaces of tensile specimens in (a) ST1 and (b) ST4 conditions.
Metals 15 00742 g015
Figure 16. SE micrographs at high magnification showing the details of cracked eutectic Si particles on the fracture surfaces of tensile specimens in (a) ST1 and (b) ST4 conditions.
Metals 15 00742 g016
Figure 17. SE micrographs showing the details of brittle transgranular fractures on the fracture surfaces of tensile specimens in (a) ST1 and (b) ST4 conditions.
Metals 15 00742 g017
Figure 18. (a) BSE micrograph highlighting the presence of an interdendritic shrinkage porosity in a tensile specimen in ST1 condition; (bd) punctual EDS spectra of the intermetallic phases detected within the shrinkage porosity.
Metals 15 00742 g018
Figure 19. (a) BSE micrograph highlighting the presence of an interdendritic shrinkage porosity in a tensile specimen in ST4 condition; (bd) punctual EDS spectra of the intermetallic phases detected within the shrinkage porosity.
Metals 15 00742 g019
Figure 20. Mean values of UTS measured on tensile specimens in the as-cast and T6 heat-treated conditions. Standard deviations are reported as error bars. In the graph, the AC condition was also considered and taken as a reference.
Metals 15 00742 g020
Figure 21. Mean values of YS measured on tensile specimens in the as-cast and T6 heat-treated conditions. Standard deviations are reported as error bars. In the graph, the AC condition was also considered and taken as a reference.
Metals 15 00742 g021
Figure 22. Mean values of A5% measured on tensile specimens in the AC and the proposed solution heat treatments. Standard deviations are reported as error bars. In the graph, the AC condition was also considered and taken as a reference.
Metals 15 00742 g022
Figure 23. Mean values of Brinell hardness measured on tensile specimens in the as-cast and T6 heat-treated conditions. Standard deviations are reported as error bars. In the graph, the AC condition was also considered as a reference.
Metals 15 00742 g023
Table 1. Chemical composition (wt. %) of the secondary AlSi7Cu0.5Mg0.3 alloy used in this study.
AlSiCuMgFeMnTiSrCrB
Balance6.820.440.340.220.110.0430.0260.00910.0024
Table 2. Parameters of the investigated heat treatments, together with the corresponding designation.
DesignationSolution
Heat Treatment
QuenchingArtificial
Aging
ST1535 °C—5 h70 °C165 °C—4 h
ST2535 °C—2 h70 °C165 °C—4 h
ST3510 °C—4 h70 °C165 °C—4 h
ST4510 °C—2 h70 °C165 °C—4 h
Table 3. Mass (in mg) of the samples used for the TG-DTA simultaneous thermal analysis.
ACST2ST3ST4
62.784.062.065.1
Table 4. Solidification sequence of the different phases, detected for the AlSi7Cu0.5Mg0.3 alloy by thermal analysis.
TransformationTemperature [°C]
(1) Liquid → α-Al 625–620 (liquidus)
(2) Liquid → α-Al + β-Si + β-Al5FeSi + α-Al15(Fe, Mn, Cu)3Si2570–565
(3) Liquid → α-Al + β-Si + π-Al8FeMg3Si6 + β-Mg2Si540
(4) Liquid → α-Al + β-Si + θ-Al2Cu + Q-Al5Mg8Cu2Si6515–510 (solidus)
Disclaimer/Publisher’s Note: The statements, opinions and data contained in all publications are solely those of the individual author(s) and contributor(s) and not of MDPI and/or the editor(s). MDPI and/or the editor(s) disclaim responsibility for any injury to people or property resulting from any ideas, methods, instructions or products referred to in the content.

