Article

Life Prediction of Crack Growth for P92 Steel Under Strain-Controlled Creep–Fatigue Conditions Using a Sharp Notched Round Bar Specimen

1
Advanced Comprehensive Research Organization, Teikyo University, 2-21-1 Kaga, Itabashi-ku, Tokyo 173-0003, Japan
2
Department of Nano Mechanics, Tohoku University, 6-6-01 Aoba, Aramaki, Aoba-ku, Sendai 980-8579, Japan
3
Department of Mechanical Engineering, Nihon University, 1 Nakahara Tokusada Kooriyama, Fukushima 963-8507, Japan
4
Fracture and Reliability Research Institute at the Research Period, Tohoku University, 6-6-11 Aoba, Aramaki, Aoba-ku, Sendai 980-8579, Japan
*
Author to whom correspondence should be addressed.
Current address: Independent Researcher, 2 Chome Nankoudai, Fukushima 960-8143, Japan.
Current address: Shiroto, Watari-cho, Watari-gun, Miyagi 989-2351, Japan.
Metals 2025, 15(7), 737; https://doi.org/10.3390/met15070737
Submission received: 15 April 2025 / Revised: 30 May 2025 / Accepted: 20 June 2025 / Published: 30 June 2025
(This article belongs to the Special Issue Creep and Fatigue Behavior of Alloys)

Abstract

Testing and the estimation methods for predicting the life of crack initiation and crack growth for P92 steel using a circular sharp notched round bar specimen (CNS) under strain-controlled creep and fatigue conditions have been reported previously. A unique estimation method for the cycle-sequential characteristics of tensile and compressive peak stresses is proposed; specifically, the nominal stress range σ n e t = ( σ m a x σ m i n ) n e t and the measurement of crack length using the direct current electric potential drop (DCPD) method were adopted. This method was effective in specifying the failure life and crack initiation life by verifying the crack growth length. However, to show the universality of these results, it is important to compare the experimental results obtained under strain-controlled creep and fatigue conditions with those obtained under stress-controlled creep and fatigue conditions and with those for smooth specimens estimated based on the linear and nonlinear damage summation rule. Furthermore, it may also be important to compare these results with those of smooth specimens estimated based on the Manson–Coffin law when the failure life is fatigue-dominant. Considering these aspects, detailed experiments and analyses were systematically conducted for P92 steel in this study, and the above comparisons were conducted. The results aid in achieving a unified understanding of the law of fracture life, including those under stress- and strain-controlled creep and fatigue conditions.

1. Introduction

In a previous study, we established tests and estimation methods for predicting the life of crack initiation and crack growth for P92 steel using a sharp circular notched round bar specimen (CNS) under strain-controlled creep and fatigue conditions [1]. A unique estimation method on the cycle-sequential characteristics of the tensile and compressive peak stress was proposed; specifically, the nominal stress range σ n e t = ( σ m a x σ m i n ) n e t and measurement of crack length using the direct current electric potential drop (DCPD) method were adopted for the first time, and the validity was partly verified for P92 steel [1] and the Ni-base alloy, Alloy617 [2]. Here, σ n e t denotes the nominal stress, that is, the net section stress for the initial notched specimen that does not include the crack growth length [1]; and σ n e t , m a x , and σ n e t , m i n are the maximum and minimum nominal stresses of each strain cycle, respectively. This method enabled determination of the failure life and crack initiation life by verifying the crack growth length [1,2].
The sharp notched specimen defined in this study has a stress singularity equivalent to that for a crack, that is, 1 / r [3]; the notch opening angle is less than 80 degrees [3]. The validity of using this specimen was shown in ASTME1457-19 [4]. Thus, when a fatigue pre-crack cannot be introduced, a sharp notched specimen may be available [3,4].
However, to show the universality of these results, it is necessary to investigate the effect of specimen size and strain amplitude on the failure mechanism and life. Furthermore, it is important to compare the experimental results obtained under strain-controlled creep and fatigue conditions with those obtained under stress-controlled creep and fatigue conditions [5,6], and also with those for smooth specimens estimated based on the linear and nonlinear damage summation rule [7,8,9,10,11,12,13,14,15]. This is because, for a sharp notched specimen, the typical crack growth behaviors [1] affect the failure life.
We have proposed the method of predicting the failure life under creep and fatigue conditions by clarifying whether failure life is dominated by the time-dependent failure mechanism, which concerns creep failure, the cycle-dependent failure mechanism, which concerns fatigue failure, or an interactive failure mechanism [6]. However, since this method is a unique theory [6], it will be important to link the results obtained from this method with the widely used linear and nonlinear damage summation rule [7,8,9,10,11,12,13,14,15] from the viewpoint of engineering significance. In particular, when fatigue life is dominated by a cycle-dependent mechanism, it may be also important to compare the results with those of smooth specimens estimated based on the commonly used Manson–Coffin law [16,17] when the failure life is fatigue-dominant.
In this study, considering these aspects, detailed experiments and analyses were systematically conducted for P92 steel using a sharp notched specimen, and the above comparisons were conducted. Creep under strain-controlled conditions is defined with respect to the strain holding process for consistency with that under stress-controlled conditions.

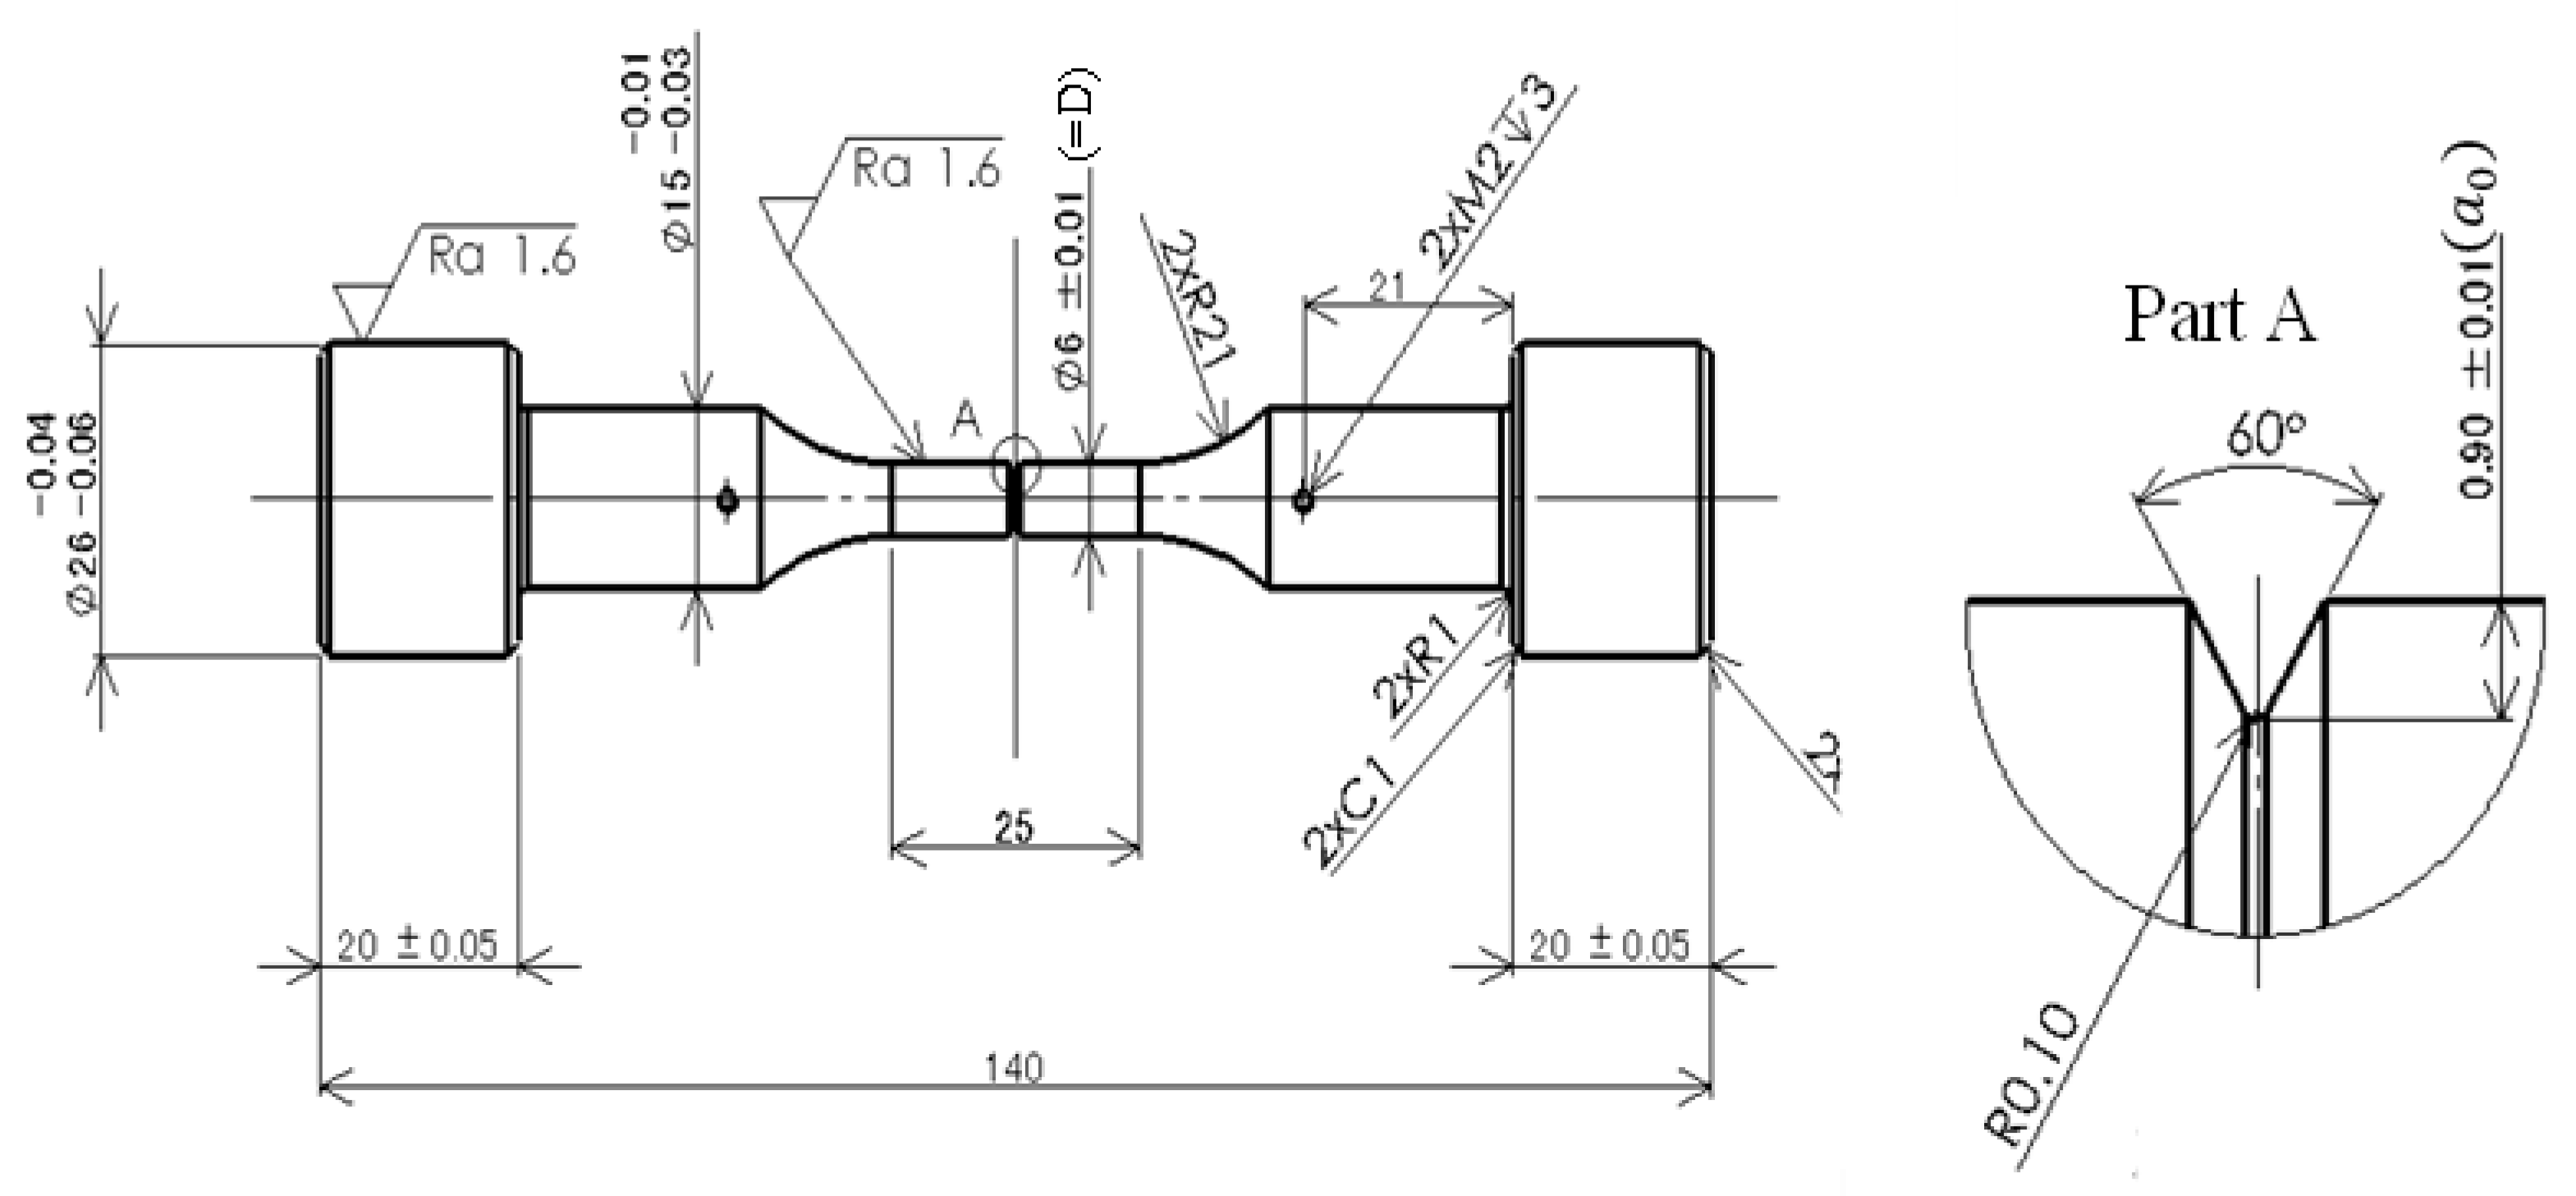
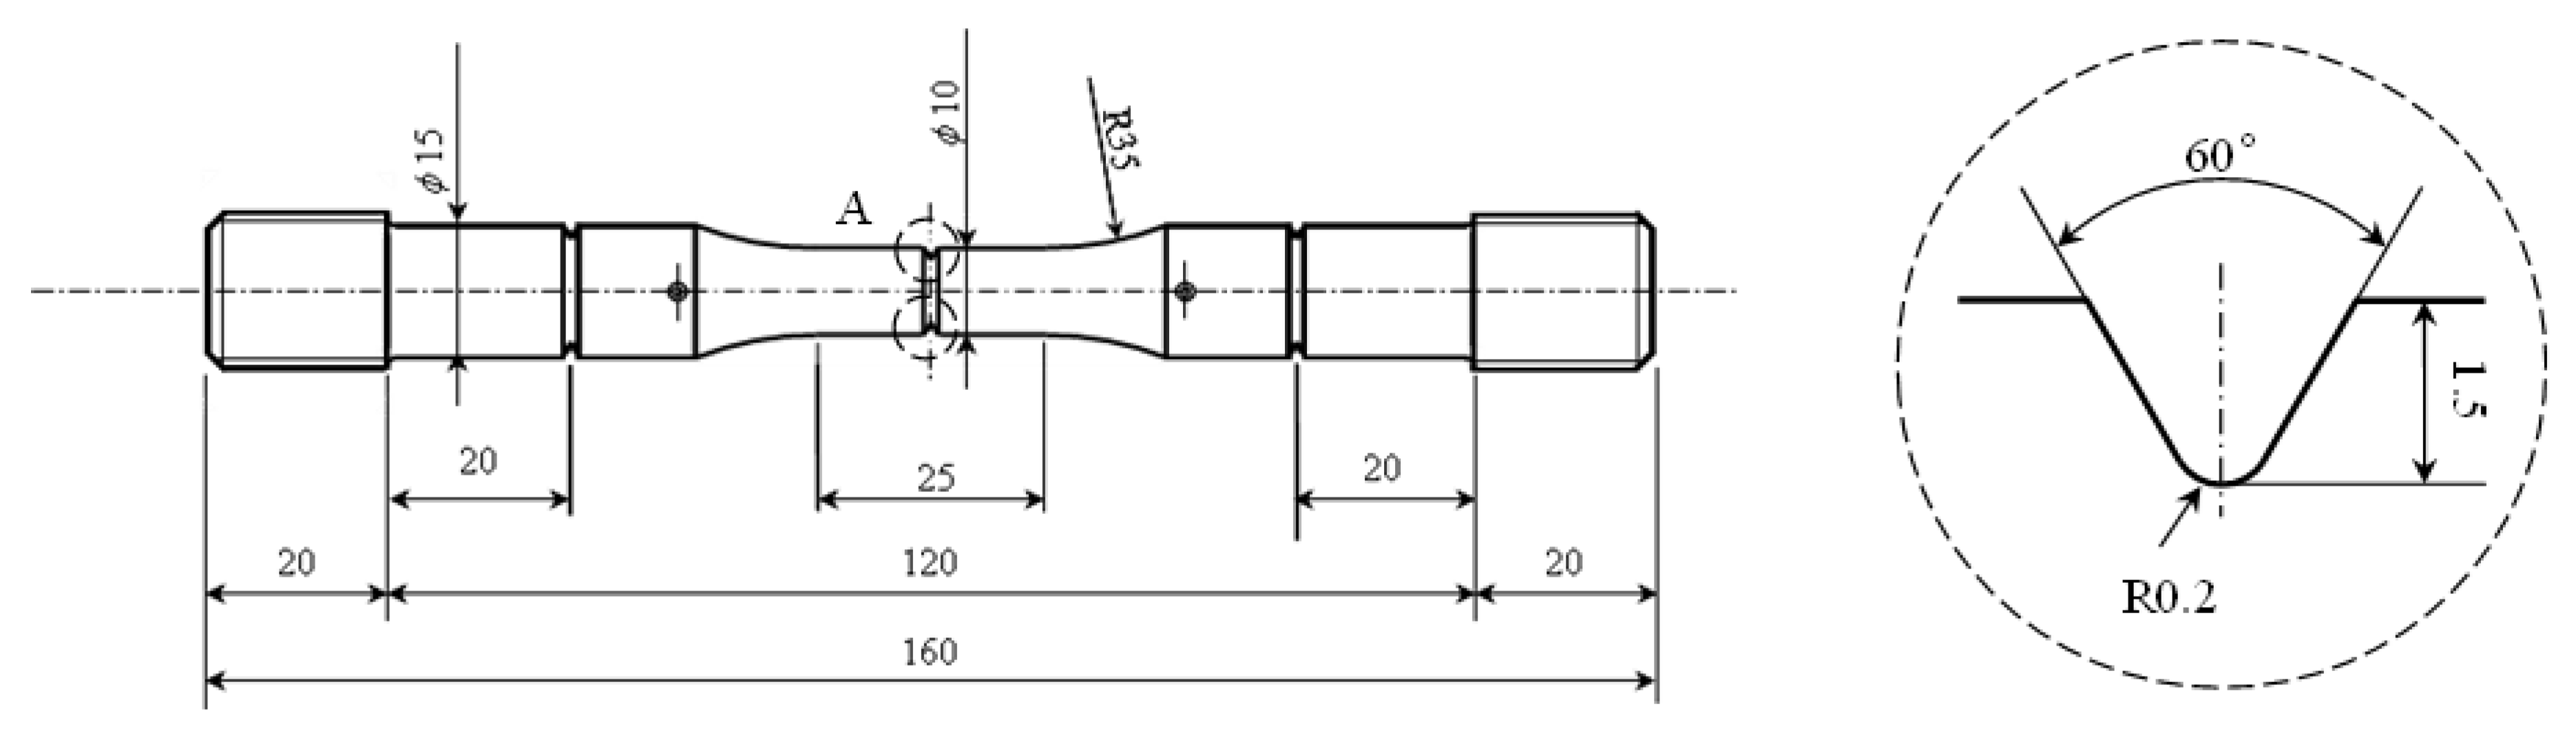
2. Materials and Methods

The material used for tests was W-added 9Cr ferritic heat-resistant steel, with ASME code case P92, which is used as boiler material. The chemical composition and mechanical properties of this material are shown in Table 1 and Table 2, respectively, which are the same as those used in a previous study [1]. The specimen used is a CNS under strain-controlled conditions, as shown in Figure 1 [1], and as recommended by ISO 12106 [18]. The tip angle, depth, and notch tip radius of the circular notch are 60 ° , 0.9 mm, and 0.1 mm, respectively. The specimen diameter used in this study under strain-controlled conditions was ϕ 6   m m . Furthermore, to compare the results under strain-controlled conditions with those under stress-controlled conditions, experiments under stress-controlled creep and fatigue conditions were conducted using a specimen with similar features, as shown in Figure 2. The diameter of the round bar specimen is ϕ 10   m m . The tip angle, depth, and notch tip radius of the circular notch are 60 ° , 1.5 mm, and 0.2 mm, respectively. The notch is considered to be a sharp notched specimen, as defined in the previous study, which has a stress singularity equivalent to that for a crack [3].

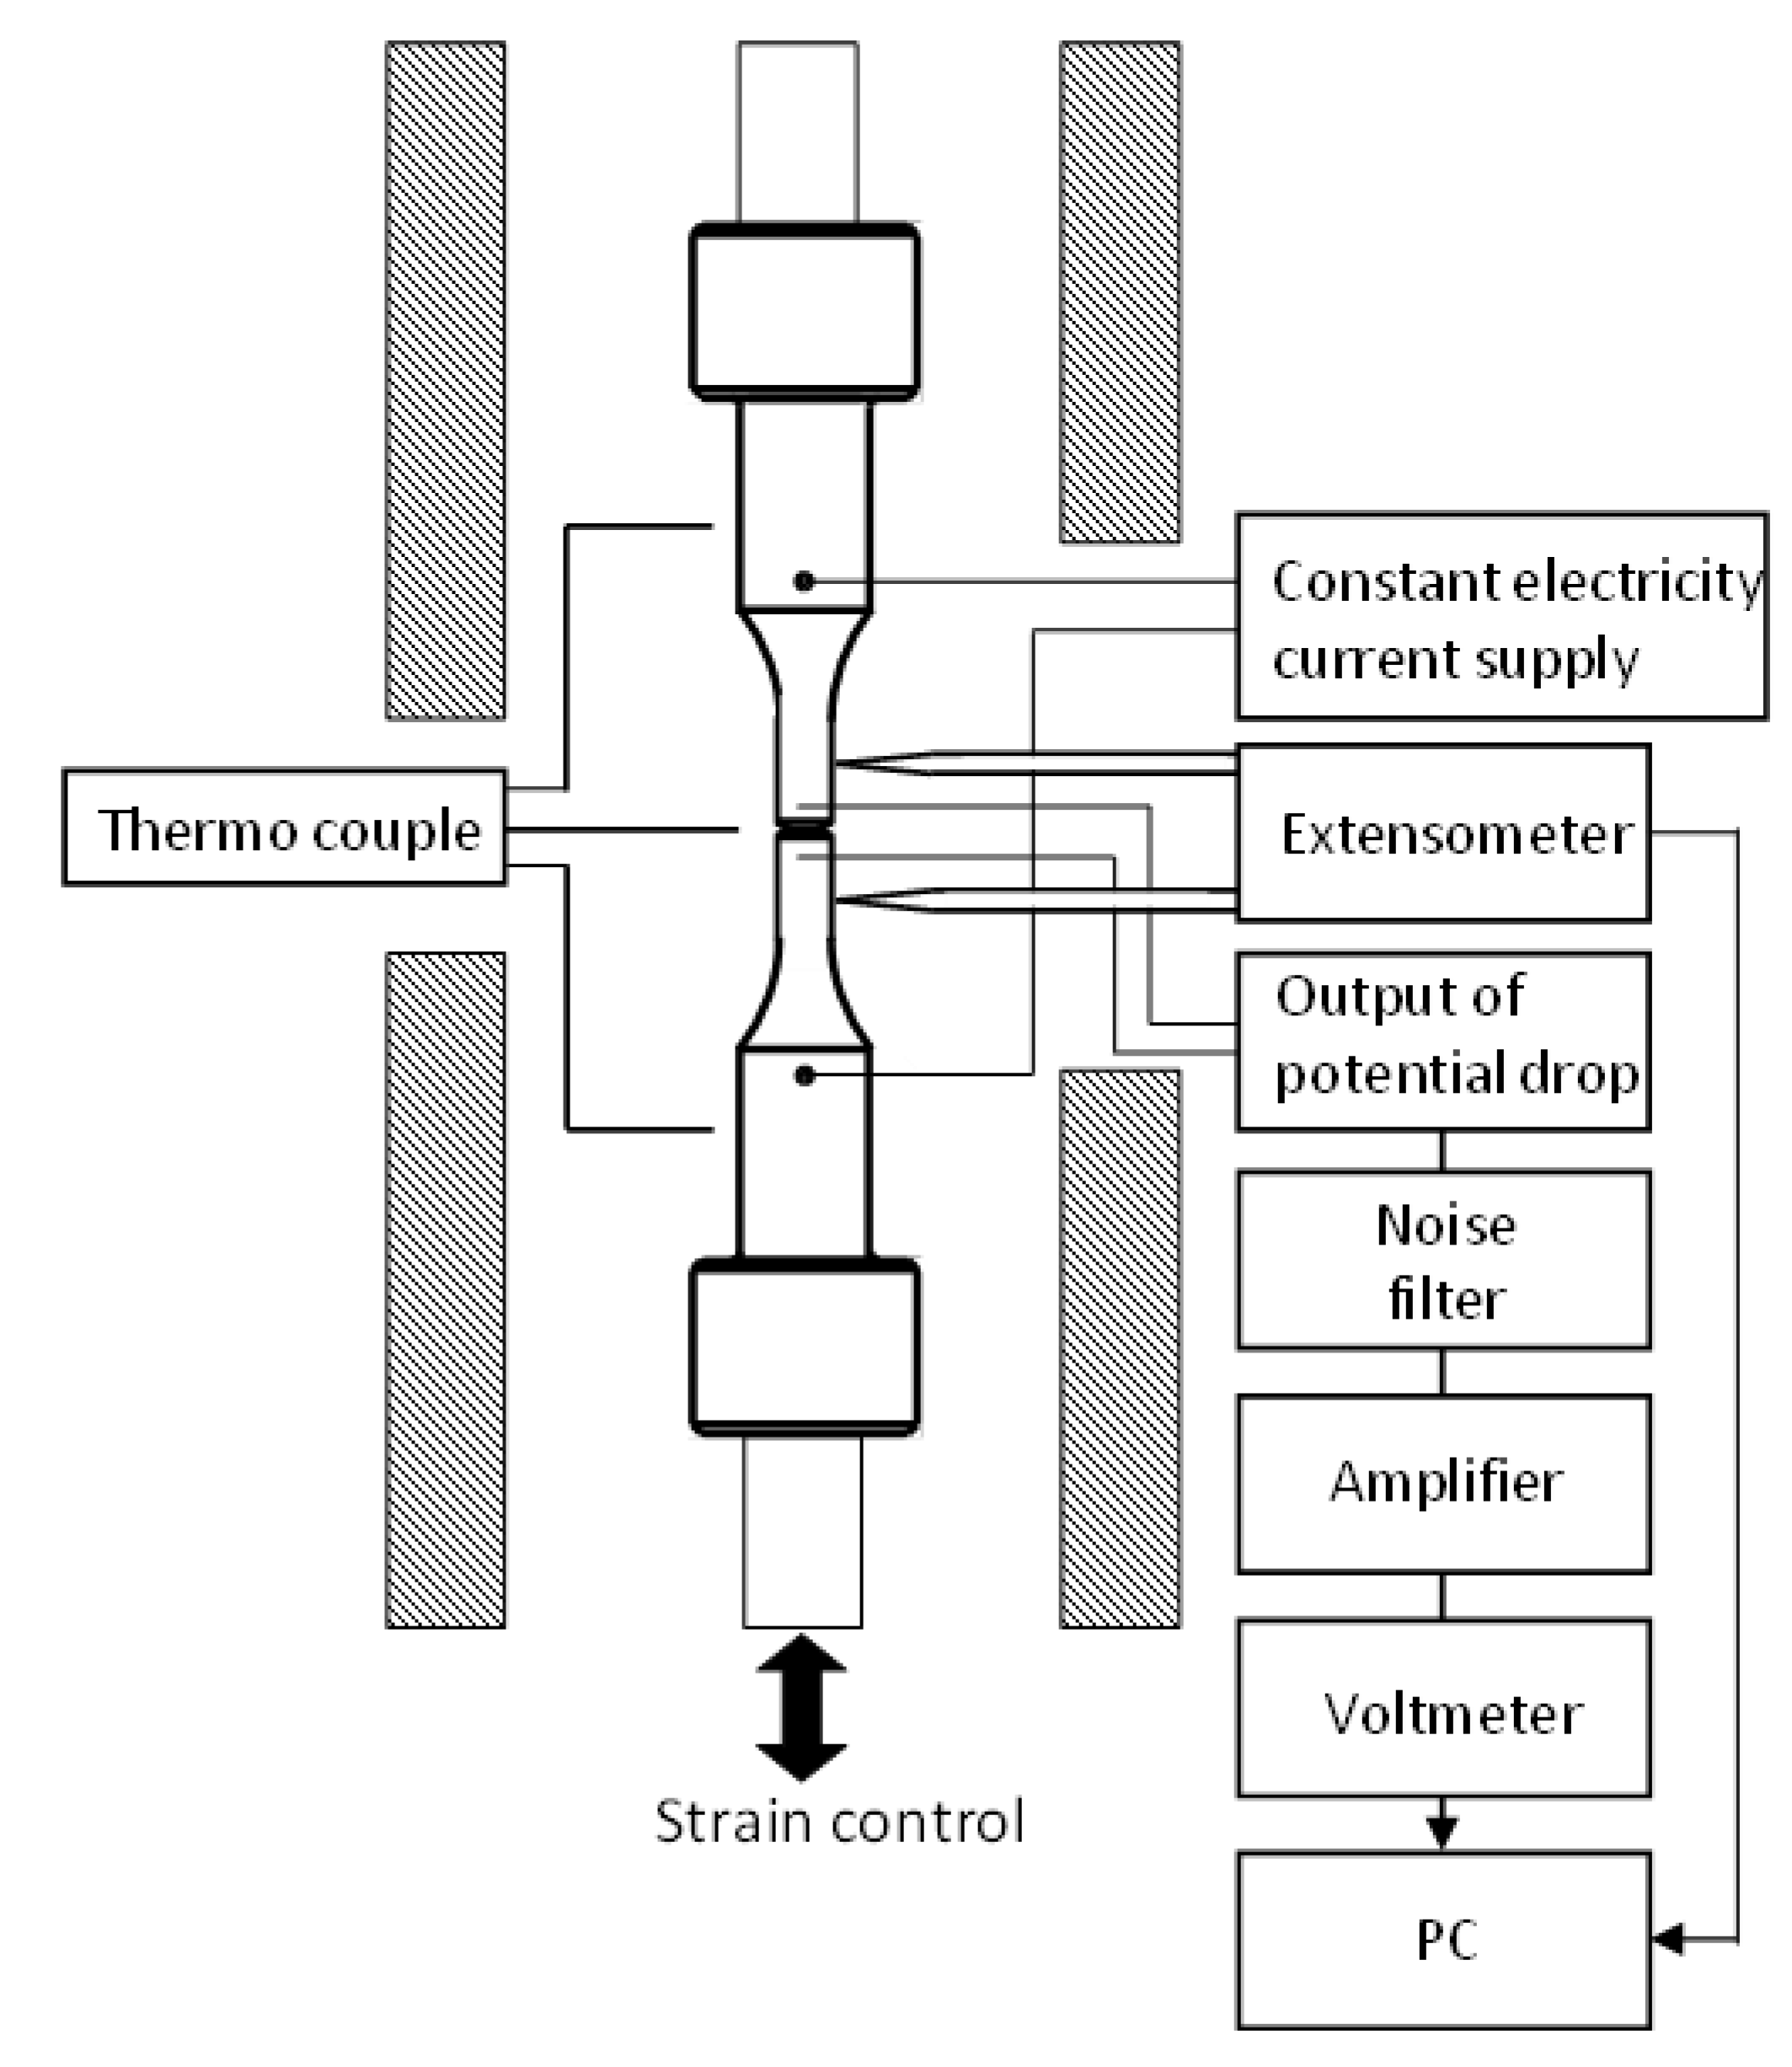
3. Experimental Procedure

3.1. Measurement Method for Crack Growth Length

Strain-controlled creep and fatigue crack growth tests were conducted using a hydraulic servo-controlled tensile–compressive fatigue testing machine originally manufactured in cooperation with SHIMADZU Corporation (Kyoto, Japan). A schematic of the experimental equipment and measurement method is shown in Figure 3. To control the applied deformation of the specimen, an extensometer manufactured by SHIMADZU Corporation was used, and the dynamic longitudinal extension was measured. The extensometer tips contact the parallel gauge section. The gauge length of the extensometer was 17 mm. The crack length from the notch tip was measured by the DCPD method as in previous studies [1,2]. To convert the change in the direct current electric potential difference into crack length, the Johnson–Schwalbe equation [19,20] was used for a compact tension specimen (C(T) specimen); however, this equation is not applied to the CNS. Under this condition, a modified equation of the Johnson–Schwalbe equation was proposed previously to measure the crack length of the CNS, as given by Equation (1) [1,2].
a = 0.667 a 0 e x p 0.434 D π a c o s 1 c o s h π y D c o s h U U 0 c o s h 1 c o s h π y D c o s π a 0 D
where:
  • a = crack length (mm);
  • a0 = initial crack length (mm);
  • D = diameter of the specimen (mm);
  • y = half-distance between the output terminals;
  • U = current voltage ( μ V ) ;
  • U0 = initial voltage ( μ V ) .
For the material and specimen used in this study, the total crack length measured using the DCPD method coupled with Equation (1) was found to predict the actual total crack length well, with a precision of less than 7.3% [1]. Therefore, in this study, the measurement of the crack length obtained using the DCPD method was adopted as the actual crack length.

3.2. Criteria of Failure Life and Crack Initiation

Concerning the failure life under creep and fatigue conditions for the smooth specimen, the cycle-sequential characteristics of the maximum stress, σ m a x , is considered, and the failure life is defined when the reduction ratio of σ m a x attains a critical value, for example 10% [7,8]; the reduction ratio of the minimum stress, σ m i n , is considered to show the antisymmetrical characteristics. However, for a CNS, the cycle-sequential characteristics of σ n e t , m a x and σ n e t , m i n show asymmetrical characteristics [1,2]. Therefore, we proposed a method of using the nominal stress range σ n e t = σ m a x σ m i n n e t and its reduction ratio η, given by Equation (2), as the failure criterion [1,2].
η = σ 0 σ σ 0 n e t
where ( σ ) n e t and ( σ 0 ) n e t are the current and initial net section nominal stress ranges considering the initial notch length [1,2]. The definition of stress in this study is that of the nominal stress, that is, the net section stress for the initial notched specimen that does not include the crack growth length [1]. The crack growth life was defined as the reduction ratio of the nominal stress range η = 25 % , corresponding to a uniform crack growth ( 400   μ m crack length measured from the initial notch tip) [1].
Crack initiation was defined as the reduction ratio of the nominal stress range η = 10 % , which corresponds to the transition point from the region of crack incubation to that of stable crack growth [1]. At this point, a crack growth length measured from the initial notch tip of 200 μ m can be found, which is in good agreement with the definition of creep crack initiation in ASTME1457-19 [4].

3.3. Experimental Conditions

The experimental conditions of creep–fatigue crack growth tests under strain-controlled conditions and the crack growth life Nf are shown in Table 3. The previous test conditions of Δε = 0.3% [1] are also included in this table. The diameters of the specimens used at temperatures of 600 and 630 °C are ϕ 10   m m [1] and ϕ 6   m m , respectively.
The experimental conditions under stress-controlled conditions and crack growth life tf are shown in Table 4, including the conditions under the creep condition.

4. Experimental Results

4.1. Cycle-Sequential Characteristics of the Nominal Stress Range σ n e t

To determine the failure criterion, the validity of using the relationship between the nominal stress range σ n e t and number of strain cycles N has been suggested previously [1,2]. Therefore, in this study, the experimental results of the cycle-sequential characteristics of the nominal stress range σ n e t at strain ranges of 0.3% [1], 0.4%, and 0.5% under strain holding times ranging from 0s to 3600s are shown in Figure 4, which also includes previous results [1]. These results show that the cycle-sequential characteristics of σ n e t decrease monotonously with the applied strain cycles, which verifies previous results [1] and makes it possible to accurately determine failure life and crack initiation using the reduction ratio of σ n e t , as proposed in the previous study [1]. However, with an increase in the applied strain range, the initial nominal stress range was found to take larger value increase and decrease markedly with an increase in the applied strain cycle.

4.2. Crack Growth Behavior

The relationship between the crack length from the initial notch obtained by the DCPD method and the reduction ratio of the net section nominal stress range η for P92 steel is shown in Figure 5. At η of approximately 25%, a uniform crack growth was found ( 400 μm crack length). At η of approximately 10%, it was found to correspond to the period of crack initiation ( 100 μm crack length). Therefore, the criteria of failure life and crack initiation obtained in this study are compatible with those of previous studies [1,2]. However, in Figure 5, the relationship between crack length from an initial notch Δa and η for specimens with diameter of ϕ 6   m m and ε of 0.4 and 0.5% was found to be slightly lower compared to those with a diameter of ϕ 10   m m and ε of 0.3%. The analysis and consideration of these results are written in Section 5, Analysis and Discussion.

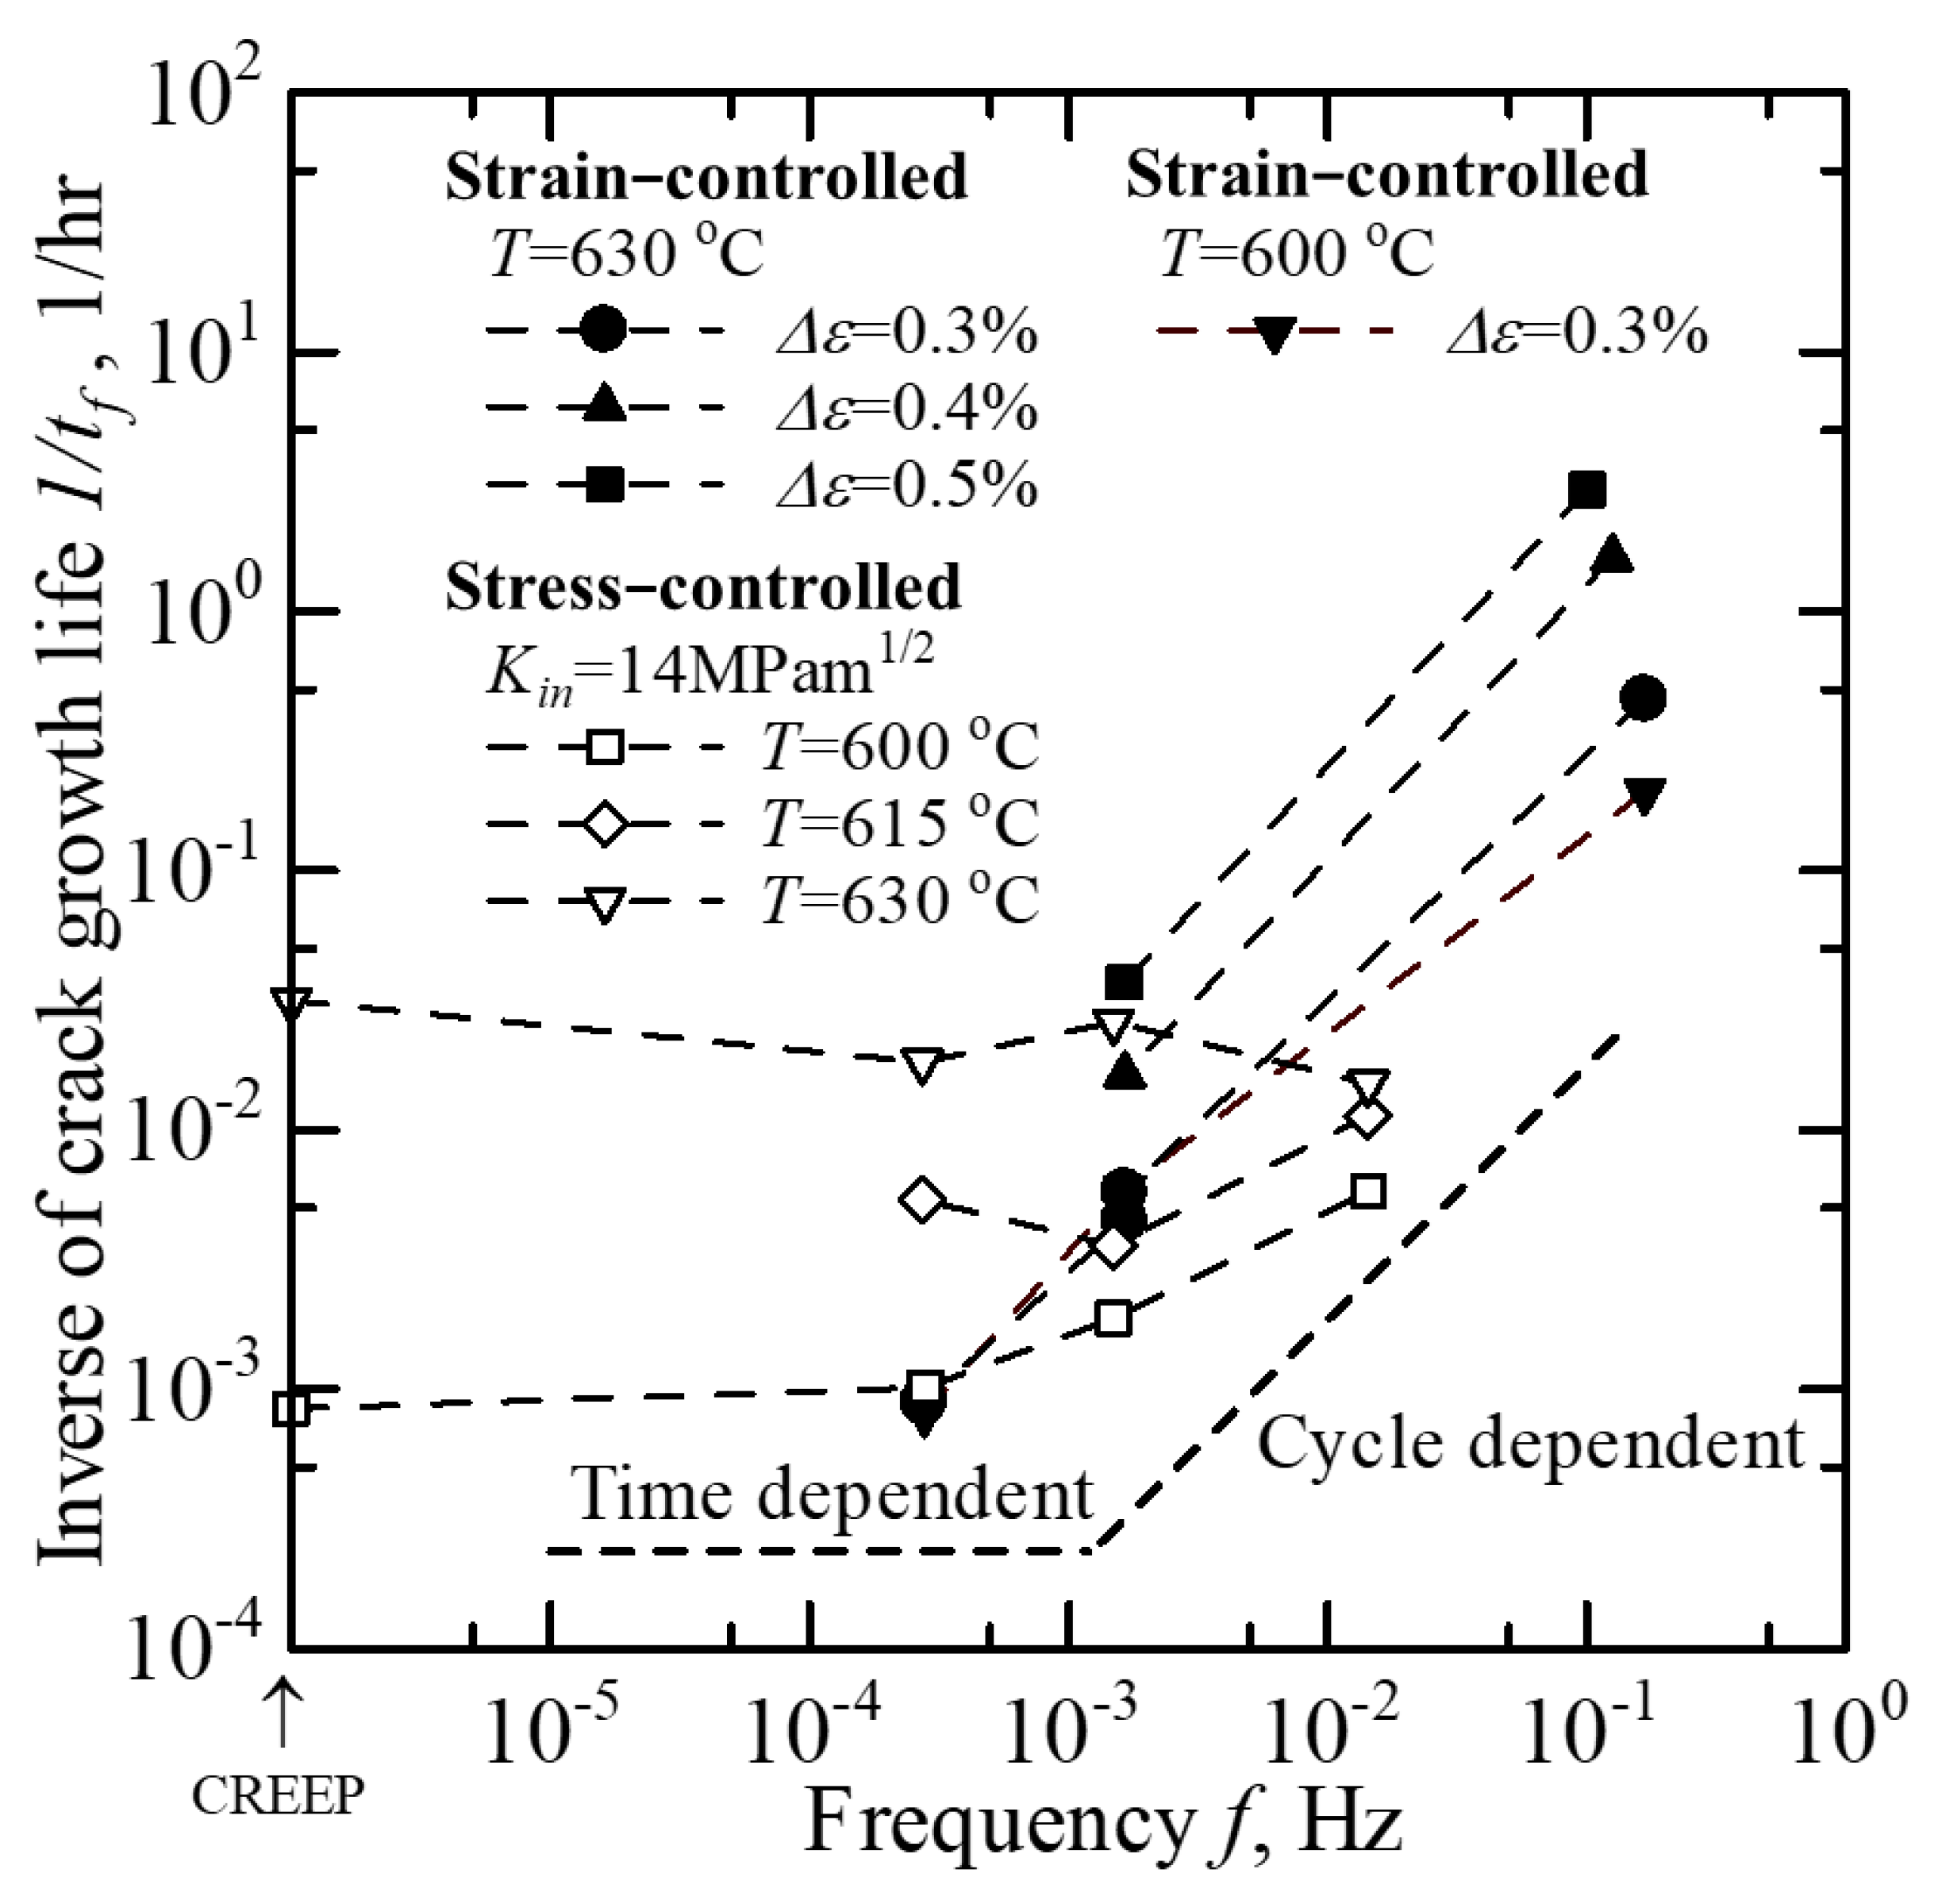
4.3. The Load Frequency Characteristics of the Inverse Value of Crack Growth Life

The load frequency characteristics of the inverse value of crack growth life for P92 steel under stress- and strain-controlled creep–fatigue conditions are shown in Figure 6. Previous results at temperatures of 600 and 630 °C and in a strain range of 0.3% [1] are also included. These results show the marked difference in frequency characteristics between these conditions. The detailed considerations are mentioned in Section 5.2.

5. Analysis and Discussion

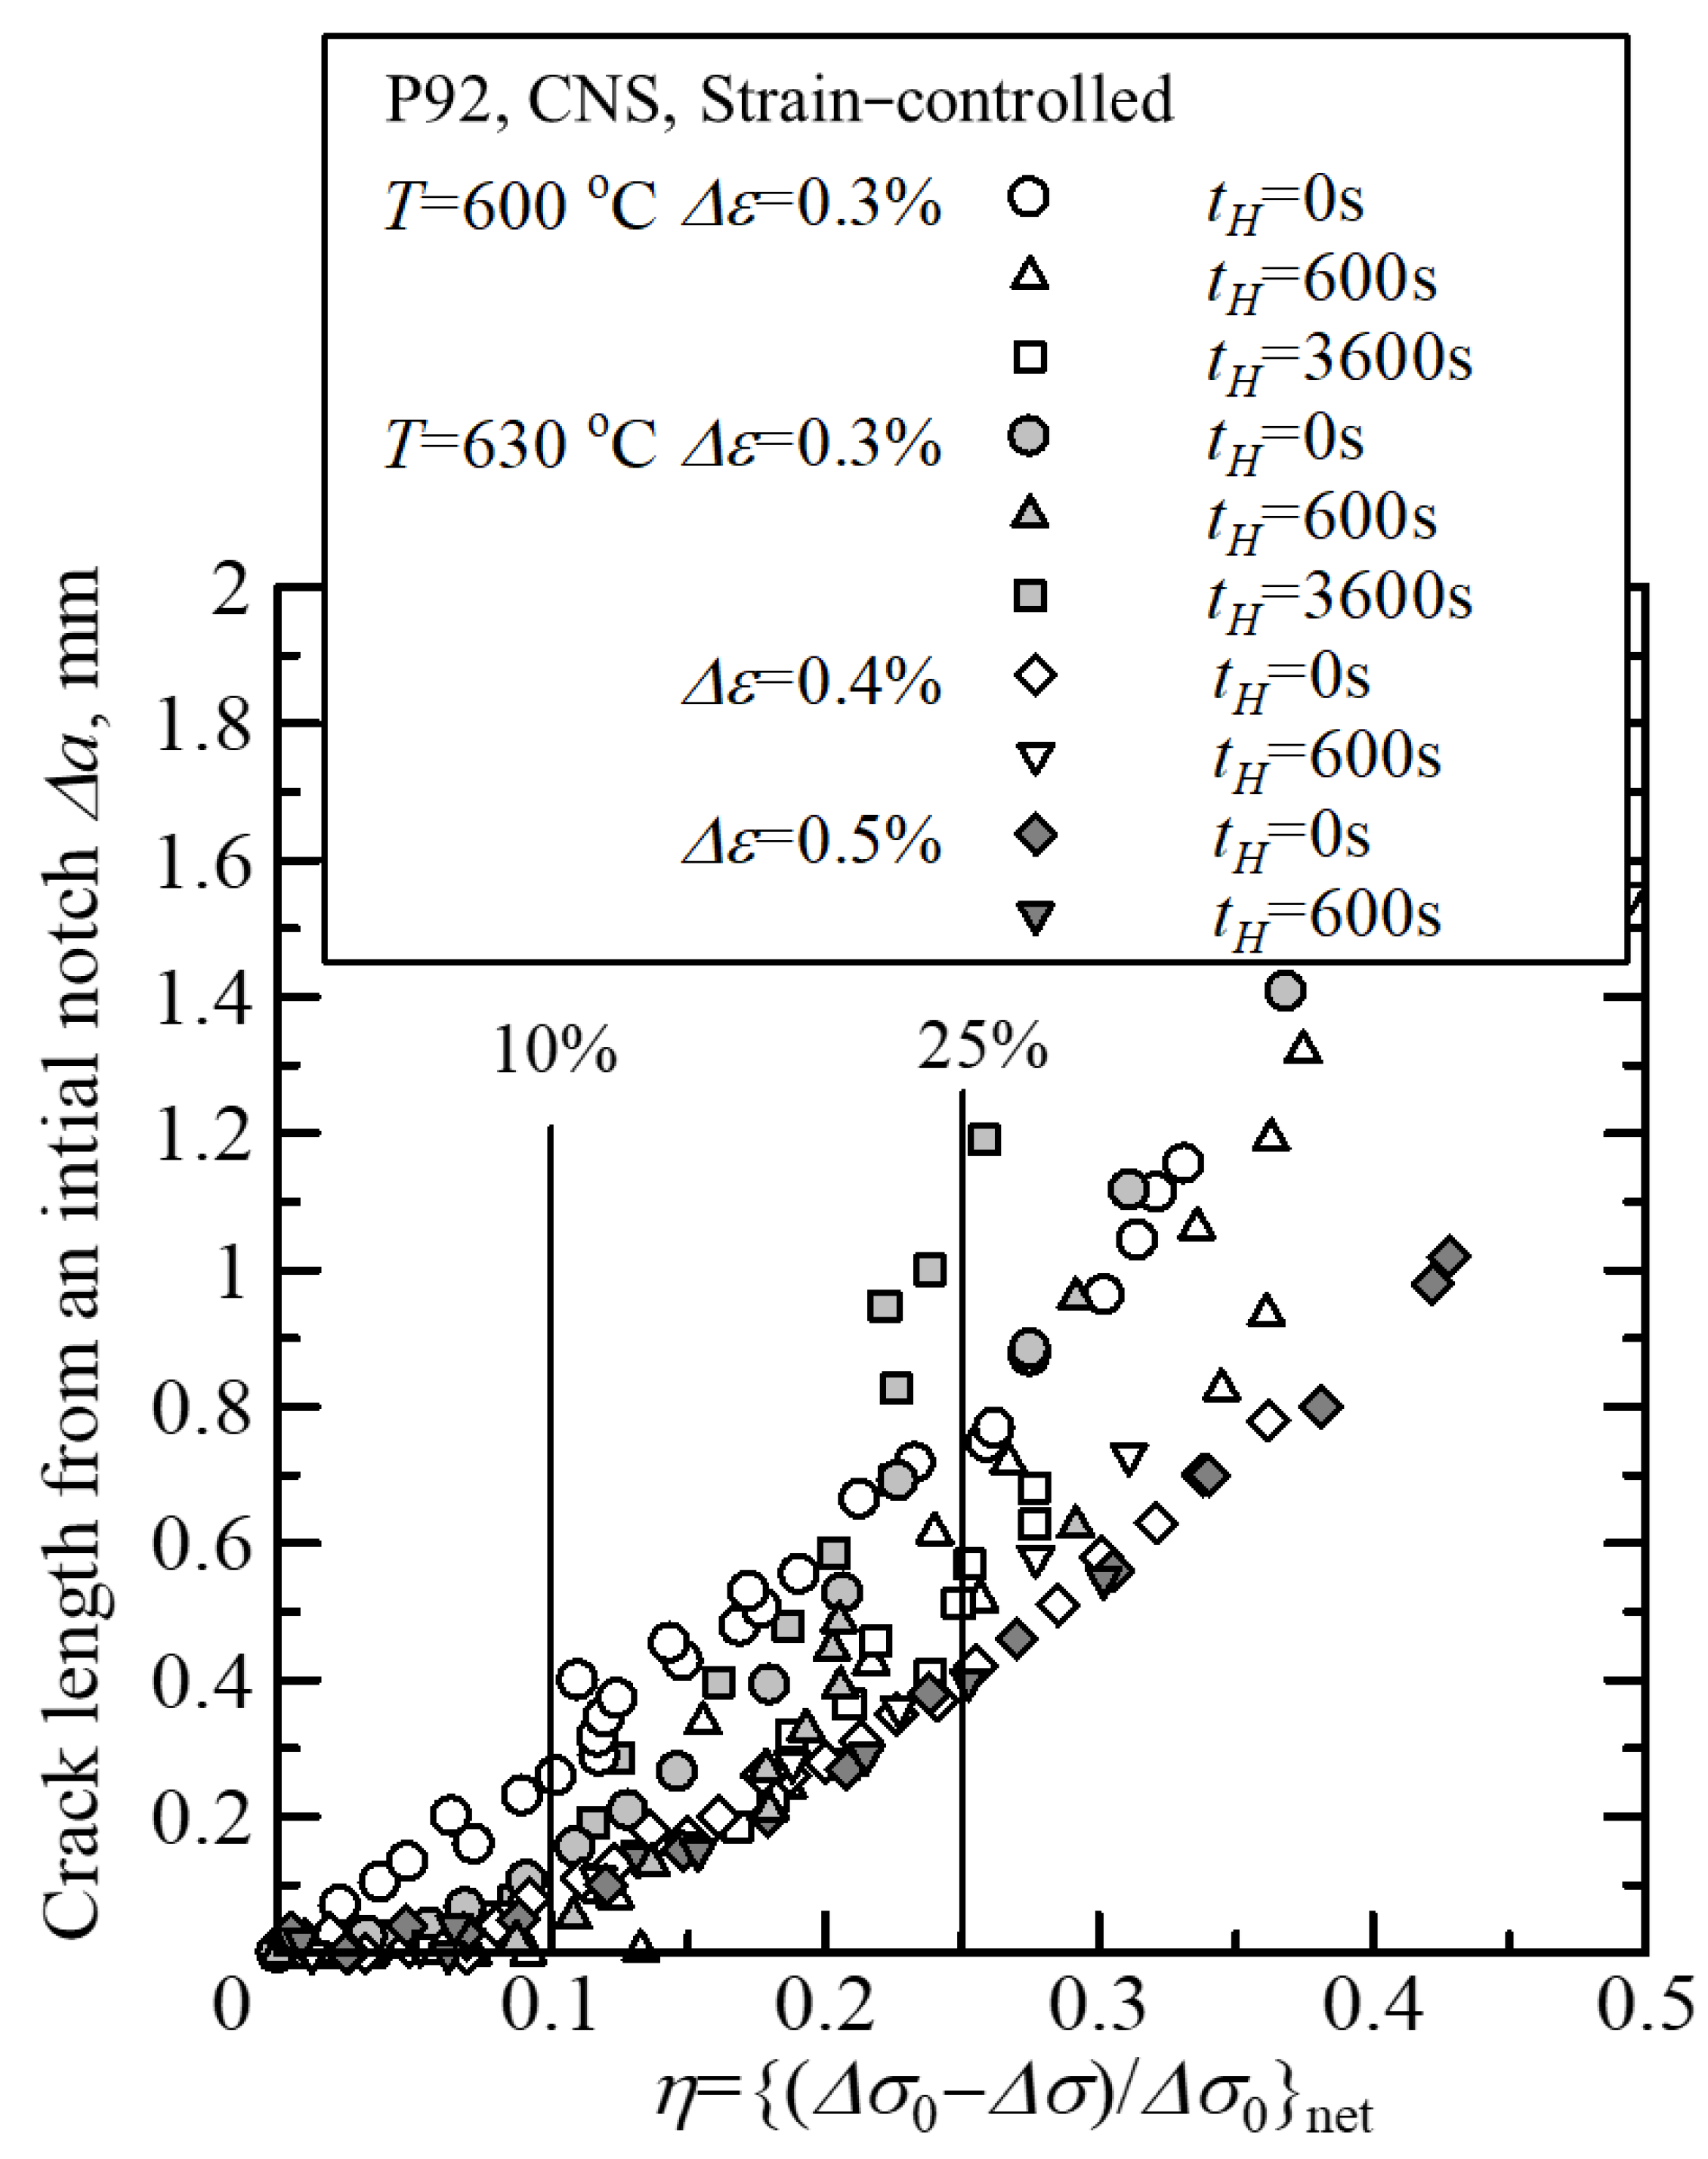
5.1. Relationship Between Crack Length and Stress Reduction Ratio

In Figure 5, the relationship between the crack length from an initial notch Δa and η of specimens with a diameter of ϕ 6   m m is shown, and the values were found to be slightly lower compared to those with ϕ 10   m m . Therefore, to control the effect of the specimen diameter on this relationship, Δa is replaced by the non-dimensional value of the crack length controlled by D n e t , that is, Δ a / D n e t . Here, D n e t is the initial net section diameter D n e t = D 2 a 0 of the specimen. The relationship between Δ a / D n e t and η is shown in Figure 7 including the data in a strain range of 0.3% [1]. The effect of the specimen diameter on the crack growth curve was found to be well-controlled by this representation method and to show good correlation between Δ a / D n e t and η . This result shows that the crack growth life is not dominated by the crack length but by the ratio of the crack length to the initial net section diameter of the specimen.

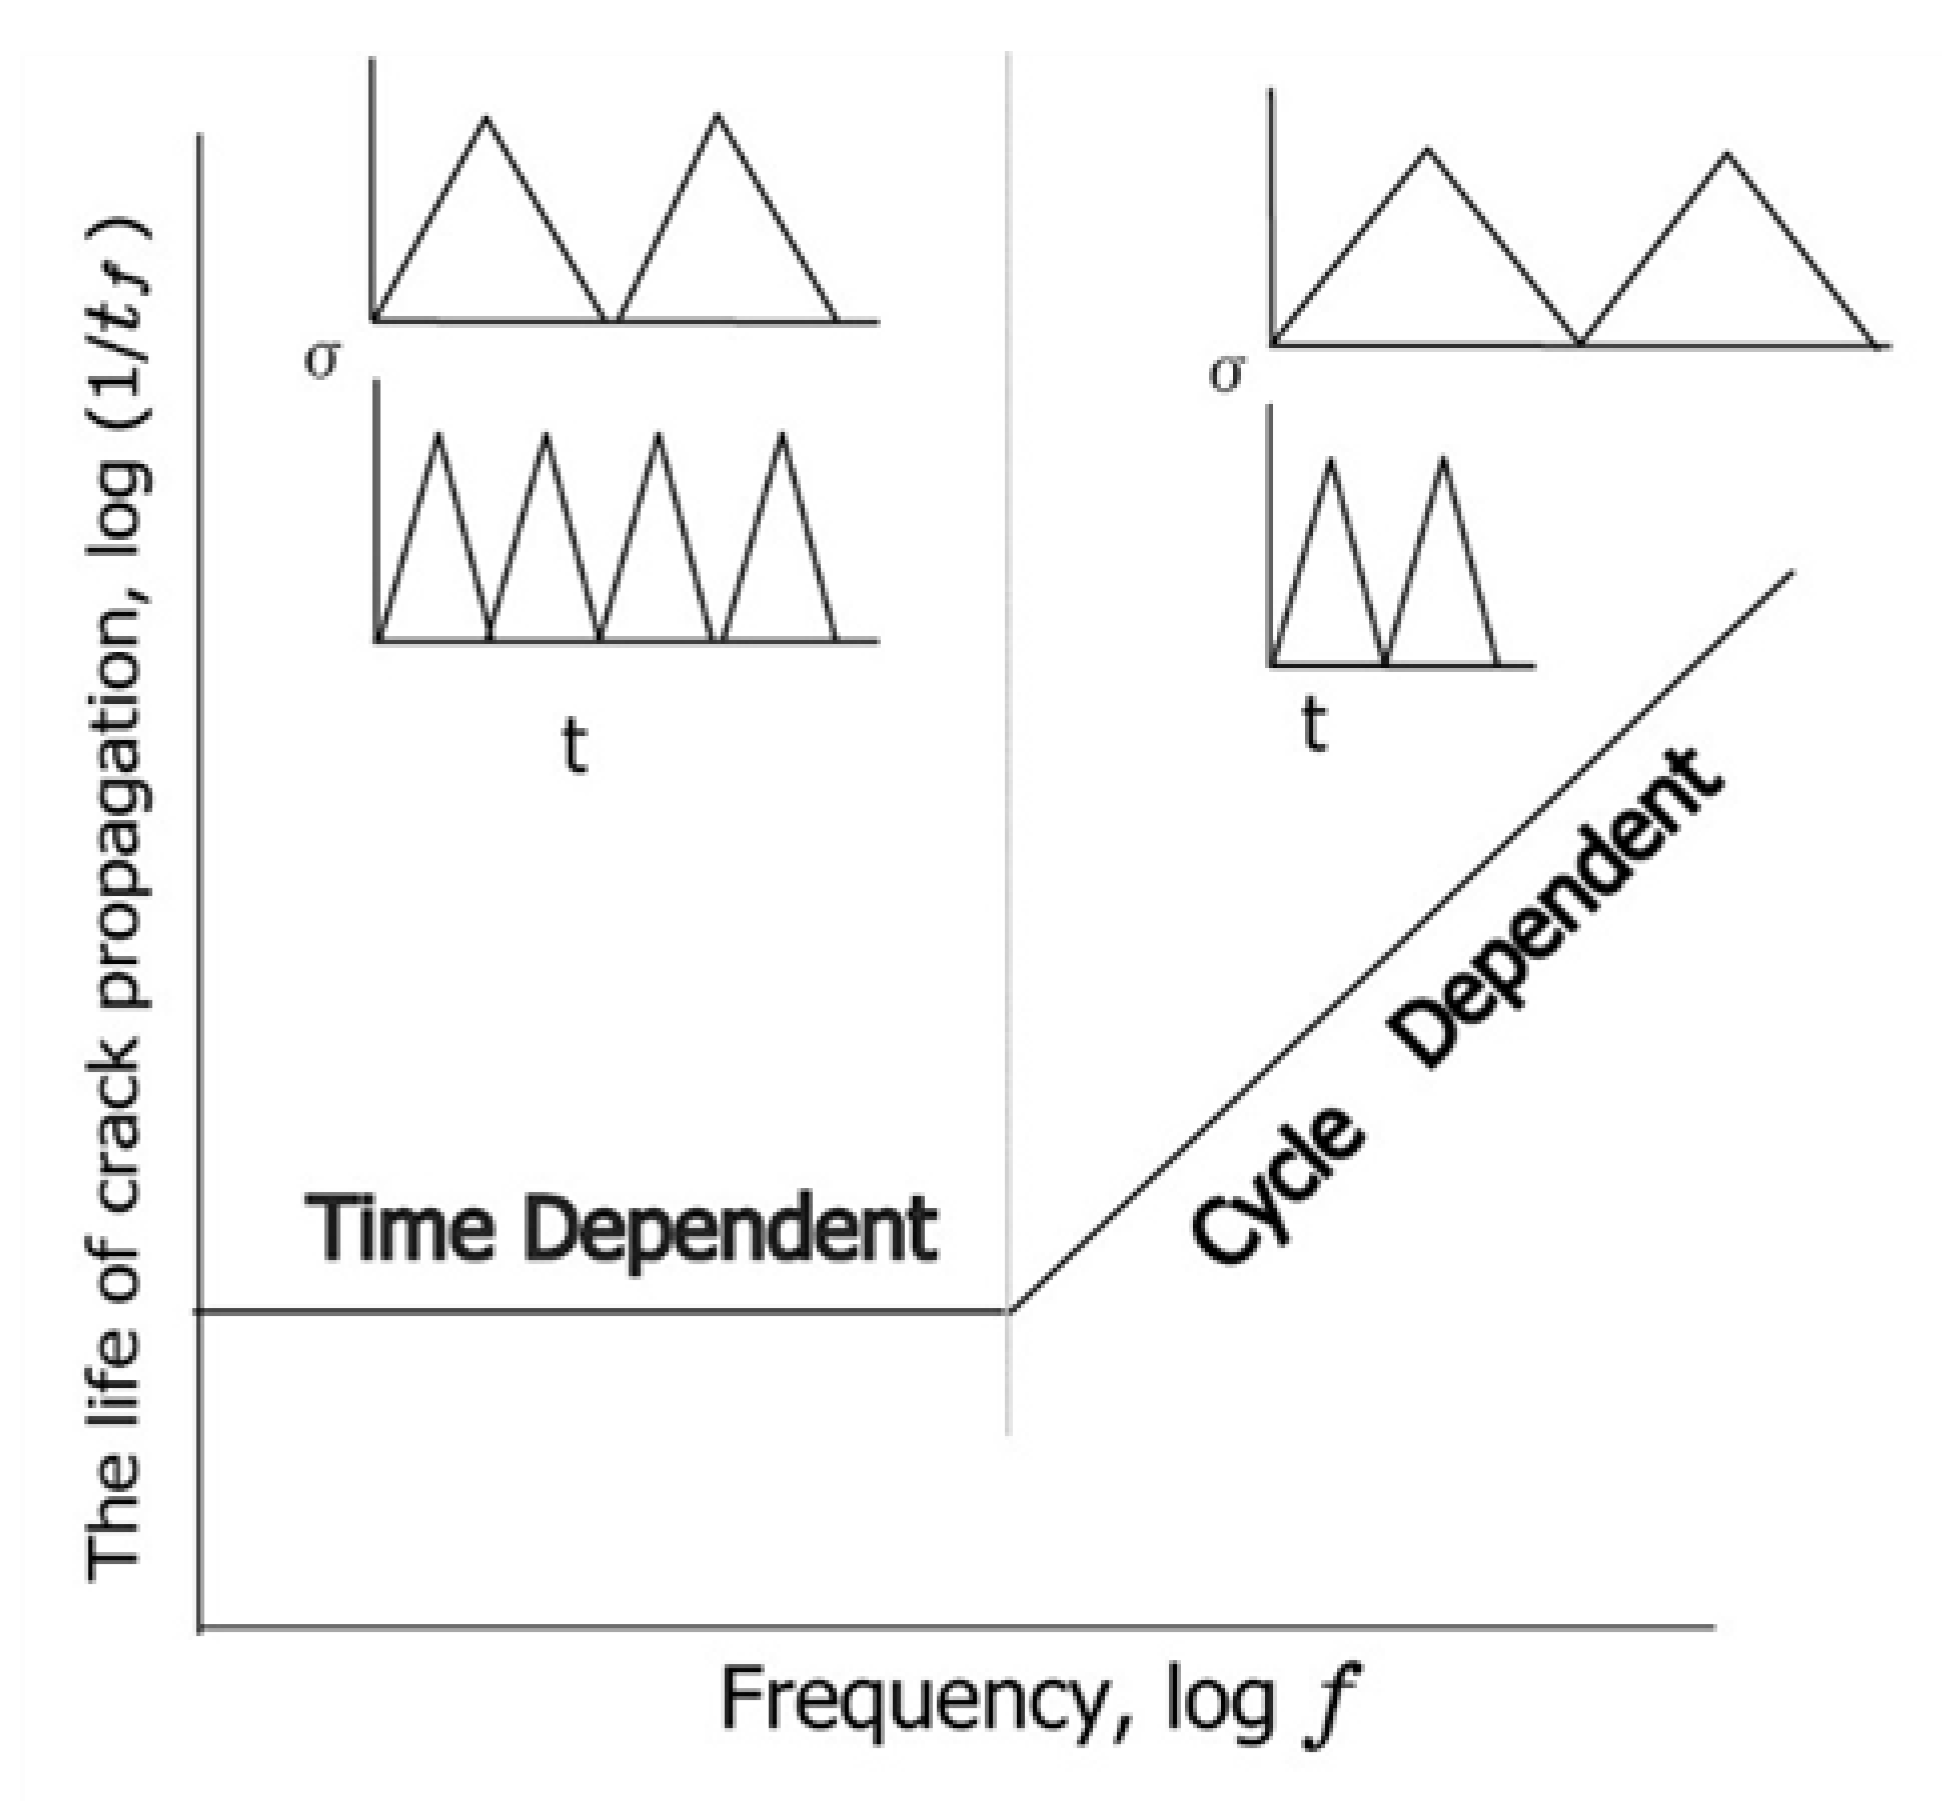
5.2. Separate Estimation Method for the Cycle-Dependent Mechanism from the Time-Dependent Mechanism for Crack Growth Life

A separate estimation method for the cycle-dependent mechanism from the time-dependent mechanism for crack growth has been proposed previously based on the representation of the relationship between the inverse value of crack growth life and applied load frequency, as shown in Figure 8 [21]. When the crack growth life tf is dominated by the cycle-dependent mechanism, the relationship between log (1/tf) and log f is linear with a gradient of 45°. By contrast, when the crack growth life tf is dominated by the time-dependent mechanism, the relationship between log (1/tf) and log f is linear and parallel to the log f axis. On the basis of this representation, it can be determined whether the crack growth life is dominated by the cycle-dependent, time-dependent, or an interactive mechanism [21]. The considerations based on this estimation method was conducted for the results in Figure 6. These results show that the crack growth life of the CNS under strain-controlled creep–fatigue conditions for P92 steel is dominated by the cycle-dependent mechanism in a strain range from 0.3% to 0.5%. By contrast, the crack growth life of the CNS under stress-controlled creep and fatigue conditions for P92 steel is mainly dominated by the time-dependent mechanism in the same temperature range.

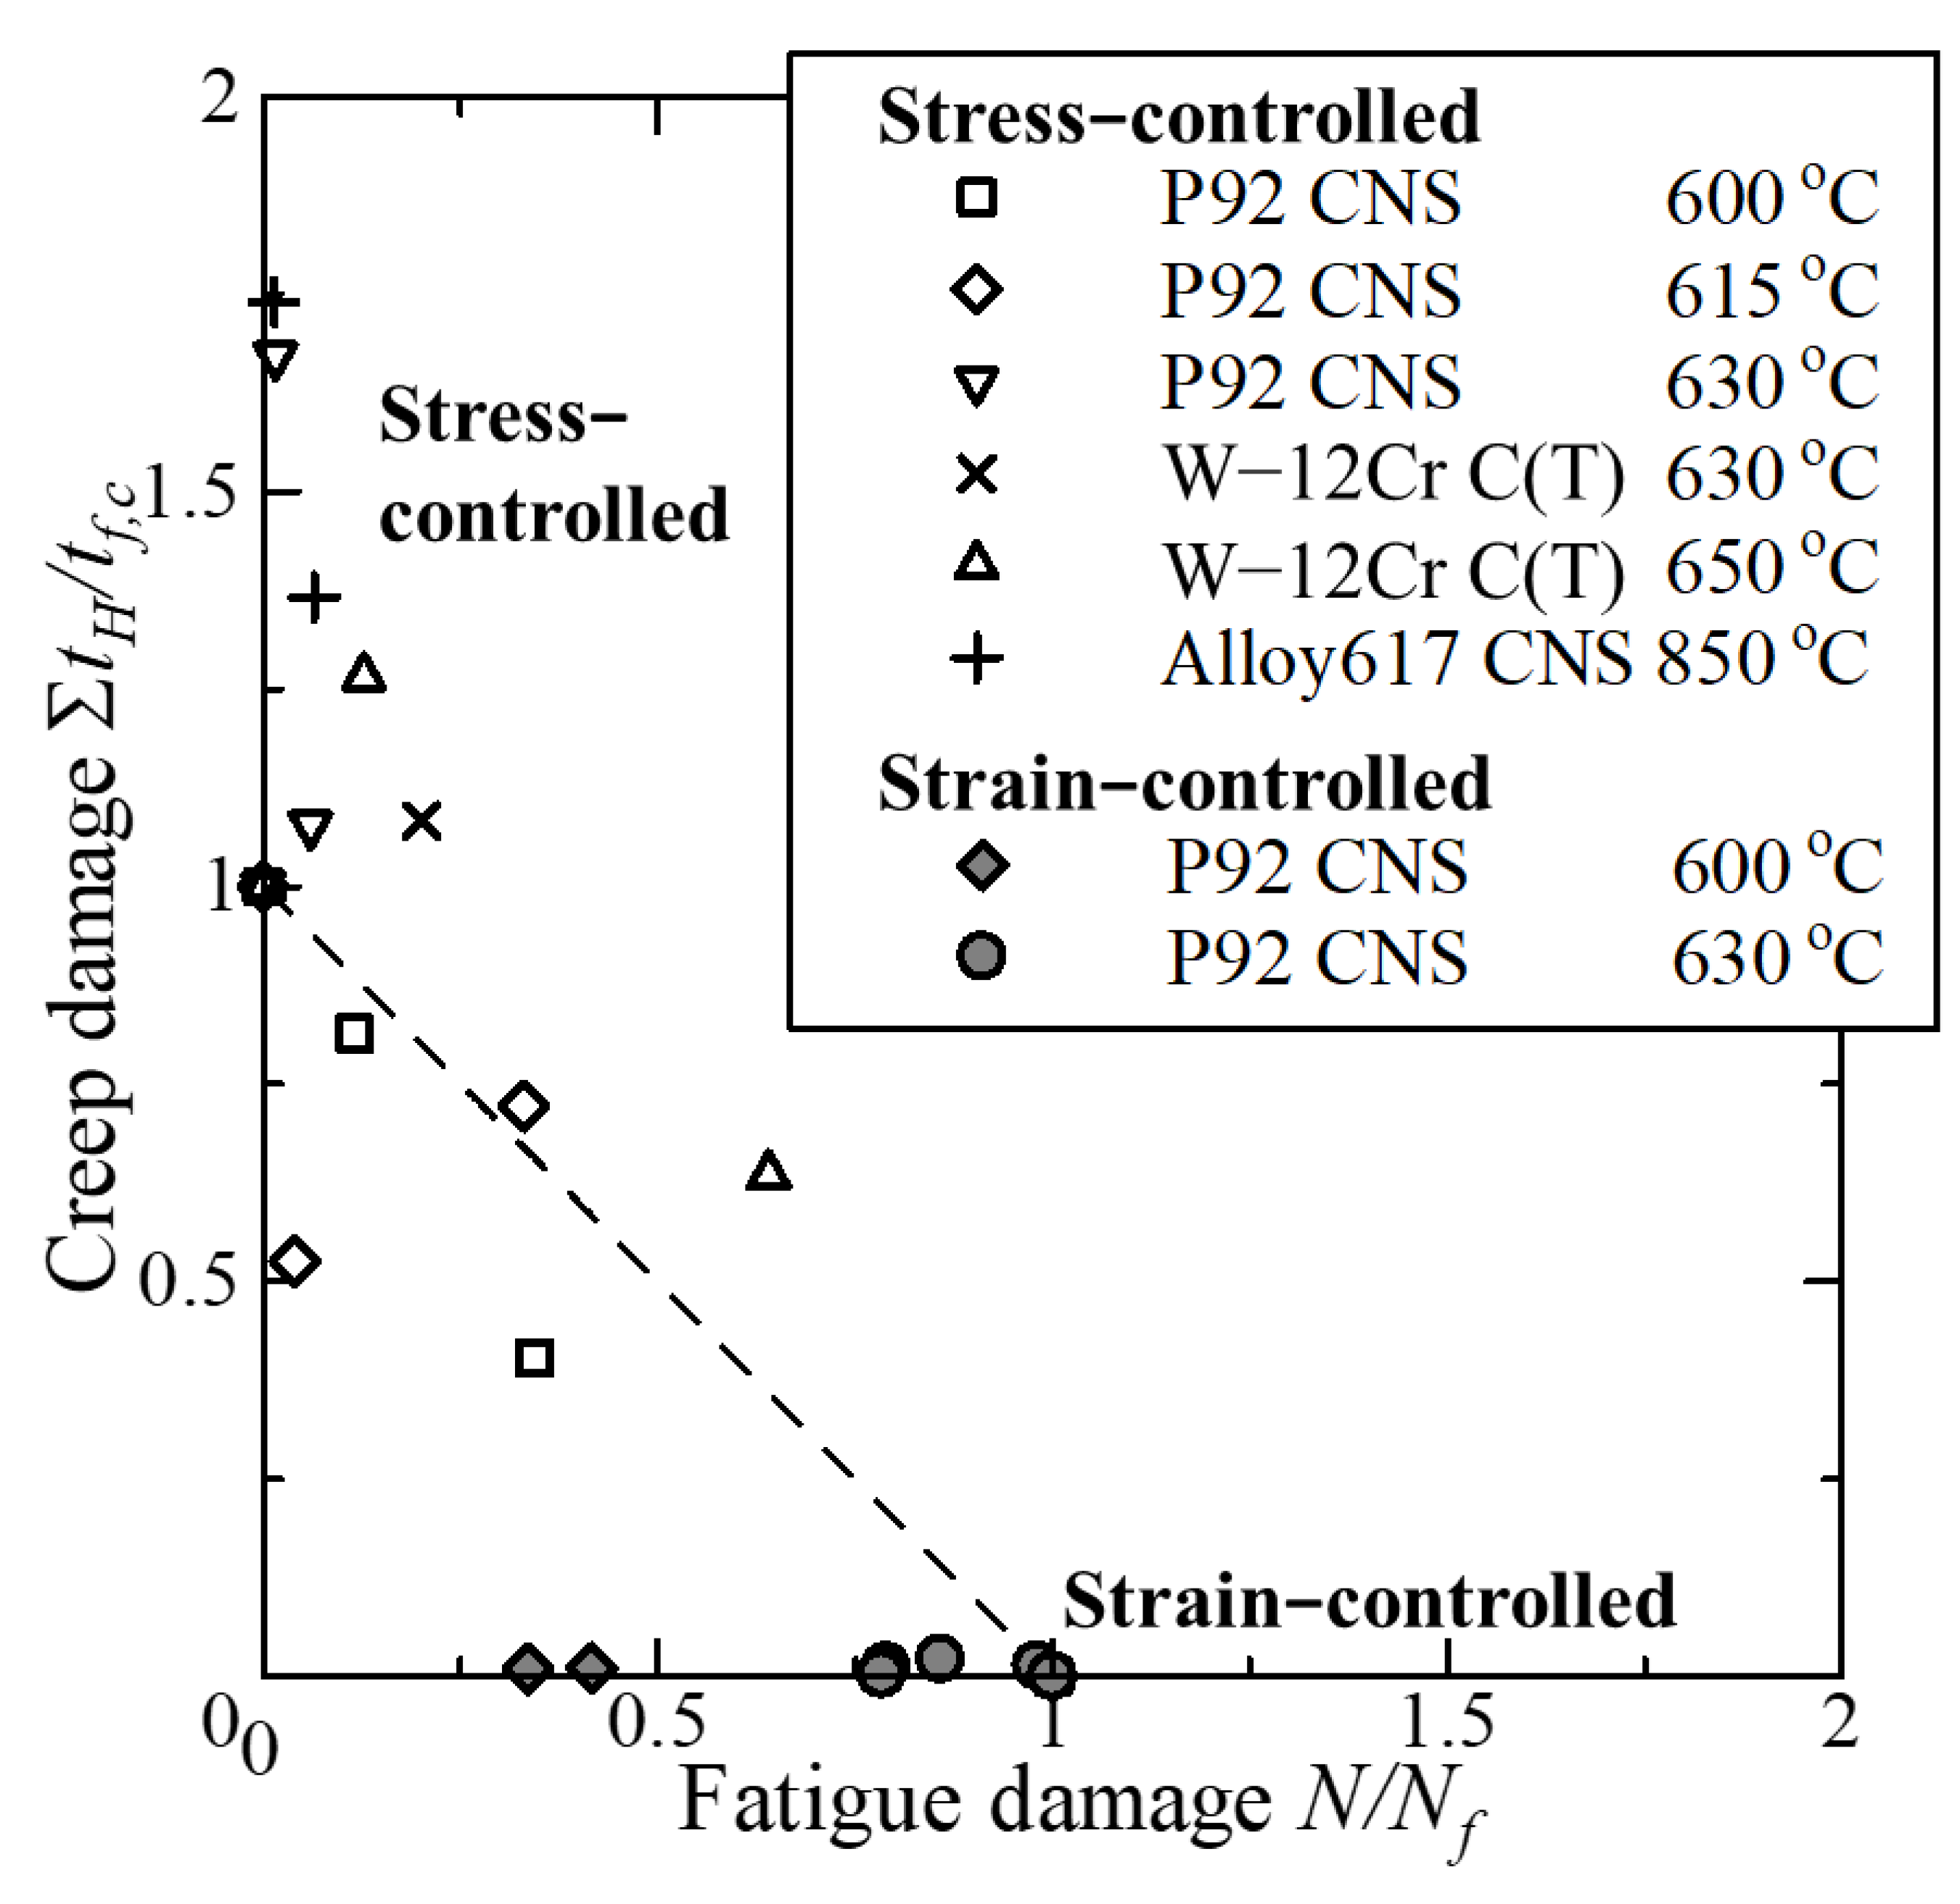
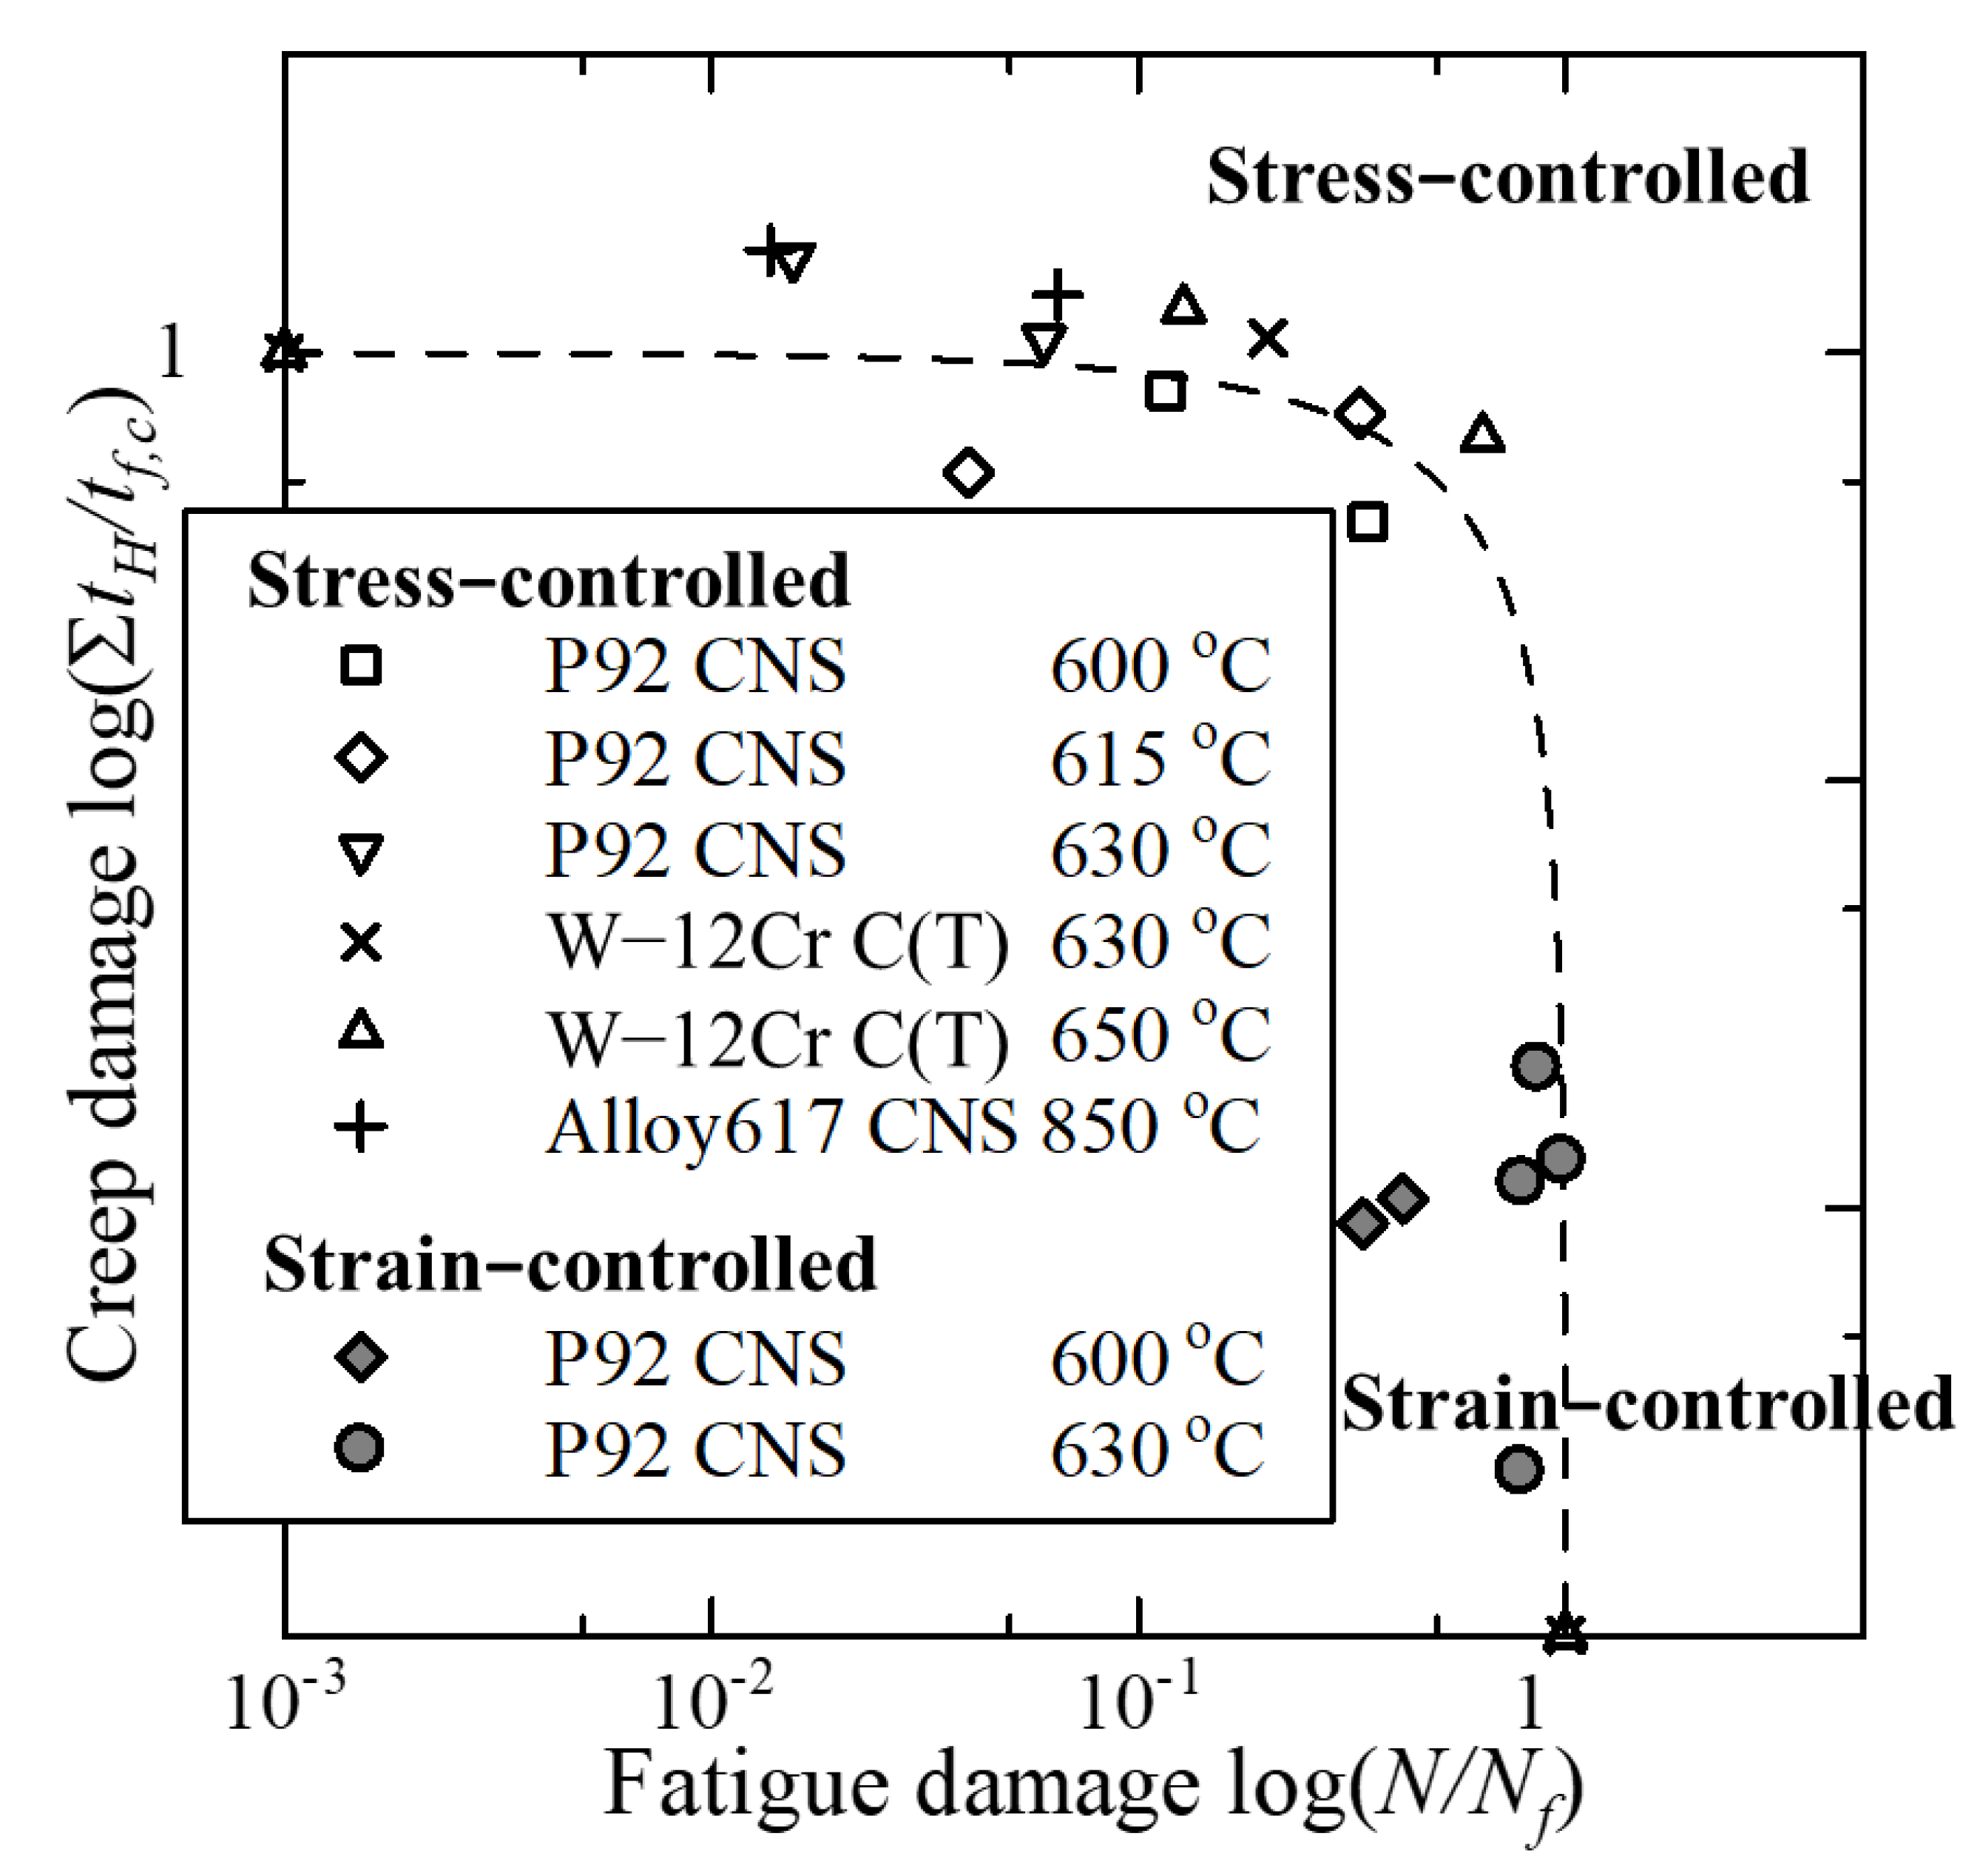
5.3. Representation of the Creep and Fatigue Accumulated Damage Law

In previous studies [7,8,9,10,11,12,13,14,15], creep and fatigue damage rules were proposed. In ASME Boiler and Pressure Vessel Code N47 [7], the summation of creep and fatigue damage, ϕc and ϕf, were kept below the Dcri of material constant for operation under the creep and fatigue conditions given by Equations (3)–(5);
ϕ f + ϕ c D c r i
ϕ c = K = 1 K = v t k t f , k
ϕ f = N f N f f
Here, tk is the total sum of the stress-holding time under a stress level of k, and tf,k is the creep-rupture time under stress level k. Nf is the number of cycles of failure life under the creep–fatigue test, Nf-f is the full-fatigue life under the strain range of the test, and ϕc is given by Equation (6).
ϕ c = N = 1 N = N f 0 t H d t t f , t N N f i = 1 i = n d t t f , i N f 2
A stress relaxation curve at a half-life of Nf/2 was selected, as shown in Figure 9. This curve was divided into n, as shown in Figure 10. In each step of i (i = 1~n), an average stress was defined as σi, and tf,i is the creep failure life under this stress level. Since a circular sharp notched round bar specimen is used in this test, crack growth occurs. Therefore, the Q* concept [22] can be used to obtain tf,i.
Based on the Q* concept [22], the Q* parameter for creep brittle materials is given by Equation (7), and the creep crack growth rate is given by Equation (8) [22]. This will be also applicable to creep ductile materials in the region of t, as shown in Figure 10. Integrating Equation (8), tf,k is given by Equation (9).
Q * = n l o g K i K 0 Q R T
d a d t = A * e x p Q * = A * K i n e x p Q R T
t f , k = a 0 a f d a A * e x p Q * = ( a f a 0 ) A * K i n e x p Q R T
Here, A* is a constant, Q is the activation energy [kJ/mol], Ki [MPam1/2] is the initial stress intensity factor, K0 is the normalizing factor with a value of 1 MPam1/2, and n is the power coefficient value of Ki in the equation for creep crack growth rate. R is the gas constant ( = 8.3145 × 10 3   k J / m o l ), T is the absolute temperature, a0 is the initial crack length, and af is the final crack length.
In this study, the equation of Q* and the creep fracture life, t f , k , of the CNS for P92at the stress level of σ k given by Equations (10) and (11) for P92 steel [22] were used.
Q * = 6.8 l n K i σ k 499 R T
t f , k = 1 1.27 × 10 19 K i σ k 6.8 e x p 499 R T
Using Equations (4)–(6) and Equations (10) and (11), linear cumulative damage estimation was conducted, as shown in Figure 11, for P92 steel CNS under strain- and stress-controlled conditions, including those for Alloy 617 CNS and W-added 12Cr C(T) specimens under stress-controlled conditions, and plotted as a square graph. Furthermore, these data were replotted as the logarithmic graph shown in Figure 12. From these results, a unified cumulative failure law under stress- and strain-controlled conditions was obtained, as shown in Figure 11 and Figure 12. These results show that for a sharp notched specimen of P92 steel, the failure life under strain-controlled creep and fatigue conditions exists in the region of the cyclic-dependent mechanism; however, the failure life under stress-controlled creep and fatigue conditions exists in the region of the time-dependent mechanism under the same temperature range as that under the strain-controlled condition. These results correspond well to the results shown in Figure 6.

5.4. Representation by the Manson–Coffin Law

For the case of low cycle fatigue under strain-controlled conditions, the Manson–Coffin law has been verified for the relationship between the failure life N f and plastic strain-amplitude ε P [16,17]. The definition of ε P is plastic strain amplitude at the half failure life, N f / 2 . Under the strain-controlled creep–fatigue conditions, since the failure life was found to be dominated by the cycle-dependent mechanism, as shown in Section 5.2 and Section 5.3, the applicability of the Manson–Coffin law was verified. The relationship between ε P , % , and Nf is shown in Figure 13. The results for a smooth specimen of P92 steel under fatigue conditions [23] was also added for comparison with those of the CNS in Table 5. These results show that the Manson–Coffin law given by Equation (12) is valid not only for a smooth specimen under fatigue conditions but also for the CNS under fatigue and creep–fatigue conditions.
ε P N f α = C
where α and C are constants obtained using the experiments shown in Figure 13 and Table 5, respectively.
As shown in Table 5, these results show that the quantitatively different relationship between a smooth specimen and a CNS is reflected by the value of α in Equation (12) for the case of tH = 0s, that is, 0.816 and 0.594, respectively. By contrast, C in Equation (12) is found to take approximately the same values, that is, 1.58 and 1.8, respectively. For the CNS, the high value of the local multi-axial stress T F = σ P / σ ¯ compared with that of a smooth specimen is caused due to the effect of the structural brittleness caused by the existence of a sharp notch [24], where σ P is the hydrostatic stress and σ ¯ is the equivalent stress. The value of α is considered to be sensitive to the effect of TF.
By contrast, the effect of the strain holding time on Equation (12) was found to be reflected by the value of C given by the results with and without a strain holding time of 600s for the CNS, as shown in Figure 13 and Table 5. This indicates a parallel shift of the Manson–Coffin line. The value of C is considered to be affected by the time-dependent mechanism, that is, stress relaxation.
From these results, the Manson–Coffin law was found to be applicable not only to the case of a smooth specimen under low cycle fatigue but also to the case of the CNS under low cycle fatigue and creep–fatigue conditions for different values of α and C.

5.5. Discussion

Creep–fatigue testing of a smooth specimen was conducted to estimate the mechanical performance and predict failure life. The linear and nonlinear damage summation rules to estimate failure life have been proposed and standardized [7,8,18]. However, for an engineering structure, it is necessary to set the maintenance inspection period by predicting the crack growth life. Studies of failure laws of creep crack growth life have been conducted, and the standardization is in progress [4].
However, concerning the prediction of crack growth life under stress-controlled creep–fatigue conditions, studies are still underway [5,6]. Under strain-controlled creep–fatigue conditions, since the specimen is different from a C(T) specimen, for example, a circular notched round bar specimen, it is first necessary to establish a conversion formula for the direct current electric potential drop (DCPD) method to measure the crack growth length. A conversion formula and estimation method [1,2] have been proposed, and the validity of using this method is considered to be established for application to P92 steel, as shown in this study. This study concerns the comparative estimation method for crack growth life under both strain- and stress-controlled conditions.

5.6. Limitations

Identifying the reasons why fracture or failure life is dominated by the time-dependent mechanism under stress-controlled conditions and dominated by the cycle-dependent mechanism under strain-controlled conditions remains an open problem. In this study, a comparison of the experimental results was conducted; however, the difference between the behaviors was considered to be caused by the different types of damage formulation, such as the vacancy diffusion mechanism. Theoretical analysis based on vacancy diffusion behavior under strain- and stress-controlled conditions is a problem to be addressed in the future.

6. Conclusions

Detailed experiments and analyses on the life prediction of crack growth for P92 steel were conducted using a CNS under strain- and stress-controlled creep and fatigue conditions. The following results were obtained.
  • The cycle-sequential characteristics of the nominal stress range, σ n e t , was found to monotonously decrease against the applied strain cycles, which verifies the previous result [1] and makes it possible to accurately determine the failure life and crack initiation using the reduction ratio of the nominal stress range, σ n e t , as proposed in the previous study [1].
  • The effect of specimen diameter on the crack growth curve was found to be well-controlled by the initial net section diameter Dnet, and to show good correlation between Δ a / D n e t and η. This result shows that crack growth life is not dominated by the crack length but by the ratio of the crack length to the initial net section diameter of the specimen.
  • The crack growth life of the CNS under strain-controlled creep–fatigue conditions for P92 steel was found to be dominated by the cycle-dependent mechanism in a strain range from 0.3% to 0.5%. By contrast, the crack growth life of the CNS under stress-controlled creep–fatigue conditions for P92 steel was mainly dominated by the time-dependent mechanism in the same temperature range.
  • A unified cumulative failure law under stress- and strain-controlled conditions was investigated. The results show that, for a sharp notched specimen of P92 steel, the failure life under strain-controlled creep and fatigue conditions exists in the region of the cycle-dependent mechanism; however, the failure life under stress-controlled creep and fatigue conditions exists in the region of the time-dependent mechanism under the same temperature range as that under strain-controlled conditions. These results correspond well to the results in point 3 above.
  • Under strain-controlled creep and fatigue conditions for the CNS, since the crack growth life was dominated by the cycle-dependent mechanism in a strain range from 0.3% to 0.5%, the Manson–Coffin law was found to be applicable not only to a smooth specimen under low cycle fatigue but also to the CNS under low cycle fatigue and creep–fatigue conditions with different values of α and C.

Author Contributions

Conceptualization, A.T.Y.J.; Methodology, A.T.Y.J., G.O., K.J., H.S., R.S. and I.N.; Validation, A.T.Y.J., G.O., R.S. and I.N.; Formal analysis, A.T.Y.J., G.O., K.J. and H.S.; Investigation, A.T.Y.J., K.J., H.S., R.S. and I.N.; Data curation, A.T.Y.J. and G.O.; writing—original draft preparation, A.T.Y.J.; writing—review and editing, G.O. All authors have read and agreed to the published version of the manuscript.

Funding

This research received no external funding.

Data Availability Statement

The original contributions presented in this study are included in the article. Further inquiries can be directed to the corresponding author.

Acknowledgments

We deeply appreciate Sakamoto A. and Fukuda T. for very useful discussions on the experimental data for creep fracture life for, Alloy617 and CNS W-12Cr C(T).

Conflicts of Interest

The authors declare no conflicts of interest.

References

  1. Sugiura, R.; Yokobori, A.T., Jr.; Nakagawa, T.; Adachi, T.; Nonaka, I.; Tabuchi, M.; Hasegawa, Y.; Matsuzaki, T. Characterizations of creep and fatigue crack initiation and growth life for P92 using circular notched round bar specimen. In Creep and Fatigue Interactions: Test Methods and Models; Saxena, A., Dogan, B., Eds.; ASTM International: West Conshohocken, PA, USA, 2011; Volume 9, pp. 67–86. [Google Scholar]
  2. Ozeki, G.; Yokobori, A.T., Jr.; Tabuchi, M.; Hayakawa, M.; Nikbin, K. Testing and Estimation Methods of Crack Growth Life for Alloy 617 Under Strain-Controlled Creep and Fatigue Conditions Using Circular Sharp Notched Round bar Specimen. In Advances in Accelerated Testing and Predictive Methods in Creep, Fatigue, and Environmental Cracking; ASTM International STP1643: West Conshohocken, PA, USA, 2023; pp. 42–62. [Google Scholar] [CrossRef]
  3. Awaji, K.; Yokobori, A.T., Jr.; Yokobori, T. The variation of the stress singularity at the notch tip as notch angle and radius of curvature. Comput. Struct. 1986, 22, 25–30. [Google Scholar] [CrossRef]
  4. ASTME1457-19; Standard Test Method for Measurement of Creep Crack Growth Times in Metals. ASTM International: West Conshohocken, PA, USA, 2019. [CrossRef]
  5. Mehmanparast, A.; Davies, M.; Nikbin, K. Evaluation of the testing and analysis methods in ASTM E2760-10 Creep and fatigue crack growth testing standard for a range of steel. In Creep and Fatigue Interactions. Test Method and Models; Saxena, A., Dogan, B., Eds.; ASTM International: West Conshohocken, PA, USA, 2011; Volume 8, pp. 1–18. [Google Scholar]
  6. Yokobori, A.T., Jr.; Sugiura, R.; Kimoto, S.; Yoshino, D.; Matsuzaki, T. Law of crack growth life for P92 steel under the conditions of creep and fatigue multiplication and projection of the threshold temperature of creep crack growth based on this law. In Proceedings of the ASME Pressure Vessels and Piping Conference PVP2009, Prague, Czech Republic, 26–30 July 2009; ASME: New York, NY, USA, 2009. [Google Scholar]
  7. ASME. ASME Boiler & Pressure Vessel Code; Sec., III, Division 5; ASME: New York, NY, USA, 2021. [Google Scholar]
  8. ASTM E2714-13; Standard Test Method for Creep and Fatigue Testing. ASTM International: West Conshohockencken, PA, USA, 2020. [CrossRef]
  9. Robinson, E. Effect of temperature variation on the long time rupture strength of steels: Trans. ASME 1952, 74, 777–780. [Google Scholar] [CrossRef]
  10. Taira, S. IUTAM Colloquium; Springer: New York, NY, USA, 1962; p. 96. [Google Scholar]
  11. Lemaitre, J.; Plumtree, A. Application of damage concepts to predict creep damage failures. J. Eng. Mater. Technol. Trans. ASME 1979, 101, 284–292. [Google Scholar] [CrossRef]
  12. Bui-Quoc, T.; Biron, A. A phenomenological approach for the analysis of combined fatigue and creep. Nucl. Eng. Des. 1982, 71, 89–102. [Google Scholar] [CrossRef]
  13. Shimakawa, T.; Suzono, N.; Usui, Y.; Fukuda, Y.; Kasahara, N. Current status and issues on creep and fatigue life evaluation in elevated temperature design guidance. Jpn. High Press. Inst. 2001, 39, 19–31. (In Japanese) [Google Scholar]
  14. Koo, G.-H.; Lee, S.-Y.; Seo, J.-H.; Song, K.-H.; Choi, G.-S. A study on creep and fatigue evaluation of nuclear cladded components by ASME-III, Division. Metals 2023, 16, 2898. [Google Scholar] [CrossRef]
  15. Nonaka, I. Creep and fatigue life estimation of gr.91 steel and its welded joints. Metals 2023, 13, 1880. [Google Scholar] [CrossRef]
  16. Manson, S.S. Behavior of Materials Under Conditions of Thermal Stress; National Advisory Committee for Aeronautics: Washington, DC, USA, 1953. [Google Scholar]
  17. Coffin, L.F. A study of the effects of cyclic thermal stresses on a ductile metal. Trans. ASME 1954, 76, 931–950. [Google Scholar] [CrossRef]
  18. ISO 12106; Metallic Materials—Fatigue Testing—Axial-Strain-Controlled Method. ISO: Geneva, Switzerland, 2017.
  19. Johnson, H.H. Calibrating the Electric Potential Method for Studying Slow Crack Growth. Mater. Res. Stand. 1965, 5, 442–445. [Google Scholar]
  20. Schwalbe, K.H.; Hellmann, D. Application of the Electric Potential method to Crack Length Measurement Using Johnson’s Formula. J. Test. Eval. 1981, 9, 218–221. [Google Scholar] [CrossRef]
  21. Yokobori, A.T., Jr.; Kuriyama, T.; Kaji, Y.; Yokobori, T. The Effect of the Stress rate in a Cycle and the Stress Hold Time respectively on Fracture Life under High Temperature Creep and fatigue, and Creep and fatigue Multiplication Conditions. Jpn. Soc. Strength Fract. Mater. 1986, 21, 25–32. [Google Scholar]
  22. Yokobori, A.T., Jr.; Tabuchi, M. The Chapter of Q* Parameter for Crack Growth Prediction. In Comprehensive Structural Integrity, 2nd ed.; Ferri, M.H.A., Winston, S., Eds.; Elsevier: Amsterdam, The Netherlands, 2023; pp. 434–452. [Google Scholar] [CrossRef]
  23. Wang, X.; Gong, J.; Zhao, Y.; Wang, Y.; Yu, M. Characterization of Low Cycle Fatigue of New Ferritic-Martensitic P92 Steel at High Temperature, Effect of Strain Amplitude, Steel. Res. Int. 2015, 86, 1046–1055. [Google Scholar]
  24. Yokobori, A.T., Jr.; Sugiura, R.; Tabuchi, M.; Fuji, A.; Adachi, T.; Yokobori, T. The Effect of Multi-Axial Stress Component on Creep Crack Growth Rate Concerning Structural Brittleness. In Proceedings of the 11th International Conference on Fracture, Turin, Italy, 20–25 March 2005; ICF: Lexington, Kentucky, 2005. CD-ROM. [Google Scholar]
Figure 1. Dimensions of the CNS used for experiments under strain-controlled creep–fatigue conditions.
Metals 15 00737 g001
Figure 2. Dimensions of the CNS used for the experiments under stress-controlled creep–fatigue conditions.
Metals 15 00737 g002
Figure 3. A schematic illustration of the experimental equipment and the measurement method.
Metals 15 00737 g003
Figure 4. Cycle sequential characteristics of σnet t of CNS for P92 steel under strain-controlled creep–fatigue conditions at temperatures of 600 and 630 °C and at the applied strain ranges of 0.3, 0.4 and 0.5%, ε ˙ = 0.1%/s.
Metals 15 00737 g004
Figure 5. The relationship between the crack length from an initial notch measured using DCPD Δa and the reduction ratio of stress range η at temperatures of 600 and 630 °C and applied strain ranges of 0.3, 0.4, and 0.5%.
Metals 15 00737 g005
Figure 6. Separate discrimination of the cycle-dependent mechanism from the time-dependent mechanism under stress- and strain-controlled conditions.
Metals 15 00737 g006
Figure 7. The relationship between Δa/Dnet and η.
Metals 15 00737 g007
Figure 8. Separate estimation method of the cycle-dependent mechanism from the time-dependent mechanism for crack growth life.
Metals 15 00737 g008
Figure 9. Stress relaxation curve at Nf/2.
Metals 15 00737 g009
Figure 10. Schematic illustration of the derivation method in Equation (4).
Metals 15 00737 g010
Figure 11. Estimation using the linear cumulative damage law, including the data for P92 CNS, Alloy617 CNS, and W-12Cr C(T) under stress-controlled conditions, plotted on a square graph.
Metals 15 00737 g011
Figure 12. Estimation using the linear cumulative damage law, including the data for P92 CNS, Alloy617, and CNS W-12Cr C(T) under stress-controlled conditions, plotted on a logarithmic graph.
Metals 15 00737 g012
Figure 13. The relationship between plastic strain amplitude at the half failure life, Δεp at the Nf/2 and failure life Nf under applied strain amplitude ∆ε values of 0.3, 0.4, and 0.5%.
Metals 15 00737 g013
Table 1. Chemical composition (mass%) of P92 steel.
CSiMnPSCrMoWNbVNB
0.0850.260.490.0060.00128.850.501.800.060.200.05100.0030
Table 2. Mechanical properties of P92 steel.
0.2YS (MPa)TS (MPa)Uniform EL (%)EL (%)RA (%)
5837312.6827.674.6
Table 3. Experimental conditions and failure lives under strain-controlled conditions.
dε/dt
[%/s]
Temp.
[°C]
Diameter, D
[mm]
∆ε
[%]
tH
[s]
Nf
[-]
Metals 15 00737 i001
0.1600100.3 02980
6001000
36001240
630
01310
6001035
36001125
63060.40372
600365
0.50168
600160
Table 4. Experimental conditions and crack growth lives under stress-controlled conditions.
σnet
[MPa]
Kin
[MPa√m]
Temp.
[°C]
tR = tD
[s]
tH
[s]
tf
[h]
Metals 15 00737 i002
30014600350172.1
600533
3600985.2
Creep1189
61535088.3
600279.4
3600186.3
63035066.3
60038.4
360054.8
Creep31.7
Table 5. Experimental values of α and C for CNS and smooth specimens.
SpecimenTemp.
[°C]
tH
[s]
α
[-]
C
[-]
CNS63000.5941.8
6000.5213.2
Smooth63000.8161.58
Disclaimer/Publisher’s Note: The statements, opinions and data contained in all publications are solely those of the individual author(s) and contributor(s) and not of MDPI and/or the editor(s). MDPI and/or the editor(s) disclaim responsibility for any injury to people or property resulting from any ideas, methods, instructions or products referred to in the content.

