Article

Understanding Shock Response of Body-Centered Cubic Molybdenum from a Specific Embedded Atom Potential

National Key Laboratory of Science and Technology for High-Strength Structural Materials, Central South University, Changsha 410083, China
*
Authors to whom correspondence should be addressed.
Metals 2025, 15(6), 685; https://doi.org/10.3390/met15060685
Submission received: 20 May 2025 / Revised: 15 June 2025 / Accepted: 16 June 2025 / Published: 19 June 2025
(This article belongs to the Special Issue Mechanical Structure Damage of Metallic Materials)

Abstract

:
Extreme conditions induced by shock exert unprecedented force on crystal lattice and push atoms away from their equilibrium positions. Nonequilibrium molecular dynamics (MD) simulations are one of the best ways to describe material behavior under shock but are limited by the availability and reliability of potential functions. In this work, a specific embedded atom (EAM) potential of molybdenum (Mo) is built for shock and tested by quasi-isentropic and piston-driven shock simulations. Comparisons of the equation of state, lattice constants, elastic constants, phase transitions under pressure, and phonon dispersion with those in the existing literature validate the reliability of our EAM potential. Quasi-isentropic shock simulations reveal that critical stresses for the beginning of plastic deformation follow a [111] > [110] > [100] loading direction for single crystals, and then polycrystal samples. Phase transitions from BCC to FCC and BCC to HCP promote plastic deformation for single crystals loading along [100] and [110], respectively. Along [111], void directly nucleates at the stress concentration area. For polycrystals, voids always nucleate on the grain boundary and lead to early crack generation and propagation. Piston-driven shock loading confirms the plastic mechanisms observed from quasi-isentropic shock simulation and provides further information on the spall strength and spallation process.

Graphical Abstract

1. Introduction

The shock responses of metals and alloys are of great importance in aerospace, transportation, energy equipment (fusion reactors), and weapon applications [1,2,3]. Molybdenum (Mo), as a typical refractory metal, is widely used in extreme shock conditions due to its high melting point and strength, outstanding thermal stability, and corrosion resistance [4,5]. The operational environments in these application areas are typically characterized by high strain rate, high temperatures, and high pressures. Such extreme conditions will exert unprecedented forces on Mo crystal lattice and push atoms away from their equilibrium positions, leading to plastic deformation and spallation. Consequently, understanding the dynamic response, especially the plastic behavior, of Mo under extremely high strain rate, high temperature, and high pressure induced by shock is crucial for the rational design of Mo-based materials.
The dynamic response of Mo under extreme shock is hard characterize from experiments, since monitoring the material properties over such a short time span (femtosecond (fs) to picosecond (ps) scale) is difficult [6,7]. Most experimental characterizations have been performed on the remaining samples after shock impact [8,9,10,11,12,13]. For example, Gachegova et al. [9] used laser shock peening of one side of three-millimeter-thick plates of Ti-6Al-4V covered by a sticky layer, aluminum foil, and black alkyd paint. Using EBSD analysis, they found that no significant reduction in grain size, twinning, or dislocation density growth occurred as a result of laser shock peening, irrespective of the initial structure. Akhmedov et al. [10] conducted shock compression to examine the lattice behavior of Mo under high pressure, validating the characteristics of transgranular fracture in single crystals and intergranular fracture in polycrystalline systems. Oniyama et al. [11] investigated the impact of crystallographic anisotropy on the mechanical response of Mo single crystal along different crystallographic orientations at 110 GPa, finding strong mechanical anisotropy along different shock directions. By shock-induced elastic-plastic deformation, Mandal et al. [13] compared high-purity single crystals of Mo shocked along the [110] and [111] orientations to an elastic impact stress of 12.5 GPa with [100] direction. The measured wave profiles showed a time-dependent response and strong anisotropy. Huang et al. [14] reported that the equation of state (EOS) of Mo can be obtained by an integrated technique of laser-heated DAC and synchrotron X-ray diffraction. Johanns et al. [15] performed in situ tensile test in a dual-beam-focused ion beam and scanning electron microscope on as-grown and pre-strained single-crystal molybdenum-alloy fibers. Even though in situ XRD could reveal the phase transformation or, indirectly, the plastic mechanism using the Linac Coherent Light Source [16], it is still challenging to track the atomic or microstructural evolution during the shock process.
Molecular dynamics (MD) simulations have been proven to be a reliable method for exploring the mechanical properties of materials under extreme conditions and can monitor the atomic and defect evolutions under extreme shock processes at a similar time scale (fs~ps) [7,13,17,18,19,20,21,22,23]. Different simulation loading methods have been successfully employed to explore the behaviors of various materials under extreme shock conditions [13,24,25,26,27,28,29,30,31]. For instance, Zepeda-Ruiz et al. [27] present fully dynamic atomistic simulations of bulk single-crystal plasticity in the body-centered-cubic metal tantalum. They found that, on reaching certain limiting conditions of strain, dislocations alone can no longer relieve mechanical loads; instead, another mechanism, known as deformation twinning, takes over as the dominant mode of dynamic response. Hu et al. [29] conducted static tensile simulations on nano-polycrystalline (NPC) Mo and investigated the effects of grain size and temperature on its physical properties, unravelling the differences regarding mechanical characteristics and intrinsic deformation behaviors between NPC Mo and single-crystal Mo. Frederiksen et al. [30] researched the high-strain-rate plastic deformation of nanocrystalline Mo. Their results demonstrate that both dislocation migration and grain boundary (GB) processes contribute to plastic deformation. Mostafa et al. [31] employed molecular dynamics simulations to develop an embedded-atom method (EAM) potential for Mo, enabling the analysis of nanoscale structural transformations, demonstrating the MD’s capability in describing static properties. However, currently constructed potential functions lack specialized descriptions for metals or alloys under extreme conditions like high strain rate, high temperature, and high pressure. For example, the simulation results of Lee et al. [32], Han et al. [33], and Park et al. [34] capture the properties of the corresponding metals well, but the potential functions employed in their studies were not specifically tailored to account for high-pressure conditions. This limitation leaves room for improvement in the simulation results of these EAM potentials when compared to experimental data under extreme conditions. It is thus of importance to construct specific EAMs for extreme conditions, like shock, to reveal the intrinsic deformation mechanism.
In this work, we aim to investigate the dynamic mechanical response of Mo under extreme shock conditions. We adopted a new EAM potential function, specifically designed for high-velocity impact simulations, which has been validated by its developers through satisfactory reproduction of tantalum’s performance characteristics. Based on this specific potential for shock simulation, we unraveled the microstructural evolution in spallation regions during shock loading using both quasi-isentropic loading and piston-driven impact methods. The structural transformations and anisotropic mechanical responses were analyzed by intentionally loading along different loading orientations. Additionally, the influence of grain boundaries on the dynamic mechanical properties of the material was examined through simulations of single-crystal and polycrystalline systems. The details of the simulation and analysis methodologies are discussed in Section 2, while the key findings are presented in Section 3. Conclusions are drawn in Section 4.

2. Computational Details

In this study, we employed the embedded-atom method (EAM) potential form developed by Ravelo et al. [35] (hereafter abbreviated as the Ravelo EAM potential) and re-parameterized for Mo to describe atomic interactions of Mo and conduct nonequilibrium molecular dynamics (MD) simulations. Compared to traditional EAM potentials, the Ravelo EAM potential provides a more accurate description of interatomic interactions under high-pressure conditions, particularly in shock wave simulations.

2.1. EAM Potential Functions and Parametrization

The potential energy in the Ravelo EAM potential consists of the embedding energy and the pair potential. Notably, the embedding energy is not determined by traditional semi-empirical formulas but is instead derived from the solid equation of state (EOS). The EOS curve is described using the Rydberg function [36] form proposed by Rose et al. [37], with results obtained from first-principles calculations. Distinctively, the Ravelo EAM potential introduces high-pressure properties into the fitting procedure by utilizing cubic and quartic terms. The cubic and quartic coefficients, f3 and f4, are normally set to zero for low-pressure applications but become important under high-pressure conditions. The inclusion of these two parameters extends the functional form of the Ravelo EAM potential beyond conventional potential functions, thereby enhancing its applicability under high-pressure conditions.
E E O S a * = E c 1 + a * + f 3 a * 3 + f 4 a * 4 e a * ,
a * = α a a 0     1
In the above equations, a * represents the dimensionless linear strain parameter, while a 0 and a denote the equilibrium lattice constant and the lattice constant under non-equilibrium conditions, respectively.
Once the fitted function of the EOS is obtained, the embedding energy can be numerically determined as follows:
F ρ ¯ = E E O S a     1 2 j i ϕ r i j
In the Ravelo EAM potential, the pairwise interaction is divided into three segments within the cutoff radius:
ϕ r = U 0 1 + r * + β 3 r * 3 + β 4 r * 4 e r *       0     r     r s U 0 r c r s i = 1 4 a i r c r i 1         r s     r     r c 0                         r > r c
r * = α p r r 1     1
In Equations (4) and (5), r * is analogous to the previously defined a * , both being dimensionless distance parameters. The parameters r1, rs, rc, s, αp, U0, β3, and β4 are all fitting parameters. The coefficient a i is uniquely determined by enforcing the continuity of the piecewise function ϕ r , as well as the equality of its first, second, and third derivatives at r = r s .
The electronic density function w (r) in the Ravelo EAM potential adopts a simple continuous piecewise functional form that has been employed in the study of high-stress plastic deformation in metals [38]:
w r = ρ 0 r C P r P r C P r 0 P q                       0     r     r C 0                                                                                 r > r C
In Equation (6), r 0 is the equilibrium nearest-neighbor distance at P = T = 0. The functional form exhibits qualitative similarity to a Gaussian function and smoothly approaches zero at the cutoff distance r C . The parameter ρ 0 is determined by the normalization condition, and p, q, and r C are fitting parameters.

2.2. Quasi-Isentropic Shock Loading Setting

Using the open-source MD code LAMMPS [39], we investigated the plastic behavior using quasi-isentropic shock along different loading orientations in both single-crystal and polycrystalline systems. We selected three principal crystallographic orientations—<100>, <110>, and <111>—as loading directions to investigate the anisotropic response of single-crystal Mo under uniaxial shock tensile. We also set up a polycrystalline Mo system for comparison with the single-crystal system. The simulation box was constructed with orthogonal lattice vectors following the right-hand rule, where the Z-axis was fixed as the loading direction. To enhance the observation of microstructural evolution, the box was elongated along the loading (Z) direction. Prior to loading, periodic boundary conditions (PBCs) were applied in all three dimensions. The initial atomic configuration was subjected to energy minimization, followed by equilibration in the NPT ensemble at 300 K for 100 ps before the shock loading process. Details such as the coordinate system and number of atoms of the three simulation boxes are shown in Table 1.
The loading process employed a constant strain rate control scheme with an integration timestep of 1 fs. To precisely track microstructural evolution during deformation, atomic configurations and associated attributes (including kinetic energy, potential energy, stress tensors, and so on) were written to trajectory files at 1 ps intervals, corresponding to 0.1% strain increments. The simulation encompassed the complete deformation process from initial unstrained conditions through ultimate material failure.

2.3. Piston Shock Loading Setting

For piston shock loading tests, we configured the test specimens similarly to quasi-isentropic conditions: single-crystal Mo along the [100], [110], and [111] crystallographic orientations and a polycrystalline case. The simulation involved designating several atomic layers at the bottom of the system as a rigid piston, which was then assigned an initial velocity to simulate shock loading. The loading protocol consisted of a three-stage ‘acceleration/sustain/deceleration’ sequence: (1) linear acceleration to the target impact velocity within a predefined time, (2) maintenance at constant velocity for a specified duration, and (3) linear deceleration to complete rest. Proper configuration of these temporal parameters and sample characteristics yielded physically meaningful observations. The piston impact parameters are detailed in Table 2.
For the examination of structural evolution, we utilized the visualization software OVITO (Version 3.12) [40] along with its integrated modifiers. To perform sophisticated structural analyses, we applied the common neighbor analysis (CNA) [41,42] algorithm and dislocation extraction algorithm (DXA) [43,44].

3. Results and Discussion

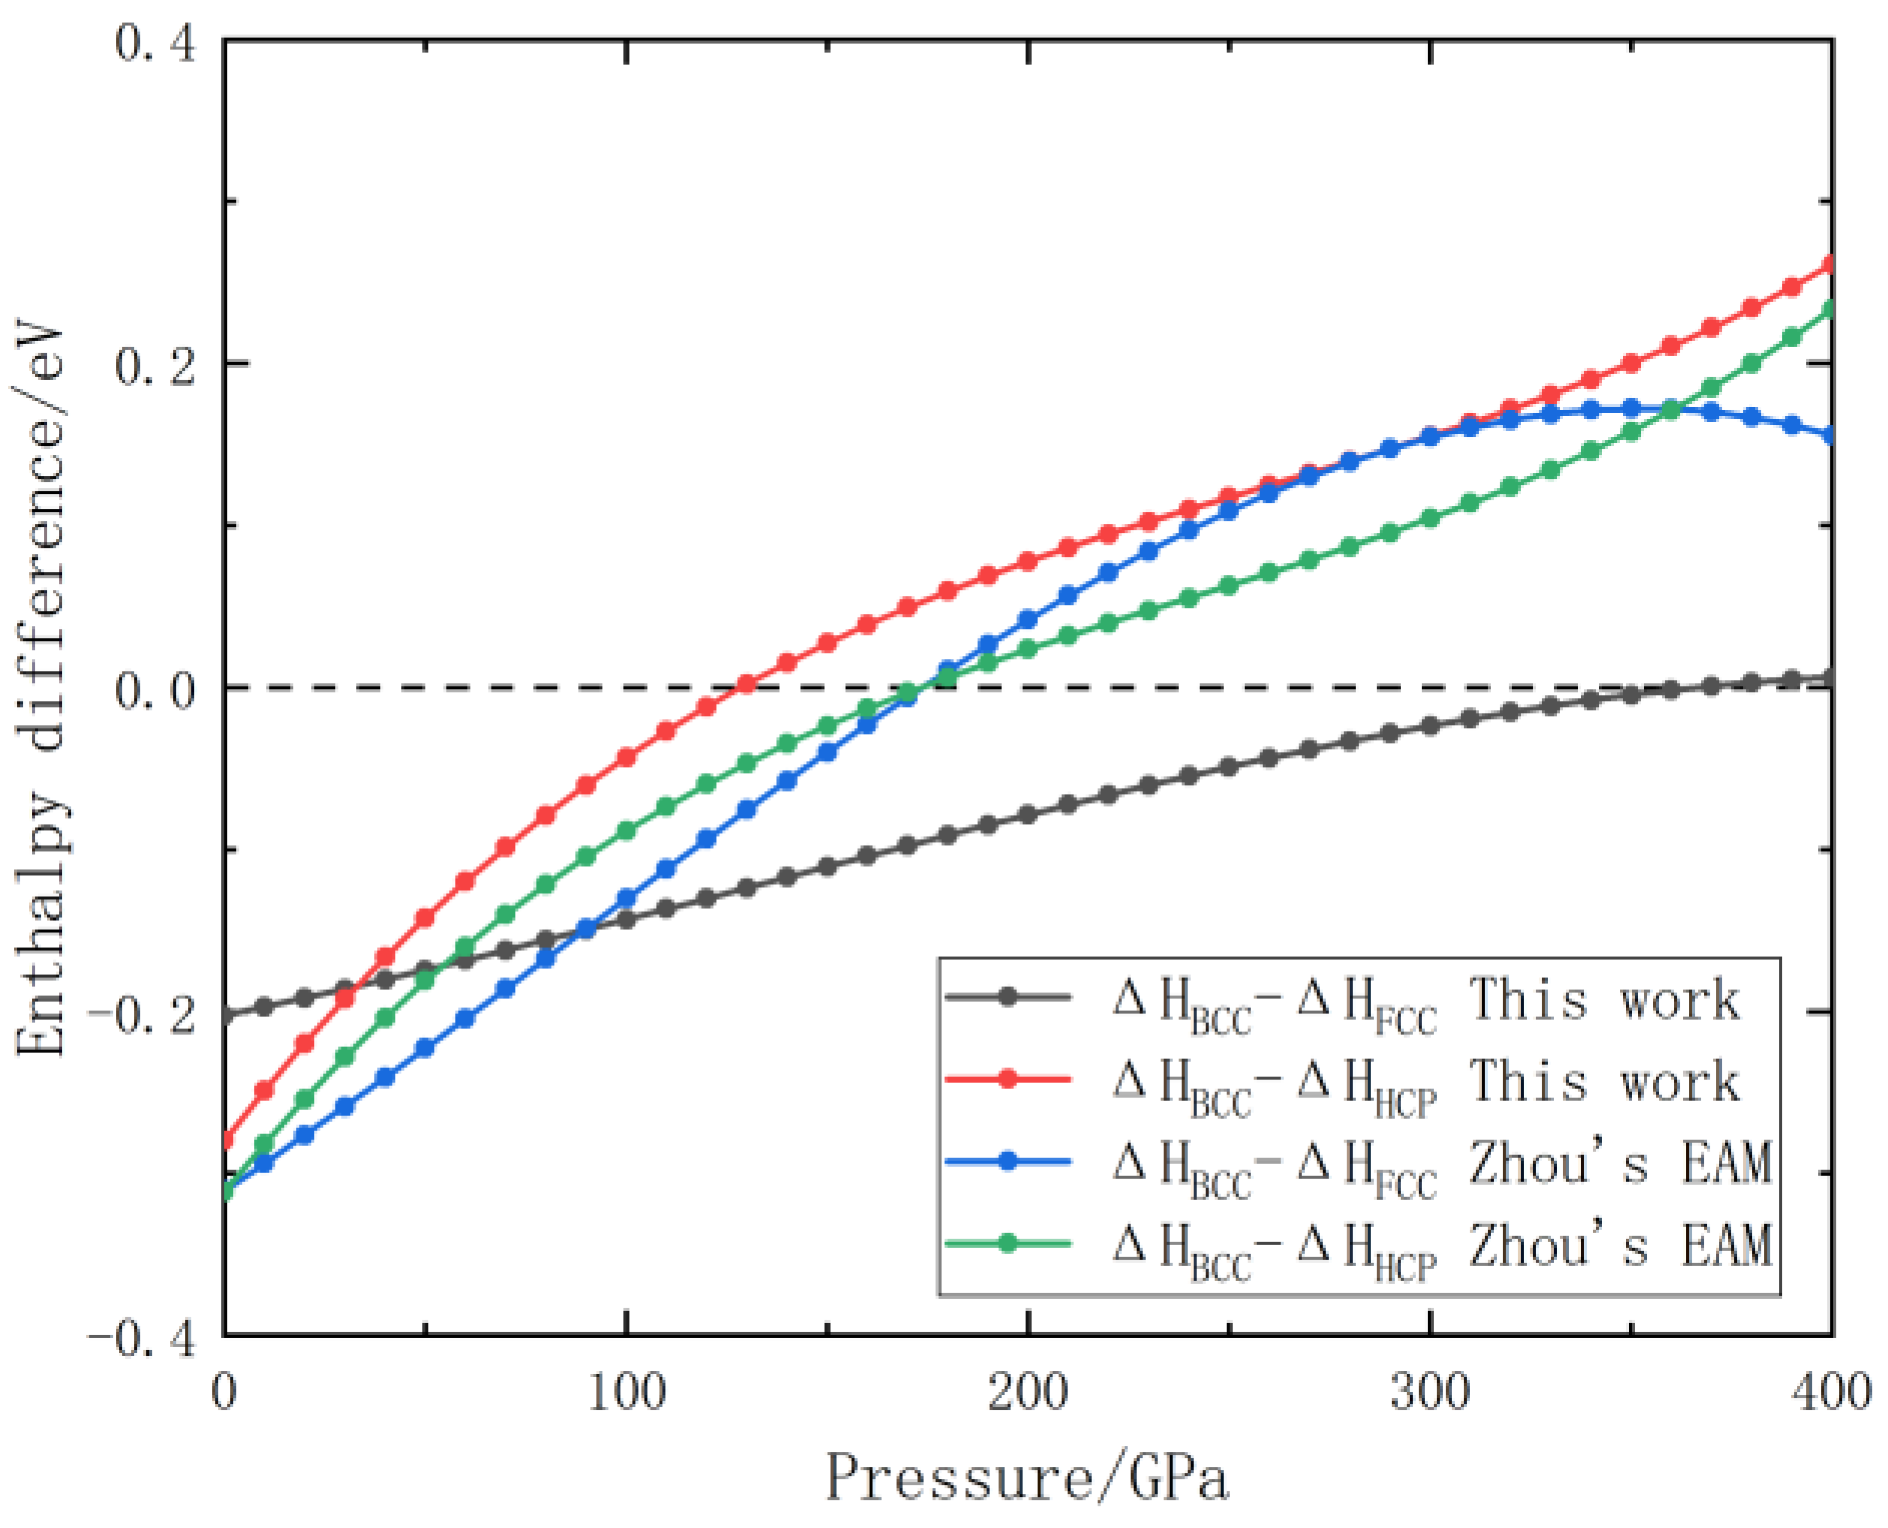
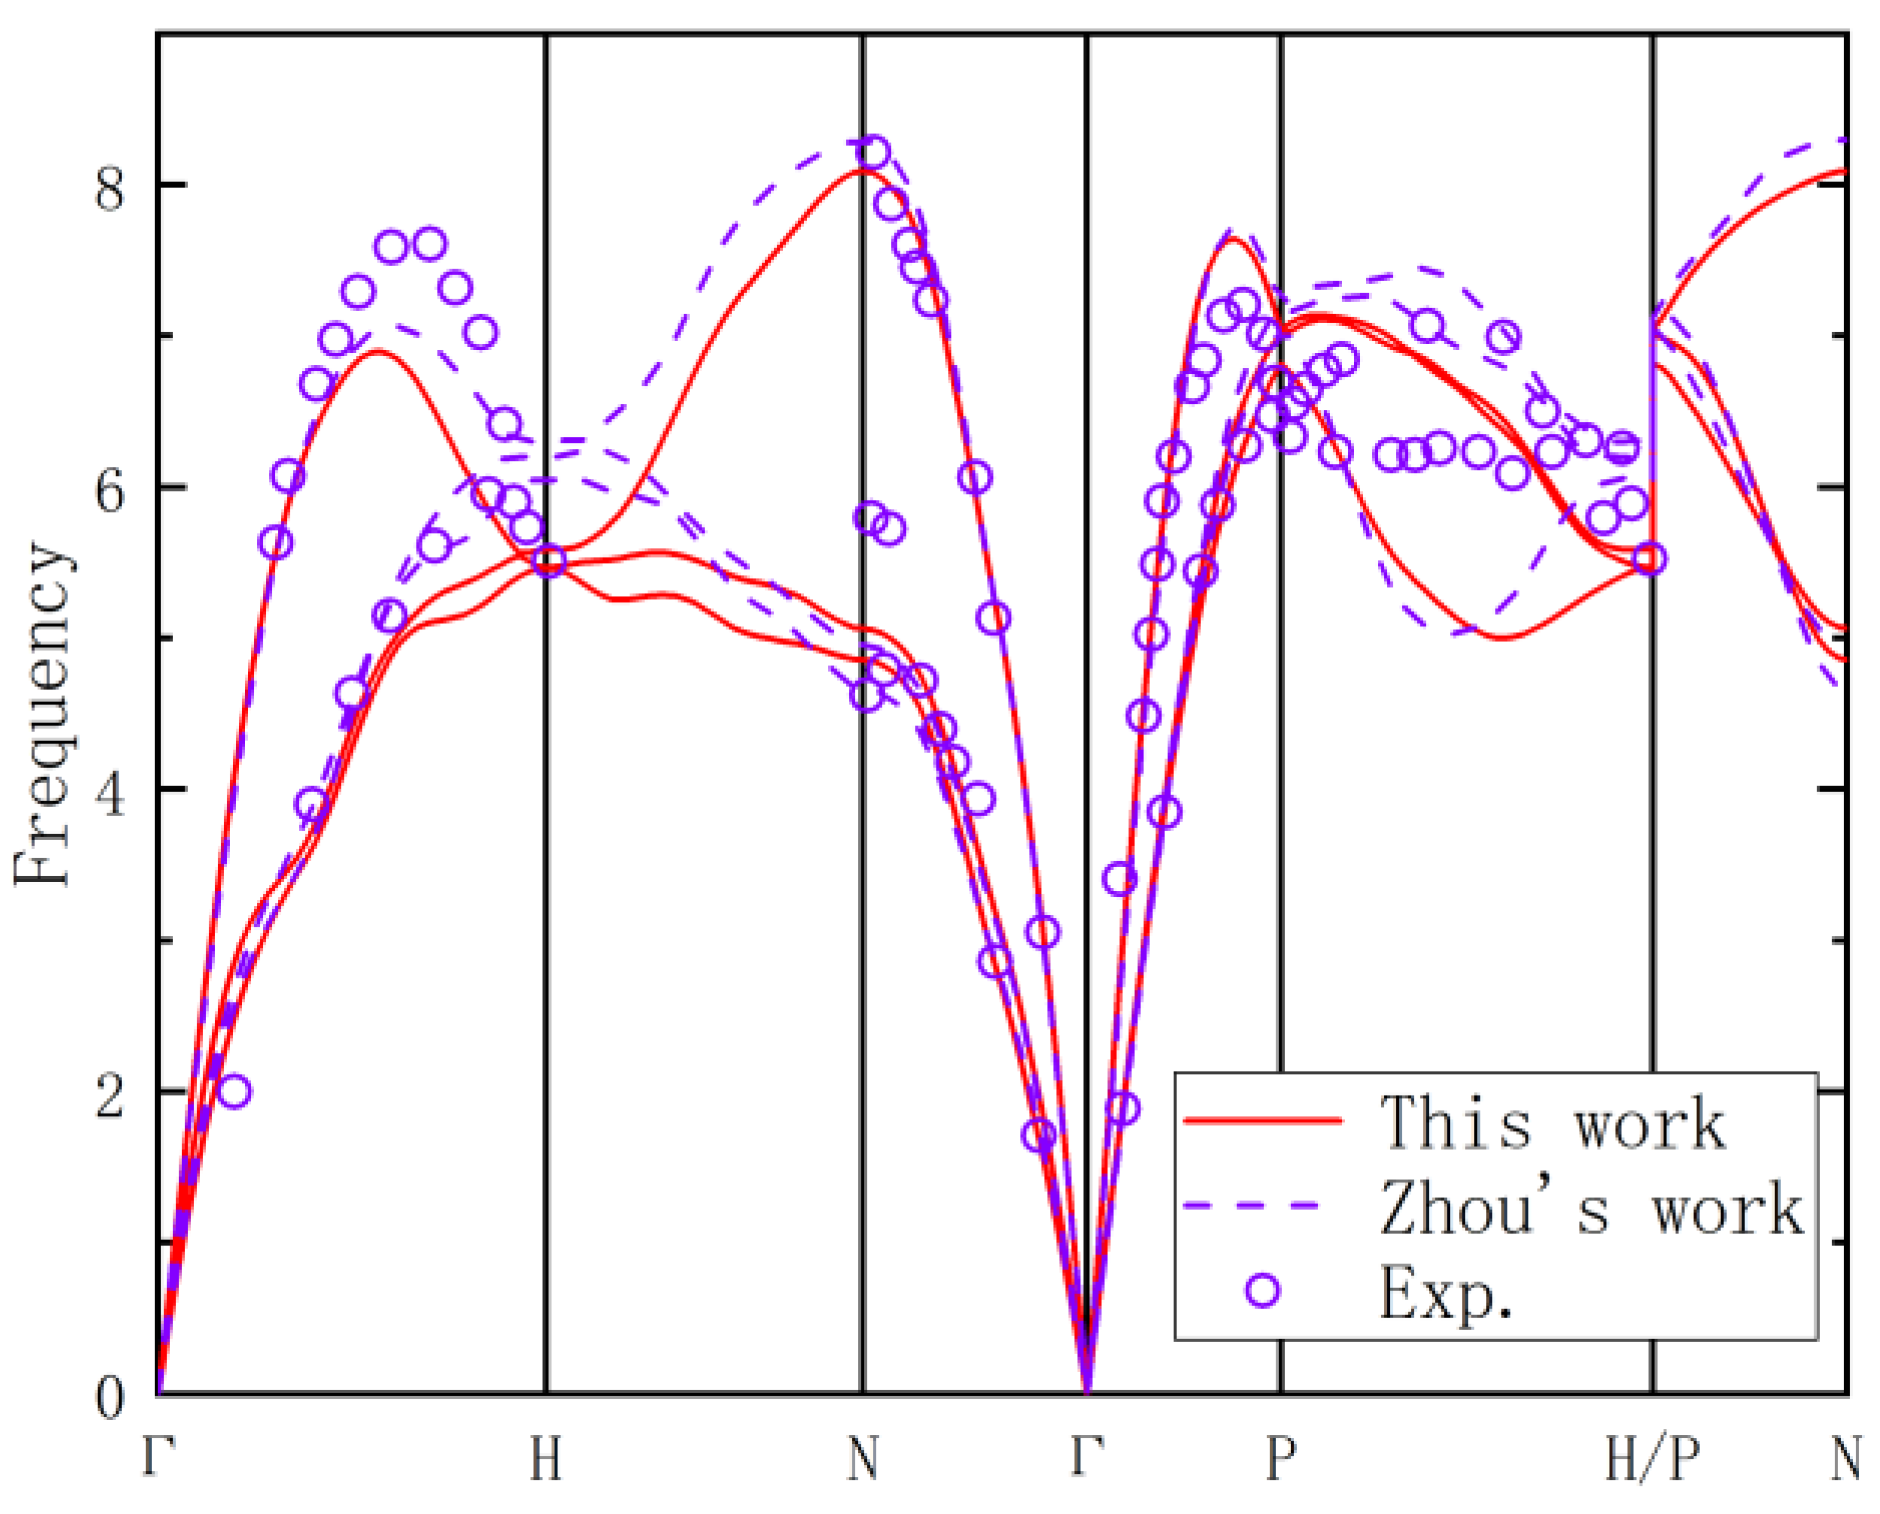
3.1. Validation of EAM Potential

The determined parameter set of the Ravelo EAM potential function for Mo, optimized through multiple rounds of simulated annealing iterations, is presented in Table 3. Concurrently, we have obtained the standard-format EAM potential function file using these parameters. The accuracy of the fitted potential was systematically validated by evaluating fundamental properties using the LAMMPS. In Table 4, we list some mechanical properties of BCC Mo evaluated with the EAM potentials along with corresponding experimental values and values from DFT calculations [34], which including lattice constant (a0), cohesive energy (Ec), and elastic constants (C11, C12, C44).
Comparative analysis demonstrates that the Ravelo EAM potential exhibits superior accuracy in describing equilibrium properties of Mo with respect to both experimental measurements and alternative potentials (e.g., MEAM) [34]. It is worth noting that the calculated lattice constant (a0 = 3.146 Å ) shows perfect agreement with experimental data (a0 = 3.146 Å , Ec = −6.81 eV), while the cohesive energy (Ec = −6.805 eV) deviates only minimally. For elastic constants, the Ravelo EAM potential achieves significantly smaller errors compared to MEAM and GGA-PBE results [34]. Specifically, C12 (161.64 GPa) and C44 (108.36 GPa) values exhibit negligible deviations from experiments (C12 = 161.5, C44 = 108.9 GPa), while C11 (453.65 GPa) maintains a relative error below 3%. The overall consistency between simulated and experimental values highlights the potential’s exceptional capability in describing Mo’s anisotropic elastic response and mechanical behavior.
In extreme pressure conditions, the stability of the potential function in describing the evolution of crystal structures and the accuracy of energy calculations directly affect the reliability of physical phenomena such as shock wave propagation and phase transition processes. A highly reliable potential function must accurately reproduce the elastic constants and lattice vibrational properties of the material under small strains near equilibrium (0.95 < V/V0 < 1.05). When the structure significantly deviates from equilibrium (V/V0 < 0.8 or V/V0 > 1.2), the potential function should also maintain good consistency with first-principles calculations in energy estimation [46]. Based on these requirements, we systematically evaluated the volume-energy (E-V) state equation of the obtained Ravelo EAM potential function using LAMMPS, and the test results are shown in Figure 1. Compared with first-principles computational data, it is evident that the Ravelo EAM potential function developed in this work demonstrates exceptional descriptive accuracy within the equilibrium structure and a certain range of volume variations (V/V0 = 0.6–1.5). Even in significantly non-equilibrium deformation regimes (V/V0 < 0.6 and V/V0 > 1.5), the structural energies computed by this potential function remain in good agreement with first-principles results.
In conventional EAM potential simulations of body-centered cubic (BCC) metals under shock loading, an ‘artificial phase transition’ phenomenon often occurs at high pressures, typically manifesting as an underestimation of the critical phase transition pressure [35]. To validate the structural stability of our developed potential under high pressure, we calculated the enthalpy difference between the bcc phase and other close-packed phases (fcc, hcp) as a function of pressure and compared the results with conventional potentials (Zhou potential) [47]. As shown in Figure 2, the BCC phase remains stable when the curve lies below the y = 0 line within the pressure range studied (~400 GPa). This is consistent with modeling for fusion observation that shows that Mo does not show any phase transition up to 500 GPa [1] and with Wang et al. [6]’s experimental observation that Mo remains in the BCC structure up to 380 GPa. The results for the pressure required for the BCC–HCP phase transition simulated in this work are also lower (less than 150 GPa), which corresponds to the experimentally observed occurrence of the BCC–HCP transition at 210 GPa and 4100 K. This demonstrates that the Ravelo EAM potential developed in this work significantly increases the critical phase transition pressures for both FCC and HCP phases compared to conventional potentials. These results confirm that the fitted Ravelo EAM potential provides a superior description of high-pressure structural stability relative to traditional potential functions. However, a limitation of our study is that the simulation process failed to fully capture the temperature-dependent characteristics of phase stability, resulting in discrepancies between our simulation results and experimental values at certain temperatures.
In addition to the aforementioned tests, we employed the LAMMPS method [48,49] to calculate the phonon dispersion of Mo in its BCC structure, thereby validating the accuracy of the potential function in describing lattice vibrational modes. The simulation results, presented in Figure 3, compare the phonon spectrum computed using our in-house EAM potential (red curves) with experimentally measured phonon data (purple hollow circles) [48,50,51,52]. The horizontal axis represents the wave vector along the high-symmetry path (Γ-H-N-Γ-P-H/P-N), while the vertical axis denotes the phonon frequency. The calculated results exhibit excellent agreement with experimental values across the entire frequency range. The potential accurately captures the lattice vibrational modes of Mo in the low-, medium-, and high-frequency regimes.

3.2. Quasi-Isentropic Shock

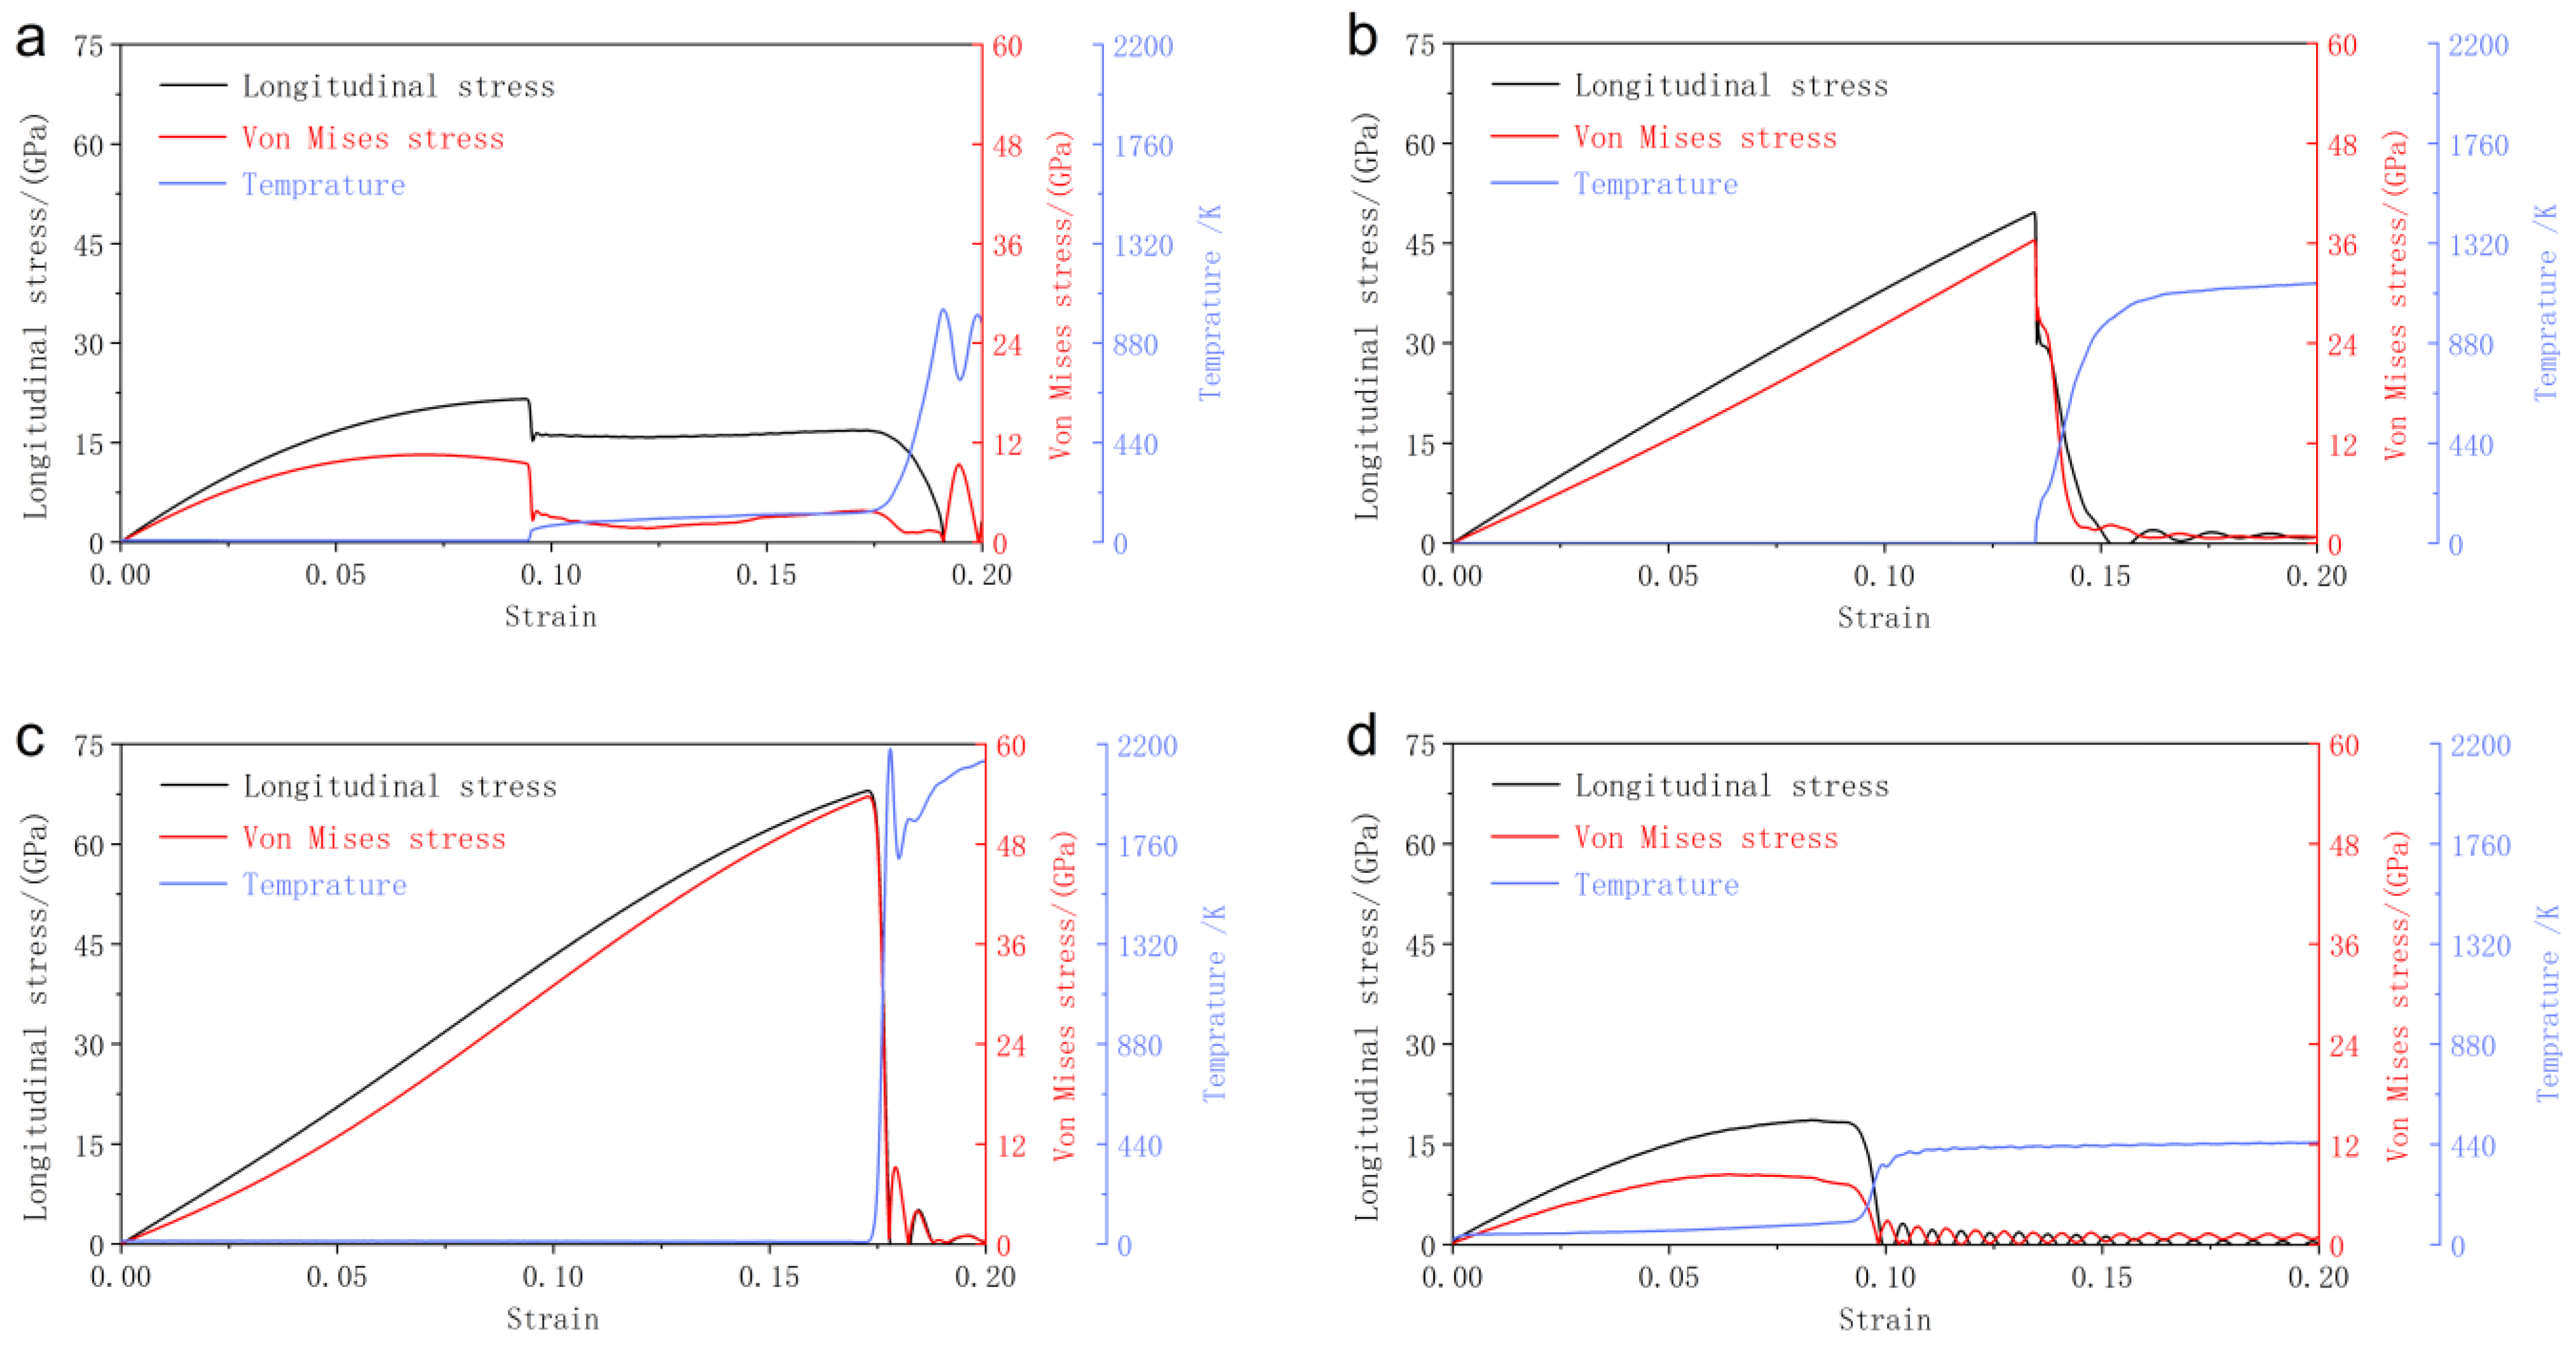
3.2.1. Mechanical Response

Figure 4 presents the evolution of longitudinal stress, von Mises stress, and temperature as functions of strain during tensile loading of the single-crystal Mo along three crystallographic orientations and of the polycrystal sample. Based on our tests, the initial temperature settings have minimal influence on the subsequent results under the extreme shock conditions simulated and have been set close to 0 K in this work. Under the same strain rate conditions, we observe that critical stresses follow a descending order: [111] (67.9 GPa) > [110] (49.6 GPa) > [100] (21.5 GPa) > polycrystal (18.6 GPa). Correspondingly, the peak von Mises stresses for the [111], [110], and [100] orientations are 53.7 GPa, 36.3 GPa, and 10.5 GPa, respectively. This value for the polycrystal sample is 8.47 GPa. The mechanical responses under each loading orientation will be discussed in detail.
We first examine the tensile test along the [100] orientation (Figure 4a). Upon reaching the maximum longitudinal stress of 21.5 GPa, the single-crystal Mo yields, followed by a stress plateau before subsequent softening. During this stage, the von Mises stress decreases correspondingly while the system temperature rises moderately, stabilizing at a plateau around 170 K. At a strain of 19%, the material reaches its macroscopic fracture threshold, characterized by abrupt stress reduction and rapid temperature rise to 1000 K.
For the [110] orientation (Figure 4b), yielding occurs at the peak longitudinal stress of 49.6 GPa, where both longitudinal and von Mises stresses exhibit rapid softening after a brief plateau at 26 GPa. The temperature surges to 1200 K immediately post-yielding.
The [111] orientation (Figure 4c) demonstrates distinct behavior: upon reaching the maximum stress of 67.9 GPa, the stresses drop precipitously to zero without any observable plateau, while the temperature escalates dramatically to 2270 K. Both the heating rate and final temperature significantly exceed those observed in the other two orientations.
Critical stress analysis reveals progressively higher slip resistance along the [100]→[110]→[111] sequence, indicating decreasing numbers of activatable slip systems in BCC Mo. This trend reflects increasing intrinsic lattice friction and required stress for slip initiation. Our measured stress sequence agrees well with Hahn et al.’s [22] earlier findings in single-crystal tantalum. The significantly higher critical stress along [111] could be understood by the Schmid factor, as demonstrated in our previous work [53] on the 24 conventional slip systems in BCC metals, which showed that the [111] orientation exhibits approximately 40% lower Schmid factor values compared to the [100] and [110] orientations. It should also be noted that in experiments, metals with body-centered cubic (BCC) structures exhibit significant non-Schmid effects [54,55]. However, such phenomena are difficult to observe through simulation processes, and the potential function adopted in this study is no exception. Therefore, in actual processes, this anisotropy should arise from the combined influence of both Schmid and non-Schmid effects.
Figure 4d illustrates the evolution of longitudinal stress, von Mises stress, and temperature with strain during tensile loading of polycrystalline Mo. Due to the complex grain boundary network and intrinsic defects within the polycrystalline sample, the longitudinal stress rapidly decreases to zero after reaching a peak value of 18.6 GPa, accompanied by a similar decline in von Mises stress. Concurrently, the temperature rises to 463 K because of crystallographic plane fracture and the nucleation and growth of voids. Both the peak longitudinal stress, von Mises stress, and temperature are much lower than those of single crystalline samples. We attribute this to the fact that grain boundaries in the polycrystalline structure facilitate plastic deformation mechanisms such as slip and void nucleation. Additionally, these interfaces reduce internal frictional resistance during plastic deformation, not only decreasing the stress required for yielding but also diminishing the energy released from internal friction during deformation. This phenomenon is further evidenced by the post-fracture final temperature of 463 K, which is significantly lower than the minimum temperature observed in single-crystal systems (1000 K for the [100] orientation).
It is also important to note that the crystal cells constructed in the simulation (particularly single-crystal cells) are idealized as perfect structures, which fundamentally differ from real-world materials, because of pre-existing dislocations. Even though a relaxation process was incorporated in the simulation, it remains challenging to replicate the inherent defects that are inevitably present in real ‘perfect’ materials. Therefore, it is reasonable that the numerical results of the simulation are higher than those obtained from experimental measurements.

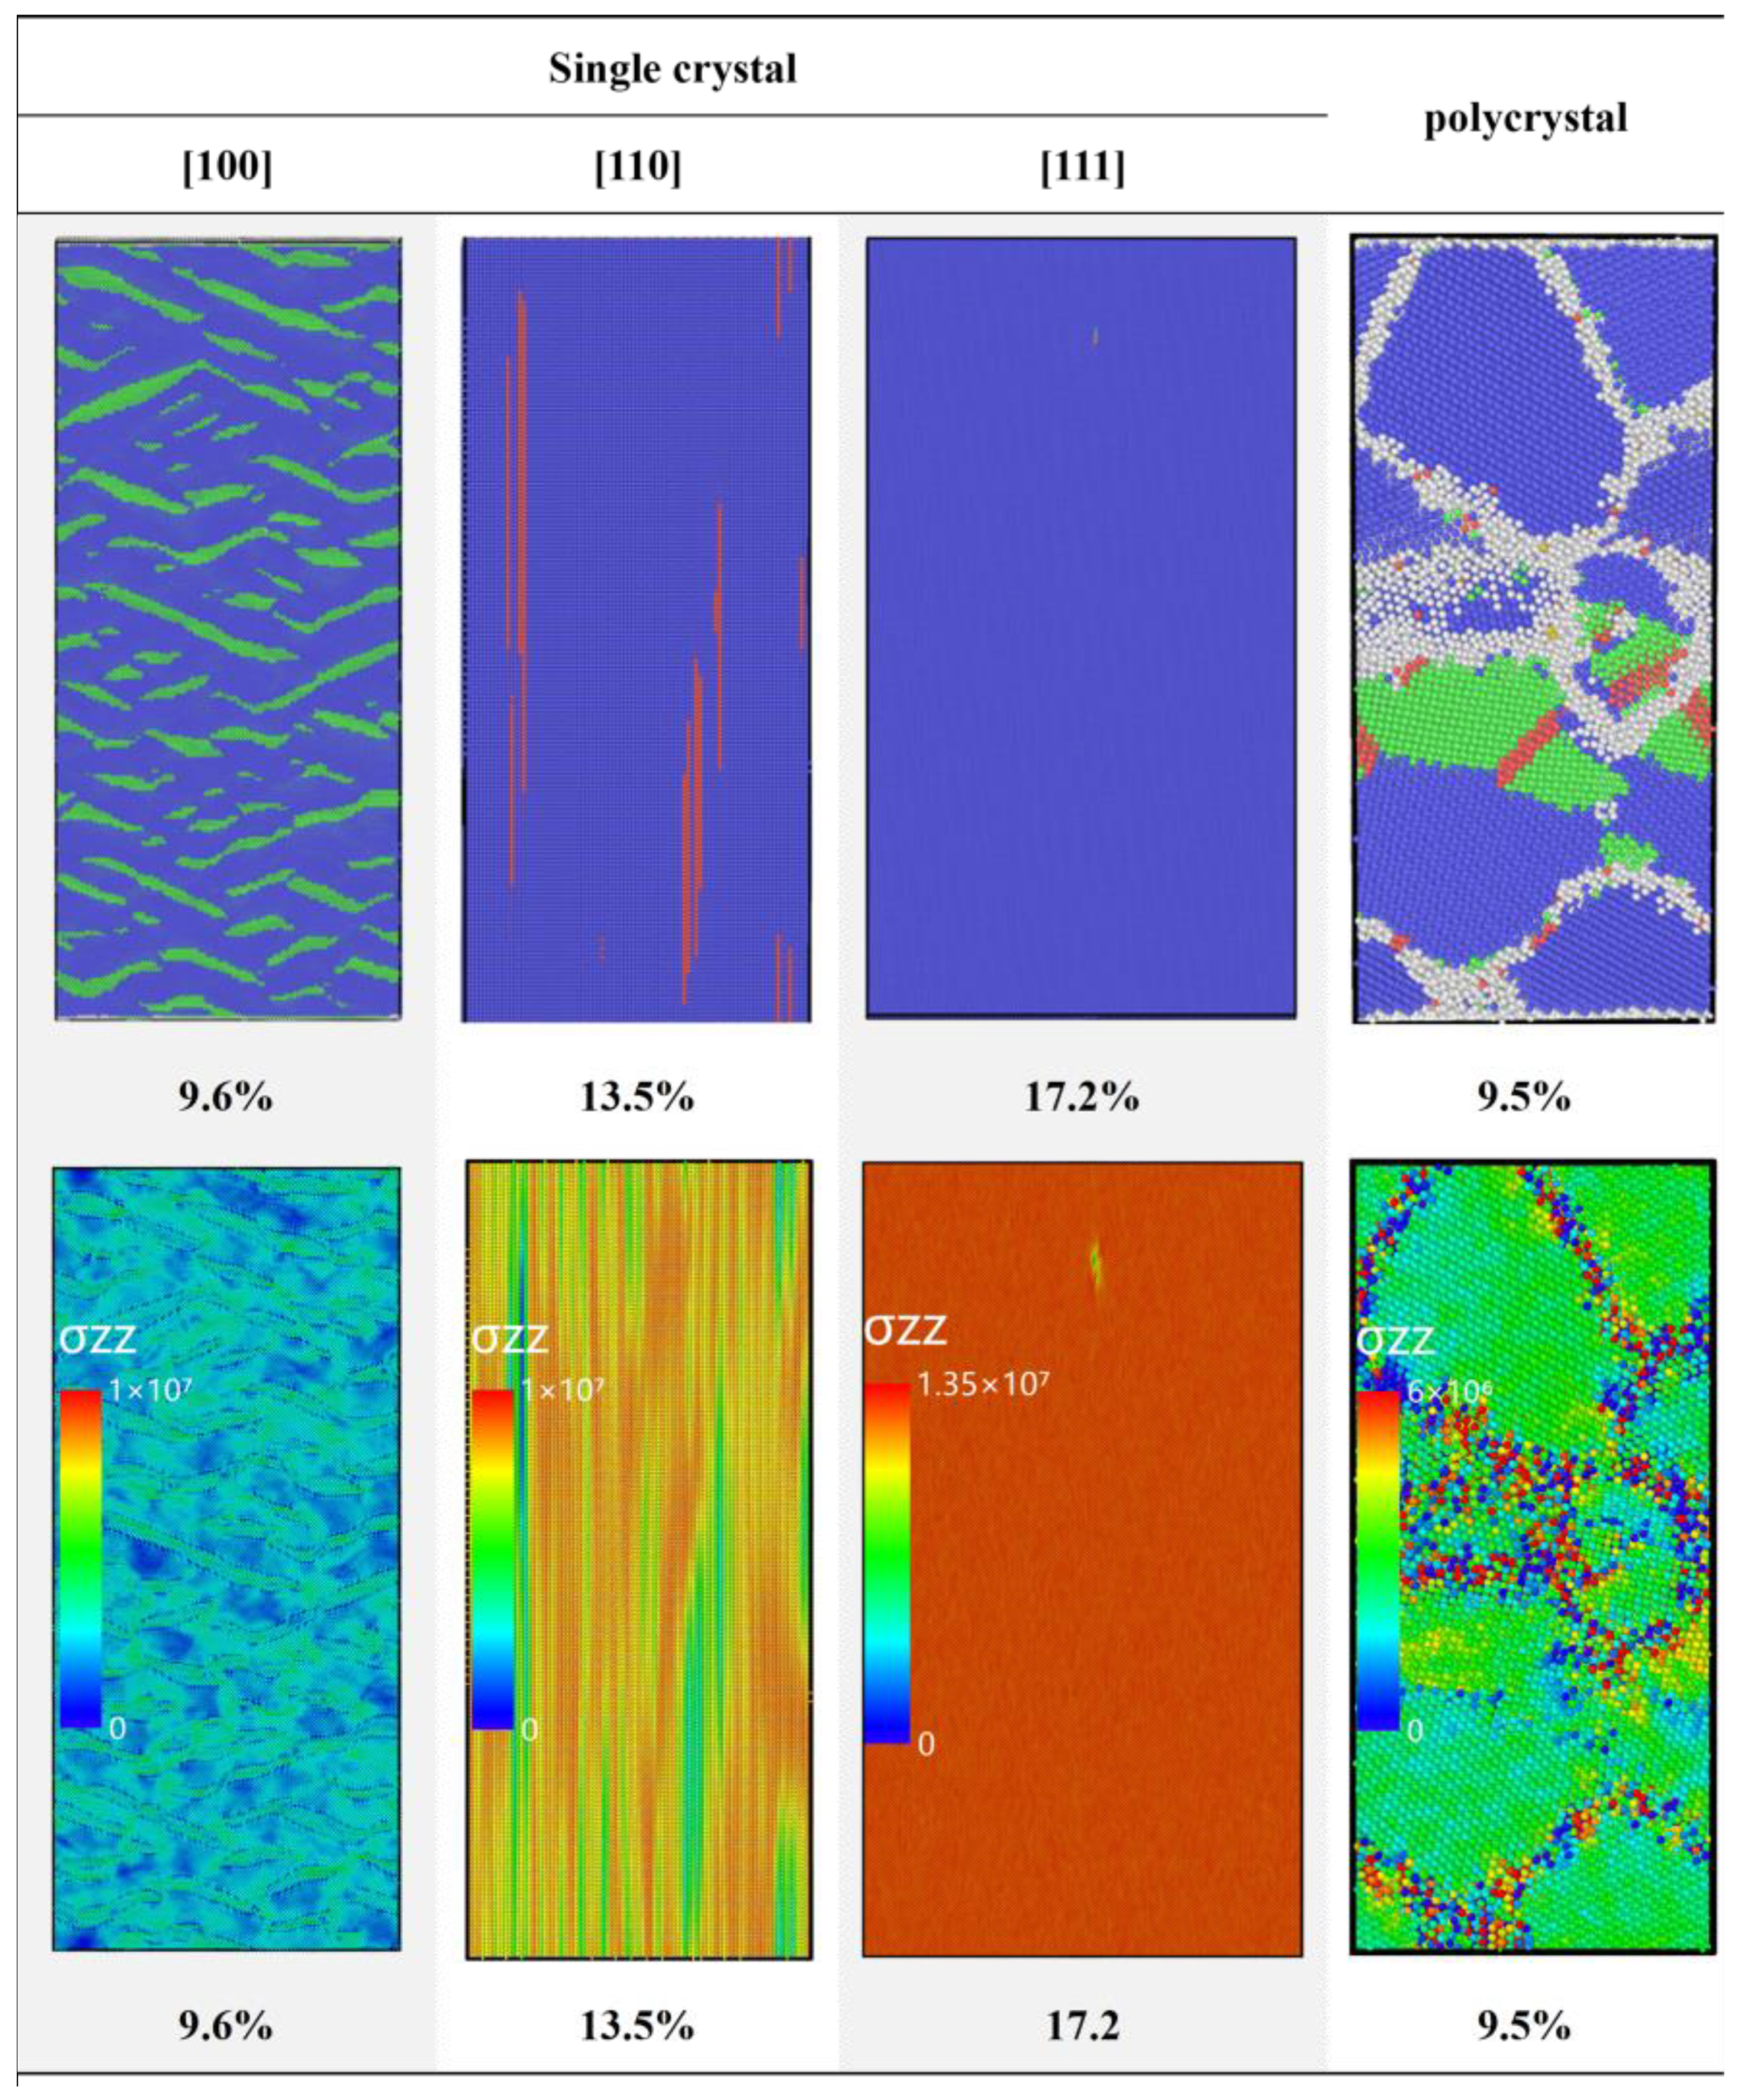
3.2.2. Plastic Behaviors and Structure Evolution

Figure 5 displays snapshots of the crystal structure and defect evolution during quasi-isentropic shock along the [100], [110], [111] directions for the single crystals and the one polycrystal sample, along with their corresponding strain values and stress levels. In the structural snapshots, blue atoms represent the BCC phase, green atoms the FCC phase, red atoms the HCP phase, and white atoms other atomic configurations. The color scheme is the same below. The color in stress distribution mapping represents the magnitude of the stress intensity experienced by each atom in the material, with tensile stress as the default. The redder the color, the stronger the tensile stress experienced; conversely, the bluer the color, the weaker the tensile stress, until it transitions into compressive stress.
Figure 5 reveals that due to the varying ease of slip activation along the three crystallographic directions, the critical strain values for phase transition initiation in Mo single crystals increase accordingly ([100] 9.6%, [110] 13.5%, [111] 17.2%). Beyond the differences in strain thresholds, the phase transformation pathways exhibit distinct anisotropic characteristics, which will be discussed separately.
Along the [100] direction, the inhomogeneous distribution of normal stress triggers a rapid FCC phase transition, propagating in a network-like manner through atomic clustering at a strain of 9.6%. The stress relaxation accompanying the phase transition is evident in the reduced stress levels in the transformed regions, where the FCC phase resides in high-stress zones while the BCC phase remains in relatively low-stress regions. The transformation outcome, as shown in Figure 6, indicates that over half of the BCC lattice converts into the FCC phase at a strain of 17.0%. However, the initial formation of FCC domains with varying orientations hinders further propagation, leading to extensive twinning and localized amorphization at stacking fault intersections. This characteristic is also observed in other shock loading simulations [56]. Observing the structure in Figure 6, we can observe that the generated twins are predominantly {111} twins in FCC phase, because during the phase transition expansion stage, the stress in the FCC region is still higher than the stress in the BCC region. The FCC region relaxes part of the normal stress through the formation of twins. This result is also consistent with our observations on twin formation in previous work [53].
However, in the present simulation, the BCC–FCC phase transformation along the [100] direction does not predominantly convert into the FCC phase as observed in most simulations, but instead forms a BCC/FCC lamellar structure with specific angles. This phenomenon has also been reported in the tensile process of Mo single-crystal nanowires by Mostafa et al. [31]. Therefore, we propose that the FCC phase transformation in this simulation is achieved via the Bain transformation mechanism. The BCC–FCC phase transition process involves only axial-stress-induced tensile deformation without long-range diffusion. Additionally, due to the absence of boundary constraints in the loading setup, the applied stress direction and strain remain parallel to the Z-axis, preventing the occurrence of the Pitsch transformation during nanowire loading and thereby inhibiting further structural evolution of the system. The system partially relieves normal stress through phase transformation and twin formation.
In the [110] direction, shown in Figure 5, we observe a distinct lamellar concentration of stress, which leads to phase transformation structures also exhibiting prominent lamellar characteristics. The BCC phase undergoes rapid transformation under nonuniform stress, forming lamellar FCC and HCP structure. Unlike the [100] case, the phase transition proceeds more swiftly, with FCC nucleation occurring explosively and propagating along multiple orientations. Figure 6 demonstrates that a significant fraction of the BCC phase remains untransformed, while twinning between differently oriented FCC domains severely impedes further phase evolution. Although stress relaxation is similarly mediated by phase transition and twinning, the latter plays a more dominant role in the [110] direction compared to [100].
The [111] direction exhibits fundamentally distinct behavior. As previously noted, the deformation process from yield to fracture occurs extremely rapidly. As observed in Figure 5, a very small phase transformation point, generated due to localized stress concentration, rapidly initiates void nucleation and propagates to form a large void, as seen in the upper half of Figure 6. Upon stress localization, void nucleation initiates, followed by rapid BCC-to-FCC transformation around the voids—a phenomenon observed in both MD simulations and experiments [57,58,59]. As illustrated in Figure 6, void and phase transformation propagation proceeds faster parallel to the loading axis than perpendicular to it. Combining Figure 5 and Figure 6, a pronounced microscale stress concentration zone with notable deformation is observed at the strain of 17.2%. Then, phase transformation and void nucleation rapidly occur around this region. Upon reaching a strain of 17.4%, the stress-concentration-induced phase transformation zone has already completed rapid void nucleation and subsequently expanded into a substantial void. The leading FCC phase governs the expansion direction, resembling the Bain mechanism in BCC–FCC transitions. Notably, phase transformation and defect generation are secondary to void nucleation and growth, which dominate the structural evolution.
After the phase transformations shown in Figure 5 and Figure 6, the BCC–FCC phase transformation in the polycrystalline system exhibits strong grain boundary dependence. When the strain reaches 9.5%, all phase transformations occur near grain boundaries and propagate from the boundaries into the grain interiors (as shown in Figure 5). During the growth of the FCC phase, twin defects also form, but unlike in single crystals, the twins in the polycrystalline system do not develop complex intersecting structures, instead existing as lamellar twins. The stress maps in Figure 5, compared to single crystals, show that the stress distribution in the polycrystalline system is more complex. Stress primarily concentrates near grain boundaries, while the stress distribution within the grains remains relatively uniform. Within a single grain, stress transfer manifests as tensile stress, acting first on atoms near the grain boundary, followed by gradual propagation toward the grain interior. This stress distribution in the polycrystalline system effectively explains why phase transformation initiates near grain boundaries and then extends into the grain interiors. As fracture and stress relaxation occur, the FCC phase almost reverts to the BCC phase, similar to the behavior observed in single-crystal systems.
In summary, under uniaxial loading at a strain rate of 109 s−1 (a strain rate that has been utilized in the experiments of others [60,61] and our previous work [53,62,63,64]), Mo single crystals along the [100] and [110] directions relieve longitudinal stress through phase transitions and twinning, occurring uniformly throughout the material. The resulting FCC phase distribution varies: clustered in [100] and lamellar in [110]. In contrast, the [111] orientation bypasses such transformation-mediated relaxation, instead undergoing direct void nucleation once the critical stress threshold for ideal crystal cavitation is exceeded. For the polycrystal sample, the grain boundary serves as the nucleation sites for FCC phase transition and later arrests the twinning during phase transitions.

3.2.3. Void Nucleation and Growth Behavior Across Crystallographic Orientations

In [100] orientation, void nucleation preferentially initiates near the twins generated during the FCC phase transformation. As shown in Figure 7, at the strain of 17.1%, the void nucleation sites coincide with the intersections of twins with different orientations. During void growth, all sequentially formed voids exhibit a pronounced tendency for planar expansion, predominantly propagating along the [12] planes. When void propagation encounters obstacles from twin boundaries with other orientations, as illustrated in Figure 7, the voids extend along alternative directions. Ultimately, voids nucleated at different locations coalesce during propagation, leading to fracture. After void nucleation, the metastable FCC phase accommodates dislocations and twins (thermodynamically stabilized defects), while the BCC phase remains defect-free. Dislocation analysis (DXA) reveals abundant Shockley partials (green lines) and limited Hirth dislocations (yellow lines) within FCC domains. Near the end of spallation (18.0%), post-fracture stress relaxation triggers FCC→BCC reversion (the increased width of blue strips), eliminating twins but retaining dislocations in the recovered BCC matrix.
In the [110] orientation, voids nucleate predominantly at phase-transformation-induced interface junctions and twin intersections (Figure 7 at a strain of 13.8%). The explosive, multidirectional phase transformation history generates extensive twin networks and interfacial labyrinths, making void nucleation the dominant stress-relief mechanism. Quasi-simultaneous void nucleation at multiple sites occurs, with growth exhibiting equiaxed characteristics due to heightened sensitivity to triaxial stress states—contrasting the directional growth in [100] [65,66]. Coalescence proceeds via isotropic void expansion until macroscopic crack formation. In the strain of 14.1–14.3%, we can see that this orientation hosts higher dislocation densities (primarily Shockley partials) than [100], with shorter and more curved configurations due to complex twin–boundary interactions. Post-fracture FCC→BCC reversion is incomplete, as residual twins and FCC domains persist owing to topological constraints from pre-existing defect networks.
For the [111] orientation, in the absence of pre-existing defects, the growth of voids appears to be equiaxial. Because the nucleation positions are very close, voids do not grow much and quickly coalesce with each other, so the dominant mechanism of fracture is void coalescence. They mainly occur in the strain range of 17.2–17.4%. The absence of detectable dislocation activity (via DXA) reflects the timescale being shorter than defect generation kinetics. Limited FCC/twin reversion occurs post-fracture due to the abrupt stress drop.
For polycrystal, as shown in Figure 7, during the loading process, a small number of dislocations were generated in the grain boundary regions of some grains and subsequently propagated into the FCC phase within the grain interior as the phase transformation progressed. These dislocations were predominantly 1/2<111> perfect dislocations. During the void nucleation process in polycrystalline systems, stress concentration at grain boundaries induces phase transformation accompanied by extensive dislocation generation near grain boundaries when the strain reaches 9%. Up to 9.5% strain, numerous voids nucleate adjacent to these pre-existing dislocations and rapidly propagate/coalesce along grain boundaries. This behavior elongates the original grain boundaries without suppressing the concurrent FCC phase transformation. At 9.8% strain, the voids completely replace the original grain boundary network at prior boundary locations. The interconnected void and cracks formed through grain boundary propagation render the original grain boundaries undetectable, ultimately triggering intergranular fracture of the entire polycrystalline system along these defect pathways.
It is noteworthy that the phase transformation and void nucleation/growth processes in the polycrystalline system occur almost simultaneously. This results in many grains not completing the BCC–FCC phase transition before fracture occurs, with stress release primarily being accomplished through void nucleation. This behavioral pattern shares certain similarities with the [111] orientation in single crystals. However, the key distinction lies in the fact that grain boundaries in the polycrystalline system significantly exacerbate the inhomogeneous stress distribution, promoting void nucleation at remarkably low stress levels. In contrast, for the [111] single-crystal orientation, the high frictional resistance and non-Schmid slip lead to substantial stress accumulation before phase transformation and void nucleation. The resulting severe internal stress inhomogeneity triggers explosive, simultaneous occurrences of scattering phase transition and void nucleation, thereby achieving stress release.

3.3. Piston-Driven Shock

Post-shock surface profilometry analysis (Figure 8) reveals consistent shock wave arrival times at the free surface (~9.4 ps post-loading initiation) for both single-crystal and polycrystalline cases. Subsequent wave reflection generates release waves propagating antiparallel to the loading direction, while the free surface maintains forward momentum. Critical wave interactions occur at 15 ps (single crystal) and 16 ps (polycrystal), where the reflected release wavefront intersects with the advancing unloading wavefront. Post-intersection, these wavefronts continue diverging, creating an expanding inter-wavefront zone subjected to progressively intensifying tensile stresses. Lattice dynamics within this region exhibit characteristic elastic stretching deformation, with the degree of expansion scaling directly with the separation distance between the diverging wavefronts.
Meanwhile, based on the μfs values calculated from Figure 8, we conducted computational analyses on the spall strengths of single-crystal Mo and polycrystalline Mo. The spall resistance order derived from the spall strength analysis, ranked from highest to lowest, is [111] (41.08 GPa) > [110] (33.85 GPa) > [100] (18.45 GPa) > polycrystal (17.96 GPa). This trend completely aligns with that observed in Kanel et al. [60]’s experimental results ([111] (6.3 GPa) > [110] 4.6 GPa) > [100] (3.3 GPa) > polycrystal (1.8 GPa)); however, numerically, differences exist due to limitations imposed by the material dimensions and shock velocity during the simulation process. This corroborates the peak stress results obtained from quasi-isentropic loading experiments discussed earlier.
Figure 9 illustrates the structural evolution process of single-crystal Mo under different loading directions. It can be observed that as the wavefront propagates, the phase transformation zone expands accordingly. Since the net force between the two wavefronts manifests as tensile stress, the phase transformations within the tensile stress regions in all three directions exhibit characteristics similar to those observed in previous quasi-isentropic loading. However, unlike quasi-isentropic loading, the BCC–FCC phase transformation along the [100] direction in piston-impact experiments is more complete, leaving no significant lamellar BCC structure. At 19 ps, the FCC phase exhibits a greater number of orientations due to the presence of a higher density of more complex twin structures, which also introduces distinct variations in the subsequent void nucleation stage.
The phase transformation along the [110] direction, as illustrated in Figure 9, exhibits closer resemblance to that observed under quasi-isentropic loading. The resulting FCC and HCP phase in this orientation displays a distinct lamellar structure, and the transformation occurs at an exceptionally rapid rate—nearly complete BCC transforms into FCC and HCP phase behind the propagating wavefront. Similarly, this swift and spatially distributed phase transformation generates a high density of twins that grow along the FCC phase propagation direction throughout the system. These twins, along with small-volume FCC domains of varying orientations, collectively prevent the FCC phase transformation under piston-impact loading from fully extending across the entire tensile stress region.
Figure 9 illustrates the phase transformation process along the [111] direction. Unlike quasi-isentropic tensile loading simulations, where the entire system remains under a uniform stress state, the tensile stress region propagating with the wavefront in piston-impact experiments causes the phase transformation to synchronize with the wavefront propagation. Additionally, due to the exceptionally high yield stress required for plastic deformation along the [111] direction, at the time of 18 ps, we can observe that the expansion of pre-existing voids and the FCC phase at the transformation front within the tensile stress region becomes highly constrained. These factors result in a stress relaxation mechanism along the [111] direction that primarily relies on void nucleation rather than phase transformation from the outset. Throughout the process, the majority of observed regions consist of void nucleation zones, with phase transformation regions being exceedingly sparse—even around voids, no large-scale phase transition occurs.
As shown in the time axis of 19–20 ps, the phase transformation mechanism of polycrystalline molybdenum exhibits similarity to the quasi-isentropic loading experimental results, where phase transition initiates around grain boundaries within regions of inhomogeneous stress distribution and subsequently propagates inward toward the grain interior.
The void nucleation, propagation, and fracture processes along the three crystallographic orientations are illustrated in Figure 10. Combining Figure 9 and Figure 10, it can be observed that along the [100] direction, due to the formation of more complex twin structures during phase transformation, void nucleation occurs simultaneously at multiple twin boundary intersections under tensile stress. Within merely 19 ps to 20 ps, explosive nucleation of multiple voids occurred throughout the tensile stress region, followed by their rapid propagation along specific crystallographic orientations during the expansion phase. During void propagation, expansion proceeds primarily along directions perpendicular to the shock wave loading axis or specific twin boundaries, exhibiting more pronounced planar propagation characteristics compared to quasi-isentropic loading—a feature similarly manifested in the [110] and [111] orientations. With continued wavefront progression, smaller voids progressively expand and eventually coalesce under tensile stress, entering the void merging stage. Owing to the planar propagation behavior during void growth, the resulting large voids and fracture surfaces exhibit distinct planar features, predominantly oriented perpendicular to the loading direction.
The void nucleation process along the [110] direction is similar to that in the [100] orientation; however, in the structure of 19–20 ps, we can notice that the presence of more intricate twin structures in the [110] direction results in a higher density of nucleation sites at the same stage. During initial propagation, voids in the [110] orientation exhibit isotropic expansion characteristics. However, influenced by the loading system, subsequent growth parallel to the loading axis becomes suppressed, leading to reduced expansion rates and a more flattened void morphology, in the time of 20–21 ps.
The [111] orientation exhibits the most obvious flattening characteristics among the three directions due to the constrained expansion parallel to the loading axis. Void growth in the [111] direction, which relies on nucleation and expansion for stress relaxation, proceeds more rapidly in the direction perpendicular to the loading axis, leading to earlier onset of void coalescence. We observe that the [111] direction requires significantly less time (18 ps, faster than the other two directions by over 1 ps) for the initially formed voids to expand and coalesce perpendicular to the loading direction, resulting in the formation of numerous linear void structures oriented normal to the applied stress.
Figure 9 and Figure 10 demonstrate that the phase transformation and void growth behaviors of polycrystalline Mo under piston impact are like those under quasi-isentropic loading. During the phase transformation process, due to stress concentration at grain boundaries, the same characteristic is observed—phase transformation initiates preferentially at grain boundaries before propagating into grain interiors. However, as shown at the time of 19 ps, possibly because of the higher applied stress and shorter timescale available for phase transformation within grains, we also observe that the extent of phase transformation in piston-impact experiments is relatively smaller.
During the void nucleation and growth process, the behavior of polycrystalline Mo is similar to quasi-isentropic loading experimental results. Due to stress inhomogeneity concentrating at grain boundary regions, voids preferentially nucleate at grain boundaries and subsequently propagate along them, which is clearly demonstrated at 18–19 ps. Moreover, owing to the differing magnitudes of axial stress imposed by distinct loading methods, piston-impact experiments exhibit a higher density of void nucleation events at grain boundaries, along with accelerated propagation rates, ultimately leading to fracture occurring simultaneously across multiple grain boundaries.
Furthermore, we observe that in the polycrystalline system, void nucleation and fracture occur before large-scale phase transformation, which contrasts sharply with the sequence observed in the single-crystal system (compared in Figure 9), where extensive phase transformation precedes void nucleation. We attribute this difference to the highly non-uniform stress distribution induced by grain boundaries, which promotes premature void nucleation and accelerates the entire nucleation-fracture process. This results in a faster transition from stress release via phase transformation to stress release through void formation and fracture.

4. Conclusions

In this study, we employed nonequilibrium molecular dynamics simulations to investigate the mechanical response, plastic deformation mechanisms, and spallation behavior of Mo based on the newly built specific EAM potential. Both single-crystal/polycrystalline quasi-isentropic tensile loading and piston-driven shock loading were performed. The key findings are summarized as follows:
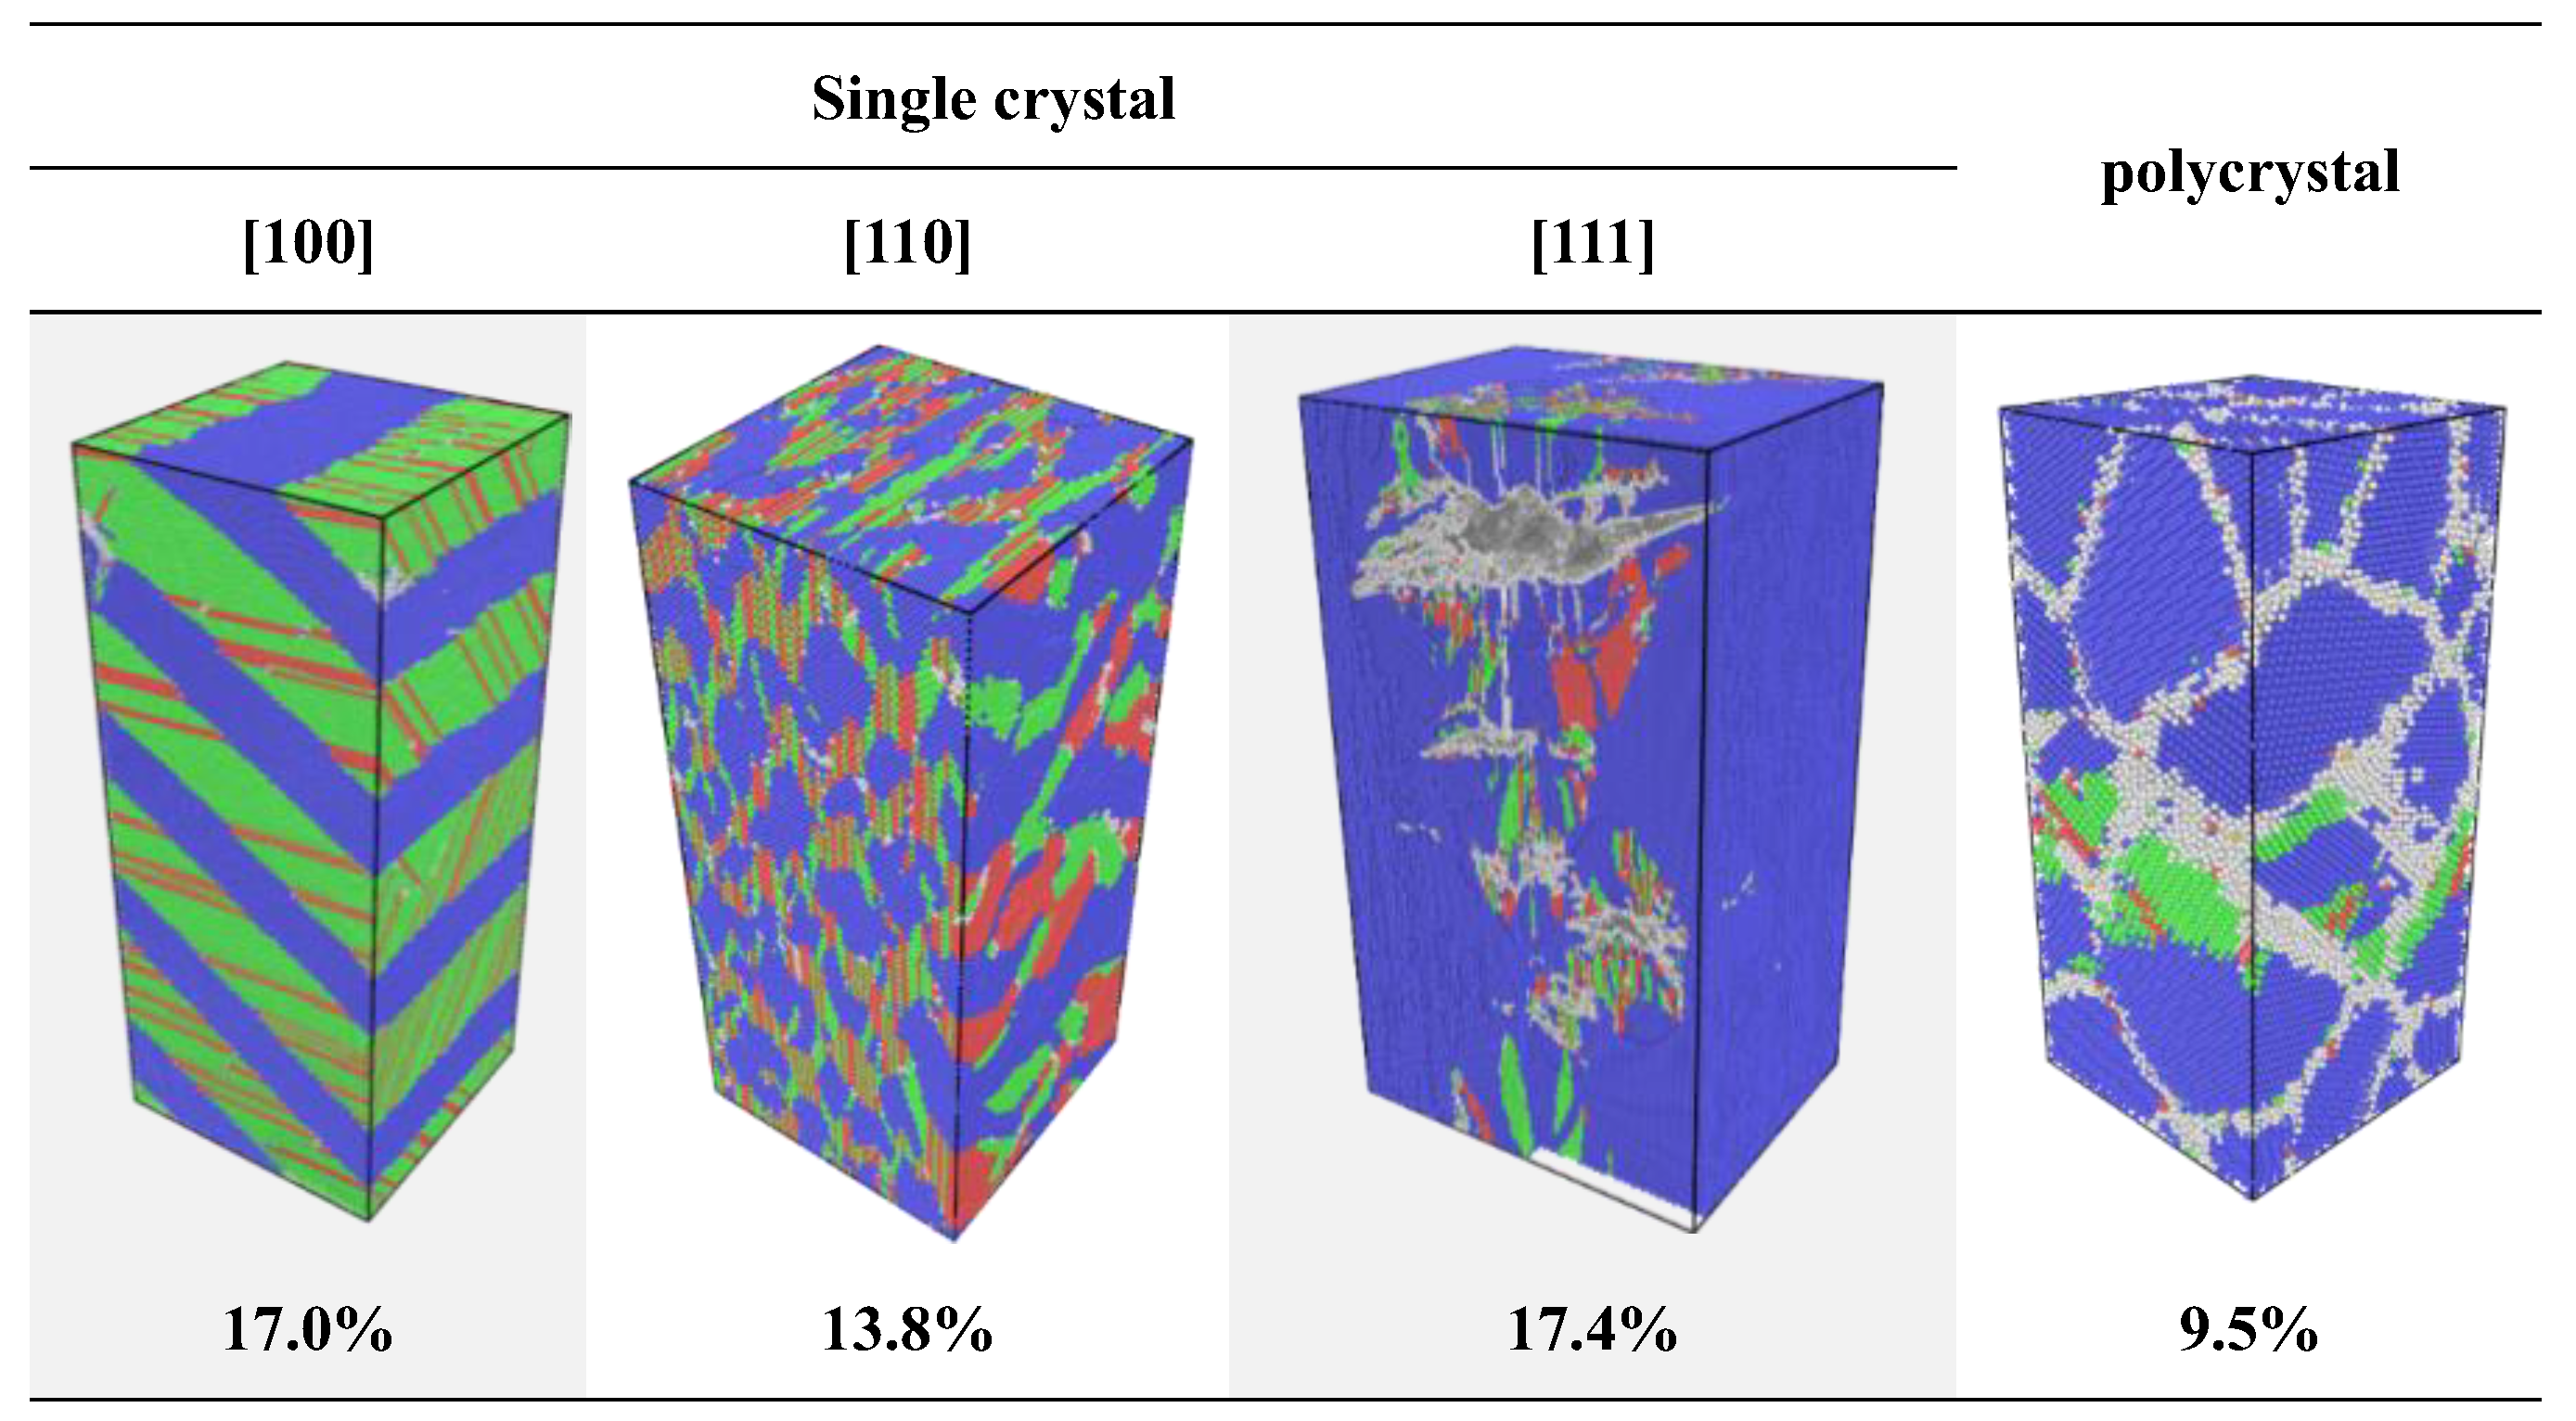
  • Under quasi-isentropic loading at a strain rate of 109 s−1, the critical stresses along the three principal crystallographic orientations follow the order [111] (67.9 GPa) > [110] (49.6 GPa) > [100] (21.5 GPa). This sequence is governed by the Schmid factor and subsequently influences the dominant plastic deformation mechanisms. The critical stress of polyscrystal (18.6 GPa) is lower than that of single crystals. Grain boundaries in polycrystalline Mo leads to non-uniform stress distribution and result in fast fracture failure. The resultant spall strength of Mo under piston-driven shock loading shows the same order as quasi-isentropic loading: [111] (41.08 GPa) > [110] (33.85 GPa) > [100] (18.45 GPa) > polycrystalline (17.96 GPa).
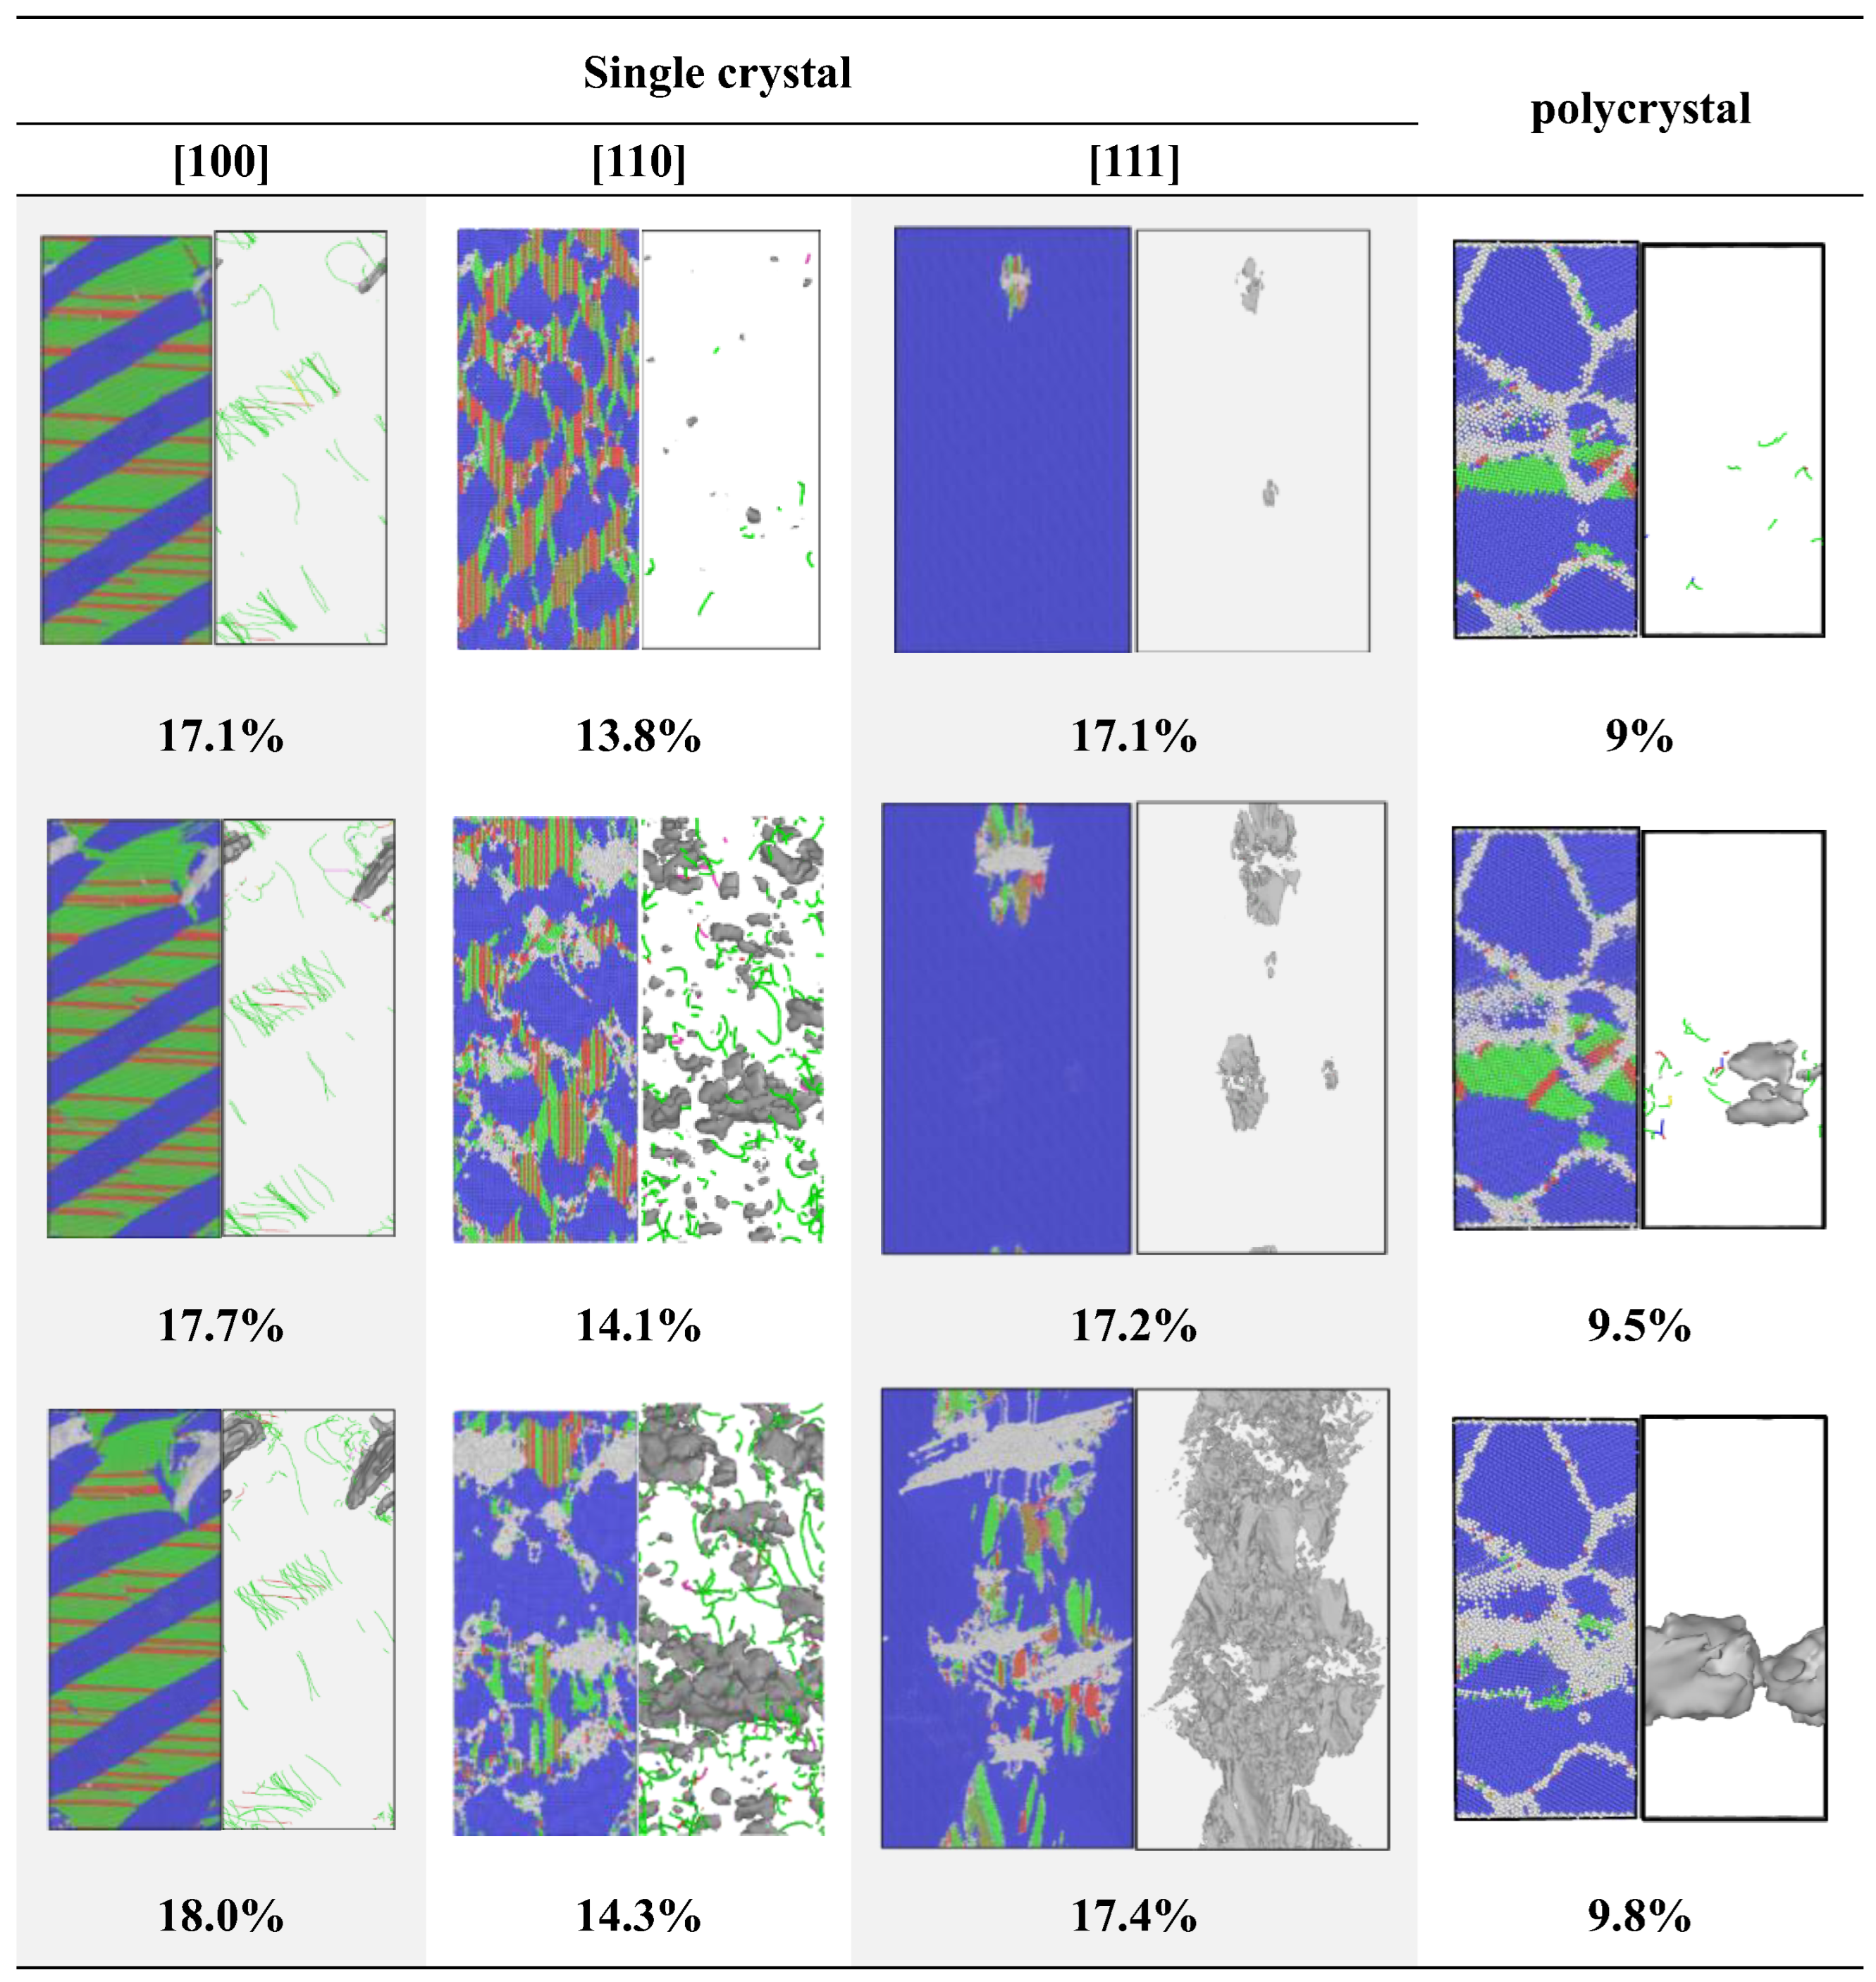
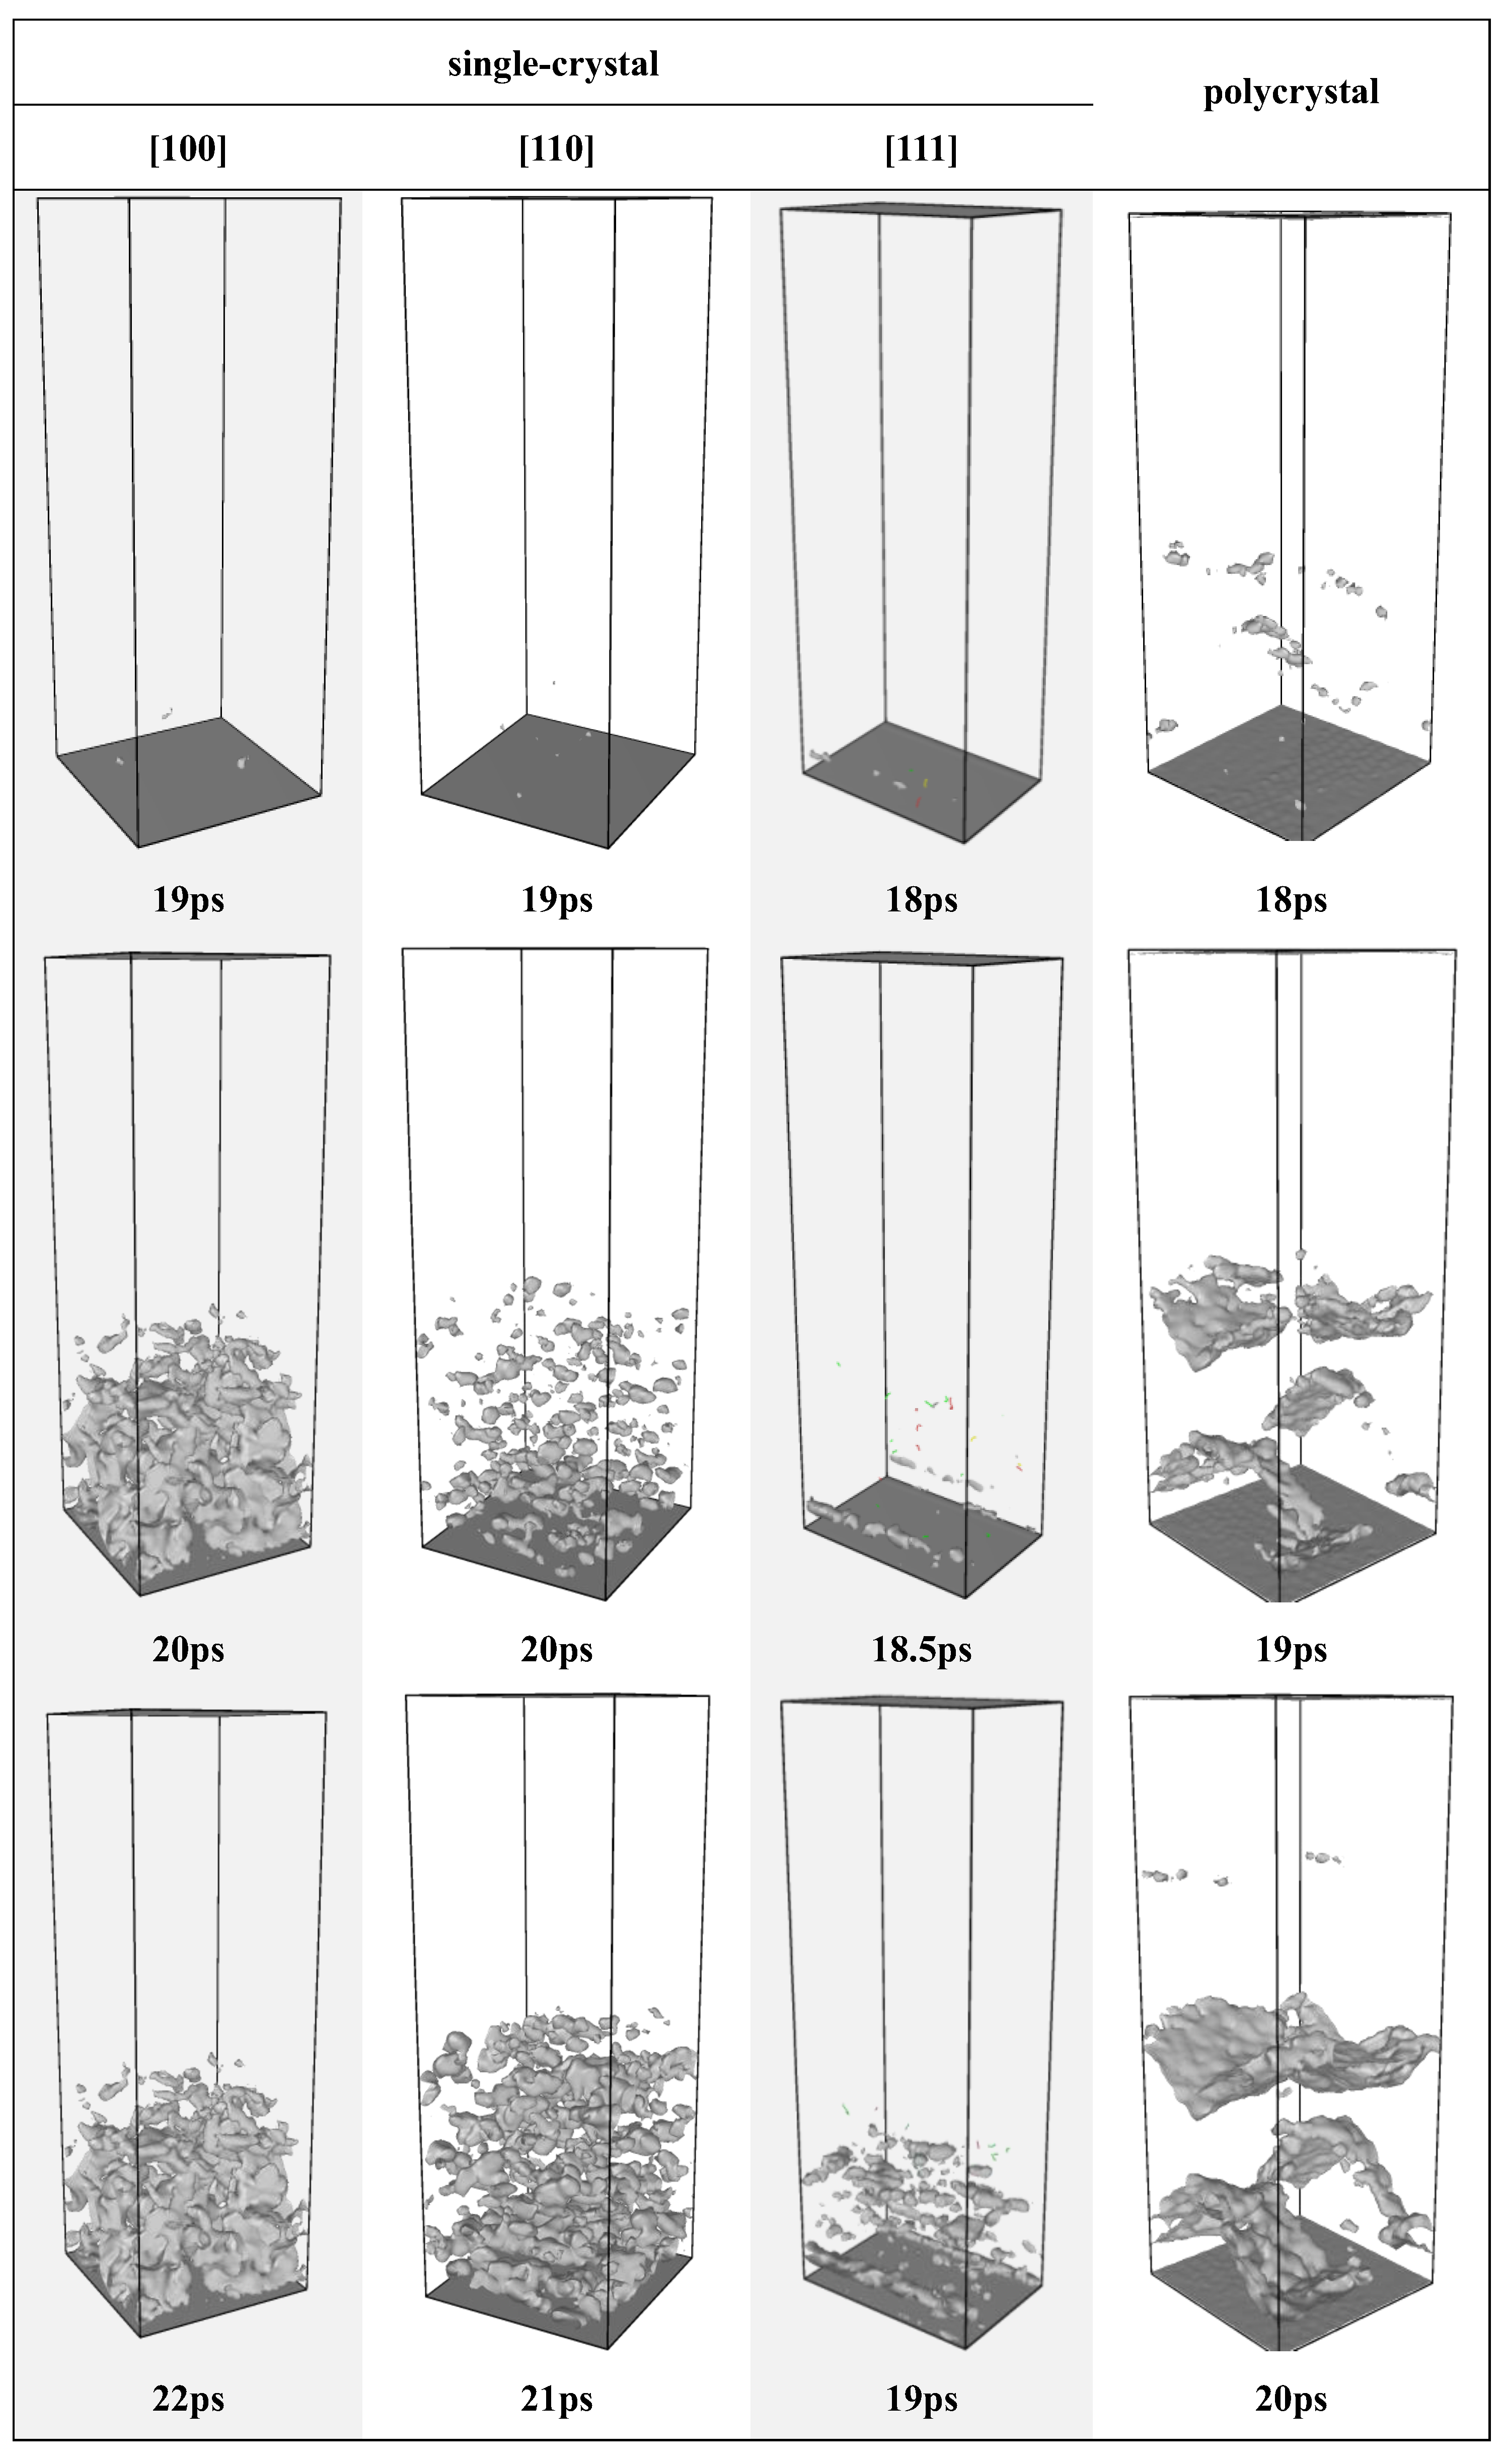
  • At a strain rate of 109 s−1, phase transformation serves as the primary stress relaxation mechanism for longitudinal stress induced by high strain along the [100] and [110] loading directions. In contrast, phase transition is nearly inactive while loading along the [111] direction, where the system rapidly transitions to void nucleation and growth for stress relaxation. For polycrystalline Mo, grain boundaries induce heterogeneous stress distributions with localized concentrations, act as nucleation sites for voids, and promote their growth and coalescence along boundaries, leading to intergranular fracture as the dominant failure mode—distinct from the transgranular fracture observed in single crystals.

Author Contributions

Conceptualization, C.L.; data curation, Y.J. and Y.L.; formal analysis, C.L.; funding acquisition, C.L.; methodology, Y.J. and Y.L.; project administration, C.L.; software, Y.J., Y.L., and X.C.; visualization, X.C.; writing—original draft, Y.J.; writing—review and editing, Y.L. and C.L. All authors have read and agreed to the published version of the manuscript.

Funding

This work was supported by the National Natural Science Foundation of China (grant numbers 51801236, 52471026) and the Natural Science Foundation of Hunan Province, China (Grant No. 2025JJ20048).

Data Availability Statement

The raw data supporting the conclusions of this article will be made available by the authors on request.

Acknowledgments

We are grateful for technical support from the High-Performance Computing Center of Central South University.

Conflicts of Interest

The authors declare no conflicts of interest.

References

  1. Dudarev, S.L.; Boutard, J.L.; Lässer, R.; Caturla, M.J.; Derlet, P.M.; Fivel, M.; Fu, C.C.; Lavrentiev, M.Y.; Malerba, L.; Mrovec, M.; et al. The EU programme for modelling radiation effects in fusion reactor materials: An overview of recent advances and future goals. J. Nucl. Mater. 2009, 386–388, 1–7. [Google Scholar] [CrossRef]
  2. Zinkle, S.J.; Ghoniem, N.M. Operating temperature windows for fusion reactor structural materials. Fusion Eng. Des. 2000, 51–52, 55–71. [Google Scholar] [CrossRef]
  3. Yan, G.-Q.; Cheng, X.-L.; Zhang, H.; Zhu, Z.-Y.; Ren, D.-H. Different effects of electronic excitation on metals and semiconductors. Phys. Rev. B 2016, 93, 214302. [Google Scholar] [CrossRef]
  4. Sand, A.E.; Byggmästar, J.; Zitting, A.; Nordlund, K. Defect structures and statistics in overlapping cascade damage in fusion-relevant bcc metals. J. Nucl. Mater. 2018, 511, 64–74. [Google Scholar] [CrossRef]
  5. Gandhi, V.; Ravindran, S.; Joshi, A.; Ravichandran, G. Real-time characterization of dislocation slip and twinning of shock-compressed molybdenum single crystals. Phys. Rev. Mater. 2023, 7, 073601. [Google Scholar] [CrossRef]
  6. Wang, J.; Coppari, F.; Smith, R.F.; Eggert, J.H.; Lazicki, A.E.; Fratanduono, D.E.; Rygg, J.R.; Boehly, T.R.; Collins, G.W.; Duffy, T.S. X-ray diffraction of molybdenum under shock compression to 450 GPa. Phys. Rev. B 2015, 92, 174114. [Google Scholar] [CrossRef]
  7. Lu, C.H.; Hahn, E.N.; Remington, B.A.; Maddox, B.R.; Bringa, E.M.; Meyers, M.A. Phase Transformation in Tantalum under Extreme Laser Deformation. Sci. Rep. 2015, 5, 15064. [Google Scholar] [CrossRef]
  8. Belonoshko, A.B.; Burakovsky, L.; Chen, S.P.; Johansson, B.; Mikhaylushkin, A.S.; Preston, D.L.; Simak, S.I.; Swift, D.C. Molybdenum at High Pressure and Temperature: Melting from Another Solid Phase. Phys. Rev. Lett. 2008, 100, 135701. [Google Scholar] [CrossRef] [PubMed]
  9. Gachegova, E.; Davydov, D.; Mironov, S.; Kalinenko, A.; Ozerov, M.; Zherebtsov, S.; Plekhov, O. The Influence of Absorbing Coating Material on the Efficiency of Laser Shock Peening. Metals 2024, 14, 1045. [Google Scholar] [CrossRef]
  10. Akhmedov, E.N. Molybdenum lattice properties at high pressure. J. Phys. Chem. Solids 2018, 121, 62–66. [Google Scholar] [CrossRef]
  11. Oniyama, T.; Gupta, Y.M.; Ravichandran, G. Shock compression of molybdenum single crystals to 110 GPa: Elastic–plastic deformation and crystal anisotropy. J. Appl. Phys. 2020, 127, 205902. [Google Scholar] [CrossRef]
  12. Farihi, J.; Gänsicke, B.T.; Koester, D. Evidence for Water in the Rocky Debris of a Disrupted Extrasolar Minor Planet. Science 2013, 342, 218–220. [Google Scholar] [CrossRef] [PubMed]
  13. Mandal, A.; Gupta, Y.M. Elastic-plastic deformation of molybdenum single crystals shocked to 12.5 GPa: Crystal anisotropy effects. J. Appl. Phys. 2019, 125, 055903. [Google Scholar] [CrossRef]
  14. Huang, X.; Li, F.; Zhou, Q.; Meng, Y.; Litasov, K.D.; Wang, X.; Liu, B.; Cui, T. Thermal equation of state of Molybdenum determined from in situ synchrotron X-ray diffraction with laser-heated diamond anvil cells. Sci. Rep. 2016, 6, 19923. [Google Scholar] [CrossRef]
  15. Johanns, K.E.; Sedlmayr, A.; Phani, P.S.; Mönig, R.; Kraft, O.; George, E.P.; Pharr, G.M. In-situ tensile testing of single-crystal molybdenum-alloy fibers with various dislocation densities in a scanning electron microscope. J. Mater. Res. 2012, 27, 508–520. [Google Scholar] [CrossRef]
  16. Wehrenberg, C.E.; Mcgonegle, D.; Bolme, C.; Higginbotham, A.; Lazicki, A.; Lee, H.J.; Nagler, B.; Park, H.S.; Remington, B.A.; Rudd, R.E.; et al. In situ X-ray diffraction measurement of shock-wave-driven twinning and lattice dynamics. Nature 2017, 550, 496–499. [Google Scholar] [CrossRef]
  17. Luo, S.-N.; Germann, T.C.; Tonks, D.L. Spall damage of copper under supported and decaying shock loading. J. Appl. Phys. 2009, 106, 123518. [Google Scholar] [CrossRef]
  18. Hahn, E.N.; Germann, T.C.; Ravelo, R.J.; Hammerberg, J.E.; Meyers, M.A. Non-equilibrium molecular dynamics simulations of spall in single crystal tantalum. AIP Conf. Proc. 2017, 1793, 070006. [Google Scholar]
  19. Park, N.-Y.; Cha, P.-R.; Kim, Y.-C.; Seok, H.-K.; Han, S.-H.; Lee, S.-C.; Cho, S.; Jung, H. Radiation damage in nano-crystalline tungsten: A molecular dynamics simulation. Met. Mater. Int. 2009, 15, 447–452. [Google Scholar] [CrossRef]
  20. Feng, Y.; Li, J.; Yang, X. Intragranular and Intergranular Crack Propagation in Nanocrystalline Ni Under Single-Cycle Mode I Loading. Met. Mater. Int. 2022, 28, 1590–1598. [Google Scholar] [CrossRef]
  21. Ding, J.; Li, Z.; Wang, W.; Ma, Y.; Liu, W.; Liang, C. Evaluation of structural and mechanical strength of symmetric tilt interface in W/Fe composite laminate using molecular dynamics. J. Phys. Chem. Solids 2022, 168, 110800. [Google Scholar] [CrossRef]
  22. Hahn, E.N.; Fensin, S.J.; Germann, T.C.; Gray, G.T. Orientation dependent spall strength of tantalum single crystals. Acta Mater. 2018, 159, 241–248. [Google Scholar] [CrossRef]
  23. Derlet, P.M.; Nguyen-Manh, D.; Dudarev, S.L. Multiscale modeling of crowdion and vacancy defects in body-centered-cubic transition metals. Phys. Rev. B 2007, 76, 054107. [Google Scholar] [CrossRef]
  24. Fan, J.; Zhang, W. Atomic Scale Diffusion Study in Quaternary and Quinary Alloys of Co–Cr–Fe–Mn–Ni System. Met. Mater. Int. 2024, 30, 457–468. [Google Scholar] [CrossRef]
  25. Ye, W.; Misra, M.; Menezes, P.; Mushongera, L.T. Influence of Grain Boundary Character on Dopants Segregation in Nanocrystalline Aluminum. Met. Mater. Int. 2023, 29, 18–26. [Google Scholar] [CrossRef]
  26. Jasim, S.A.; Ali, M.H.; Mahmood, Z.H.; Rudiansyah, M.; Alsultany, F.H.; Mustafa, Y.F.; Ramadan, M.F.; Surendar, A. Role of Alloying Composition on Mechanical Properties of CuZr Metallic Glasses During the Nanoindentation Process. Met. Mater. Int. 2022, 28, 2075–2082. [Google Scholar] [CrossRef]
  27. Zepeda-Ruiz, L.A.; Stukowski, A.; Oppelstrup, T.; Bulatov, V.V. Probing the limits of metal plasticity with molecular dynamics simulations. Nature 2017, 550, 492–495. [Google Scholar] [CrossRef]
  28. Chen, X.; Luo, G.; Cao, Y.; Liang, C. Effect of Atomic Ordering on Phase Stability and Elastic Properties of Pd-Ag Alloys. Metals 2024, 14, 1017. [Google Scholar] [CrossRef]
  29. Hu, Y.; Xu, J.; Su, L.; Zhang, Y.; Ding, S.; Shen, Y.; Xia, R. Tensile responses of polycrystalline Mo via molecular dynamics simulation: Grain size and temperature effects. Mater. Chem. Phys. 2023, 296, 127270. [Google Scholar] [CrossRef]
  30. Frederiksen, S.L.; Jacobsen, K.W.; Schiøtz, J. Simulations of intergranular fracture in nanocrystalline molybdenum. Acta Mater. 2004, 52, 5019–5029. [Google Scholar] [CrossRef]
  31. Mostafa, A.; Vu, L.; Guo, Z.; Shargh, A.K.; Dey, A.; Askari, H.; Abdolrahin, N. Phase-transformation assisted twinning in Molybdenum nanowires. Comput. Mater. Sci. 2024, 244, 113273. [Google Scholar] [CrossRef]
  32. Lee, B.-J.; Baskes, M.I.; Kim, H.; Koo Cho, Y. Second nearest-neighbor modified embedded atom method potentials for bcc transition metals. Phys. Rev. B 2001, 64, 184102. [Google Scholar] [CrossRef]
  33. Han, S.; Zepeda-Ruiz, L.A.; Ackland, G.J.; Car, R.; Srolovitz, D.J. Interatomic potential for vanadium suitable for radiation damage simulations. J. Appl. Phys. 2003, 93, 3328–3335. [Google Scholar] [CrossRef]
  34. Park, H.; Fellinger, M.R.; Lenosky, T.J.; Tipton, W.W.; Trinkle, D.R.; Rudin, S.P.; Woodward, C.; Wilkins, J.W.; Hennig, R.G. Ab initio based empirical potential used to study the mechanical properties of molybdenum. Phys. Rev. B 2012, 85, 214121. [Google Scholar] [CrossRef]
  35. Ravelo, R.; Germann, T.C.; Guerrero, O.; An, Q.; Holian, B.L. Shock-induced plasticity in tantalum single crystals: Interatomic potentials and large-scale molecular-dynamics simulations. Phys. Rev. B 2013, 88, 134101. [Google Scholar] [CrossRef]
  36. Rydberg, R. Graphische Darstellung einiger bandenspektroskopischer Ergebnisse. Z. Für Physik 1932, 73, 376–385. [Google Scholar] [CrossRef]
  37. Rose, J.H.; Smith, J.R.; Guinea, F.; Ferrante, J. Universal features of the equation of state of metals. Phys. Rev. B 1984, 29, 2963–2969. [Google Scholar] [CrossRef]
  38. Holian, B.L.; Voter, A.F.; Wagner, N.J.; Ravelo, R.J.; Chen, S.P.; Hoover, W.G.; Hoover, C.G.; Hammerberg, J.E.; Dontje, T.D. Effects of pairwise versus many-body forces on high-stress plastic deformation. Phys. Rev. A 1991, 43, 2655–2661. [Google Scholar] [CrossRef]
  39. Plimpton, S. Fast Parallel Algorithms for Short-Range Molecular Dynamics. J. Comput. Phys. 1995, 117, 1–19. [Google Scholar] [CrossRef]
  40. Stukowski, A. Visualization and analysis of atomistic simulation data with OVITO–the Open Visualization Tool. Model. Simul. Mater. Sci. Eng. 2010, 18, 015012. [Google Scholar] [CrossRef]
  41. Tsuzuki, H.; Branicio, P.S.; Rino, J.P. Structural characterization of deformed crystals by analysis of common atomic neighborhood. Comput. Phys. Commun. 2007, 177, 518–523. [Google Scholar] [CrossRef]
  42. Honeycutt, J.D.; Andersen, H.C. Molecular dynamics study of melting and freezing of small Lennard-Jones clusters. J. Phys. Chem. 1987, 91, 4950–4963. [Google Scholar] [CrossRef]
  43. Stukowski, A.; Albe, K. Extracting dislocations and non-dislocation crystal defects from atomistic simulation data. Model. Simul. Mater. Sci. Eng. 2010, 18, 085001. [Google Scholar] [CrossRef]
  44. Marinica, M.C.; Ventelon, L.; Gilbert, M.R.; Proville, L.; Dudarev, S.L.; Marian, J.; Bencteux, G.; Willaime, F. Interatomic potentials for modelling radiation defects and dislocations in tungsten. J. Phys. Condens. Matter 2013, 25, 395502. [Google Scholar] [CrossRef]
  45. Pearson, W.B.; Vineyard, G.H. A Handbook of Lattice Spacings and Structures of Metals and Alloys. Phys. Today 2009, 11, 36. [Google Scholar] [CrossRef]
  46. Ding, J.; Ma, Y.; Liu, W.; Liang, C. High-temperature structural stability and mechanical properties of η-carbides M6W6C, M3W3C and M2W2C from first-principles calculations. Ceram. Int. 2025, 51, 21742–21751. [Google Scholar] [CrossRef]
  47. Zhou, X.W.; Johnson, R.A.; Wadley, H.N.G. Misfit-energy-increasing dislocations in vapor-deposited CoFe/NiFe multilayers. Phys. Rev. B 2004, 69, 144113. [Google Scholar] [CrossRef]
  48. Kong, L.T. Phonon dispersion measured directly from molecular dynamics simulations. Comput. Phys. Commun. 2011, 182, 2201–2207. [Google Scholar] [CrossRef]
  49. Kong, L.T.; Bartels, G.; Campañá, C.; Dennistoon, C.; Müser, M.H. Implementation of Green’s function molecular dynamics: An extension to LAMMPS. Comput. Phys. Commun. 2009, 180, 1004–1010. [Google Scholar] [CrossRef]
  50. Zarestky, J.; Stassis, C.; Harmon, B.N.; Ho, K.M.; Fu, C.L. Temperature dependence of the vibrational modes of molybdenum. Phys. Rev. B 1983, 28, 697–701. [Google Scholar] [CrossRef]
  51. Woods, A.D.B.; Chen, S.H. Lattice dynamics of molybdenum. Solid State Commun. 1964, 2, 233–237. [Google Scholar] [CrossRef]
  52. Farber, D.L.; Krisch, M.; Antonangeli, D.; Beraud, A.; Badro, J.; Occelli, F.; Orlikowski, D. Lattice Dynamics of Molybdenum at High Pressure. Phys. Rev. Lett. 2006, 96, 115502. [Google Scholar] [CrossRef]
  53. Leng, Y.; Li, Z.; Liu, W.; Ma, Y.; Liang, C. Orientation Dependent Quasi-isentropic Tensile Behaviors of Body-Centered Cubic Tungsten Through Molecular Dynamics. Met. Mater. Int. 2024, 30, 2699–2712. [Google Scholar] [CrossRef]
  54. Knezevic, M.; Beyerlein, I.J.; Lovato, M.L.; Tomé, C.N.; Richards, A.W.; McCabe, R.J. A strain-rate and temperature dependent constitutive model for BCC metals incorporating non-Schmid effects: Application to tantalum–tungsten alloys. Int. J. Plast. 2014, 62, 93–104. [Google Scholar] [CrossRef]
  55. Wijnen, J.; Hoefnagels, J.P.M.; Geers, M.G.D.; Peerlings, R.H.J. Discrete slip plane analysis of ferrite microtensile tests: Influence of dislocation source distribution and non-Schmid effects on slip system activity. Mater. Des. 2025, 251, 113698. [Google Scholar] [CrossRef]
  56. Zhao, S.; Yin, S.; Liang, X.; Cao, F.; Yu, Q.; Zhang, R.; Dai, L.; Ruestes, C.J.; Ritchie, R.O.; Minor, A.M. Deformation and failure of the CrCoNi medium-entropy alloy subjected to extreme shock loading. Sci. Adv. 2023, 9, eadf8602. [Google Scholar] [CrossRef]
  57. Ma, B.; Rao, Q.; He, Y. Molecular dynamics simulation of temperature effect on tensile mechanical properties of single crystal tungsten nanowire. Comput. Mater. Sci. 2016, 117, 40–44. [Google Scholar] [CrossRef]
  58. Zhang, J.; Li, Y.; Li, X.; Zhai, Y.; Zhang, Q.; Ma, D.; Mao, S.; Deng, Q.; Li, Z.; Li, X.; et al. Timely and atomic-resolved high-temperature mechanical investigation of ductile fracture and atomistic mechanisms of tungsten. Nat. Commun. 2021, 12, 2218. [Google Scholar] [CrossRef]
  59. Chang, H.; Huang, Z.; Wen, S.; Chen, J.; Liu, X.; Pan, M.; Zhao, Y. The influence of crystal defects on the elastic properties of tungsten metals. Fusion Eng. Des. 2016, 109–111, 321–325. [Google Scholar] [CrossRef]
  60. Kanel, G.I.; Razorenov, S.V.; Utkin, A.V.; Fortov, V.E.; Baumung, K.; Karrow, H.U.; Rusch, D.; Licht, V. Spall strength of molybdenum single crystals. J. Appl. Phys. 1993, 74, 7162–7165. [Google Scholar] [CrossRef]
  61. Dora, T.L.; Singh, S.K.; Mishra, R.R.; Yu, H.; Rawat, N.K.; Verma, A. Exploring deformation mechanisms in a refractory high entropy alloy (MoNbTaW). Int. J. Mech. Sci. 2025, 288, 110000. [Google Scholar] [CrossRef]
  62. Liu, W.; Li, Z.; Bai, X.; Ma, Y.; Liang, C.P. A unified model for yield strength and plastic behavior of nanovoid evolution in tungsten based on molecular dynamics simulations. Comput. Mater. Sci. 2022, 211, 111534. [Google Scholar] [CrossRef]
  63. Li, Z.; Liu, W.; Ma, Y.; Liang, C. Heterogeneous nucleation of plastic defects and tension-compression asymmetry in the presence of vacancies in W single crystals. J. Nucl. Mater. 2025, 610, 155806. [Google Scholar] [CrossRef]
  64. Li, Z.; Liu, W.; Ma, Y.; Liang, C. Influence of crystallographic orientations and nanovoid on the plastic mechanism and damage behavior of single-crystal tungsten under shock. J. Mater. Res. Technol. 2025, 35, 714–725. [Google Scholar] [CrossRef]
  65. Rice, J.R.; Tracey, D.M. On the ductile enlargement of voids in triaxial stress fields∗. J. Mech. Phys. Solids 1969, 17, 201–217. [Google Scholar] [CrossRef]
  66. Mcveigh, C.; Vernerey, F.; Liu, W.K.; Moran, B.; Olson, G. An interactive micro-void shear localization mechanism in high strength steels. J. Mech. Phys. Solids 2007, 55, 225–244. [Google Scholar] [CrossRef]
Figure 1. Equation of BCC Mo evaluated with the Ravelo EAM potential (purple *) and from first-principles calculations.
Metals 15 00685 g001
Figure 2. Comparison of enthalpy differences between ground-state BCC and close-packed (FCC/HCP) phases calculated by the Ravelo EAM potential and Zhou’s EAM potentials (reprinted from Ref. [47]) for Mo.
Metals 15 00685 g002
Figure 3. Comparison of phonon spectra calculated using the Ravelo EAM potential and Zhou’s EAM potential (reprinted from Ref. [47]) experimental data (reprinted from Refs. [50,51,52]).
Metals 15 00685 g003
Figure 4. The evolution of longitudinal stress, von Mises stress, and temperature with strain in simulations with different loading directions: (a) [100] direction; (b) [110] direction; (c) [111] direction; and (d) polycrystal.
Metals 15 00685 g004
Figure 5. Schematic diagrams of structural evolution (top) and stress distribution (bottom) during triaxial tensile loading tests.
Metals 15 00685 g005
Figure 6. Structural snapshots at the end of the phase transition stage during triaxial tensile loading tests.
Metals 15 00685 g006
Figure 7. Structural snapshots of the spalling process (left) and dislocation/void snapshots (right) during triaxial tensile loading tests.
Metals 15 00685 g007
Figure 8. Surface position and velocity profiles of Mo after shock simulation: (a) [100], (b) [110], (c) [111], (d) polycrystal.
Metals 15 00685 g008
Figure 9. Time-sequence visualization of phase transition progress in single-crystal Mo and polycrystal Mo under piston shock loading test.
Metals 15 00685 g009
Figure 10. Time-sequence visualization of defect structure evolution in single-crystal Mo and polycrystal Mo under piston shock loading test.
Metals 15 00685 g010
Table 1. Details of the simulation settings for quasi-isentropic loading tests.
Loading Crystal TypeLoading DirectionOrthogonal Coordinate System AxesSimulation System Dimensions (Å)Number of Atoms
MoSingle crystal[100][100] [010] [001]283.14 * 283.14 * 585.163,013,200
[100][001] [1 1 ¯ 0] [110]195.05 * 195.76 * 400.42982,080
[111][1 1 ¯ 0] [11 2 ¯ ] [111]293.73 * 380.28 * 588.674,219,776
Polycrystalxx, y, z100.24 * 100.24 * 200.48128,520
Table 2. Details of the simulation settings for piston shock loading tests.
Loading Crystal TypeLoading DirectionSimulation System Dimensions (Å)Number of AtomsImpact Velocity (km/s)Loading Time
MoSingle crystal[100]201 * 201 * 5031,310,7200.85 ps + 5 ps + 5 ps
[110]200 * 201 * 4921,290,2400.85 ps + 5 ps + 5 ps
[111]133 * 200 * 501861,1200.85 ps + 5 ps + 5 ps
Polycrystalx200 * 200 * 5011,283,4470.85 ps + 5 ps + 5 ps
Table 3. Ravelo EAM potential parameters optimized via simulated annealing.
ParametersMo
α4.9757
Ec(eV)7.57
f30.0266
f40.0306
U0(eV)0.5669
r1 ( Å ) 2.8366
αp2.1431
β30
β40
rs ( Å ) 2.8388
s5.6106
rc ( Å ) 4.7733
a1 ( Å s ) −1.6319
a2 ( Å ( s + 1 ) ) 2.1267
a3 ( Å ( s + 2 ) ) −0.9473
a4 ( Å ( s + 3 ) ) 0.1434
p4.2079
q3.3179
ρ00.0826
Table 4. Comparison of partial properties of Mo calculated using the Ravelo EAM potential with experimental, MEAM, and GGA-PBE data.
This WorkExp. [45]MEAM [34]GGA-PBE [34]
a0 ( Å )3.1463.1463.1673.169
Ec (eV/atom)−6.805−6.81−6.82−6.25
C11 (GPa)453.65464.7441462
C12 (GPa)161.64161.5158163
C44 (GPa)108.36108.996102
Disclaimer/Publisher’s Note: The statements, opinions and data contained in all publications are solely those of the individual author(s) and contributor(s) and not of MDPI and/or the editor(s). MDPI and/or the editor(s) disclaim responsibility for any injury to people or property resulting from any ideas, methods, instructions or products referred to in the content.

