Article

Evaluation of the Suitability of High-Temperature Post-Processing Annealing for Property Enhancement in LPBF 316L Steel: A Comprehensive Mechanical and Corrosion Assessment

1
Physics Department, Pryazovskyi State Technical University, 49044 Dnipro, Ukraine
2
Institute of Materials Research, Slovak Academy of Sciences, 04001 Kosice, Slovakia
3
International Research Institute for Steel Technology, Collaborative Innovation Center for Advanced Steels, Wuhan University of Science and Technology, Wuhan 430081, China
*
Author to whom correspondence should be addressed.
Metals 2025, 15(6), 684; https://doi.org/10.3390/met15060684
Submission received: 30 April 2025 / Revised: 6 June 2025 / Accepted: 16 June 2025 / Published: 19 June 2025

Abstract

This study aims to comprehensively assess the suitability of post-processing annealing (at 900–1200 °C) for enhancing the key properties of 316L steel fabricated via laser powder bed fusion (LPBF). It adopts a holistic approach to investigate the annealing-driven evolution of microstructure–property relationships, focusing on tensile properties, nanoindentation hardness and modulus, impact toughness at ambient and cryogenic temperatures (−196 °C), and the corrosion resistance of LPBF 316L. Annealing at 900–1050 °C reduced tensile strength and hardness, followed by a moderate increase at 1200 °C. Conversely, ductility and impact toughness peaked at 900 °C but declined with the increasing annealing temperature. Regardless of the annealing temperature and testing conditions, LPBF 316L steel fractured through a mixed transgranular/intergranular mechanism involving dimple formation. The corrosion resistance of annealed steel was significantly lower than that in the as-built state, with the least detrimental effect being observed at 1050 °C. These changes resulted from the complex interplay of annealing-induced structural transformations, including elimination of the cellular structure and Cr/Mo segregations, reduced dislocation density, the formation of recrystallized grains, and the precipitation of nano-sized (MnCrSiAl)O3 inclusions. At 1200 °C, an abundant oxide formation strengthened the steel; however, particle coarsening, combined with the transition of (MnCrSiAl)O3 into Mo-rich oxide, further degraded the passive film, leading to a sharp decrease in corrosion resistance. Overall, post-processing annealing at 900–1200 °C did not comprehensively improve the combination of LPBF 316L steel properties, suggesting that the as-built microstructure offers a favorable balance of properties. High-temperature annealing can enhance a particular property while potentially compromising other performance characteristics.

1. Introduction

316L stainless steel (ASTM A240 [1]) is widely utilized across diverse industries due to its exceptional combination of mechanical properties, biocompatibility, resistance to general and localized (pitting/crevice) corrosion, improved creep and stress rupture resistance, and higher tensile strength at elevated temperatures [2,3]. The traditional manufacturing process for 316L involves costly and time-consuming metallurgical operations, thus making this type of steel particularly expensive for producing complex, precise components. These limitations can be addressed through additive manufacturing (AM) technologies, which significantly reduce the fabrication time and enable broader applications of 316L components. Among various known AM techniques, laser-based powder bed fusion (LPBF) is recognized as one of the most promising and efficient technologies [4]. Along with obvious advantages, LPBF presents challenges due to the complex thermal dynamics of laser-melted powder particles which may cause residual stresses, surface defects, internal porosity, and micro-cracks [5,6]. Integrity issues can be mitigated by optimizing printing parameters [7,8] and via post-processing heat treatment (HT) [9,10,11]. Furthermore, LPBF-fabricated components exhibit a fine cellular microstructure, resulting in increased hardness and reduced ductility compared to wrought counterparts. According to [12], the cellular microstructure remains stable up to 873 K and is eliminated at higher temperatures. Post-processing treatments are employed to tailor the mechanical properties of AM metallic parts [13,14]. The microstructure and properties of LPBF-processed 316L steel have been heavily studied, with researchers focusing on using post-processing techniques to enhance its performance, including laser shock peening [15], ultrasonic severe surface rolling [16], ultrasonic nanocrystalline surface modification [17,18], hot isostatic pressing [19], pulsed-plasma modification [20], etc. [21,22]. Among them, bulk heat treatment stands out as the most widely studied with respect to AM-316L steel [23,24,25,26].
The influence of post-heat treatment is primarily evaluated based on its impact on the corrosion and/or mechanical properties of LPBF 316L steel. It should be noted that despite the large number of studies published on this topic, there is still no consensus among researchers regarding the nature of HT’s impact on these properties, making this an unresolved scientific challenge. For instance, in articles [22,23,24,27,28,29], which are dedicated to the corrosion resistance and high-temperature oxidation resistance of AM 316L steel, diverse findings are reported. Some authors suggest that post-processing HT enhances the corrosion resistance of LPBF 316L steel. This conclusion was reached, in particular, by Moghadas et al. [28], Zhou et al. [30], and Liu et al. [31], who attributed the improved corrosion resistance to the relief of residual stresses (at 450 °C [28]), the elimination of melt pool boundaries identified as pitting initiation sites (at 950 °C [30]), or the recrystallization-induced formation of Σ3 twin grain boundaries and the appearance of stable SiO2 inclusions (at 1200 °C [31]). Conversely, other studies indicate that post-processing heat treatment reduces the resistance of LPBF 316L steel to uniform and localized corrosion. Indeed, refs. [27,29] demonstrate that increasing annealing temperatures reduces stress corrosion cracking resistance and increases the susceptibility of LPBF 316L to stable pitting, as explained by a transition from low-angle grain boundaries to high-angle grain boundaries [27] and by the thinning of the passive film due to compressive stress relief and a decrease in dislocation density under annealing [29]. Several studies [32,33,34,35,36] attribute the decline in corrosion resistance of AM 316L steel to the precipitation of non-metallic inclusions from austenite. Duan et al. [35] and Laleh et al. [36] observed the formation of MnS oxide particles under high-temperature annealing (900–1150 °C), which reduced the pitting resistance of AM 316L steel. In contrast, the authors of [23,37,38] ascribed the deterioration of corrosion resistance of 316L steel to HT-driven oxide precipitation, depleting alloying elements in the oxide-adjacent matrix. While oxide precipitation is considered a detrimental structural factor, it may offer potential for steel strengthening, similar to oxide dispersion-strengthened steels [39,40].
Similarly, diverse opinions have been expressed regarding the impact of post-processing HT on the mechanical and fatigue properties of LPBF 316L steel [41,42,43]. Stress relief HT [44] and solution HT at 1060–1110 °C [45] have been reported to enhance fatigue strength and low-cycle fatigue life in this steel, respectively. Moreover, Yadollahi et al. [46] observed enhanced tensile properties of direct laser-deposited (DLD) 316L steel after homogenization at 1150 °C (2 h). Conversely, the authors of [12,47,48,49] highlighted a reduced tensile strength with increasing HT temperature due to the elimination of the cellular structure. Indeed, Kumaran et al. [48] reported maximum ductility in direct energy-deposited (DED) 316L after HT at 1100 °C. Thus, HT allows for manipulating the cellular sub-grain structure to tailor the mechanical properties of LPBF 316L [49].
Most studies on LPBF 316L steel focus on its tensile and fatigue properties, typically evaluated at ambient or elevated temperatures [23,46,47,50]. However, given the diverse applications of 316L, LPBF-made components may also be subjected to high-energy impacts across a broader temperature range, including subzero conditions. Consequently, research on the toughness of LPBF 316L has primarily focused on low-speed loading (fracture toughness measurements [51,52]) rather than high-speed (Charpy) testing [51,53]. In particular, there is little information available on testing LPBF 316L steel at cryogenic temperatures [54]. Thus, the variation in the impact toughness of LPBF 316L steel at different test temperatures, depending on the post-processing HT regime and microstructure, remains insufficiently studied.
Despite the numerous studies on this topic, the majority examine only one or a few key properties obtained after applying one or two HT regimes. This prevents a comprehensive understanding of post-processing HT’s impact on the full range of properties. The aforementioned limitations and contradictory findings in the literature leave open the question of the feasibility of applying high-temperature heat treatment to LPBF 316L, which is of significant practical importance. Addressing this question was the motivation for this study. The primary research objective of the present study was to comprehensively evaluate the influence of annealing temperature over a wider range (900–1200 °C) on the mechanical and corrosion properties of LPBF-fabricated 316L stainless steel. The set of mechanical properties was extended by including tensile properties, nanoindentation parameters, and impact toughness at ambient and cryogenic temperatures to evaluate the behavior of this steel under different testing conditions. To achieve this study’s objective, tasks were carried out that involved analyzing the evolution of the microstructure depending on the HT temperature and its relationship with specific properties and the rapture mechanism.

2. Materials and Methods

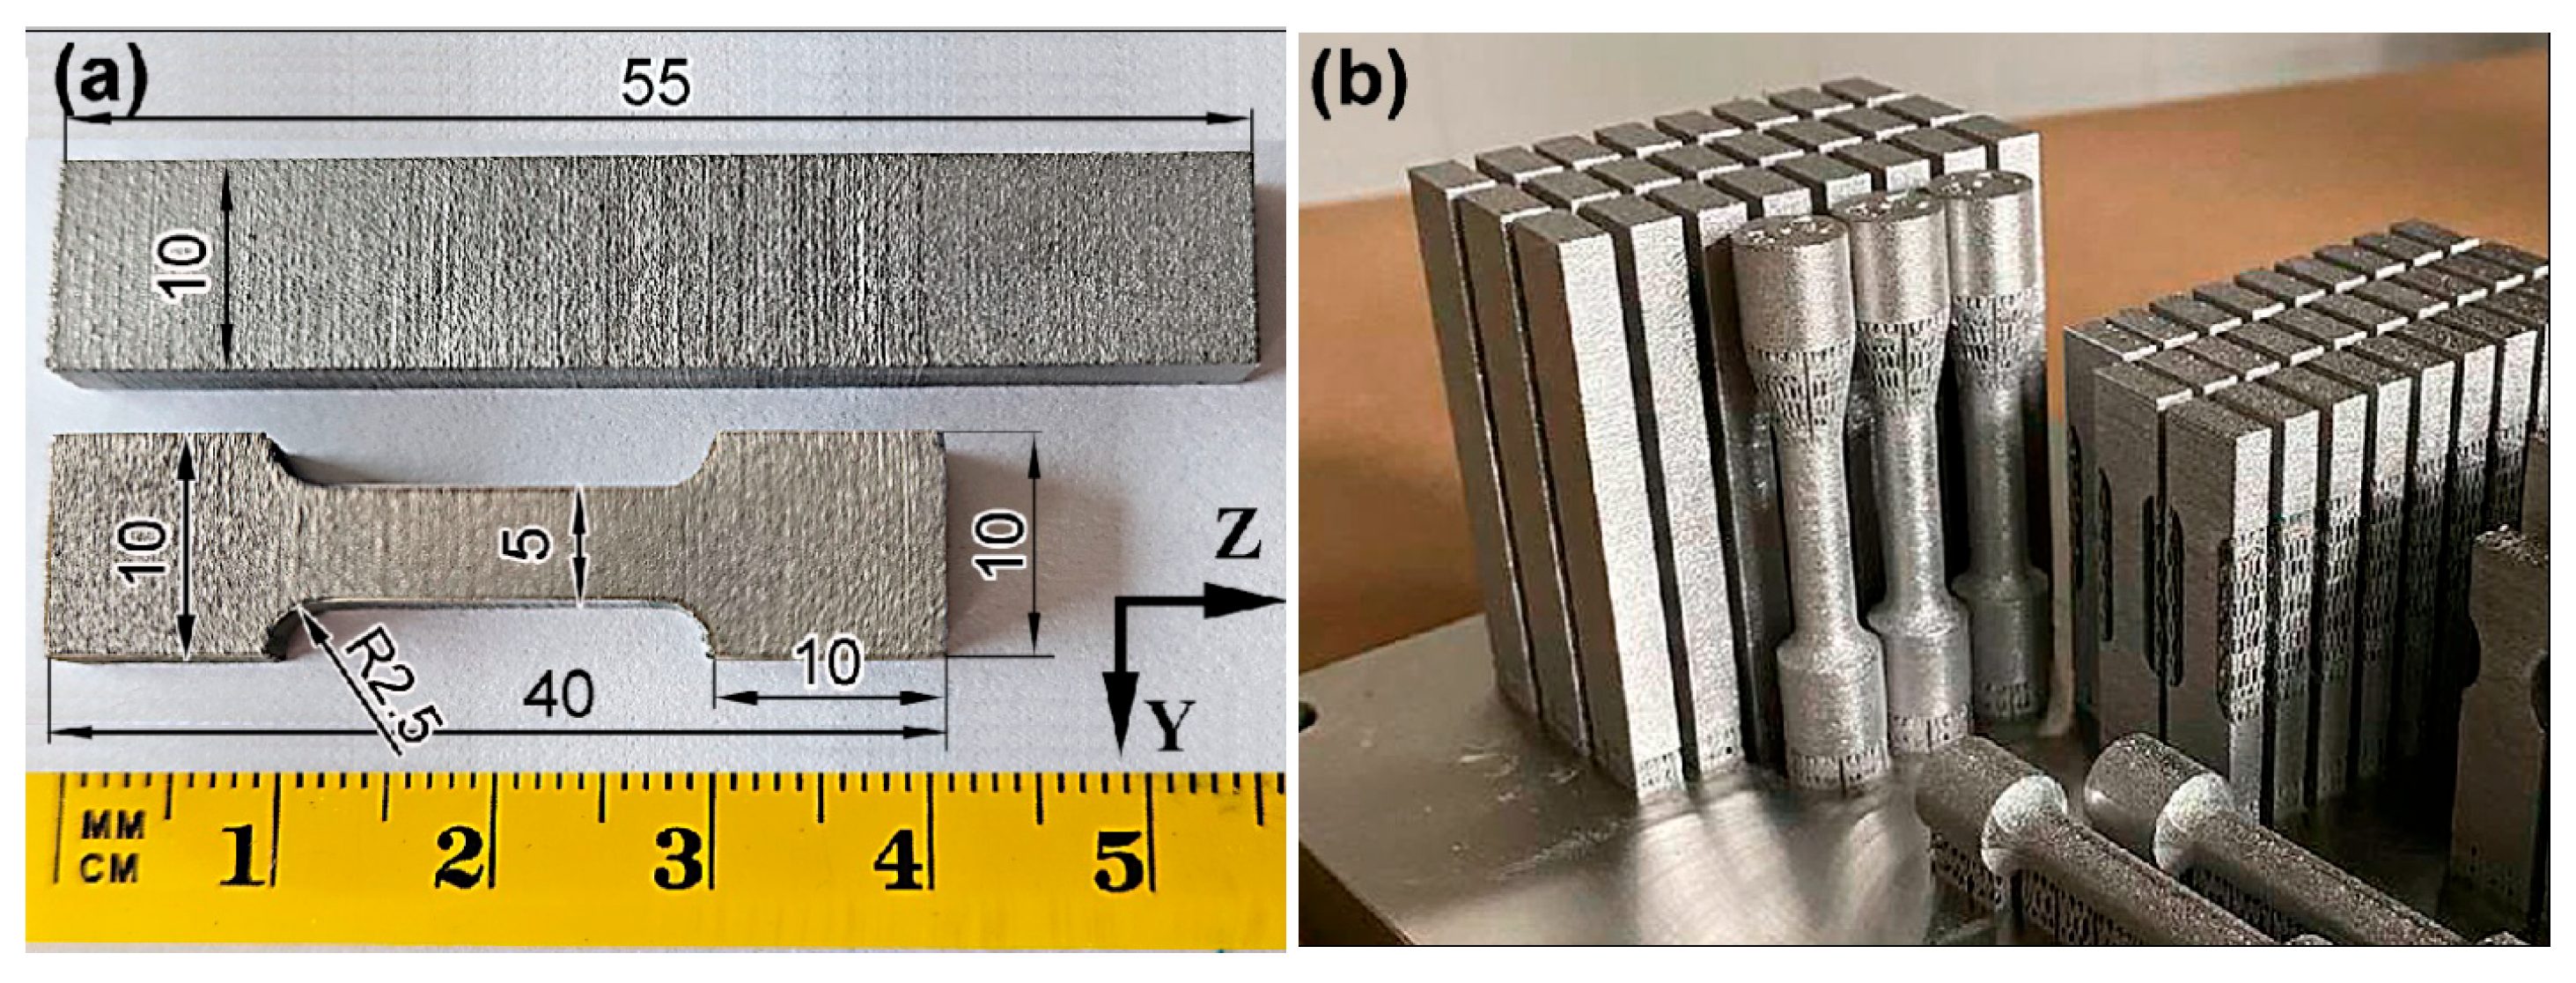
2.1. Specimen Preparation

Specimens were fabricated via the laser powder bed fusion technique using the 3D printer Alfa-150D (Additive Laser Technology, Dnipro, Ukraine) with the following parameters: a laser power of 195 W, a scanning speed of 1150 mm/s, a laser spot diameter of 45 µm, a layer thickness of 40 µm, hatch spacing of 100 µm, a scanning strategy based on stripe, and a rotation angle of 67°. The feedstock consisted of gas-atomized 316L stainless steel powder with a particle size range of 15–45 µm. The chemical compositions of the as-printed specimens (Table 1) were determined using an optical emission spectrometer NCS Labspark 1000 (NCS Testing Technology Co., Ltd., Beijing, China).
Tensile and Charpy specimens, both 5 mm thick, were fabricated via LPBF, and their dimensions are shown in Figure 1a. During fabrication, specimens were oriented with their long axes being parallel to the build direction (Z-axis, Figure 1b). Charpy specimens were notched using a wire electrical discharge machine DK77 (Tiazhou Chuangyan Machines Co, Ltd., Taizhou, China). As-built specimens (designated as AsB) underwent annealing at 900 °C, 1050 °C, and 1200 °C for 5 h, followed by water quenching, and were labeled A900, A1050, and A1200, respectively. Heat treatments were performed under a protective atmosphere of technical grade N2 (99.9% purity). Annealed specimens were ground to Ra = 0.2 µm to remove oxides and diminish the technological roughness.

2.2. Mechanical and Corrosion Property Testing

Tensile testing was conducted using the TiraTest 2300 testing machine (TIRA GmbH, Schalkau, Germany) at a loading speed of 1.5 mm/min. During tensile testing, the following properties were defined: (a) yield tensile strength (YTS) referring to the offset yield point of 0.2% plastic strain; (b) ultimate tensile strength (UTS); (c) total elongation (TEL); and (d) area reduction (AR). The Charpy test was performed on a WANCE PIT602H-4 pendulum-type machine (Shenzhen Wance Testing Machine Co., Shenzhen, China) at room temperature (RT, 25 °C) and liquid nitrogen temperature (LNT, −196 °C). Impact toughness (KCV) was calculated as the absorbed impact energy divided by the cross-sectional area (J/cm2). Nanoindentation was carried out using the Nano Indenter G200 (Agilent Technologies, Santa Clara, CA, USA) with a Berkovich indenter tip. Indentation was performed at a displacement rate of 10 nm/s to a maximum load of 50 gf, with 100 imprints made in a 10 × 10 grid (50 µm spacing) to assess result variability. The following parameters were derived from nanoindentation: indentation modulus, indentation hardness, the elastic recovery index (ERI), the plasticity index (PI), and the shear of plastic displacement (hp/hmax). The ERI and the PI were calculated from the “Load/Displacement” curves as described in [56]:
E R I = W e W t ,
P I = W p W t .
where We and Wp are the elastic energy and plastic energy, respectively, as defined by the area under the “load/displacement” curve according to ISO 14577-1. Wt is the total energy of nanoindentation (Wt = We + Wp). The shear of plastic displacement was determined to be hp/hmax, where hp is the plastic displacement and hmax is the total displacement [57].
The corrosion resistance was assessed using electrochemical impedance spectroscopy (EIS) and potentiodynamic polarization (PDP) with a Princeton VersaSTAT3F electrochemical workstation (Ametek, Berwyn, IL, USA). Experiments were conducted at RT by employing a three-electrode system, comprising a platinum sheet as the counter electrode, a saturated calomel electrode as the reference electrode, and the steel specimen as the working electrode. The test medium was Ringer’s solution, a medical physiological saline containing 0.9% NaCl. The EIS measurements were performed at open-circuit potential (OCP) using a sinusoidal potentiostatic signal with an amplitude of 10 mV across a frequency range of 100 kHz to 0.01 Hz. The resulting data were analyzed and fitted using ZSimpWin software (version 3.2). PDP measurements were conducted at a scan rate of 0.5 mV/s, spanning from −0.5 V to 1.0 V (vs OCP). All tests commenced after the OCP stabilized, exhibiting fluctuations of less than ±10 mV over 15 min.

2.3. Microstructure Characterization

Specimens for microstructure observation were polished using SiC emery papers and 1 µm diamond paste and then etched with a 3:1 mixture of HCl and HNO3. The microstructure was examined using an optical microscope GX71 (Olympus Corporation, Tokyo, Japan) and a JEOL JSM-7000F field emission scanning electron microscope (FE-SEM) (JEOL, Tokyo, Japan) equipped with an Oxford Instruments INCAx-sight energy-dispersive X-ray (EDX) detector (Oxford Instruments, High Wycombe, UK). Electron backscattering diffraction (EBSD) analysis was conducted using the EBSD Symmetry S3 system (Oxford Instruments, High Wycombe, UK) on an Apreo S Hivac FE-SEM (Thermo Fisher Scientific, Waltham, MA, USA) with a 20 kV accelerating voltage and a 1.0 µm sampling step size. Phase identification was performed via X-ray diffraction (XRD) using an X’Pert PRO diffractometer (PANalytical, Worcestershire, UK) with Cu-Kα radiation, operating at 40 kV and 50 mA, with a scan step of 0.033° and scan speed of 0.069 °/s. XRD patterns were analyzed using MAUD software (version 2.9995). For transmission electron microscopy (TEM), 3 mm diameter foils were mechanically polished and electro-etched in 10 wt% perchloric acid at 20 V and RT. Scanning TEM and high-resolution TEM (HRTEM) images were obtained using a JEOL JEM-F200 transmission electron microscope (JEOL, Tokyo, Japan). The non-metallic inclusions were statistically analyzed using five TEM images, each covering a 12 µm × 12 µm area.

3. Results

3.1. Mechanical Properties and Fracture Morphologies

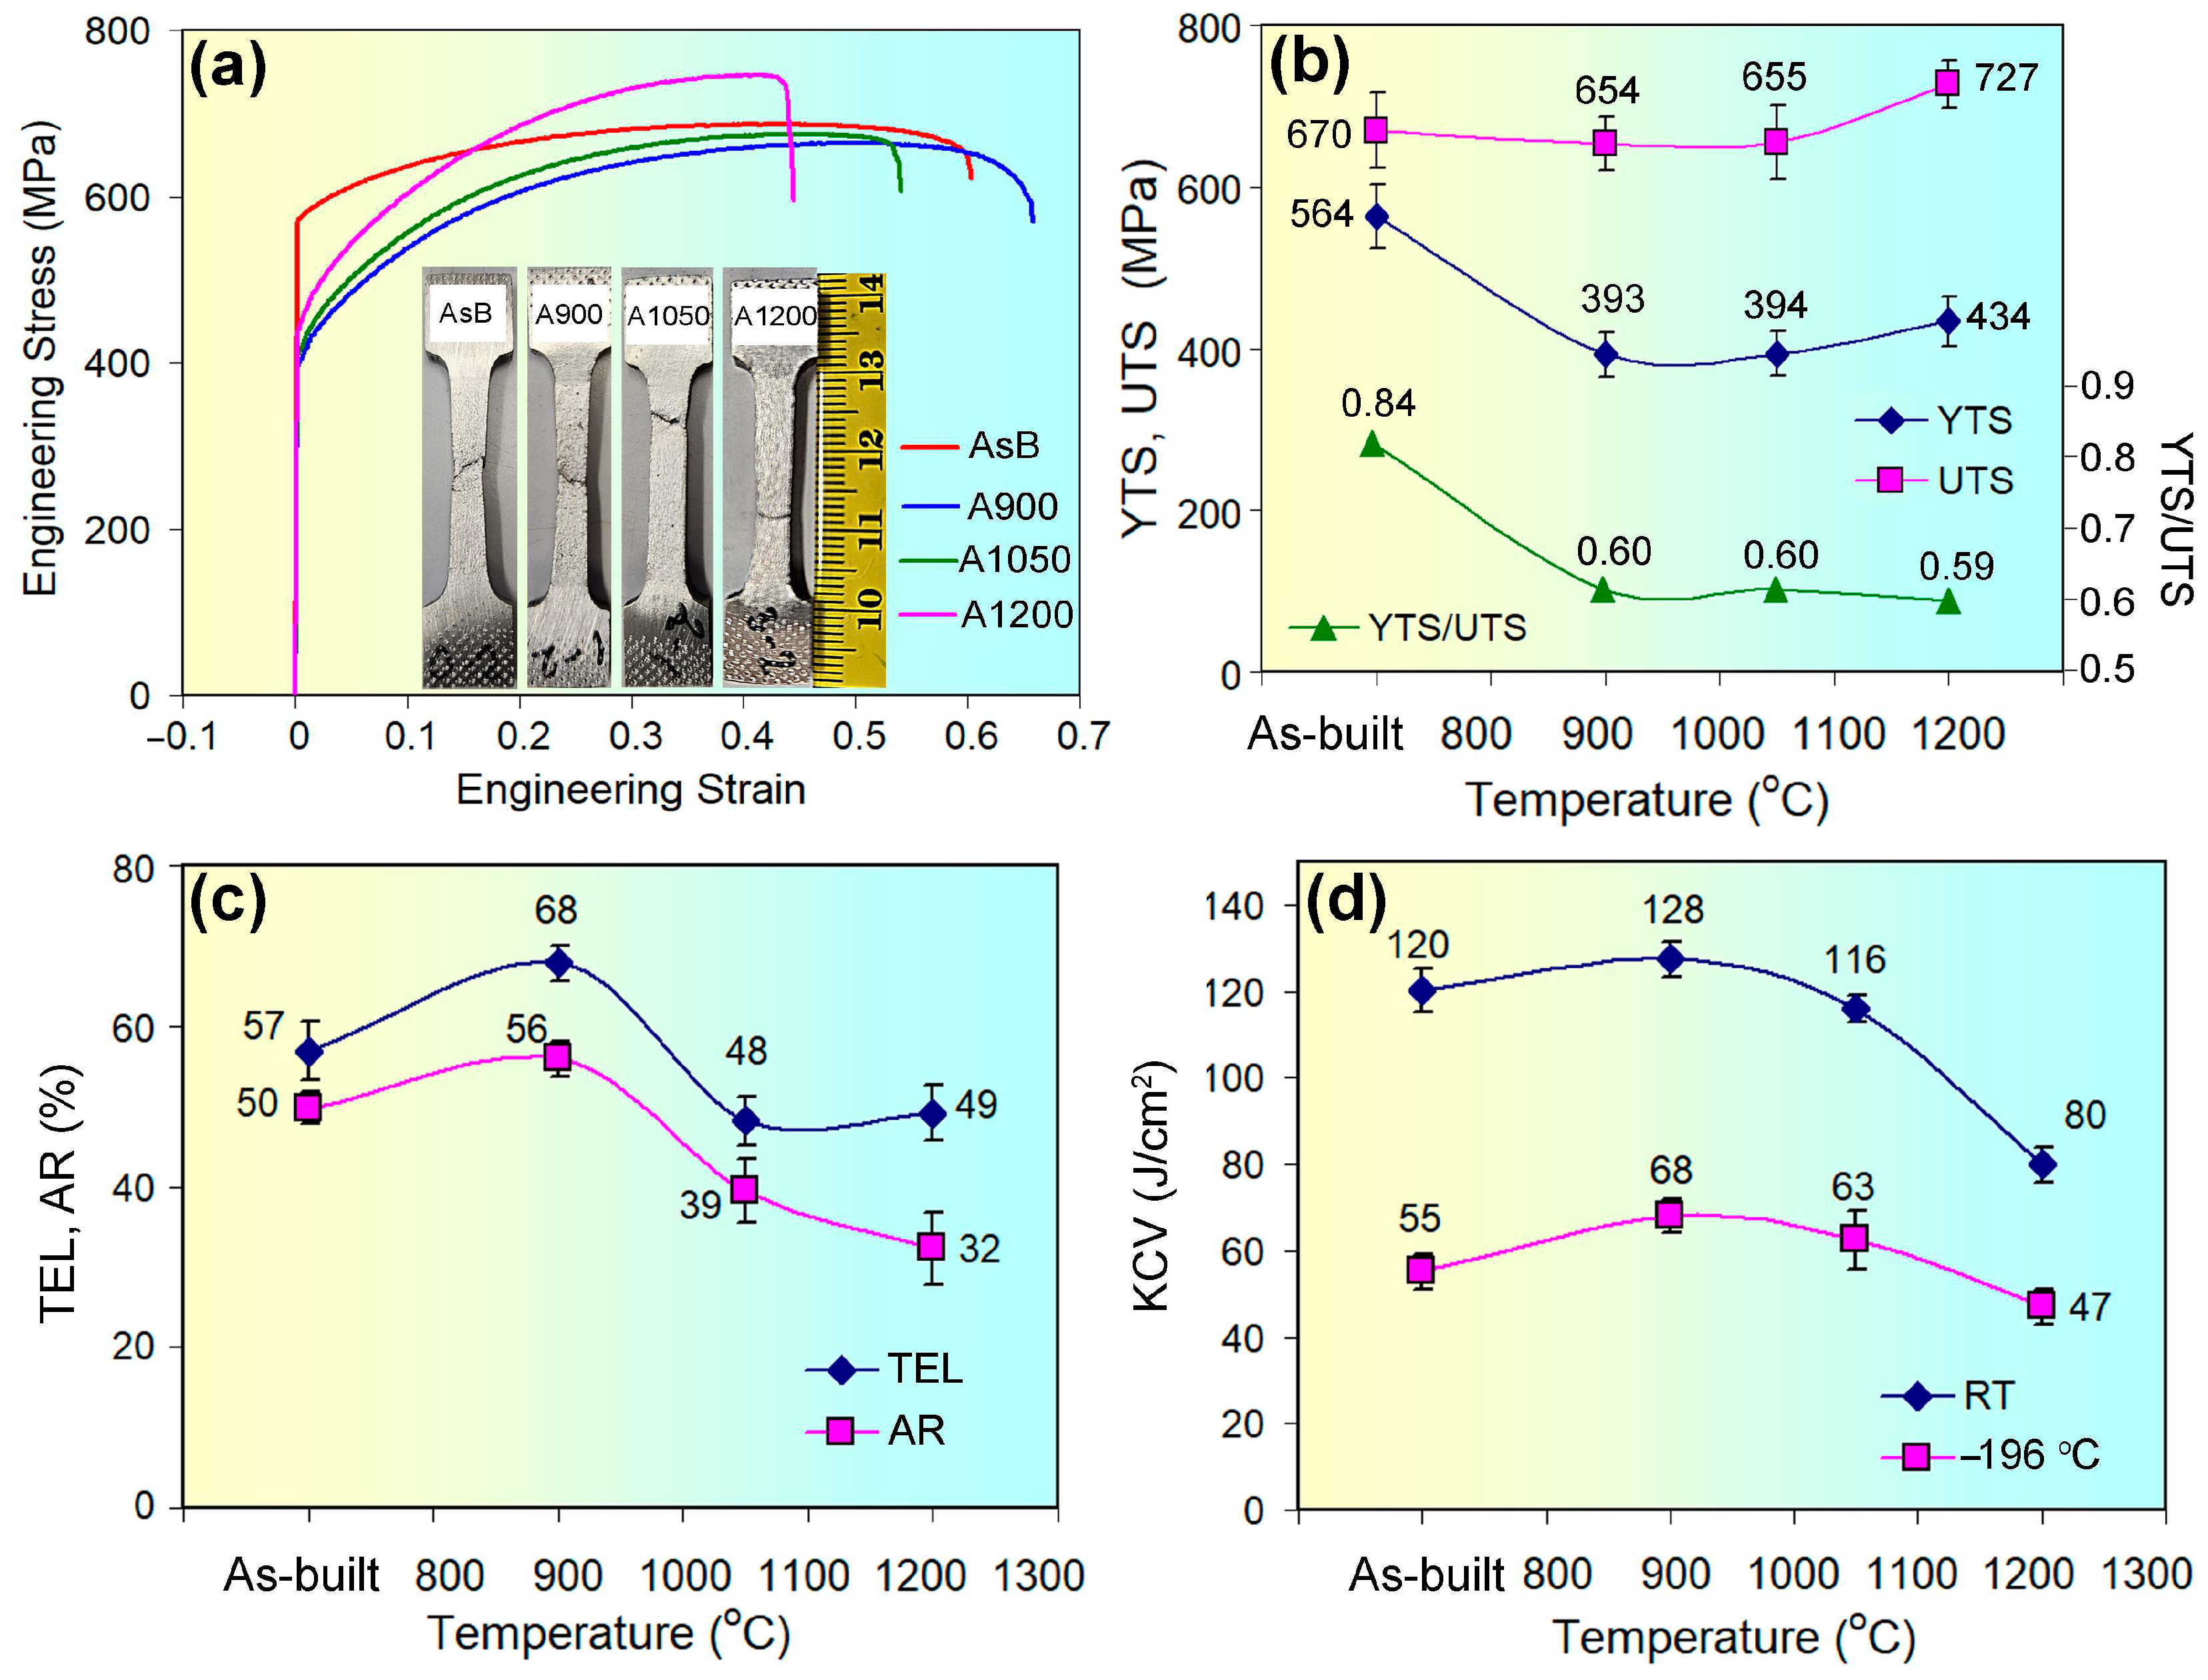
3.1.1. Tensile and Impact Testing

The tensile behavior of 316L steel is characterized by the load curve profiles shown in Figure 2a. The lowest yield point load corresponds to specimens annealed at 900 °C and 1050 °C, while the highest one is observed for specimen AsB; the 1200 °C-annealed specimen exhibits intermediate yield stress. For AsB, strength increases most significantly during deformation, peaking at ε = 0.43. Other specimens show less pronounced work hardening, extending to higher strain values, with the maximum value identified in A900 specimens. All curves display a region of localized deformation, corresponding to the onset and progression of necking. The A1200 specimen exhibits the most rapid neck formation, indicated by a sharp stress drop, suggesting a lower uniform deformation capacity. In contrast, AsB and A900 specimens show delayed neck development, likely due to higher ductility, enabling greater resistance to localized deformation.
Figure 2b–d present the mechanical properties derived from tensile and impact testing. As shown in Figure 2b, as-built 316L steel exhibited a high yield tensile strength of 564 ± 39 MPa, 2.5 times greater than the minimum specified by ASTM F3184-16 (YTS ≥ 215 MPa) [58]. Annealing at 900 °C and 1050 °C significantly reduced YTS to 393–394 MPa, with a slight increase to 434 ± 30 MPa after annealing at 1200 °C. Unlike YTS, ultimate tensile strength remained largely unaffected by annealing at 900 °C and 1050 °C compared to the as-built state, with a 57 MPa increase after 1200 °C. Consequently, the YTS/UTS ratio, reflecting formability and stress-sustaining capacity, decreased from 0.84 in the as-built state to 0.59–0.60 across all annealing temperatures (Figure 2b).
As shown in Figure 2c, as-built 316L steel samples, despite their high yield strength, exhibited excellent ductility with a total elongation of 57 ± 2.3%, significantly surpassing ASTM F3184-16 requirements. Annealing at 900 °C further increased ductility for TEL to 68 ± 2.2%. However, at higher annealing temperatures, TEL decreased, leveling at 48–49%. Notably, the YTS and TEL profiles did not align, indicating that strength and ductility changes were not linearly correlated, reflecting complex microstructural evolution during annealing. In contrast, area reduction (AR) and impact toughness (at room and cryogenic temperatures) followed a similar trend: increasing from the as-built state to 900 °C, before decreasing to 1200 °C (Figure 2c,d). After annealing at 900 °C, the steel peaked for AR (56 ± 2.1%) and impact toughness (128 ± 4.0 J/cm2 at RT; 68 ± 5.2 J/cm2 at LNT), suggesting the creation of an optimized microstructure for enhanced ductility and toughness. Conversely, 1200 °C-annealed steel showed the highest UTS but the lowest ductility and impact toughness (AR = 32 ± 3.5%, KCVRT = 80 ± 3.9 J/cm2, KCVLNT = 47 ± 2.8 J/cm2).
An analysis of Figure 2d reveals that the as-built impact toughness (≤128 J/cm2) was slightly lower than the reported values for LPBF 316L steel [59,60], possibly due to microstructural variations from differing manufacturing parameters. At −196 °C, impact toughness decreased consistently (1.7–2.2 times) across as-built and annealed specimens, suggesting that cryogenic temperature effects on toughness were largely independent of heat treatment.

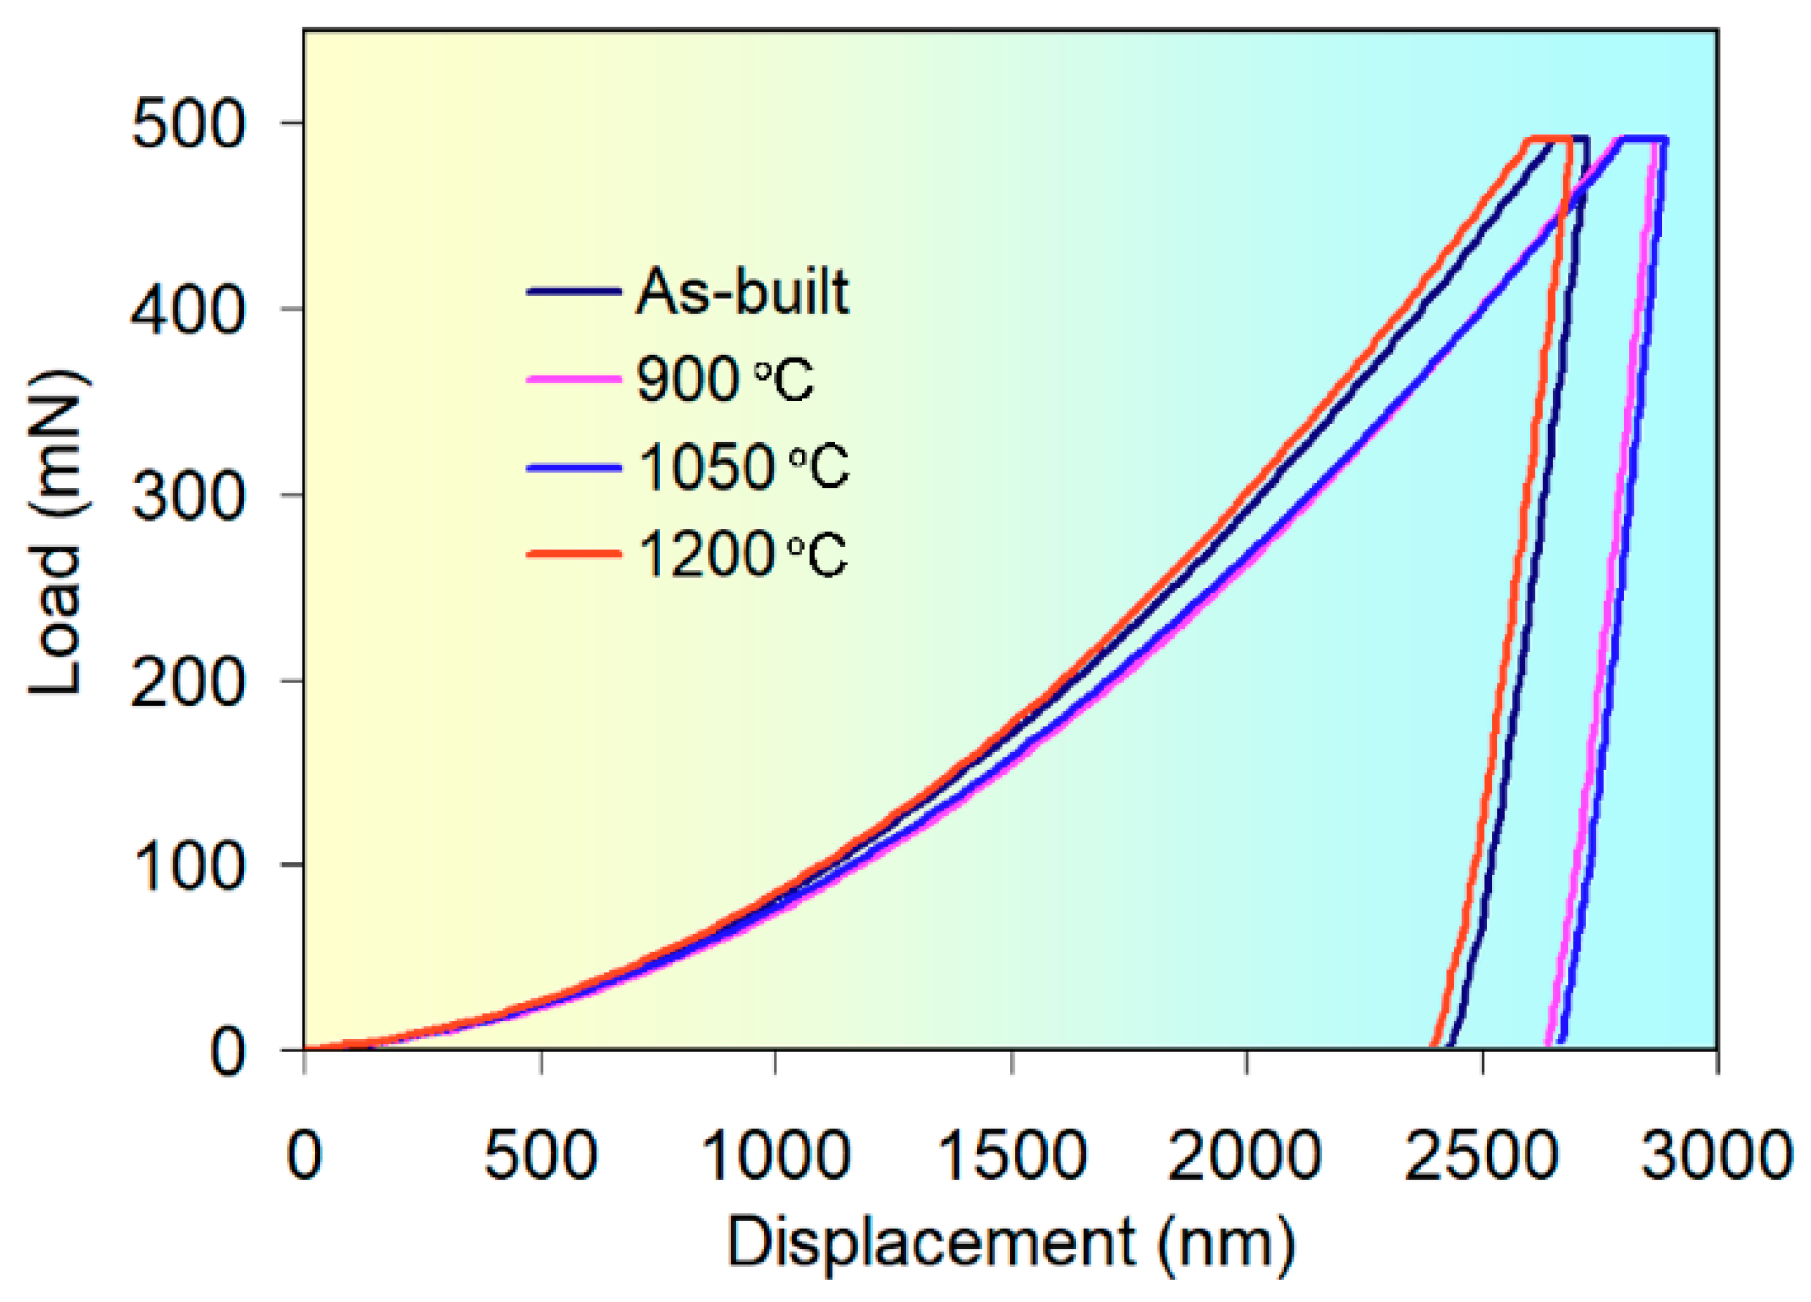
3.1.2. Nanoindentation
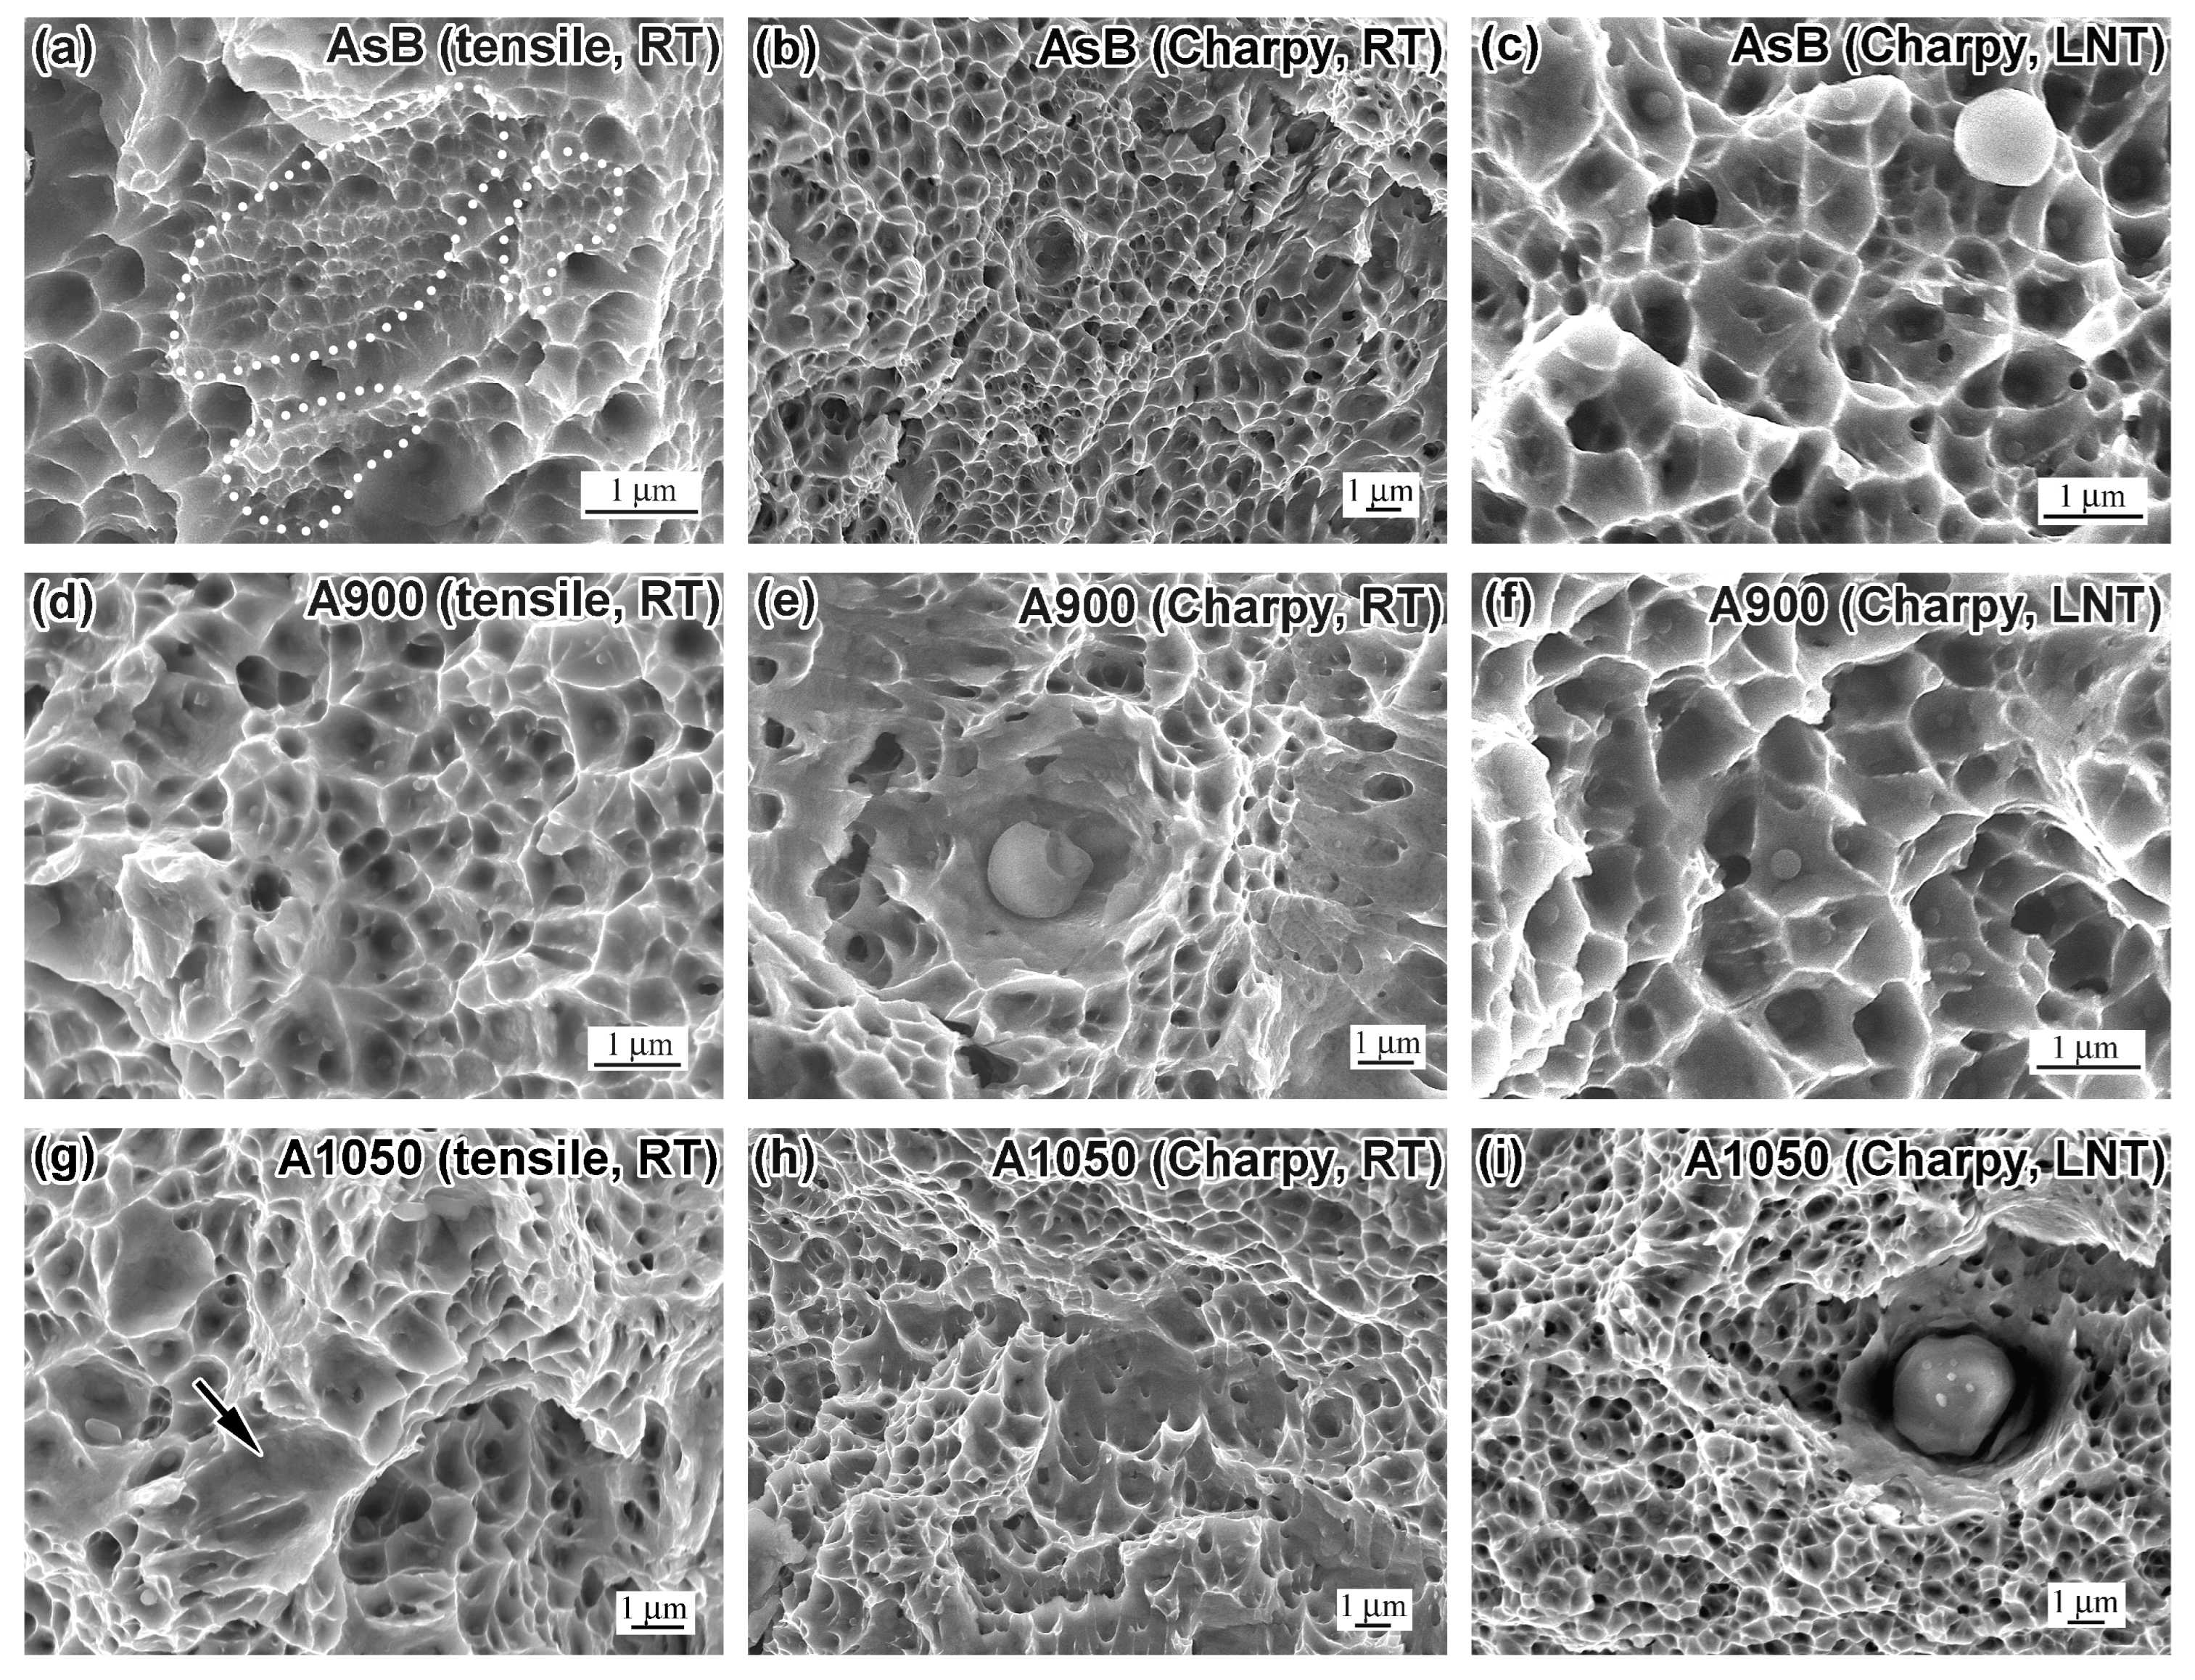
Figure 3 displays the characteristic load–displacement curves, illustrating the nanoindentation response of LPBF 316L steel as the indenter penetrates to a maximum load of 50 mN, followed by unloading. Each curve represents the average indentation response for a specific specimen type, corresponding to its average indentation hardness. The curves show distinct variations in maximum indentation depth, correlating with the material’s deformation resistance. The specimens are divided into two groups based on maximum indentation depth. A900 and A1050 specimens exhibit the highest maximum depth (~2900 nm), indicating lower deformation resistance. In contrast, AsB and A1200 specimens show a lower depth of ~2700 nm, reflecting higher deformation resistance and increased hardness.
Table 2 summarizes the results of micromechanical property measurements. The scatter of indentation modulus (hereafter referred to as modulus) values reached up to 30 GPa for the AsB, A900, and A1050 specimens, and 23.5 GPa for A1200, suggesting a reduced elastic response heterogeneity with high-temperature annealing. In the as-built state, 316L steel had the lowest modulus (156.9 GPa), indicating reduced stiffness inherent in LPBF processing. Annealing at 900 °C increased the modulus by 22% to 191.3 GPa, aligning with the literature values for wrought 316L steel [61]. However, beyond 900 °C, the modulus gradually declined, reverting to as-built levels at higher temperatures, suggesting that elevated annealing temperatures induced microstructural changes that reduced the material’s elastic response.
Indentation hardness (hereafter referred to as hardness) showed limited variation across different specimens. The as-built sample had an average hardness of 3.02 GPa, consistent with the reported values for LPBF 316L steel [55], exceeding those of wrought 316L steel by factor 1.5 [62]. Annealing at 900 °C reduced hardness to 2.42 GPa, with a similar value at 1050 °C. In contrast, annealing at 1200 °C increased hardness to 3.10 GPa, slightly surpassing that of the as-built state. The elastic properties of LPBF 316L steel, evaluated via the elastic recovery index (ERI), varied with annealing temperature. The ERI decreased from 0.135 in the as-built state to 0.114 at 900 °C, indicating increased plastic deformation after annealing. However, at higher solution temperatures, the ERI rose to 0.143 at 1050 °C and 0.156 at 1200 °C, surpassing the as-built value. This suggests that higher annealing temperatures, especially 1200 °C, enhance elastic recovery, improving resistance to permanent deformation. Conversely, plastic properties, assessed via the plasticity index (PI) and the ratio of plastic displacement to maximum indentation depth (hp/hmax), showed the opposite trend. These parameters, reflecting plastic deformation capacity, indicated the highest plasticity for the A900 specimen and the lowest for the in A1200 (PI) and AsB (hp/hmax) specimens.

3.1.3. Fractography

The fracture surface morphologies of LPBF 316L steel specimens under uniaxial tension and impact loading are presented in Figure 4 and Figure 5. Surface analysis was performed at low and high magnifications to provide a deeper understanding of fracture mechanisms. The macro-level fracture character (×200–500 magnification) is shown in Figure 4, using AsB and A1200 specimens as examples (similar patterns apply to A900 and A1050 specimens). The tensile and impact specimens from both groups share common features. Regardless of the test temperature, fracture surfaces exhibit coarse “terrace”-shaped relief, combining transgranular and intragranular fracture patterns. These surfaces feature rather flat cleavage facets (up to 100 µm in size) at varying levels, interconnected by the steps. Secondary micro-cracks and tear-out zones, appearing as large cavities, are evident, particularly in A1200 specimens. Large non-metallic inclusions and lack-of-fusion pores are observed across the rupture surfaces of all specimens, reducing the energy absorption capacity and adversely affecting the fracture mechanism.
The transition to the micro-level is shown in the insert of Figure 4f, where coarse facets display a micro-dimple pattern for their surfaces. Micro-level fracture surface analyses (SEM at 8–15 kx magnification) for all specimens (tensile and impact) are presented in Figure 5. A dimple structure, indicative of ductile fracture, is observed across all annealing conditions and specimen types (tensile and Charpy). Dimple size varies in the range of 0.3–1.0 µm, though occasional wide (up to 5 µm) shallow voids are also noted (indicated by an arrow in Figure 5g). At LNT, dimples are particularly shallow, aligning with the reduced impact toughness at cryogenic temperatures. A distinctive feature of the tensile AsB specimen is the presence of super-fine voids (0.1–0.3 µm in size, marked in Figure 5a). Void nucleation and coalescence at dispersed non-metallic inclusions are observed in all specimens (Figure 5e,f,i), with notably high void nucleation density in A1200 specimens (Figure 5k,l). Thus, fractured surfaces exhibit a dual nature: a brittle pattern at the macroscopic level and ductile characteristics at the microscopic scale, reflecting the complex interplay of fracture mechanisms in LPBF 316L steel.

3.2. Microstructure Observation

The microstructure of as-built 316L steel is shown in Figure 6. The as-printed specimens exhibit a dense structure with porosity not exceeding 2%. In the Z-direction, a characteristic “fish-scale” pattern, typical of LPBF alloys, is observed, consisting of parallel rows of hemispherical melt pools formed during laser scanning. Long epitaxial grains, spanning multiple melt pool rows, are visible, indicated by an arrow in Figure 6a. Melt pools and their interstices comprise clusters of columnar crystals with varying orientations (Figure 6b), displaying either columnar or cellular patterns in cross-section. As shown in Figure 6c, adjacent cell clusters (areas) vary in average cell cross-sectional size as follows: 0.90 ± 0.8 µm (area 1), 0.47 ± 0.3 µm (area 2), 0.76 ± 0.6 µm (area 3), 0.61 ± 0.5 µm (area 4), and 0.81 ± 0.1 µm (area 5); they yield an overall average of 0.71 µm, which is consistent with the data reported in [12,18]. At the melt pool junction, cell size even reaches approximately 2.0 µm (Figure 6d). Cell wall thickness ranges from 0.05 to 0.25 µm, reaching up to 0.60 µm at cell junctions (Figure 6d). EDX analysis indicates that cell walls are enriched in Cr and Mo but depleted in Ni and Fe, consistent with prior studies [63]. The average Cr content in cell walls was measured to be 17.3 ± 0.2 wt.%, 1.07 times higher than in the cell body, while Mo content was 3.9 ± 1.0 wt.%, 1.65 times higher than in the cell body (evidenced by the EDX maps and spectra in Figure 6e,f). Similar Mo(Cr) segregation at boundaries has been reported in rapidly solidified stainless steels and cobalt-based alloys [63,64]. This segregation formation is presumably facilitated to reduce local elastic energy [65] connected with high dislocation density in cell boundaries (1.6 × 10¹⁴ m−2, according to Hong et al. [49]). Furthermore, non-metallic inclusions, ranging from 1.0 to 35.0 µm, are observed throughout the as-built structure.
Annealing at 900 °C significantly altered the 316L steel’s microstructure. While the “melt pool” contours persisted (Figure 7a), the structure became less heterogeneous. SEM images show smoother grain surfaces, with the cellular structure and its relief being absent (Figure 7b). A similar morphology was observed after annealing at 1050 °C (Figure 7c). In optical microscopy (OM) images of A900 and A1050 specimens, grains displayed light or dark contrasts. High-magnification analysis reveals that darker grains owed their contrast to numerous triangular or rhombic etching pits (Figure 7d). Annealing at 1200 °C induced further changes: while the elongated “melt pool” pattern partially remained (left side of Figure 7e), the microstructure attained the characteristic of the FCC structure view, with predominately equiaxed recrystallized and twinned grains (right side of Figure 7e). Etching pits sharply decreased, indicating a more uniform, stabilized microstructure.
Transmission electron microscopy analysis (Figure 8) provides deeper insights into the microstructural evolution. In as-built specimens, the packets of the columnar cells were divided by high-angle grain boundaries, while the cells were separated by dislocation pile-up walls (Figure 8a,b). Within cells, dislocations were also configured into boundaries forming sub-grains (Figure 8c). Spherical non-metallic inclusions within the cell body were a distinctive feature of the AsB specimen observed in as-built TEM images (Figure 8a–c). In A900 specimens, the columnar/cellular structure disappeared (Figure 8d), and the dislocation density decreased significantly, though sub-grains divided by flat dislocation pile-ups still persisted (Figure 8e).
The appearance of numerous nano-sized (20–50 nm) non-metallic precipitates, with pinning dislocations, was observed in the A900 specimen (Figure 8f). In the 1200 °C-annealed specimens, the dislocation density further decreased and dislocation-free grains were noted. Moreover, numerous spherical inclusions (0.02–1.0 µm, average 0.11 ± 0.03 µm; 64% of <0.1 µm) (Figure 8g) were revealed. Many coarse inclusions resided at grain boundaries, suggesting either their interaction with moving boundaries or boundary-related nucleation and coarsening (Figure 8h,i).

3.3. XRD Analysis

The X-ray diffraction (XRD) patterns in Figure 9 reveal the phase composition and structural characteristics of as-built and annealed 316L steel specimens. The XRD data confirm a single-phase austenitic (FCC) structure, evidenced by γFe peaks, namely (111), (200), (220), (311), and (222), across all thermal treatments (Figure 9a). The only exception is weak peaks corresponding to an oxide phase, likely MnSiO3, in the A1200 specimen, indicating detectable oxide formation during high-temperature annealing.
A key observation of the XRD patterns is the peak shift in annealed specimens toward smaller angles relative to the as-built state (Figure 9b), indicating crystal lattice expansion as annealing temperature increases. Lattice parameters, listed in Table 3, increased from 3.597 Å in the as-built specimen to 3.604 Å in A1200. Using MAUD software, structural parameters—coherent scattering region (D) size and lattice micro-strain (ε)—were calculated (Table 3). The as-built specimen showed the smallest crystallite size (1668 Å) and highest micro-strain (2.37 × 10⁻⁴), reflecting a strained microstructure caused by rapid solidification and high cooling rates inherent in the LPBF process. In annealed specimens, D peaked at 5223 Å in A1050, while ε decreased monotonically with temperature, reaching 8.88 × 10⁻⁵ in A1200, indicating a progressively reduced lattice strain and relaxed microstructure. Based on D and ε, the dislocation density (ρXRD) was calculated using the Williamson–Smallman equation [66]:
ρ X R D = 3 k ε D b .
where b is the Burgers vector magnitude (2.58 × 10⁻¹⁰ m), and k is a parameter depending on the elastic properties of the alloy and the dislocation disposition (taken as 1.2 [66]).
Dislocation density calculations showed 1.04 × 10¹³ m−2 in the as-built specimen, gradually decreasing to 2.58 × 10¹² m−2 in A1200 (Table 3), consistent with the reported values for annealed 316L steel [67].

3.4. EBSD Investigation

The EBSD characterization results for the specimens are presented in Figure 10 and summarized in Table 4. The inverse pole figure (IPF) color map of the as-built specimen with respect to the building direction is depicted in Figure 10a. It reveals elongated, arched grains aligned with the melt pool pattern. This microstructure lacks a dominant crystallographic texture but displays significant spatial misorientation between adjacent grains. The grain boundary (GB) map (Figure 10b) shows that high-angle grain boundaries (HAGBs, >10°) dominate, constituting 75.4% of total boundaries. Low-angle grain boundaries (LAGBs) are present within grains, delineating clusters of columnar crystals. The kernel average misorientation (KAM) map (Figure 10c) indicates KAM values ranging from 0° to 4.99°, closely associated with LAGBs.
Specimen A900 retains an IPF pattern characteristic of the AsB specimen (Figure 10d). However, annealing at 1050 °C transformed some grains from a curved to a more equiaxed morphology (Figure 10g). Annealing at 1200 °C further promoted the formation of equiaxed recrystallized grains, with some containing twins (Figure 10j). With an increasing annealing temperature, the average austenite grain size (estimated as equivalent circle diameter) decreased slightly in specimen A900 compared to AsB, before progressively increasing in specimens A1050 and A1200 (Table 4). The HAGB/LAGB ratio followed a similar trend: it decreased at 900 °C, then increased at 1050 °C and 1200 °C. Average KAM values increased from 0.51° (AsB) to 0.54° (A900), then decreased to 0.49° (A1050) and 0.38° (A1200). Notably, specimen A1200 exhibited the zero-KAM grains, indicating their enhanced structural uniformity (Figure 10l).
All studied specimens exhibit diverse grain orientations and lack a distinct crystallographic texture, as shown by the IPF maps (Figure 10) and scattered pole points in the EBSD pole figures (Figure 11). The maximum projection pole density values, ranging from 2.47 to 3.38, are consistent across specimens, indicating that annealing did not promote specific crystallographic texture formation [68].

3.5. Non-Metallic Inclusion Characterization

Non-metallic inclusions in LPBF 316L steel were analyzed using optical microscopy, SEM, and TEM. Optical microscopy on non-etched surfaces identified coarse inclusions formed during the LPBF process (Figure 12a). Their size varied significantly, reaching up to 45 μm, with the majority (70%) not exceeding 1 μm (Figure 12b). Coarse inclusions were predominantly globular, while non-equiaxed angular particles were also observed (the latter type included spheroidal ones that fractured due to high thermal stresses during melt pool solidification—Figure 12a, lower-left and upper-right corners). Most inclusions (70%) were ≤1.0 μm (Figure 12b), making their size measurement challenging. The remaining inclusions were distributed as follows: 2–10 μm (12%), 1–20 μm (10%), 20–30 μm (4.5%), and 3–40 μm (3.5%).
SEM and TEM analyses at magnifications up to 100,000× provided statistical data on the effect of the post-processing heat treatment regime on size and area distribution of fine inclusions (Figure 12c, Table 5). In the as-printed state, fine inclusions occupied 0.43 vol.% of the specimen volume (area density of 1.08 pcs/μm2), with a maximum size of 0.50 μm and an average diameter of 0.071 ± 0.01 μm; the particle size distribution peaked at 0.10 μm (37.5%). Annealing at 900 °C maintained a similar area fraction (within statistical error) but significantly increased inclusion density to 13.1 pcs/μm2 and reduced oxide particle size, with 71% of inclusions being smaller than 0.05 μm (compared to 44% in the as-printed specimen). Annealing at 1200 °C doubled the area fraction to 1.14%, reduced the inclusion density to 0.55 pcs/μm2 (half that of the as-printed state), and led to particle coarsening (up to 0.99 μm maximum). The proportion of inclusions smaller than 0.05 μm decreased to 33%, while those larger than 0.25 μm increased to 10% (compared to 2.1% for the as-printed specimen and 0.7% for the 900 °C-annealed specimen).
The chemical compositions of coarse inclusions in the as-printed specimen were studied using SEM/EDX. The coarse particles (shown in Figure 13a) had a heterogeneous structure, typical for coarse inclusions in LPBF 316L, featuring the embedded spherical areas shown by arrows in Figure 13d (a comparable morphology is presented in Figure 12a). According to the EDX maps (Figure 13d), these particles were enriched with O, Si, Al, and Mn, slightly depleted in Cr, and highly depleted in Fe and Ni (relative to the matrix). The inclusion primarily contained O (47 wt.%) and Si (18 wt.%), with lower amounts of Mn, Cr, Al, and Fe (EDX spectrum 26 in Figure 13b; Table A1). The embedded roundish areas are distinctly visible in the back-scattered electron image (BSEI) due to bright contrast, suggesting enrichment with heavier elements such as Fe (60–62 wt.%), Cr, and Ni (both 14–15 wt.%), and less than 1.0 wt.% Mo (EDX spectrum 27 in Figure 13c). Based on the composition, these bright regions are likely micro-droplets of the matrix phase (austenite), splashed from the melt pool and trapped within the non-metallic inclusion.
TEM/EDX analysis revealed that all fine inclusions contained Si, Mn, Al, Cr, Ni, Mo, Fe, and O (Table A1, Appendix A). Notably, their measured elemental composition varied with the inclusion size: as the inclusion size increased, the contents of O, Si, Mn, and Al increased, while those of Cr, Ni, Fe, and Mo decreased. For instance, in as-printed samples, fine inclusions of 0.14–0.20 μm contained 32.6–41.7 wt.% Fe, 12.3–14.4 wt.% Cr, 5.3–6.4 wt.% Ni, 17.5–22.4 wt.% O, and ~12 wt.% Si. In slightly larger inclusions (0.22–0.35 μm), Fe decreased to ≤15.2 wt.%, and Ni and Mo were minimal or absent, while O and Si increased to 35.5–44.6 wt.% and 26.4–33.4 wt.%, respectively. A similar trend was observed in annealed specimens: smaller inclusions (<0.1 μm) had the highest contents of Fe, Cr, Ni, and Mo and the lowest contents of O, Si, Mn, and Al. As particle size increased to 0.19 μm (900 °C) and 0.37–0.41 μm (1200 °C), and Fe, Ni, and Mo were undetectable, while O, Mn, and Al reached maximum values (36–42 wt.%, 20–24 wt.%, and 10–14 wt.%, respectively). Most likely, this size dependency was due to the high pickup of Fe, Cr, Ni, and Mo from the surrounding matrix, which skewed the EDX results. As particle size increased, the EDX response from the matrix decreased, and the particle’s chemical composition approached its true value [69].
The elemental compositions of oxide particles in the A1200 specimen could not be solely attributed to particle size or matrix effects. Inclusions smaller than 0.3 μm exhibited significant variations in molybdenum content, as revealed via elemental distribution analysis. Figure 14a,b compare the EDX maps of two fine inclusions with different Mo contents (0.12 μm, 1.8 wt.% Mo and 0.11 μm, 13.7 wt.% Mo, respectively), highlighting increased molybdenum presence in the particles shown in Figure 14b. The inclusion in Figure 14b is chemically heterogeneous, comprising two distinct zones: zone 1, enriched in Si and O, and zone 2, enriched in Mo, Al, Mn, and Cr but depleted in Si. Linear EDX analysis (Figure 14c) confirmed the non-uniform elemental distribution within the inclusion. According to the elemental profile, Mo content in zone 2 is significantly higher than the average content of Mo in the particle, as determined via point EDX analysis. The presence of Mo-enriched particles in the A1200 specimen suggests that annealing induced transformations in the oxide-containing inclusions leading to the in situ formation of Mo-based oxide.
As revealed by the EDX analysis, the inclusions are primarily (Si, Mn, O)-rich compounds, likely based on manganese silicate MnSiO3 (rhodonite), consistent with the XRD pattern (Figure 9a) and prior LPBF 316L studies [70]. Essentially, they are a modification of this compound, alloyed with aluminum and chromium, i.e., (MnCrSiAl)O3. Figure 15a presents a high-resolution TEM image of a 0.11 μm oxide inclusion in the A1200 specimen. The selected area electron diffraction (SAED) pattern (Figure 15a) confirmed its silicate nature [71]. Fast Fourier transform (FFT) analysis of the inclusion–matrix interface (Figure 15b,c) revealed a d-spacing of 0.252 nm, corresponding to the (310) plane of the MnSiO3 phase (PDF #13-138). The surrounding austenite matrix exhibited a d-spacing of 0.206 nm, matching the (111) plane, confirming its austenitic structure.

3.6. Corrosion Resistance Evaluation

Figure 16 illustrates the Nyquist and potentiodynamic polarization curves for steel specimens annealed at different temperatures. As shown in Figure 16a, the Nyquist loop diameter dramatically decreases after annealing at 900 °C, followed by a slight increase at 1050 °C, and then a further reduction to its minimum at 1200 °C. Overall, annealing substantially impairs the surface impedance of the steel. For quantitative analysis, the equivalent circuit R(QR)(QR) was employed to fit each EIS curve, assuming the passivation of the steel (Figure 16c). The fitting results are presented in Table 6, where |Z|0.01 denotes the impedance modulus at 0.01 Hz, Rf denotes the resistance of the passive film, Qf and nf denote the capacitance and diffusion index of the passive film, Qdl and ndl denote the capacitance and diffusion index of the electric double layer, and Rct denotes the charge transfer resistance. The results reveal a significant reduction in Rf with annealing at the tested temperatures, indicating that high-temperature annealing compromises the protective capability of the passive film. Among the annealing temperatures, 1050 °C exhibits the least detrimental effect. As annealing temperature increases, Rct consistently decreases, suggesting an increased reaction rate. Consequently, the impedance modulus drops markedly at 900 °C and 1050 °C, with a further decline at 1200 °C, indicating the greatest reduction in corrosion resistance at 1200 °C. The decrease in Rct is less pronounced than that of Rf, suggesting that the adverse effect of annealing on corrosion resistance primarily stems from the reduced resistance of the passive film.
As shown in Figure 16b, the PDP curve of the as-built specimen exhibits clear passivation behavior between −0.07 V and −0.19 V, marked by a distinct shift in trend beyond −0.07 V, whereas the annealed specimen displays less pronounced passivation. The current density between −0.07 V and −0.19 V slightly increases for specimens annealed at 900 °C and 1050 °C, and significantly increases for those annealed at 1200 °C. These variations in current density for annealed samples align with the changes observed in Rf relative to the as-built sample. Additionally, corrosion potentials (Ecorr) and corrosion current densities (Icorr) are determined through Tafel fitting, as presented in Table 7.
The corrosion potential shows minor changes for specimens annealed at 900 °C and 1050 °C but drops sharply at 1200 °C. Correspondingly, the corrosion current density increases significantly at 900 °C and 1050 °C, with a further substantial increase at 1200 °C. Notably, the Icorr at 1050 °C is the lowest among all the annealing temperatures tested. This trend in corrosion potential and current density corresponds closely with the impedance modulus variations reported in Table 6. Generally, the corrosion testing conducted consistently demonstrates a reduced corrosion resistance for the annealed LPBF 316L steel compared to its as-built condition.

4. Discussion

4.1. Annealing-Induced Microstructure–Property Correlations

The conventional metallurgical route for producing wrought 316L steel involves mandatory high-temperature solution annealing at 1050–1100 °C for dissolving Mo-rich intermetallic phases (e.g., σ- and χ-phases) and transforming the interdendritic δ-ferrite network into spheroidal δ-ferrite [72], thereby improving formability and enhancing the mechanical properties and corrosion resistance [73]. When 316L steel is manufactured via the LPBF method, the benefit of applying heat treatment is less evident, as it leads to diverse results regarding various key properties. The alteration of properties results from the complex interplay of structural transformations occurring in the LPBF 316L steel during high-temperature annealing. The primary reason for the different effects of heat treatment on the properties of wrought and LPBF 316L steel is the type of initial (pre-heat treatment) microstructure.
As-built LPBF 316L is characterized by a fine cellular microstructure with increased dislocation density, which provides superior strength (1.9 times higher YTS and 17% higher UTS) with a moderately reduced ductility (10–28% reduction) and a significantly lower impact toughness (half that of wrought steel) compared to its wrought counterpart [74,75]. The strength–ductility balance, measured as the product of strength and elongation (PSE), is 38.1 GPa% for as-built samples.
Annealing at 900–1050 °C reduced YTS by 30% while maintaining UTS close to the as-built condition. Despite this reduction, YTS remained higher than that of wrought steel. Annealing at 1200 °C increased YTS compared to 900–1050 °C and UTS relative to the as-built state. Notably, annealing at 900 °C significantly enhanced total elongation, achieving the highest PSE value (44.3 GPa%) among the tested conditions. At higher annealing temperatures, especially 1200 °C, ductility and PSE were reduced. A similar trend was observed in impact toughness, which peaked at 900 °C (for both RT and LNT), but dropped sharply after 1200 °C annealing. Annealing at 1050 °C, typical for wrought steel, notably degraded LPBF steel properties compared to the as-built state (except for impact toughness at LNT), recording the lowest PSE (31.6 GPa%) among tested specimens.
The aforementioned changes are attributed to the annealing-driven transition of the as-built microstructure into a thermodynamically stable one. This statement can be confirmed by evaluating the steel’s strength changes caused by structural transformations. The enhanced strength of as-built LPBF 316L steel is primarily attributed to its fine cells and high dislocation density (the contribution of the latter is usually estimated via the Taylor equation [76]). However, dislocations are predominantly concentrated at cell boundaries impeding gliding dislocations [49], while the cell interiors remain nearly defect-free. Consequently, the conventional Taylor equation is unsuitable for evaluating the dislocation strengthening of LPBF alloys. Instead, the Hall–Petch law, expressed as a function of LPBF cell size (Lc, μm), is more appropriate [76,77]:
Δ σ L P B F = 253.66 L C ( MPa ) .
According to (4), in the as-built specimen with an average cell size of 0.71 μm, the dislocation structure (cell boundaries) contributes 301 MPa to the overall strength.
Furthermore, Mo/Cr segregations at cell boundaries enhance strength (Δσsegr) by inducing local lattice strain (εS) around impurity atoms [78], as follows:
Δ σ s e g r = G ε S 3 / 2 Δ c 760 ( MPa ) ,
where G is the shear modulus (80 GPa [79]), and εS is defined as follows:
ε S = ε G β ε a .
In Equation (6), the term εa denotes the strain arising from the micro-scale lattice parameter mismatch (Δa) and is calculated as εa = Δa/(aΔc). The parameter β is an empirical constant, and ε G is the strain due to the mismatch in the shear modulus (ΔG):
ε G = ε G + 0.5 ε G ,
where εG = ΔG/(GΔc).
A previous study on an LPBF Co-28Cr-6Mo alloy [65] showed that in the Co-FCC phase, local Mo/Cr segregations (1.7 wt.% each) enhanced strength by ~150 MPa. Given the similar cell boundary enrichment in as-built LPBF 316L steel (1.6 wt.% Mo, 1.2 wt.% Cr) and comparable shear modulus values for Co and Fe [80], a similar strength increase (Δσsegr ≈ 150 MPa) is assumed for LPBF 316L steel.
Annealing at 900 °C eliminates the cellular structure and reduces dislocation density (Table 3), consistent with previously reported data [81]. Consequently, the cellular structure’s contribution (ΔσLPBF) should be replaced by a conventional Hall–Petch relationship, accounting for grain boundary effects:
Δ σ G B = k d ( MPa ) ,
where d is grain size (μm) and k is the Hall–Petch constant taken as 500 MPa·μm−1/2 [82].
In the A900 specimen, EBSD data revealed a grain size of 18.8 μm, yielding a ΔσGB of 124 MPa, which is 2.4 times lower than that of ΔσLPBF. Furthermore, cellular structure degradation at 900 °C was accompanied by the diffusion-induced annihilation of Cr/Mo-segregation (according to [76], Mo and Cr diffuse from cell boundaries into sub-grains at temperatures above 800 °C). Accordingly, the concentration-related grain mismatch (Δσsegr) was eliminated, decreasing yield strength. The equalizing of Mo and Cr increased their average grain concentration, potentially resulting in increased lattice parameters due to larger atomic sizes compared to Fe [83]. This was confirmed by shifting the XRD peak to lower angles in annealed specimens (relative to as-built, Figure 9b).
Alongside processes reducing strength, annealing also promoted steel strengthening through the precipitation of dispersed oxides from austenite. This strengthening effect can be quantified using the following expression [84]:
Δ σ p c p t = 0.538 G b V f d p c p t ln d p c p t 2 b ( MPa ) ,
where b is the magnitude of the Burgers vector, Vf is the volume fraction of precipitates, and dpcpt is the precipitate mean size.
The volume fractions of oxide inclusions in this study (0.43–1.14%) comply with prior findings of [23,85]. Using parameters from Table 5, Δσpcpt was calculated to be 46 MPa for the as-built state and 75–96 MPa for annealed specimens.
Table 8 summarizes the contributions of various strengthening mechanisms in LPBF 316L steel. The lattice friction stress (Peierls–Nabarro stress, ΔσP-N) for austenitic 316L stainless steel is 16 MPa [86]. Dislocation strengthening was determined using the Taylor equation [76]:
Δ σ d i s l = 0.25 M b G ρ d i s l ( MPa ) ,
where ρdiscl is the dislocation density (Table 3), and M is the Taylor orientation factor (M = 3).
Solute strengthening was calculated based on [87]:
Δ σ s s = i k i c i ( MPa ) ,
where ki is the strength effect factor of each individual element, and ci is the content of the element. Element concentration values were taken from Table 1, and the following ki values (in MPa/wt.%) were used as per FCC: kC = 354, kSi = 8.7, kMn = 1.5, kCr = 1.0, kNi = 5.0, kMo= 19.4, and kP = 6.3 [86,88,89].
According to [82], twinning stress depends primarily on grain size and orientation. Thus, the strengthening contribution from deformation twinning (Δσtw) is assumed to be equal to ΔσGB, as per [82]. This mechanism is considered only for A1200 samples, where twins are observed in the microstructure (Figure 7f).
As per Table 8, the calculated yield tensile strength (YTScalc) for as-built 316L steel exceeds the experimental (YTSexp) value by 68.3 MPa (12% discrepancy), likely due to overestimating solute strengthening (Equation (11)). The contribution of Mo and Cr to solute strengthening (Δσss) should be reduced in proportion to the depletion of these elements within cell interiors. Overall, the cellular structure and elemental segregation at cell walls are critical to the yield strength of as-built 316L steel, accounting for ~70% of its total value. In contrast, calculated and experimental YTS for specimens annealed at 900 °C and 1200 °C show close agreement (4.8–7.4% error), validating the above speculations regarding their structural evolution under annealing.
Annealing at 900 °C sharply reduced YTS, as dispersed nano-oxide precipitations (75.4 MPa, 20.7% of YTScalc) failed to compensate for the loss of ΔσLPBF and Δσsegr following cellular structure annihilation and segregation elimination. Conversely, annealing at 1200 °C increased YTS, primarily due to enhanced oxide precipitation (volume fraction reaching 1.14%), which counteracted particle coarsening and boosted Δσpcpt to 95.6 MPa (21% of YTScalc). Deformation twinning further enhanced strength in 1200 °C-annealed steel by 100 MPa. Additionally, a higher proportion of high-angle grain boundaries in equiaxed, fully recrystallized grains (Figure 7f) potentially impeded the dislocation motion due to high grain misorientation, as reported in [90,91].
The loss of the cellular structure at 900 °C enhanced ductility by improving gliding dislocation mobility, despite nano-oxide precipitation interacting with dislocations via the Orowan mechanism (Figure 8e,f). However, higher annealing temperatures reduced ductility due to the increased oxide volume fraction and their coarsening, governed by Ostwald ripening [92] as described by the Lifshitz–Slyozov–Wagner theory [59]:
d 3 d 0 3 = k r c t ,
where d0 and d are the mean particle size before and after coarsening, krc is the rate constant of coarsening, and t is the holding duration.
The value of krc is directly proportional to the diffusion coefficient of solute atoms and inversely proportional to temperature [59]. As a result, increasing the annealing temperature promoted oxide particle coarsening, reducing their area density [93]. Oxide coarsening facilitated the fracture of LPBF 316L steel by promoting void formation (Figure 5k,l).
The impact toughness of LPBF 316L steel at room temperature was approximately half that of wrought 316L steel [74,75]. The reduced impact toughness of as-built LPBF steel was attributed to its increased strength, the presence of porosity, and oxide inclusions [47,59]. The presence of pores and oxide inclusions hindered significant improvement in impact toughness through annealing at 900 °C, despite a notable increase in ductility following this treatment. Increasing the annealing temperature to 1050–1200 °C further reduced RT impact toughness due to enhanced oxide precipitation and particle coarsening. The oxide particles similarly affected cryogenic impact toughness, decreasing KCVLNT from 68 J/cm2 at 900 °C to 47 J/cm2 at 1200 °C, consistent with the findings of Wang et al. [54]. Accordingly, KCVLNT was nearly 50% of KCVRT, consistent with the characteristics of wrought 316L steel, suggesting that there was no brittle fracture threshold [60].

4.2. Oxide Precipitation and Corrosion Resistance

The results showed that the corrosion resistance of as-built 316L stainless steel was significantly decreased by annealing at 900–1200 °C, with the most pronounced effects observed at 900 °C and 1200 °C, as evidenced in Figure 16 and Table 6 and Table 7. While annealing effectively reduced dislocations and residual stresses, it promoted the precipitation of oxides (Figure 8d–f), increasing the risk of localized galvanic corrosion. Typically, stainless steels undergo sensitization between 600 °C and 850 °C due to chromium depletion at grain boundaries caused by Cr23C6 carbide formation [94]. Annealing at 900 °C, near this sensitization range, could foster chromium depletion at grain boundaries. However, in this study, no chromium carbides were detected, likely due to the steel’s low carbon content (0.022 wt%). Instead, non-metallic inclusions containing up to 20 wt.% Cr precipitated, reducing the chromium content in the solution. This compromised the passive film’s integrity, leading to localized corrosion, as confirmed by a significant decrease in protective film resistance (Rf) (Table 6). At 1050 °C, enhanced chromium diffusivity presumably mitigated its local depletion through redistribution, reducing passive film damage compared to at 900 °C. Consequently, samples annealed at 1050 °C exhibited a slight increase in Rf and corrosion potential, alongside a modest decrease in corrosion current density. However, at 1200 °C, Cr-containing oxides coarsened significantly, particularly at grain boundaries (Figure 8g,h), and Mo-rich phases formed, depleting the matrix of molybdenum. These changes severely undermined the passive film’s integrity and induced a strong galvanic effect between large precipitates and the matrix. As a result, annealing at 1200 °C led to a sharp decrease in Rf and Ecorr, coupled with a substantial increase in Icorr (Table 6 and Table 7).
The obtained results indicate that the formation of non-metallic phases significantly affects the comprehensive properties of LPBF 316L steel. Oxide precipitation in LPBF alloys results from oxygen contamination, driven by the oxidation of hot spatter and the reworking of pre-existing oxides [95]. The present study addressed the type and chemical composition of non-metallic inclusions in LPBF 316L steel, a topic of continued debate [29,38,78,96]. Saeidi et al. [97] found SiO2 inclusions; Kong et al. [29] detected the (O, Al, Si)-rich phase, with minor amounts of Ti and Mn; and the presence of (O, Si, Cr)-rich inclusions was reported in [30,39]. Separate to these findings, the formation of (Mn, Si, O)-rich inclusions in LPBF 316L steel was frequently documented in [23,38,40,78,98,99]. These inclusions were further identified by Yan et al. [71] as a manganese silicate MnSiO3. The presence of inclusions with a MnSiO3-based lattice as the primary non-metallic phase in LPBF 316L steel was also confirmed by our investigation. However, in contrast to previous studies, we identified significant Cr content (up to 20 wt.%) and Al (up to 14 wt.%) in manganese silicate, allowing it to be represented as (MnCrSiAl)O3. The binding of a significant portion of chromium by inclusions likely deteriorated the corrosion resistance of the annealed samples.
The other finding of this study is the transformation of oxides during high-temperature annealing. Similar transitions in LPBF 316L under high-temperature annealing have been observed in prior research: (Mn,O,Si)-based oxide → (Mn,Cr,O)-rich phase [33], (Mn,O,Si)-based oxide → Cr2O3, Cr-Mn-O-rich and oxygen-free Cr-Mn inclusions [23], and heterogeneous MnO-SiO2-Cr2O3 particles → christobalite (SiO2) [31]. In our study, the transition of (MnCrSiAl)O3 into Mo-rich complex oxide was observed, occurring at 1200 °C. As shown in Figure 14b, this transformation enriched inclusions with molybdenum and aluminum while simultaneously depleting chromium and silicon, resulting in duplex inclusion with distinct chemical compositions within the particle. This finding is supported by reference [31], which discusses the formation of Mo-rich oxides, such as MoO3, in LPBF 316L steel.
From a practical perspective, the obtained results show that high-temperature annealing does not lead to an overall improvement in the mechanical and corrosion properties of LPBF 316L stainless steel, in contrast to its wrought counterpart. Steel in its as-built state has advantages in most parameters, making annealing impractical. High-temperature annealing can improve a particular property while potentially compromising other performance characteristics. Solution treatment at 900 °C may be applied to enhance ductility and, to some extent, impact toughness if strength and hardness are not critical factors. Annealing at 1200 °C may potentially increase ultimate strength and hardness due to oxide precipitation when corrosion resistance is of lesser importance. Given that low-temperature annealing is known to help reduce residual stresses in as-printed components, further research should determine the upper rational limit of the annealing temperature for 316L steel that prevents substantial structural alterations detrimental to its primary functional characteristics.

5. Conclusions

This study evaluated the impact of high-temperature post-processing annealing (at 900–1200 °C) on the microstructure–property relationship in relation to the mechanical properties (via tensile testing, nanoindentation, and impact loading) and corrosion resistance of laser powder bed fusion (LPBF)-manufactured 316L stainless steel. The following conclusions were drawn:
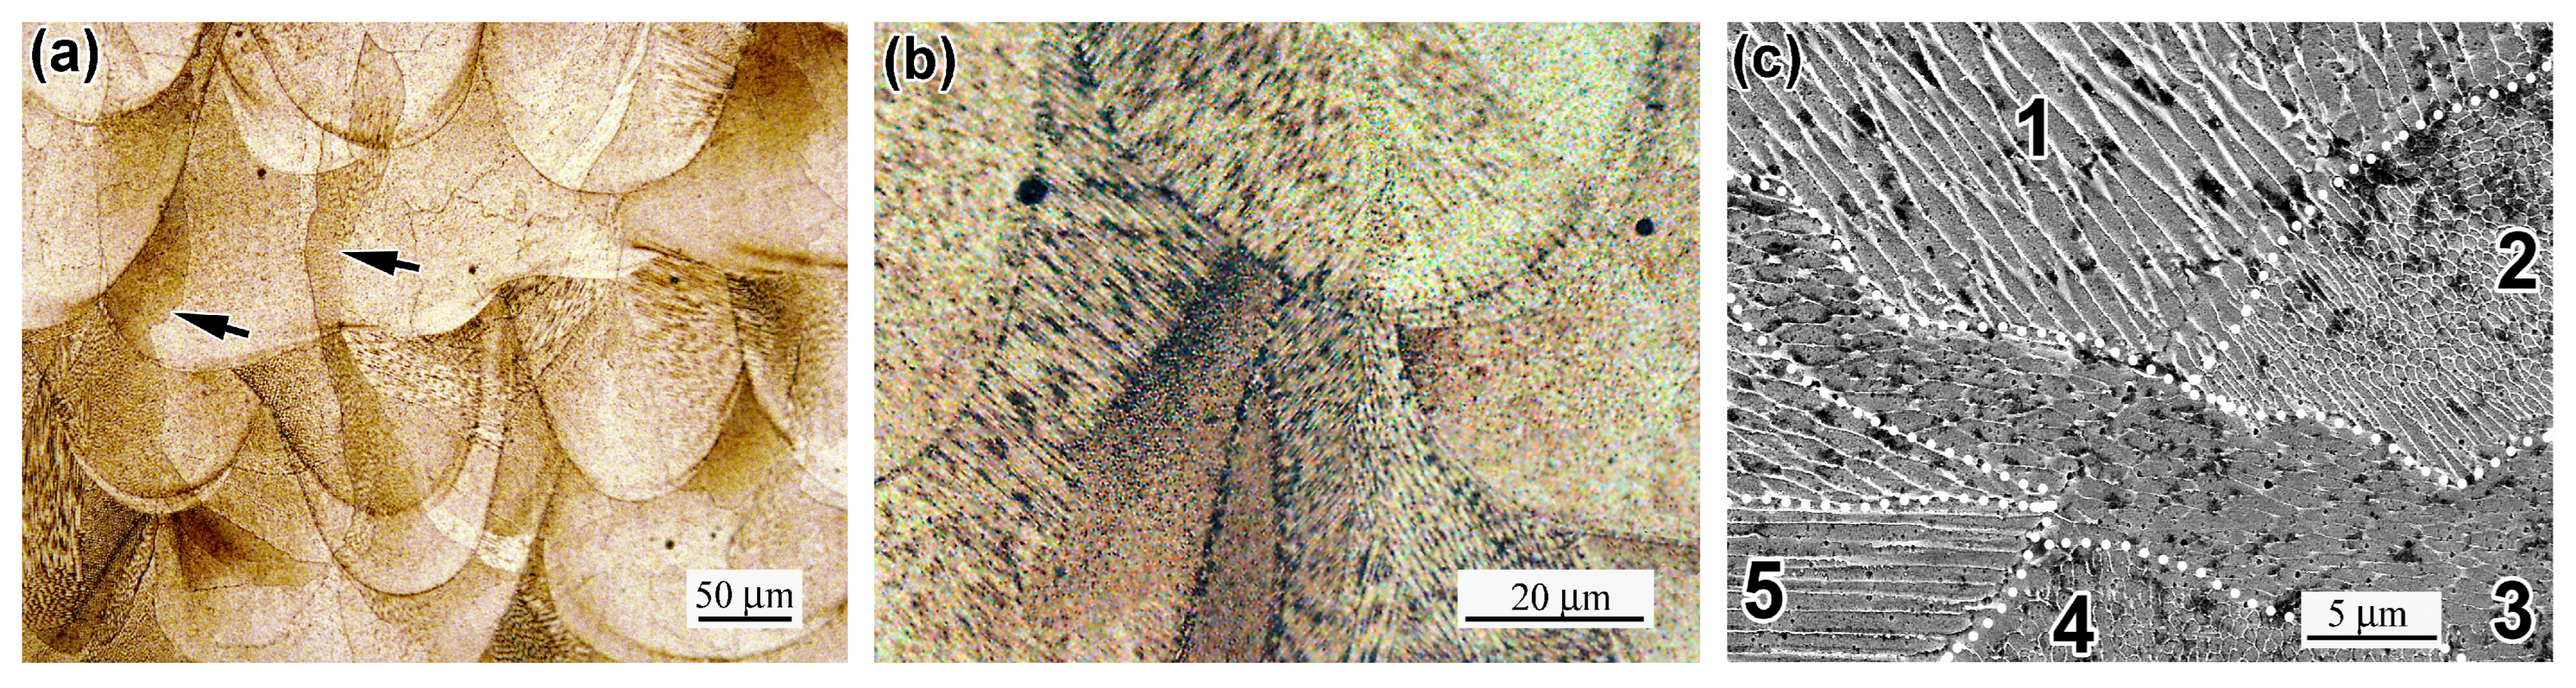
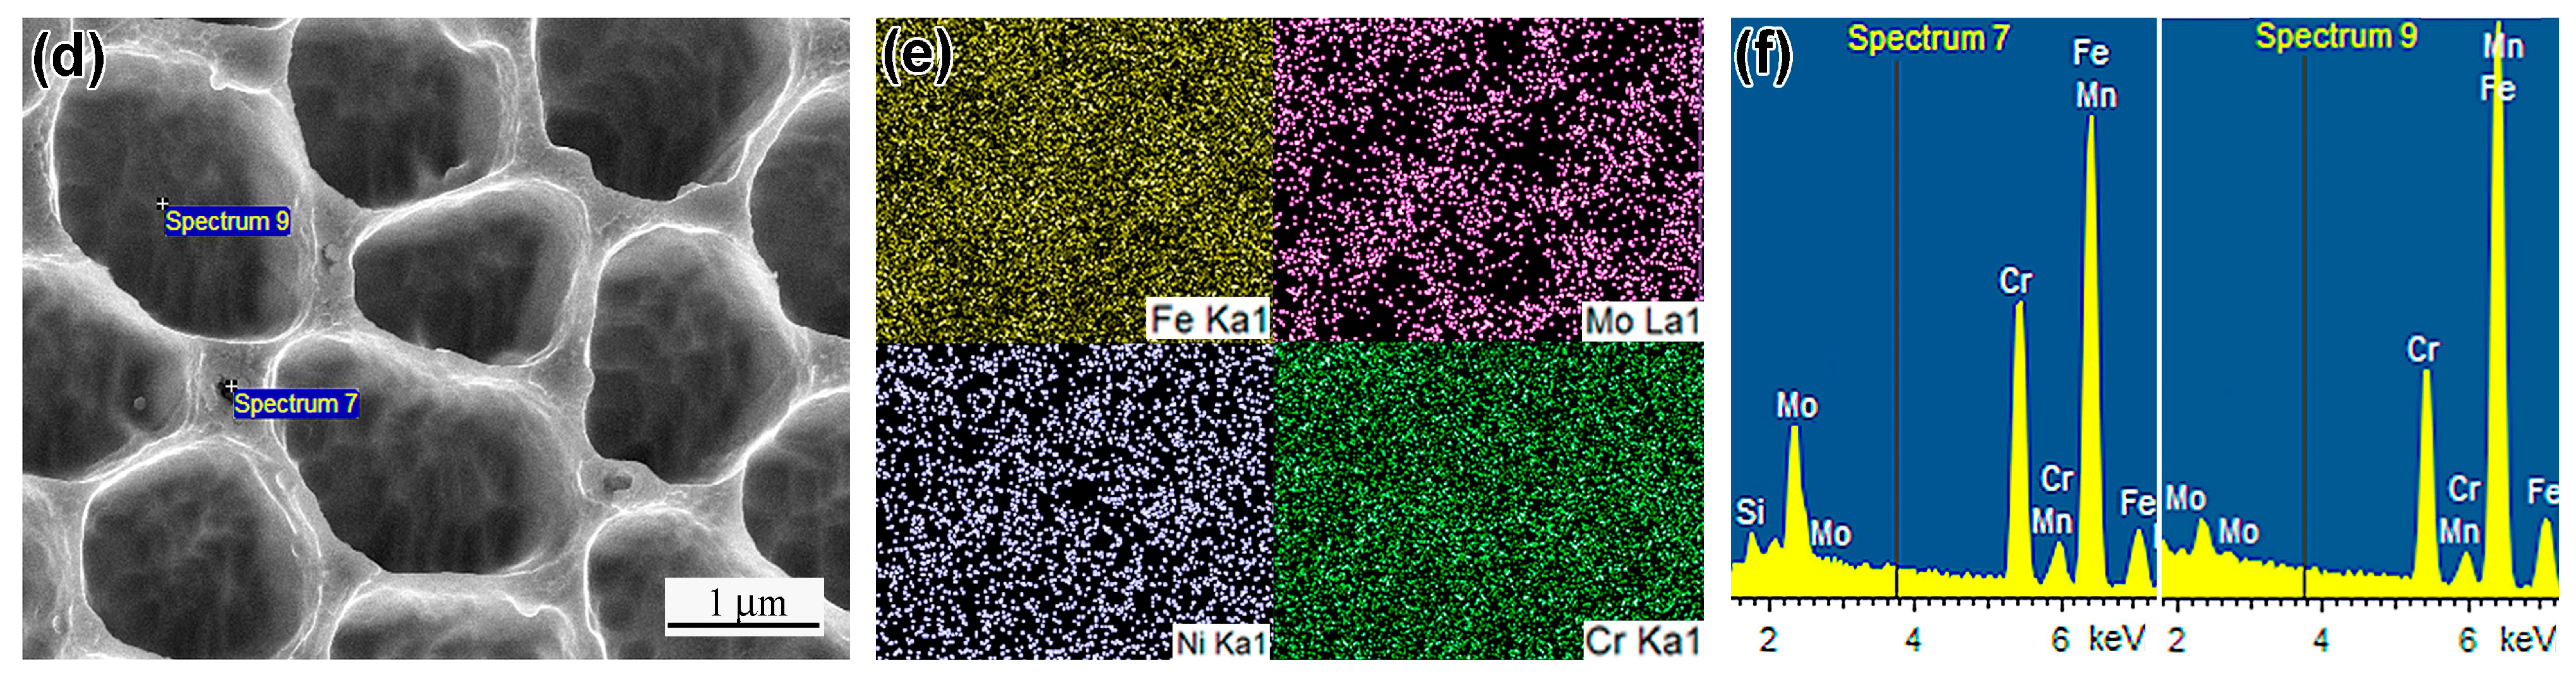
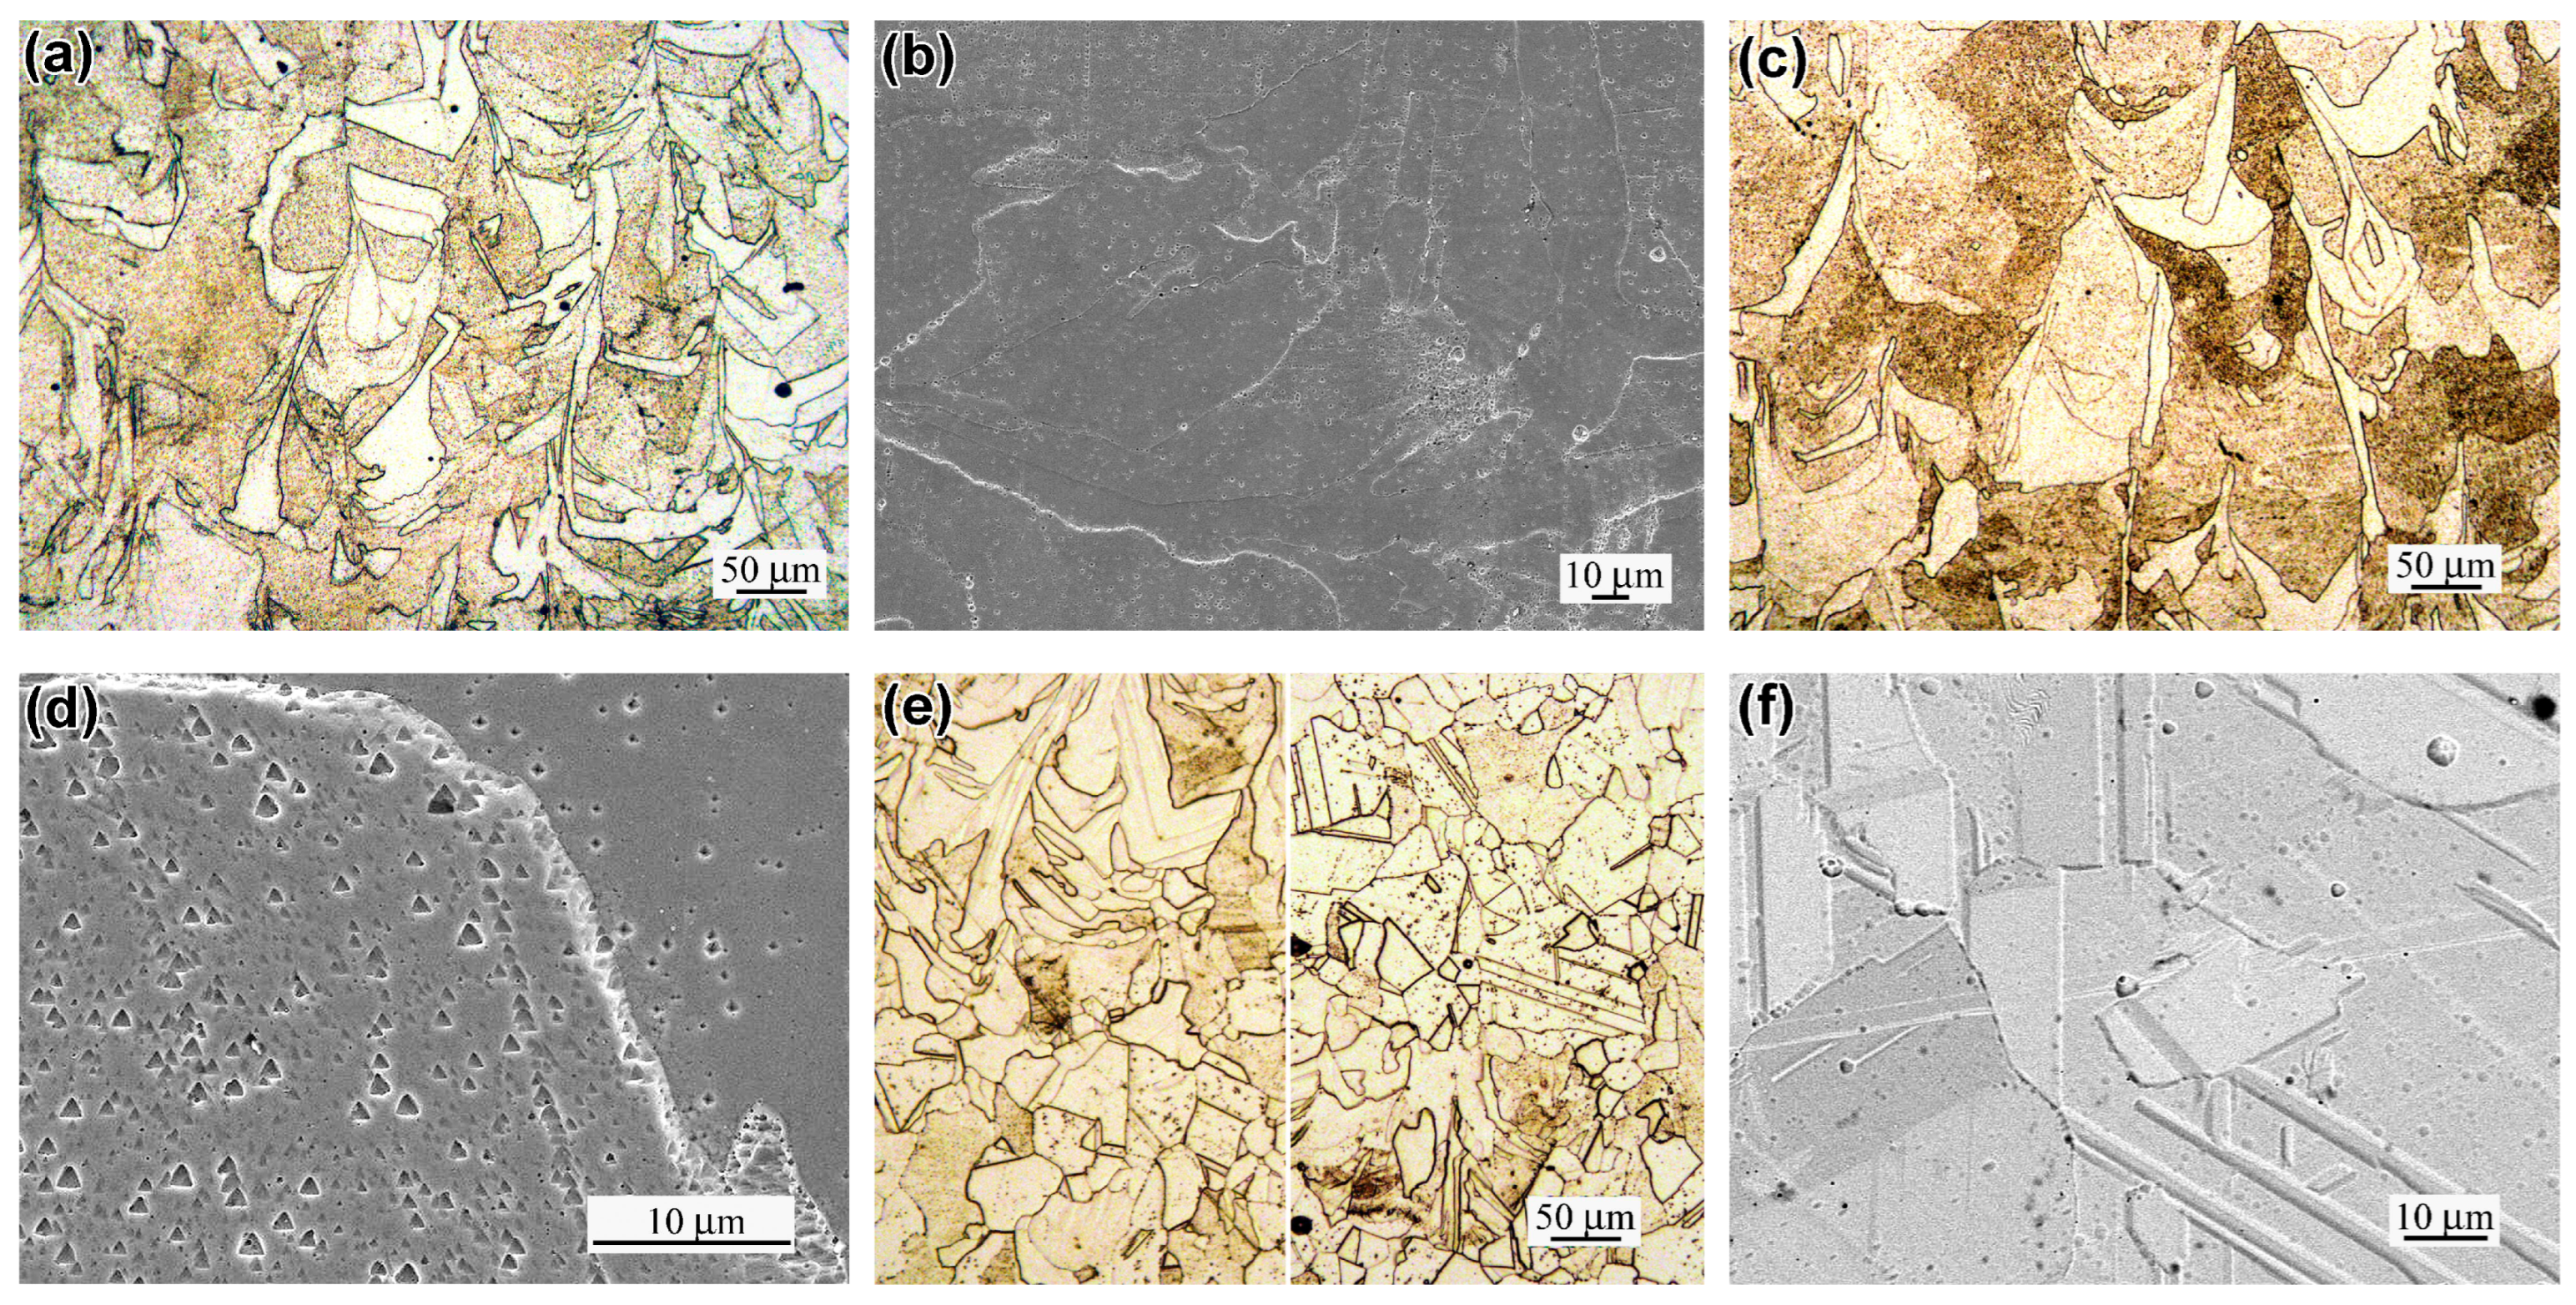
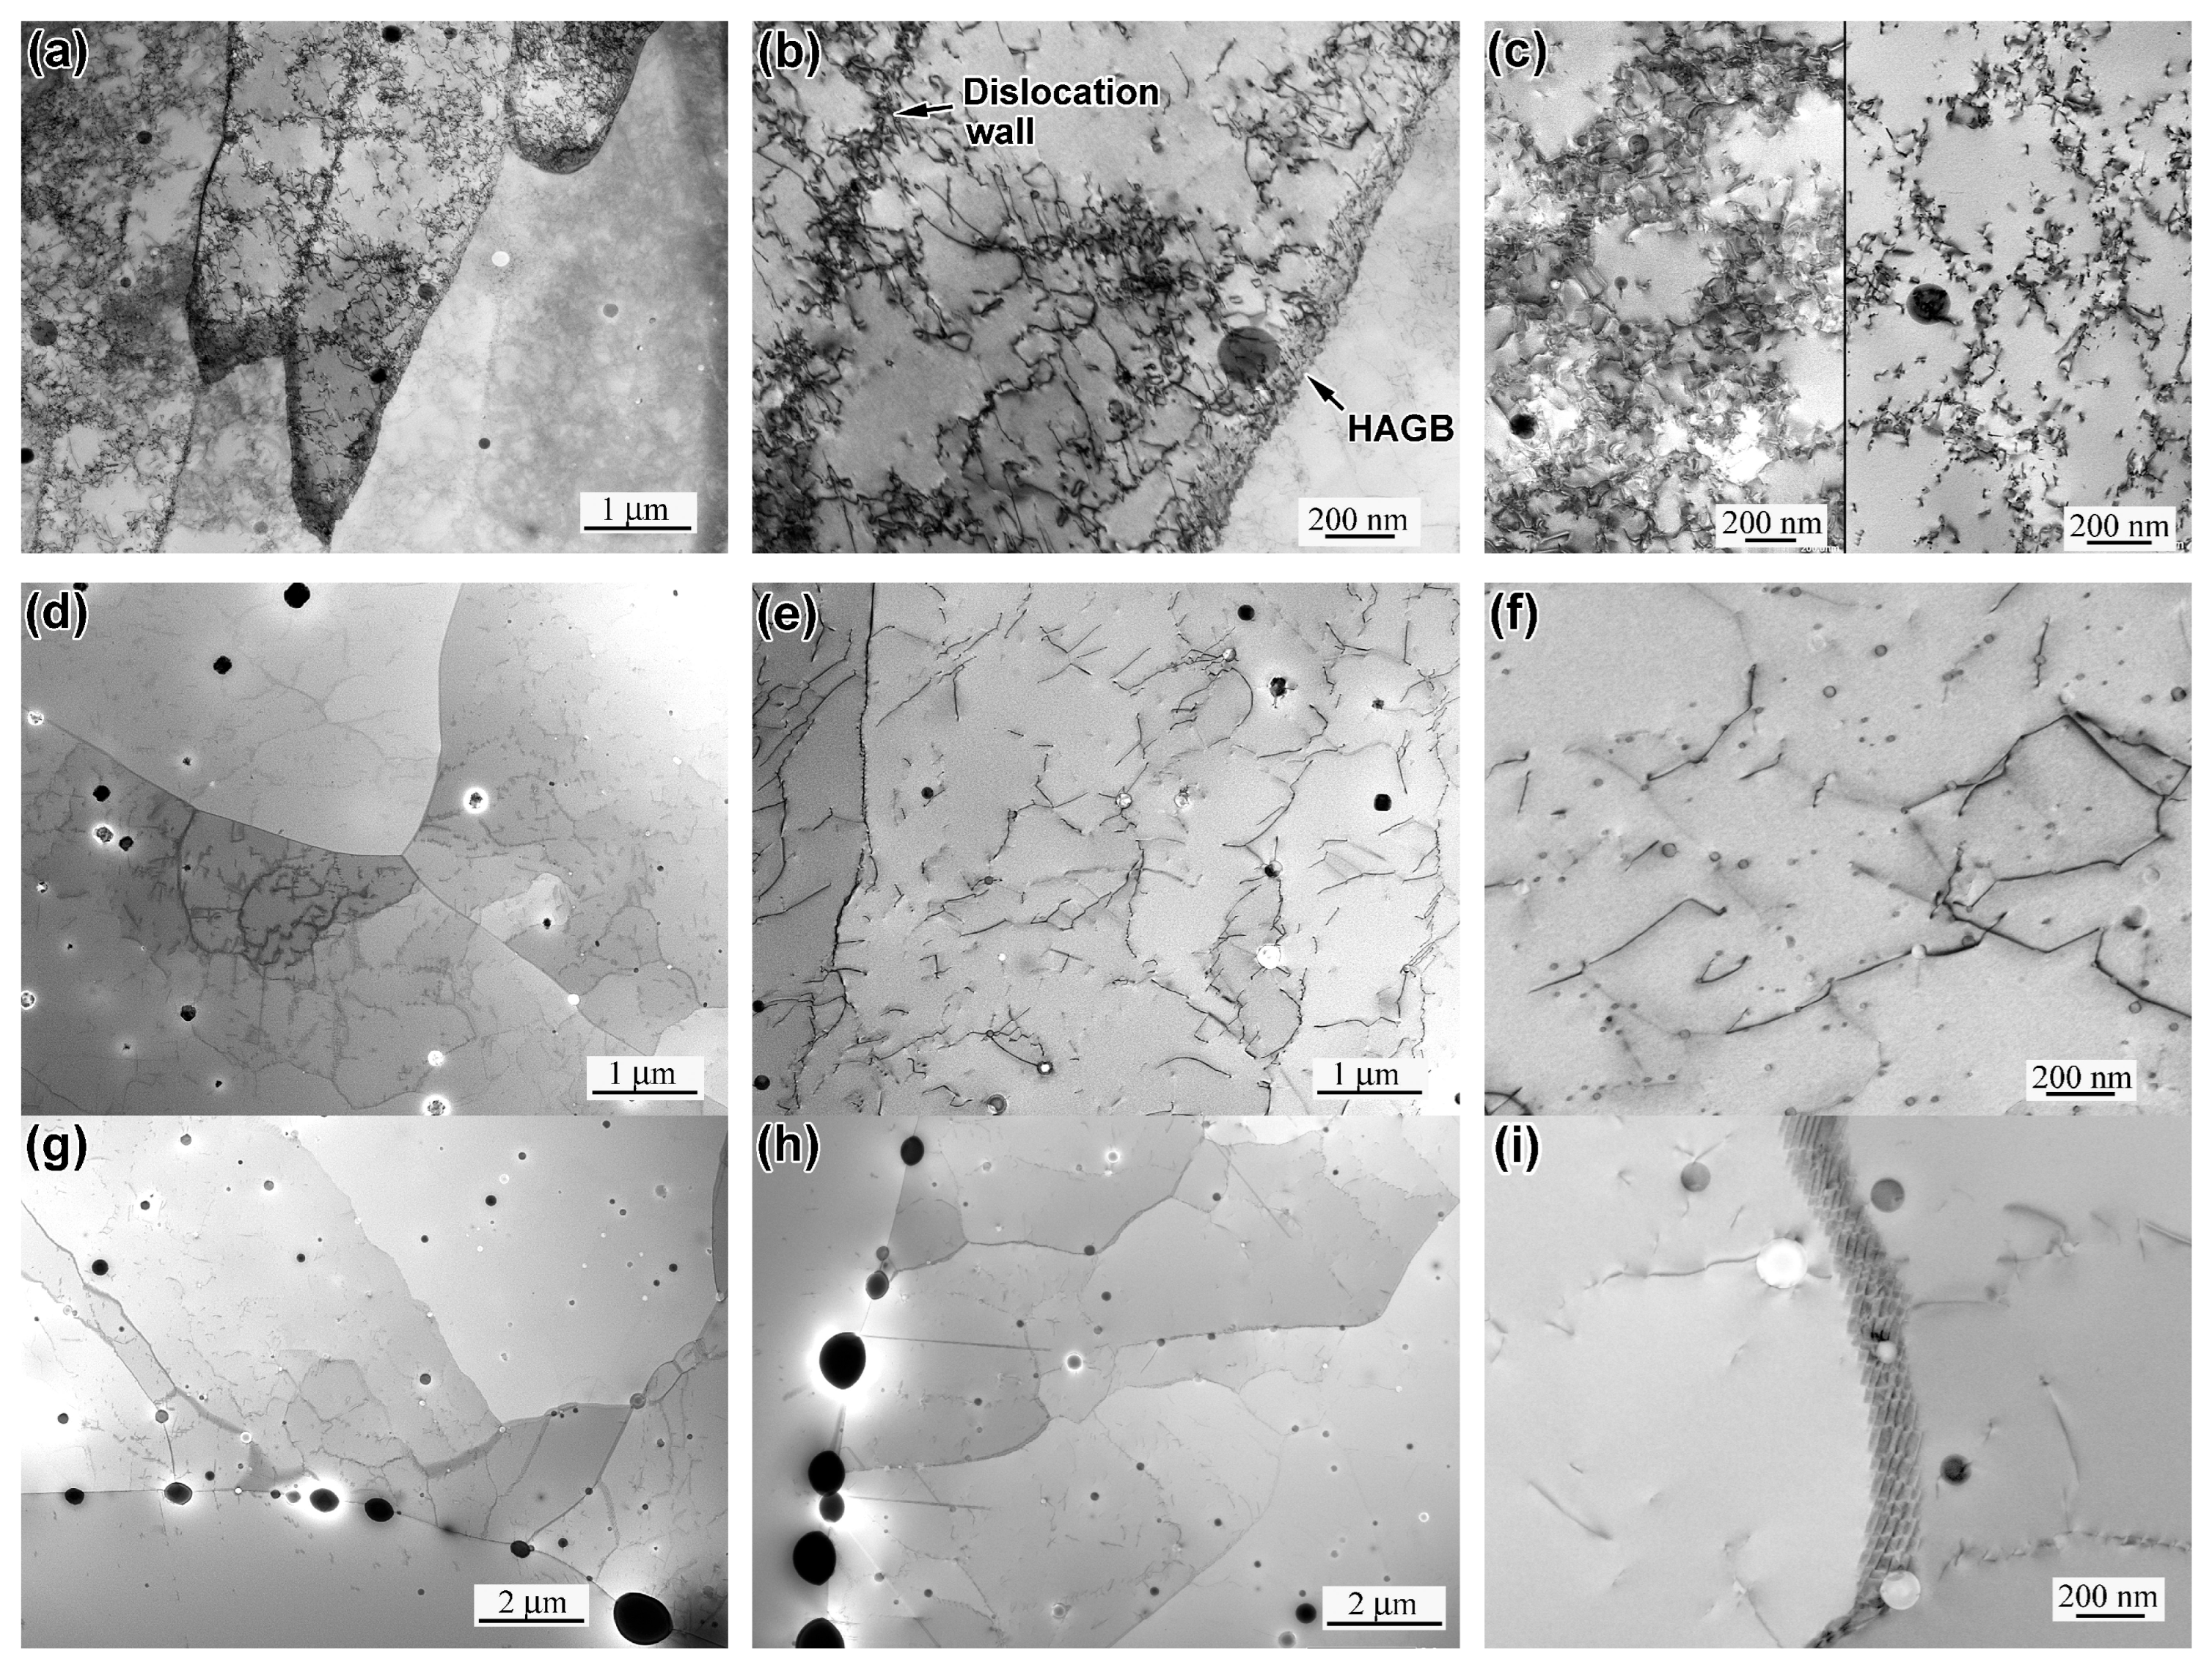
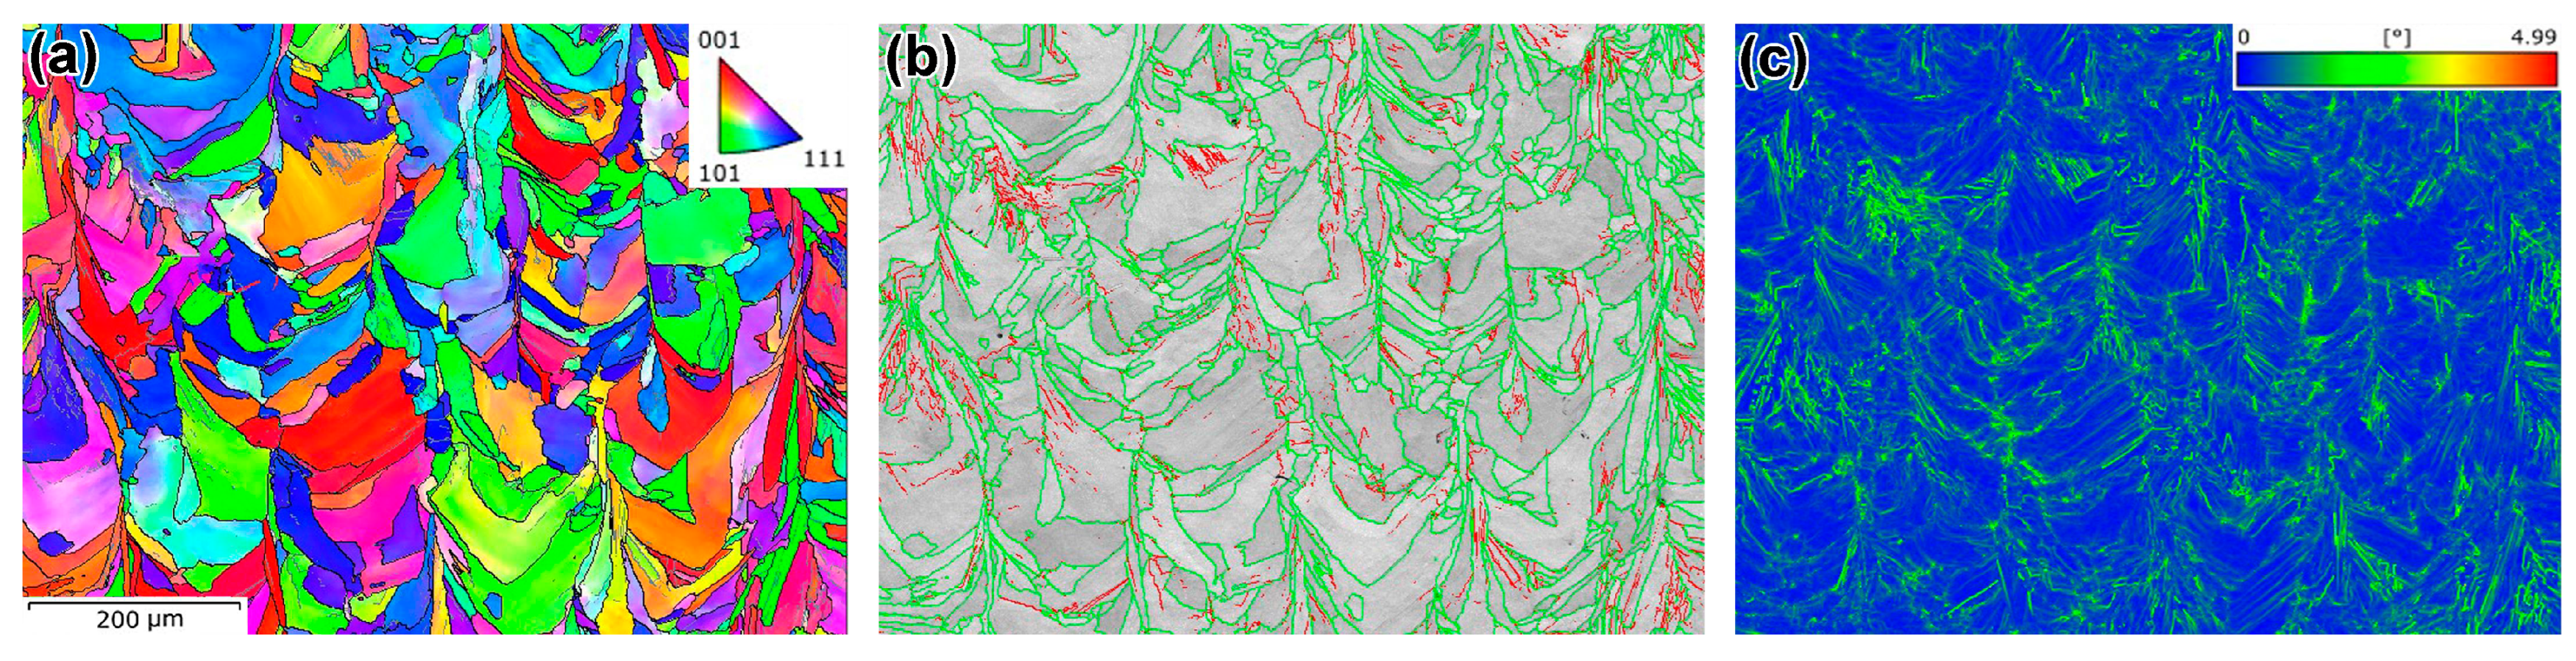
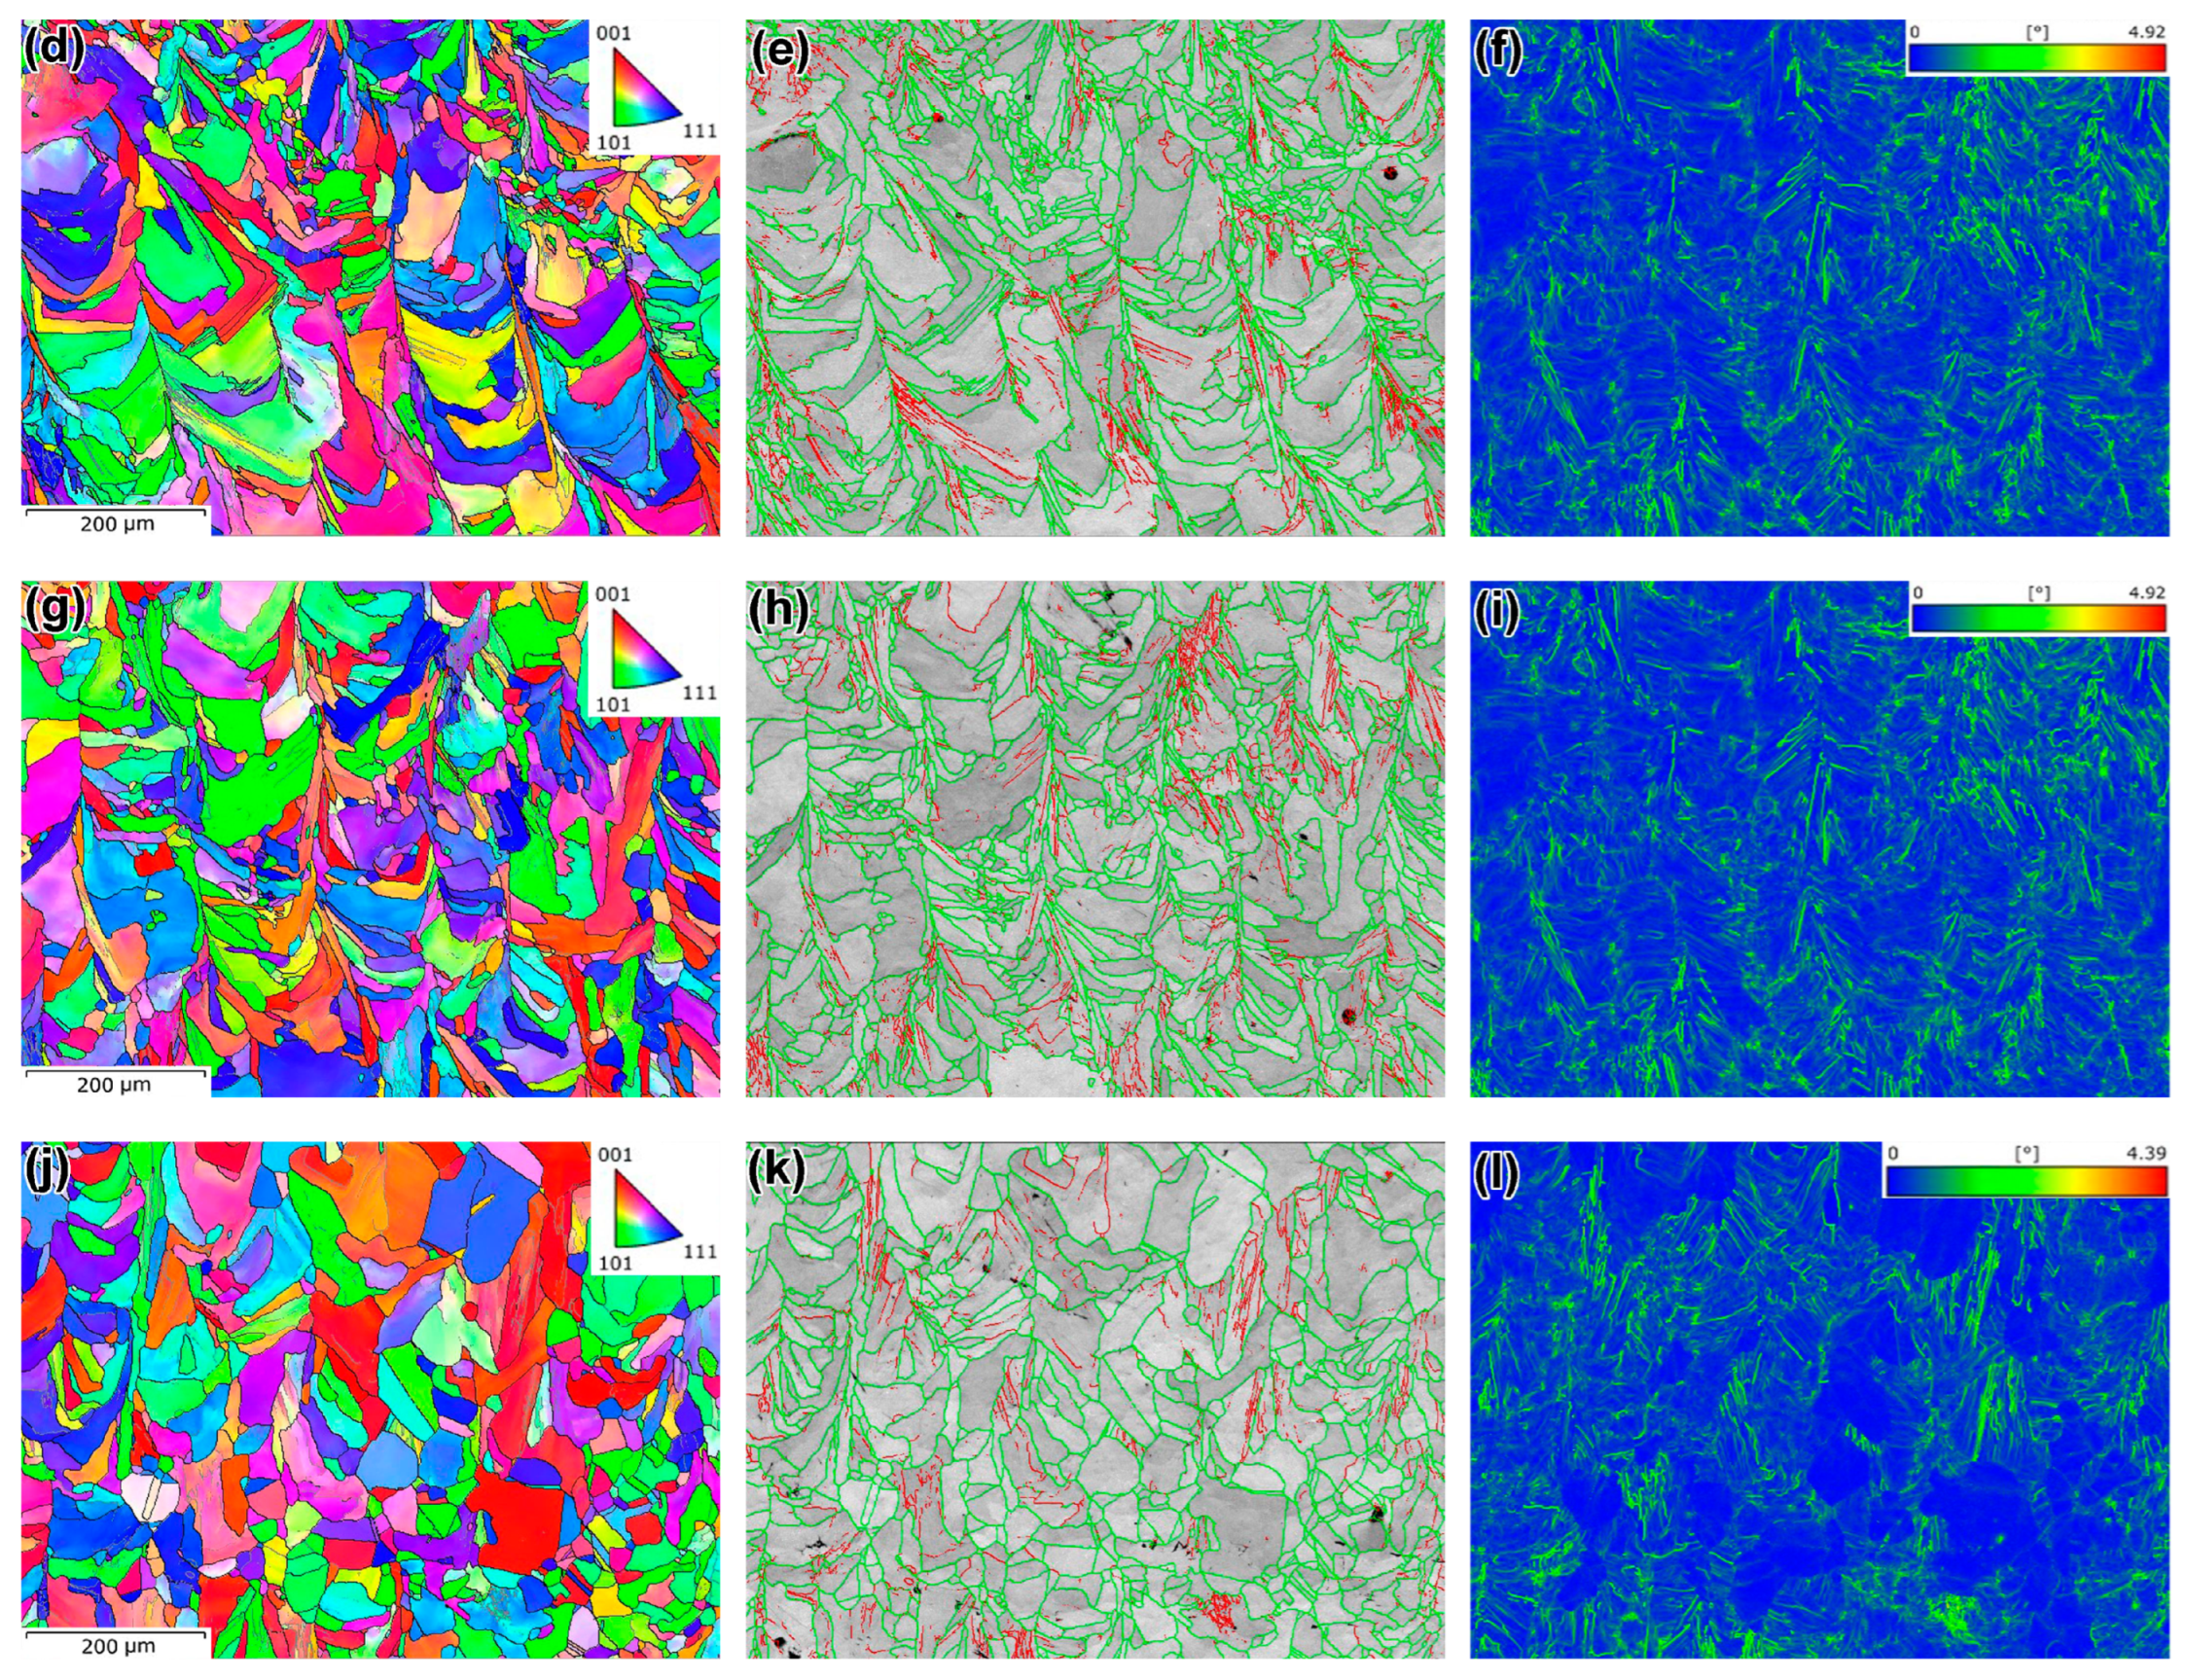
  • As-built LPBF 316L steel exhibited arc-like austenite grains and a cellular microstructure with cell boundaries formed by dislocation pile-ups, enriched in Cr and Mo, leading to segregation-induced lattice mismatch. This structure provided higher strength and hardness compared to wrought counterparts. Post-processing annealing stabilized the microstructure by eliminating the cellular substructure, homogenizing the elemental composition, decreasing the dislocation density, and producing equiaxed recrystallized grains at 1200 °C. These processes, at 900 °C, reduced the yield tensile strength and hardness by factors of 1.4 and 1.3, respectively, while achieving peak ductility (TEL of 68%) and impact toughness (KCVRT of 128 J/cm2). At higher annealing temperatures, strength and hardness were maintained (at 1050 °C) or moderately increased (at 1200 °C), while ductility and impact toughness (at room temperature and cryogenic temperature) were significantly reduced.
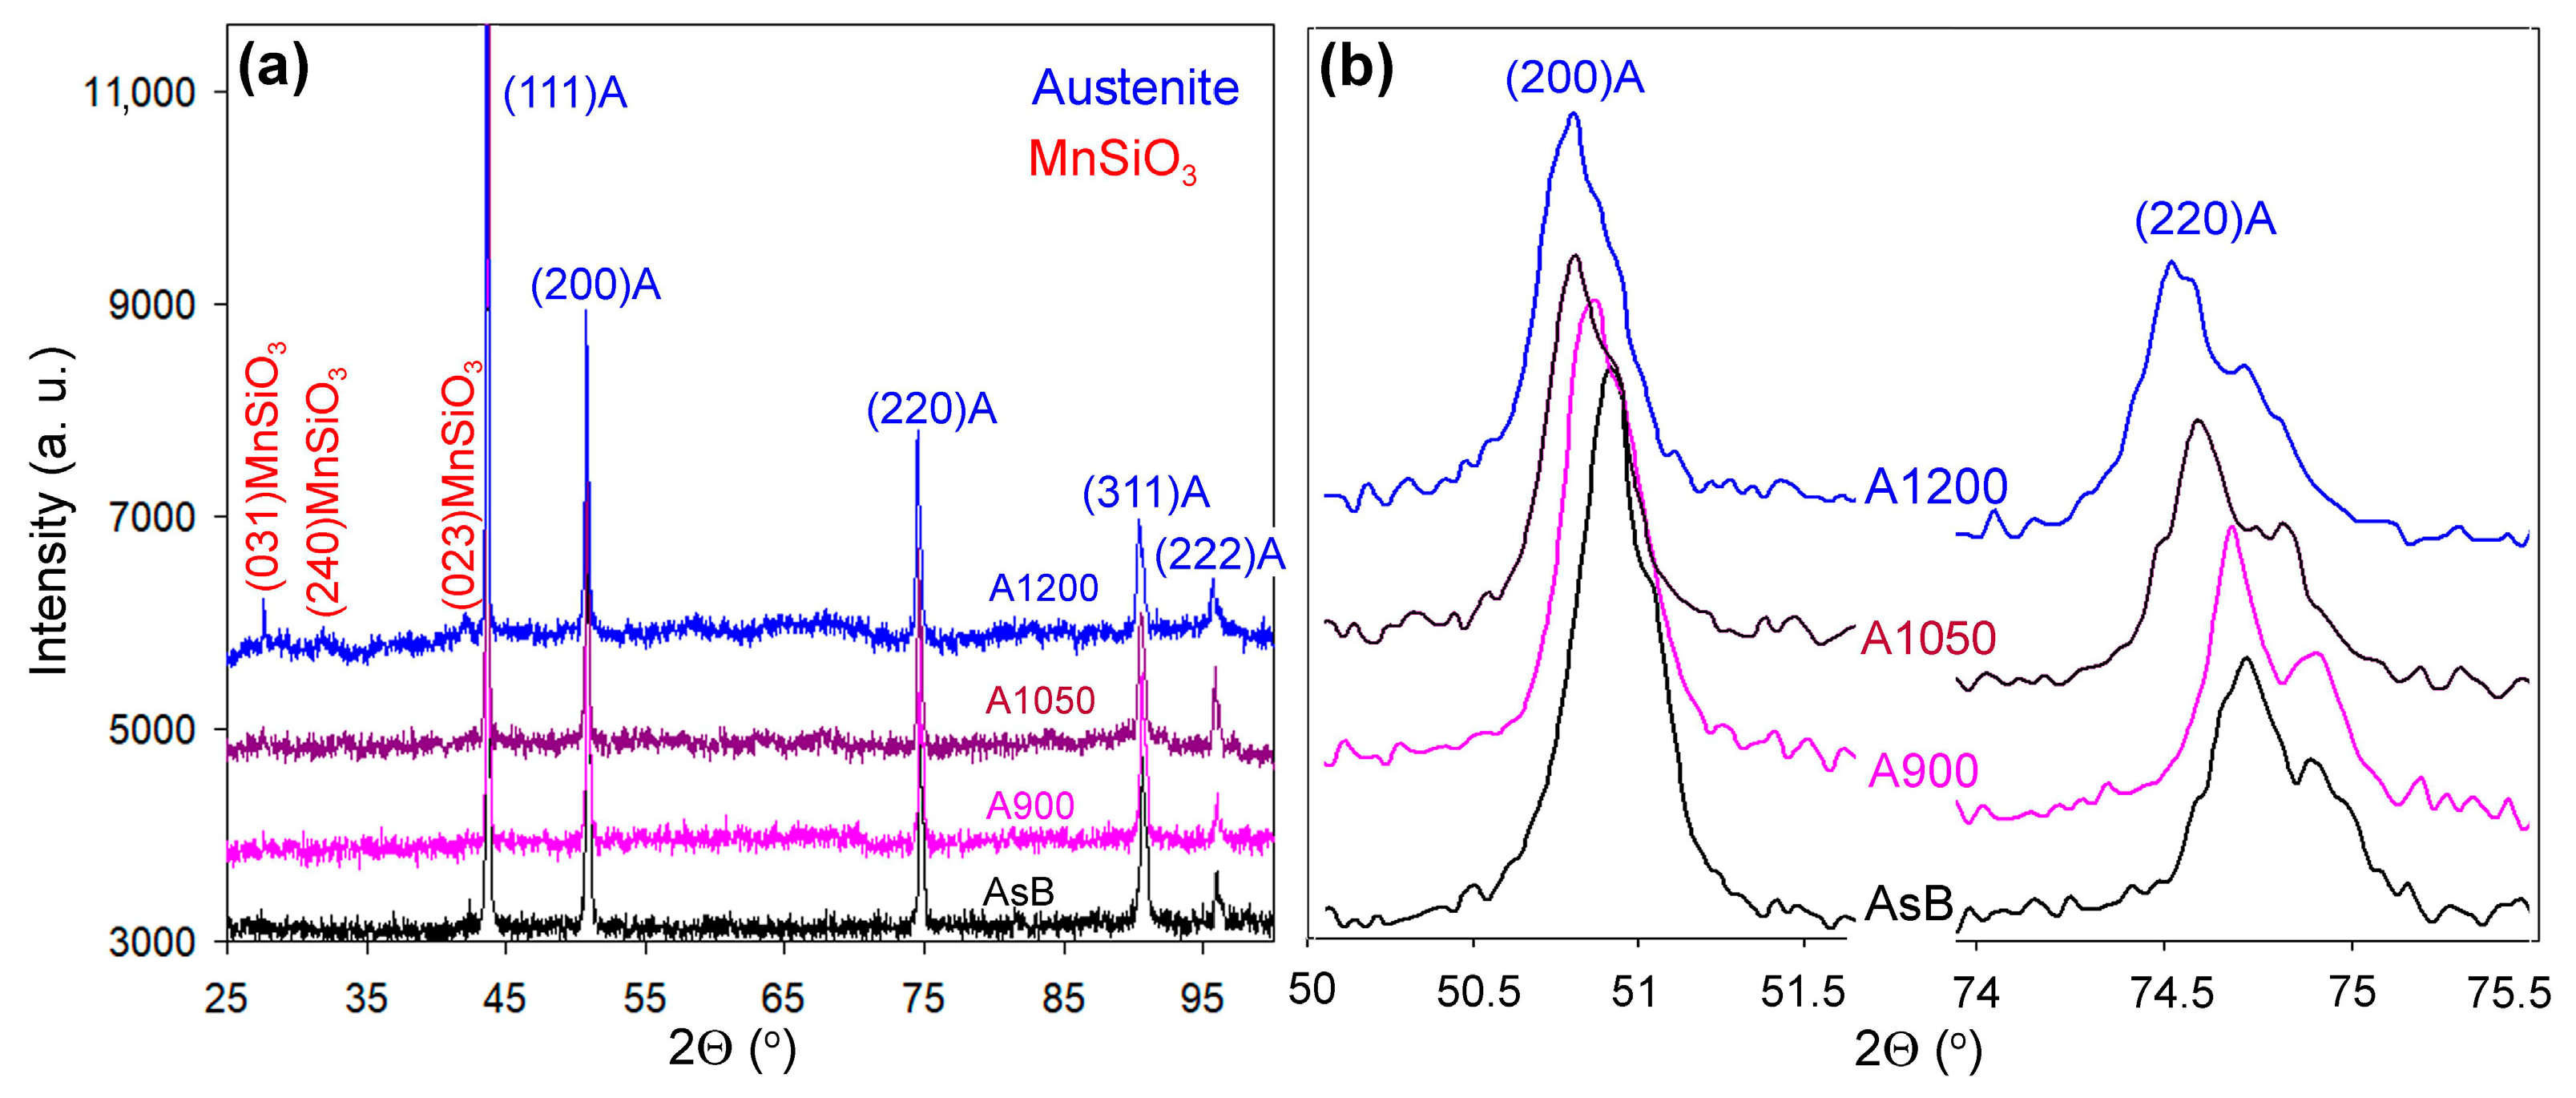
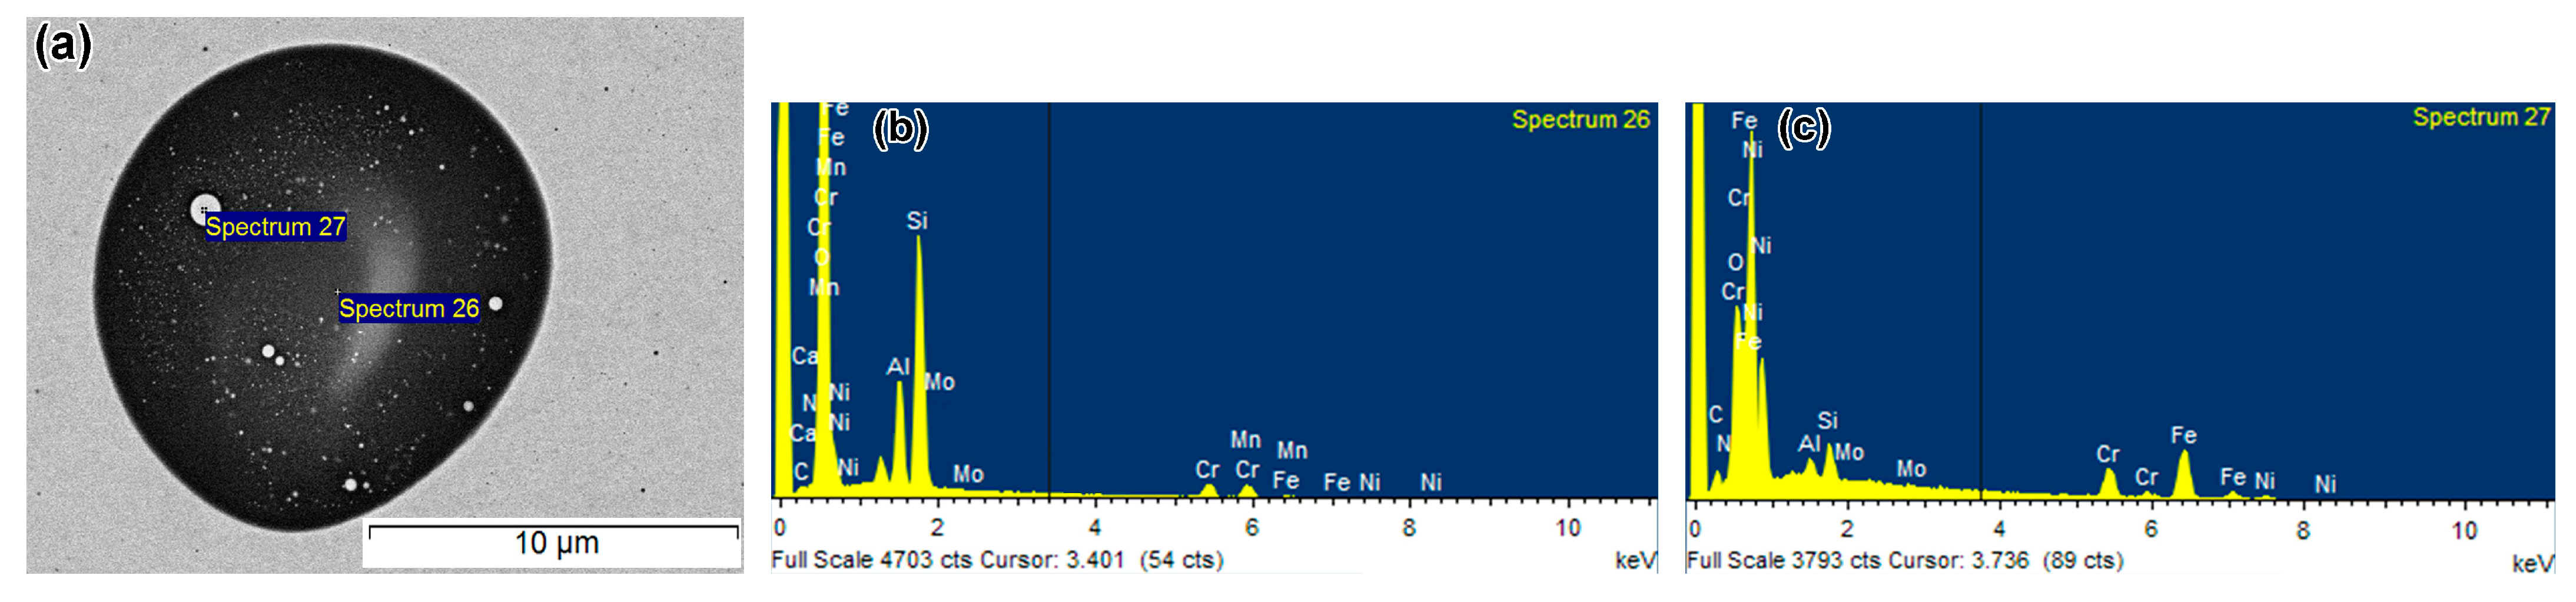
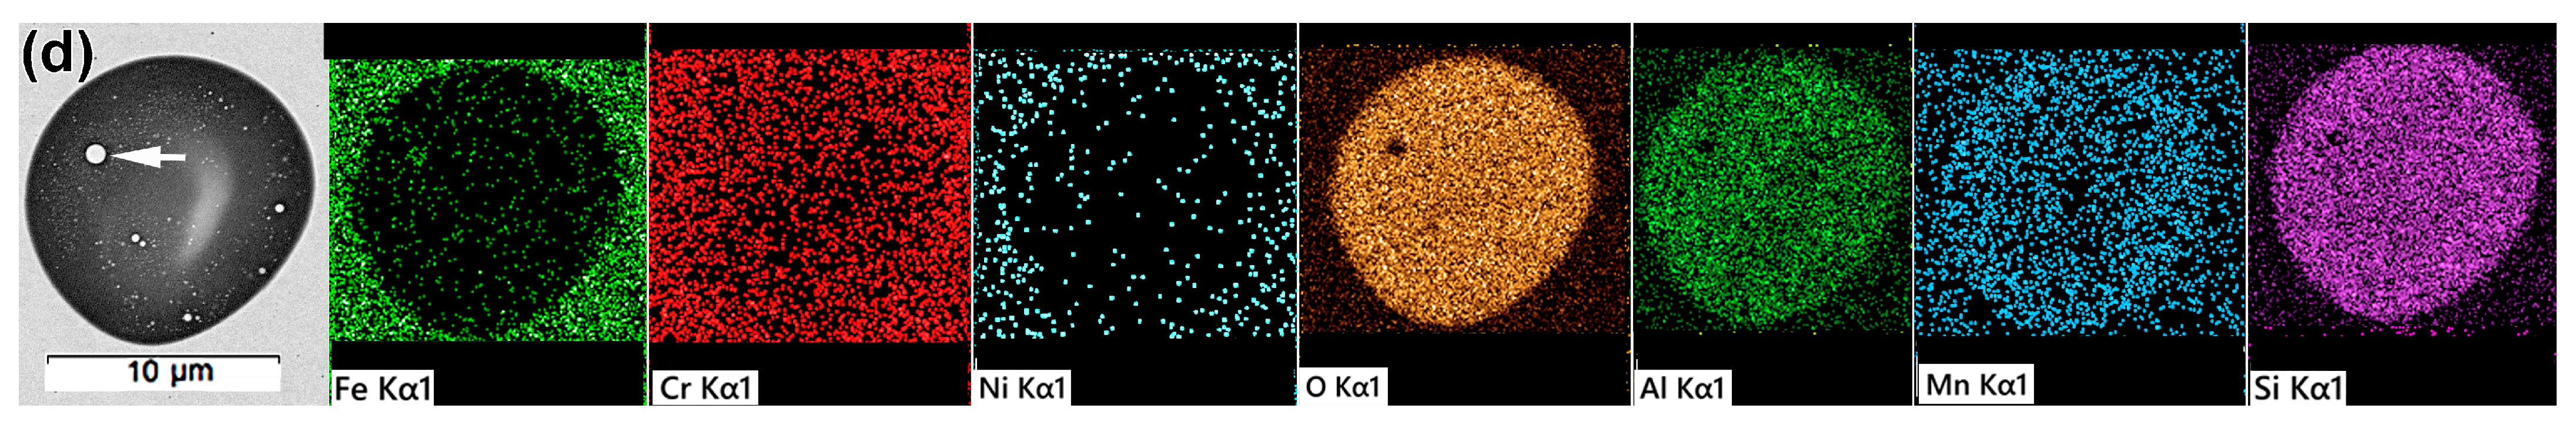
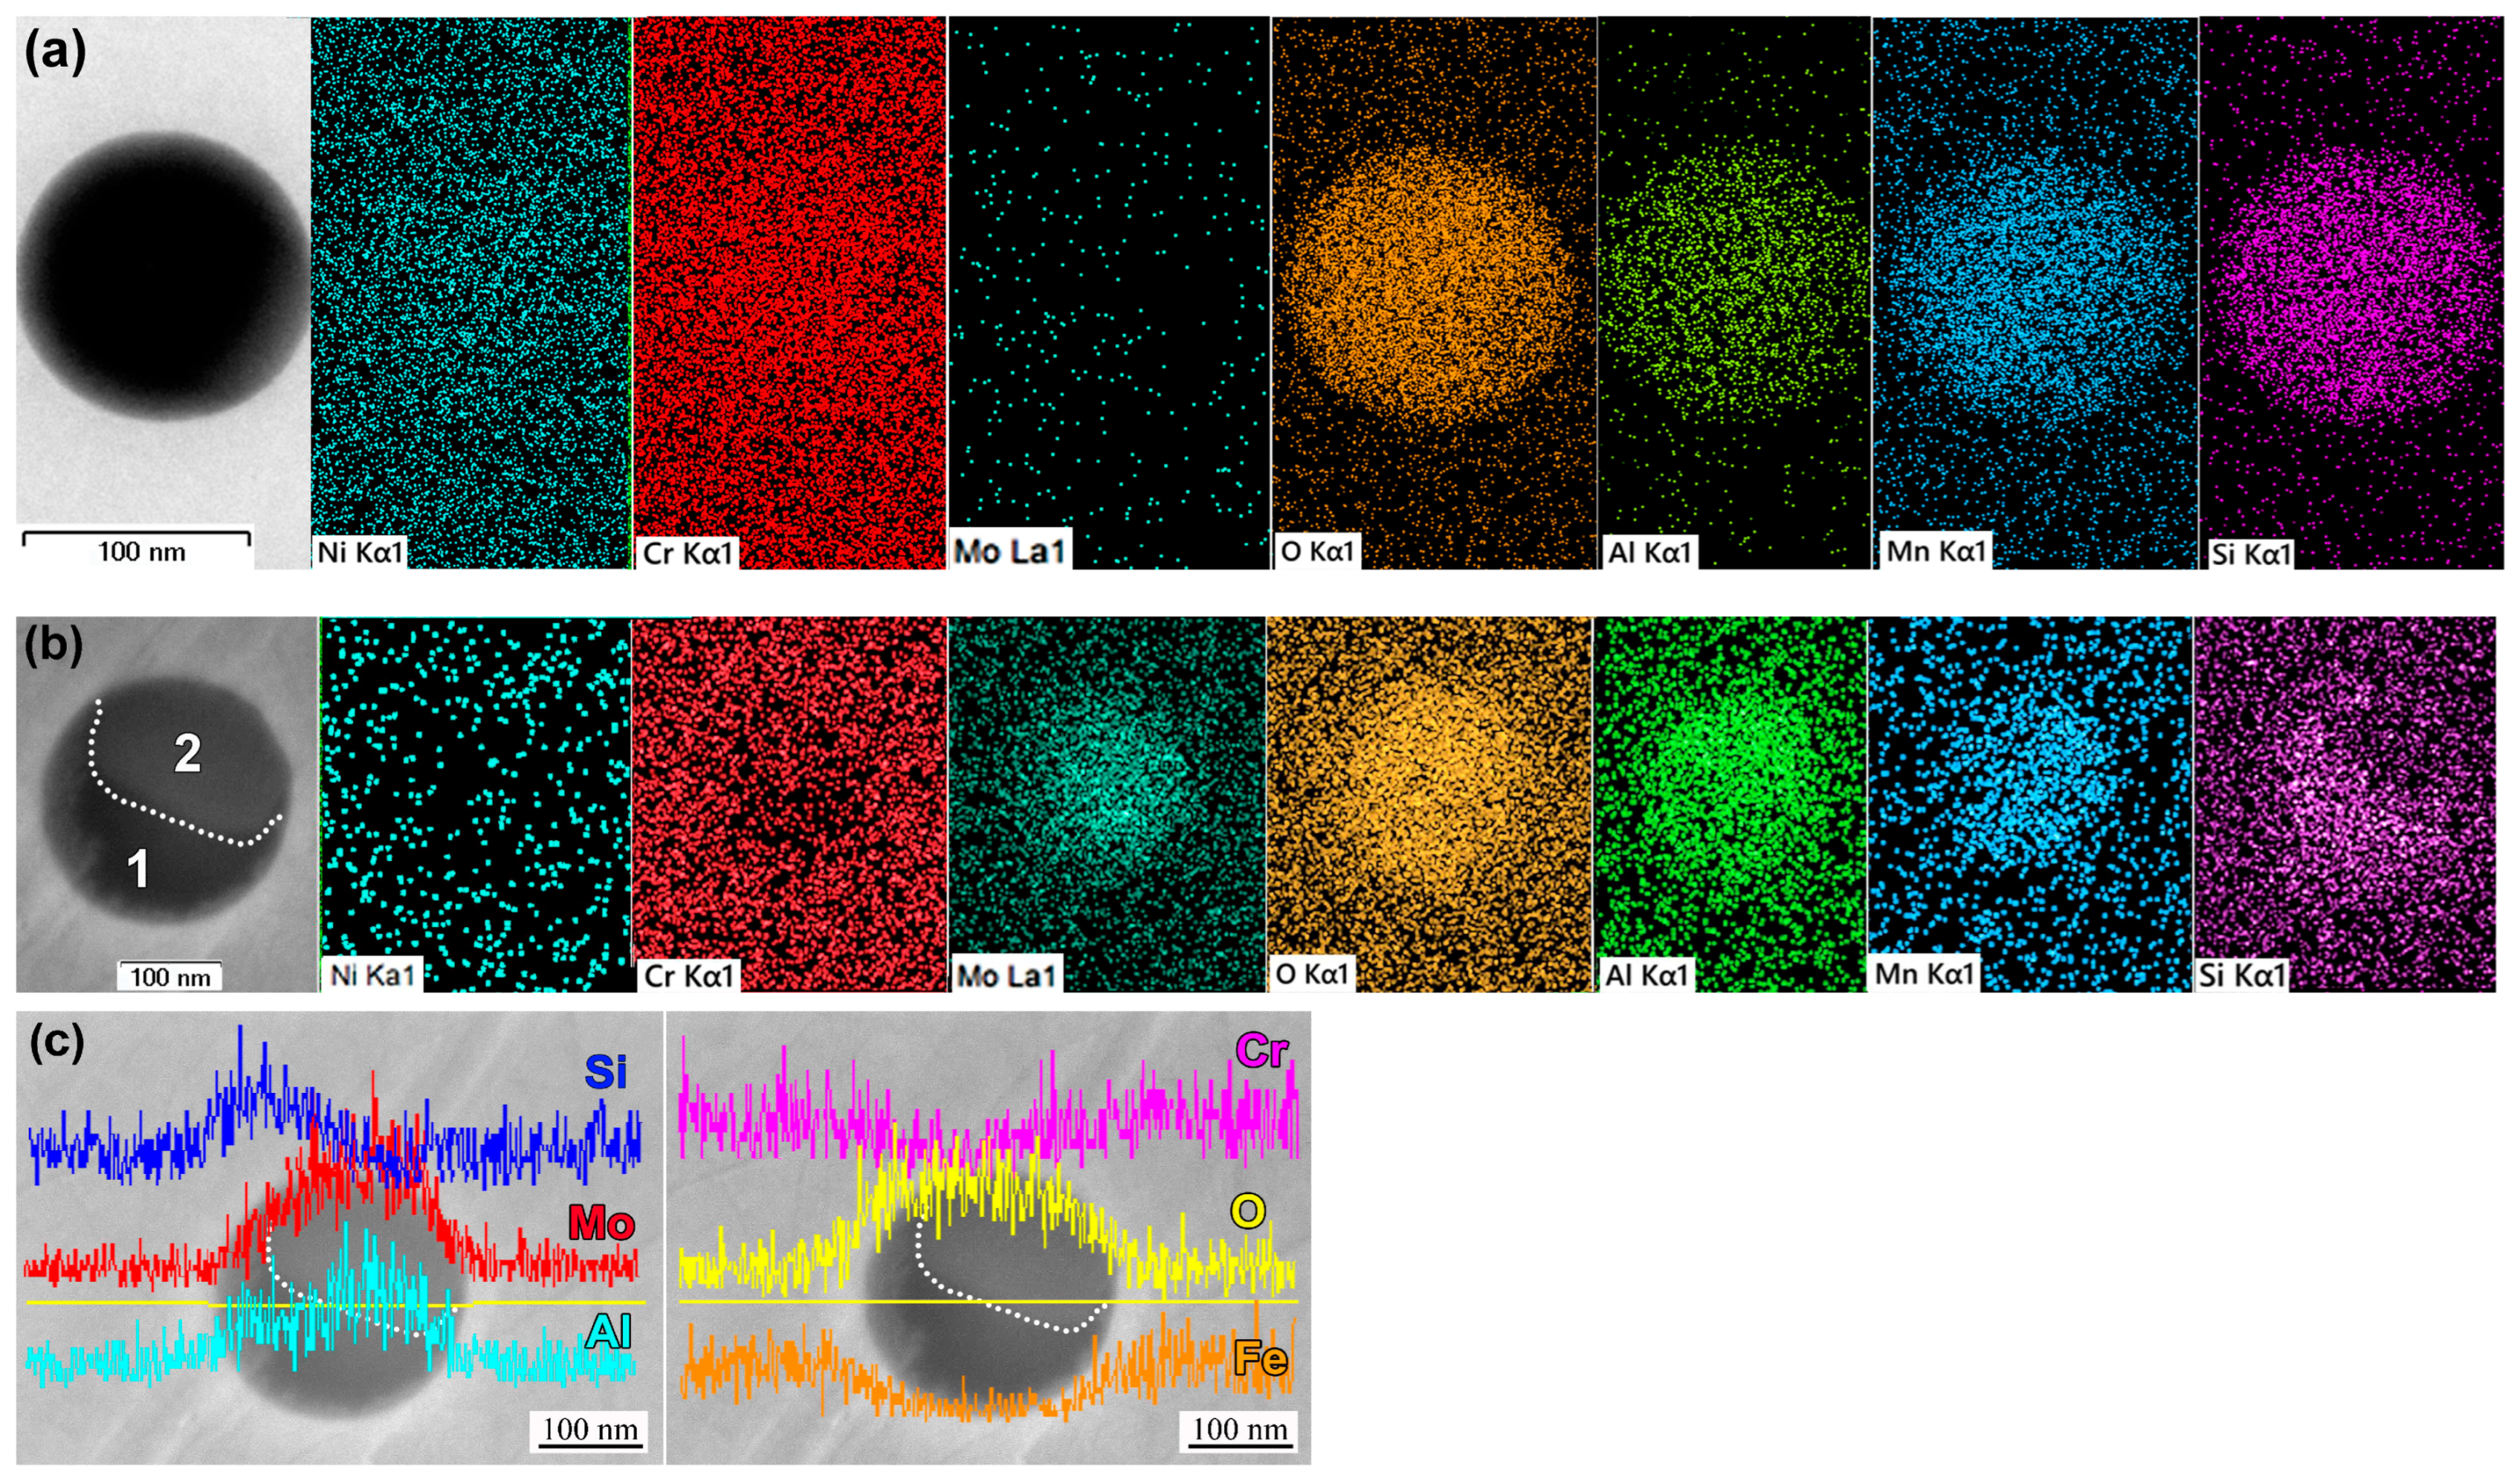
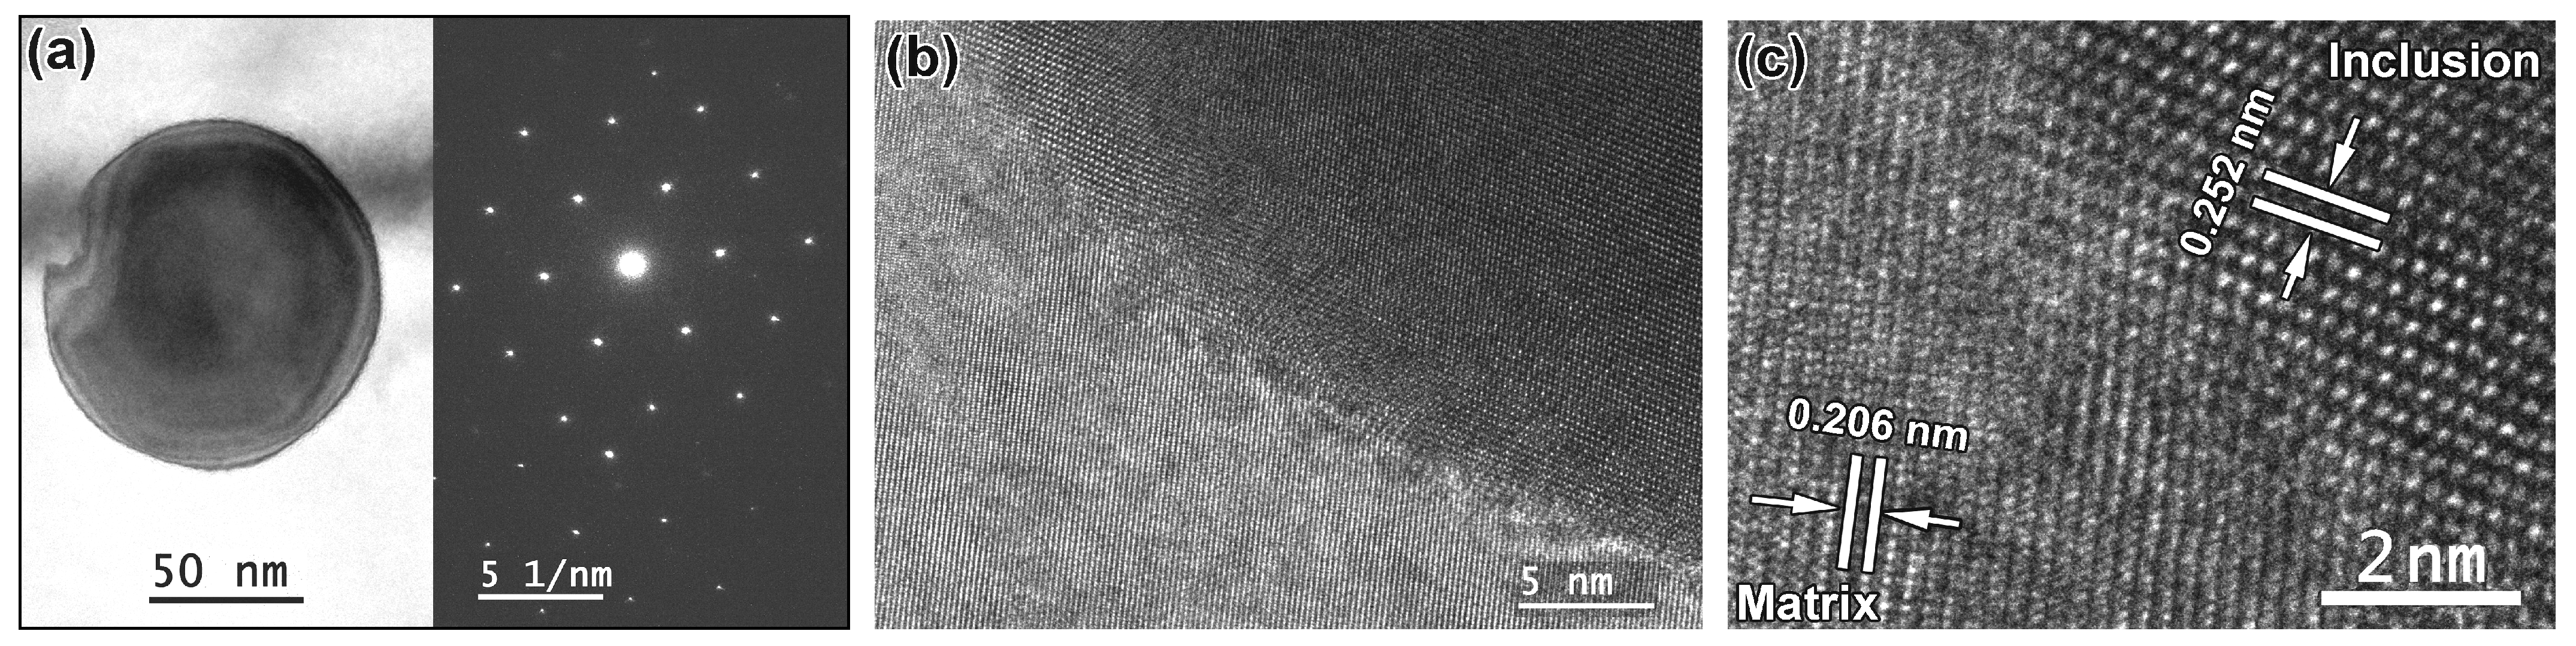
  • Annealing at 900 °C induced precipitation of nano-sized inclusions of manganese silicate, enriched with Al (up to 16 wt.%) and Cr (up to 20 wt. %). The volume fraction and size of inclusions increased with annealing temperature, contributing to strength (up to 100 MPa) and hardness while notably decreasing ductility, impact toughness, and corrosion behavior. At 1200 °C, the in situ transition (MnCrSiAl)O3 to Mo-rich (Si-depleted) oxides was observed.
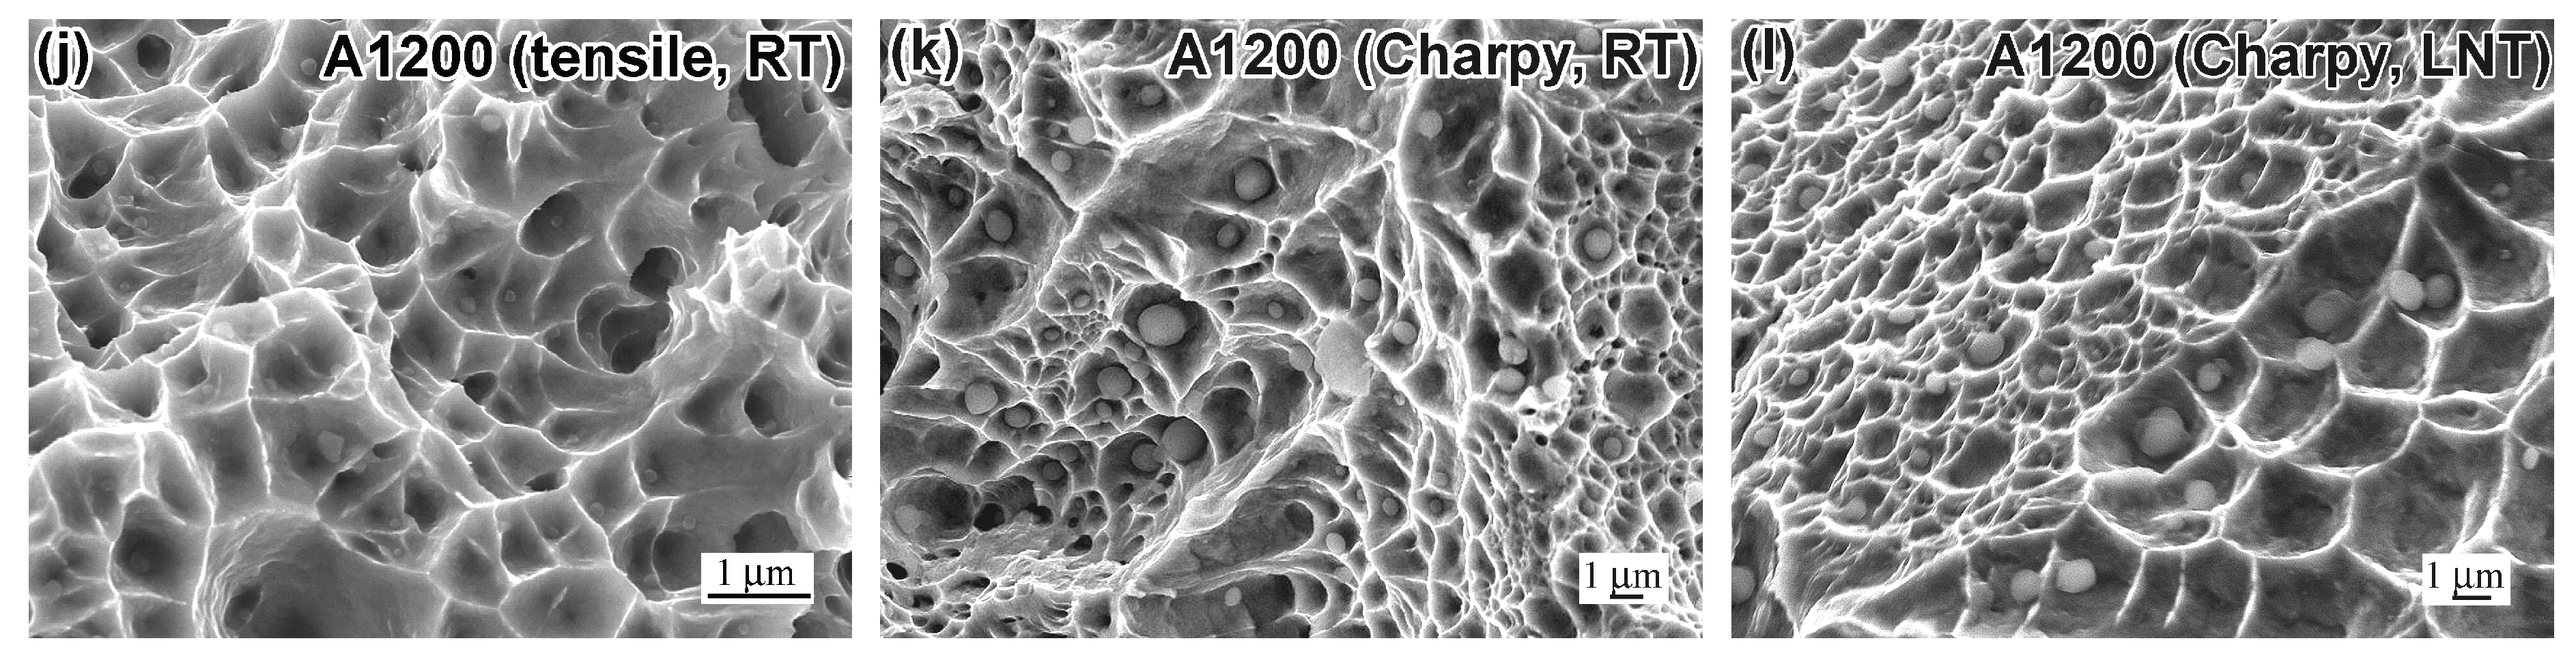
  • Regardless of the testing conditions (tensile, impact, room temperature, –196 °C) and annealing temperatures used, LPBF 316L steel exhibited a mixed transgranular and intergranular fracture mode with dimple relief, indicative of ductile fracture. Microvoid nucleation at oxide inclusions was the primary mechanism for dimple formation, becoming more pronounced at higher annealing temperatures.
  • Annealing of LPBF 316L steel at 900–1200 °C remarkably reduced corrosion resistance compared to its as-built condition, with the greatest deterioration being recorded at 1200 °C, primarily due to decreased passive film resistance (Rf) and increased corrosion current density (Icorr). The least detrimental effect was observed at 1050 °C, where impedance and corrosion parameters exhibited relatively milder degradation. The reduction in corrosion resistance was attributed to the formation and coarsening of oxygen-containing inclusions driven by high temperatures, as well degradation of the passive film due to the formation of Mo-rich oxides.
  • High-temperature annealing (900–1200 °C) is unsuitable for improving the overall balance of the tensile strength, ductility, impact toughness, and corrosion resistance of LPBF-manufactured 316L steel, as it may only enhance specific properties at the expense of compromising other critical characteristics.

Author Contributions

Conceptualization, B.E., Y.C., and V.E.; methodology, V.E., I.P., M.D., and K.W.; investigation, B.E., Y.C., S.A., T.Z., M.D., and T.X.; validation, I.P. and S.A.; formal analysis, B.E., S.A., and T.X.; resources, I.P., K.W., and T.X.; writing—original draft preparation, B.E., Y.C., V.E., and T.Z.; writing—review and editing, B.E., Y.C., V.E., and T.Z.; visualization, B.E. and I.P.; software, S.A.; supervision, V.E.; project administration, Y.C.; funding acquisition, V.E., K.W., and I.P. All authors have read and agreed to the published version of the manuscript.

Funding

This research was funded by the Ministry of Education and Science of Ukraine (project No. 0123U101834) and by the Slovak Research and Development Agency (APVV-23-0341).

Data Availability Statement

The original contributions presented in this study are included in the article. Further inquiries can be directed to the corresponding author.

Conflicts of Interest

The authors declare no conflicts of interest.

Abbreviations

The following abbreviations are used in this manuscript:
AMAdditive manufacturing
ARArea reduction
EBSDElectron backscattering diffraction
EDXEnergy dispersive X-ray spectroscopy
EISElectrochemical impedance spectroscopy
ERIElastic recovery index
HAGBHigh-angle grain boundary
HTHeat treatment
IPFInverse pole figure
FFTFast Fourier transform
KAMKernel average misorientation
KCVImpact toughness
LAGBLow-angle grain boundary
LNTLiquid nitrogen temperature (–196 °C)
LPBFLaser-based powder bed fusion
OCPOpen-circuit potential
OMOptical microscopy
PDPPotentiodynamic polarization
PIPlasticity index
PSEProduct of strength and elongation
RTRoom temperature (25 °C)
SAEDSelected area electron diffraction
SEMScanning electron microscope
SLMSelective laser melting
TELTotal elongation
TEMTransmission electron microscope
UTSUltimate tensile strength
XRDX-ray diffraction
YTSYield tensile strength

Appendix A

Table A1. The chemical composition of the non-metallic inclusions in LPBF 316L stainless steel (in wt.%).
Size (μm)OSiMnAlCrNiMoFe
As-built specimen (SEM/EDX)
12.0–22.0 (coarse)36.0–48.516.6–26.49.2–14.52.2–7.08.2–12.30.3–3.41.6–15.2
As-built specimen (TEM/EDX)
0.14–0.2017.5–22.411.8–12.02.0–13.22.2–2.712.3–14.45.3–6.40.0–1.232.6–41.7
0.22–0.3535.5–44.626.4–33.49.2–11.42.2–4.43.9–8.20.0–3.42.3–15.2
Matrix0.7–0.818.0–18.610.5–11.12.0–2.566.1–66.8
Annealing at 900 °C (TEM/EDX)
0.02–0.051.0–5.30.6–2.10.0–11.10.9–2.617.9–19.58.2–10.30.0–3.152.6–64.9
0.11–0.139.6–32.30.4–7.510.6–19.53.4–16.415.2–19.62.6–6.41.2–1.717.0–7.7
0.1936.48.320.712.117.8
Matrix0.5–0.717.8–18.210.1–10.52.4–2.666.6
Annealing at 1200 °C (TEM/EDX)
0.03–0.052.7–4.10.4–4.21.5–6.70.8–2.117.2–19.49.1–9.82.1–2.757.3–59.9
0.06–0.2815.2–26.58.8–16.210.6–22.22.2–9.99.3–11.44.2–7.01.6–13.724.1–43.9
0.37–0.4137.5–42.07.9–13.623.1–23.79.9–14.211.4–12.9
Matrix0.6–0.818.3–18.910.3–10.92.5–2.967.4–67.8

References

  1. ASTM A240/A240M-22a; Standard Specification for Chromium and Chromium-Nickel Stainless Steel Plate, Sheet, and Strip for Pressure Vessels and for General Applications. ASTM International: West Conshohocken, PA, USA, 2022.
  2. Kibambe, N.M.; Obadele, B.A.; Babalola, B.J.; Anamu, U.S.; Olubambi, P.A. Corrosion characteristics of heat-treated biomedical grade 316L stainless steel in simulated body fluids. Results Mater. 2025, 26, 100676. [Google Scholar] [CrossRef]
  3. Vainionpää, A.; Ferreirós, P.A.; Seppänen, T.; Que, Z. Microstructural insights into effects of pressurized water reactor environment and cyclic loading parameters on the low cycle fatigue behavior of 316L stainless steel. Int. J. Fatigue 2025, 198, 109016. [Google Scholar] [CrossRef]
  4. Haghdadi, N.; Laleh, M.; Moyle, M.; Primig, S. Additive manufacturing of steels: A review of achievements and challenges. J. Mater. Sci. 2021, 56, 64–107. [Google Scholar] [CrossRef]
  5. Gordon, J.V.; Narra, S.P.; Cunningham, R.W.; Liu, H.; Chen, H.; Suter, R.M.; Beuth, J.L.; Rollett, A.D. Defect structure process maps for laser powder bed fusion additive manufacturing. Addit. Manuf. 2020, 36, 101552. [Google Scholar] [CrossRef]
  6. Xiao, Q.; Chen, J.; Lee, H.B.; Jang, C.; Jang, K. Effect of heat treatment on corrosion behaviour of additively manufactured 316L stainless steel in high-temperature water. Corros. Sci. 2023, 210, 110830. [Google Scholar] [CrossRef]
  7. Li, H.; Song, B.; Wang, Y.; Zhang, J.; Zhao, W.; Fang, X. Laser powder bed fusion process optimization of CoCrMo alloy assisted by machine-learning. J. Mater. Res. Technol. 2024, 33, 3901–3910. [Google Scholar] [CrossRef]
  8. Duriagina, Z.A.; Tkachenko, R.O.; Trostianchyn, A.M.; Lemishka, I.A.; Kovalchuk, A.M.; Kulyk, V.V.; Kovbasyuk, T.M. Determination of the best microstructure and titanium alloy powders properties using neural network. J. Achiev. Mater. Manuf. Eng. 2018, 87, 25–31. [Google Scholar] [CrossRef]
  9. Vukkum, V.B.; Gupta, R.K. Review on corrosion performance of laser powder-bed fusion printed 316L stainless steel: Effect of processing parameters, manufacturing defects, post-processing, feedstock, and microstructure. Mater. Des. 2022, 221, 110874. [Google Scholar] [CrossRef]
  10. Deshmukh, K.; Riensche, A.; Bevans, B.; Lane, R.J.; Snyder, K.; Halliday, H.; Williams, C.B.; Mirzaeifar, R.; Rao, P. Effect of processing parameters and thermal history on microstructure evolution and functional properties in laser powder bed fusion of 316L. Mater. Des. 2024, 244, 113136. [Google Scholar] [CrossRef]
  11. Efremenko, B.V.; Shimizu, K.; Espallargas, N.; Efremenko, V.G.; Kusumoto, K.; Chabak, Y.G.; Belik, A.G.; Chigarev, V.V.; Zurnadzhy, V.I. High-temperature solid particle erosion of Cr-Ni-Fe-C arc cladded coatings. Wear 2020, 460–461, 203439. [Google Scholar] [CrossRef]
  12. Salman, O.O.; Gammer, C.; Chaubey, A.K.; Eckert, J.; Scudino, S. Effect of heat treatment on microstructure and mechanical properties of 316L steel synthesized by selective laser melting. Mater. Sci. Eng. A 2019, 748, 205–212. [Google Scholar] [CrossRef]
  13. Malakizadi, A.; Mallipeddi, D.; Dadbakhsh, S.; M’Saoubi, R.; Krajnik, P. Post-processing of additively manufactured metallic alloys—A review. Int. J. Mach. Tools Manuf. 2022, 179, 10390. [Google Scholar] [CrossRef]
  14. Chabak, Y.; Efremenko, B.; Petryshynets, I.; Efremenko, V.; Lekatou, A.G.; Zurnadzhy, V.; Bogomol, I.; Fedun, V.; Kovaľ, K.; Pastukhova, T. Structural and tribological assessment of biomedical 316 stainless steel subjected to pulsed-plasma surface modification: Comparison of LPBF 3D printing and conventional fabrication. Materials 2021, 14, 7671. [Google Scholar] [CrossRef]
  15. Hareharen, K.; Pradeep Kumar, S.; Panneerselvam, T.; Dinesh Babu, P.; Sriraman, N. Investigating the effect of laser shock peening on the wear behaviour of selective laser melted 316L stainless steel. Opt. Laser Technol. 2023, 162, 109317. [Google Scholar] [CrossRef]
  16. Sun, J.; Sun, Q.; Liu, Y.; Li, B.; Zhang, Z.; Xu, B.; Xu, S.; Han, Y.; Qiao, Y.; Han, J.; et al. Improving corrosion resistance of selective laser melted 316L stainless steel through ultrasonic severe surface rolling. J. Mater. Res. Technol. 2022, 20, 4378–4391. [Google Scholar] [CrossRef]
  17. Bae, D.; Park, S.; Seol, J.B.; Lee, D.J.; Amanov, A.; Sung, H.; Kim, J.G. Microstructural evolution and mechanical properties of laser-powder bed fusion processed 316L stainless steel with an ultrasonic-nanocrystalline surface modification. Mater. Sci. Eng. A 2023, 862, 144436. [Google Scholar] [CrossRef]
  18. Vasylyev, M.O.; Mordyuk, B.M.; Sydorenko, S.I.; Voloshko, S.M.; Burmak, A.P.; Franchik, N.V. Evolution of a structure-phase state and microhardness of a surface of stainless steel 12Cr18Ni10Ti in the conditions of ultrasonic impact treatment in various mediums. Metallofiz. Noveishie Tekhnologii 2017, 39, 905–928. [Google Scholar] [CrossRef]
  19. Kim, R.E.; Jeong, S.G.; Ha, H.; Heo, Y.U.; Amanov, A.; Gu, G.H.; Lee, D.J.; Moon, J.; Kim, H.S. Surface heterostructuring of 316L stainless steel manufactured by laser powder bed fusion and hot isostatic pressing. Mater. Sci. Eng. A 2024, 909, 146820. [Google Scholar] [CrossRef]
  20. Chabak, Y.G.; Efremenko, B.V.; Fedun, V.I.; Zurnadzhy, V.I.; Tyutyunnikov, V.I.; Dzherenova, A.V.; Tsvetkova, E.V.; Zhuk, V.I.; Efremenko, V.G. Feasibility of Pulsed-Plasma Treatment for Surface Modification of 3D-Printed Biomedical Alloys. Rom. J. Phys. 2022, 67, 501. [Google Scholar]
  21. Ghorbani, J.; Li, J.; Srivastava, A.K. Application of optimized laser surface re-melting process on selective laser melted 316L stainless steel inclined parts. J. Manuf. Process. 2020, 56, 726–734. [Google Scholar] [CrossRef]
  22. Doche, M.-L.; Hihn, J.-Y.; Drynski, E.; Roy, F.; Boucher, A.; Rolet, J.; Tardelli, J. Electropolishing of 316L stainless steel parts elaborated by selective laser melting: From laboratory to pilot scale. Procedia CIRP 2022, 108, 722–727. [Google Scholar] [CrossRef]
  23. Ura-Bińczyk, E.; Dobkowska, A.; Bazarnik, P.; Ciftci, J.; Krawczyńska, A.; Chromiński, W.; Wejrzanowski, T.; Molak, R.; Sitek, R.; Płociński, T.; et al. Effect of annealing on the mechanical and corrosion properties of 316L stainless steel manufactured by laser powder bed fusion. Mater. Sci. Eng. A 2022, 860, 144263. [Google Scholar] [CrossRef]
  24. Abu-warda, N.; Bedmar, J.; García-Rodriguez, S.; Torres, B.; Utrilla, M.V.; Rams, J. Effect of post-processing heat treatments on the high-temperature oxidation of additively manufactured 316L stainless steel. J. Mater. Res. Technol. 2024, 29, 3465–3476. [Google Scholar] [CrossRef]
  25. Gundgire, T.; Santa-aho, S.; Rautio, T.; Järvenpää, A.; Vippola, M. Synergistic effects of heat treatments and severe shot peening on residual stresses and microstructure in 316L stainless steel produced by laser powder bed fusion. J. Mater. Process. Technol. 2024, 323, 118229. [Google Scholar] [CrossRef]
  26. Zhu, W.; Moumni, Z.; Zhu, J.; Zhang, Y.; You, Y.; Zhang, W. A multi-scale experimental investigation on fatigue crack propagation rate behavior of powder bed fusion-laser beam 316L stainless steel subjected to various heat treatments. Eng. Fract. Mech. 2024, 302, 110064. [Google Scholar] [CrossRef]
  27. Que, Z.; Riipinen, T.; Ferreirós, P.; Goel, S.; Sipilä, K.; Saario, T.; Ikäläinen, T.; Toivonen, A.; Revuelta, A. Effects of surface finishes, heat treatments and printing orientations on stress corrosion cracking behavior of laser powder bed fusion 316L stainless steel in high-temperature water. Corros. Sci. 2024, 233, 112118. [Google Scholar] [CrossRef]
  28. Moghadas, S.M.J.; Yeganeh, M.; Zaree, S.R.A.; Eskandari, M. Influence of low temperature heat treatment on microstructure, corrosion resistance and biological performance of 316L stainless steel manufactured by selective laser melting. CIRP J. Manuf. Sci. Technol. 2023, 40, 68–74. [Google Scholar] [CrossRef]
  29. Kong, D.; Dong, C.; Ni, X.; Zhang, L.; Yao, J.; Man, C.; Cheng, X.; Xiao, K.; Li, X. Mechanical properties and corrosion behavior of selective laser melted 316L stainless steel after different heat treatment processes. J. Mater. Sci. Technol. 2019, 35, 1499–1507. [Google Scholar] [CrossRef]
  30. Zhou, C.; Hu, S.; Shi, Q.; Tao, H.; Song, Y.; Zheng, J.; Xu, P.; Zhang, L. Improvement of corrosion resistance of SS316L manufactured by selective laser melting through subcritical annealing. Corros. Sci. 2020, 164, 108353. [Google Scholar] [CrossRef]
  31. Liu, W.; Liu, C.; Wang, Y.; Zhang, H.; Ni, H. Effect of heat treatment on the corrosion resistance of 316L stainless steel manufactured by laser powder bed fusion. J. Mater. Res. Technol. 2024, 32, 3896–3912. [Google Scholar] [CrossRef]
  32. Bae, K.; Shin, D.; Lee, J.; Kim, S.; Lee, W.; Jo, I.; Lee, J. Corrosion resistance of laser powder bed fused AISI 316L Stainless Steel and effect of direct annealing. Materials 2022, 15, 6336. [Google Scholar] [CrossRef] [PubMed]
  33. Lalech, M.; Hughes, A.E.; Xu, W.; Cizek, P.; Tan, M.Y. Unanticipated drastic decline in pitting corrosion resistance of additively manufactured 316L stainless steel after high-temperature post-processing. Corros. Sci. 2020, 165, 108412. [Google Scholar] [CrossRef]
  34. Bedmar, J.; García-Rodríguez, S.; Roldán, M.; Torres, B.; Rams, J. Effects of the heat treatment on the microstructure and corrosion behavior of 316L stainless steel manufactured by Laser Powder Bed Fusion. Corros. Sci. 2022, 209, 110777. [Google Scholar] [CrossRef]
  35. Duan, Z.; Man, C.; Cui, H.; Cui, Z.; Wang, X. Formation mechanism of MnS inclusion during heat treatments and its influence on the pitting behavior of 316L stainless steel fabricated by laser powder bed fusion. Corros. Commun. 2022, 7, 12–22. [Google Scholar] [CrossRef]
  36. Zhao, C.; Bai, Y.; Yan, Q.; Li, B. Enhanced corrosion resistance of laser powder bed fusion 316L stainless steel by modifying the microstructure through heat treatment. J. Mater. Process. Technol. 2025, 36, 7158–7171. [Google Scholar] [CrossRef]
  37. Sander, G.; Thomas, S.; Cruz, V.; Jurg, M.; Birbilis, N.; Gao, X.; Brameld, M.; Hutchinson, C. On the corrosion and metastable pitting characteristics of 316L stainless steel produced by selective laser melting. Electrochem. Soc. Interface 2017, 164, 250–257. [Google Scholar] [CrossRef]
  38. Lou, X.; Andresen, P.L.; Rebak, R.B. Oxide inclusions in laser additive manufactured stainless steel and their effects on impact toughness and stress corrosion cracking behavior. J. Nucl. Mater. 2018, 499, 182–190. [Google Scholar] [CrossRef]
  39. Saeidi, K.; Gao, X.; Zhong, Y.; Shen, Z.J. Hardened austenite steel with columnar sub-grain structure formed by laser melting. Mater. Sci. Eng. A 2015, 625, 221–229. [Google Scholar] [CrossRef]
  40. Yin, H.; Wei, B.; Shmatok, A.; Yang, J.; Salek, M.F.; Beckingham, L.; Prorok, B.; Wang, J.; Lou, X. On the nanoscale oxide dispersion via in-situ atmospheric oxidation during laser powder bed fusion. J. Mater. Process. Technol. 2023, 322, 118191. [Google Scholar] [CrossRef]
  41. Morozova, I.; Kehm, C.; Obrosov, A.; Yang, Y.; Miah, K.U.M.; Uludintceva, E.; Fritzsche, S.; Weiß, S.; Michailov, V. On the Heat Treatment of Selective-Laser-Melted 316L. J. Mater. Eng. Perform. 2023, 32, 4295–4305. [Google Scholar] [CrossRef]
  42. Zhang, H.; Li, C.; Yao, G.; Shi, Y.; Zhang, Y. Effect of annealing treatment on microstructure evolution and deformation behavior of 304 L stainless steel made by laser powder bed fusion. Int. J. Plast. 2022, 155, 103335. [Google Scholar] [CrossRef]
  43. Ge, J.; Pillay, S.; Ning, H. Post-Process Treatments for Additive-Manufactured Metallic Structures: A Comprehensive Review. J. Mater. Eng. Perform. 2023, 32, 7073–7122. [Google Scholar] [CrossRef]
  44. Blinn, B.; Krebs, F.; Ley, M.; Teutsch, R.; Beck, T. Determination of the influence of a stress-relief heat treatment and additively manufactured surface on the fatigue behavior of selectively laser melted AISI 316L by using efficient short-time procedures. Int. J. Fatigue 2020, 131, 105301. [Google Scholar] [CrossRef]
  45. Yang, J.; Li, B.; Zheng, Y.; Chen, G.; Chen, X. Low cycle fatigue behavior of additive manufactured 316LN stainless steel at 550 °C: Effect of solution heat treatment. Int. J. Fatigue 2024, 179, 108066. [Google Scholar] [CrossRef]
  46. Yadollahi, A.; Shamsaei, N.; Thompson, S.M.; Seely, D.W. Effects of process time interval and heat treatment on the mechanical and microstructural properties of direct laser deposited 316L stainless steel. Mater. Sci. Eng. A 2015, 644, 171–183. [Google Scholar] [CrossRef]
  47. Ronneberg, T.; Davies, C.M.; Hooper, P.A. Revealing relationships between porosity, microstructure and mechanical properties of laser powder bed fusion 316L stainless steel through heat treatment. Mater. Des. 2020, 189, 108481. [Google Scholar] [CrossRef]
  48. Kumaran, M.; Sathies, T.; Balaji, N.S.; Bharathiraja, G.; Mohan, S.; Senthilkumar, V. Influence of heat treatment on stainless steel 316L alloy fabricated using directed energy deposition. Mater. Today Proc. 2022, 62, 5307–5310. [Google Scholar] [CrossRef]
  49. Hong, Y.; Zhou, C.; Zheng, Y.; Zhang, L.; Zheng, J. The cellular boundary with high density of dislocations governed the strengthening mechanism in selective laser melted 316L stainless steel. Mater. Sci. Eng. A 2021, 799, 140279. [Google Scholar] [CrossRef]
  50. Shin, W.-S.; Son, B.; Song, W.; Sohn, H.; Jang, H.; Kim, Y.-J.; Park, C. Heat treatment effect on the microstructure, mechanical properties, and wear behaviors of stainless steel 316L prepared via selective laser melting. Mater. Sci. Eng. A 2021, 806, 140805. [Google Scholar] [CrossRef]
  51. de Sonis, E.; Dépinoy, S.; Giroux, P.-F.; Maskrot, H.; Wident, P.; Hercher, O.; Villaret, F.; Gourgues-Lorenzon, A.-F. Microstructure—Toughness relationships in 316L stainless steel produced by laser powder bed fusion. Mater. Sci. Eng. A 2023, 877, 145179. [Google Scholar] [CrossRef]
  52. Alsalla, H.; Hao, L.; Smith, C. Fracture toughness and tensile strength of 316L stainless steel cellular lattice structures manufactured using the selective laser melting technique. Mater. Sci. Eng. A 2016, 669, 1–6. [Google Scholar] [CrossRef]
  53. Pacheco, J.T.; Meura, V.H.; Rafael, P.; Bloemer, A.; Veiga, M.T.; de Moura Filho, O.C.; Cunha, A.; Teixeira, M.F. Laser directed energy deposition of AISI 316L stainless steel: The effect of build direction on mechanical properties in as-built and heat-treated conditions. Adv. Ind. Manuf. Eng. 2022, 4, 100079. [Google Scholar] [CrossRef]
  54. Wang, C.; Lin, X.; Wang, L.; Zhang, S.; Huang, W. Cryogenic mechanical properties of 316L stainless steel fabricated by selective laser melting. Mater. Sci. Eng. A 2021, 815, 141317. [Google Scholar] [CrossRef]
  55. Efremenko, B.; Chabak, Y.; Petryshynets, I.; Efremenko, V.; Wu, K.; Arshad, S.; Kromka, F. Microstructure Evolution, Tensile/Nanoindentation Response, and Work-Hardening Behaviour of Prestrained and Subsequently Annealed LPBF 316L Stainless Steel. Materials 2025, 18, 1102. [Google Scholar] [CrossRef] [PubMed]
  56. Lephuthing, S.S.; Rasiwela, L. Nondestructive measurement of the mechanical properties of graphene nanoplatelets reinforced nickel aluminium bronze composites. Heliyon 2021, 7, e07978. [Google Scholar] [CrossRef]
  57. Yurkova, A.I.; Byakova, A.V.; Belots’ky, A.V.; Milman, Y.V.; Dub, S.N. Mechanical behaviour of nanostructured iron fabricated by severe plastic deformation under diffusion flow of nitrogen. Mater. Sci. Forum 2006, 503–504, 645–650. [Google Scholar] [CrossRef]
  58. ASTM F3184-16; Standard Specification for Additive Manufacturing Stainless Steel Alloy (UNS S31603) with Powder Bed Fusion. ASTM International: West Conshohocken, PA, USA, 2016.
  59. Deng, P.; Song, M.; Yang, J.; Pan, Q.; McAllister, S.; Li, L.; Prorok, B.C.; Lou, X. On the thermal coarsening and transformation of nanoscale oxide inclusions in 316L stainless steel manufactured by laser powder bed fusion and its influence on impact toughness. Mater. Sci. Eng. A 2022, 835, 142690. [Google Scholar] [CrossRef]
  60. de Sonis, E.; Dépinoy, S.; Giroux, P.-F.; Maskrot, H.; Wident, P.; Hercher, O.; Villaret, F.; Gourgues-Lorenzon, A.-F. Impact toughness of LPBF 316L stainless steel below room temperature. Mater. Sci. Eng. A 2024, 915, 147189. [Google Scholar] [CrossRef]
  61. Losertova, M.; Štamborská, M.; Lapin, J.; Mareš, V. Comparison of deformation behavior of 316L stainless steel and Ti6Al4V alloy applied in traumatology. Metalurgija 2016, 55, 667–670. [Google Scholar]
  62. Rokosz, K.; Hryniewicz, T.; Valicek, J.; Harnicarova, M.; Vylezik, M. Nanoindentation measurements of AISI 316L SS biomaterial samples after annual immersion in Ringer’s solution followed by electrochemical polishing in a magnetic field. Pomiary Autom. Kontrola 2012, 58, 460–463. [Google Scholar]
  63. Yeganeh, M.; Shahryari, Z.; Talib Khanjar, A.; Hajizadeh, Z.; Shabani, F. Inclusions and Segregations in the Selective Laser-Melted Alloys: A Review. Coatings 2023, 13, 1295. [Google Scholar] [CrossRef]
  64. Li, S.-H.; Zhao, Y.; Kumar, P.; Ramamurty, U. Effect of initial dislocation density on the plastic deformation response of 316L stainless steel manufactured by directed energy deposition. Mater. Sci. Eng. A 2022, 851, 143591. [Google Scholar] [CrossRef]
  65. Efremenko, V.G.; Lekatou, A.G.; Chabak, Y.G.; Efremenko, B.V.; Petryshynets, I.; Zurnadzhy, V.I.; Emmanouilidou, S.; Vojtko, M. Micromechanical, corrosion and wet sliding wear behaviours of Co-28Cr-6Mo alloy: Wrought vs. LPBF. Mater. Today Commun. 2023, 35, 105936. [Google Scholar] [CrossRef]
  66. Gubicza, J. Reliability and interpretation of the microstructural parameters determined by X-ray line profile analysis for nanostructured materials. Eur. Phys. J. Spec. Top. 2022, 231, 4153–4165. [Google Scholar] [CrossRef]
  67. Zieliński, W.; Abduluyahed, A.A.; Kurzydłowski, K.J. TEM studies of dislocation substructure in 316 austenitic stainless steel strained after annealing in various environments. Mater. Sci. Eng. A 1998, 249, 91–96. [Google Scholar] [CrossRef]
  68. Huang, G.; Wei, K.; Deng, J.; Liu, M.; Zeng, X. High-power laser powder bed fusion of 316L stainless steel: Defects, microstructure, and mechanical properties. J. Manuf. Process. 2022, 83, 235–245. [Google Scholar] [CrossRef]
  69. Efremenko, V.G.; Chabak, Y.G.; Shimizu, K.; Golinskyi, M.A.; Lekatou, A.G.; Petryshynets, I.; Efremenko, B.V.; Halfa, H.; Kusumoto, K.; Zurnadzhy, V.I. The novel hybrid concept on designing advanced multi-component cast irons: Effect of boron and titanium (Thermodynamic modelling, microstructure and mechanical property evaluation). Mater. Charact. 2023, 197, 112691. [Google Scholar] [CrossRef]
  70. Yan, F.; Xiong, W.; Faierson, E.; Olson, G.B. Characterization of nano-scale oxides in austenitic stainless steel processed by powder bed fusion. Scr. Mater. 2018, 155, 104–108. [Google Scholar] [CrossRef]
  71. Mancini, F.; Alviola, R.; Marshall, B.; Satoh, H.; Papunen, H. The manganese silicate rocks of the Early Proterozoic Vittinki Group, southwestern Finland: Metamorphic grade and genetic interpretations. Can. Mineral. 2000, 23, 1103–1124. [Google Scholar] [CrossRef]
  72. Chu, H.-Y.; Shiue, R.-K.; Cheng, S.-Y. The Effect of Homogenization Heat Treatment on 316L Stainless Steel Cast Billet. Materials 2024, 17, 232. [Google Scholar] [CrossRef]
  73. Hao, Y.; Cao, G.; Li, C.; Liu, W.; Li, J.; Liu, Z.; Gao, F. Solidification structures of Fe-Cr-Ni-Mo-N super-austenitic stainless steel processed by twin-roll strip casting and ingot casting and their segregation evolution behaviors. ISIJ Int. 2018, 58, 1801–1810. [Google Scholar] [CrossRef]
  74. Sumanariu, C.A.; Amza, C.G.; Baciu, F.; Vasile, M.I.; Nicoara, A.I. Comparative Analysis of Mechanical Properties: Conventional vs. Additive Manufacturing for Stainless Steel 316L. Materials 2024, 17, 4808. [Google Scholar] [CrossRef] [PubMed]
  75. Cooper, A.J.; Cooper, N.I.; Dhers, J.; Sherry, A. Effect of Oxygen Content Upon the Microstructural and Mechanical Properties of Type 316L Austenitic Stainless Steel Manufactured by Hot Isostatic Pressing. Metall. Mater. Trans. A 2016, 47, 4467–4475. [Google Scholar] [CrossRef]
  76. Riabov, D.; Leicht, A.; Ahlström, J.; Hryha, E. Investigation of the strengthening mechanism in 316L stainless steel produced with laser powder bed fusion. Mater. Sci. Eng. A 2021, 822, 141699. [Google Scholar] [CrossRef]
  77. Wang, Y.; Voisin, T.; McKeown, J.; Jianchao Ye, J.; Calta, N.P.; Zan, L.; Zeng, Z.; Zhang, Y.; Chen, W.; Roehling, T.T.; et al. Additively manufactured hierarchical stainless steels with high strength and ductility. Nat. Mater. 2018, 17, 63–71. [Google Scholar] [CrossRef]
  78. Mohri, T.; Suzuki, T. Solid solution hardening by impurities. In Impurities in Engineering Materials; Briant, C.L., Dekker, M., Eds.; Routledge: London, UK, 1999. [Google Scholar]
  79. Yan, F.K.; Qian, L.; Nai, T. Anisotropic strengthening of nanotwinned austenitic grains in a nanotwinned stainless steel. Scr. Mater. 2018, 142, 15–19. [Google Scholar] [CrossRef]
  80. Ghosh, G.; Olson, G.B. The isotropic shear modulus of multicomponent Fe-base solid solutions. Acta Mater. 2002, 50, 2655–2675. [Google Scholar] [CrossRef]
  81. Zhong, Y.; Liu, L.; Wikman, S.; Cui, D.; Shen, Z. Intragranular cellular segregation network structure strengthening 316L stainless steel prepared by selective laser melting. J. Nucl. Mater. 2016, 470, 170–178. [Google Scholar] [CrossRef]
  82. Kvackaj, T.; Bidulská, J.; Fedoríková, A.; Bidulský, R. Mechanical Properties and Strengthening Contributions of AISI 316 LN Austenitic Stainless Steel Grade. Materials 2025, 18, 499. [Google Scholar] [CrossRef]
  83. Ghosh, D.C.; Biswas, R. Theoretical Calculation of Absolute Radii of Atoms and Ions. Part 1. The Atomic Radii. Int. J. Mol. Sci. 2002, 3, 87–113. [Google Scholar] [CrossRef]
  84. Gladman, T. Precipitation hardening in metals. Mater. Sci. Technol. 1999, 15, 30–36. [Google Scholar] [CrossRef]
  85. Deng, P.; Karadge, M.; Rebak, R.B.; Gupta, V.K.; Prorok, B.C.; Lou, X. The origin and formation of oxygen inclusions in austenitic stainless steels manufactured by laser powder bed fusion. Addit. Manuf. 2020, 35, 101334. [Google Scholar] [CrossRef]
  86. Chen, S.; Ma, G.; Wu, G.; Godfrey, A.; Huang, T.; Huang, X. Strengthening mechanisms in selective laser melted 316L stainless steel. Mater. Sci. Eng. A 2022, 832, 142434. [Google Scholar] [CrossRef]
  87. Schmauder, S.; Kohler, C. Atomistic Simulations of Solid Solution Strengthening of α-Iron. Comput. Mater. Sci. 2011, 50, 1238–1243. [Google Scholar] [CrossRef]
  88. Eliasson, J.; Sandström, R. Proof strength values for austenitic stainless steels at elevated temperatures. Steel Res. 2000, 71, 249–254. [Google Scholar] [CrossRef]
  89. Kako, K.; Kawakami, E.; Ohta, J.; Mayuzumi, M. Effects of various alloying elements on tensile properties of high-purity Fe-18Cr-(14-16)Ni alloys at room temperature. Mater. Trans. 2002, 43, 155–162. [Google Scholar] [CrossRef]
  90. Kong, D.; Dong, C.; Ni, X.; Liang, Z.; Man, C.; Li, X. Hetero-deformation-induced stress in additively manufactured 316L stainless steel. Mater. Res. Lett. 2020, 8, 390–397. [Google Scholar] [CrossRef]
  91. Guo, Y.; Collins, D.M.; Tarleton, E.; Hofmann, F.; Tischler, J.; Liu, W.; Xu, R.; Wilkinson, A.J.; Britton, T.B. Measurements of stress fields near a grain boundary: Exploring blocked arrays of dislocations in 3D. Acta Mater. 2015, 96, 229–236. [Google Scholar] [CrossRef]
  92. Chabak, Y.G.; Efremenko, V.G. Change of secondary-carbides’ nanostate in 14.5% Cr cast iron at high-temperature heating. Metallofiz. Noveishie Tekhnologii 2012, 34, 1205–1220. [Google Scholar]
  93. Trembach, B.; Trembach, I.; Maliuha, V.; Knyazev, S.; Krbata, M.; Kabatskyi, O.; Balenko, O.; Zarichniak, Y.; Brechka, M.; Bodak, M.; et al. Study of self-shielded flux-cored wire with exothermic additions CuO-Al on weld bead morphology, microstructure, and mechanical properties. Int. J. Adv. Manuf. Technol. 2025, 137, 4685–4711. [Google Scholar] [CrossRef]
  94. Efremenko, B.V.; Zurnadzhy, V.I.; Chabak, Y.G.; Efremenko, V.G.; Kudinova, K.V.; Mazur, V.A. A comparison study on the effect of counter ball material on sliding wear response of SLM-printed biomedical 316L steel. Mater. Today Proc. 2022, 66, 2587–2593. [Google Scholar] [CrossRef]
  95. Ohtsuki, T.; Pistorius, P.C. Oxide Behavior During Laser Surface Melting. Metals 2025, 15, 627. [Google Scholar] [CrossRef]
  96. Sukhova, O.V.; Polonskyy, V.A.; Ustinova, K.V. Microstructure and corrosion properties of quasicrystal Al-Cu-Fe alloys alloyed with Si and B in acidic solutions. Vopr. Khimii Khimicheskoi Tekhnologii 2018, 121, 77–83. [Google Scholar] [CrossRef]
  97. Saeidi, K.; Kvetkova, L.; Lofaj, F.; Shen, Z. Austenitic stainless steel strengthened by the in situ formation of oxide nanoinclusions. RSC Adv. 2015, 5, 20747–20750. [Google Scholar] [CrossRef]
  98. Chao, Q.; Thomas, S.; Birbilis, N.; Cizek, P.; Hodgson, P.D.; Fabijanic, D. The Effect of Post-processing heat treatment on the microstructure, residual stress and mechanical properties of selective laser melted 316L stainless steel. Mater. Sci. Eng. A 2021, 821, 141611. [Google Scholar] [CrossRef]
  99. Chen, N.; Ma, G.; Zhu, W.; Godfrey, A.; Shen, Z.; Wu, G.; Huang, X. Enhancement of an additive-manufactured austenitic stainless steel by post-manufacture heat-treatment. Mater. Sci. Eng. A 2019, 759, 65–69. [Google Scholar] [CrossRef]
Figure 1. The specimens of 316L steel used for tensile and Charpy testing: (a) shapes and sizes; (b) a total view of as-built specimens on the platform.
Metals 15 00684 g001
Figure 2. (a) Engineering strain–stress curves. Effects of annealing temperature on (b) YTS, UTS, and YTS/UTS ratio; (c) TEL and AR; and (d) KCV and PSE.
Metals 15 00684 g002
Figure 3. The load–displacement curves of the nanoindentation tests (each curve corresponds to the mean value of the indentation hardness for a specific heat treatment mode).
Metals 15 00684 g003
Figure 4. Low-magnification images of the fractured surface of (a,c,e) AsB specimens and (b,d,f) A1200 specimens: (a,b)—tensile testing at RT; (c)—impact testing at RT; (df)—impact testing at LNT.
Metals 15 00684 g004
Figure 5. High-magnification images of the fractured surfaces of tensile specimens (a,d,g,j) and Charpy (b,c,e,f,h,i,k,l) specimens ((ac)—AsB; (df)—A900; (gi)—A1050; (jl)—A1200). ((a,b,d,e,g,h,j,k)—tested at RT; (c,f,i,l)—tested at LNT.)
Metals 15 00684 g005aMetals 15 00684 g005b
Figure 6. The microstructure of the as-built specimen: (a) “fish-scale” pattern; (b) cellular and columnar grains; (c,d) cell pattern; (d) enlarged image of cells; (e) EDX maps of Fe, Mo, Ni, and Cr from the location of (d); and (f) EDX spectra from the cell wall (spectrum 7) and cell body (spectrum 9). ((a,b)—OM; (c,d)—SEM; (e,f)—SEM/EDX.). Black arrows show the epitaxial grains. The areas 1, 2, 3, 4 and 5 depict the adjacent cell clusters of different cell cross-sectional size.
Metals 15 00684 g006aMetals 15 00684 g006b
Figure 7. The microstructure of the annealed specimens: (a,b) A900, (c) A1050, (d) A900 (etching pits), and (e,f) A1200 ((a,c,e)—OM; (b,d,f)—SEM).
Metals 15 00684 g007
Figure 8. TEM images of the microstructure of specimens: (a) columnar grains (AsB), (b) dislocation wall and HAGB of the columnar grain (AsB), (c) sub-grains (AsB), (d,e) the dislocation structure in the A900 specimen, (f) oxide nano-precipitates in the A900 specimen, (g,h) coarse oxide inclusions in the A1200 specimen, and (i) the peening of the grain boundary by the nano-sized oxide inclusions.
Metals 15 00684 g008
Figure 9. XRD patterns of the LPBF 316L specimens: (a) a range of 2θ = 25–100°; (b) 2θ ranges corresponding to the (200) and (220) peaks of austenite.
Metals 15 00684 g009
Figure 10. The results of the EBSD analysis of specimens (ac) AsB, (df) A900, (gi) A1050, and (jl) A1200. (a,d,g,j) are IPF maps; (b,e,h,k) are GB maps (green lines are HAGB, red lines are LAGB); (c,f,i,l) are KAM maps. (af are adapted from Ref. [55]).
Metals 15 00684 g010aMetals 15 00684 g010b
Figure 11. The {100}, {110}, and {111} pole figures of specimens AsB, A900, A1050, and A1200.
Metals 15 00684 g011aMetals 15 00684 g011b
Figure 12. (a) OM images of non-metallic inclusions. They include size distributions based on (b) OM observations (coarse particles) and (c) SEM/TEM observations (fine particles).
Metals 15 00684 g012
Figure 13. Coarse heterogeneous non-metallic inclusion in as-built specimens (SEM/EDX): (a) back-scattered electron image, (b) EDX spectrum 26, (c) EDX spectrum 27, and (d) EDX elemental maps of Fe, Cr, Ni, O, Al, Mn, and Si. White arrow in (d) shows the micro-droplet of the matrix phase.
Metals 15 00684 g013aMetals 15 00684 g013b
Figure 14. Fine non-metallic inclusions in the A1200 specimen (TEM/EDX analysis). Secondary electron images and EDX elemental maps of the (a) low-Mo inclusion (0.12 μm) and (b) high-Mo inclusion (0.26 μm). (c) Elemental distribution across the particles shown in (b). Area 1 is the zone enriched in Si and O; area 2 is the zone enriched in Mo, Al, Mn, and Cr.
Metals 15 00684 g014
Figure 15. Manganese silicate inclusion in the A1200 specimen: (a) a high-resolution TEM image, (b) the SAED pattern along the [010] zone axis of MnSiO3, and (c) the FFT patterns of the inclusion–matrix interface.
Metals 15 00684 g015
Figure 16. The (a) Nyquist curves and (b) PDP curves of the LPBF 316L steel specimens annealed at various temperatures. (c) Equivalent circuits for fitting. Q is the capacitance, Rs is solution resistance, Rct is the charge transfer resistance, Rf is the resistance of the passive film.
Metals 15 00684 g016
Table 1. The chemical composition (wt. %) of the as-built 316L steel samples (adapted from Ref. [55]).
CSiMnCrNiMoSPCuVTiNbCoAlFe
0.0220.801.0816.3911.922.360.0070.0180.150.050.0060.040.100.02bal.
Table 2. The micromechanical properties of LPBF 316L steel (in parenthesis is a maximum data scatter; ERI, PI, and hp/hmax are calculated for the curve corresponding to the mean nanoindentation hardness).
SpecimenIndentation Modulus (GPa)Indentation Hardness (GPa)ERIPIhp/hmax
Range
of Values (Difference)
Average
Value
Range
of Values
(Difference)
Average
Value
AsB138.31–169.41 (31.1)156.94 ± 1.082.72–3.69 (0.97)3.02 ± 0.040.1350.8650.899
A900172.32–201.14(28.82) 191.33 ± 1.422.36–3.34 (0.98)2.42 ± 0.030.1140.8860.929
A1050167.42–198.39 (30.97) 186.74 ± 1.352.36–2.92 (0.56)2.67 ± 0.020.1430.8570.925
A1200147.28–170.83 (23.55) 159.81 ± 1.122.72–3.73 (1.01)3.10 ± 0.030.1560.8440.903
Table 3. The results derived from the XRD patterns.
Specimena (Å)D (Å)ερXRD (m−2)
AsB3.59716682.37 × 10−41.04 × 10¹³
A9003.59824852.27 × 10−46.72 × 10¹²
A10503.60152231.96 × 10−42.76 × 10¹²
A12003.60425328.88 × 10−52.58 × 10¹²
Table 4. The statistical data of the EBSD analysis.
ParametersHeat Treatment
As-Built900 °C1050 °C1200 °C
Grain number767903753579
Grain size (μm)20.618.821.624.8
HAGB (%)75.473.673.876.0
LAGB (%)24.626.426.224.0
KAM (o)0.510.540.490.38
Table 5. Statistical data on fine oxide particle size and distribution (based on TEM observation).
SpecimenVolume Fraction (vol.%)Area Density, (pcs/μm2)Mean Size (μm)Maximum Size (μm)
AsB0.43 ± 0.081.08 ± 0.170.071 ± 0.010.50
A9000.50 ± 0.1113.06 ± 4.90.044 ± 0.020.45
A12001.14 ± 0.250.55 ± 0.090.110 ± 0.030.99
Table 6. The fitting results of the EIS data.
ParametersAsB900 °C1050 °C1200 °C
|Z|0.01 (Ω·cm2)316,311.2100,274.6169,657.165,340.6
Rf (Ω·cm2)3.289 × 1051.052 × 1051.574 × 1050.764 × 105
Qf−1·cm–2·sn)5.528 × 10−54.128 × 10−54.332 × 10−58.747 × 10−5
nf0.810.880.930.84
Rct (Ω·cm2)3.486 × 1043.475 × 1042.368 × 1042.152 × 104
Qdl−1·cm−2·sn)2.652 × 10−56.793 × 10−58.635 × 10−56.764 × 10−5
ndl0.900.890.890.84
Table 7. The fitting results of the PDP curves.
ParametersAsB900 °C1050 °C1200 °C
Ecorr (V)−0.169−0.163−0.186−0.237
Icorr (A/cm2)6.611 × 10−81.378 × 10−71.228 × 10−71.995 × 10−7
Table 8. The contributions (in MPa) of strengthening mechanisms to the theoretical YTS of LPBF 316L steel.
SpecimenΔσP-NΔσssΔσGBΔσpcptΔσdislΔσLPBFΔσsegrΔσtwYTScalcYTSexp.ΔYTS
As-built16.013546.3301.0150.0632.356468.3
A90016.0135115.375.438.1363.8393–29.2
A120016.0135100.495.623.6100.4455.043421.0
Disclaimer/Publisher’s Note: The statements, opinions and data contained in all publications are solely those of the individual author(s) and contributor(s) and not of MDPI and/or the editor(s). MDPI and/or the editor(s) disclaim responsibility for any injury to people or property resulting from any ideas, methods, instructions or products referred to in the content.

