Article

An Investigation of Heat Treatment Residual Stress of Type I, II, III for 8Cr4Mo4V Steel Bearing Ring Using FEA-CPFEM-GPA Method

1
School of Materials Science and Engineering, Harbin Institute of Technology, Harbin 150001, China
2
School of Materials Science and Engineering, Liaoning University of Technology, Jinzhou 121001, China
*
Authors to whom correspondence should be addressed.
Metals 2025, 15(5), 548; https://doi.org/10.3390/met15050548
Submission received: 8 April 2025 / Revised: 6 May 2025 / Accepted: 14 May 2025 / Published: 15 May 2025

Abstract

:
The heat treatment residual stress of 8Cr4Mo4V steel bearings seriously affects the contact fatigue life. The micro stress concentration at the carbide interface leads to the initiation of micro cracks. Therefore, in this paper, the systematic analysis of heat treatment residual stress of 8Cr4Mo4V steel is conducted. FEA was used to analyze the residual stress of type I after heat treatment process. Based on numerical simulation and EBSD results, CPFEM was carried out to study the distribution of type II residual stress. Using high-resolution characterization results, GPA was performed to study type III residual stress caused by crystal defects. The FEA results indicate that thermal strain and phase transformation strain dominate the macroscopic stress change before and after martensitic transformation. During the first tempering process, the phase transformation leads to the release of quenching residual stress. The large stress concentration at the carbide interface is revealed by CPFEM. High-resolution characterization of coherent interface between carbide and matrix reveals that the micro residual strain at this interface is small. Through a systematic analysis of the residual stress of 8Cr4Mo4V steel, a basis is provided for modifying the macroscopic and microscopic residual stress of heat treatment to improve the bearing performance.

1. Introduction

As a second-generation bearing steel [1,2,3], 8Cr4Mo4V steel has excellent strength and toughness [4,5,6] and is widely used in the preparation of engine main shaft bearings [7,8,9,10,11]. However, the main failure forms of bearings under rolling contact fatigue are subsurface cracking and spalling [12]. The contact load causes micro cracks, leading to failure to initiate at the interfaces of carbides and inclusions in the subsurface [13]. The difference in mechanical properties between the second phase and the matrix in the bearing steel leads to the generation of micro stress concentration at these interfaces. The local micro stress will induce local plastic deformation, causing micro cracks to form and expand towards the surface. To date, there have been many studies on the detailed analysis of bearing failure caused by primary carbides in the bearing subsurface. The formation of white etched cracks (WEAs) at the carbide interfaces in the subsurface layer is the main cause of bearing failure [14,15,16,17,18]. Peel [19] studied the influence of the micro structural characteristics of carbides on the steel matrix during the formation of WEAs through multiscale finite element simulation and found that carbides can cause severe local plastic deformation, leading to the formation of WEAs. Li et al. [20] found that there were nanocrystallization and amorphization in the subsurface white etched area of AISI 52100 steel during the rolling contact fatigue process, resulting in microstructure changes. Hou et al. [12] proposed that the formation mechanism of WEAs was a phase transformation driven by the accumulation of high-stress-induced plastic deformation in the micro region. Therefore, carbides seriously affect the contact fatigue life of bearings. To improve the service life of bearings, attention should also be paid to the primary carbides in the bearing steel, especially in the subsurface layer of the bearing loading area.
In addition to the microstructure in bearing steel, residual stress is also a key factor affecting the service life of bearings [10,21,22,23]. Li et al. [24] studied the influence of dented residual stress on damage evolution under cyclic rolling contact loading through finite element simulation and found that the presence of residual stress advanced the initiation of subsurface damage. Guan et al. [25] studied the influence of residual stress in M50 bearing steel on the damage evolution induced by carbides and found that higher temperatures were beneficial for strengthening the residual stress and reducing the damage accumulation rate. Residual stress can be classified into three types according to scale [26]. After the external load is removed, the long-range stress on the macroscopic scale is the residual stress of type I (σI). The residual stress within the grain scale is the residual stress of type II (σII), which represents the degree of difference from the macroscopic trend of σI. The residual stress of type III (σIII) is caused by crystal defects such as dislocations and vacancies, representing the intracrystalline deviation between the nanoscale stress and the average grain level. The initiation of micro cracks at the carbide interface is related to σII and σIII. Therefore, studying the micro stress at the carbide interface is beneficial for improving the service life of bearings.
Heat treatment is an important process to improve the mechanical properties of bearing steel. However, thermal strain and phase transformation lead to the generation of residual stress in bearing steel after heat treatment. Moreover, carbides in the subsurface layer of the bearing can cause nonuniform distribution of residual stress. The residual stress of type I in bearing heat treatment is long-range stress. Its testing and evaluation methods are relatively mature. The type I residual stress of heat treatment can also be predicted by numerical simulation methods. Wang et al. [27] studied the change in residual stress during the quenching process of M50 steel through finite element numerical simulation. Akbarzadeh et al. [28] investigated the post-weld heat treatment parameters on the relaxation of welding residual stresses through numerical study. G. Carro et al. [29] simulated the change in quenching stress of aluminum alloy cylinders and verified the effectiveness of the simulation results by X-ray diffraction analysis. However, the evaluation of type II and type III residual stresses still needs further research. Electron backscatter diffraction is a powerful method for determining lattice strain, with a resolution ranging from the submicron scale to the nanometer scale [30]. The EBSD results are used to analyze the lattice orientation difference to obtain the stress change at the grain scale [31]. A semi-destructive method combining a nanoscale focused ion beam (FIB) and ring core milling with digital image correlation (DIC) can calculate the residual stress through the released residual strain, realizing the quantitative analysis of the residual stress of type II [32]. Geometric phase analysis can be used for the analysis of the residual stress of type III, and the stress distribution at the grain scale can be obtained by analyzing the lattice distortion [33]. Wang et al. [34] used the geometric phase analysis method to analyze the surface morphology of carbon-fiber-reinforced epoxy matrix composites and found that there was an obvious radial strain near the interface.
Carbides in the subsurface layer of the bearing greatly affect the uniformity of the heat treatment micro stress, causing micro stress concentration at the carbide interface, which leads to the initiation of WEAs. In order to improve the service life of the bearing, it is necessary to evaluate the heat treatment micro residual stress to guide the improvement of the bearing heat treatment process. At present, there is a lack of research on the micro residual stress in the heat treatment of bearing steel. Therefore, in this paper, a finite element numerical simulation is used to simulate the heat treatment process and analyze the change in the macroscopic residual stress. Combining the residual stress of type I of heat treatment with crystal plasticity simulation, the residual stress type II of heat treatment is analyzed. High-resolution transmission characterization is carried out on the quenched martensite, tempered martensite and carbide interface of 8Cr4Mo4V bearing steel, and geometric phase analysis is used to study the residual stress of type III of heat treatment. Through the systematic analysis of the heat treatment residual stress of 8Cr4Mo4V steel bearing rings, subsequent heat treatment process optimization work can be guided.

2. Materials and Methods

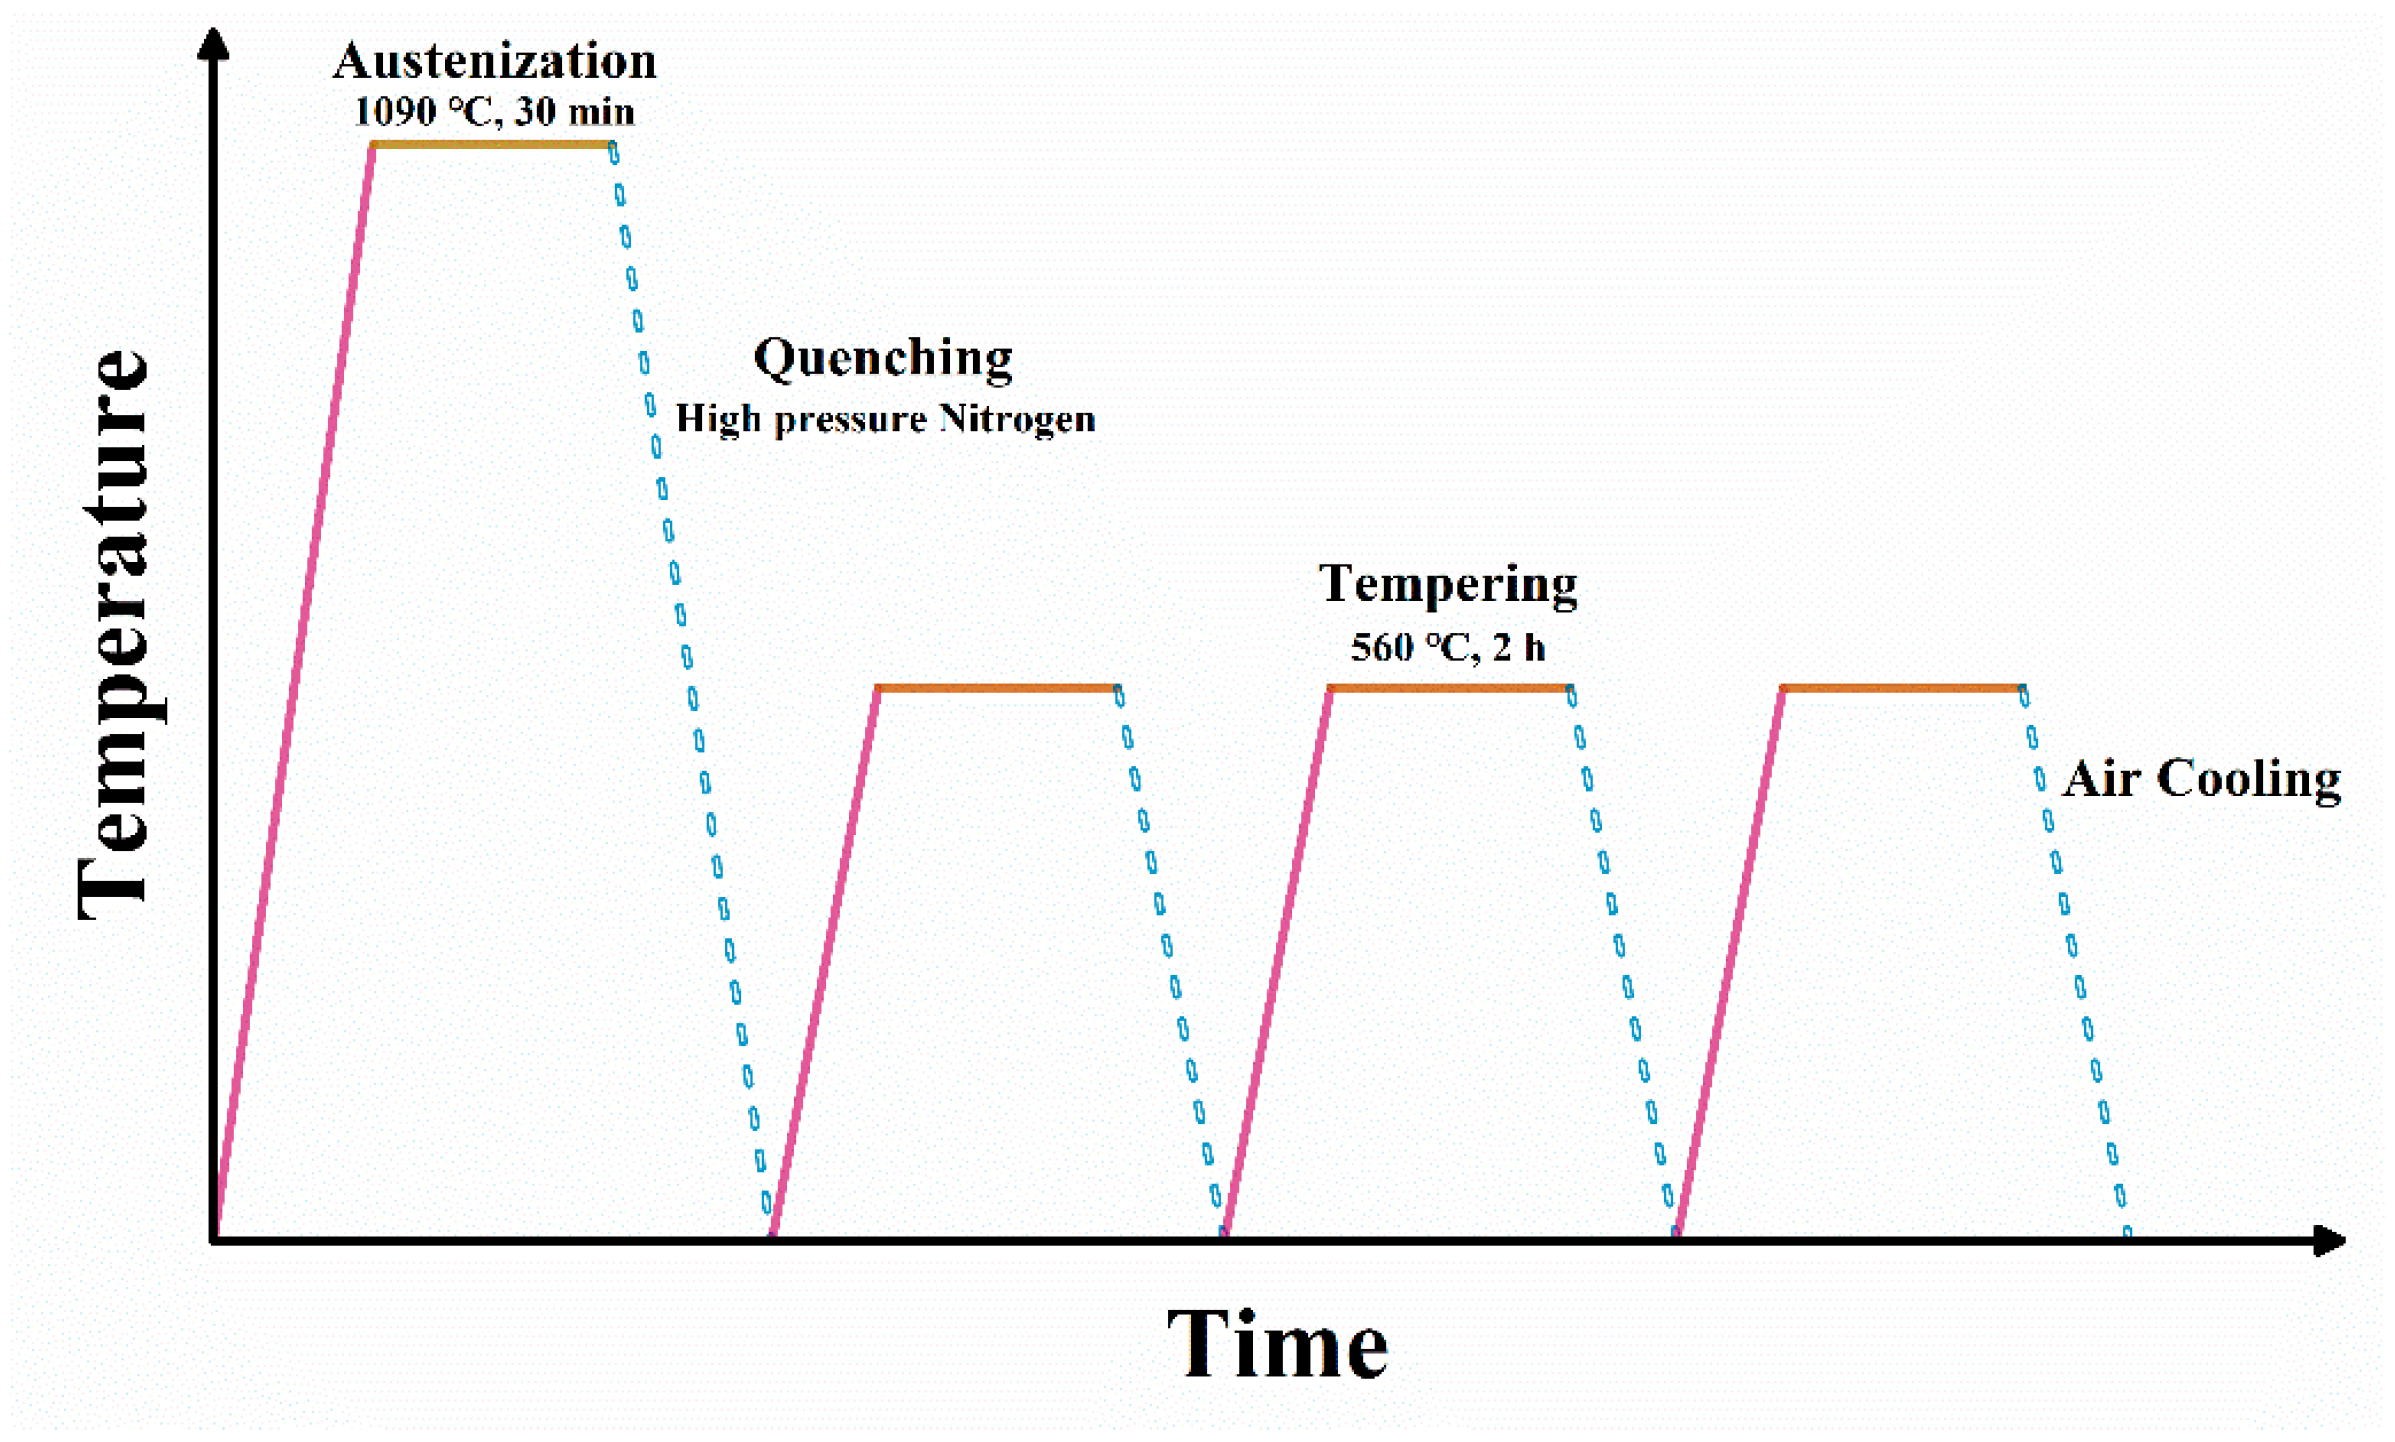
2.1. Materials and Heat Treatment

The general chemical composition of 8Cr4Mo4V steel is listed in Table 1. The initial state of this steel is annealed. To analyze the residual stress after heat treatment, the temperature–time curve shown in Figure 1 was used for processing. The 8Cr4Mo4V steel is heated to 1090 °C for austenitization and then cooled with high-pressure nitrogen. The tempering temperature for three times of tempering is 560 °C, the tempering time is 2 h, and the cooling method is air cooling. The specimens for microstructure characterization were processed by wire cut electrical discharge machining (WEDM). A finite element model was established using the microstructure after heat treatment to analyze the type II residual stress. In previous study [35], the type I residual stress of the bearing ring after tempering was tested to verify the results of the finite element simulation. In this study, the analysis of the residual stress after each process was completed through finite element numerical simulation.

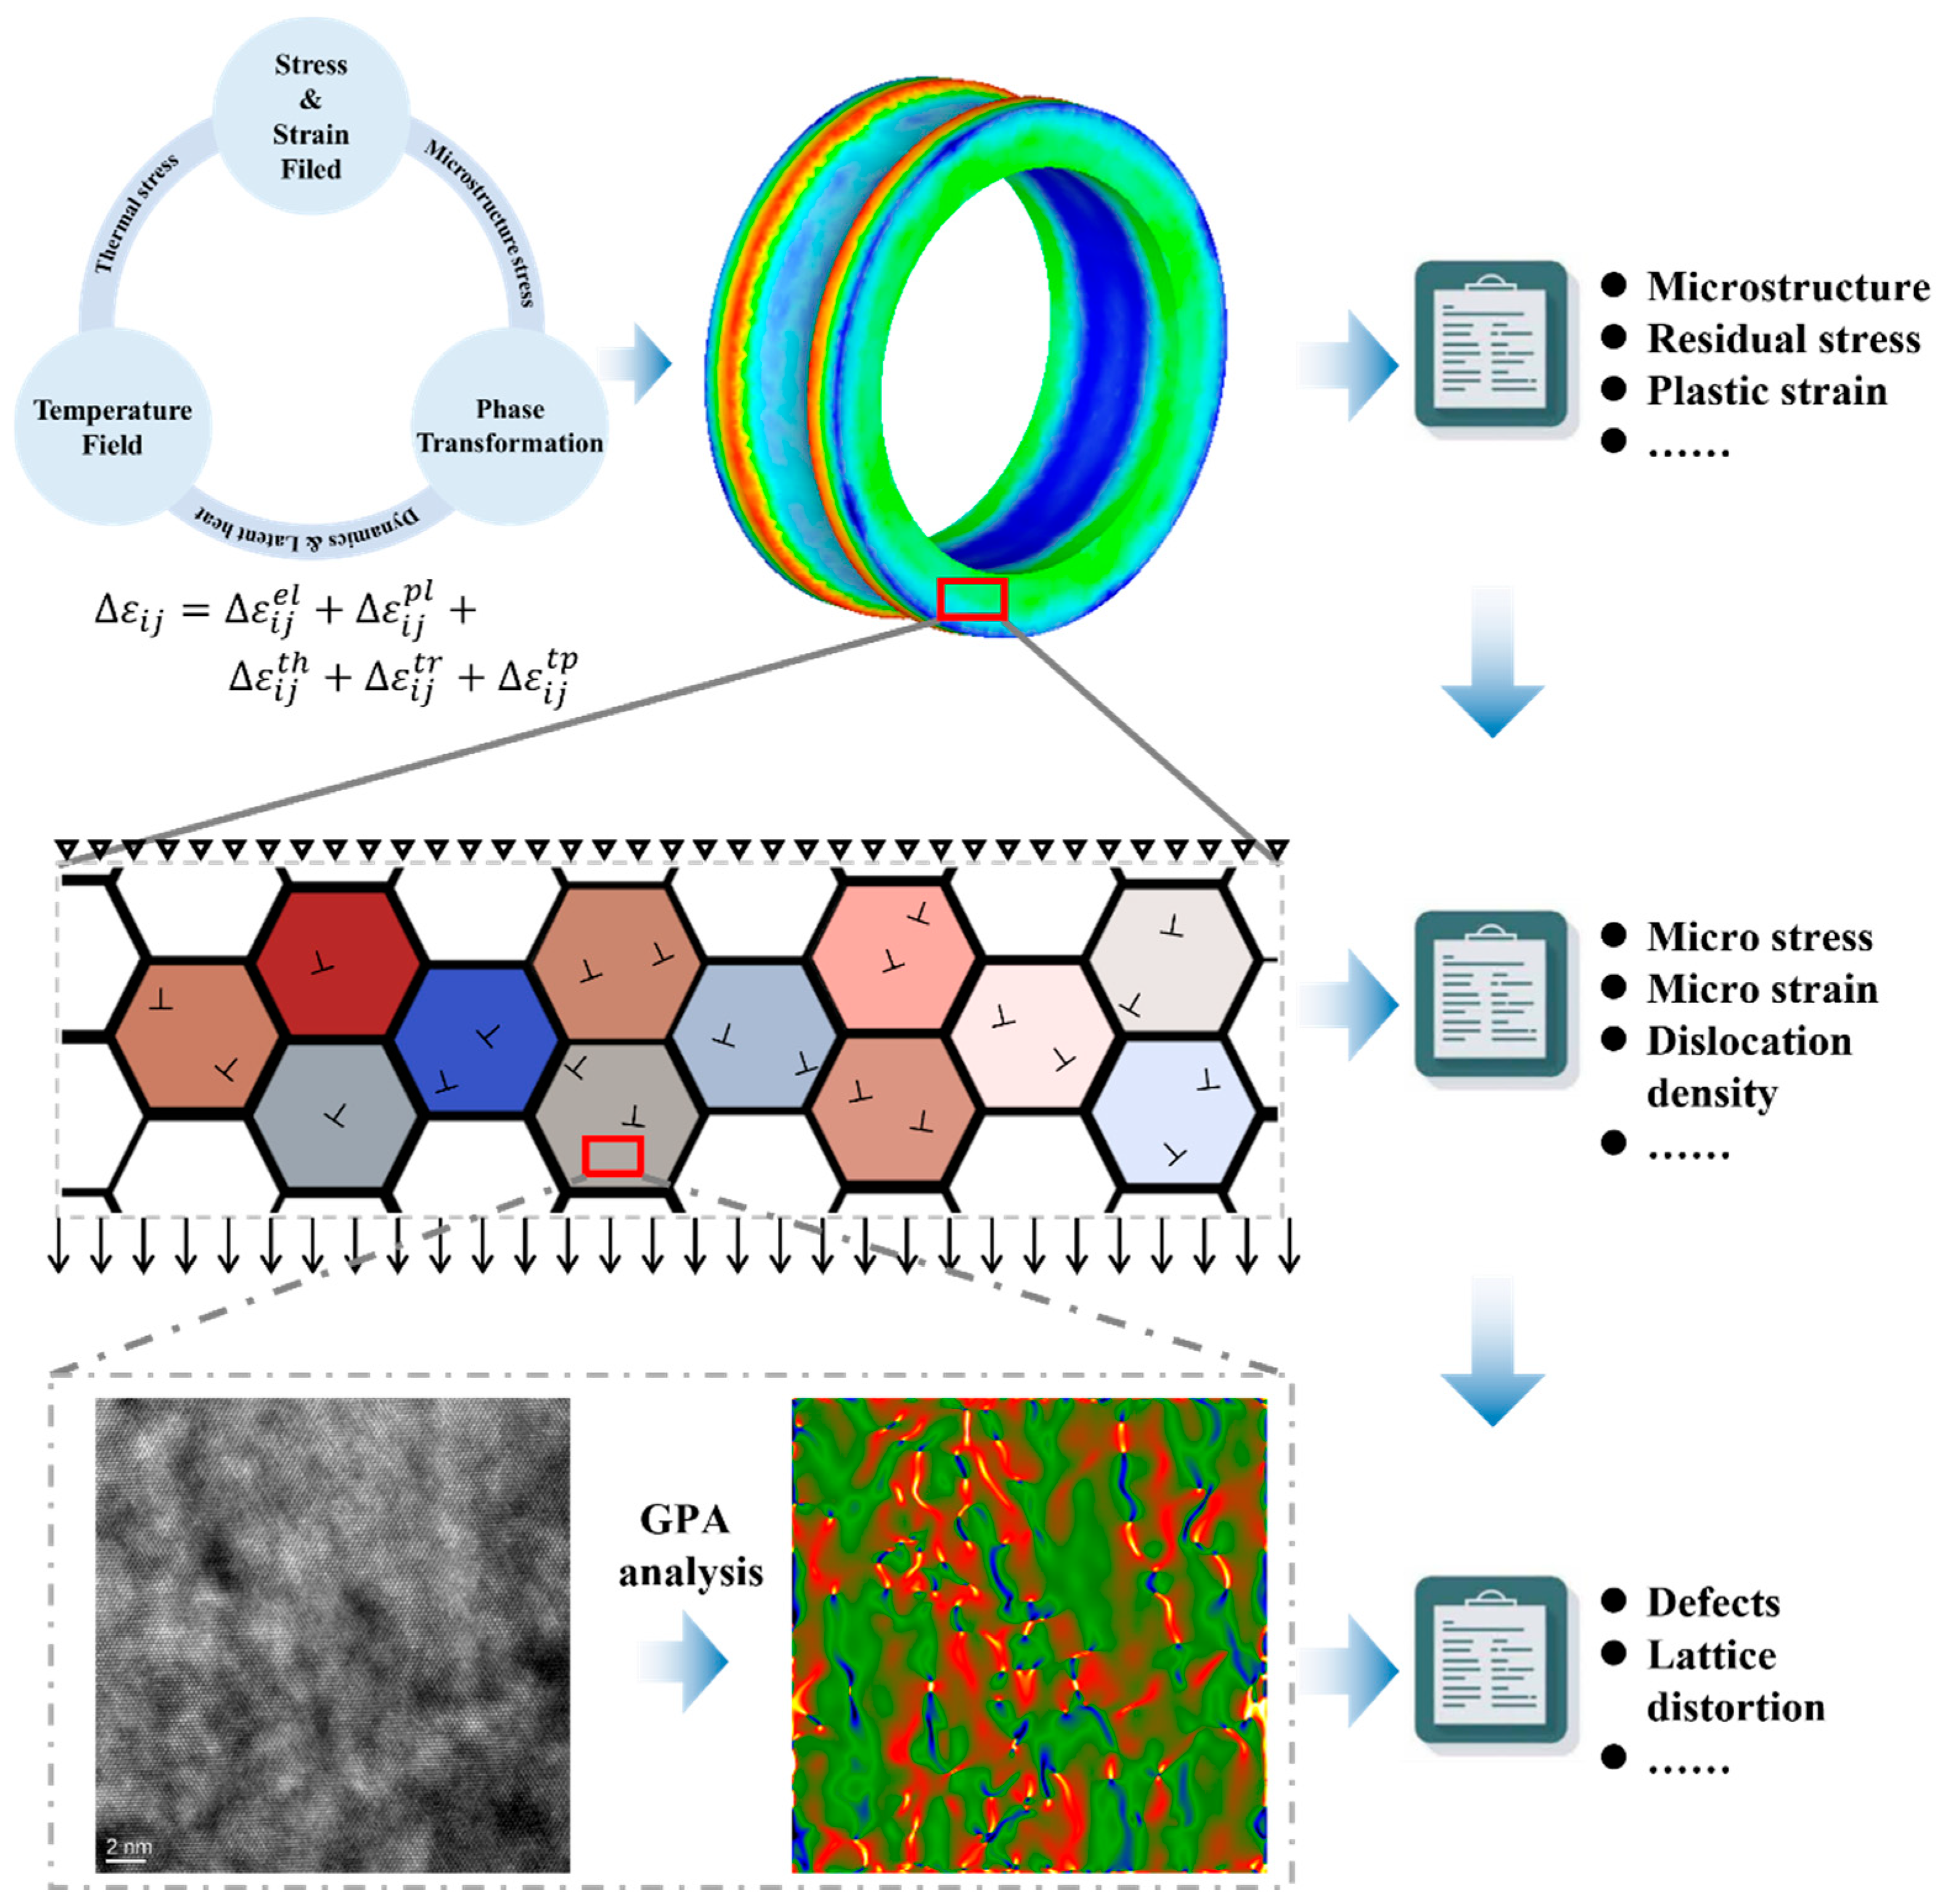
2.2. Numerical Simulation Method

The three types of residual stresses in the bearing rings after heat treatment involve different scales, and simulation and characterization methods at different scales need to be used for analysis. The residual stress of type I of the bearing ring is obtained by the heat treatment numerical simulation method. To analyze the residual stress of type II within the range of multiple grains, a crystal plasticity simulation is carried out, and the residual stress of type I is used as the boundary condition for the analysis of the residual stress of type II. The GPA method is used to analyze the residual stress of type III in one grain caused by defects. The research process of this paper is shown in Figure 2.

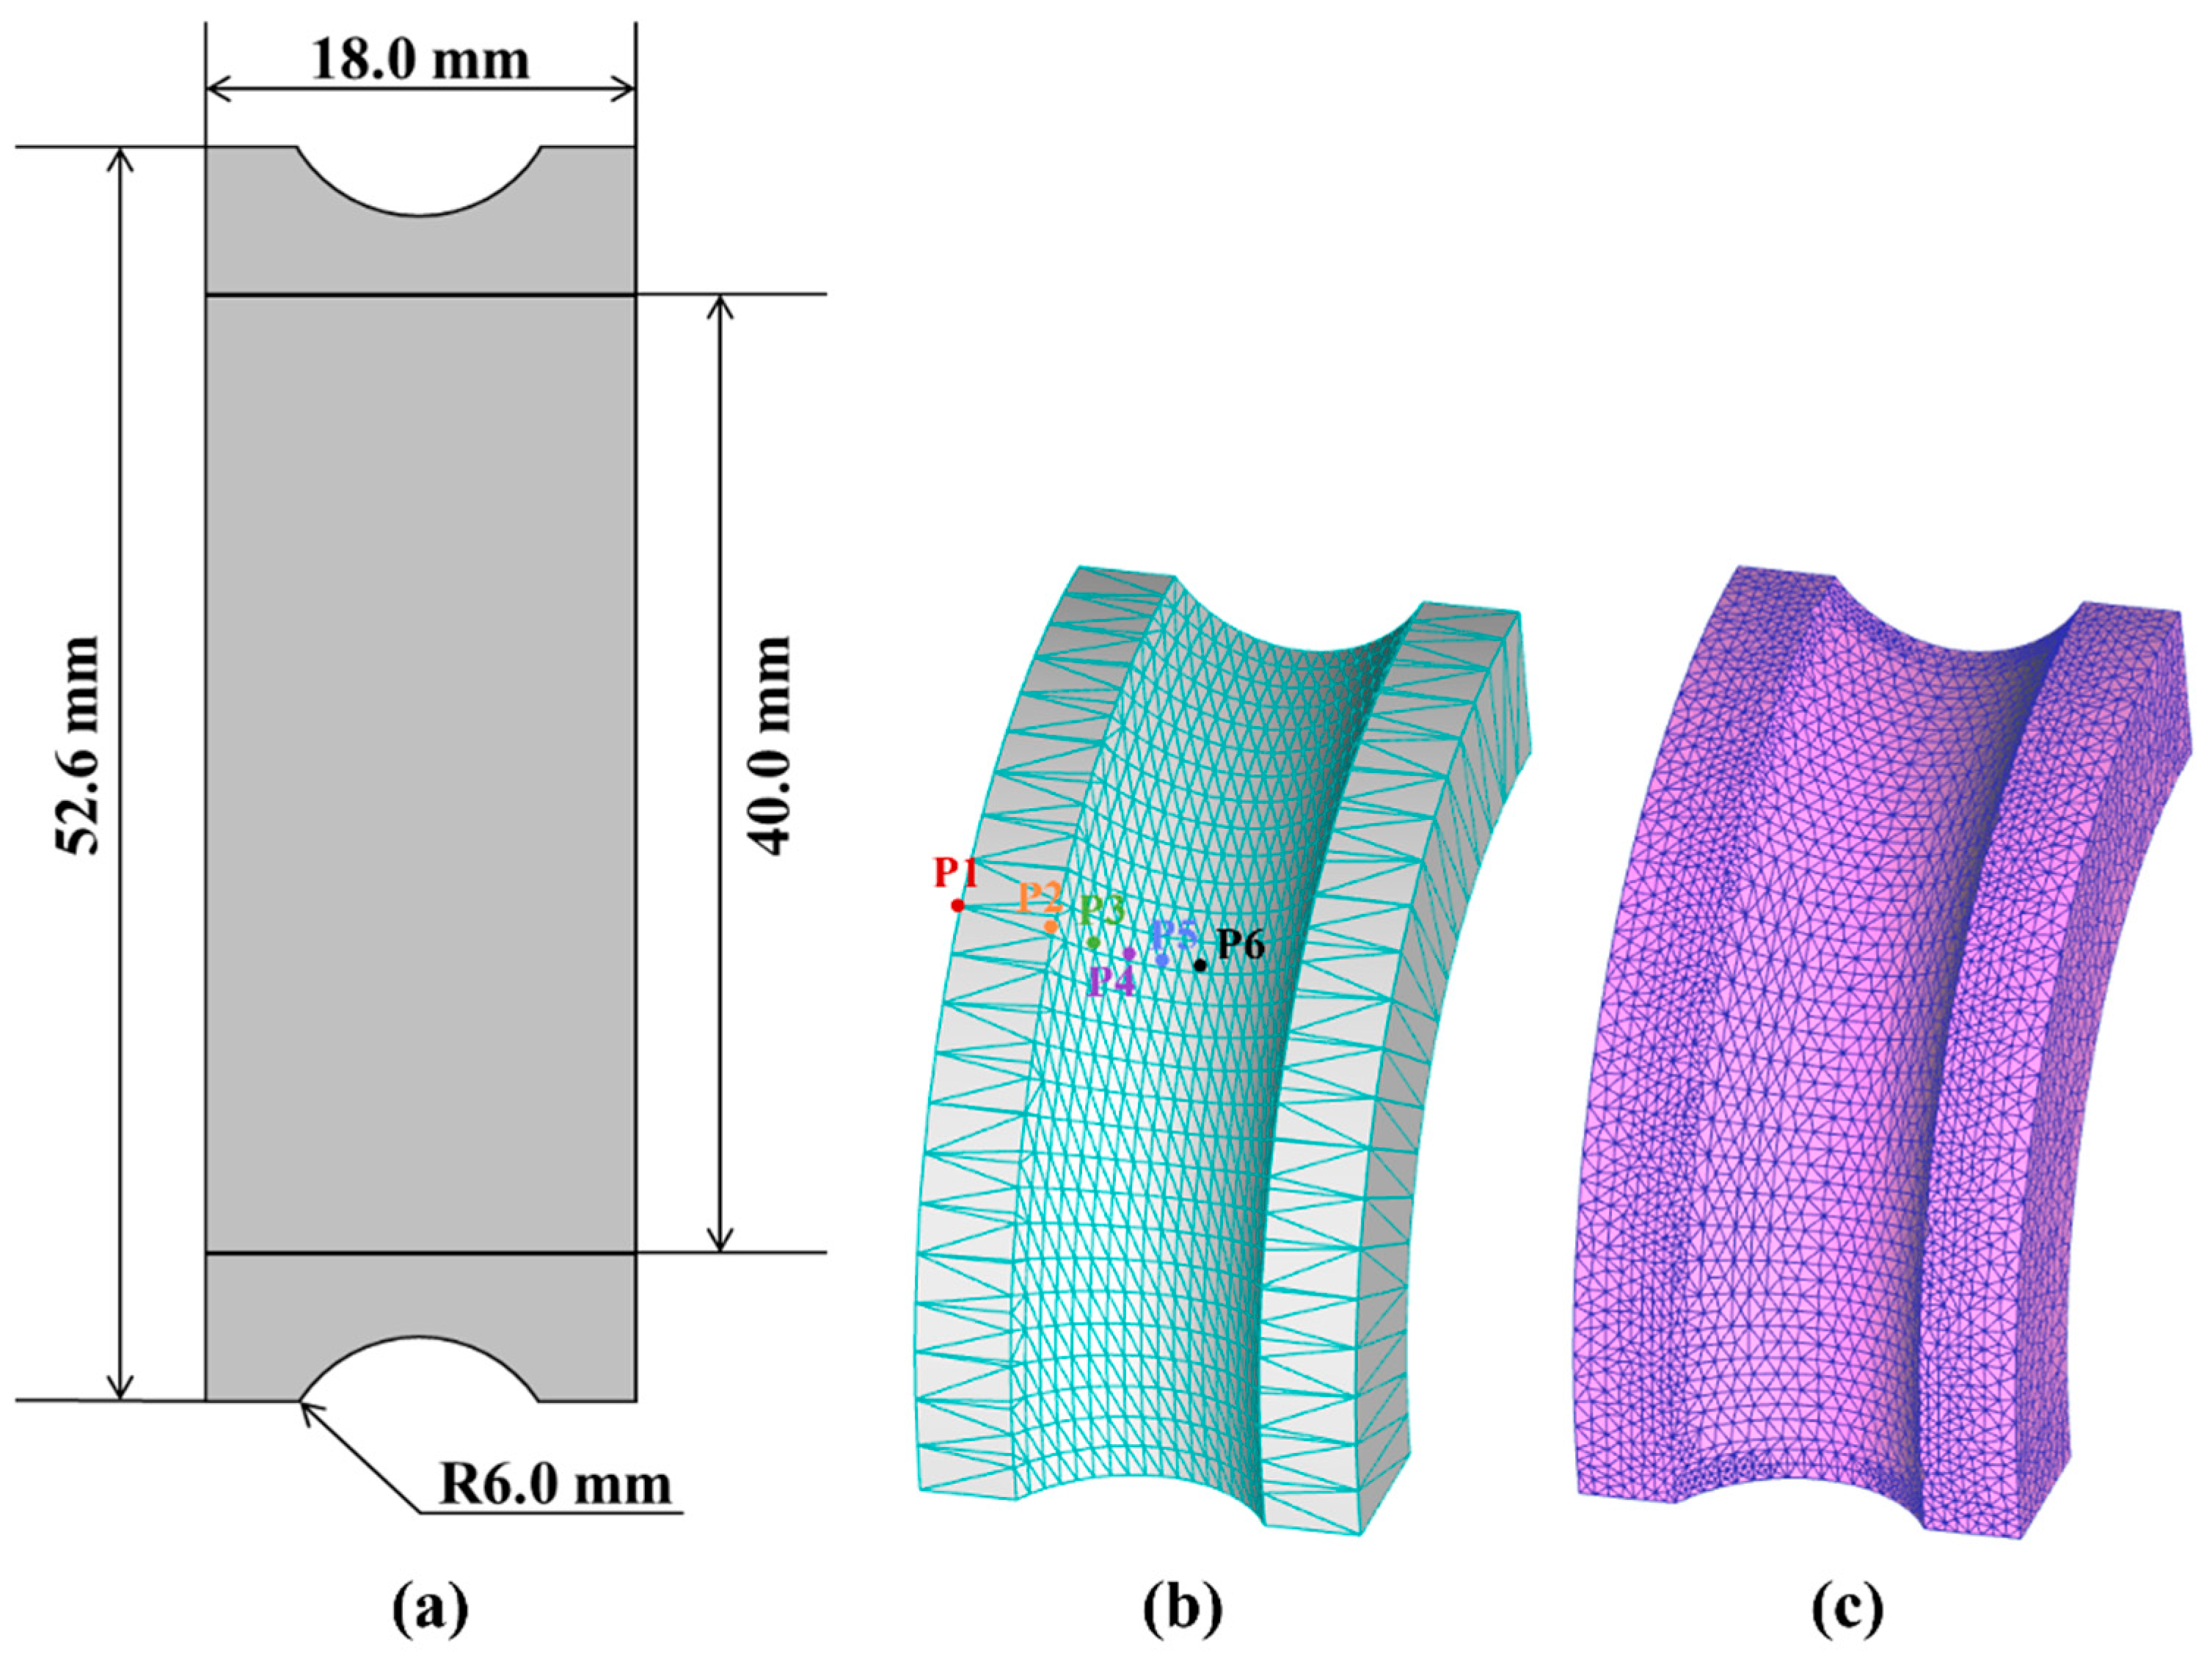
2.2.1. Finite Element Analysis

The numerical simulation of the heat treatment process is a complex nonlinear problem, which requires considering the co-evolution and mutual influence of the temperature field, microstructure field, and stress field. Temperature changes will cause volume expansion/contraction at the element nodes. That is the thermal strain ( ε i j t h ). Another effect of temperature change is phase transformation. The difference in lattice constants between different microstructures will lead to the generation of microstructure stress ( ε i j t r ). In addition, microstructure transformation will result in the generation of plastic strain below the yield strength, namely, phase-transformation plasticity ( ε i j t p ). Therefore, the total strain within an incremental step can be written as follows:
ε i j = ε i j e l + ε i j p l + ε i j t h + ε i j t r + ε i j t p ,
where ε i j e l is the elastic strain, and ε i j p l is the plastic strain. The thermal strain increment at the element nodes is calculated based on the content of a single phase and the increase in the thermal strain of the phase. The calculation formula of thermal strain increment [36] is as follows:
Δ ε i j t h = δ i j k = 1 l   φ k ε k T + Δ T ε k T ,
where φ k is the content of the phase k and δ i j is the Kronecker delta symbol, which is used to describe the isotropy, and l is the number of phases.
In a previous study [35], the continuous-cooling transformation curve (CCT curve) of 8Cr4Mo4V steel was calculated. It is considered that only martensitic transformation occurs during nitrogen quenching, and the tempered martensite transformation occurs during tempering process. The increment in microstructure strain is related to the amount of microstructure transformation, and its calculation equation [36] is similar to Equation (2):
Δ ε i j t r = δ i j k = 2 l   Δ φ k ε k T + Δ T ε 1 T + Δ T ,
where Δ φ k is the amount of microstructure transformation for phase k.
The increment in phase-transformation plasticity strain is different from thermal strain and microstructure strain. Obviously, it is anisotropic, and the calculation equation is as follows:
Δ ε i j t p = 1.5 K σ e q f φ s i j φ ,
where K σ e q is the phase-transformation plasticity coefficient, which is related to the equivalent stress. The value range of K σ e q is 5~10 × 10−5 MPa−1. f φ represents the first-order derivative of the normalization function and has various forms. s i j denotes the deviatoric stress tensor, and ∆φ is the amount of microstructure transformation.
After obtaining the increments of each strain, plasticity assessment and plastic correction are still required to determine the stress at the element nodes. Hardening occurs after plastic deformation. The yield strength of 8Cr4Mo4V steel under different plastic strains is obtained by interpolating the flow curves of each phase. The flow curves of each phase can be found in [35].
The phase transformation process includes martensitic transformation and tempered martensitic transformation during the entire heat treatment process. The kinetics of martensitic transformation is calculated by the K-M equation [37]:
f = 1 exp [ α ( M s T ) ] ,
where Ms is the martensitic transformation start temperature. The Ms of 8Cr4Mo4V steel is 172.3 °C. α is a constant related to the material, and equal to 0.011 in this study.
The process of tempered martensitic transformation is related to temperature and holding time. The kinetics can be calculated by the JMAK equation [38]:
φ = 1 e x p t τ ( T ) n ( T ) ,
where both the incubation period τ(T) and the exponential factor n(T) of the isothermal transformation are temperature-dependent. In a previous study [35], the kinetic curve of the tempered martensite transformation after quenching was obtained through thermophysical simulation. This result was used to calculate the transformation amount of tempered martensite.
The calculation of the stress field and the microstructure field requires the use of nodal temperatures. The evolution of the temperature field is described by Fourier’s unsteady state heat transfer equation:
x λ T x + y λ T y + z λ T z + Q = ρ C p T t ,
where λ is the thermal conductivity, Q is the latent heat of phase transformation, and Cp is the heat capacity. The calculation equation for the latent heat of phase transformation per unit time is as follows:
Q ˙ = k = 1 2   Δ H k φ ˙ k ,
where ΔHk is the enthalpy of phase transformation, and φ ˙ k is the amount of microstructure transformation per unit time.
Solving the Fourier equation also requires the initial conditions and boundary conditions. The initial temperature of the bearing ring is 20 °C. During the heat treatment process of the bearing ring, the heat transfer equation between the surface and the medium is as follows:
k T n | s = H k ( T T f ) + σ ε ( T 4 T f 4 ) = H k ( T T f ) + H s ( T 4 T f 4 ) = H ( T T f ) ,
where Hk is the convective heat transfer coefficient, and Hs is the radiative heat transfer coefficient. The heat transfer coefficient of nitrogen obtained by Wang [27] through inverse heat transfer analysis is used to analyze the change in the quenching temperature field of the 8Cr4Mo4V steel bearing ring, and the heat transfer coefficient during the heating process is set to 0.01 W/(°C × m2).
The thermophysical parameters required for the numerical solution of the temperature field are calculated by the linear mixing rule:
P ( T ) = k = 1 3   φ k P k ,
where φ k is the phase content of phase k at the node, and P k is the thermophysical parameter of phase k. The thermophysical parameters of each phase can also be obtained from the literature [35].
In this study, the heat treatment process of the bearing ring is simulated using Deform 3D software. A 1/4 bearing ring model is established according to the dimensions of the 208 bearing and imported into the finite element software for adaptive mesh generation. The meshing result is shown in Figure 3. Six characteristic points (P1~P6) are marked on the shoulder and raceway of the bearing ring to analyze the heat treatment simulation results.

2.2.2. Crystal Plasticity Finite Element Analysis

The crystal plasticity finite element numerical simulation adopts an anisotropic phenomenological constitutive model in Damask software (version 2.0) [39]. For the anisotropic phenomenological constitutive model, the total deformation gradient of polycrystals can be divided into two parts: elastic deformation and plastic deformation [40]:
F = F e F p ,
where F e is the elastic deformation gradient and F p is the plastic deformation gradient.
The elastic part needs to be calculated using elastic constants. Both martensite and austenite in 8Cr4Mo4V steel have a cubic structure, and their elastic constants C11, C12, C44 can be determined by the elastic modulus, shear modulus, and Poisson’s ratio:
C 11 = E ( 1 v 2 ) 1 3 v 2 2 v 3 ,
C 12 = E ( v + v 2 ) 1 3 v 2 2 v 3 ,
C 44 = G = E 2 ( 1 + v ) ,
The elastic modulus of each phase was obtained through nanoindentation tests in previous studies [41], and the Poisson’s ratio is set to 0.3.
In the crystal plasticity of the anisotropic phenomenological constitutive model, it is considered that plastic deformation is the result of dislocation slip. The plastic deformation velocity gradient can be expressed as the sum of the shear rates on all slip systems [7,8]:
L p = α = 1 i γ ˙ α m α n α ,
where γ ˙ α is the shear strain rate of slip system α, m α is the dislocation slip direction, n α is the normal direction of the slip plane, and i is the number of slip systems.
The phenomenological constitutive model uses the critical resolved shear stress ( g ˙ α ) as the state variable of the slip system. The shear strain rate can be expressed as a function of the resolved shear stress ( τ α ) of the slip system and the critical resolved shear stress:
γ ˙ α = f τ α , g ˙ α ,
According to Schmid’s law, the dislocation slip resistance is related to the resolved shear stress and shear strain rate of the slip system. On each slip system, the shear strain rate generated by dislocation motion satisfies a power law relationship with the resolved shear stress and the critical resolved shear stress [42]:
γ ˙ α = γ ˙ 0 τ α g ˙ α 1 / n s g n τ α ,
where m is the slip rate sensitivity index. The influence of other slip system on the hardening behavior [41] of the fixed slip system α is given by:
g ˙ α = β = 1 n   h α β | γ ˙ β | ,
where h α β is the hardening matrix to describe the interaction between two slip systems and can be written as follows:
h α β = q α β h 0 1 g ˙ β τ β a ,
where h 0 and a are the slip hardening parameters and qαβ is a latent hardening parameter, and its value is taken as 1 in this paper.
In the power law relationship above, these microscopic parameters are difficult to obtain through experiments. In this study, these were obtained by establishing a polycrystalline model, assigning random orientations to each grain, setting the values of microscopic parameters, and simulating the uniaxial tensile behavior. When the simulated data are consistent with the experimental data, the obtained parameter values are used in the crystal plasticity finite element simulation to obtain the microscopic stress distribution.
In order to establish a finite element model using the results of real microstructure characterization to simulate the microscopic stress distribution of the real microstructure morphology and grain orientation under different macroscopic residual stress states, we used Dream 3D [43] to process the microstructure characterization results.

2.3. Microstructure Characterization

To establish a crystal plasticity finite element model using real microstructure morphology and orientation information, the specimens after heat treatment were ground and electrolytically polished, and electron backscatter diffraction (EBSD) analysis was carried out using the Quanta 200FEG field emission scanning electron microscope (FEI Company, Hillsboro, OR, USA). The Dream 3D software (version 6.5) was used to process the EBSD data. To analyze the type III residual stress and the lattice mismatch stress between carbides and the matrix, the Tecnai G2 F20 transmission electron microscope (TEM) (FEI Company, OR, USA) equipped with the energy-dispersive spectrometer (EDS) was used to characterize the specimens after ion thinning.

2.4. Geometric Phase Analysis

Geometric phase analysis (GPA) is a high-precision characterization technique for strain fields and displacement fields based on high-resolution transmission electron microscope (HRTEM) images [44,45]. The image is transformed into reciprocal space through Fast Fourier Transform (FFT). Noncollinear reciprocal vectors g and g corresponding to specific crystal planes are selected, and the information of the corresponding crystal planes is extracted by filtering. Then, an Inverse Fast Fourier Transform (IFFT) is performed to obtain a real space phase diagram after filtering. The filtered phase diagram contains information on lattice distortion. For the reciprocal vector g , the relationship between the phase of the filtered image and the local displacement field is as follows:
P g r = 2 π g · u r ,
where g is the reciprocal vector, and u(r) is the lattice displacement at position r. By selecting two noncollinear reciprocal vectors g and g , a two-dimensional displacement field can be constructed:
u r = 1 2 π P g 1 r a 1 + P g 2 r a 2 ,
where a and a are the real space basis vectors corresponding to g 1 and g 2. By performing a spatial differentiation on the displacement field u(r), the strain tensor ε and the rotation component ω can be obtained:
ε i j = 1 2 u i x j + u j x i ,
ω x y = 1 2 u y x u x y ,
where ε characterizes the normal and shear strains of the lattice, and ω describes the rotational distortion between crystal planes.

3. Results and Discussion

3.1. Numerical Simulation Results Analysis

3.1.1. Macroscopic Stress Evolution During Quenching

The martensite content and stress distribution in the 8Cr4Mo4V steel bearing ring after quenching are shown in Figure 4. After quenching, the martensite content in the bearing ring is 78.8%, which is close to the experimental test result (82.2%) [35]. Since the martensite transformation kinetics during simulation is only related to the temperature of the cooling medium, which is different from the actual martensite transformation process, the martensite content is uniform throughout the ring. Figure 4b shows the effective stress distribution after quenching. The maximum effective stress of the bearing ring was 1690 MPa. Figure 4c shows the distribution of circumference stress of the ring after quenching. The raceway is under tensile stress, and the shoulder is under compressive stress. The raceway, as the loading area of bearing, is the main part where failure occurs. Large tensile stress can seriously damage service life. Therefore, tempering treatment must be carried out to reduce the retained austenite content and quenching residual stress and improve the bearing performance.
To analyze the stress evolution process during the quenching of the bearing ring, the data of the temperature field, microstructure field, and stress field at characteristic positions on the shoulder and the loading area of bearing were obtained. Figure 4d shows the change curves of temperature and martensite content at six characteristic positions. Although the cooling rate of nitrogen quenching is relatively fast, there are differences in the cooling rates at different positions on the bearing ring. P1 is located on the edge of the bearing ring shoulder, where the heat flux density is the largest and the heat transfer with other positions is the fastest; so, the temperature drops the fastest. During the quenching process, the differences in temperature change lead to differences in thermal strain and microstructure strain on the bearing ring. Figure 4d also shows the change curves of effective stress at six characteristic positions. Although there are differences in the value of effective stress at these positions, the change trends of effective stress during the quenching process remain the same. This indicates that the reasons for stress changes are the same. Figure 4e shows the change curves of temperature, martensite content, and circumferential stress at P1. At the beginning of quenching, the temperature is higher than Ms, no microstructure transformation occurs, and the microstructure stress is zero. Since cooling here is the fastest, volume contraction occurs, resulting in the generation of tensile stress. As the temperature of the shoulder decreases, the thermal strain of the shoulder increases, causing the tensile stress at P1 to decrease. When the temperature drops below Ms, martensite transformation occurs. The difference in lattice constants between martensite and austenite leads to volume expansion, and the tensile stress rapidly changes to compressive stress. Similarly, after martensite transformation occurs in the shoulder, the compressive stress begins to decrease. The stress change at P1 indicates that thermal stress and microstructure stress are the main reasons for the stress change before and after martensite transformation [27].

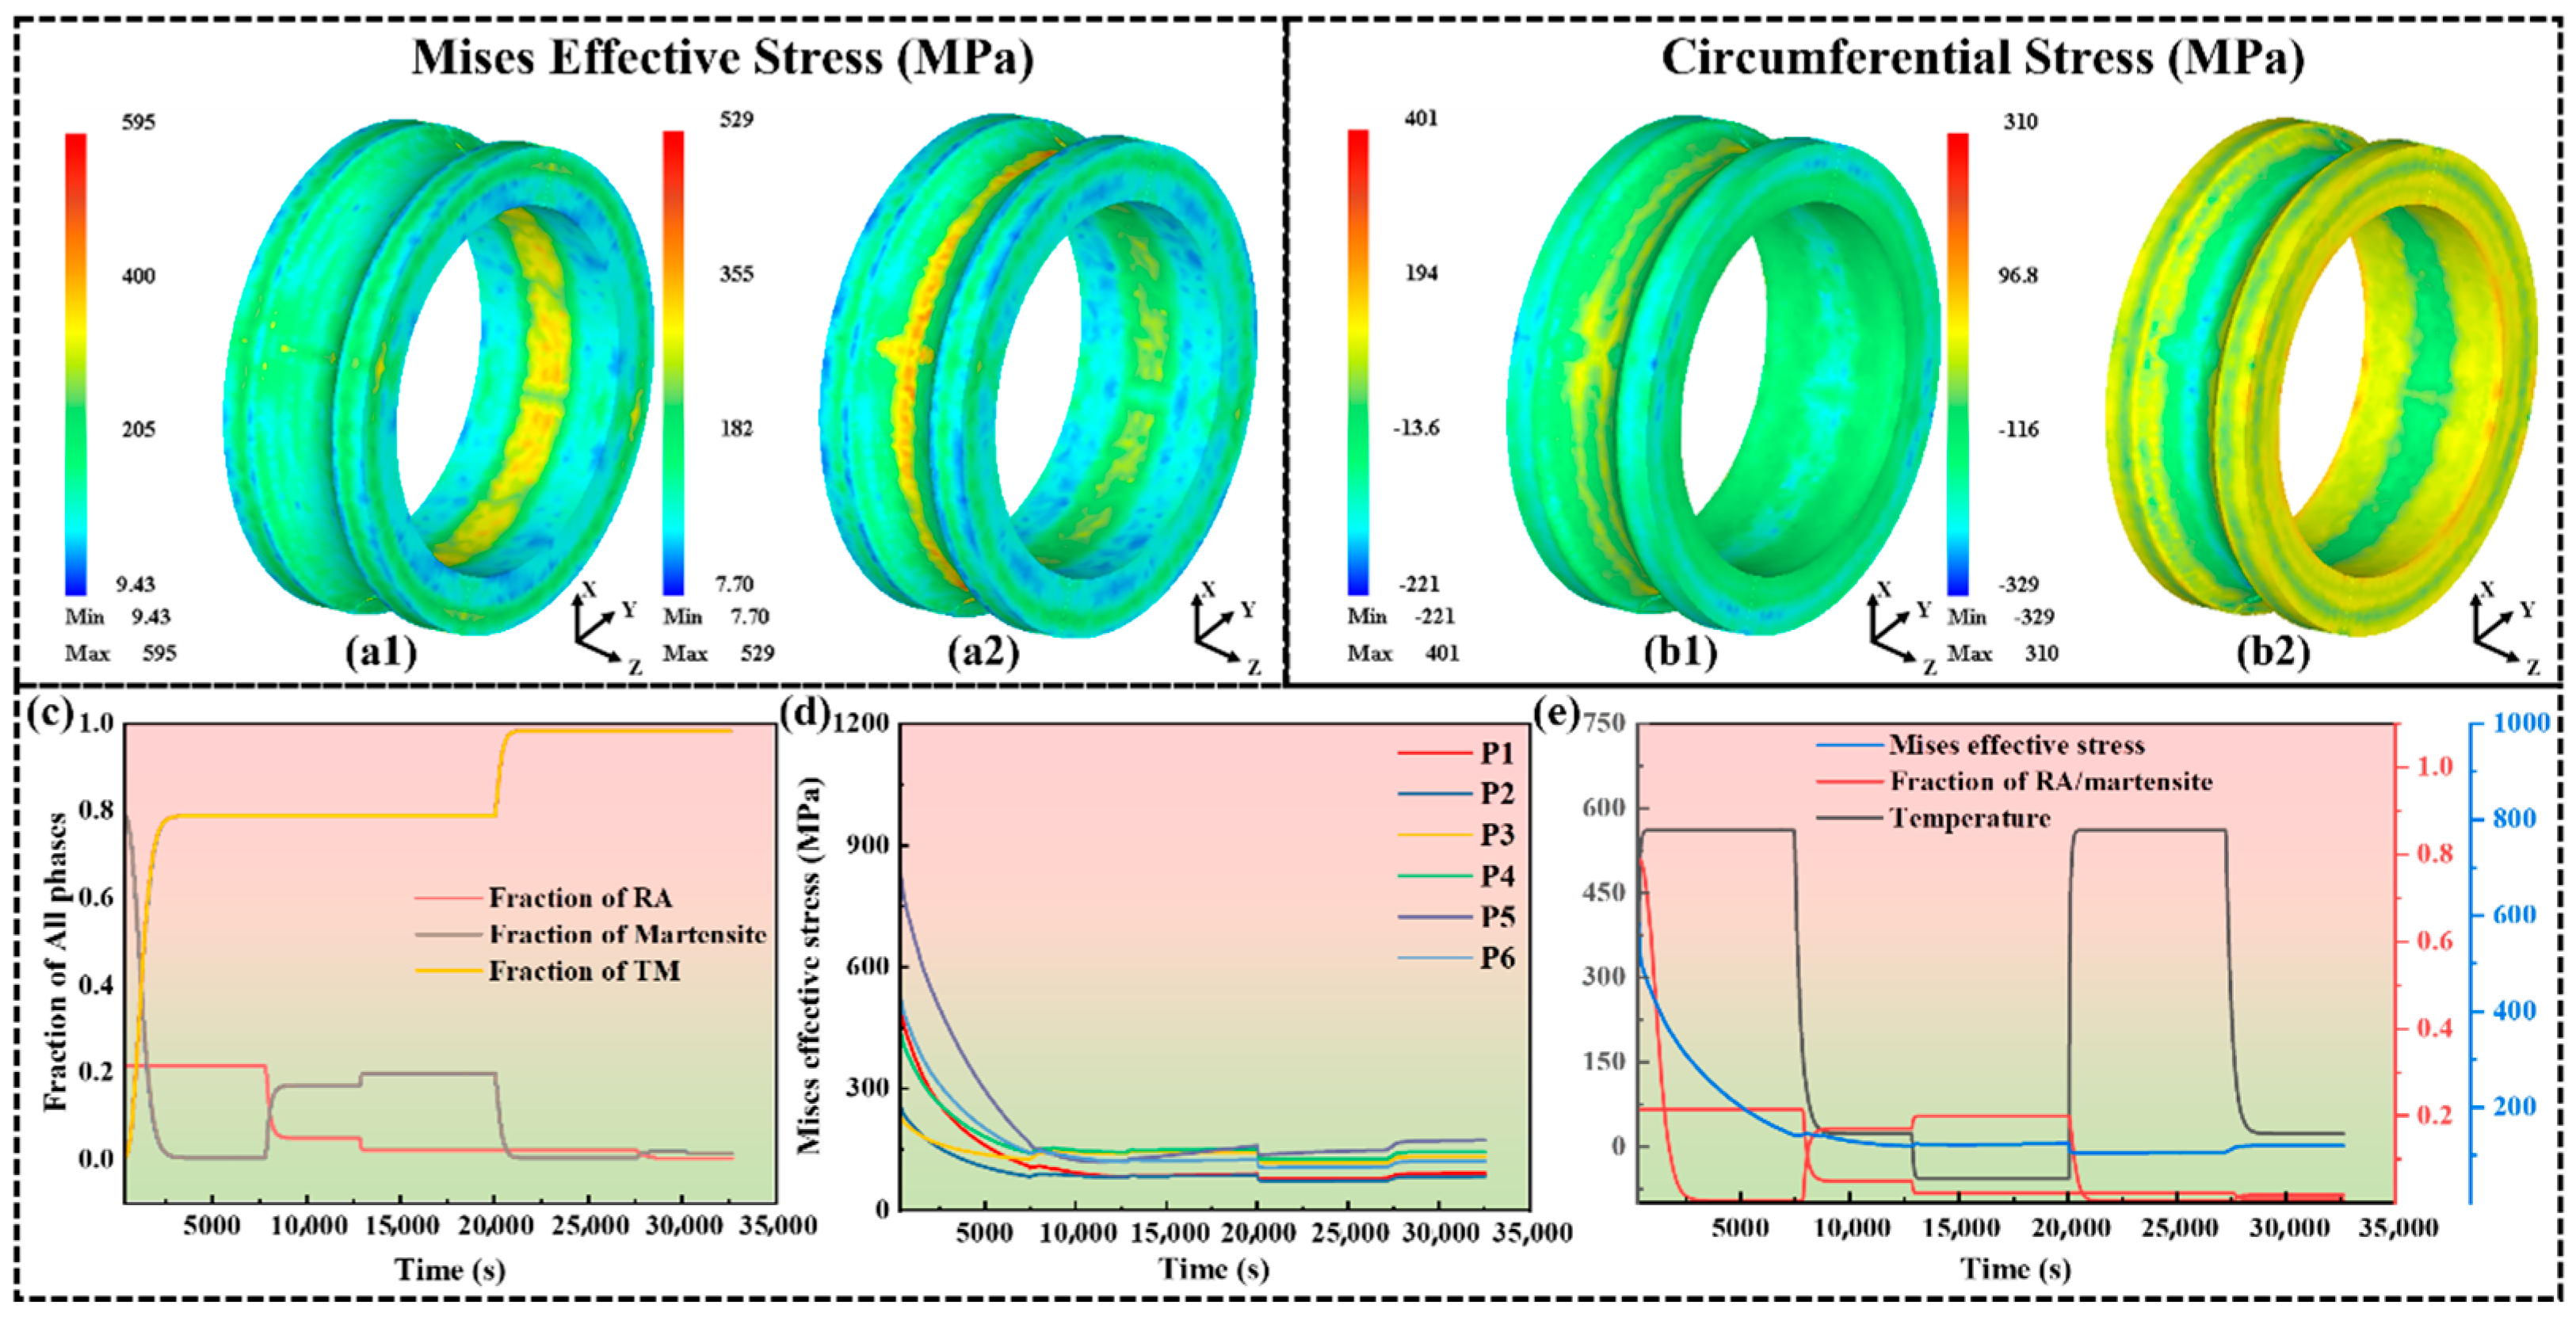
3.1.2. Macroscopic Stress Evolution During Tempering

The numerical simulation results of two times of tempering are shown in Figure 5. Since the retained austenite content after quenching reaches 21.2%, to reduce the retained austenite content, a cryogenic process was added after the first tempering process. Figure 5(a1,a2) shows the Mises effective stress distribution. After the first tempering process, the maximum effective stress decreased from 1690 MPa to 595 MPa. After the second tempering process, the maximum effective stress of the bearing ring continued to decrease. Figure 5(b1,b2) shows the circumferential stress distribution. After one cycle of tempering, both the maximum residual tensile stress and compressive stress were reduced. After two cycles of tempering, the maximum circumferential tensile stress was reduced, while the maximum circumferential compressive stress was larger than the results of one cycle of tempering. The result of stress change indicates that increasing the times of the tempering process can effectively release the quenching residual stress of 8Cr4Mo4V steel bearing ring. After tempering, the circumferential residual stress on the raceway of the bearing ring was close to the experimental test results [35], indicating the effectiveness of the heat treatment numerical simulation.
During post processing of the simulation results, the data of temperature, microstructure content, and stress change at characteristic positions were obtained. Figure 5c shows the content changes in retained austenite, martensite, and tempered martensite. During the tempering holding period, martensite can be almost completely transformed into tempered martensite. The retained austenite transforms into martensite during cooling. After two times of tempering, the content of retained austenite is 0.36%, the martensite content is 1.3%, and the tempered martensite content is 98.34%. Figure 5d shows the effective stress changes at six characteristic positions. The quenching residual stresses at the six positions are all released during the first-cycle tempering’s holding period. Figure 5e shows the physical field changes at P1. When in the first-cycle tempering process, the decrease in equivalent stress and the increase in tempered martensite content occur simultaneously, indicating that the change in microstructure stress caused by the tempered martensite transformation is the main reason for the release of quenching residual stress.

3.2. CPFEM Analysis Type II Residual Stress

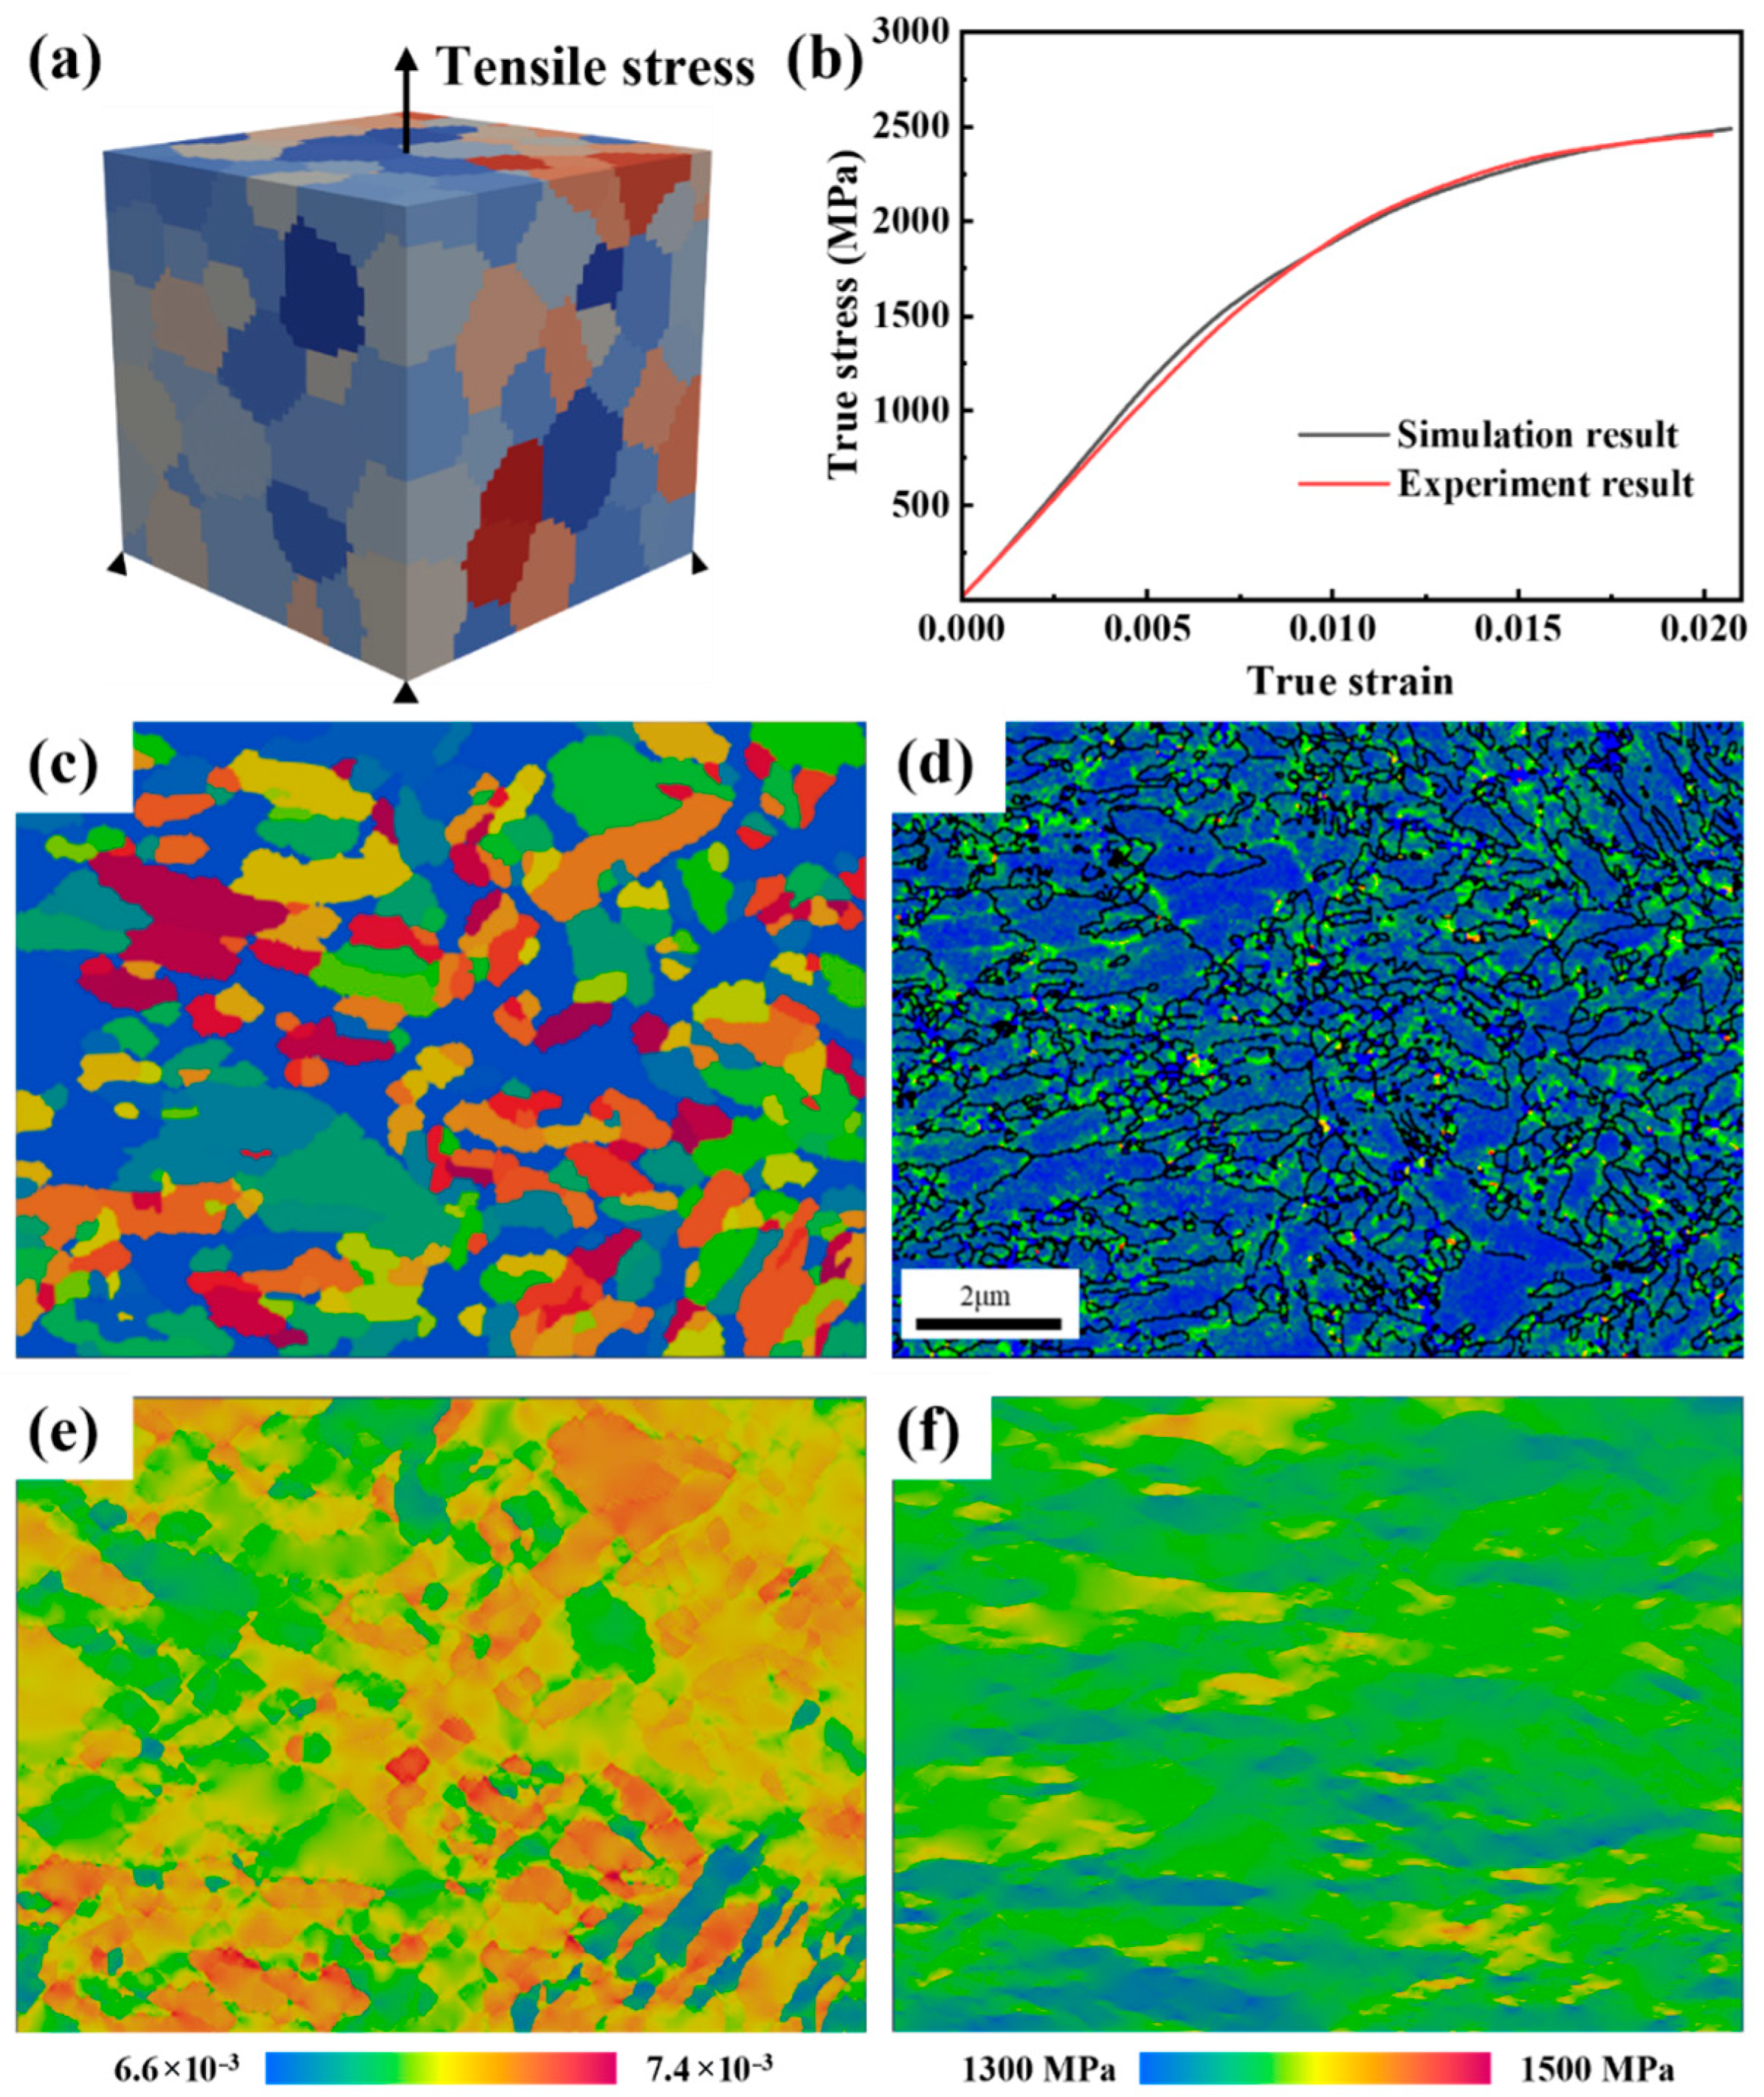
3.2.1. Crystal Plastic Constitutive Parameters

A phenomenological anisotropic model is used for the crystal plasticity model. The crystal plasticity constitutive parameters of tempered martensite are determined by fitting the actual tensile results through uniaxial tensile simulation of the polycrystalline model. C.C. Tasan [46] fitted the stress–strain curve of single-phase martensite and obtained the constitutive parameters of martensite in DP800 dual-phase steel. In this study, these parameters are used for the crystal plasticity simulation after quenching. The constitutive parameters of tempered martensite are obtained using the same method as that in reference [46,47].
The polycrystalline model with random orientations established by the Dream 3D software is shown in Figure 6a. The bottom surface of the model is constrained, and the corresponding load is applied to the top. The simulated uniaxial tensile stress–strain curve and the experimental stress–strain curve is shown in Figure 6b. The fitting results are consistent with the experimental results, and the constitutive parameters of tempered martensite are listed in Table 2.
To verify the effectiveness of the crystal plasticity finite element method (CPFEM) in analyzing the type II residual stress, the constitutive parameters of tempered martensite and the polycrystalline model established based on the real microstructure are used for simulation. Figure 6c shows the microstructure obtained by EBSD characterization. By analyzing the orientation difference between adjacent positions based on the EBSD results, the result is shown in Figure 6d. There is a relatively large average orientation difference near the grain boundaries (black lines), indicating the inhomogeneity of local deformation, which is related to the concentration of type II residual stress. There are more geometrically necessary dislocations in the regions with large orientation differences to maintain the lattice continuity between the deformation bands.
A crystal plasticity model is established using this microstructure for uniaxial tensile simulation. The strain rate of uniaxial tension is 0.001/s, and the strain is 0.02. The strain and stress distributions obtained by crystal plasticity simulation are shown in Figure 6e,f. During the tensile process, the Schmid factors of grains with different orientations are different, resulting in different deformation abilities. The simulation results show that the angle between the maximum effective plastic strain distribution and the tensile direction is about 45°. This is consistent with the fact that slip occurs along the 45° direction during actual uniaxial tensile test. In addition, by analyzing the equivalent stress distribution, a large stress appears at the grain boundaries. Therefore, the simulation results accurately reflect the deformation behavior of the material. The crystal plasticity simulation is carried out using the type I residual stress obtained by macroscopic finite element analysis to reveal the type II residual stress after heat treatment.

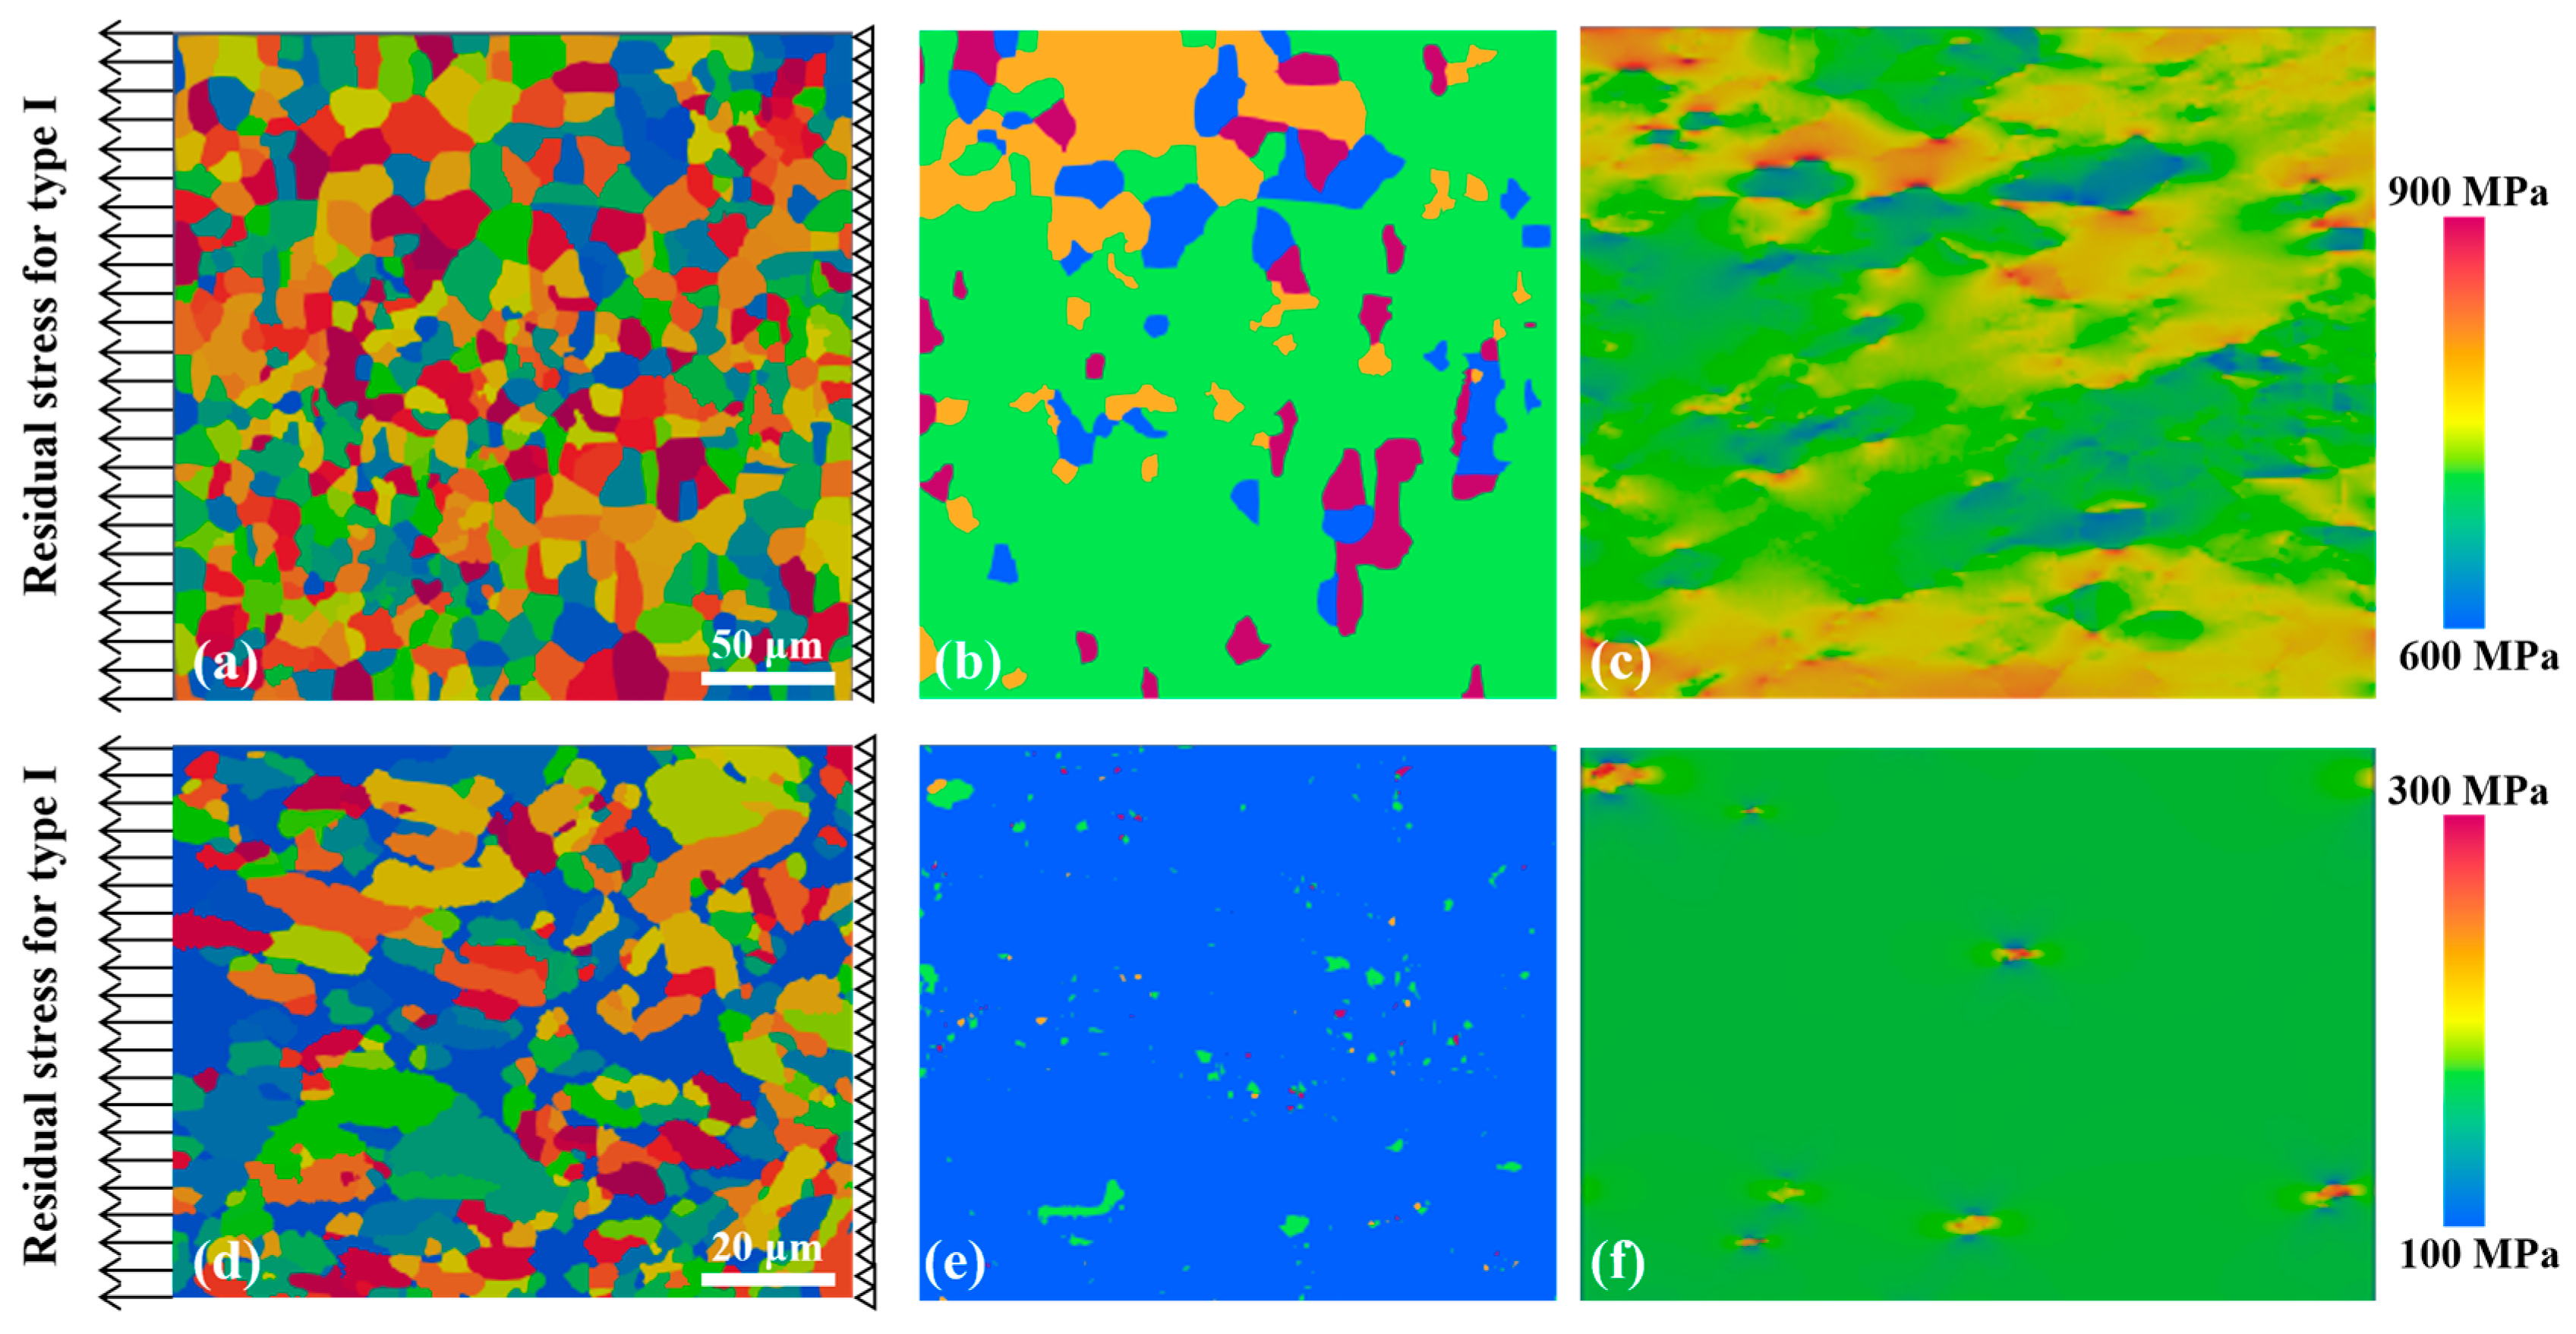
3.2.2. Analysis Residual Stress of Type II After Heat Treatment

Since the bearing raceway is the main loading area, the residual stress of type II on the raceway after heat treatment is analyzed. The effective stresses at the bottom of the raceway (P6) are 711.3 MPa and 168.3 MPa after quenching and tempering, respectively. This result is used as the boundary condition of the model for crystal plasticity finite element analysis. Figure 7 shows the microstructure after quenching and tempering and the equivalent stress distribution obtained by crystal plasticity simulation. The residual stress of type I at the bottom of the raceway of the bearing ring in Section 3.1 is used as the load for uniaxial tensile simulation. The phase distribution of martensite, austenite, and carbide after quenching is shown in Figure 7b. According to the equivalent stress distribution in Figure 7c, it can be seen that the equivalent stress in the retained austenite grains is smaller. Since austenite has a face-centered cubic structure with more main slip systems, it is easier for dislocation slip to occur, resulting in lower stress. Carbide shows difficulty in undergoing plastic deformation; so, only the elastic deformation of carbide is considered. Since the critical resolved shear stress for dislocation slip in martensite is larger than austenite, the maximum equivalent stress appears at the phase interface between martensite and carbide. The phase distribution of tempered martensite, martensite, and carbide after tempering is shown in Figure 7e. The microscopic equivalent stress distribution is consistent with the quenching result (Figure 7f). Larger stress concentrations appear near the carbide and the phase interface between carbide and tempered martensite. At the bottom of the bearing ring raceway, it is subjected to tensile stress after heat treatment. Therefore, the microscopic stress concentration caused by carbide makes it easier for micro cracks to initiate here, leading to bearing failure.

3.3. Geometry Phase Analysis Type III Residual Stress

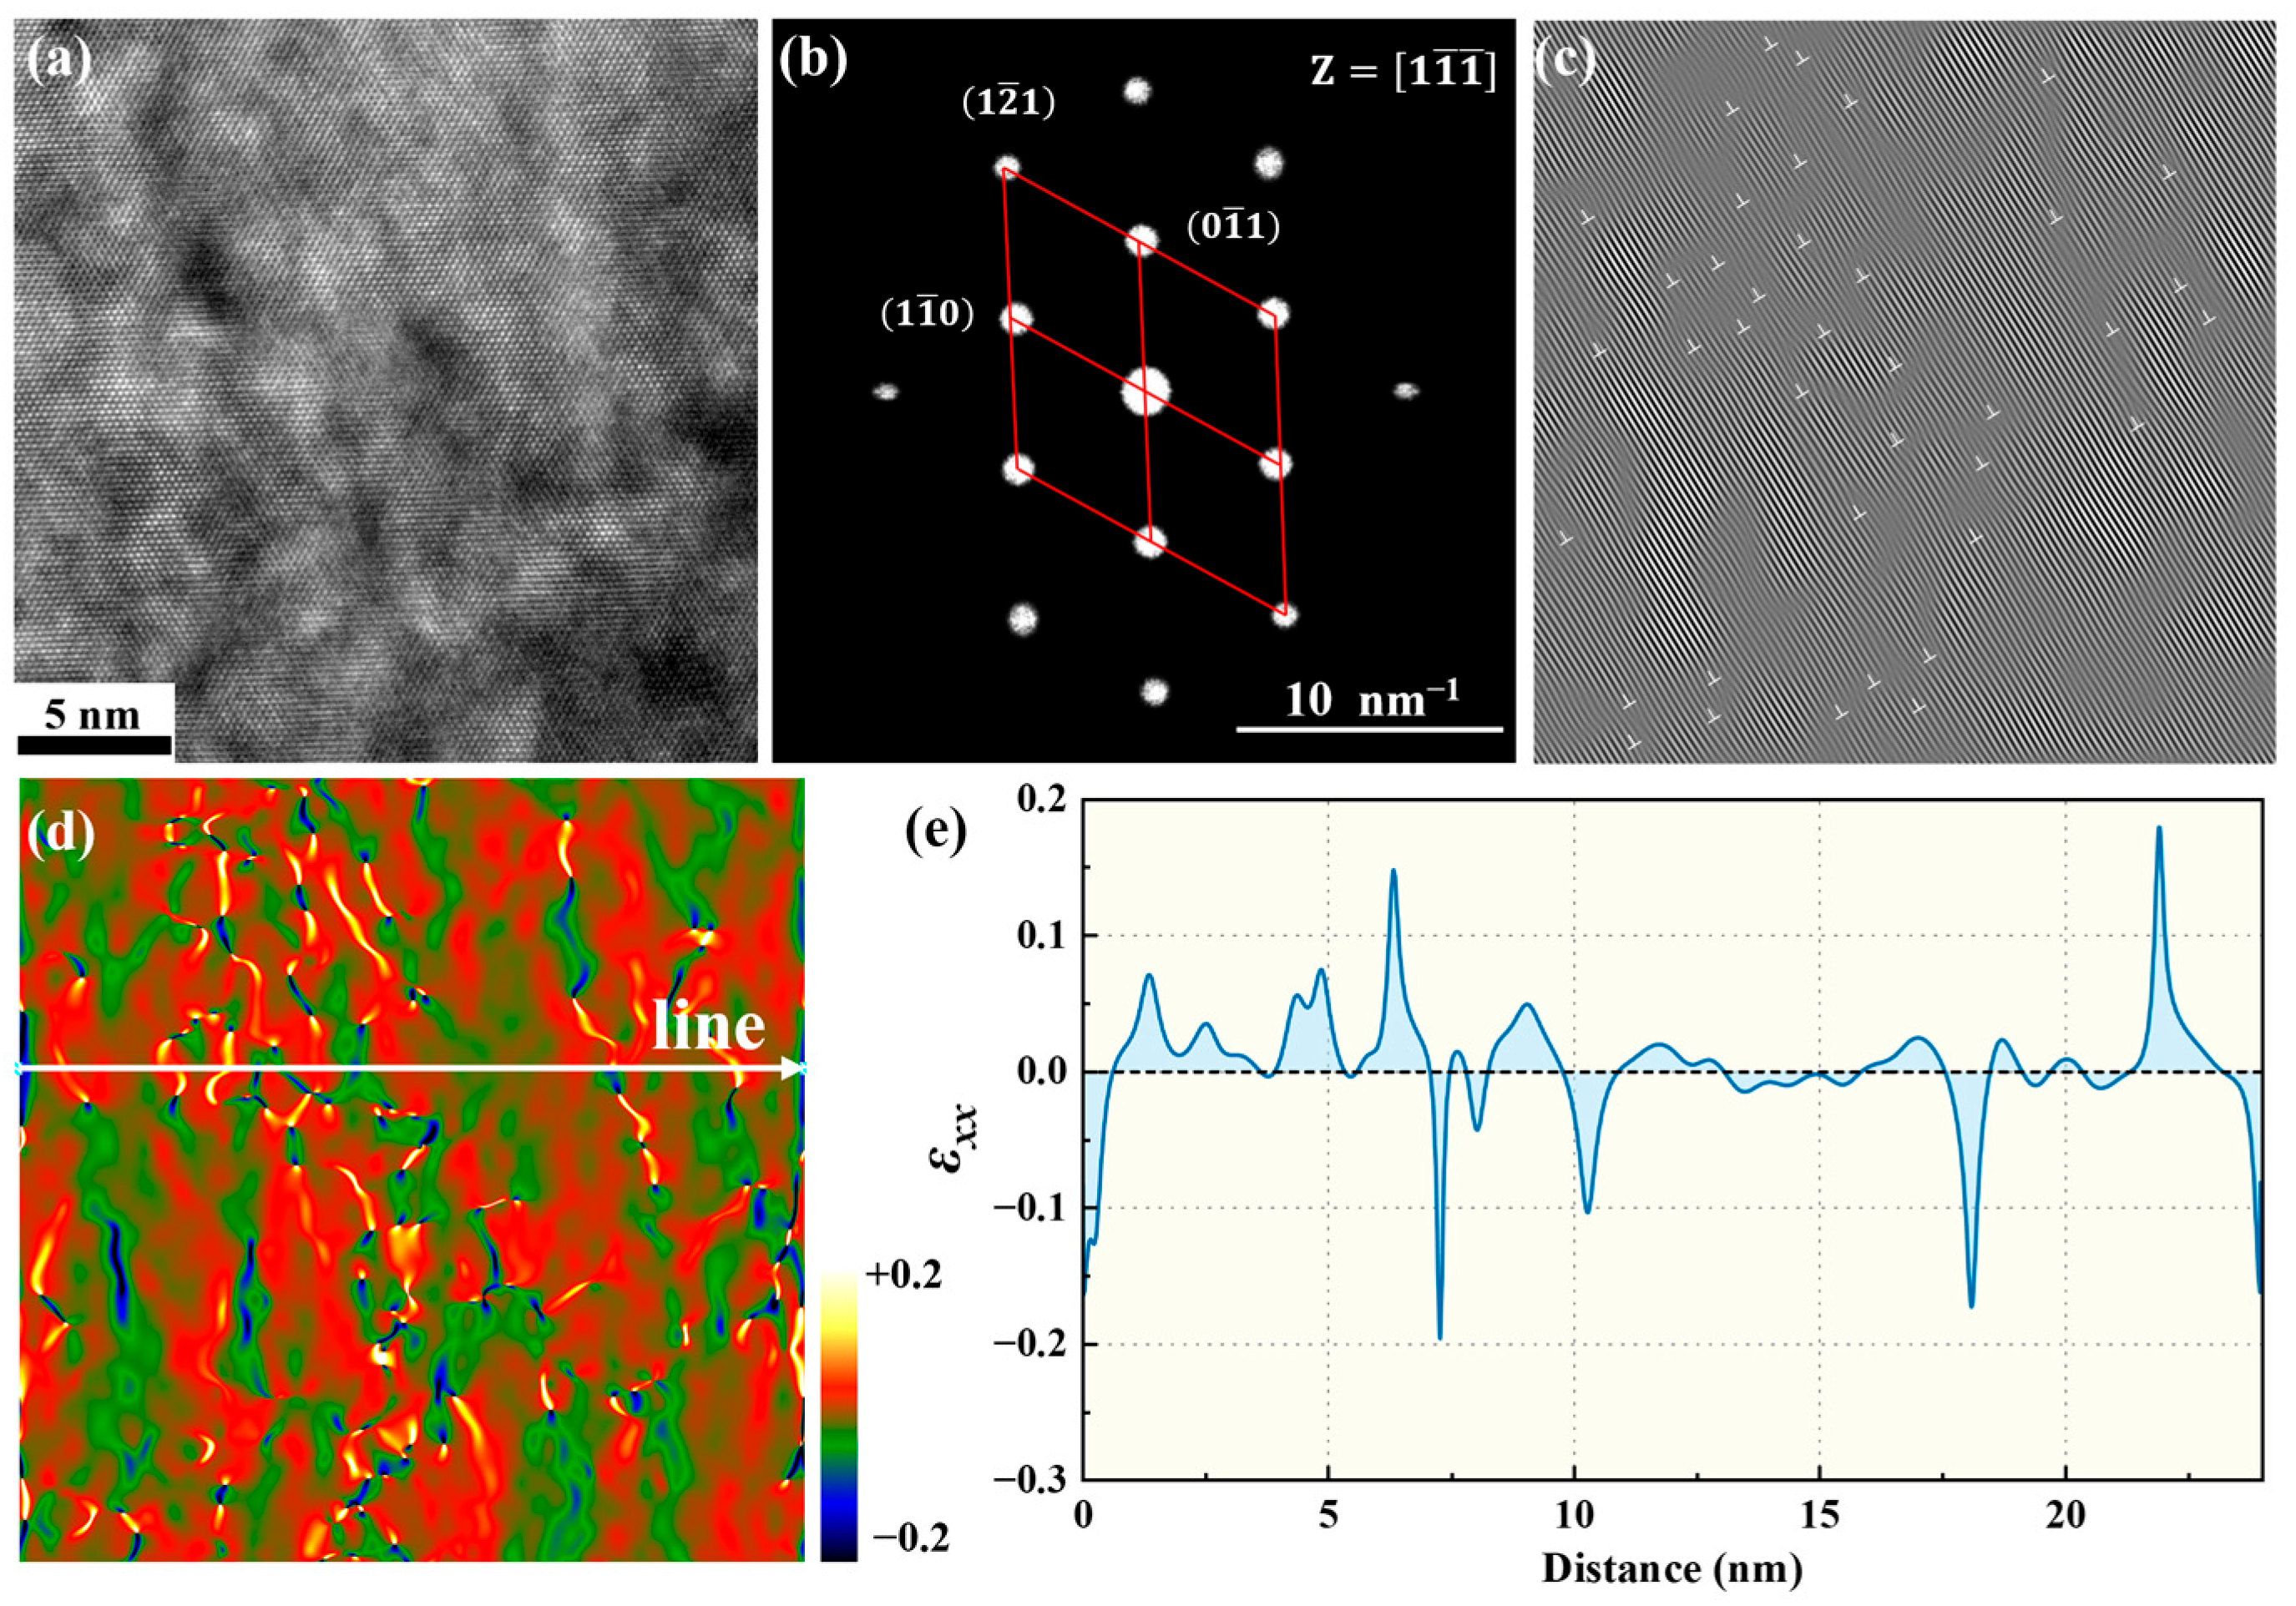
3.3.1. Geometry Phase Analysis of Quenched Martensite

The high-resolution images at atomic scale obtained by the high-resolution imaging technology of TEM and the GPA software [48] are used to analyze the residual stress type III after heat treatment. Figure 8a shows the high-resolution image of martensite in 8Cr4Mo4V steel after quenching at 1090 °C. Figure 8b is the selected area electron diffraction spots of martensite. The diffraction spots of the (101) crystal plane are selected for Inverse Fast Fourier Transform (IFFT) to obtain the lattice diffraction fringes (Figure 8c). During the quenching process, the transformation of austenite to martensite is a displacive transformation, and the crystal structure is transformed by the co-shearing of atoms. In order to reduce the resistance of the shear of large number of atoms, dislocations are formed to effectively release local stress. Therefore, the sub-structure of martensite after quenching is dislocations, and a large number of dislocations lead to large lattice distortion in martensite. Figure 8d shows the GPA results of martensite. Although the GPA analysis is calculated based on the selected reference lattice, the analysis results can effectively reflect the microscopic stress changes caused by defects. Tensile strain and compressive strain appear alternately in martensite, which is related to the extra half-atomic plane of edge dislocations. The extra half atomic plane introduced by dislocations leads to a decrease in the crystal planar spacing and induces compressive strain. However, the end far away from the extra half atomic plane is affected by the dislocation stress field and the crustal planar spacing increases, resulting in tensile strain. Figure 8e shows the change in the ε x x strain in Figure 8d along the line direction, and the local strain changes greatly.
The analysis of dislocations and strains in martensite provides a microscopic basis for understanding the relationship between the residual stress of type III and type II. The crystal plasticity simulation result in Section 3.2 reveals that the stress within a single grain is uniform, which is related to the fact that the phenomenological model uses the average method to describe the hardening effect between different slip systems. This method is effective for analyzing residual stress of type II. However, the residual stress of type III is caused by microstructures such as dislocations, twins, and nano precipitates, and it must result in the nanoscale stress that deviates from the grain scale stress.

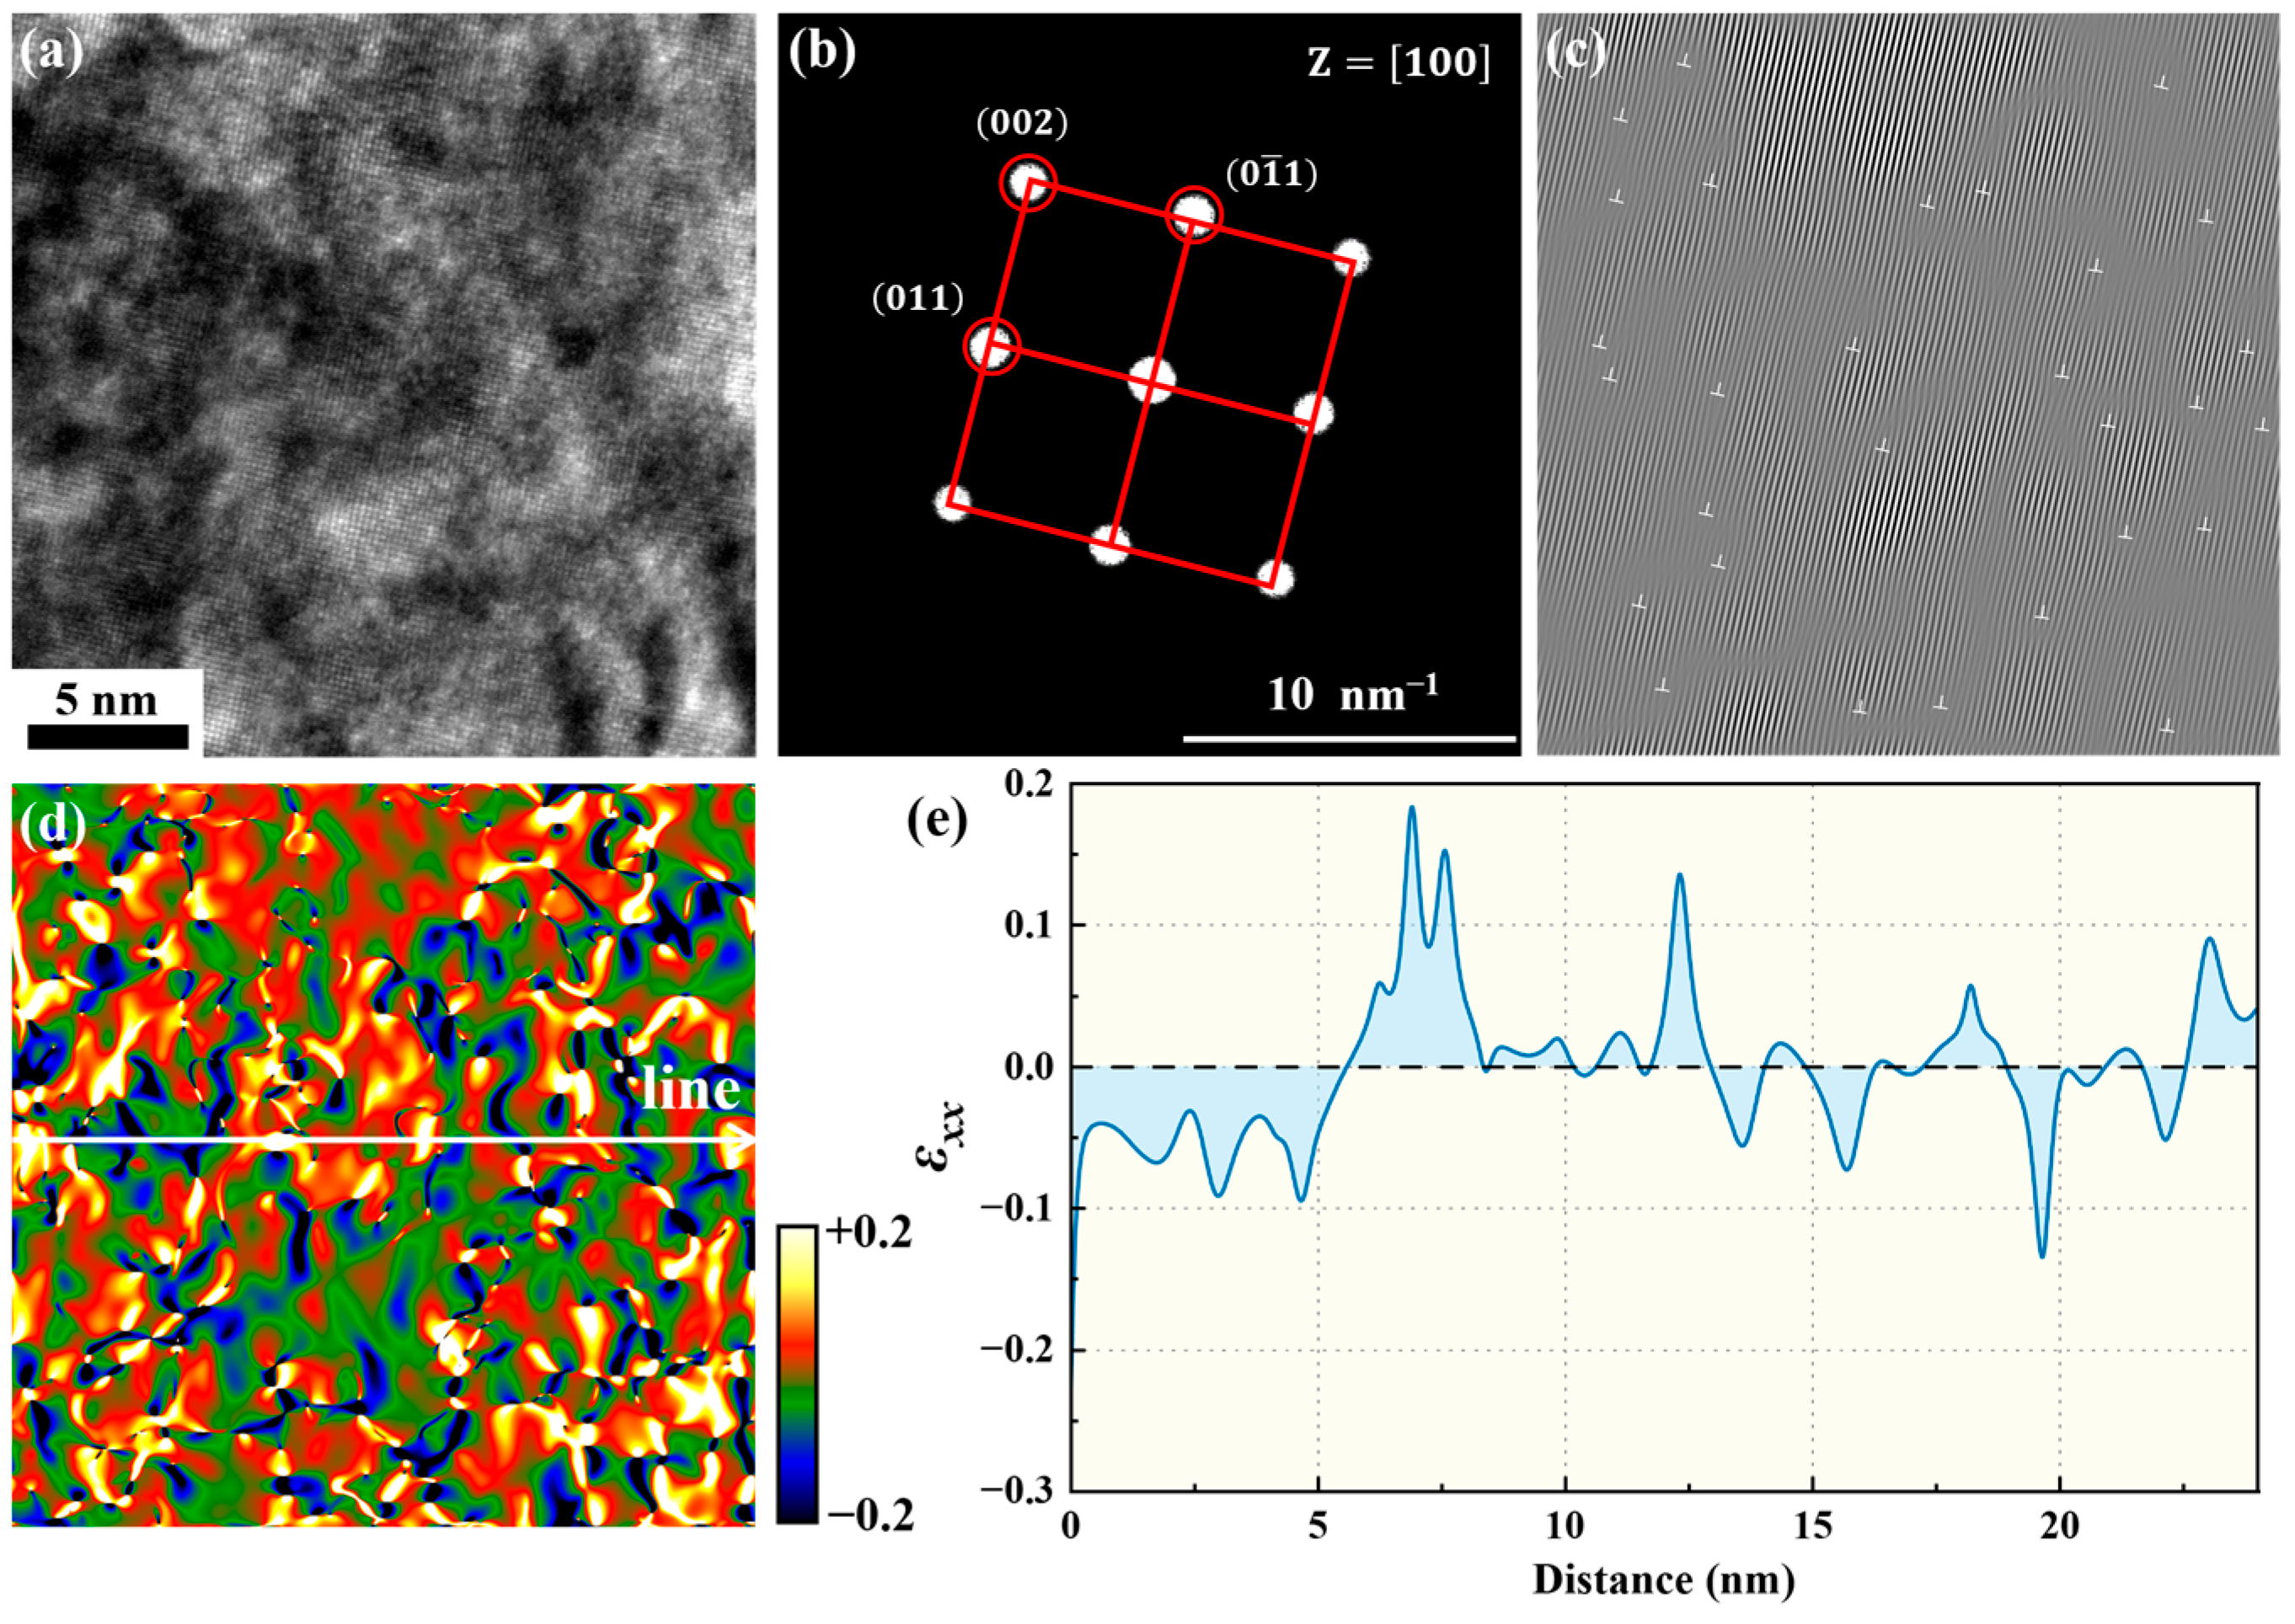
3.3.2. Geometry Phase Analysis of Tempered Martensite

Figure 9a shows the high-resolution image of tempered martensite. The selected area electron diffraction spots of tempered martensite are shown in Figure 9b, and the corresponding zone axis is [100]. The diffraction spots of the (011) crystal plane are selected for IFFT, and the lattice diffraction fringes of the (011) crystal plane are obtained (Figure 9c). It is found that there is still a large lattice distortion in the tempered martensite, but the dislocation density is lower than that in martensite. During the tempering process, since dislocations can reduce the nucleation energy barrier of nano-carbides, carbides tend to precipitate in areas with higher dislocation density, which leads to a decrease in the dislocation density in tempered martensite. The GPA analysis results of tempered martensite are shown in Figure 9d. Tensile strain and compressive strain still appear alternately. Figure 9e shows the strain change along the line direction. Compared with the results of martensite, the strain in tempered martensite decreases. This indicates that tempering can not only reduce the residual stress of type I, but also reduce the residual stress of type III.

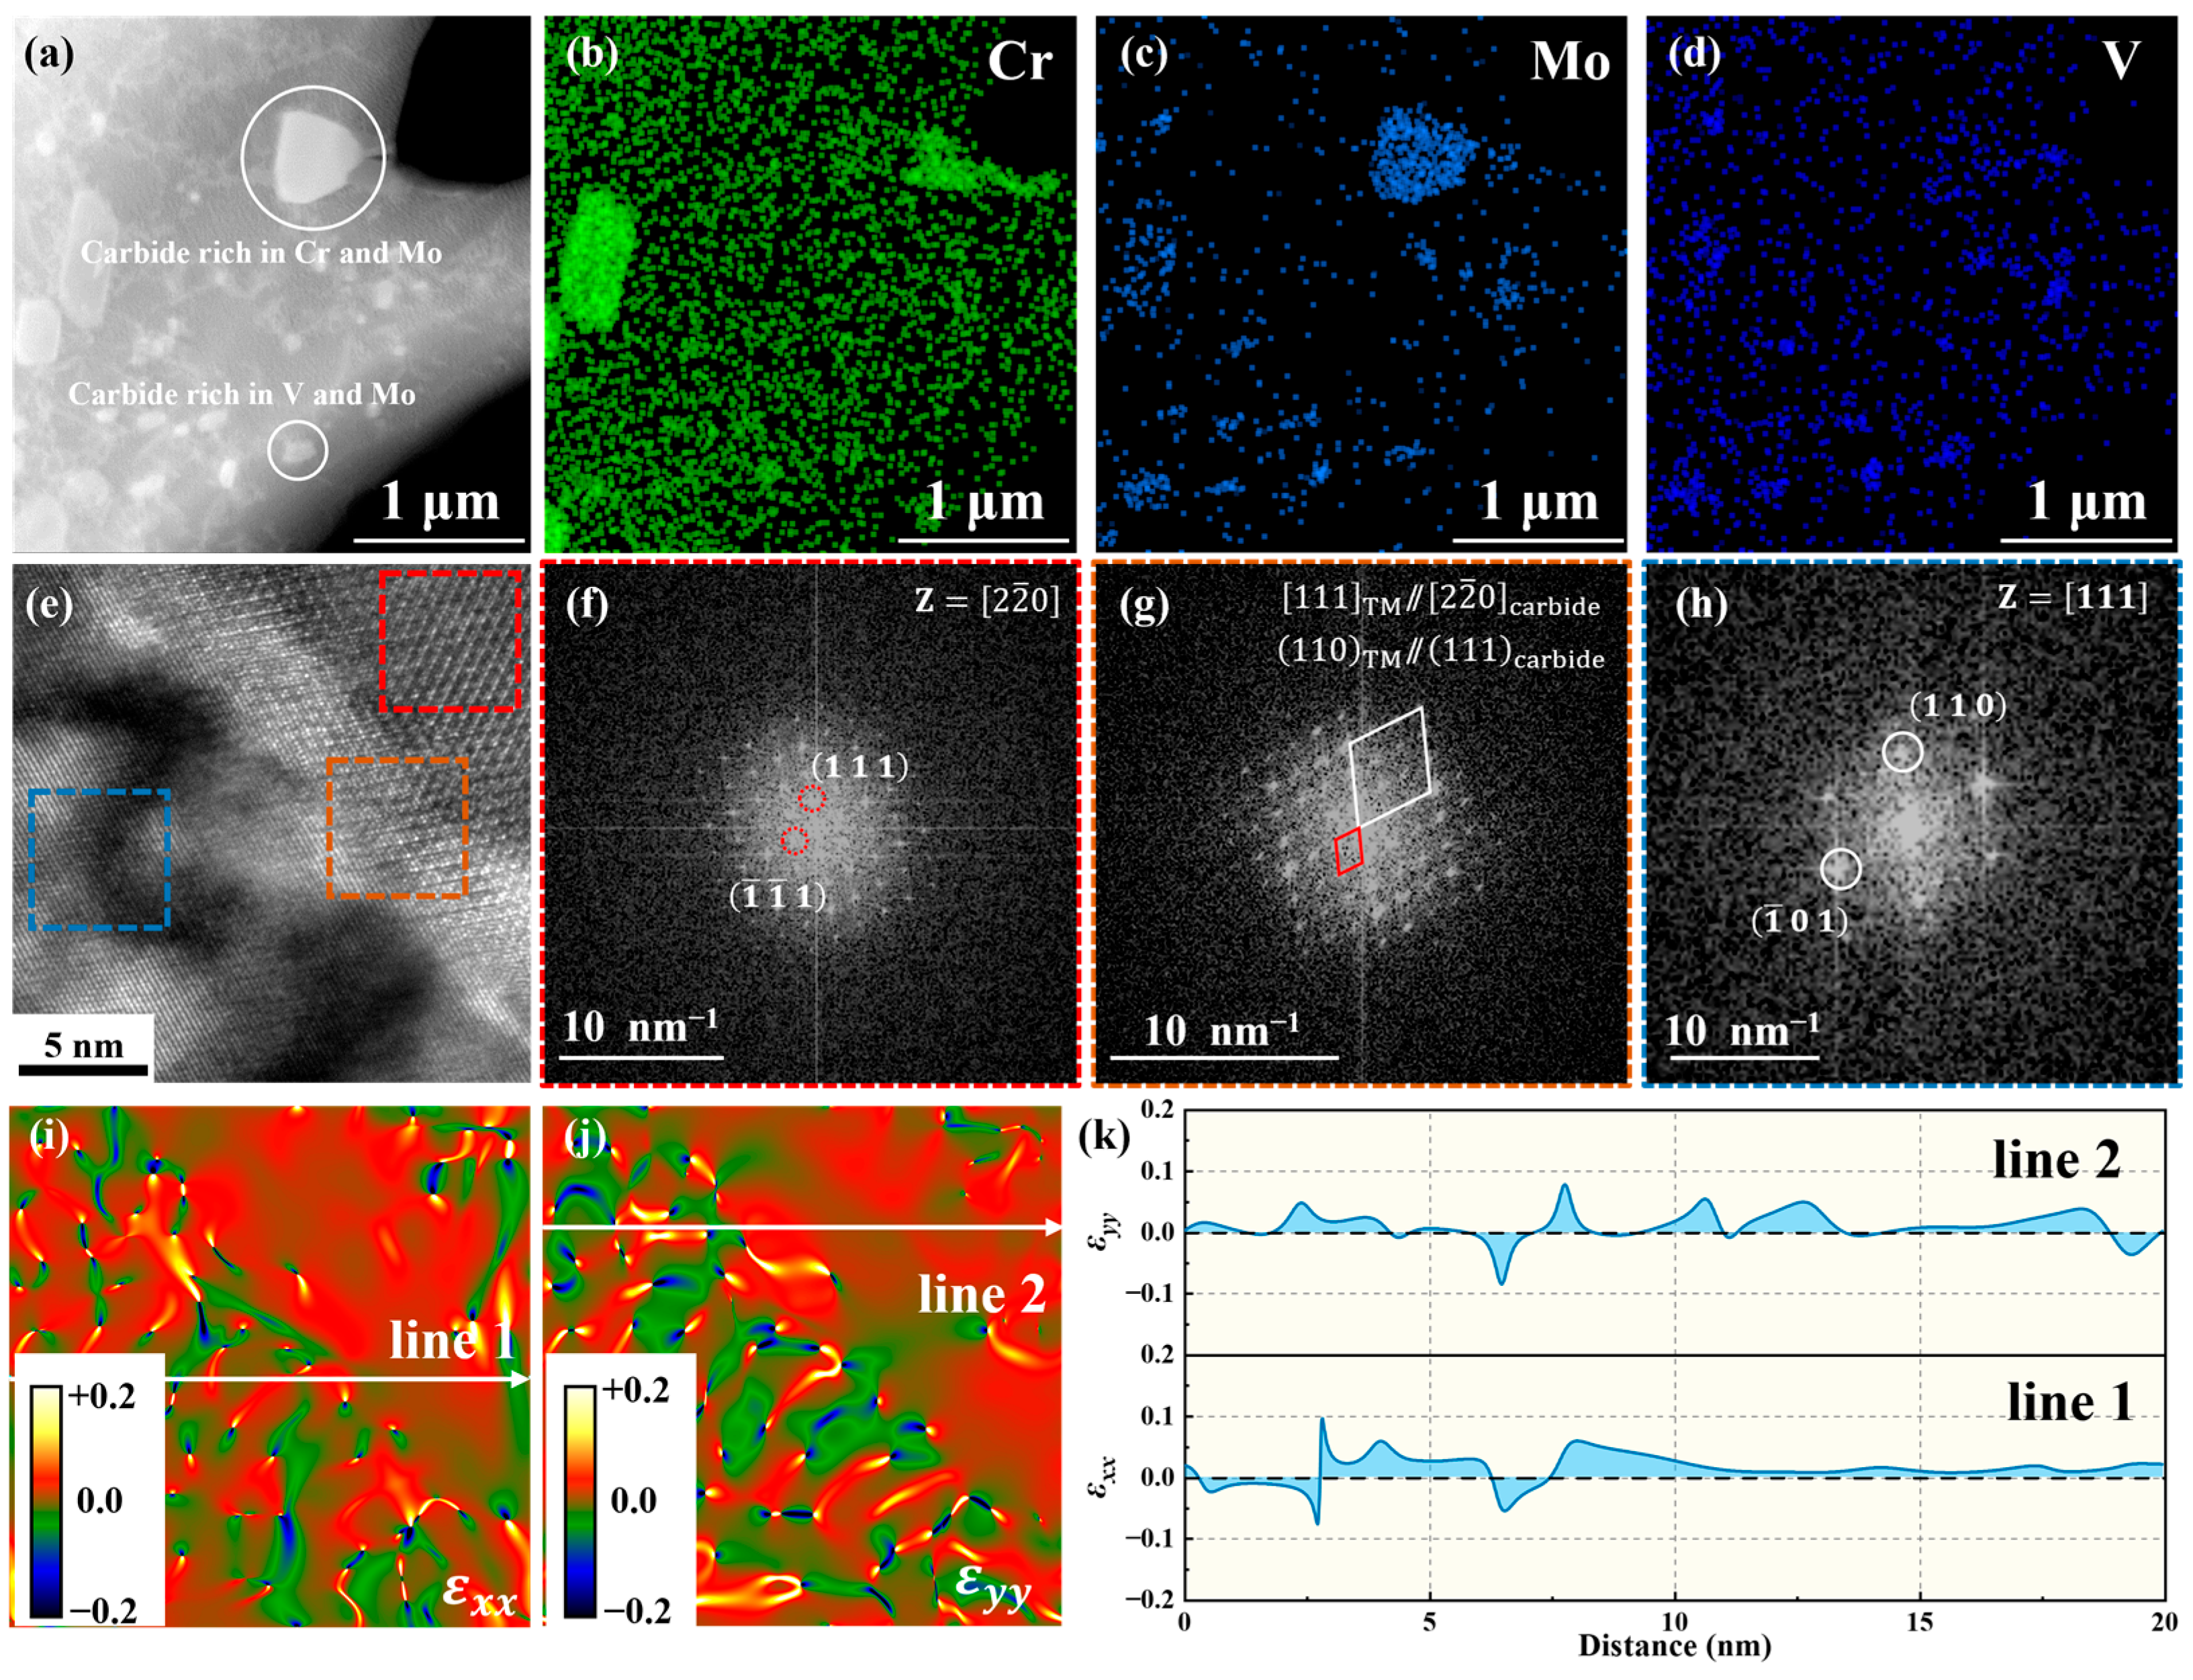
3.3.3. Geometry Phase Analysis of Phase Interface

In Section 3.2, it was found that large stress concentration occurs at the interface between the carbide and the matrix through crystal plasticity simulation. This is related to only considering elastic deformation of carbide. Since the defects that lead to bearing failure common initiate here, it is necessary to analyze the residual stress of type III at this location. To analyze the residual stress of type III at the carbide interface, TEM characterization was carried out on the carbide interface. Figure 10a shows the micro morphology of carbides in 8Cr4Mo4V steel after tempering. The size of carbides ranges from tens to hundreds of nanometers. The results of elemental analysis show that the main alloying elements in larger size carbides are Cr and Mo, while the main alloying elements in smaller size carbides are V and Mo. The high-resolution image of the interface of the carbide with a larger size is shown in Figure 10e. There is a coherent relationship between the carbide and the tempered martensite. Fast Fourier Transform (FFT) was performed on three regions in Figure 10e to obtain the corresponding diffraction spots. The calibration results of the carbide show that the carbide is Cr23C6. The 2 ¯ 2 ¯ 0 crystal direction of the carbide is parallel to the [111] crystal direction of the tempered martensite, and the (111) crystal plane of the carbide is parallel to the (110) crystal plane of the tempered martensite.
Figure 10i,j shows the GPA analysis results. The microscopic strain distribution at the interface between the carbide and the matrix is similar to that in martensite and tempered martensite. A small number of dislocations at the interface lead to lattice distortion, resulting in the alternate appearance of tensile strain and compressive strain. Since the carbide and the tempered martensite maintain coherence, the planar spacing of the 1 ¯ 01 crystal plane of the tempered martensite is 0.214 nm, and the planar spacing of the 3 ¯ 3 ¯ 1 crystal plane of the carbide is 0.205 nm. The mismatch is 4.2%. The microscopic strain caused by the difference in lattice constants between the two phases is relatively small. Figure 10k shows the values of the microscopic residual strain along the line direction. Compared with the residual strain in the tempered martensite, it is found that the residual strain at the interface is smaller. This result indicates that by modifying the carbides in the bearing steel after heat treatment to achieve coherence between the carbides and the matrix, the heat treatment residual stress can be reduced.

4. Conclusions

In this paper, numerical simulation is used to analyze the macroscopic residual stress of 8Cr4Mo4V steel bearing rings during heat treatment. Combining the heat treatment results with crystal plasticity simulation, the residual stress at the grain scale is studied. Based on high-resolution characterization and geometric phase analysis, the micro residual stress caused by crystal defects after heat treatment is analyzed. The conclusions are as follows:
During the quenching process of 8Cr4Mo4V steel bearing rings, the stress change is related to thermal strain and structural strain, which play a dominant role before and after the martensitic transformation, respectively. During the multiple tempering processes, the structural transformation leads to the release of quenching residual stress, and the stress release is concentrated in the first tempering process.
The results of crystal plasticity simulation show that the difference in deformation ability between carbides and the matrix leads to micro stress concentration at the interface between carbides and the matrix.
The GPA analysis of 8Cr4Mo4V steel after quenching and tempering shows that due to the presence of a large number of dislocations in the quenched martensite, severe lattice distortion occurs and the micro residual strain is large. After tempering process, the dislocation density decreases in tempered martensite, resulting in the reduction in the micro residual strain. Through high-resolution characterization of the carbide interface, the carbides maintain a coherent relationship with the matrix, and the micro residual strain at the nanoscale is small.

Author Contributions

Methodology, T.X., Y.L.; Validation, T.X.; Formal Analysis, X.L. and T.X.; Investigation, T.X., P.C. and T.S.; Resources, Y.L. and J.Z.; Data Curation, P.C.; Writing—Original Draft, X.L. and T.X.; Writing—Review and Editing, Y.L. and J.Z.; Visualization, X.L., T.X. and T.S.; Supervision, Y.L. and J.Z.; Funding Acquisition, Y.L. All authors have read and agreed to the published version of the manuscript.

Funding

This research was funded by the National Natural Science Foundation of China (grant No. 52031003).

Data Availability Statement

The original contributions presented in this study are included in this article. Further inquiries can be directed to the corresponding authors.

Conflicts of Interest

The authors declare no conflicts of interest.

References

  1. Gloeckner, P.; Rodway, C. The Evolution of Reliability and Efficiency of Aerospace Bearing Systems. Engineering 2017, 9, 962–991. [Google Scholar] [CrossRef]
  2. Rejith, R.; Kesavan, D.; Chakravarthy, P.; Narayana Murty, S.V.S. Bearings for Aerospace Applications. Tribol. Int. 2023, 181, 108312. [Google Scholar] [CrossRef]
  3. Zhang, B.; Liu, H.; Zhang, M.; Dai, C.; Xie, Z.; Ma, X.; Sun, Y. New Layering Strategy and the Gradient Microstructure Distribution of Surface Metamorphic Layer for 8Cr4Mo4V Steel by Grinding. Arch. Civ. Mech. Eng. 2024, 24, 42. [Google Scholar] [CrossRef]
  4. Li, Z.; Li, K.; Qian, C.; Wang, D.; Ji, W.; Wu, Y.; Cai, Z.; Liu, Q. Effect of Pulsed Magnetic Field on Retained Austenite of Quenched 8Cr4Mo4V Steel under Cryogenic Condition. J. Mater. Res. Technol. 2023, 23, 5004–5015. [Google Scholar] [CrossRef]
  5. Wang, F.; Qian, D.; Hua, L.; Mao, H.; Xie, L.; Song, X.; Dong, Z. Effect of High Magnetic Field on the Microstructure Evolution and Mechanical Properties of M50 Bearing Steel during Tempering. Mater. Sci. Eng. A 2020, 771, 138623. [Google Scholar] [CrossRef]
  6. Jiang, H.; Song, Y.; Wu, Y.; Shan, D.; Zong, Y. Macrostructure, Microstructure and Mechanical Properties Evolution during 8Cr4Mo4V Steel Roller Bearing Inner Ring Forging Process. Mater. Sci. Eng. A 2020, 798, 140196. [Google Scholar] [CrossRef]
  7. Zhu, F.; Jiang, D.; Sun, S.; Wu, H.; Zhang, Z.; Wang, J.; Ren, Z. Effect of Alternating Magnetic Field on Microstructure Evolution and Mechanical Properties of M50 Bearing Steel during Tempering Process. J. Mater. Res. Technol. 2023, 26, 4516–4525. [Google Scholar] [CrossRef]
  8. Zhou, L.; Tang, G.; Ma, X.; Wang, L.; Zhang, X. Relationship between Microstructure and Mechanical Properties of M50 Ultra-High Strength Steel via Quenching-Partitioning-Tempering Process. Mater. Charact. 2018, 146, 258–266. [Google Scholar] [CrossRef]
  9. Niu, J.B.; Zhang, X.H.; Ma, X.X.; Liu, Y.; Wang, L.Q.; Wu, T.B. Characterization of Vein-like Structures Formed in Nitrided Layers during Plasma Nitriding of 8Cr4Mo4V Steel. Materialia 2022, 22, 101378. [Google Scholar] [CrossRef]
  10. Esfahani, A.K.; Babaei, M.; Sarrami-Foroushani, S. A Numerical Model Coupling Phase Transformation to Predict Microstructure Evolution and Residual Stress during Quenching of 1045 Steel. Math. Comput. Simul. 2021, 179, 1–22. [Google Scholar] [CrossRef]
  11. Niu, J.B.; Waqas Qureshi, M.; Ding, Z.F.; Ma, X.X.; He, Y. Effect of Nitriding on the Transformation of Alloy Carbides (VC and Mo2C) in 8Cr4Mo4V Steel. Appl. Surf. Sci. 2023, 610, 155561. [Google Scholar] [CrossRef]
  12. Hou, X.-Q. Formation Mechanism and Influence of White Etching Area on Contact Fatigue Spalling of M50 Bearing Steel. Eng. Fail. Anal. 2022, 139, 106273. [Google Scholar] [CrossRef]
  13. Schönbauer, B.M.; More, S.S.; Morales-Espejel, G.E.; Mayer, H. Influence of Elevated Temperature on the Very High Cycle Fatigue Properties of Bearing Steels. Int. J. Fatigue 2023, 176, 107847. [Google Scholar] [CrossRef]
  14. Oezel, M. Formation of White Etching Areas in SAE 52100 Bearing Steel under Rolling Contact Fatigue—Influence of Diffusible Hydrogen. Wear 2018, 414–415, 352–365. [Google Scholar] [CrossRef]
  15. Guan, J.; Wang, L.; Zhang, C.; Ma, X. Effects of Non-Metallic Inclusions on the Crack Propagation in Bearing Steel. Tribol. Int. 2017, 106, 123–131. [Google Scholar] [CrossRef]
  16. Curd, M.E.; Burnett, T.L.; Fellowes, J.; Yan, P.; Withers, P.J. Redistribution of Carbon Caused by Butterfly Defects in Bearing Steels. Acta Mater. 2020, 183, 390–397. [Google Scholar] [CrossRef]
  17. Steinweg, F.; Mikitisin, A.; Zhang, J.-L.; Weirich, T.E.; Wang, J.; Chauhan, D.; Schwedt, A.; Richter, S.; Zander, D.; Mayer, J.; et al. Discovery of White Etching Areas in High Nitrogen Bearing Steel X30CrMoN15-1: A Novel Finding in Rolling Contact Fatigue Analysis. Wear 2024, 558–559, 205556. [Google Scholar] [CrossRef]
  18. Kürten, D.; Khader, I.; Raga, R.; Casajús, P.; Winzer, N.; Kailer, A.; Spallek, R.; Scherge, M. Hydrogen Assisted Rolling Contact Fatigue Due to Lubricant Degradation and Formation of White Etching Areas. Eng. Fail. Anal. 2019, 99, 330–342. [Google Scholar] [CrossRef]
  19. Peela, A.; Spille, J.; Steinweg, F.; Janitzky, T.; Schwedt, A.; Mayer, J.; Broeckmann, C. Multiscale Modelling and Simulation of Subsurface Carbide Deformation during the Formation of White Etching Areas. Wear 2023, 512–513, 204542. [Google Scholar] [CrossRef]
  20. Li, S.-X.; Su, Y.-S.; Shu, X.-D.; Chen, J.-J. Microstructural Evolution in Bearing Steel under Rolling Contact Fatigue. Wear 2017, 380–381, 146–153. [Google Scholar] [CrossRef]
  21. Wei, Y.H.; Yu, X.F.; Su, Y.; Shen, X.Y.; Xia, Y.Z.; Yang, W.W. Effect of Residual Stress and Microstructure Evolution on Size Stability of M50 Bearing Steel. J. Mater. Res. Technol. 2021, 10, 651–661. [Google Scholar] [CrossRef]
  22. Samuel, A.; Prabhu, K.N. Residual Stress and Distortion during Quench Hardening of Steels: A Review. J. Mater. Eng. Perform. 2022, 31, 5161–5188. [Google Scholar] [CrossRef]
  23. Li, H.; Zhao, G.; Huang, C.; Niu, S. Technological Parameters Evaluation of Gas Quenching Based on the Finite Element Method. Comput. Mater. Sci. 2007, 40, 282–291. [Google Scholar] [CrossRef]
  24. Li, W.; Meng, X.; Shu, K.; Zheng, D.; Wang, T.; Gu, L.; Wang, L.; Zhang, C. Effect of Dented Residual Stress on the Surface-Defect-Induced Pitting under Rolling Contact Loading of M50 Bearing Steel. Tribol. Int. 2024, 194, 109492. [Google Scholar] [CrossRef]
  25. Guan, J. A Continuum Damage Mechanics Based Approach to Damage Evolution of M50 Bearing Steel Considering Residual Stress Induced by Shot Peening. Tribol. Int. 2018, 126, 218–228. [Google Scholar] [CrossRef]
  26. Salvati, E.; Korsunsky, A.M. An Analysis of Macro- and Micro-Scale Residual Stresses of Type I, II and III Using FIB-DIC Micro-Ring-Core Milling and Crystal Plasticity FE Modelling. Int. J. Plast. 2017, 98, 123–138. [Google Scholar] [CrossRef]
  27. Wang, R.; Jiang, H.; Shao, W.; Yang, S.; Sun, X.; Cao, J.; Zhen, L. Quenching Induced Residue Stress in M50 Steel Ring: A FEM Simulation. J. Mater. Res. Technol. 2023, 24, 5298–5308. [Google Scholar] [CrossRef]
  28. Akbarzadeh, I.; Attarha, M.J.; Salehi, M.; Sattari-Far, I. Numerical and Experimental Study on the Effect of Post-Weld Heat Treatment Parameters on the Relaxation of Welding Residual Stresses. J. Strain Anal. Eng. Des. 2011, 46, 79–86. [Google Scholar] [CrossRef]
  29. Carro-Sevillano, G.; Fernández, R.; Bokuchava, G.; Millán, L.; González-Doncel, G. Residual Stress Distribution after Quenching Treatment Obtained from Diffraction Experiments and Simulation by Finite Element Method. J. Synch. Investig. 2021, 15, 537–541. [Google Scholar] [CrossRef]
  30. Guo, Y.; Abdolvand, H.; Britton, T.B.; Wilkinson, A.J. Growth of { 11 2 ¯ 2 } Twins in Titanium: A Combined Experimental and Modelling Investigation of the Local State of Deformation. Acta Mater. 2017, 126, 221–235. [Google Scholar] [CrossRef]
  31. Zhang, W.X.; Cong, Y.B.; Wang, J.; Li, C.; Wan, J.; Chen, Y.Z. Revealing the Effects of Martensitic Transformation and Dislocation Slip in Austenite on the Micromechanical Behaviors of a 9Ni Steel Using Crystal Plasticity Finite Element Method. Int. J. Plast. 2024, 174, 103869. [Google Scholar] [CrossRef]
  32. Lunt, A.J.G.; Korsunsky, A.M. A Review of Micro-Scale Focused Ion Beam Milling and Digital Image Correlation Analysis for Residual Stress Evaluation and Error Estimation. Surf. Coat. Technol. 2015, 283, 373–388. [Google Scholar] [CrossRef]
  33. Wang, Y.; Liu, X.P.; Qin, G.W. Investigation of Misfit Dislocations in α-Fe2O3/α-Al2O3 Interface by Geometric Phase Analysis and Dislocation Density Tensor Analysis. Mater. Charact. 2015, 106, 308–316. [Google Scholar] [CrossRef]
  34. Wang, S.Y.; Lang, F.C.; Xing, Y.M. Geometric Phase Analysis for Characterization of 3D Morphology of Carbon Fiber Reinforced Composites. Compos. Sci. Technol. 2023, 242, 110215. [Google Scholar] [CrossRef]
  35. Xia, T.; Chen, Y.; Song, T.; Cui, P.; Liu, Y.; Zhu, J. Optimization of Heat Treatment Process Parameters for 8Cr4Mo4V Bearing Ring Using FEA-NN-PSO Method. Met. Mater. Int. 2025. [Google Scholar] [CrossRef]
  36. Liu, Y.; Qin, S.; Hao, Q.; Chen, N.; Zuo, X.; Rong, Y. Finite Element Simulation and Experimental Verification of Internal Stress of Quenched AISI 4140 Cylinders. Met. Mater. Trans. A 2017, 48, 1402–1413. [Google Scholar] [CrossRef]
  37. Koistinen, D.; Marburger, R. A General Equation Prescribing the Extent of the Austenite-Martensite Transformation in Pure Iron-Carbon Alloys and Plain Carbon Steels. Acta Metall. 1959, 7, 59–60. [Google Scholar] [CrossRef]
  38. Zhou, Y.; Lin, W.; Yang, F.; Fang, W.; Huang, J.; Li, Q. Insights into Formation Kinetics of Gold Nanoparticles Using the Classical JMAK Model. Chem. Phys. 2014, 441, 23–29. [Google Scholar] [CrossRef]
  39. Roters, F.; Eisenlohr, P.; Kords, C.; Tjahjanto, D.D.; Diehl, M.; Raabe, D. DAMASK: The Düsseldorf Advanced MAterial Simulation Kit for Studying Crystal Plasticity Using an FE Based or a Spectral Numerical Solver. Procedia Iutam 2012, 3, 3–10. [Google Scholar] [CrossRef]
  40. Lee, E.H.; Liu, D.T. Finite-Strain Elastic—Plastic Theory with Application to Plane-Wave Analysis. J. Appl. Phys. 1967, 38, 19–27. [Google Scholar] [CrossRef]
  41. Liu, X.; Xia, T.; Li, H.; Song, T.; Qu, N.; Liu, Y.; Zhu, J. Microstructure Evolution and Mechanical Properties of Grinding Metamorphic for 8Cr4Mo4V Steel. Materials 2025, 18, 1092. [Google Scholar] [CrossRef]
  42. Roters, F.; Eisenlohr, P.; Hantcherli, L.; Tjahjanto, D.D.; Bieler, T.R.; Raabe, D. Overview of Constitutive Laws, Kinematics, Homogenization and Multiscale Methods in Crystal Plasticity Finite-Element Modeling: Theory, Experiments, Applications. Acta Mater. 2010, 58, 1152–1211. [Google Scholar] [CrossRef]
  43. Groeber, M.A.; Jackson, M.A. DREAM.3D: A Digital Representation Environment for the Analysis of Microstructure in 3D. Integr. Mater. Manuf. Innov. 2014, 3, 56–72. [Google Scholar] [CrossRef]
  44. Hÿtch, M.J.; Snoeck, E.; Kilaas, R. Quantitative Measurement of Displacement and Strain Fields from HREM Micrographs. Ultramicroscopy 1998, 74, 131–146. [Google Scholar] [CrossRef]
  45. Takeda, M.; Suzuki, J. Crystallographic Heterodyne Phase Detection for Highly Sensitive Lattice-Distortion Measurements. J. Opt. Soc. Am. A 1996, 13, 1495. [Google Scholar] [CrossRef]
  46. Tasan, C.C.; Hoefnagels, J.P.M.; Diehl, M.; Yan, D.; Roters, F.; Raabe, D. Strain Localization and Damage in Dual Phase Steels Investigated by Coupled In-Situ Deformation Experiments and Crystal Plasticity Simulations. Int. J. Plast. 2014, 63, 198–210. [Google Scholar] [CrossRef]
  47. Tjahjanto, D.D.; Turteltaub, S.; Suiker, A.S.J. Crystallographically Based Model for Transformation-Induced Plasticity in Multiphase Carbon Steels. Contin. Mech. Thermodyn. 2008, 19, 399–422. [Google Scholar] [CrossRef]
  48. Du, H. GPA—Geometrical Phase Analysis Software (2018). Available online: https://er-c.org/index.php/software/stem-data-analysis/gpa/ (accessed on 1 January 2018).
Figure 1. The temperature–time curve of the heat treatment process for 8Cr4Mo4V steel. During 3 cycles tempering, the material was held at 560 °C for 2 h and then air-cooled.
Metals 15 00548 g001
Figure 2. Flow chart of the research on the type I, type II, and type III residual stresses after heat treatment using macroscopic finite element and crystal plasticity finite element simulations and GPA analysis. The red square of the interested region on the bearing ring represents CPFEM model. The red square in the CPFEM model represents the actual microstructure.
Metals 15 00548 g002
Figure 3. Geometric model of the 8Cr4Mo4V steel bearing ring. (a) Geometric dimensions of the 8Cr4Mo4V steel bearing ring; (b) bearing ring model and six characteristic positions on the shoulder and raceway of the bearing ring; (c) the results of adaptive mesh generation for the 8Cr4Mo4V steel bearing ring.
Metals 15 00548 g003
Figure 4. Numerical simulation results of high-pressure nitrogen quenching of 8Cr4Mo4V steel bearing rings. (a) Martensite content after quenching; (b) distribution of equivalent stress on the bearing ring after quenching; (c) distribution of circumferential stress; (d,e) show the changes in temperature, martensite content, and equivalent stress at the characteristic positions of the bearing ring, respectively; (f) changes in the temperature field, microstructure field, and stress field at the characteristic point P1 during the quenching process.
Metals 15 00548 g004
Figure 5. Numerical simulation results of tempering of 8Cr4Mo4V steel bearing rings. (a1,a2) show the effective stress distributions after the first cycle tempering and the second cycle tempering, respectively; (b1,b2) show the circumferential stress distributions after the first cycle tempering and the second cycle tempering, respectively; (c) shows the change in phase content during the tempering process; (d) shows the change in effective stress at the characteristic positions of the bearing ring; (e) shows the changes in the temperature field, microstructure field, and stress field at the characteristic point P1 during the tempering process.
Metals 15 00548 g005
Figure 6. Fitting the parameters of the crystal plasticity constitutive relation of tempered martensite based on the tensile curve and the finite element simulation results of uniaxial tensile crystal plasticity. (a) Polycrystalline model of crystal plasticity finite element for fitting the tensile curve; (b) fitted uniaxial tensile curve; (c) grain orientation of tempered martensite; (d) the KAM pattern of tempered martensite indicates that the average orientation difference at the large angle grain boundaries is large, reflecting the magnitude of local strain; (e) uniaxial tensile strain distribution; (f) uniaxial tensile stress distribution.
Metals 15 00548 g006
Figure 7. The results of simulation using the constitutive parameters of the crystal plasticity relation. (a,d) show the crystal orientations after quenching and tempering, respectively; (b) shows the phase distribution after quenching, where green represents martensite, blue represents austenite, and yellow and red represent carbides; (c) shows the stress distribution from the crystal plasticity simulation of the quenched microstructure; (e) shows the phase distribution after tempering, where blue represents tempered martensite and other colors represent carbides; (f) shows the stress distribution from the crystal plasticity simulation of the tempered microstructure.
Metals 15 00548 g007
Figure 8. Transmission characterization results and GPA analysis results of quenched martensite. (a) High-resolution image of martensite; (b) selected area electron diffraction spots of martensite; (c) IFFT result of (a); (d) GPA analysis result of martensite; (e) micro strain change along the line in (d).
Metals 15 00548 g008
Figure 9. Transmission characterization results and GPA analysis results of tempered martensite. (a) High-resolution image of tempered martensite; (b) selected area electron diffraction spots of tempered martensite; (c) IFFT result of (a); (d) GPA analysis result of tempered martensite; (e) micro strain change along the line in (d).
Metals 15 00548 g009
Figure 10. Characterization results and GPA analysis results of the carbide phase interface after tempering. (a) Bright field image of the TEM characterization of the tempered microstructure; (bd) are the elemental analysis results of Cr, Mo, and V in (a), respectively; (e) is the high-resolution image of the carbide phase interface. The area within the red frame represents the carbide, the area within the brown frame represents the phase interface, and the area within the blue frame represents the tempered martensite; (fh) are the FFT results of the carbide, the phase interface, and the tempered martensite, respectively; (i,j) are the strain distributions of εxx and εyy; (k) is the micro strain change along line 1 and line 2.
Metals 15 00548 g010
Table 1. The general chemical composition of the 8Cr4Mo4V steel (wt.%).
CCrMoVMnFe
0.84.04.01.00.2Bal.
Table 2. Parameters of the phenomenological constitutive relations of crystal plasticity for martensite and tempered martensite. Reprinted with permission from ref. [46], 2014, Elsevier.
ParameterMartensite [46]Tempered Martensite
C11 (GPa)417.4309.1
C12 (GPa)242.4132.5
C44 (GPa)211.188.3
g0{111} (MPa)406605
g{111} (MPa)873972
g0{112} (MPa)457656
g{112} (MPa)9711071
γ ˙ 0 0.0010.001
n2012
a2.251.8
Disclaimer/Publisher’s Note: The statements, opinions and data contained in all publications are solely those of the individual author(s) and contributor(s) and not of MDPI and/or the editor(s). MDPI and/or the editor(s) disclaim responsibility for any injury to people or property resulting from any ideas, methods, instructions or products referred to in the content.

