
Removal of Iron, Zinc, and Copper Impurities from Sodium Aluminate After the Bayer Process

 ,
, 
 , , and
Abstract
1. Introduction
2. Materials and Methods
2.1. Materials
2.2. Methods
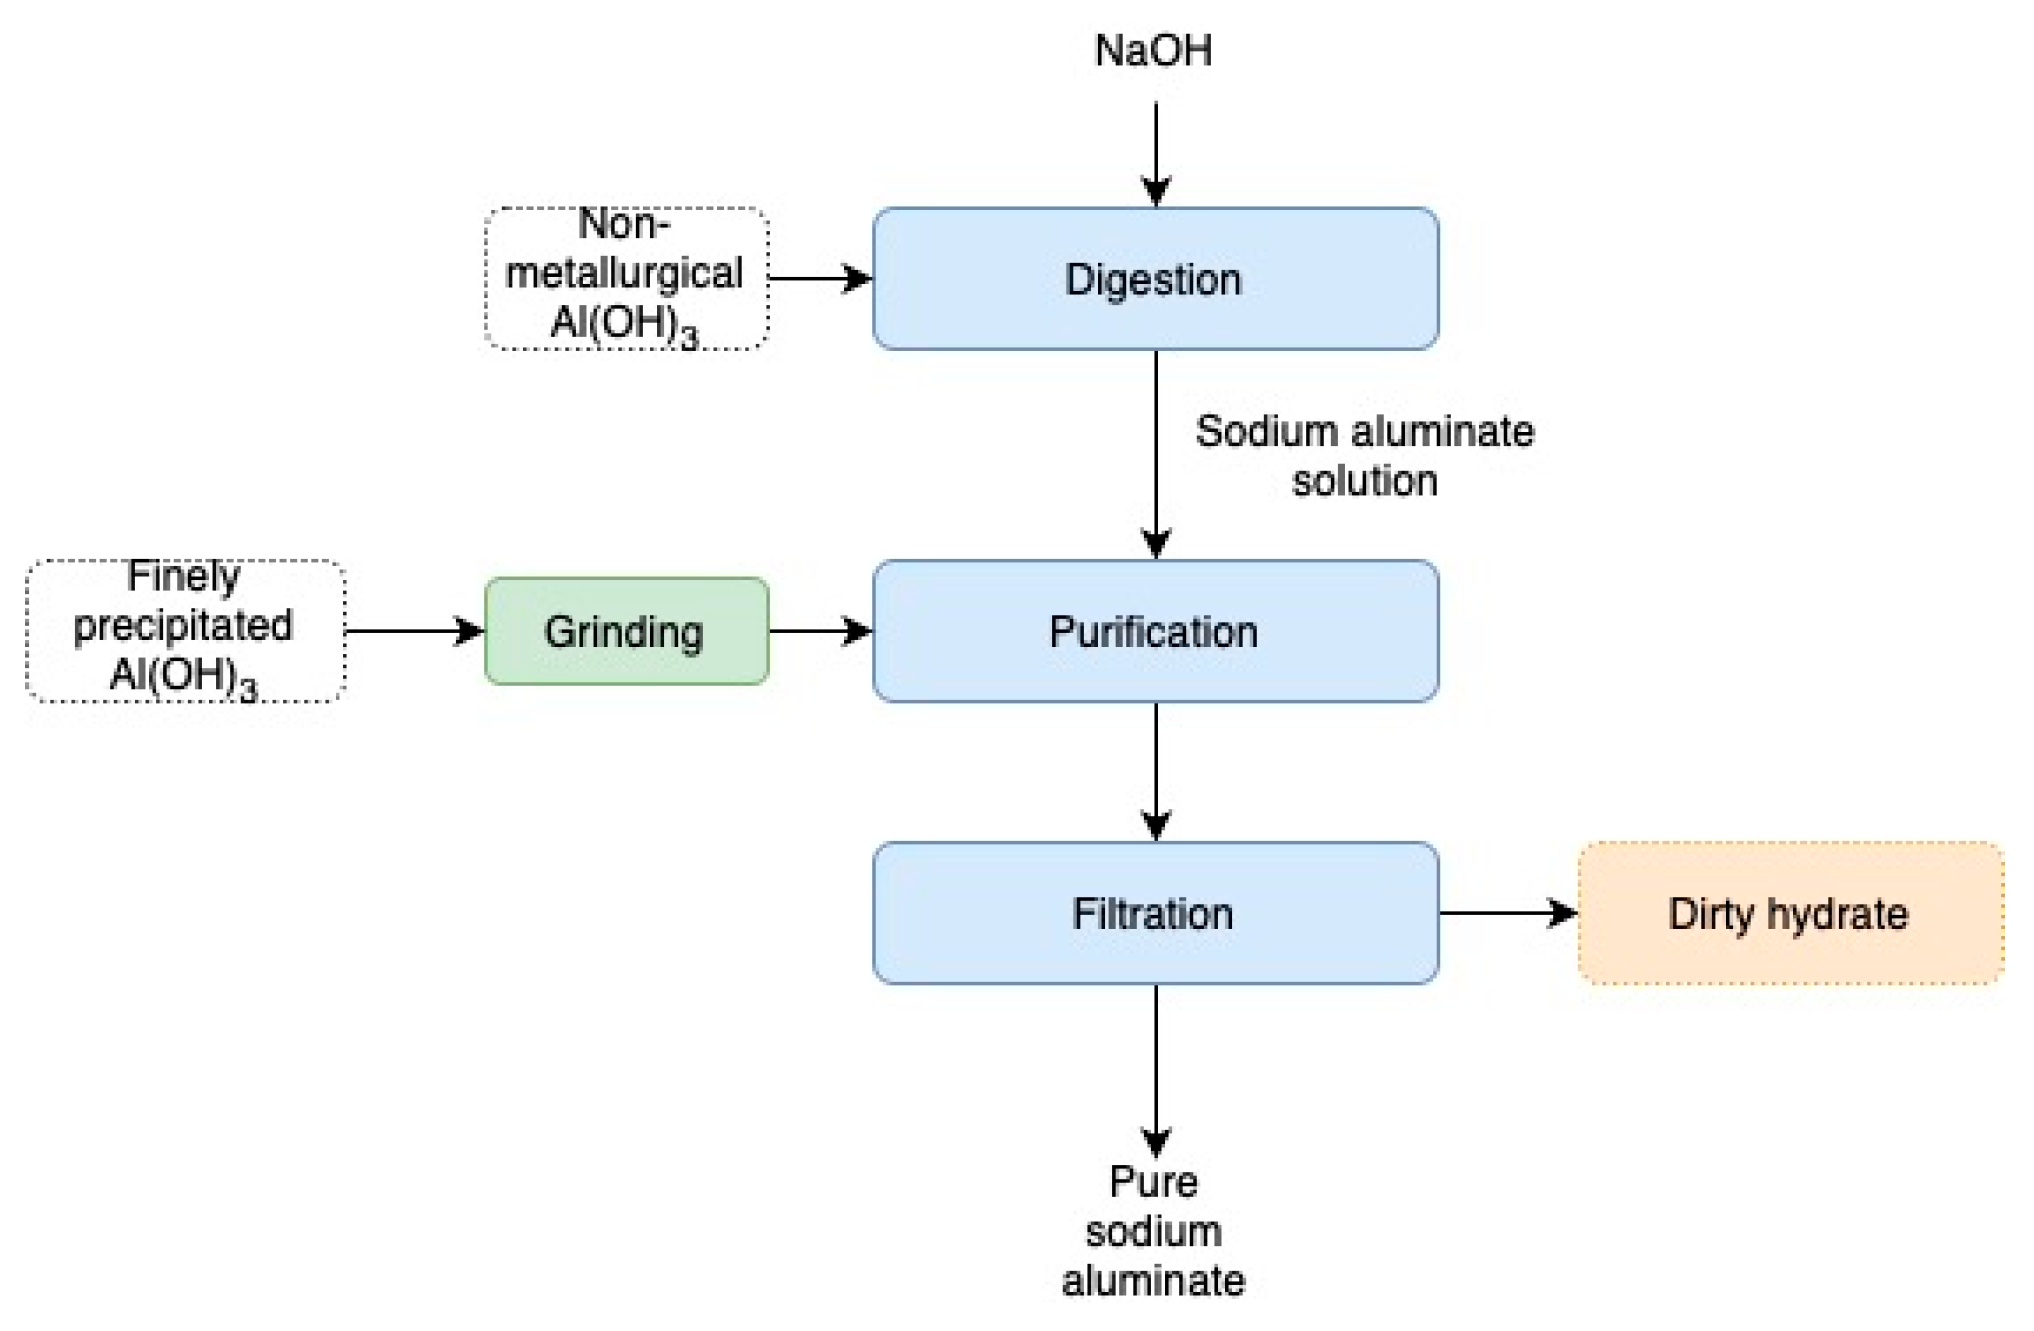
2.3. Procedure
Preparation of Tablets
3. Results
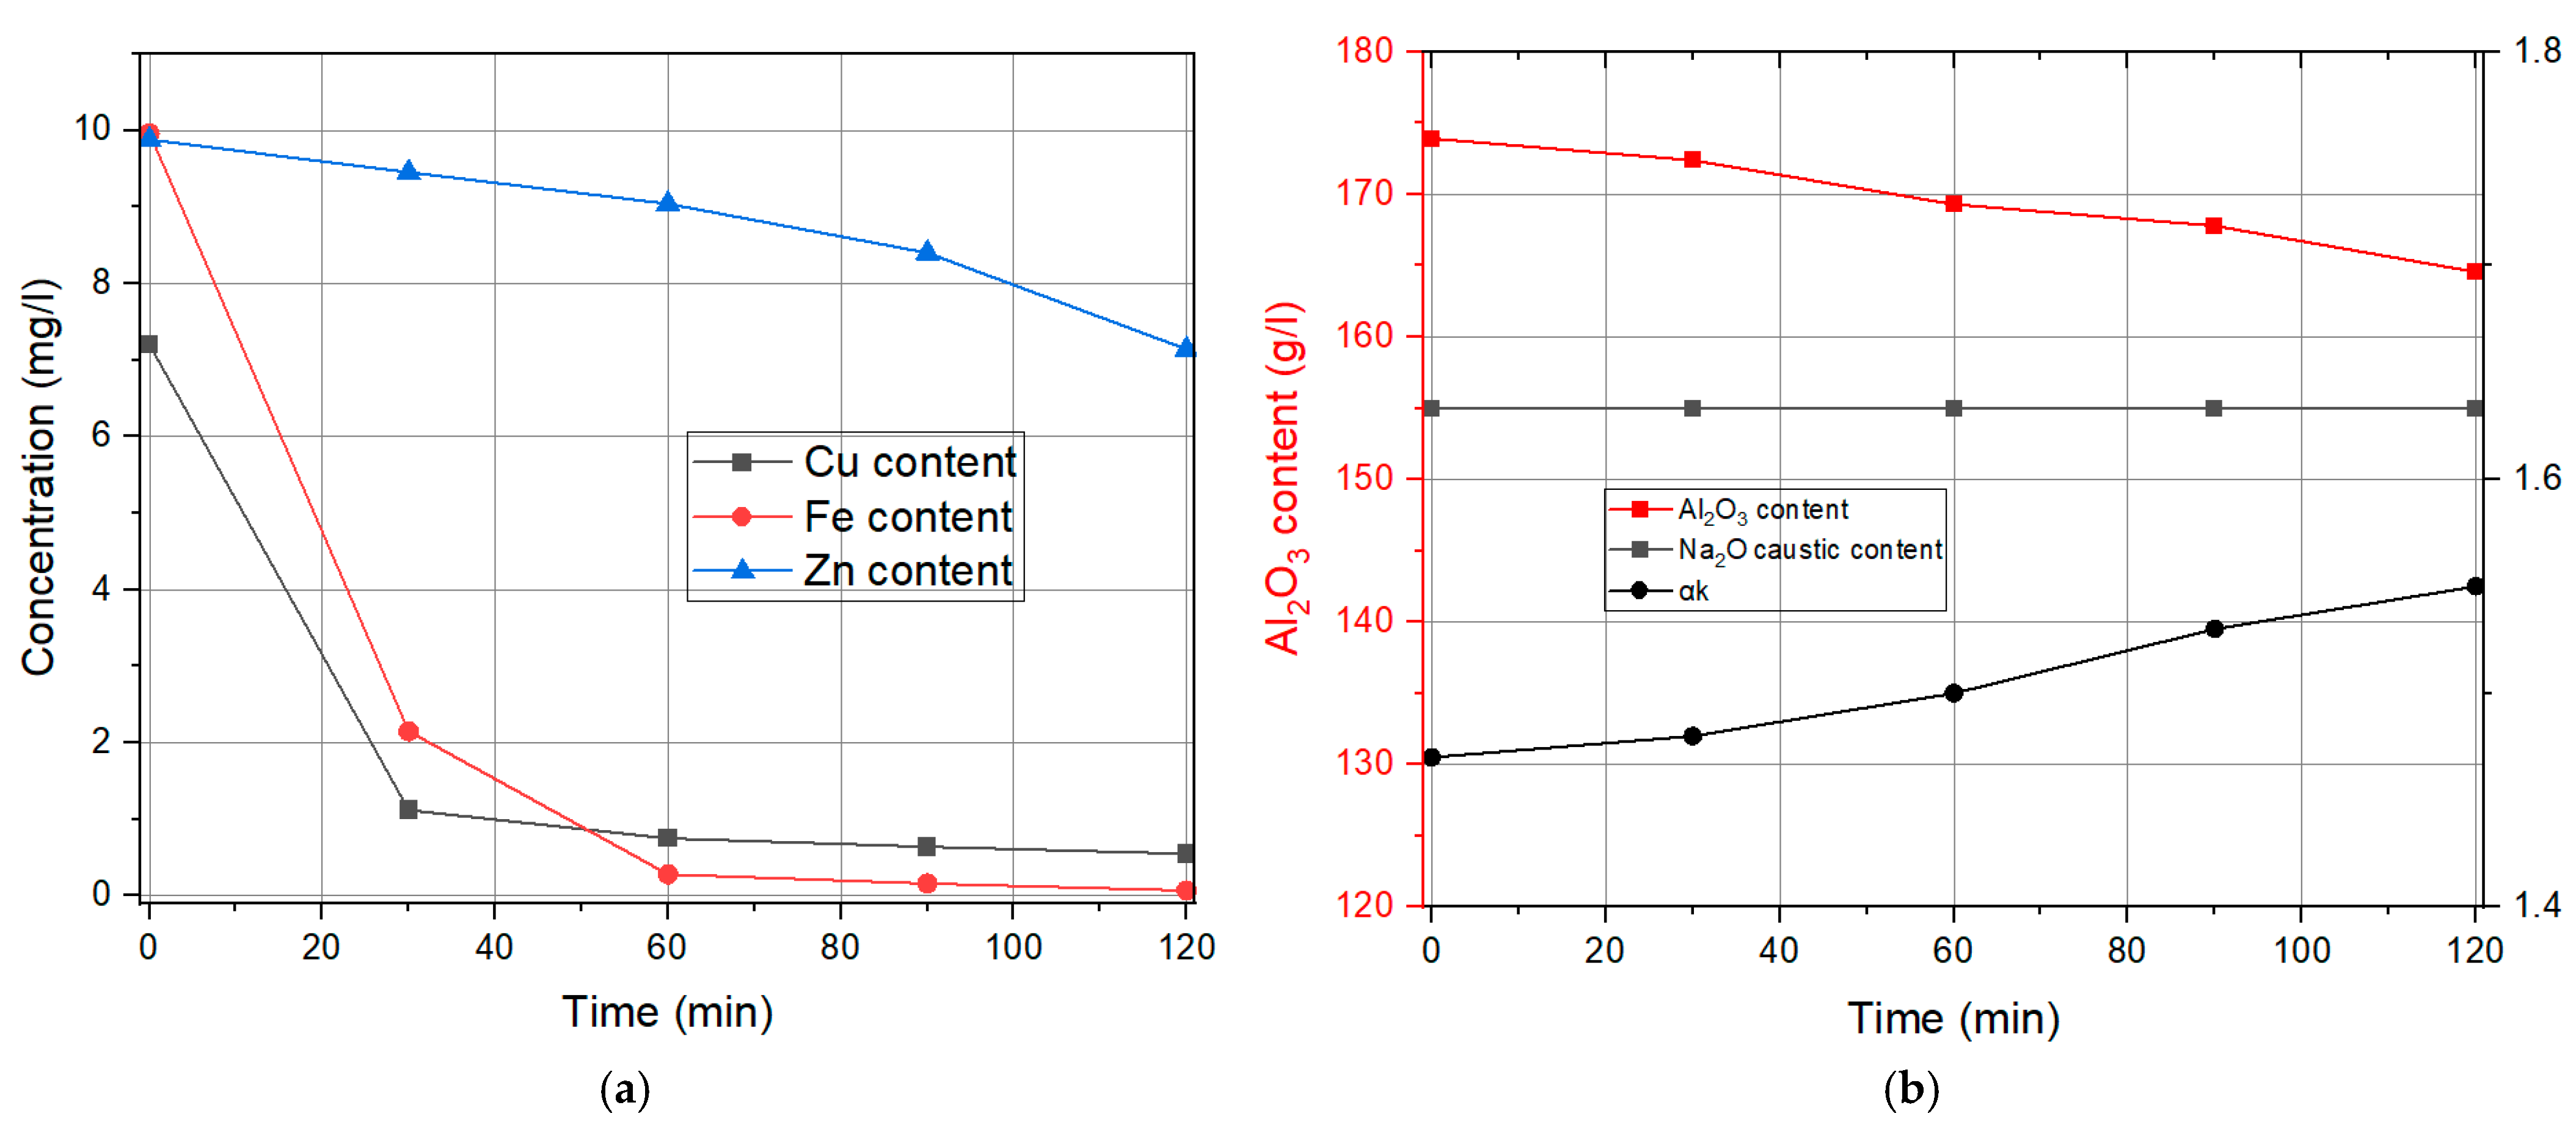
3.1. Liquid Phase Results
Influence of the Specific Surface Area of Finely Precipitated Hydrate
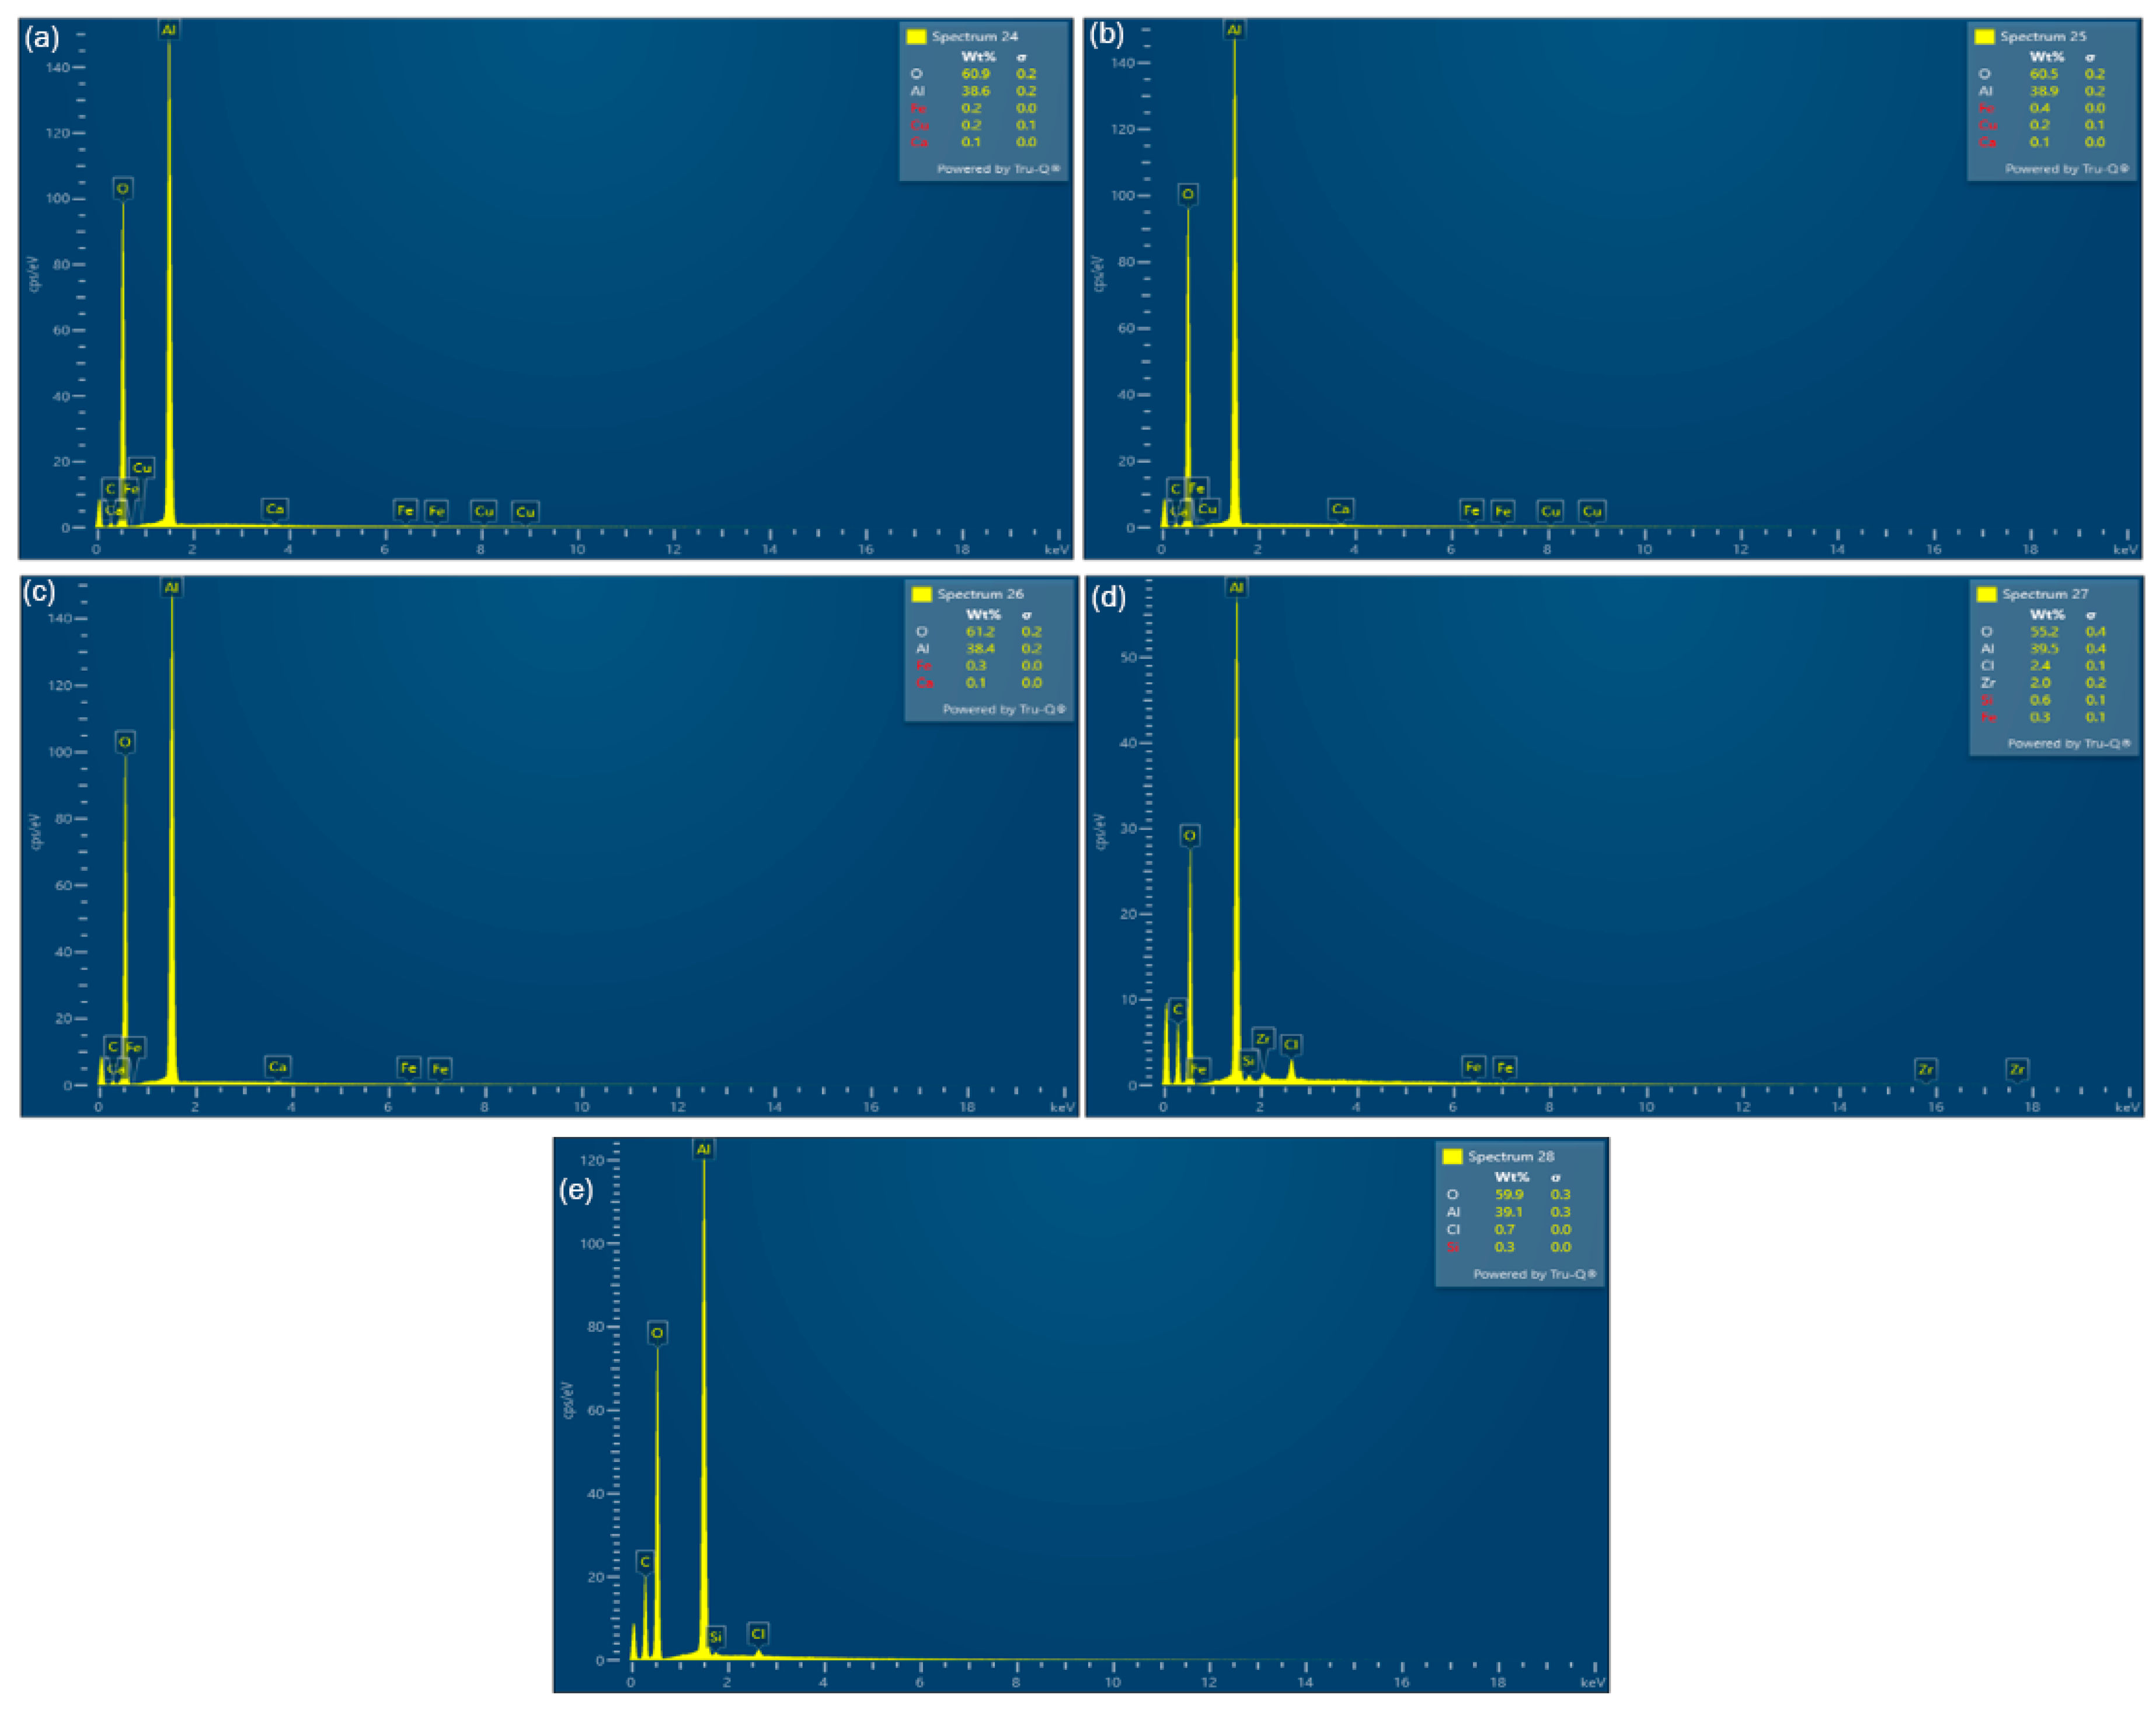
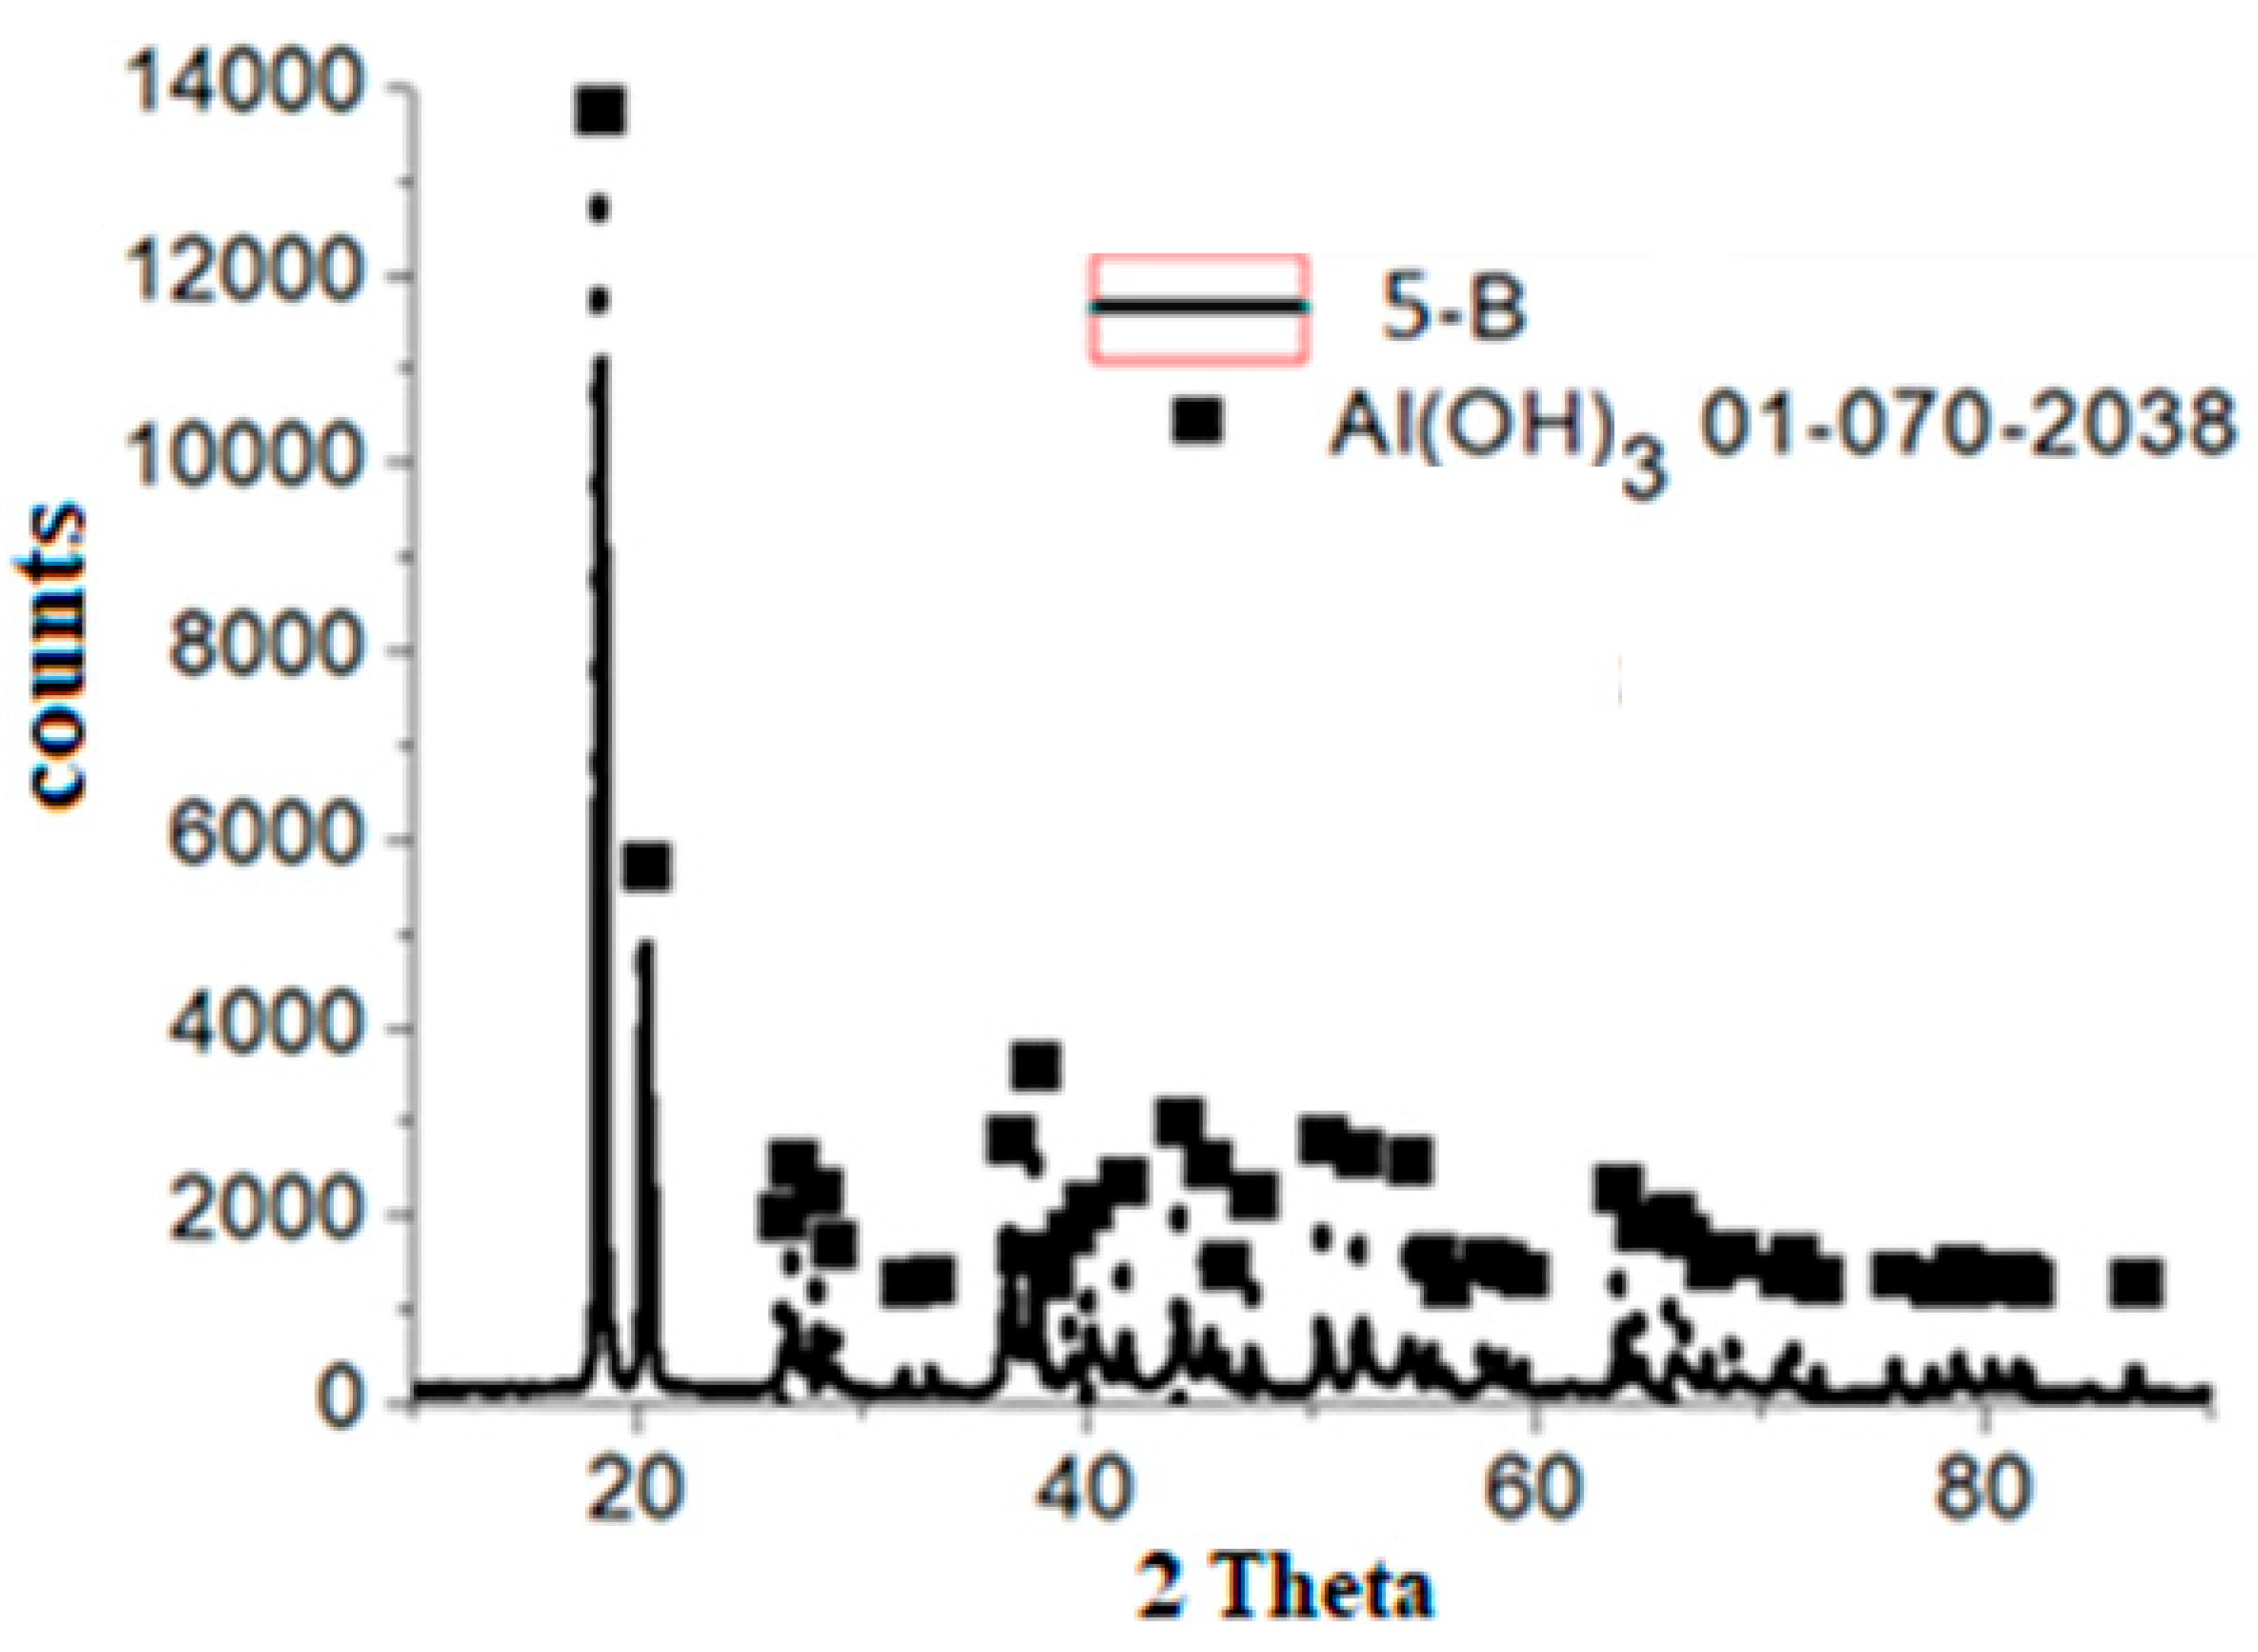
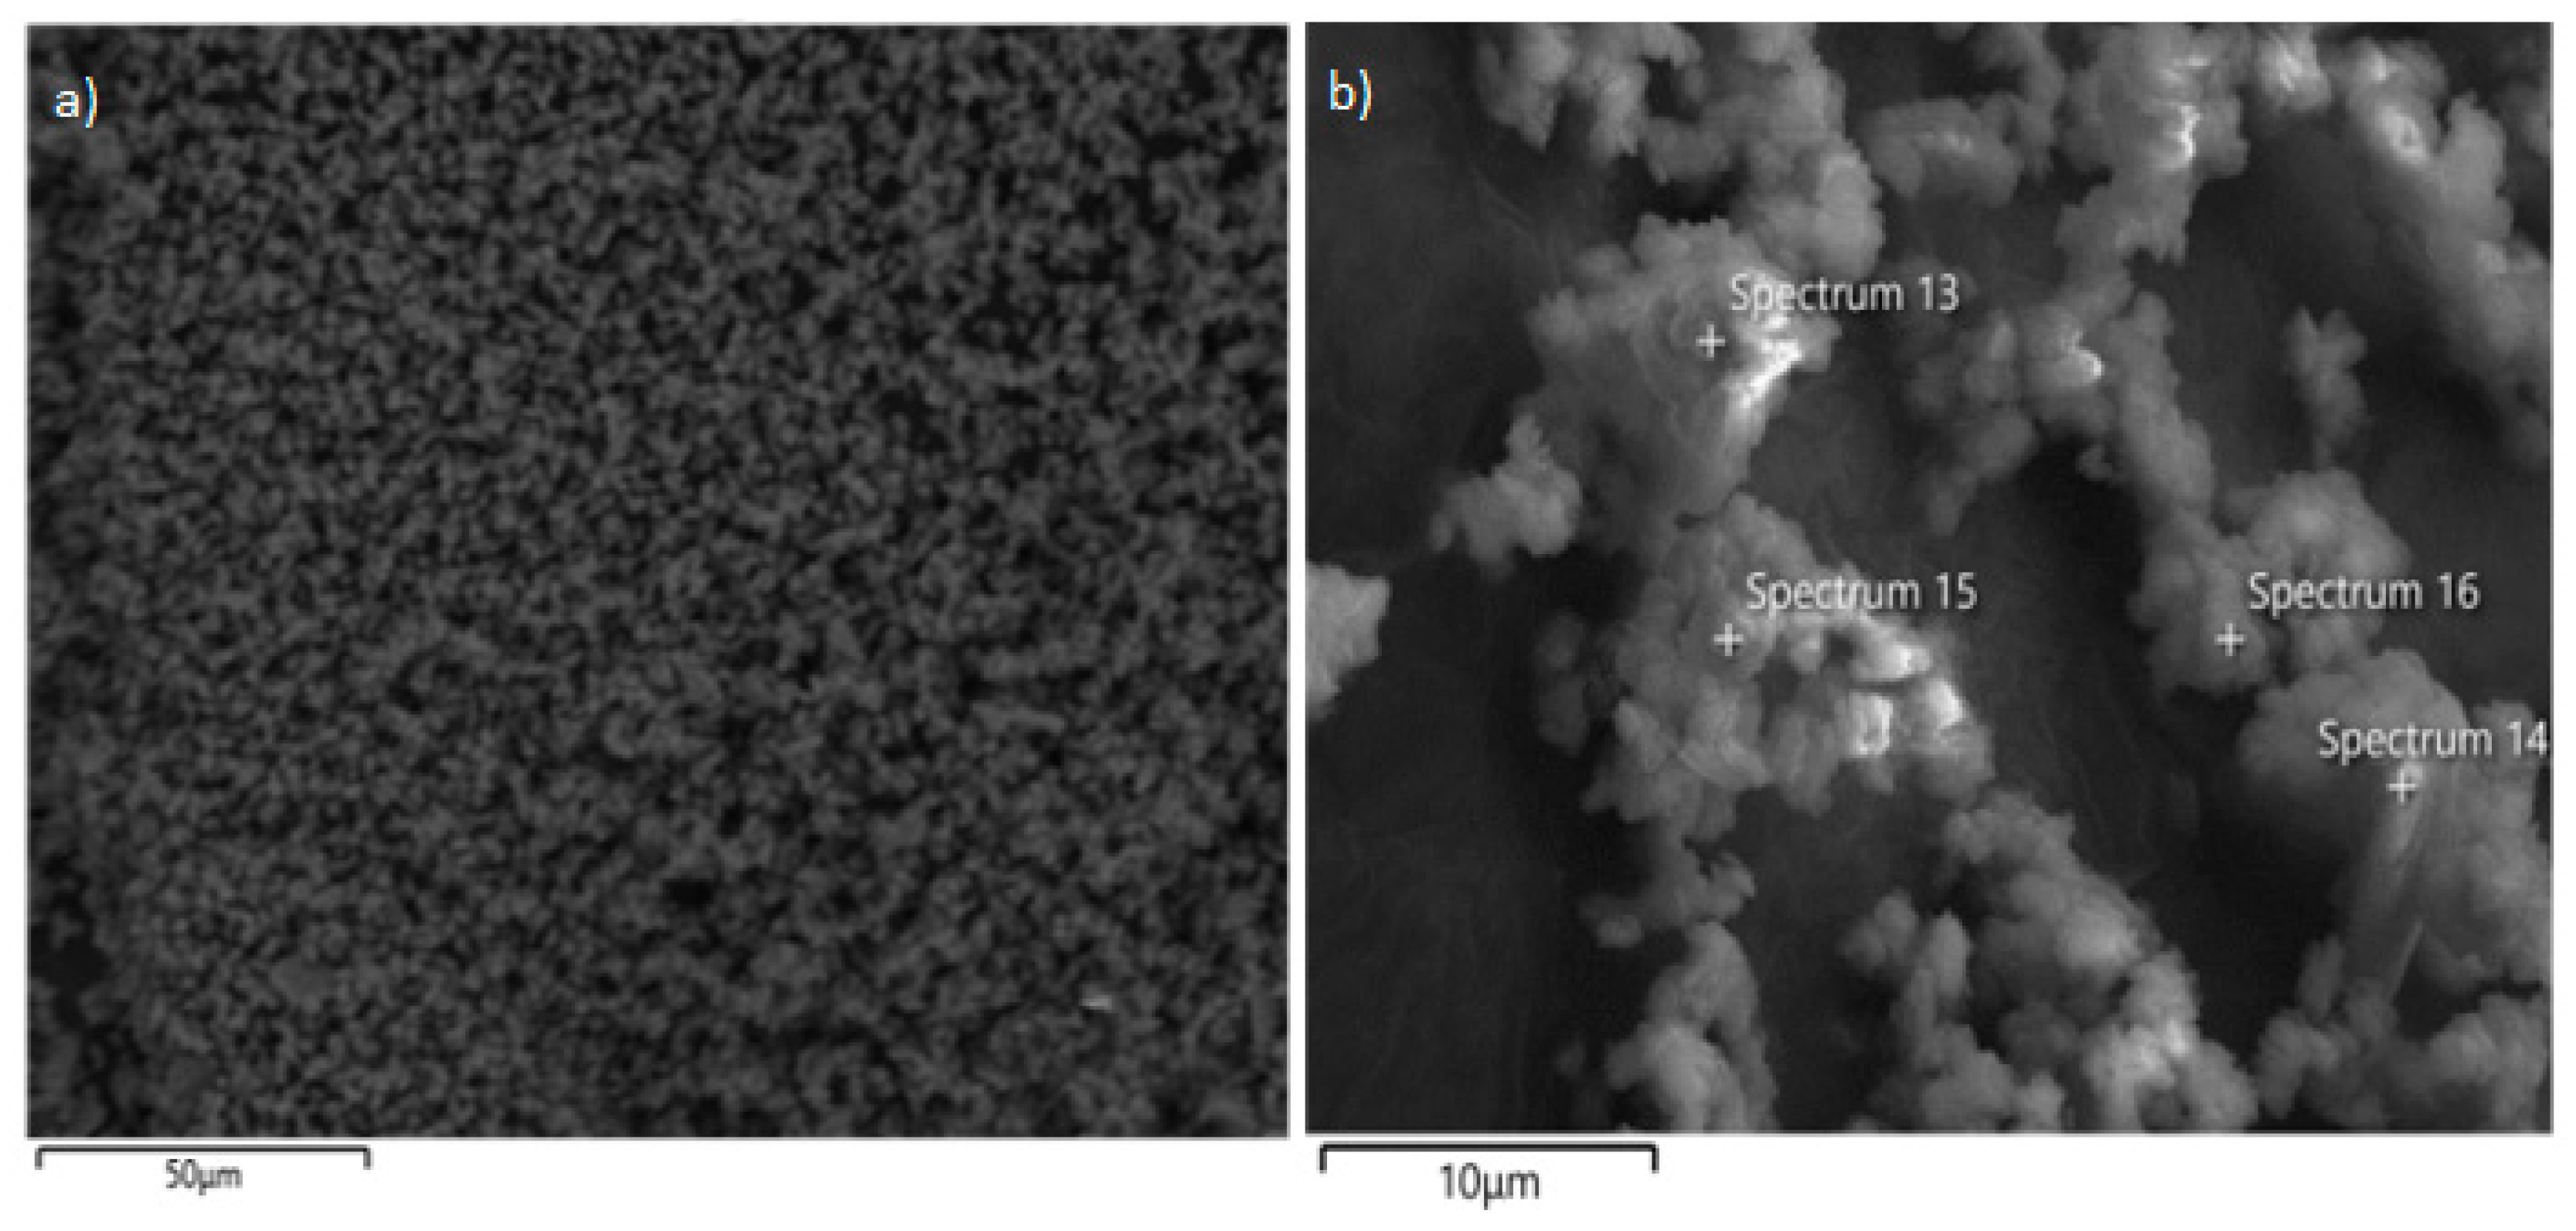
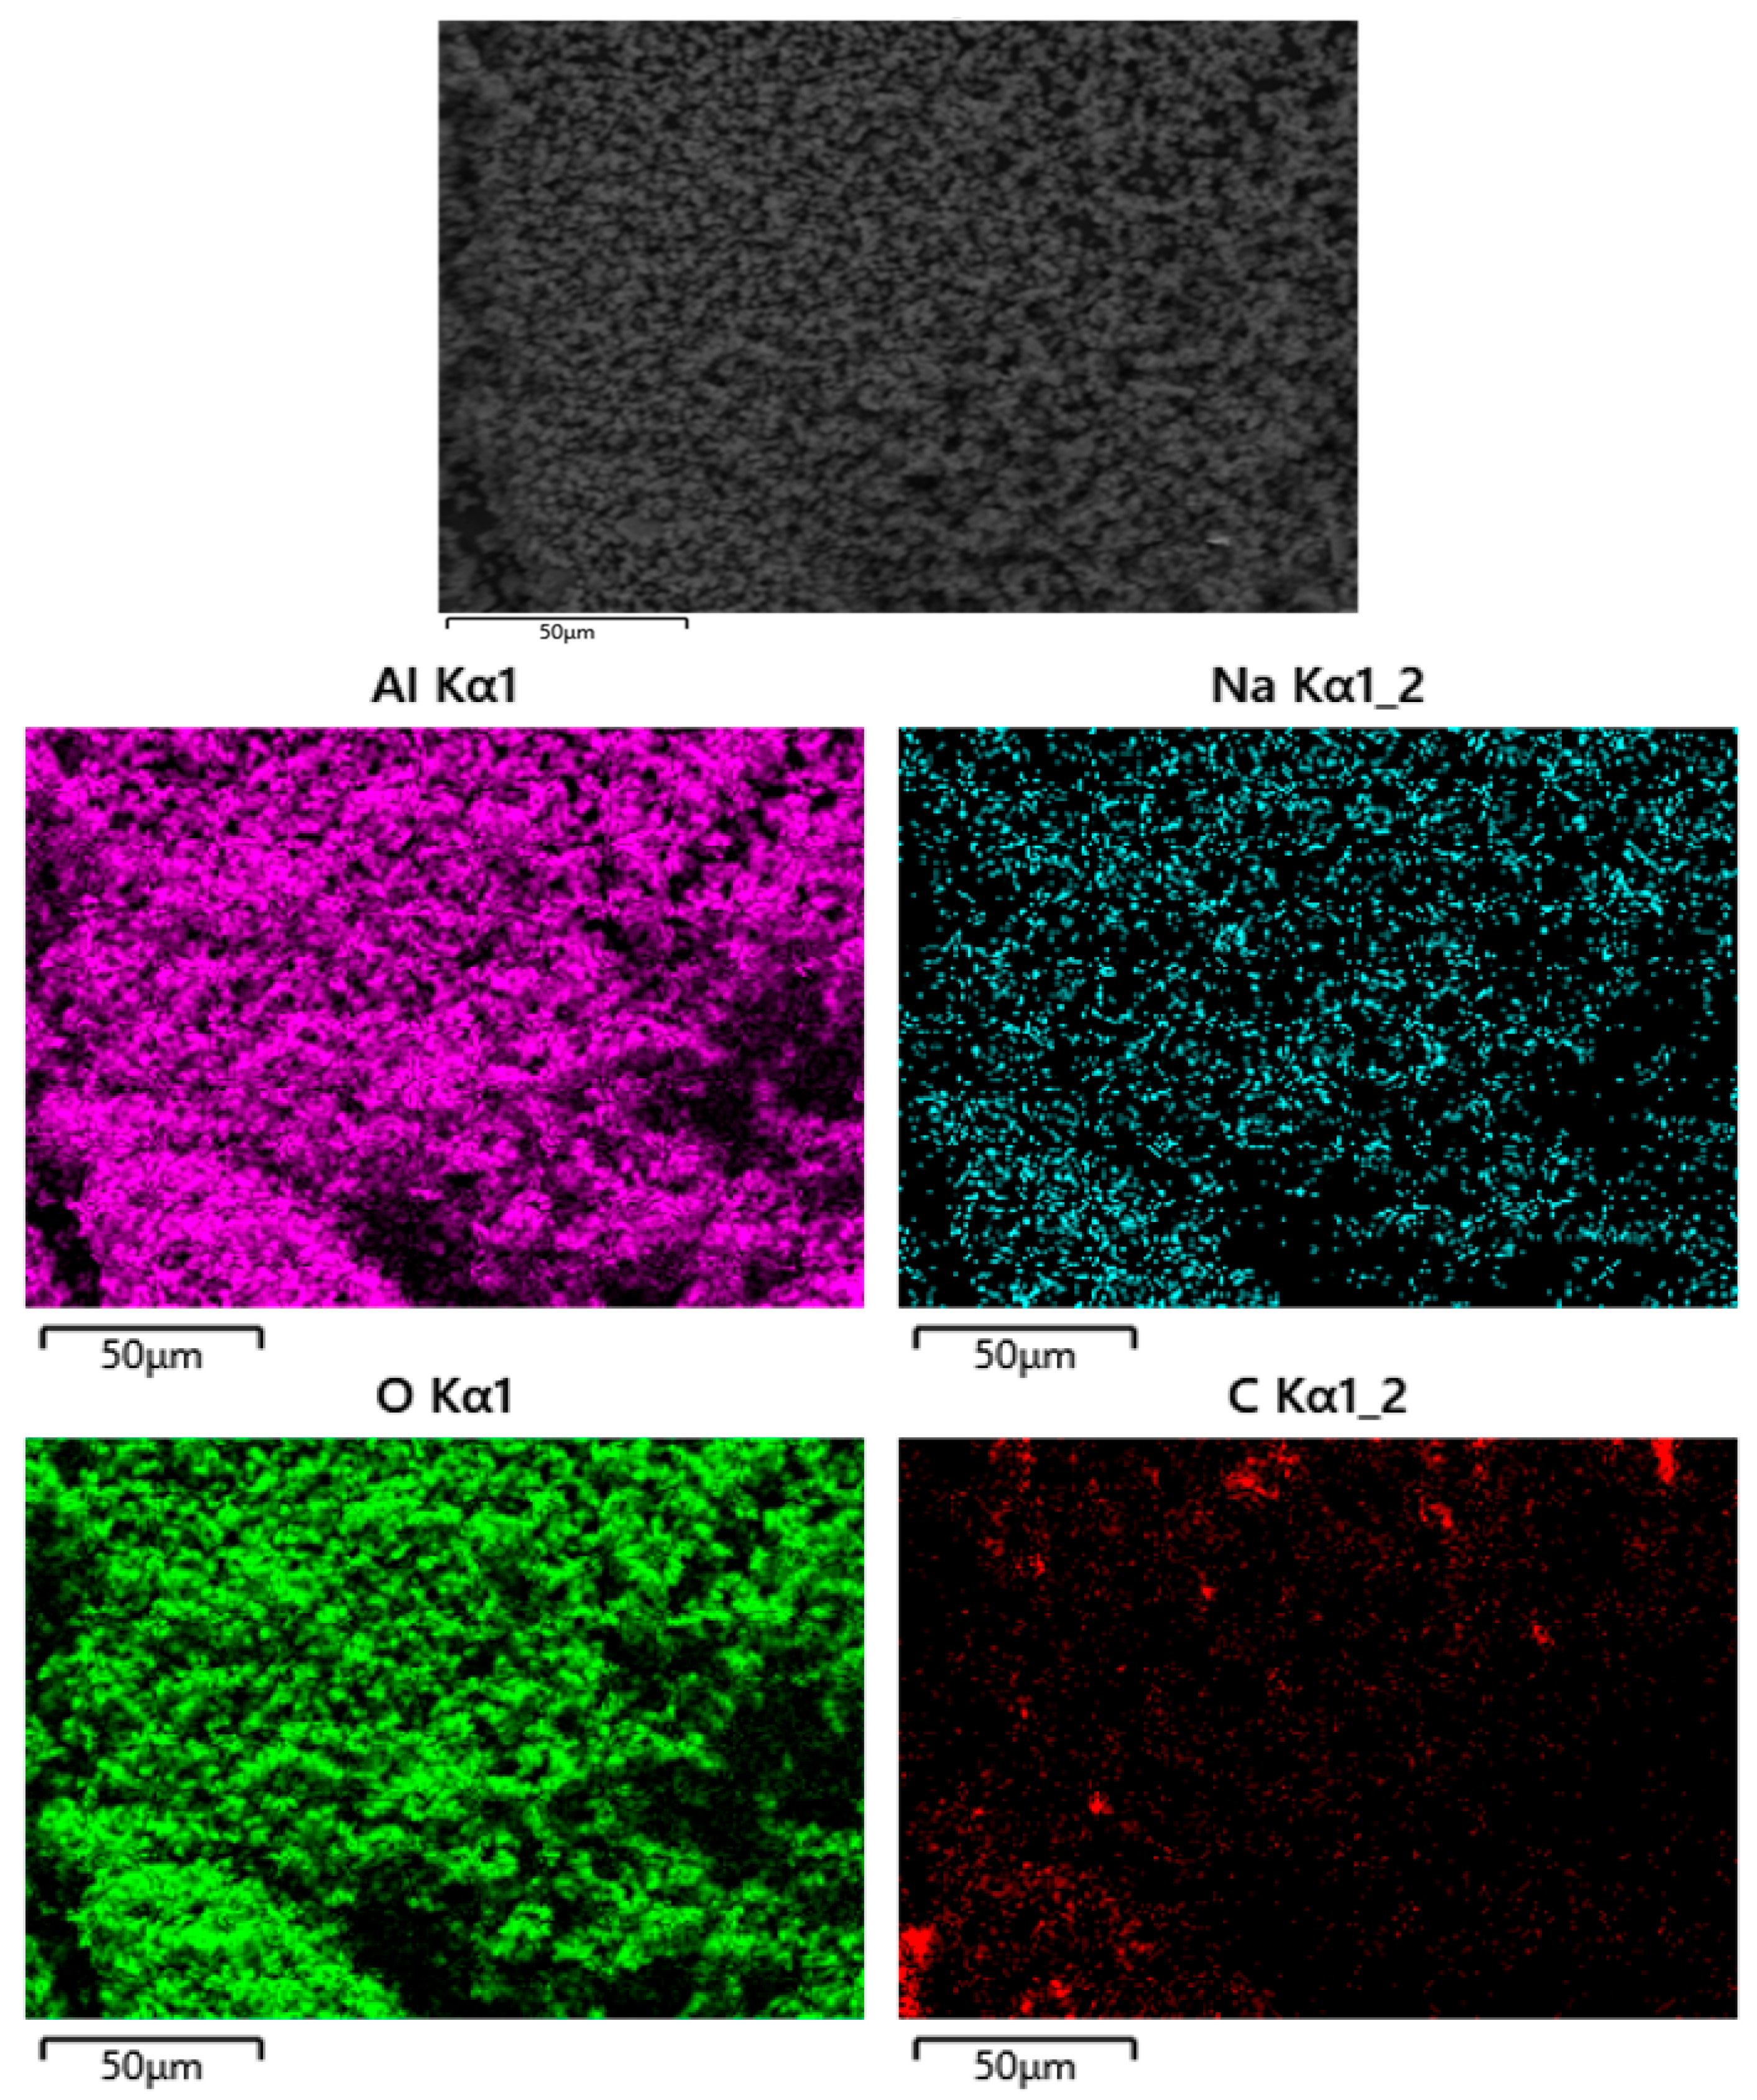
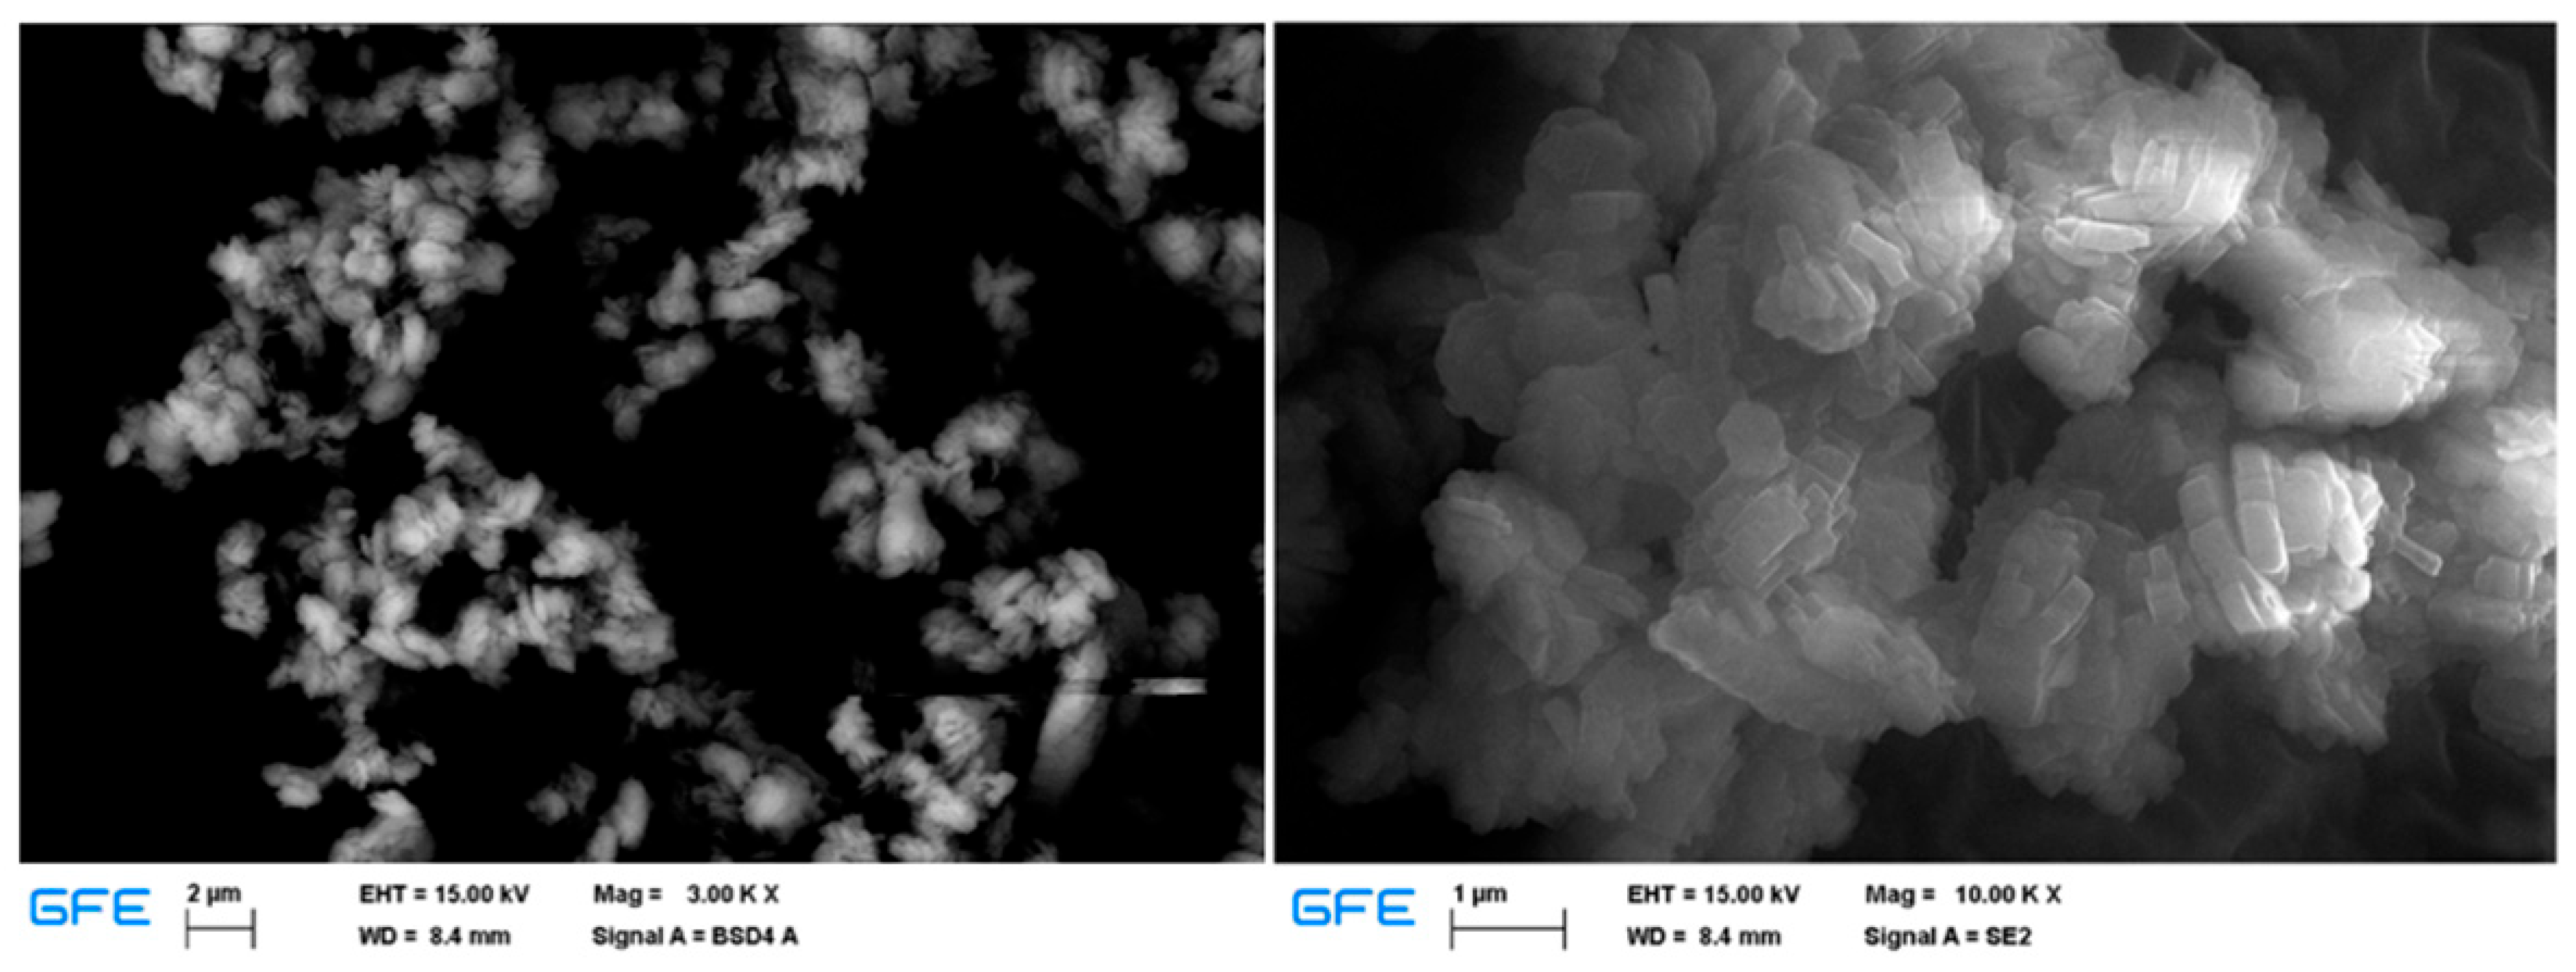
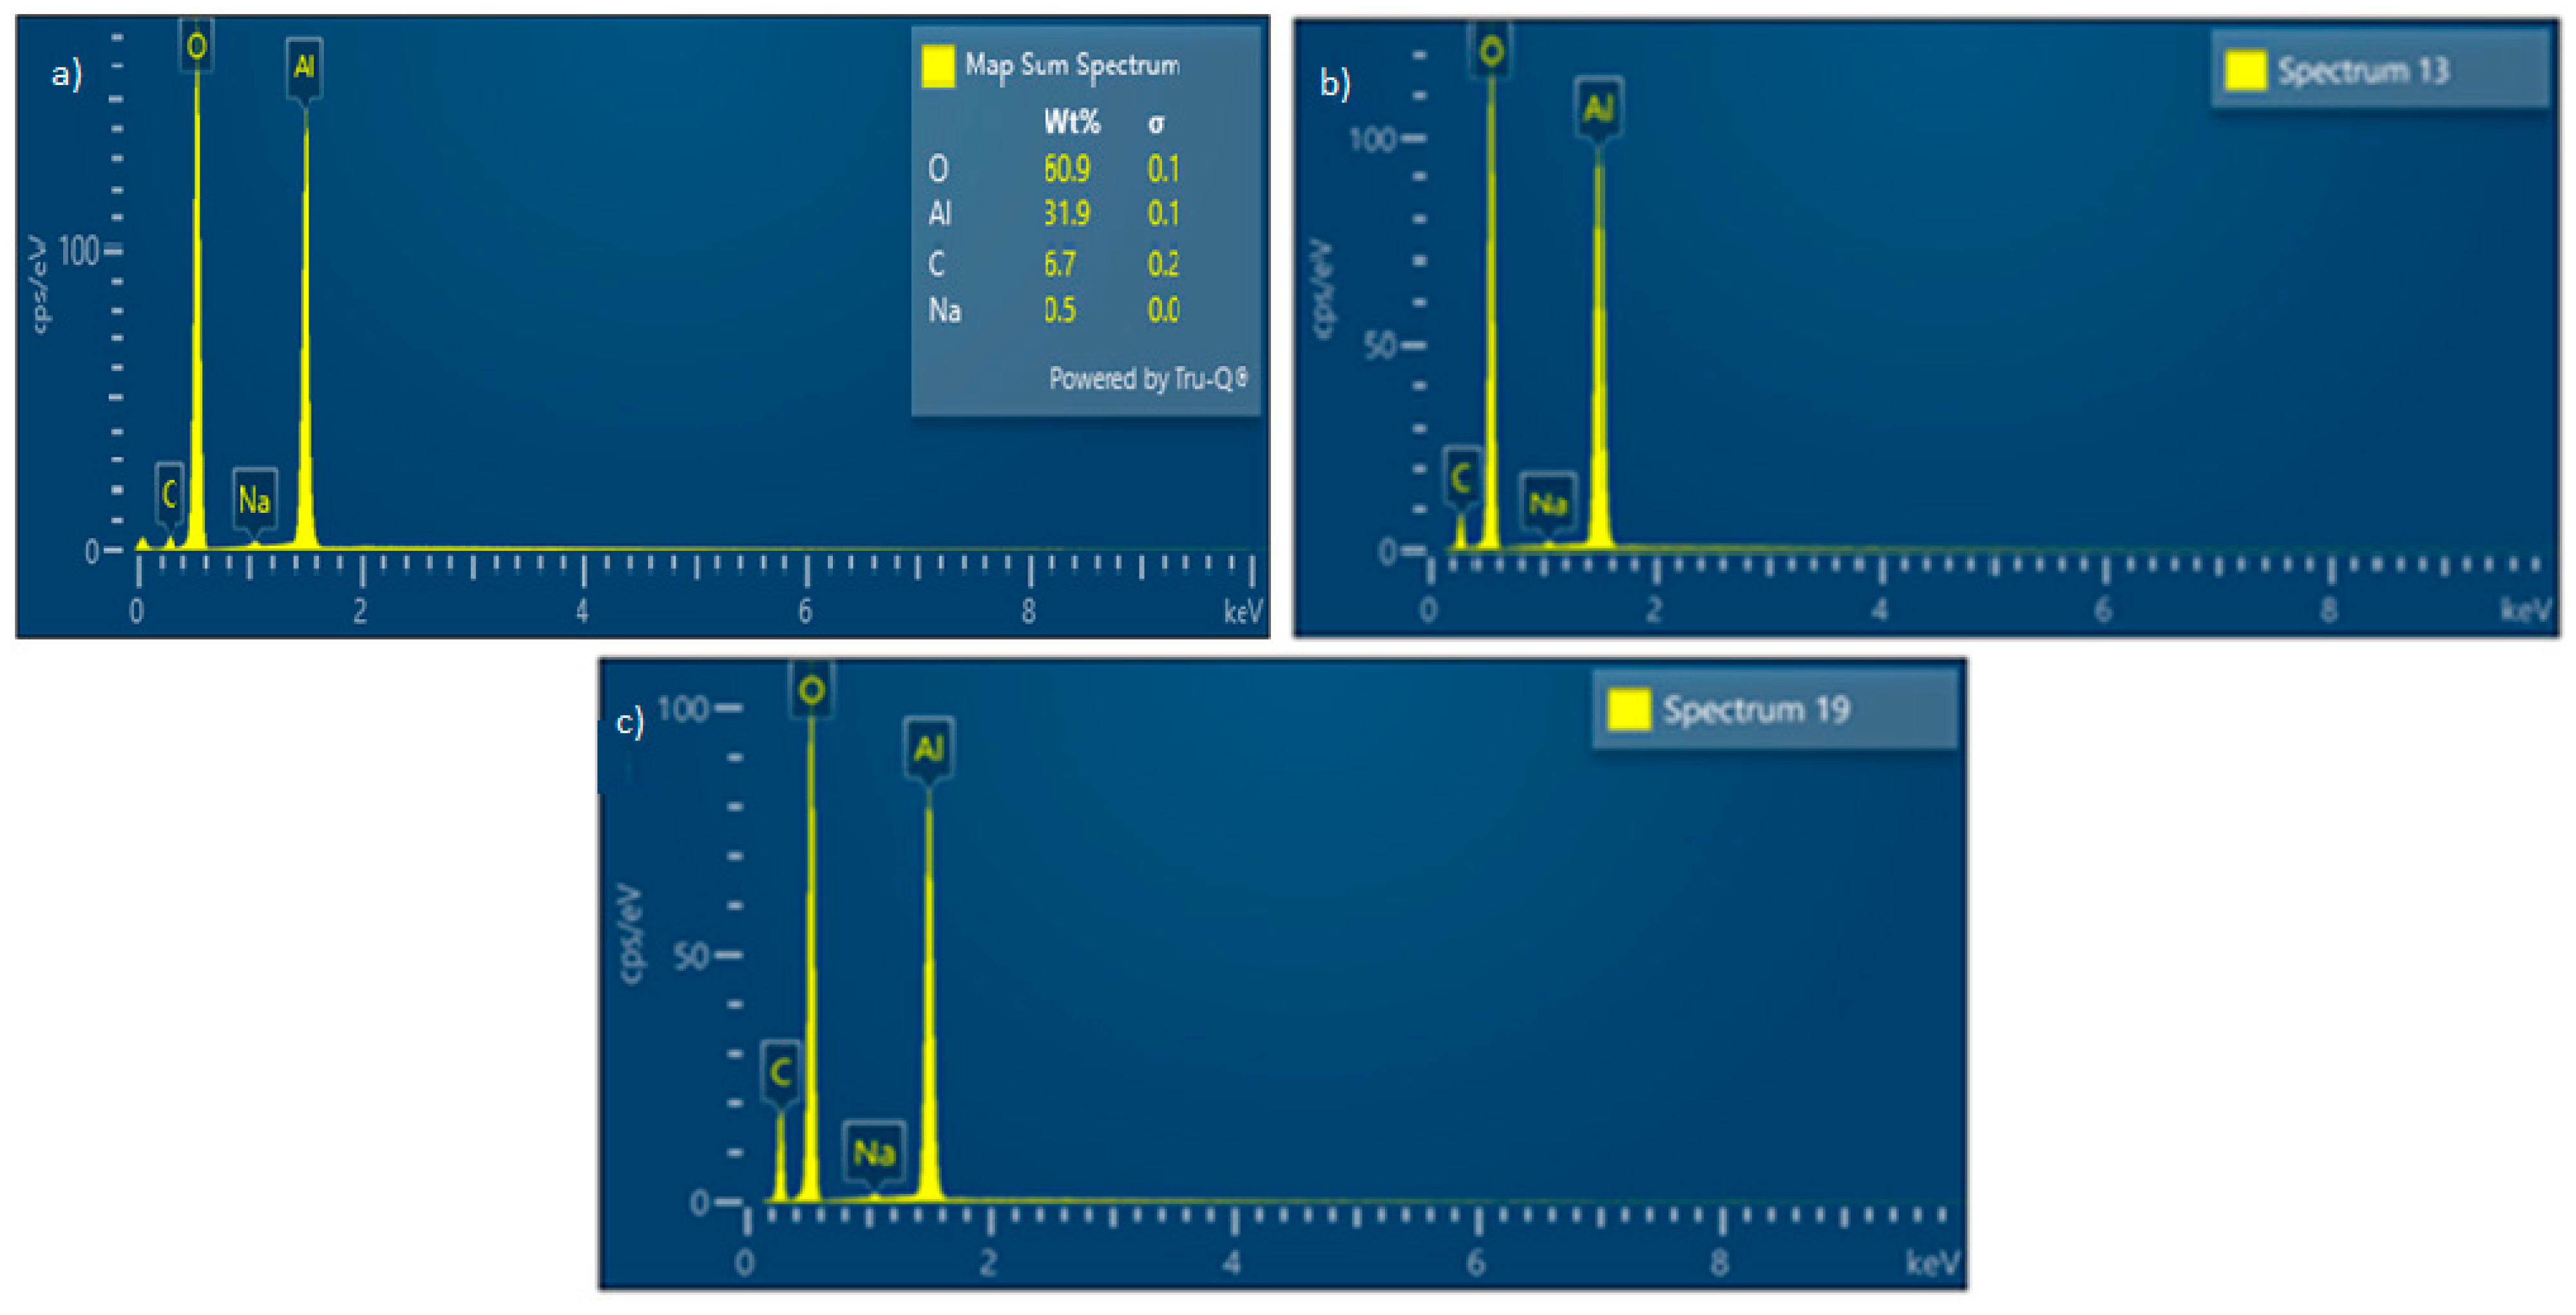
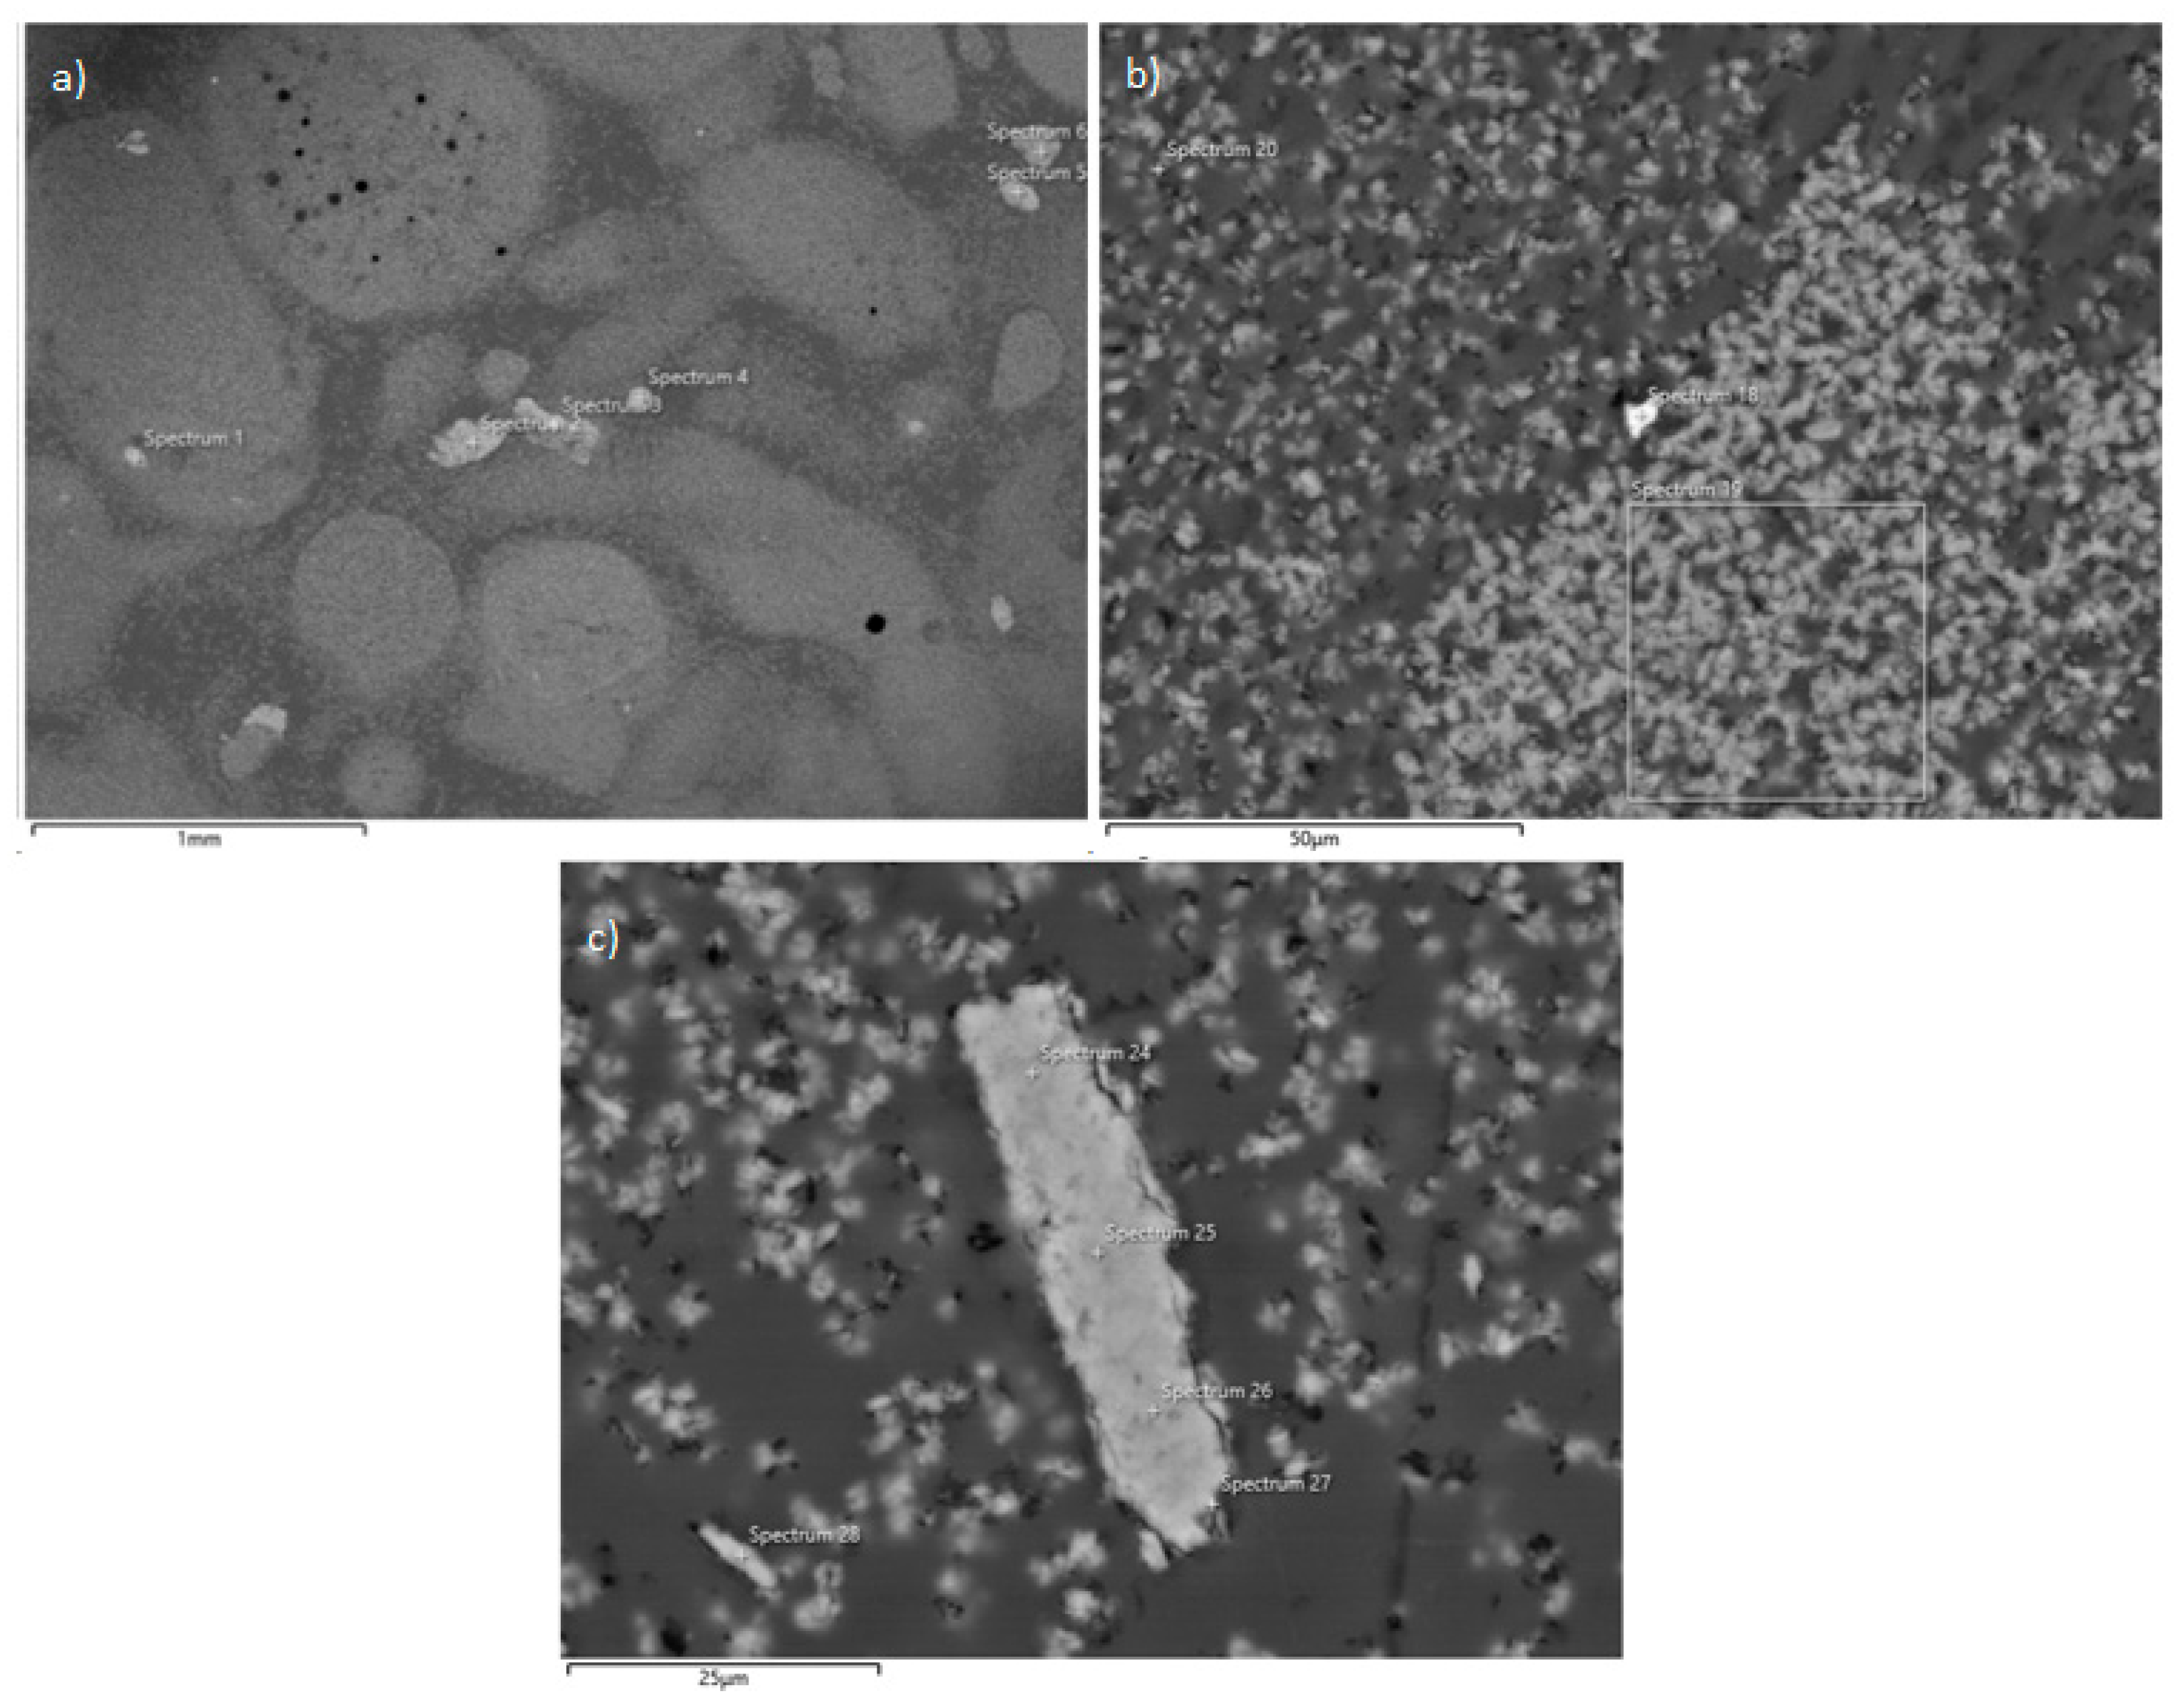
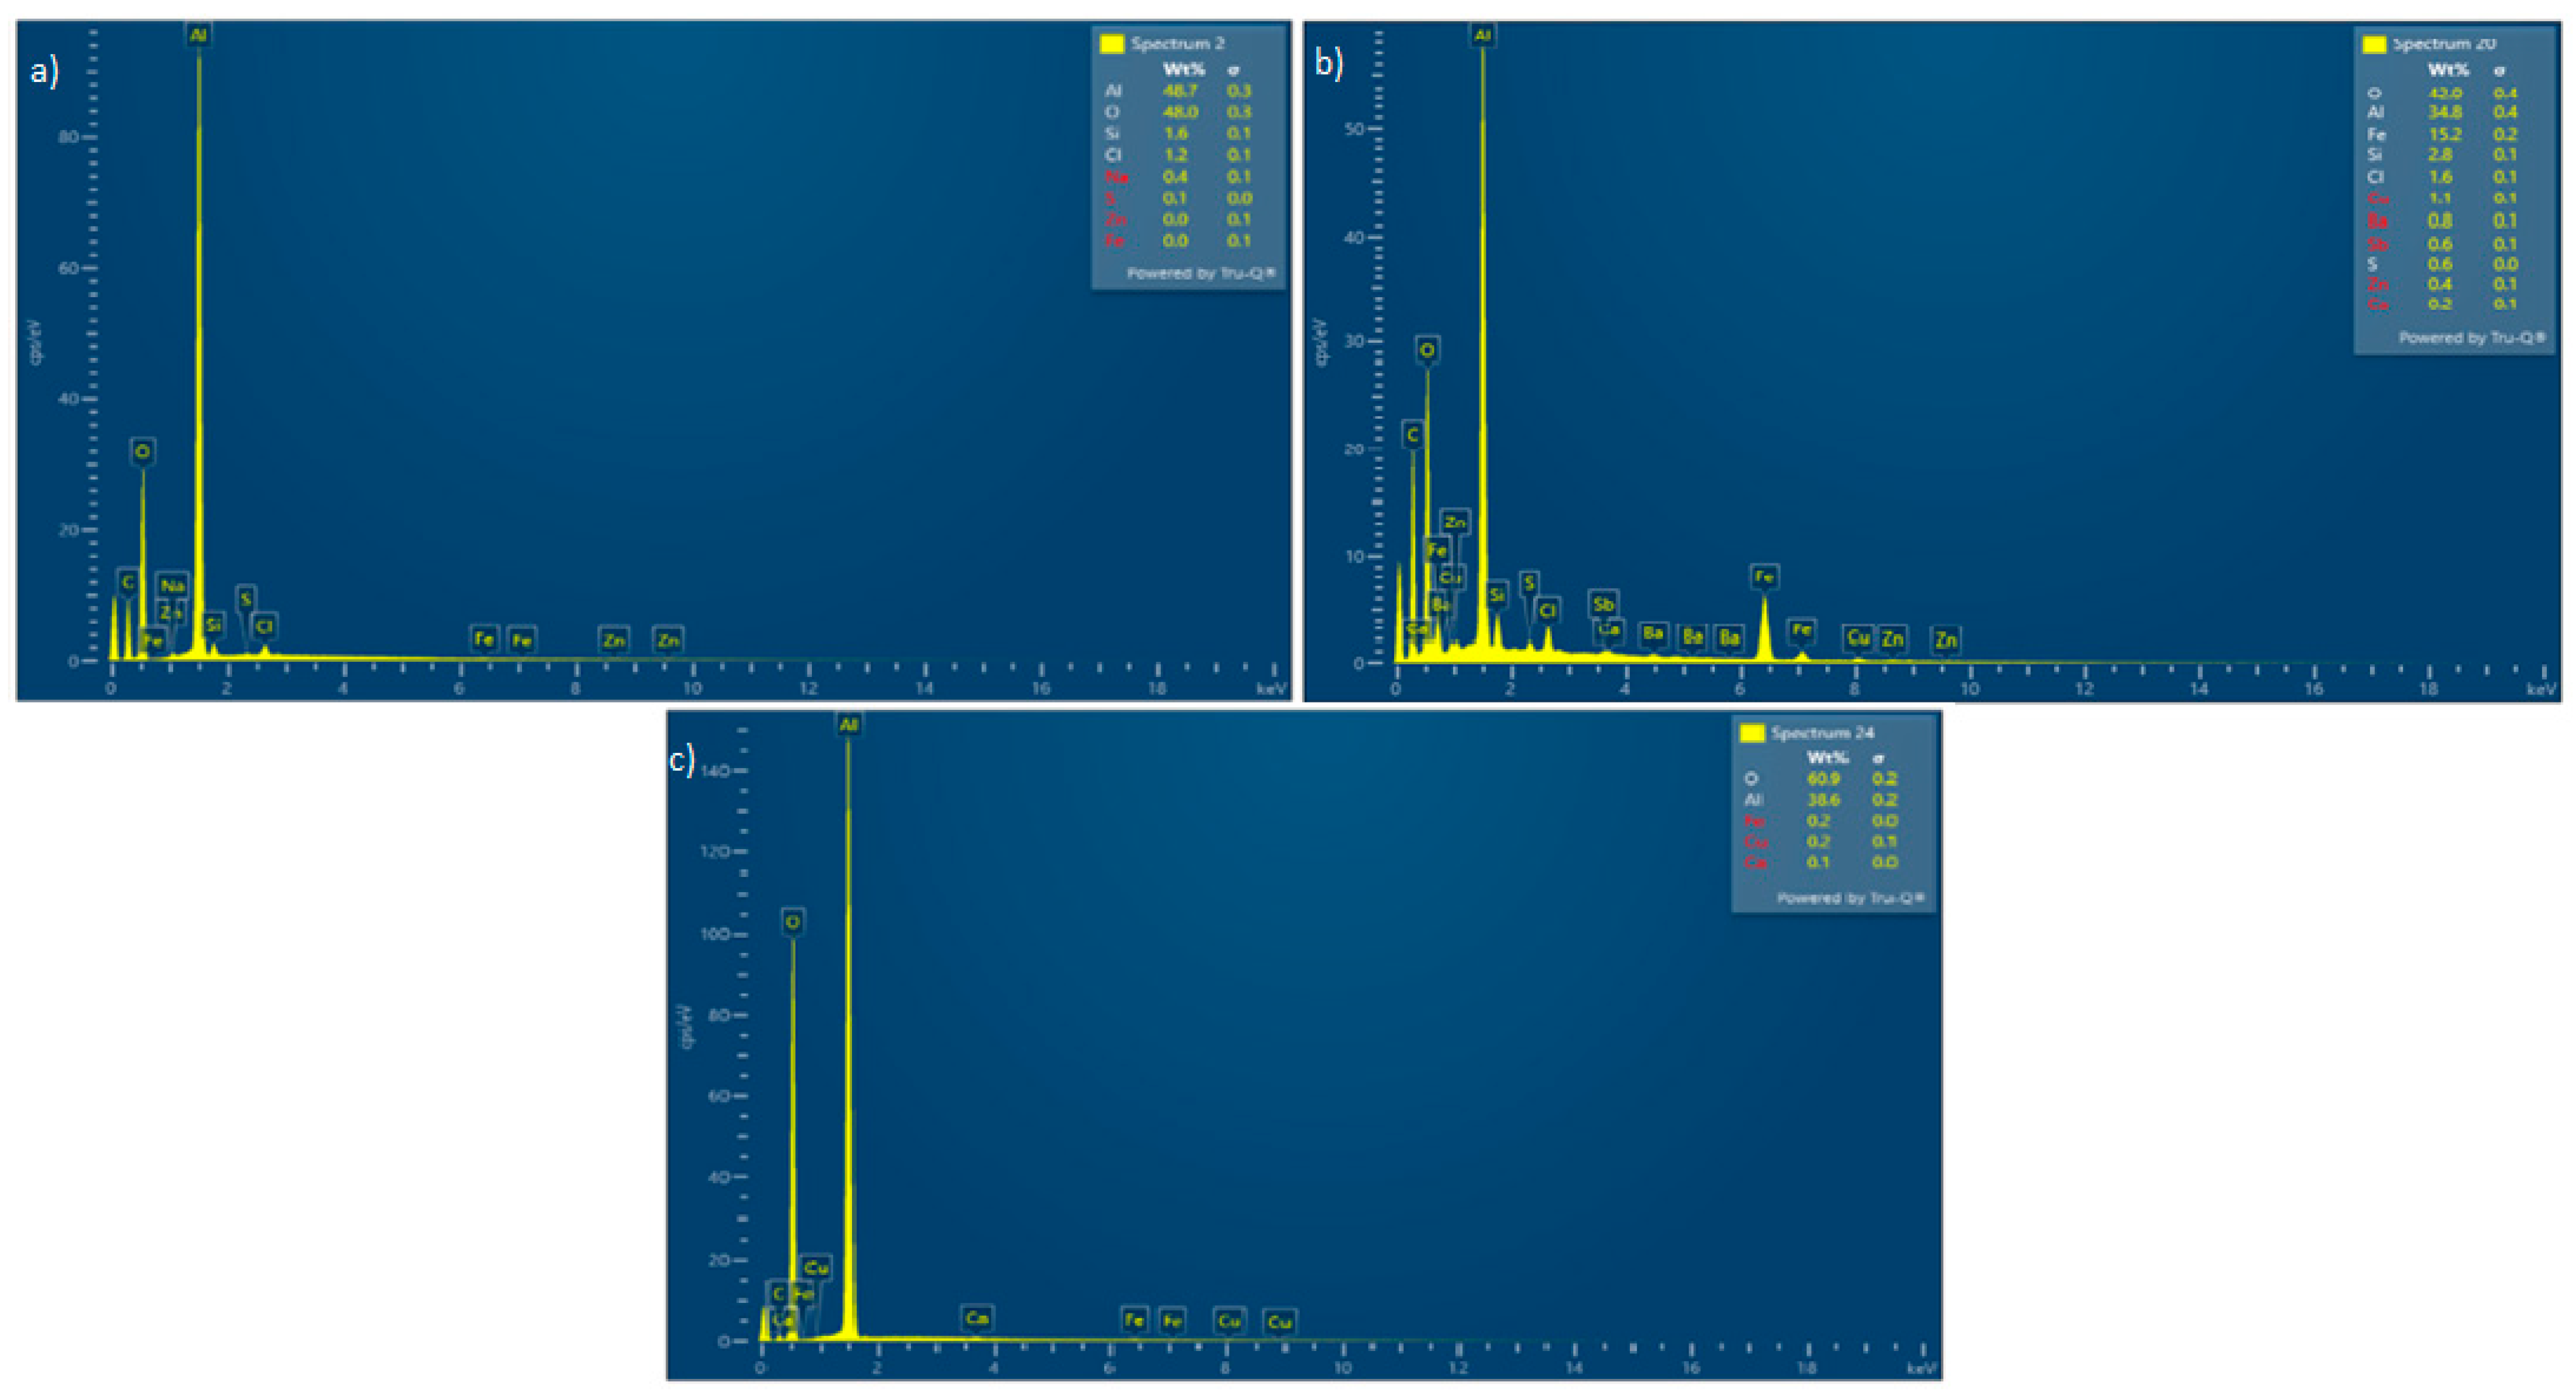
3.2. Solid Residue Results
4. Conclusions
Author Contributions
Funding
Data Availability Statement
Conflicts of Interest
Appendix A

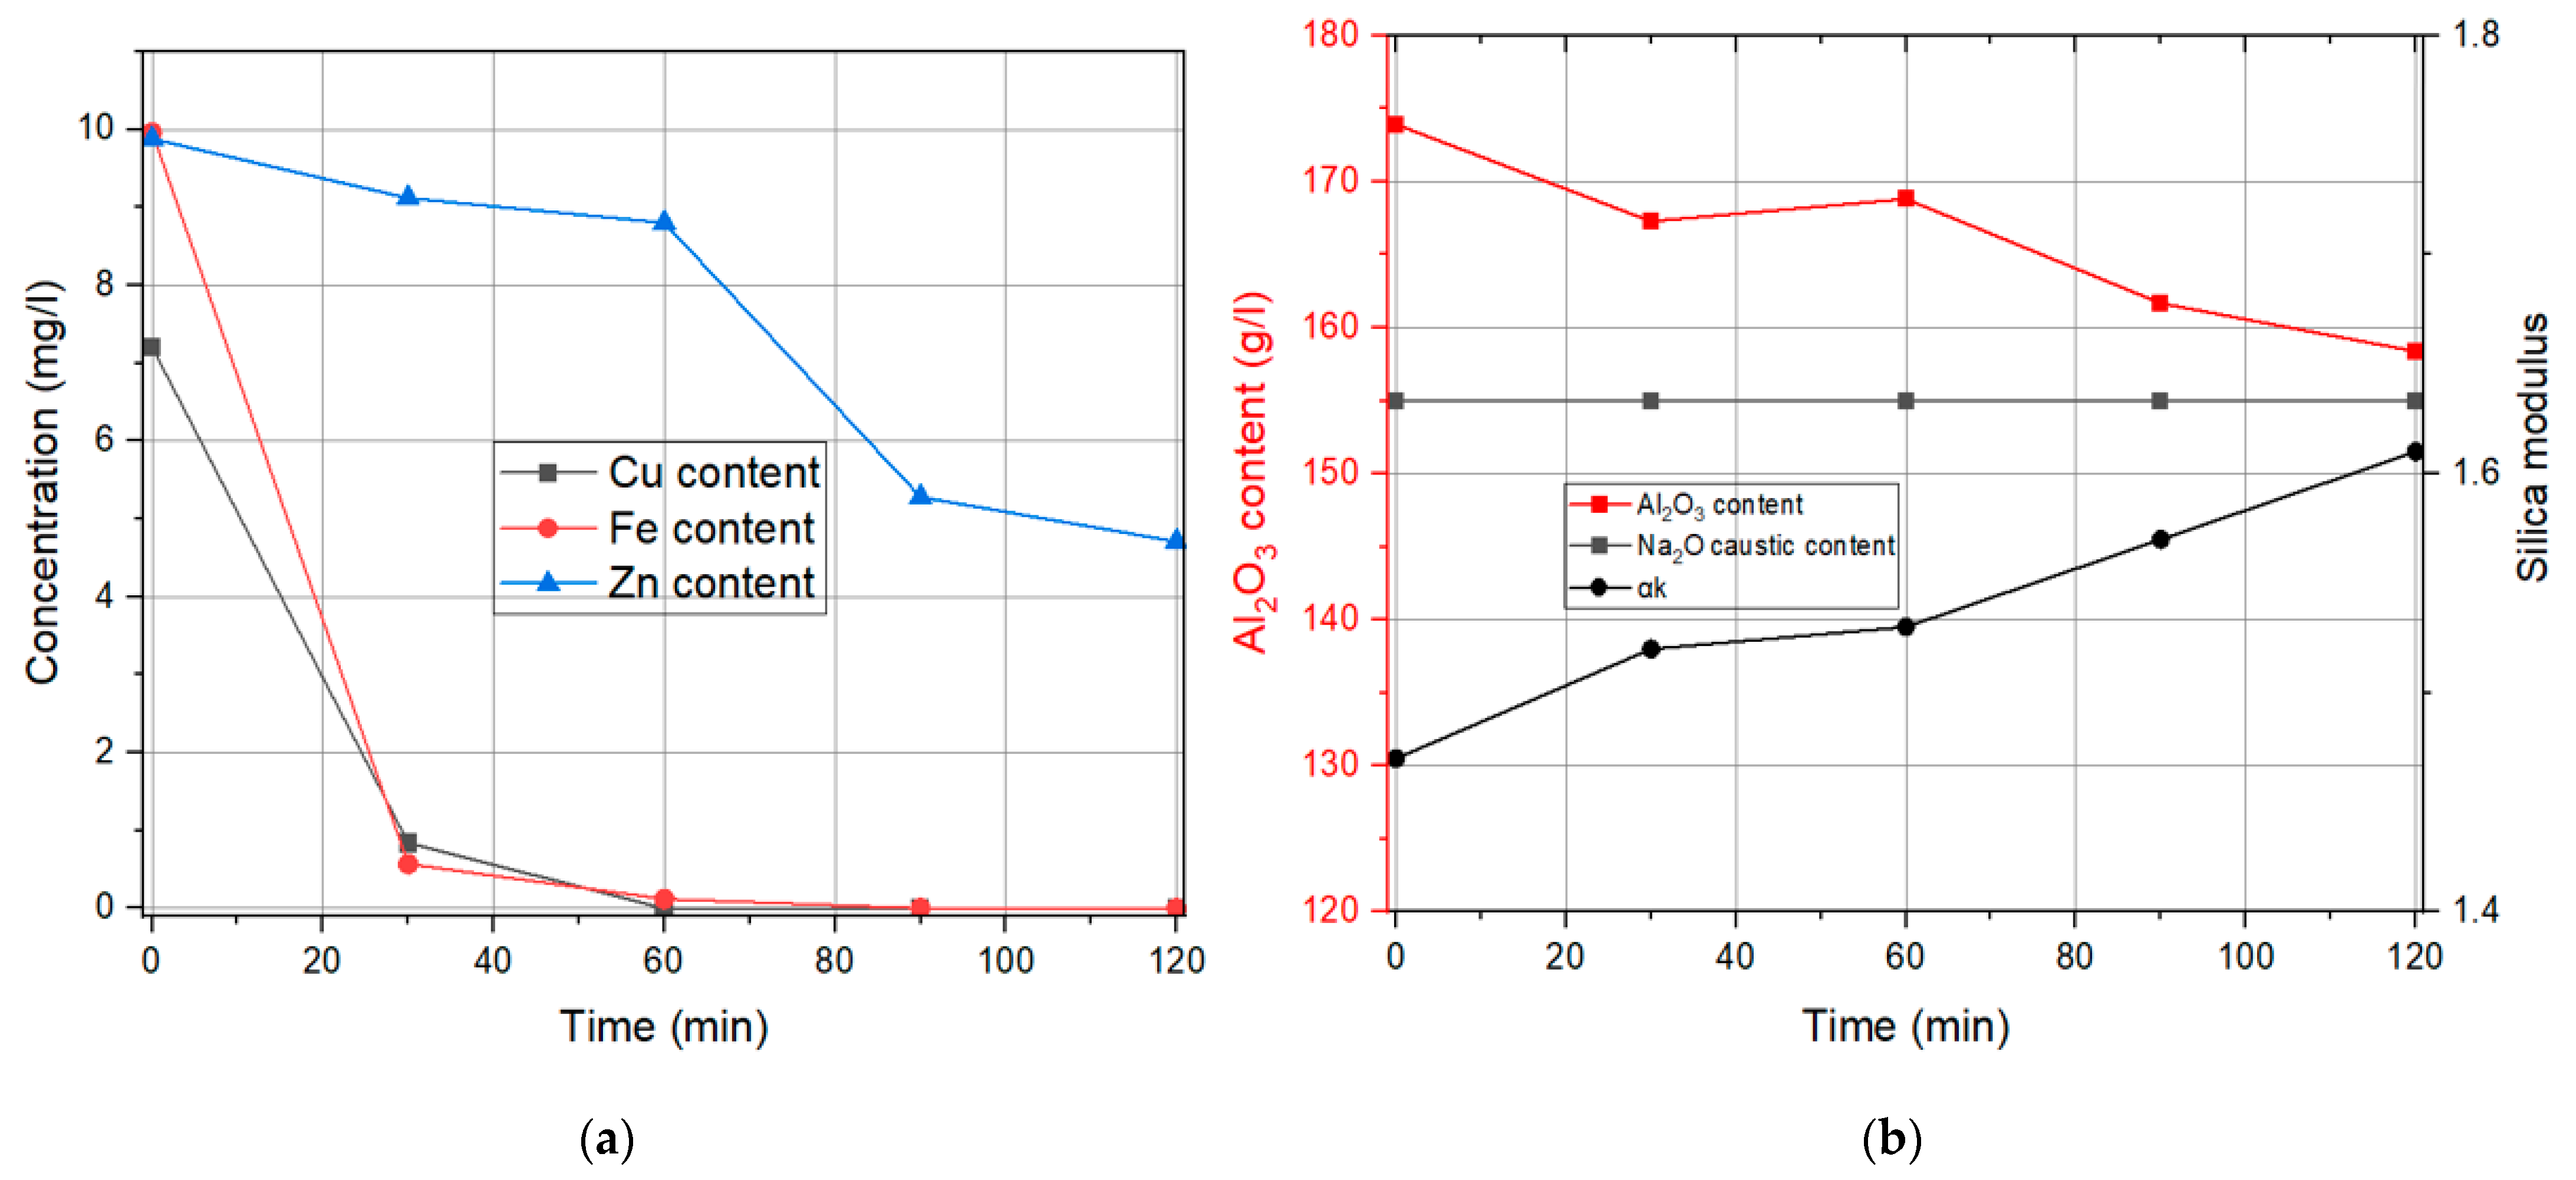
| Time | Cu Content | Fe Content | Zn Content | Na2Oc | Al2O3 | αk |
|---|---|---|---|---|---|---|
| min | mg/L | mg/L | mg/L | g/L | g/L | / |
| 0 | 7.2 | 9.96 | 9.88 | 155 | 173.91 | 1.47 |
| 30 | 1.12 | 2.15 | 9.45 | 155 | 172.38 | 1.48 |
| 60 | 0.75 | 0.28 | 9.04 | 155 | 169.3 | 1.5 |
| 90 | 0.64 | 0.16 | 8.4 | 156.55 | 167.79 | 1.53 |
| 120 | 0.55 | 0.07 | 7.14 | 155 | 164.54 | 1.55 |
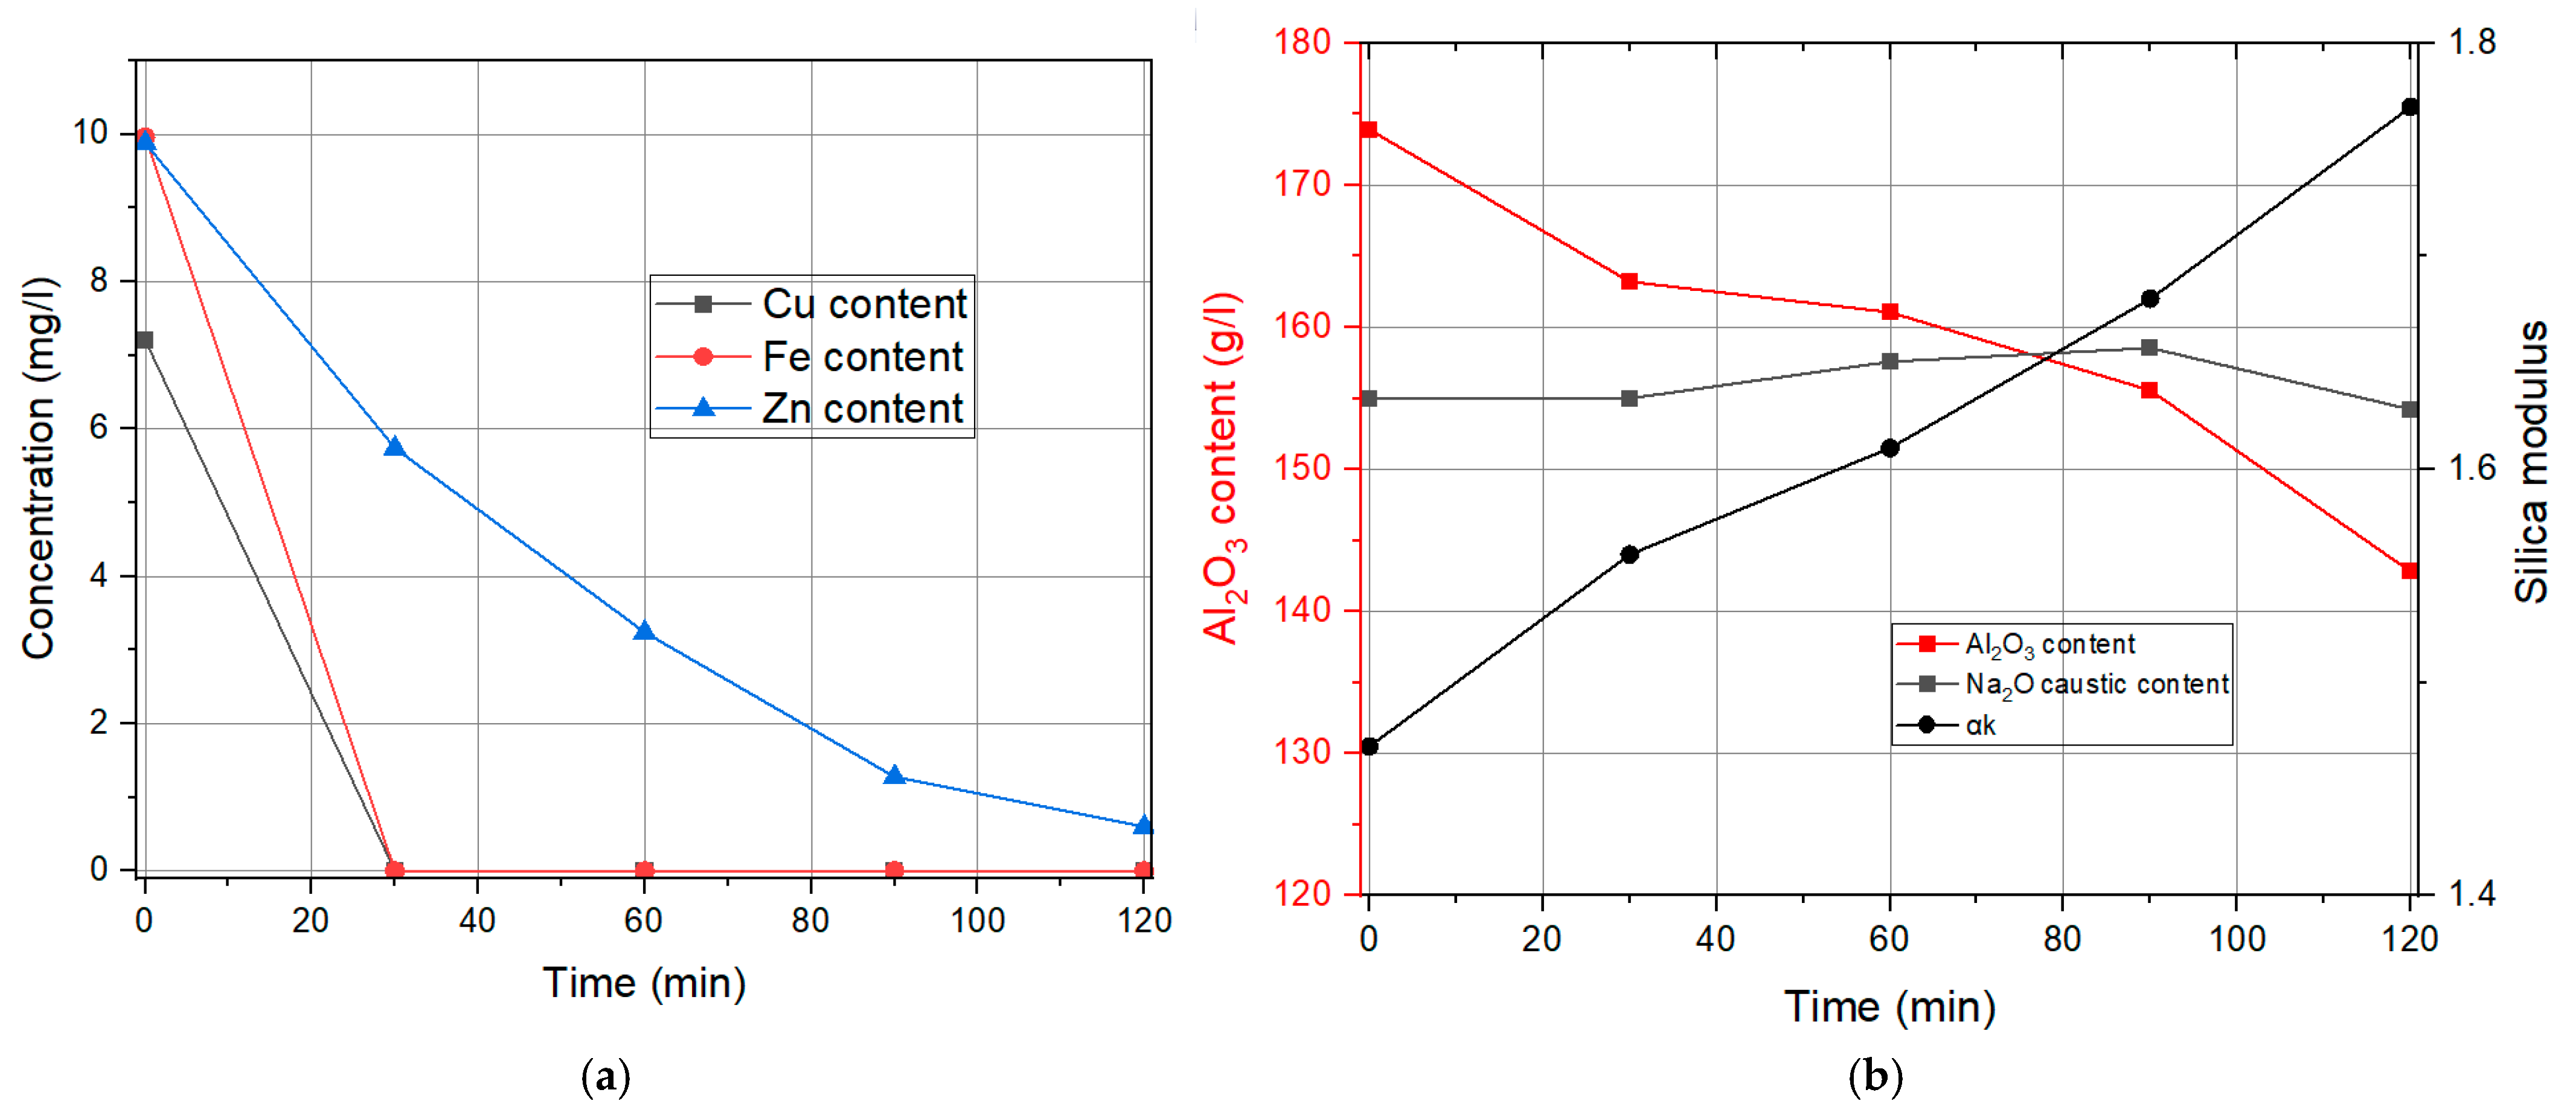
| Time | Cu Content | Fe Content | Zn Content | Na2Oc | Al2O3 | αk |
|---|---|---|---|---|---|---|
| min | mg/L | mg/L | mg/L | g/L | g/L | / |
| 0 | 7.2 | 9.96 | 9.88 | 155 | 173.91 | 1.47 |
| 30 | 0.84 | 0.57 | 9.12 | 155 | 167.28 | 1.52 |
| 60 | 0 | 0.12 | 8.8 | 157.32 | 168.81 | 1.53 |
| 90 | 0 | 0 | 5.28 | 155 | 161.67 | 1.57 |
| 120 | 0 | 0 | 4.71 | 155 | 158.37 | 1.61 |
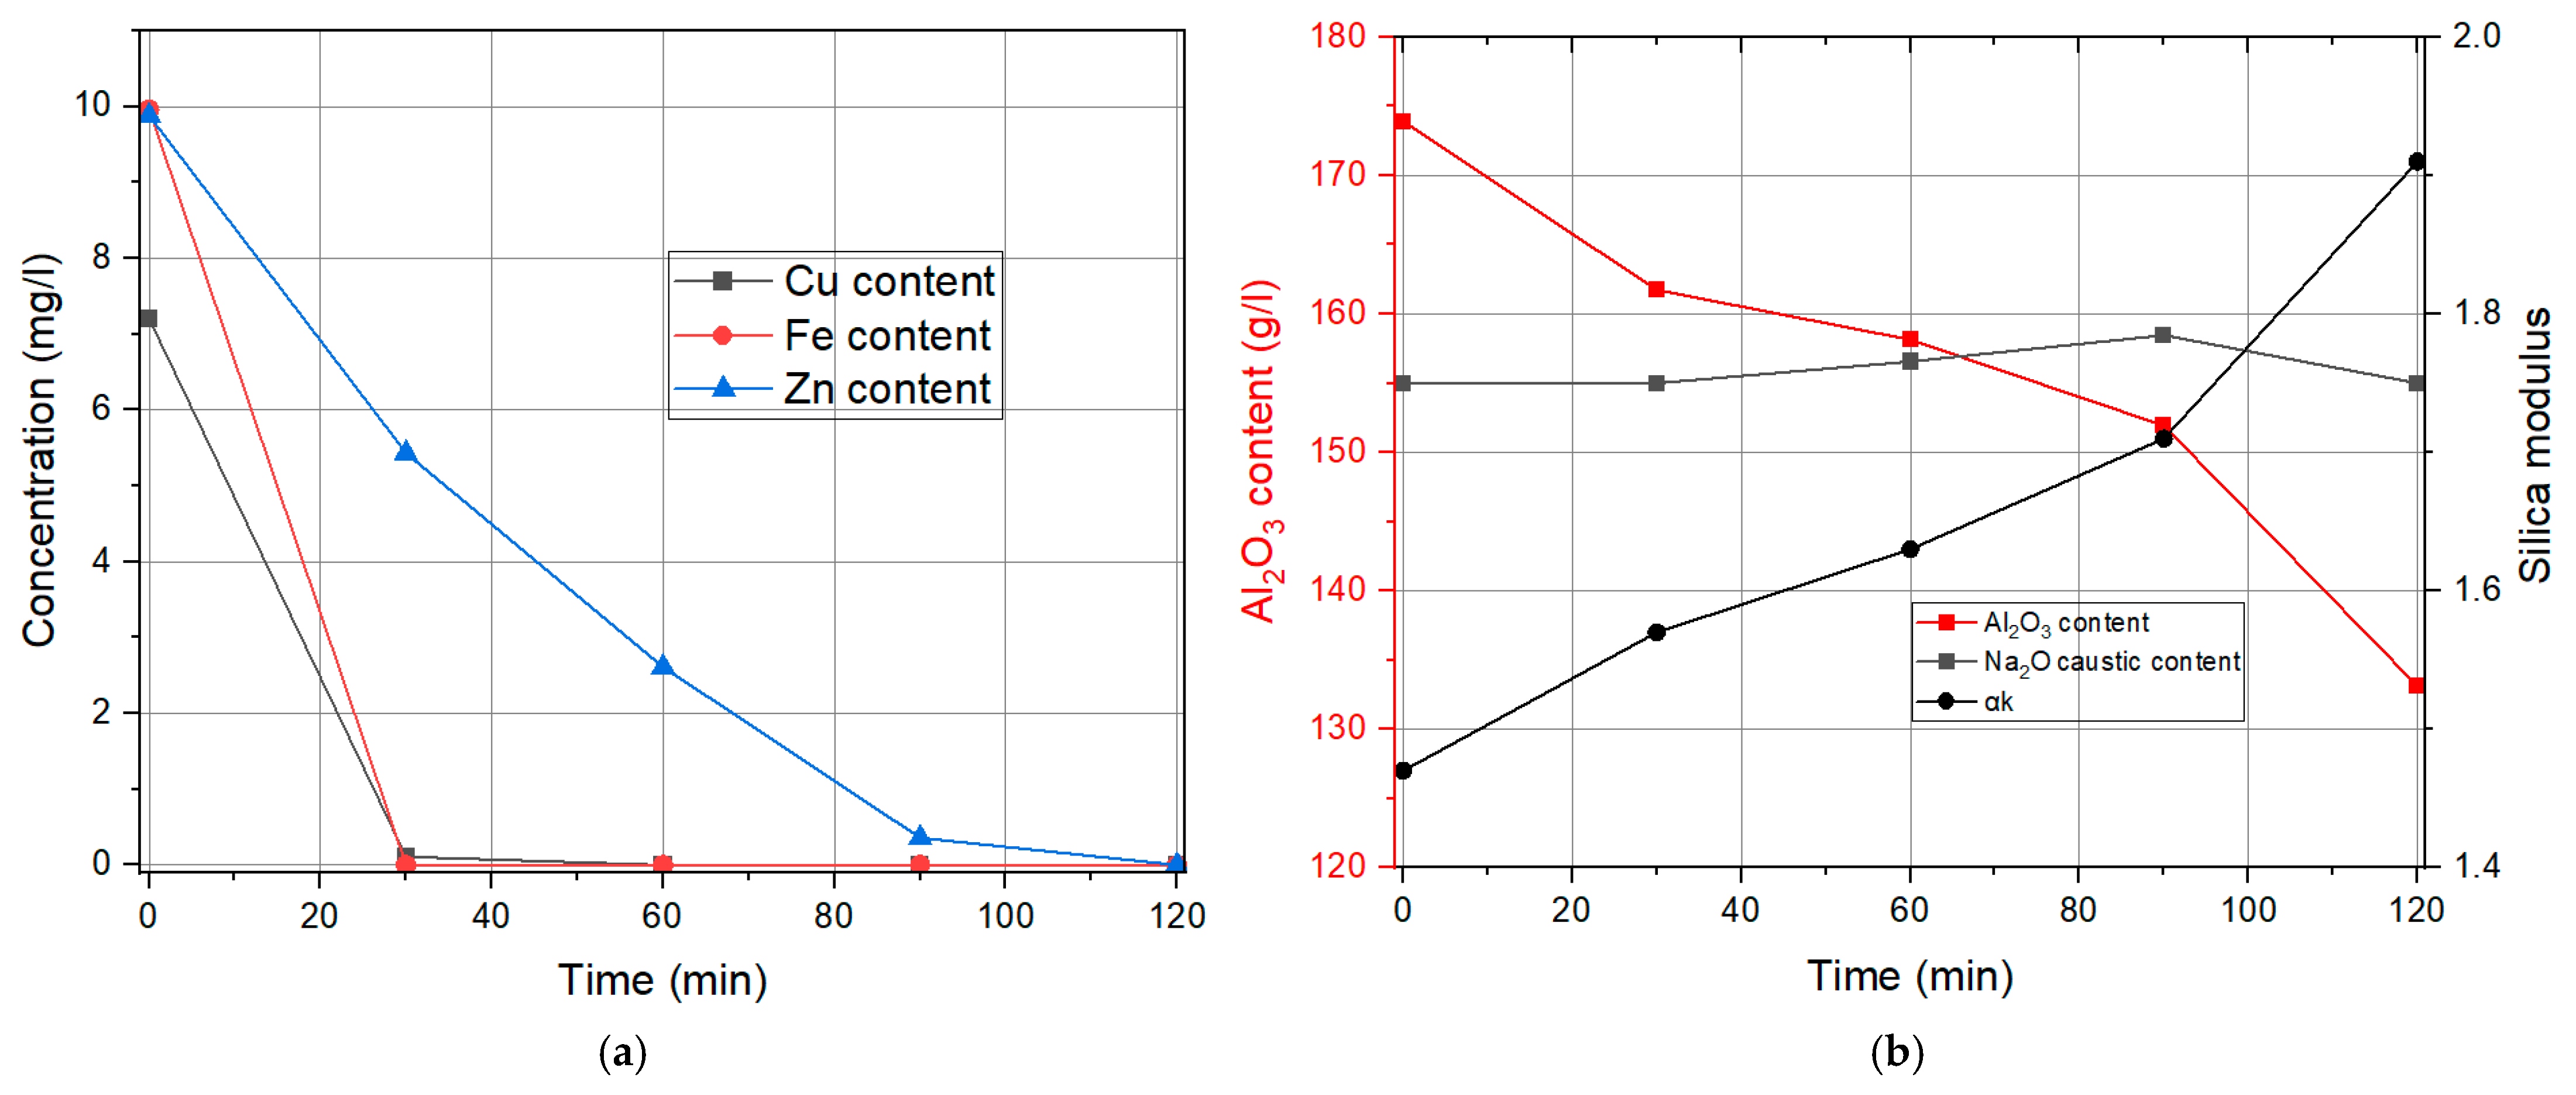
| Time | Cu Content | Fe Content | Zn Content | Na2Oc | Al2O3 | αk |
|---|---|---|---|---|---|---|
| min | mg/L | mg/L | mg/L | g/L | g/L | / |
| 0 | 7.2 | 9.96 | 9.88 | 155 | 173.91 | 1.47 |
| 30 | 0 | 0 | 5.74 | 155 | 163.2 | 1.56 |
| 60 | 0 | 0 | 3.24 | 157.58 | 161.05 | 1.61 |
| 90 | 0 | 0 | 1.28 | 158.54 | 155.55 | 1.68 |
| 120 | 0 | 0 | 0.6 | 154.22 | 142.8 | 1.77 |
| Time | Cu Content | Fe Content | Zn Content | Na2Oc | Al2O3 | αk |
|---|---|---|---|---|---|---|
| min | mg/L | mg/L | mg/L | g/L | g/L | / |
| 0 | 7.2 | 9.96 | 9.88 | 155 | 173.91 | 1.47 |
| 30 | 0.11 | 0 | 5.43 | 155 | 161.73 | 1.57 |
| 60 | 0 | 0 | 2.61 | 156.55 | 158.13 | 1.63 |
| 90 | 0 | 0 | 0.36 | 158.45 | 151.92 | 1.71 |
| 120 | 0 | 0 | 0 | 155 | 133.11 | 1.91 |
Appendix B
References
- Kvande, H.; Drabløs, P.A. The Aluminum Smelting Process and Innovative Alternative Technologies. J. Occup. Environ. Med. 2014, 56, S23–S32. [Google Scholar] [CrossRef] [PubMed]
- Kloprogge, J.T.; Duong, L.V.; Wood, B.J.; Frost, R.L. XPS Study of the Major Minerals in Bauxite: Gibbsite, Bayerite and (Pseudo-)Boehmite. J. Colloid Interface Sci. 2006, 296, 572–576. [Google Scholar] [CrossRef] [PubMed]
- Donoghue, A.M.; Frisch, N.; Olney, D. Bauxite Mining and Alumina Refining: Process Description and Occupational Health Risks. J. Occup. Environ. Med. 2014, 56, S12–S17. [Google Scholar] [CrossRef] [PubMed]
- Gupta, C.K.; Mukherjee, T.K. Hydrometallurgy in Extraction Processes, Volume I; Routledge: London, UK, 2019. [Google Scholar] [CrossRef]
- Brough, D.; Jouhara, H. The Aluminium Industry: A Review on State-of-the-Art Technologies, Environmental Impacts and Possibilities for Waste Heat Recovery. Int. J. Thermofluids 2020, 1–2, 100007. [Google Scholar] [CrossRef]
- Habashi, F. A Hundred Years of the Bayer Process for Alumina Production. In Essential Readings in Light Metals; Springer: Cham, Switzerland, 2016; Volume 81, pp. 85–93. [Google Scholar] [CrossRef]
- Zhang, Y.; Qi, Y.; Li, J.; Zhang, Y.; Qi, Y.; Li, J. Aluminum Mineral Processing and Metallurgy: Iron-Rich Bauxite and Bayer Red Muds. In Aluminium Alloys and Composites; Intechopen: London, UK, 2018. [Google Scholar] [CrossRef]
- Medvedev, V.V.; Akhmedov, S.N. Evolution of the Technology for the Production of Alumina from Bauxites. In TMS Light Metal; Springer: Cham, Switzerland, 2014; pp. 5–9. [Google Scholar] [CrossRef]
- Rosenberg, S. Impurity Removal in the Bayer Process. In Proceedings of the 35th International ICSOBA Conference, Hamburg, Germany, 2–5 October 2017. [Google Scholar]
- Park, N.K.; Choi, H.Y.; Kim, D.H.; Lee, T.J.; Kang, M.; Lee, W.G.; Kim, H.D.; Park, J.W. Purification of Al(OH)3 Synthesized by Bayer Process for Preparation of High Purity Alumina as Sapphire Raw Material. J. Cryst. Growth 2013, 373, 88–91. [Google Scholar] [CrossRef]
- Li, X.B.; Yan, L.; Zhao, D.F.; Zhou, Q.S.; Liu, G.H.; Peng, Z.H.; Yang, S.S.; Qi, T.G. Relationship between Al(OH)3 Solubility and Particle Size in Synthetic Bayer Liquors. Trans. Nonferrous Met. Soc. China 2013, 23, 1472–1479. [Google Scholar] [CrossRef]
- Noworyta, A. On the Removal of Silica from Aluminate Solutions: Mechanism and Kinetics of the Process. Hydrometallurgy 1981, 7, 99–106. [Google Scholar] [CrossRef]
- Liu, R.; Hou, H.; Lin, Y.; Yan, W.; Hu, X.; Zi, F. Study on the Efficient Removal of Trace Iron from Sodium Aluminate Solution by the Heterogeneous Nucleation Method. Chem. Eng. Sci. 2024, 316, 121993. [Google Scholar] [CrossRef]
- Xu, L.; Chen, W.M.; Zhang, Y.J.; Fan, S.; Pi, J.Q.; Wang, M. li Effect of Zinc(II) and Caustic Content on the Decomposition of Sodium Aluminate Solutions and Relevance to the Bayer Process. Hydrometallurgy 2024, 225, 106287. [Google Scholar] [CrossRef]
- Han, D.Z.; Song, E.W.; Qi, L.J.; Guan, X.G. Optimization of Zinc Removal Process in Sodium Aluminate Solution Based on Orthogonal Experiment. In Light Metals 2021; The Minerals, Metals & Materials Series; Springer: Cham, Switzerland, 2021; Volume 6, pp. 31–35. [Google Scholar] [CrossRef]
- Vaughan, J.; Peng, H.; Seneviratne, D.; Hodge, H.; Hawker, W.; Hayes, P.; Staker, W. The Sandy Desilication Product Process Concept. JOM 2019, 71, 2928–2935. [Google Scholar] [CrossRef]
- Vind, J.; Vassiliadou, V.; Panias, D. Distribution of Trace Elements Through the Bayer Process and Its By-Products. In Proceedings of the 35th International ICSOBA Conference, Hamburg, Germany, 2–5 October 2017. [Google Scholar]
- Ran, J.; Duan, H.; Srinivasakannan, C.; Yao, J.; Yin, S.; Zhang, L. Effective Removal of Organics from Bayer Liquor through Combined Sonolysis and Ozonation: Kinetics and Mechanism. Ultrason. Sonochem. 2022, 88, 106106. [Google Scholar] [CrossRef] [PubMed]
- Lamerant, J.-M.; Air, B. Process for Removing Iron in Sodium Aluminate Liquors Obtained from Alkaline Attack of Bauxite Containing Alumina Monohydrate. U.S. Patent 5,628,972, 13 May 1997. [Google Scholar]
- Siziakova, E.; Ivanov, P.; Maximova, R. Feasibility of Applying Alkaline-Earth Metal Carboaluminates for Bayer Process Aluminate Solution Purification from Organic Impurities. Mater. Sci. Forum 2021, 1031, 109–116. [Google Scholar] [CrossRef]
- Liu, J.; Pan, X.; Chen, M.; Yu, H. A Single-Step Crystallization Process to Remove Potassium from Sodium Aluminate Solution. J. Environ. Chem. Eng. 2024, 12, 113330. [Google Scholar] [CrossRef]
- Damjanović, V.; Kostić, D.; Ostojić, Ž.; Perušić, M.; Filipović, R.; Oljača, D.; Obrenović, Z.; Mićić, V. AA21-The Influence of Process Parameters on Removing Iron, Zinc and Copper Impurities from Synthetic Bayer Liquor. In Proceedings of the 38th International ICSOBA Conference, Virtual Conference, 16–18 November 2020; pp. 16–18. [Google Scholar]
- The, P. Removal of Copper and Zinc Species from Bayer Process Liquor by Filtration. U.S. Patent 4,414,115, 8 November 1983. [Google Scholar]
- Milovanović, B.; Oljača, Đ.; Pavlović, S.; Ostojić, G.; Obrenović, Z. Alumina Production from Purified Bayer Liquor. In Proceedings of the 26th Croatian Meeting of Chemists and Chemical Engineers, Šibenik, Croatia, 9–12 April 2019. [Google Scholar]
- Damjanovic, V.; Filipovic, R.; Obrenovic, Z.; Perusic, M.; Kostic, D.; Smiljanic, S.; Stopic, S. Influence of Process Parameters in Three-Stage Purification of Aluminate Solution and Aluminum Hydroxide. Metals 2023, 13, 1816. [Google Scholar] [CrossRef]
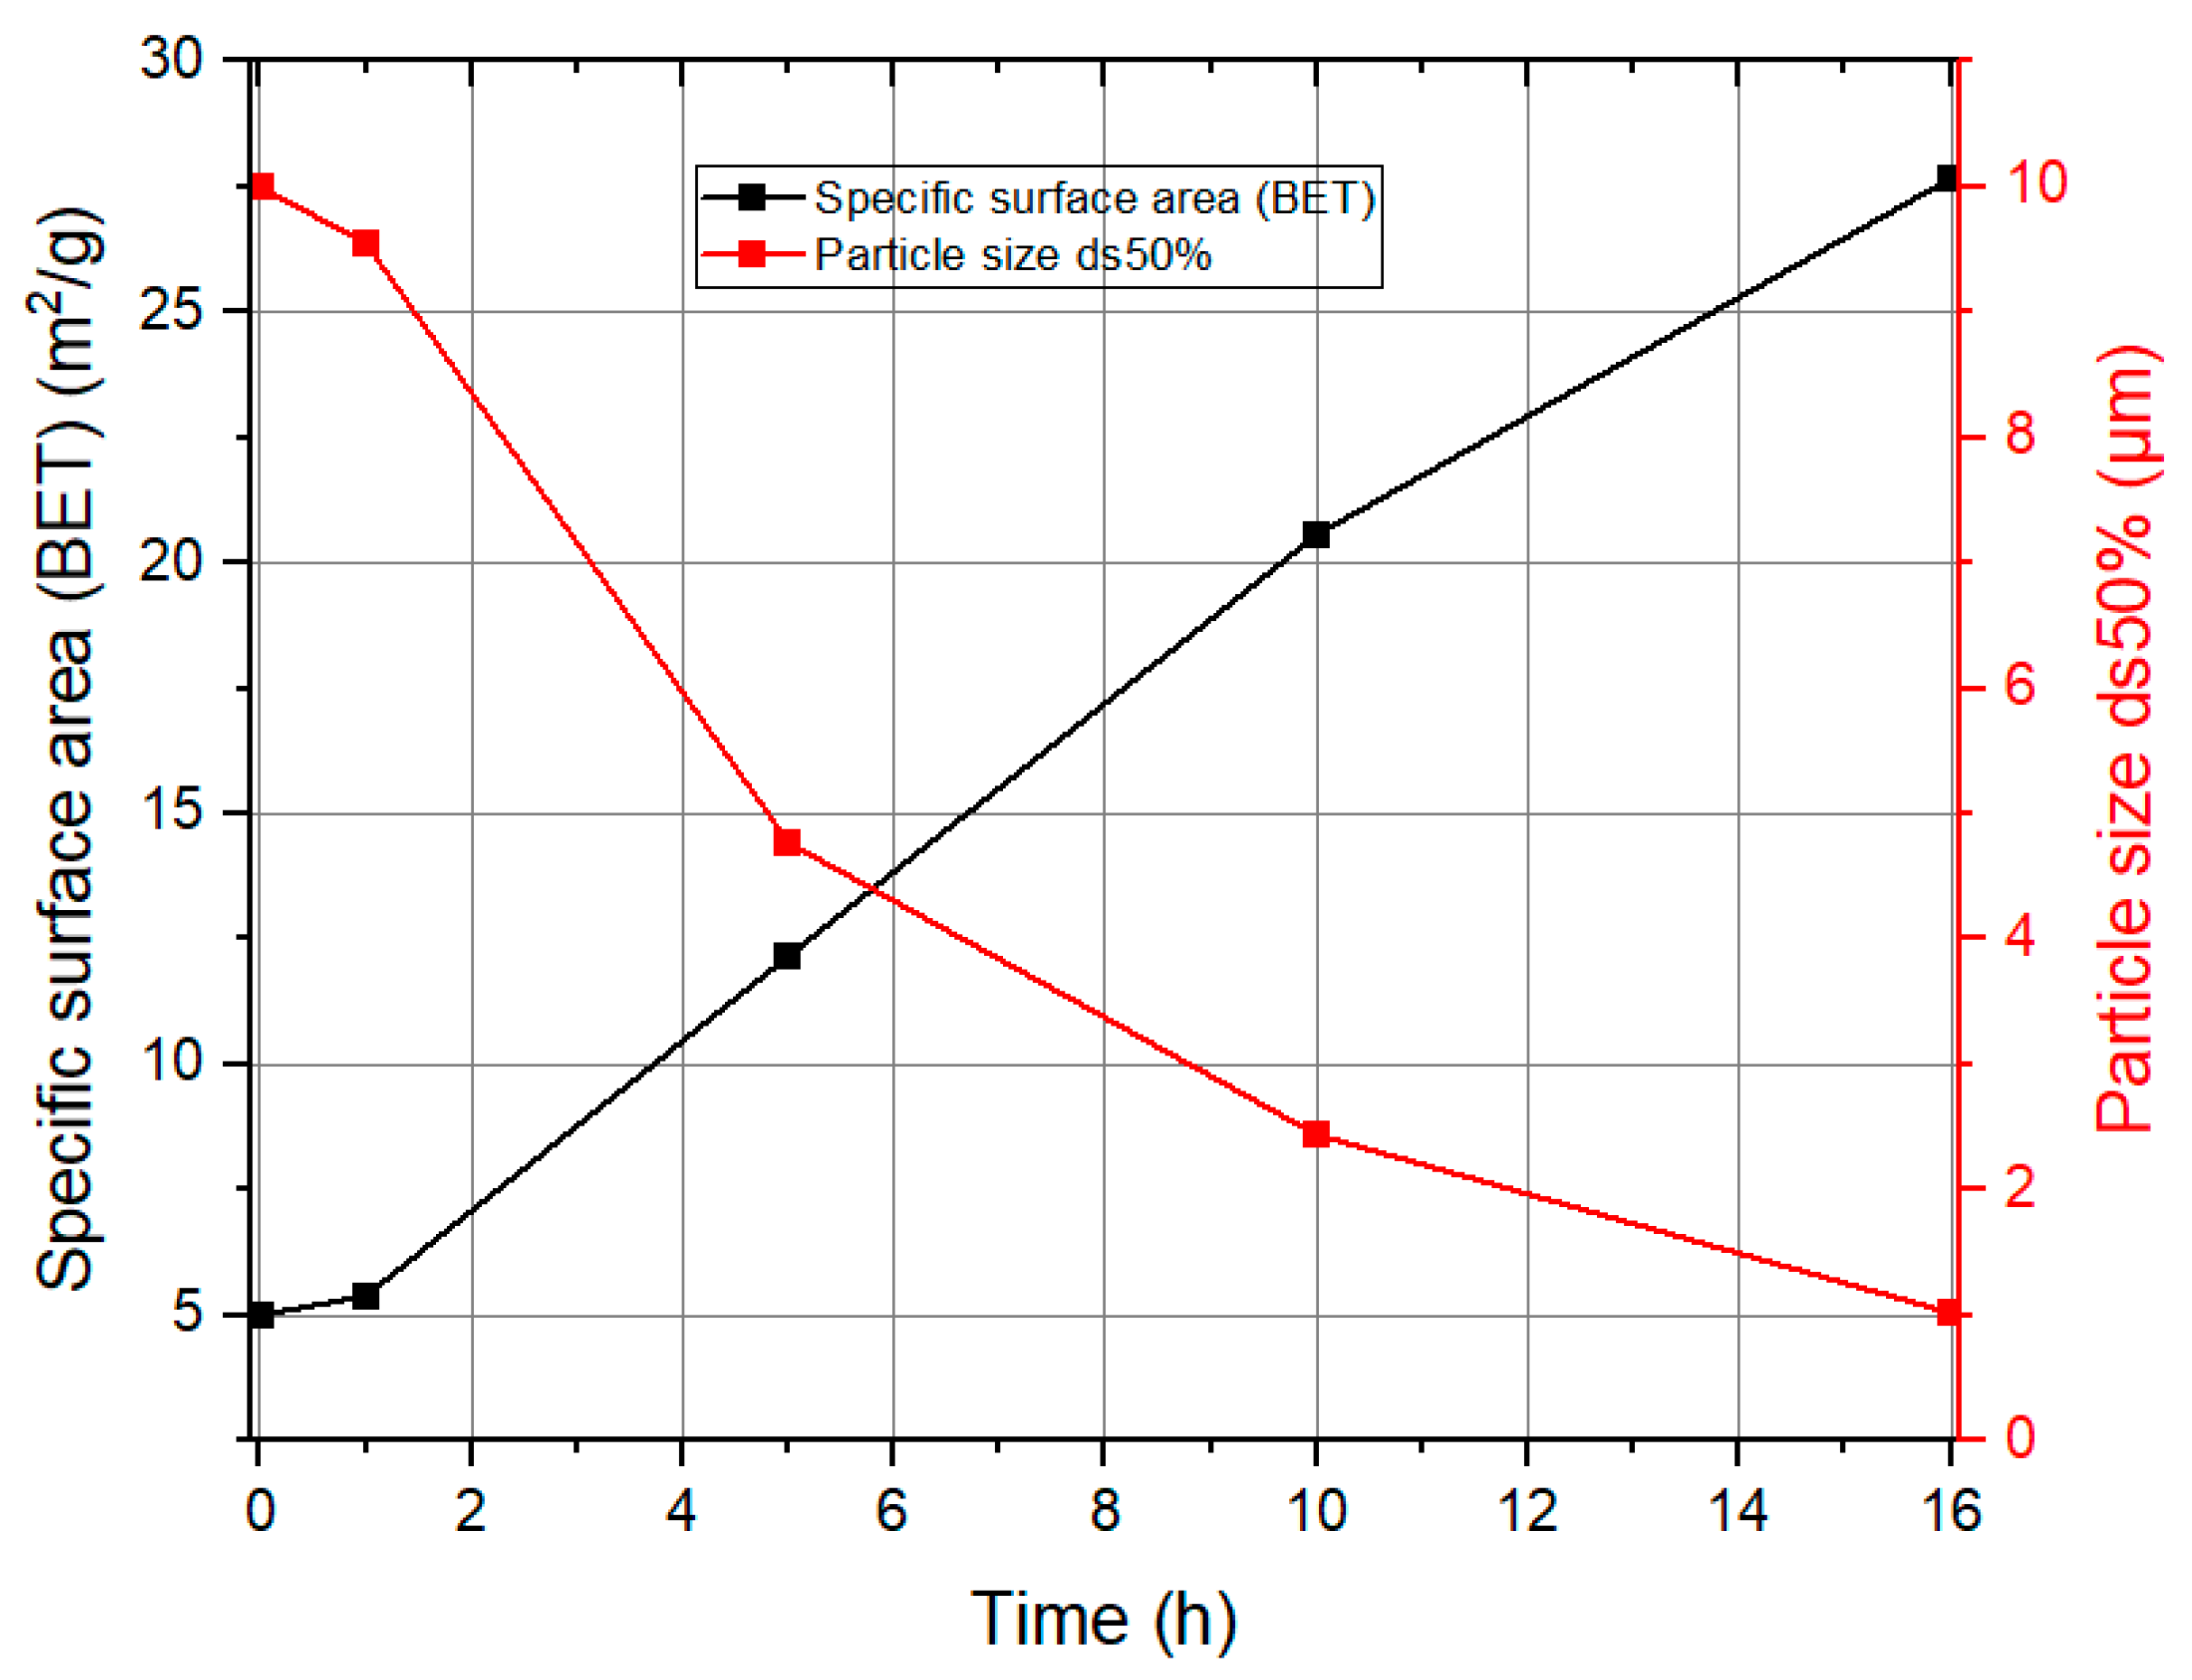
| Experiment No. | Seed Crystal Particle Size (μm) | SSA of Seed Crystal (m2/g) | Time (min) |
|---|---|---|---|
| 1 | 9.55 | 5.3897 | 30 |
| 2 | 9.55 | 5.3897 | 60 |
| 3 | 9.55 | 5.3897 | 90 |
| 4 | 9.55 | 5.3897 | 120 |
| 5 | 4.77 | 12.1691 | 30 |
| 6 | 4.77 | 12.1691 | 60 |
| 7 | 4.77 | 12.1691 | 90 |
| 8 | 4.77 | 12.1691 | 120 |
| 9 | 2.44 | 20.5632 | 30 |
| 10 | 2.44 | 20.5632 | 60 |
| 11 | 2.44 | 20.5632 | 90 |
| 12 | 2.44 | 20.5632 | 120 |
| 13 | 1.02 | 27.6645 | 30 |
| 14 | 1.02 | 27.6645 | 60 |
| 15 | 1.02 | 27.6645 | 90 |
| 16 | 1.02 | 27.6645 | 120 |
Disclaimer/Publisher’s Note: The statements, opinions and data contained in all publications are solely those of the individual author(s) and contributor(s) and not of MDPI and/or the editor(s). MDPI and/or the editor(s) disclaim responsibility for any injury to people or property resulting from any ideas, methods, instructions or products referred to in the content. |
© 2025 by the authors. Licensee MDPI, Basel, Switzerland. This article is an open access article distributed under the terms and conditions of the Creative Commons Attribution (CC BY) license (https://creativecommons.org/licenses/by/4.0/).
Share and Cite
Damjanović, V.; Stopić, S.; Kostić, D.; Perušić, M.; Filipović, R.; Mitrašinović, A.; Kostić, D. Removal of Iron, Zinc, and Copper Impurities from Sodium Aluminate After the Bayer Process. Metals 2025, 15, 669. https://doi.org/10.3390/met15060669
Damjanović V, Stopić S, Kostić D, Perušić M, Filipović R, Mitrašinović A, Kostić D. Removal of Iron, Zinc, and Copper Impurities from Sodium Aluminate After the Bayer Process. Metals. 2025; 15(6):669. https://doi.org/10.3390/met15060669
Chicago/Turabian StyleDamjanović, Vladimir, Srećko Stopić, Duško Kostić, Mitar Perušić, Radislav Filipović, Aleksandar Mitrašinović, and Dragana Kostić. 2025. "Removal of Iron, Zinc, and Copper Impurities from Sodium Aluminate After the Bayer Process" Metals 15, no. 6: 669. https://doi.org/10.3390/met15060669
APA StyleDamjanović, V., Stopić, S., Kostić, D., Perušić, M., Filipović, R., Mitrašinović, A., & Kostić, D. (2025). Removal of Iron, Zinc, and Copper Impurities from Sodium Aluminate After the Bayer Process. Metals, 15(6), 669. https://doi.org/10.3390/met15060669