Article

Corrosion Behavior Analysis of Novel Sn-2.5Ag-1.0Bi-0.8Cu-0.05Ni and Sn-1.8Bi-0.75Cu-0.065Ni Pb-Free Solder Alloys via Potentiodynamic Polarization Test

1
Department of Materials Science and Engineering, Seoul National University of Science and Technology, Seoul 139-743, Republic of Korea
2
Research Institute for Future Convergence Materials, Seoul National University of Science and Technology, Seoul 139-743, Republic of Korea
*
Author to whom correspondence should be addressed.
Metals 2025, 15(6), 670; https://doi.org/10.3390/met15060670
Submission received: 12 May 2025 / Revised: 9 June 2025 / Accepted: 9 June 2025 / Published: 17 June 2025
(This article belongs to the Special Issue New Welding Materials and Green Joint Technology—2nd Edition)

Abstract

:
The corrosion behaviors of newly developed solder alloys with excellent mechanical properties, Sn-2.5 Ag-1.0 Bi-0.8 Cu-0.05 Ni (SABC25108N) and Sn-1.5 Bi-0.75 Cu-0.065 Ni (SBC15075N), are analyzed to supplement the corrosion behavior of the limited corrosion data in Pb- and Zn-free solder compositions. A potentiodynamic polarization test is conducted on these compositions in a NaCl electrolyte solution, the results of which are compared with those of conventional Sn-3.0 (wt%) Ag-0.5Cu and Sn-1.2Ag-0.5Cu-0.05Ni alloys. The results indicate that SBC15075N exhibits the lowest corrosion potential and highest corrosion current density, thus signifying the lowest corrosion resistance. By contrast, SABC25108N exhibits the lowest corrosion current density and highest corrosion resistance. Notably, SABC25108N shows a slower corrosion progression in the active state and exhibits the longest passive state. The difference in corrosion resistance is affected more significantly by the formation and distribution of the Ag3Sn intermetallic compound phase owing to the high Ag content instead of by the presence of Bi or Ni. This uniform dispersion of Ag3Sn IMC phases in the SABC25108N alloy effectively suppressed corrosion propagation along the grain boundaries and reduced the formation of corrosion products, such as Sn3O(OH)2Cl2, thereby enhancing the overall corrosion resistance. These findings provide valuable insights into the optimal design of solder alloys and highlight the importance of incorporating sufficient Ag content into multicomponent compositions to improve corrosion resistance.

1. Introduction

Since the enforcement of the Restriction of Hazardous Substances (RoHS) directive in 2006, the use of Pb-free solder alloys has been mandated, and Sn-Ag-Cu ternary compositions have been widely used [1,2]. The representative composition, Sn-3.0(wt%)Ag-0.5Cu (SAC305), exhibits superior thermal cycling performance with excellent long-term reliability against thermal fatigue and creep failure compared with the previous Sn-37Pb eutectic solder [3]. However, owing to the widespread adoption of mobile electronic devices, resistance against drops has become a crucial reliability factor in addition to thermal cycling performance. SAC305 shows reduced reliability in the drop test because of its enhanced brittleness resulting from increased strength [4,5]. To address this limitation, an Sn-1.2Ag-0.5Cu-0.05Ni (SAC1205N) composition was developed, which significantly improved the drop resistance of mobile applications [6]. However, the increased ductility of SAC1205N resulted in inferior thermal cycling performance compared with that of SAC305 [7]. Considering that mobile devices are subject to repeated thermal cycling, studies pertaining to solder alloys that simultaneously offer superior drop resistance and thermal cycling reliability are actively being conducted.
Various approaches have been investigated to improve the mechanical properties of solder alloys, including the addition of trace amounts of rare-earth metals [8,9] and the uniform dispersion of nanoparticles [10,11,12]. However, no previous studies have successfully demonstrated simultaneous improvements in both thermal cycling and drop resistance to levels exceeding those of existing solder compositions (i.e., thermal cycling performance surpassing that of SAC305 and drop resistance exceeding that of SAC1205N) through conventional casting and solidification processes.
Recently, significant findings have been reported regarding the addition of trace amounts of Bi to simultaneously enhance thermal cycling and drop resistance. Representative compositions include Sn-2.5Ag-1.0Bi-0.8Cu-0.05Ni (SABC25108N) and Sn-1.5Bi-0.75Cu-0.065Ni (SBC15075N). SABC25108N has been reported to offer thermal cycling performance superior to that of SAC305 and a drop resistance exceeding that of SAC1205N, thus rendering it a promising solder alloy that enhances both properties simultaneously [13]. By contrast, SBC15075N, as an Ag-free composition, provides exceptional cost competitiveness while demonstrating a drop resistance superior to that of SAC1205N. However, owing to the absence of the Ag3Sn phase, its thermal cycling performance is inferior to that of SAC305 [14]. Therefore, the metallurgical properties of these newly developed Bi-containing Pb-free solder compositions should be evaluated more comprehensively.
Electronic packaging has emerged as a critical technology in the modern electronics industry, which demands high performance, miniaturization, and reliability simultaneously. The solder, as a key material enabling electrical interconnections between components, contributes significantly to the overall characteristics and quality of electronic packaging. However, solder-joint corrosion in harsh environments is one of the primary causes of performance degradation and reduced lifespan of electronic devices. Furthermore, ensuring the reliability of solder joints in extreme environments, such as marine and space applications, remains a significant challenge. Therefore, evaluating the corrosion behavior of solder alloys and improving their corrosion resistance are essential research topics that warrant increased attention in the future.
Previous corrosion studies on solder alloys have primarily focused on Pb- or Zn-bearing compositions, which are susceptible to galvanic corrosion [15,16,17,18,19,20,21,22,23]. Subsequent research on Pb- and Zn-free solders has been categorized mainly into Sn–Cu and Sn–Ag based systems. In Sn–Cu alloys, corrosion is largely attributed to the formation of galvanic couples between the Sn-rich matrix and Cu–Sn intermetallic compounds (IMCs). Therefore, microstructural changes induced by different cooling rates—particularly variations in cathode/anode area ratios—have a direct impact on corrosion susceptibility [24,25]. Alloying elements such as S, Ce, La, Al, and Ga have been proposed to be effective in improving the corrosion resistance in Sn–Cu alloys [26,27,28,29,30,31]. In Sn–Ag systems, the corrosion susceptibility primarily arises from galvanic corrosion between the Sn-rich matrix and Ag–Sn IMCs [32,33,34]. Consequently, the size, distribution, and orientation of Ag3Sn particles play a crucial role in determining corrosion resistance [35,36]. Osório et al. demonstrated that faster cooling rates reduce corrosion susceptibility in Sn–2Ag solder alloys, and they identified a correlation between morphological evolution of Ag3Sn and the evolution of corrosion resistance [36]. Alloying elements such as Ce and Cu have been reported to improve the corrosion resistance of Sn–Ag-based alloys [37,38]. With respect to the corrosion behavior of SAC alloys—compositions combining Sn–Cu and Sn–Ag systems—Wierzbicka-Miernik et al. investigated and reported their corrosion characteristics in NaCl solutions [39]. They reported that the corrosion rate was determined by not only the concentration of Cl⁻ ions in the solution but also by the amount of Ag3Sn phase in the solder alloy. In electrochemical reactions, Ag3Sn serves as a cathode that accelerates the dissolution of the β-Sn phase, which serves as an anode. Additionally, they highlighted that although the corrosion rate was significantly lower owing to obstruction by corrosion products on the reaction surface, the actual corrosion behavior in seawater might differ considerably. Subsequently, Qiao et al. fabricated comb-like electrodes using SAC305 alloy, connected them with Cu wires, and applied NaCl solution to the electrode surface to conduct electrochemical-impedance-spectroscopy measurements [40]. They observed that when a thick NaCl electrolyte layer initially shielded the electrode surface, oxygen diffusion-controlled cathodic reactions governed the corrosion process. However, under a much thinner, saturated NaCl electrolyte film, anodic dissolution became the dominant corrosion mechanism. Whereas an adequate supply of oxygen facilitated the formation of a corrosion product layer composed of electrochemically stable SnO2, the corrosion layer at elevated temperatures exhibited smaller grain sizes and significant cracking. Furthermore, they emphasized that SAC305 solder joints might corrode severely under extremely thin, saturated electrolyte layers, with the possibility of excessive accumulation of NaCl precipitates.
Therefore, this study aims to analyze the corrosion behavior of newly developed SABC25108N and SBC15075N solder compositions by performing potentiodynamic polarization tests in NaCl solution and then compare their corrosion resistance with those of conventional SAC-based compositions. Additionally, the morphologies of corrosion products formed on the surfaces of these new solder alloys are examined, and their growth processes are monitored using optical microscopy and scanning electron microscopy (SEM). The potentiodynamic polarization testing and corrosion behavior analysis of these newly developed Pb- and Zn-free SAC solder compositions in NaCl solution have not been previously reported in the literature.

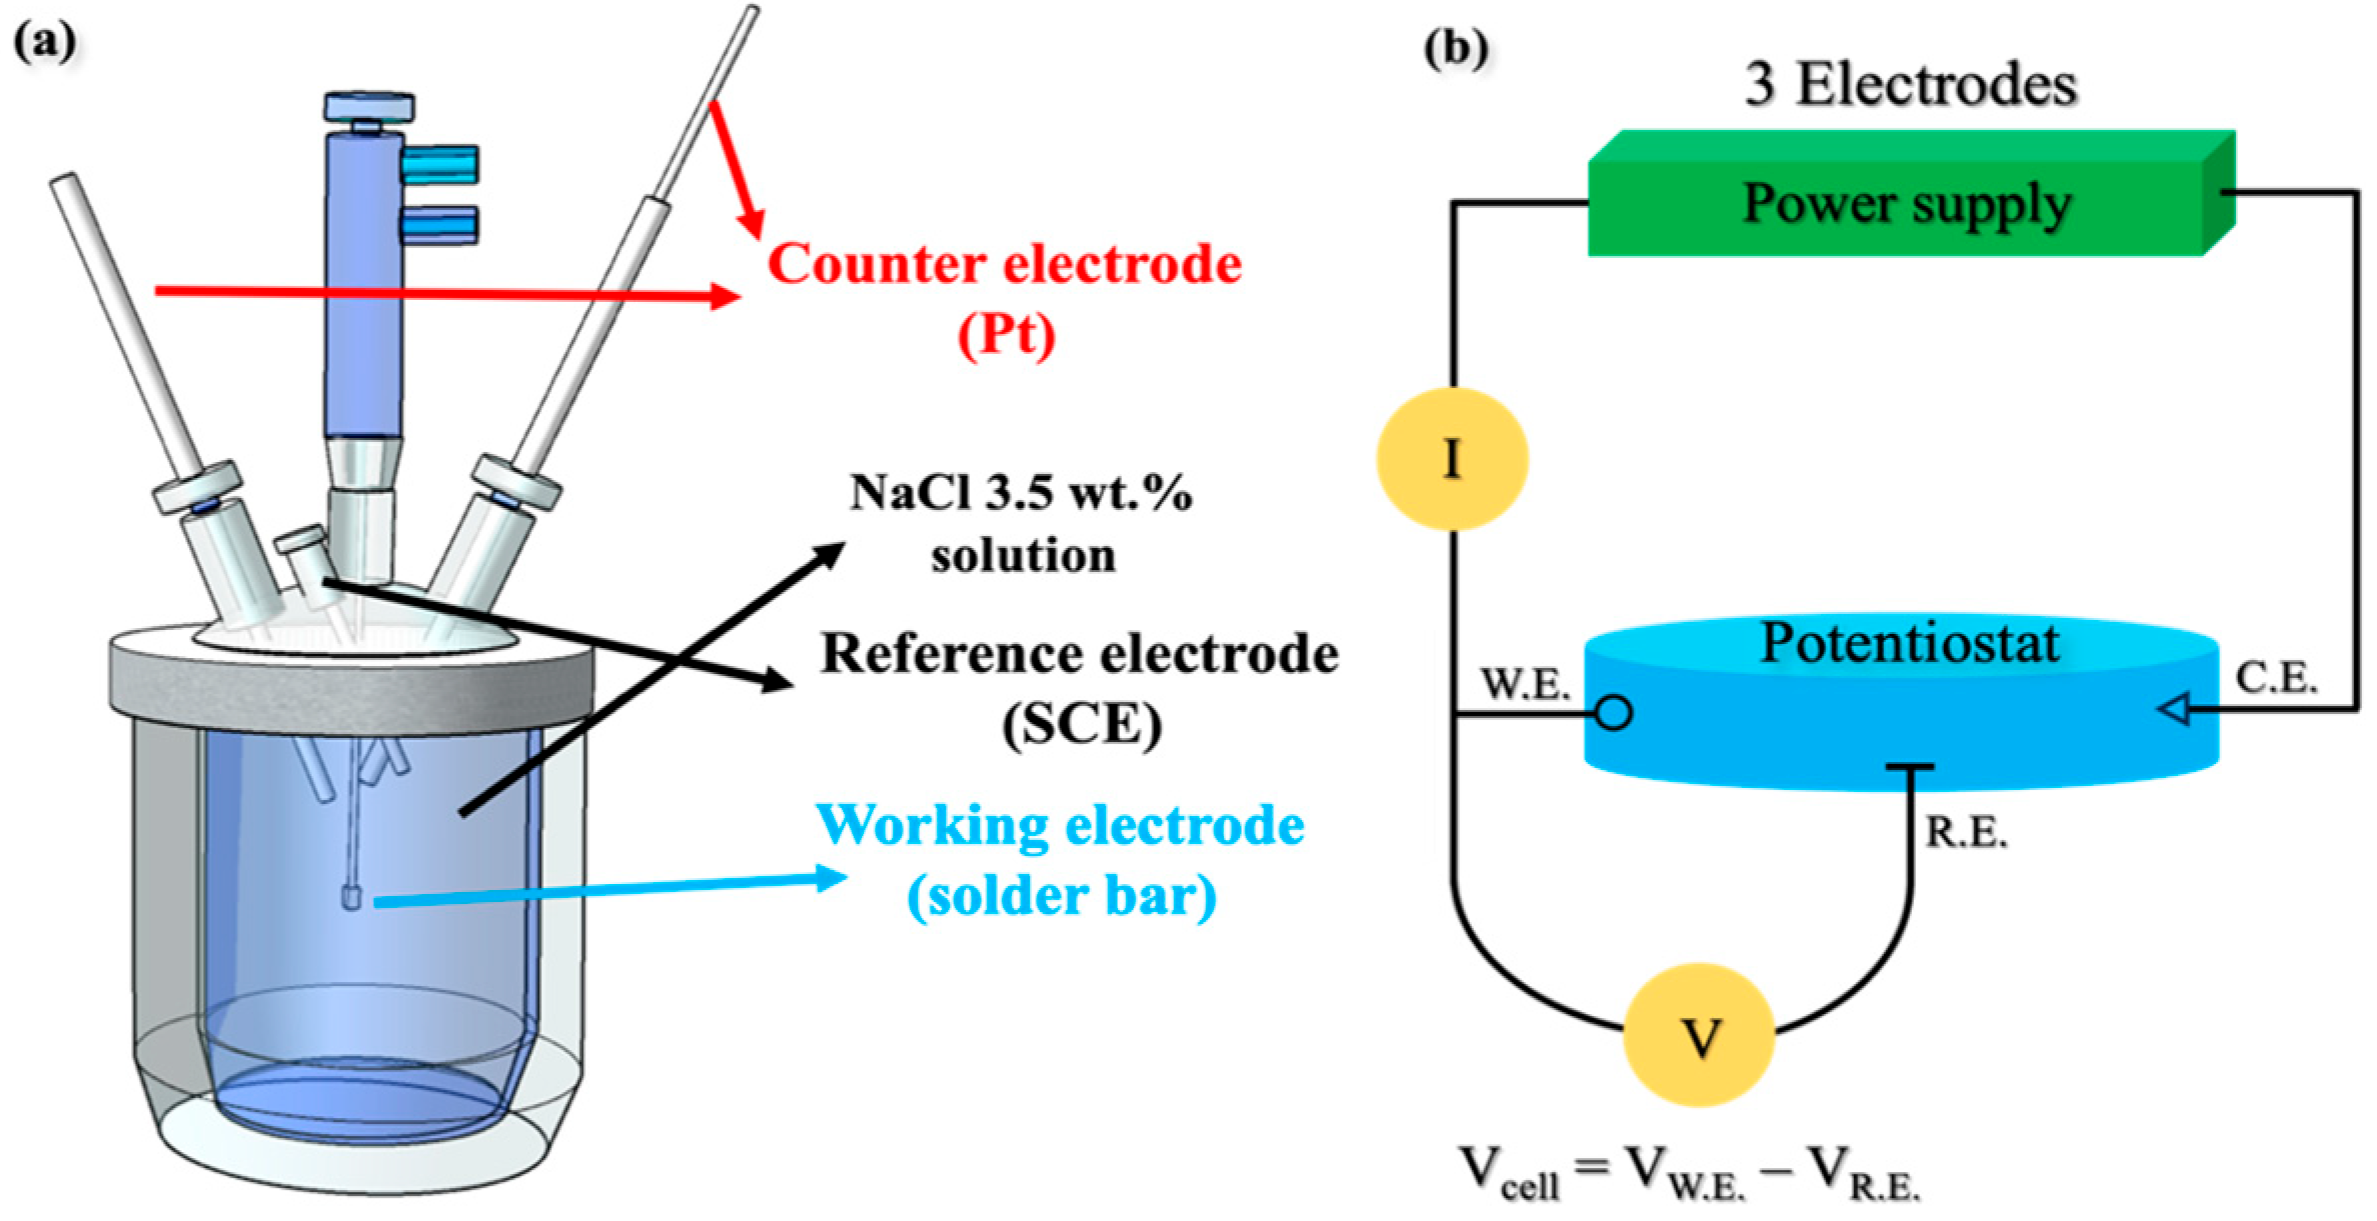
2. Materials and Methods

The solder alloy samples for potentiodynamic polarization tests were prepared as follows: Solder bars with four compositions (SAC305, SAC1205N, SABC25108N, and SBC15075N) of Table 1 were supplied by MK Electron Co., Ltd. (Yongin-city, Republic of Korea), and all of their purities were above 3N. The initial dimensions of the solder bars were 30 mm × 240 mm × 15 mm. To use them as working electrodes, they were cut into plate-shaped samples measuring 20 mm × 20 mm × 7 mm via a wire-cutting process.
Subsequently, to evaluate the electrochemical corrosion resistance of the newly developed solder bars, potentiodynamic polarization tests were conducted in accordance with ISO 17475:2005 (Corrosion of metals and alloys–Electrochemical test methods–Guidelines for conducting potentiostatic and potentiodynamic polarization measurements). Based on the obtained polarization curves, the corrosion potential (Ecorr) and corrosion current density (Icorr) were analyzed.
Potentiodynamic polarization tests were conducted using the three-electrode method. In this setup, the working, counter, and reference electrodes were immersed in a corrosive electrolyte solution and the power supply of the potentiostat was connected to three electrodes to complete the circuit before conducting the analysis. Figure 1 illustrates a schematic configuration of the three-electrode electrochemical cell. The solder plate under evaluation was used as the working electrode, which was immersed in a 3.5 wt% NaCl solution to measure its electrochemical response. A high-purity Pt mesh was employed as the counter electrode to facilitate current transfer with the working electrode and maintain current balance within the system. A saturated calomel electrode (SCE) was used as the reference electrode, which provided a stable reference potential, thus ensuring the precise measurement of the working electrode’s potential. The experimental conditions are listed in Table 2.
A potentiostat/galvanostat (SP-240, BioLogic, Seyssinet-Pariset, France) was used for the potentiodynamic polarization test. To ensure the stabilization of the specimen’s potential in the solution environment, the open-circuit potential (OCP) was measured for 10 min prior to the test. Subsequently, the potential of the working electrode was scanned from −0.75 to +1.60 V vs. the reference electrode (SCE) at a scan rate of 30 mV/min. The polarization curves obtained from the test were analyzed using Tafel extrapolation to determine and evaluate Ecorr and Icorr.
To observe the morphological characteristics of the various compound phases formed on the corroded solder plates, microstructural analysis was conducted using high-resolution field-emission scanning electron microscopy (SEM, SU8010, Hitachi, Tokyo, Japan). Additionally, the surface morphologies of the corroded solder plates were examined using an optical microscope (BA310MET Trinocular; Motic Group, Xiamen, China). The phase changes on the corroded solder plate surfaces over time were analyzed using a multipurpose X-ray diffractometer (XRD, SmartLab, Rigaku Corp., Tokyo, Japan) under Cu Kα radiation (λ = 1.5406 Å). The scan speed was set to 0.2°/s and the measurement was performed within a 2θ range of 10–80°.

3. Results and Discussion

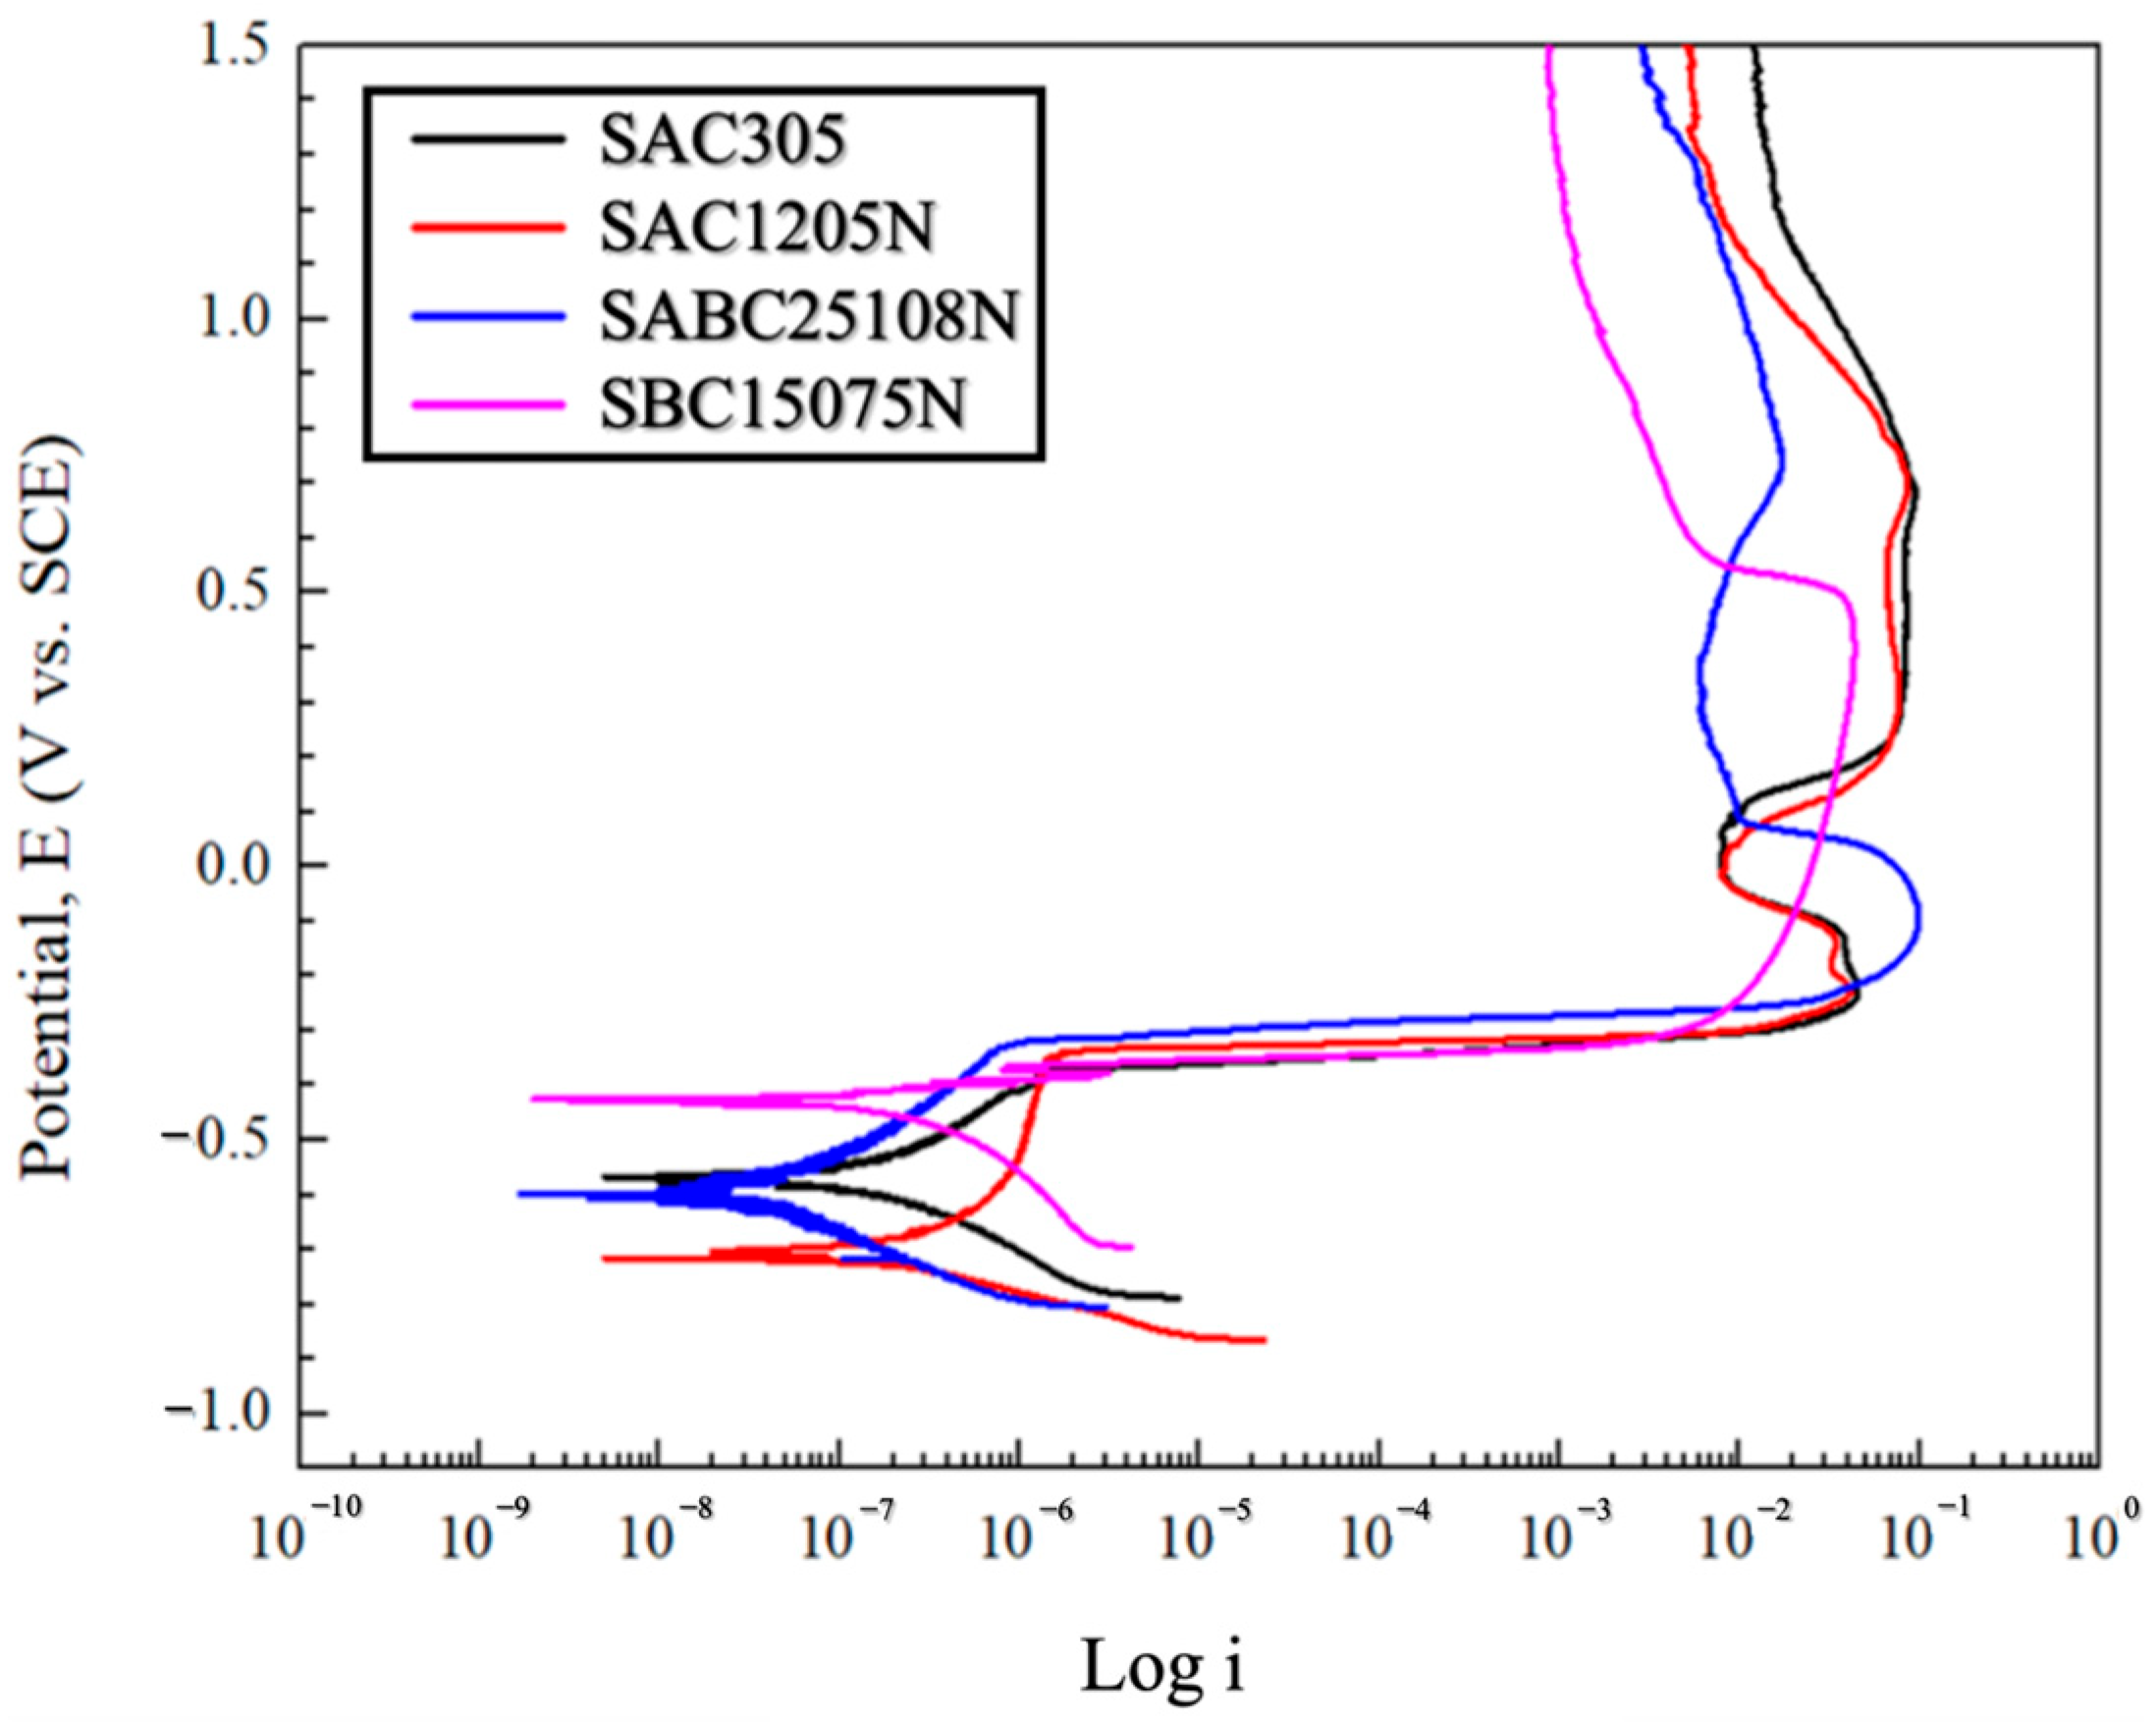
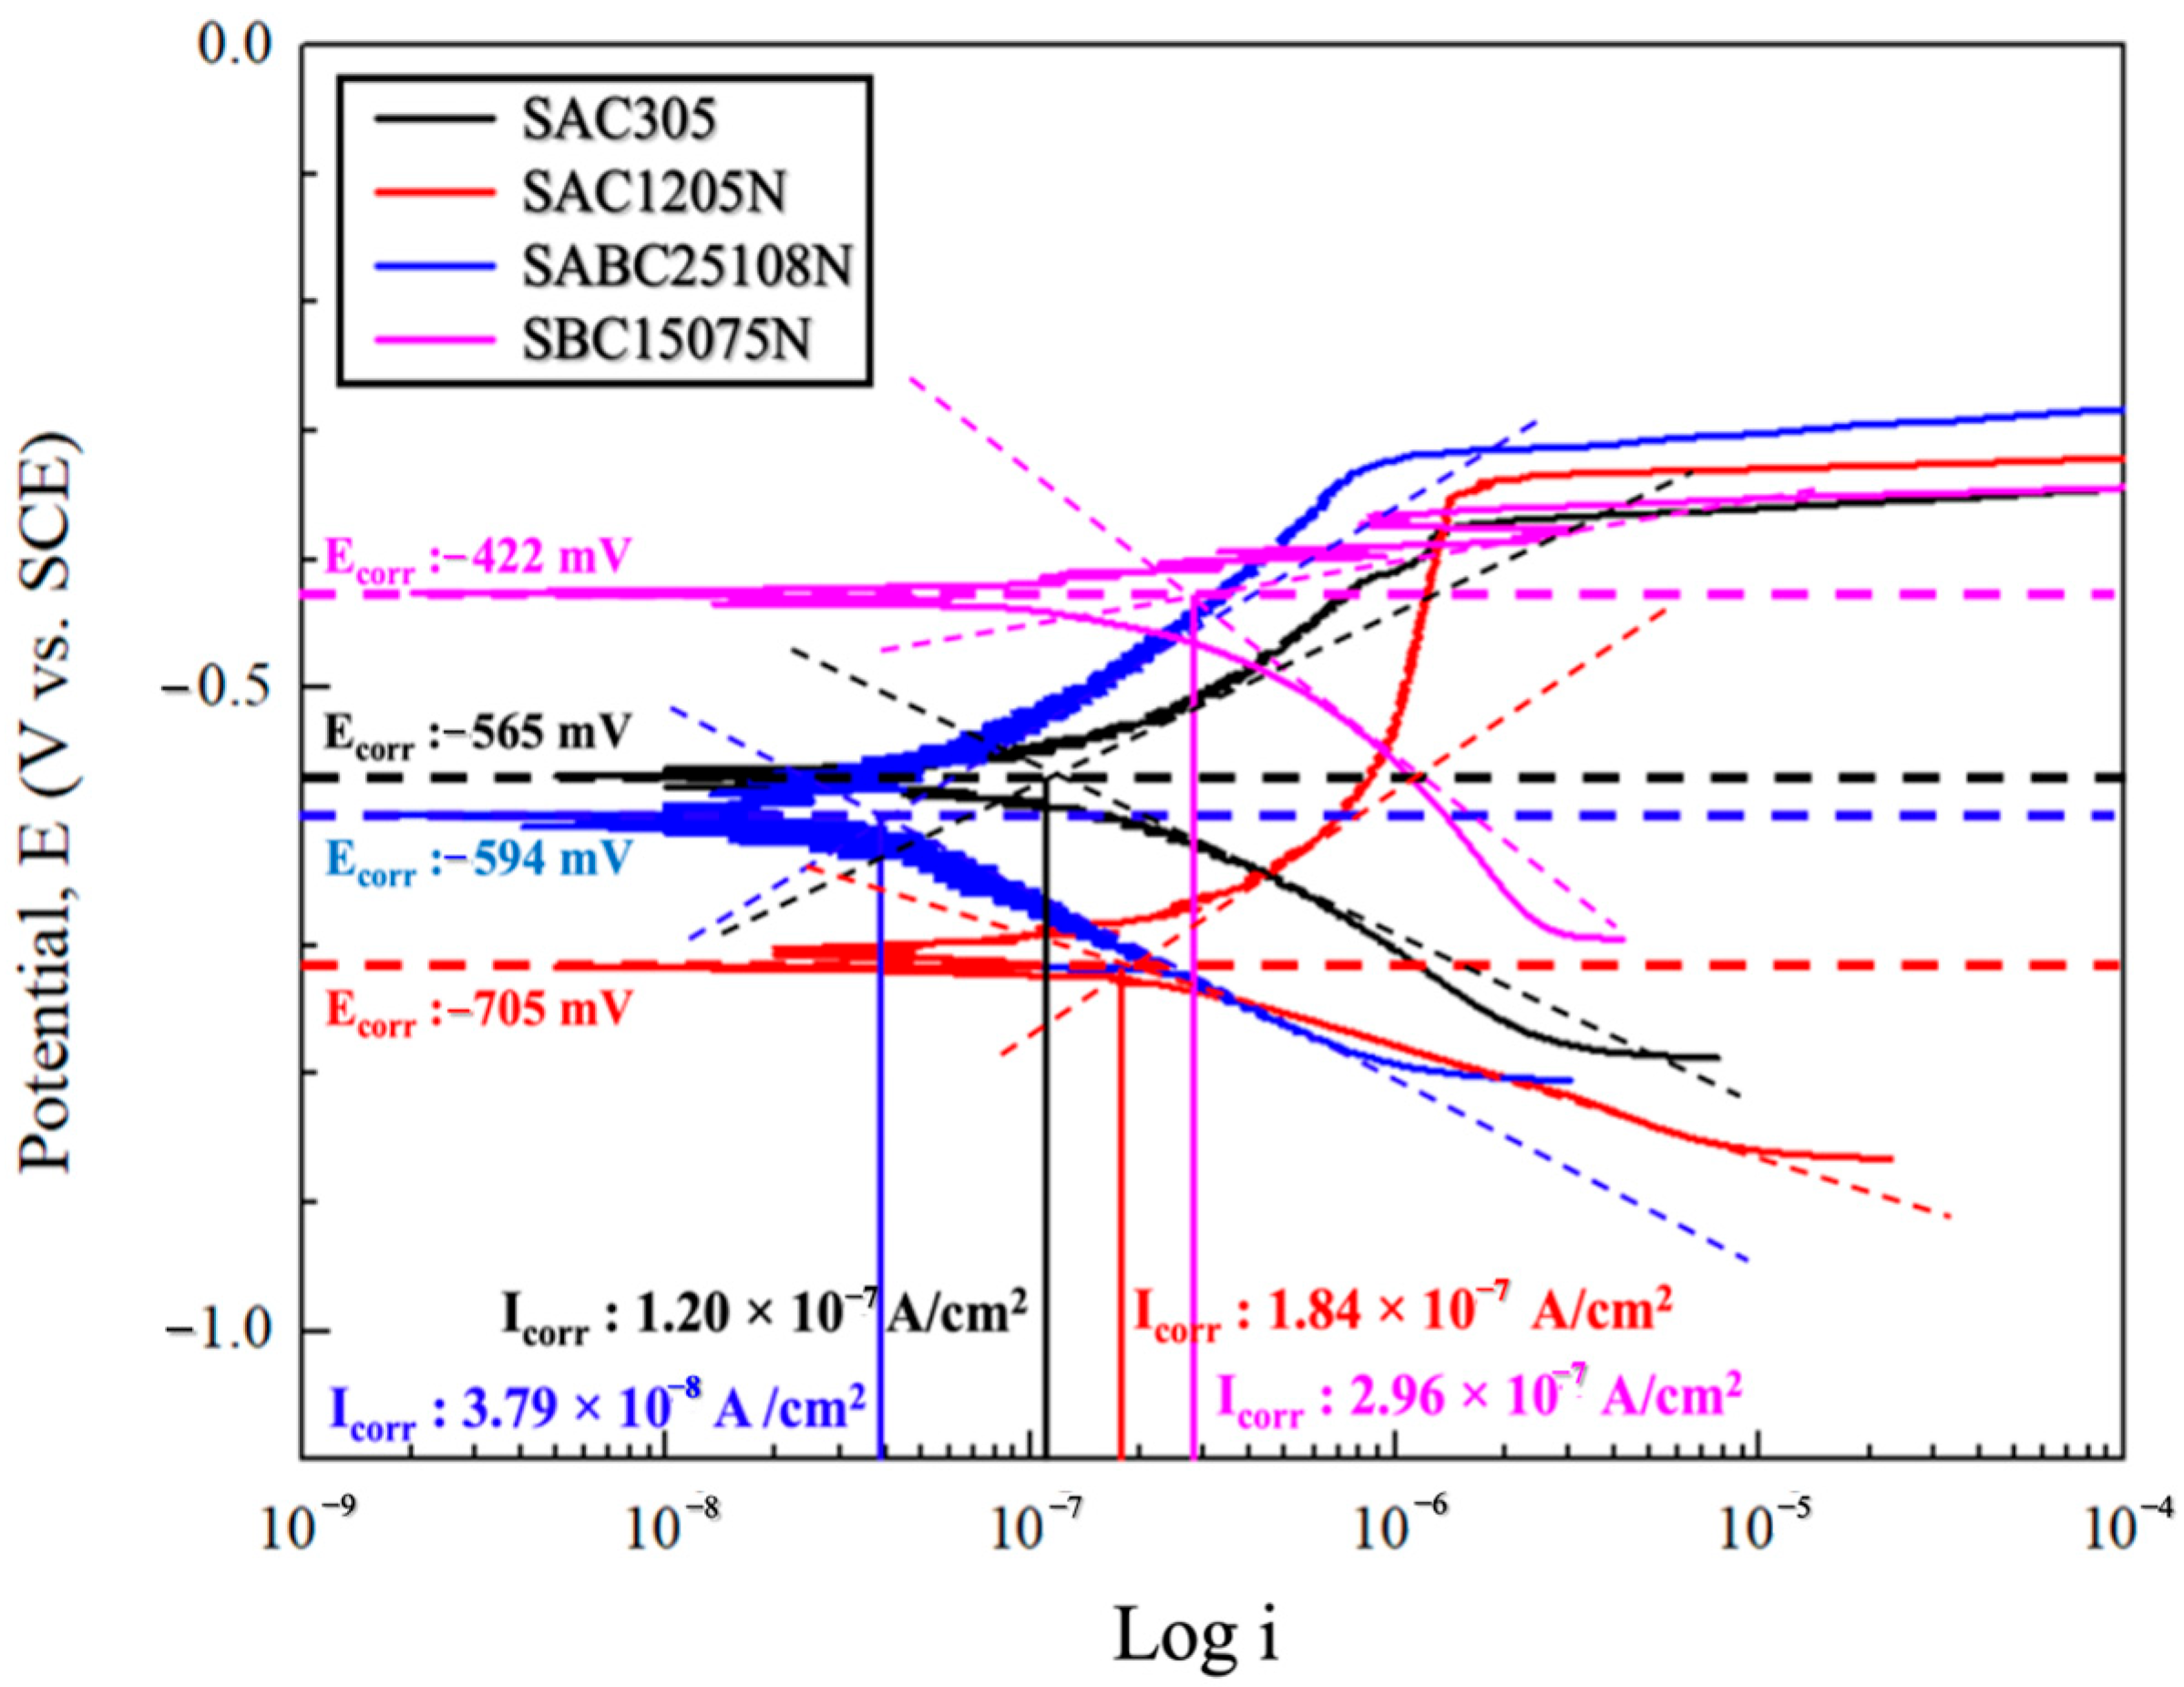
3.1. Potentiodynamic Polarization Test

Figure 2 presents the potentiodynamic polarization curves measured for the four solder compositions to assess their corrosion behaviors. Each solder composition exhibited a different corrosion potential (Ecorr). As the voltage increased in the positive direction from Ecorr, the anodic reaction at the solder plate surface transitioned to an active state, thus resulting in corrosion. In this region, the dissolution reaction of the metal surface may result in the accumulation of hydroxides or corrosion oxides, which can compromise the accuracy of corrosion-rate measurements. Cathodic polarization has been reported to be a more precise and reliable method for corrosion-rate analysis [41,42,43,44,45].
When scanning the potential from negative to positive values, the data up to approximately −0.3 V corresponds to the active-state region, including the Tafel curve. In this region, Icorr and Ecorr can be extracted to evaluate the corrosion characteristics quantitatively [46,47,48,49,50]. However, beyond −0.3 V, a passive film forms on the metal surface, thus transitioning the system into the passive state, where the current density remains relatively stable. As the potential increases further, the system enters a transpassive state, where the breakdown of the passive film causes the current density to increase or decrease abruptly [51,52,53].
All solder compositions exhibited a Tafel curve up to approximately −0.4 V after the initiation of scanning, followed by a gradual increase in the current density, thus forming the active state. The conventional SAC compositions showed similar behaviors beyond the active state, i.e., entering the passive state earlier than the newly developed SABC25108N and SBC15075N before transitioning into the transpassive state, with a subsequent increase in the current density. For SABC25108N, the current density continued to increase as the potential increased further in the active state, thus suggesting that a significant amount of time was required for the corrosion oxides to fully shield the surface. Subsequently, the current density decreased, and the passive state was maintained up to approximately 0.7 V before it transitioned into the transpassive state. By contrast, SBC15075N exhibited a relatively short active state owing to the rapid formation of corrosion oxides, followed by a rapid transition into passive and transpassive states. Additionally, SBC15075N showed a higher corrosion current density at relatively lower potentials, thereby indicating greater material loss and suggesting that its corrosion resistance was inferior to those of the other compositions. These results indicate that the newly developed SABC25108N exhibited the most stable formation of corrosion oxides, even at higher potentials, thus resulting in the longest passive state. Consequently, this composition exhibited the highest corrosion resistance among the tested alloys.
The Tafel extrapolation obtained from the polarization curves measured during the potentiodynamic tests for the four solder compositions is shown in Figure 3. Additionally, the corresponding corrosion rates for each composition were calculated. The Ecorr and Icorr were determined by drawing tangents to the anodic and cathodic polarization curves and identifying their intersection points, which corresponded to the reversible electrode potential [50,54,55]. The results are summarized in Table 2. A detailed analysis of the active state, which is highly relevant to the actual corrosion behavior, revealed that SBC15075N exhibited a higher corrosion current even at relatively low potentials, thus indicating a more rapid corrosion progression. This suggests that SBC15075N possesses a lower corrosion resistance compared with the other compositions, primarily owing to the absence of Ag in its composition, which accelerates the formation of corrosion oxides [56,57,58]. By contrast, SABC25108N showed a relatively lower corrosion current in the active state, thus indicating a slower corrosion progression. This suggests that the formation of corrosion oxides on the surface occurred in a more stable manner, thus contributing to its superior corrosion resistance.
In Table 3, Ecorr, which represents the potential at which corrosion initiates, was measured as −565, −704, −594, and −422 mV for SAC1205N, SABC25108N, SAC305, and SBC15075N, respectively. By contrast, a comparison of Icorr revealed that SBC15075N, SAC1205N, SAC305, and SABC25108N exhibited values of 296, 184, 120, and 37.9 × 10⁻⁹ A/cm2, respectively. This indicates that in the anodic active state, corrosion progressed the most rapidly in SBC15075N, whereas SABC25108N exhibited the lowest corrosion rate. Accordingly, the calculated corrosion rates exhibited the same trend, which ranked in the order of SBC15075N > SAC1205N > SAC305 > SABC25108N. The corrosion rates of SBC15075N were 146% and 61% higher than those of SAC305 and SAC1205N, respectively, whereas SABC25108N exhibited a significantly lower corrosion rate, thus demonstrating its superior corrosion resistance. The high corrosion rate of SBC15075N is attributed to its Ag-free composition. This interpretation aligns well with the observation that SBC15075N exhibits a considerably higher corrosion rate than SAC1205N, which has a relatively low Ag content. By contrast, the five-element SABC25108N, which includes Ag, exhibited a significantly lower Icorr, thus confirming its superior corrosion resistance. Moreover, its corrosion rate was substantially lower than that of SAC305, despite SAC305 having a higher Ag content. These findings reveal that when the Ag content exceeds a certain threshold, the corrosion resistance of multicomponent solder alloys improves, provided that elements such as Pb or Zn, which can significantly promote corrosion, are not alloyed.

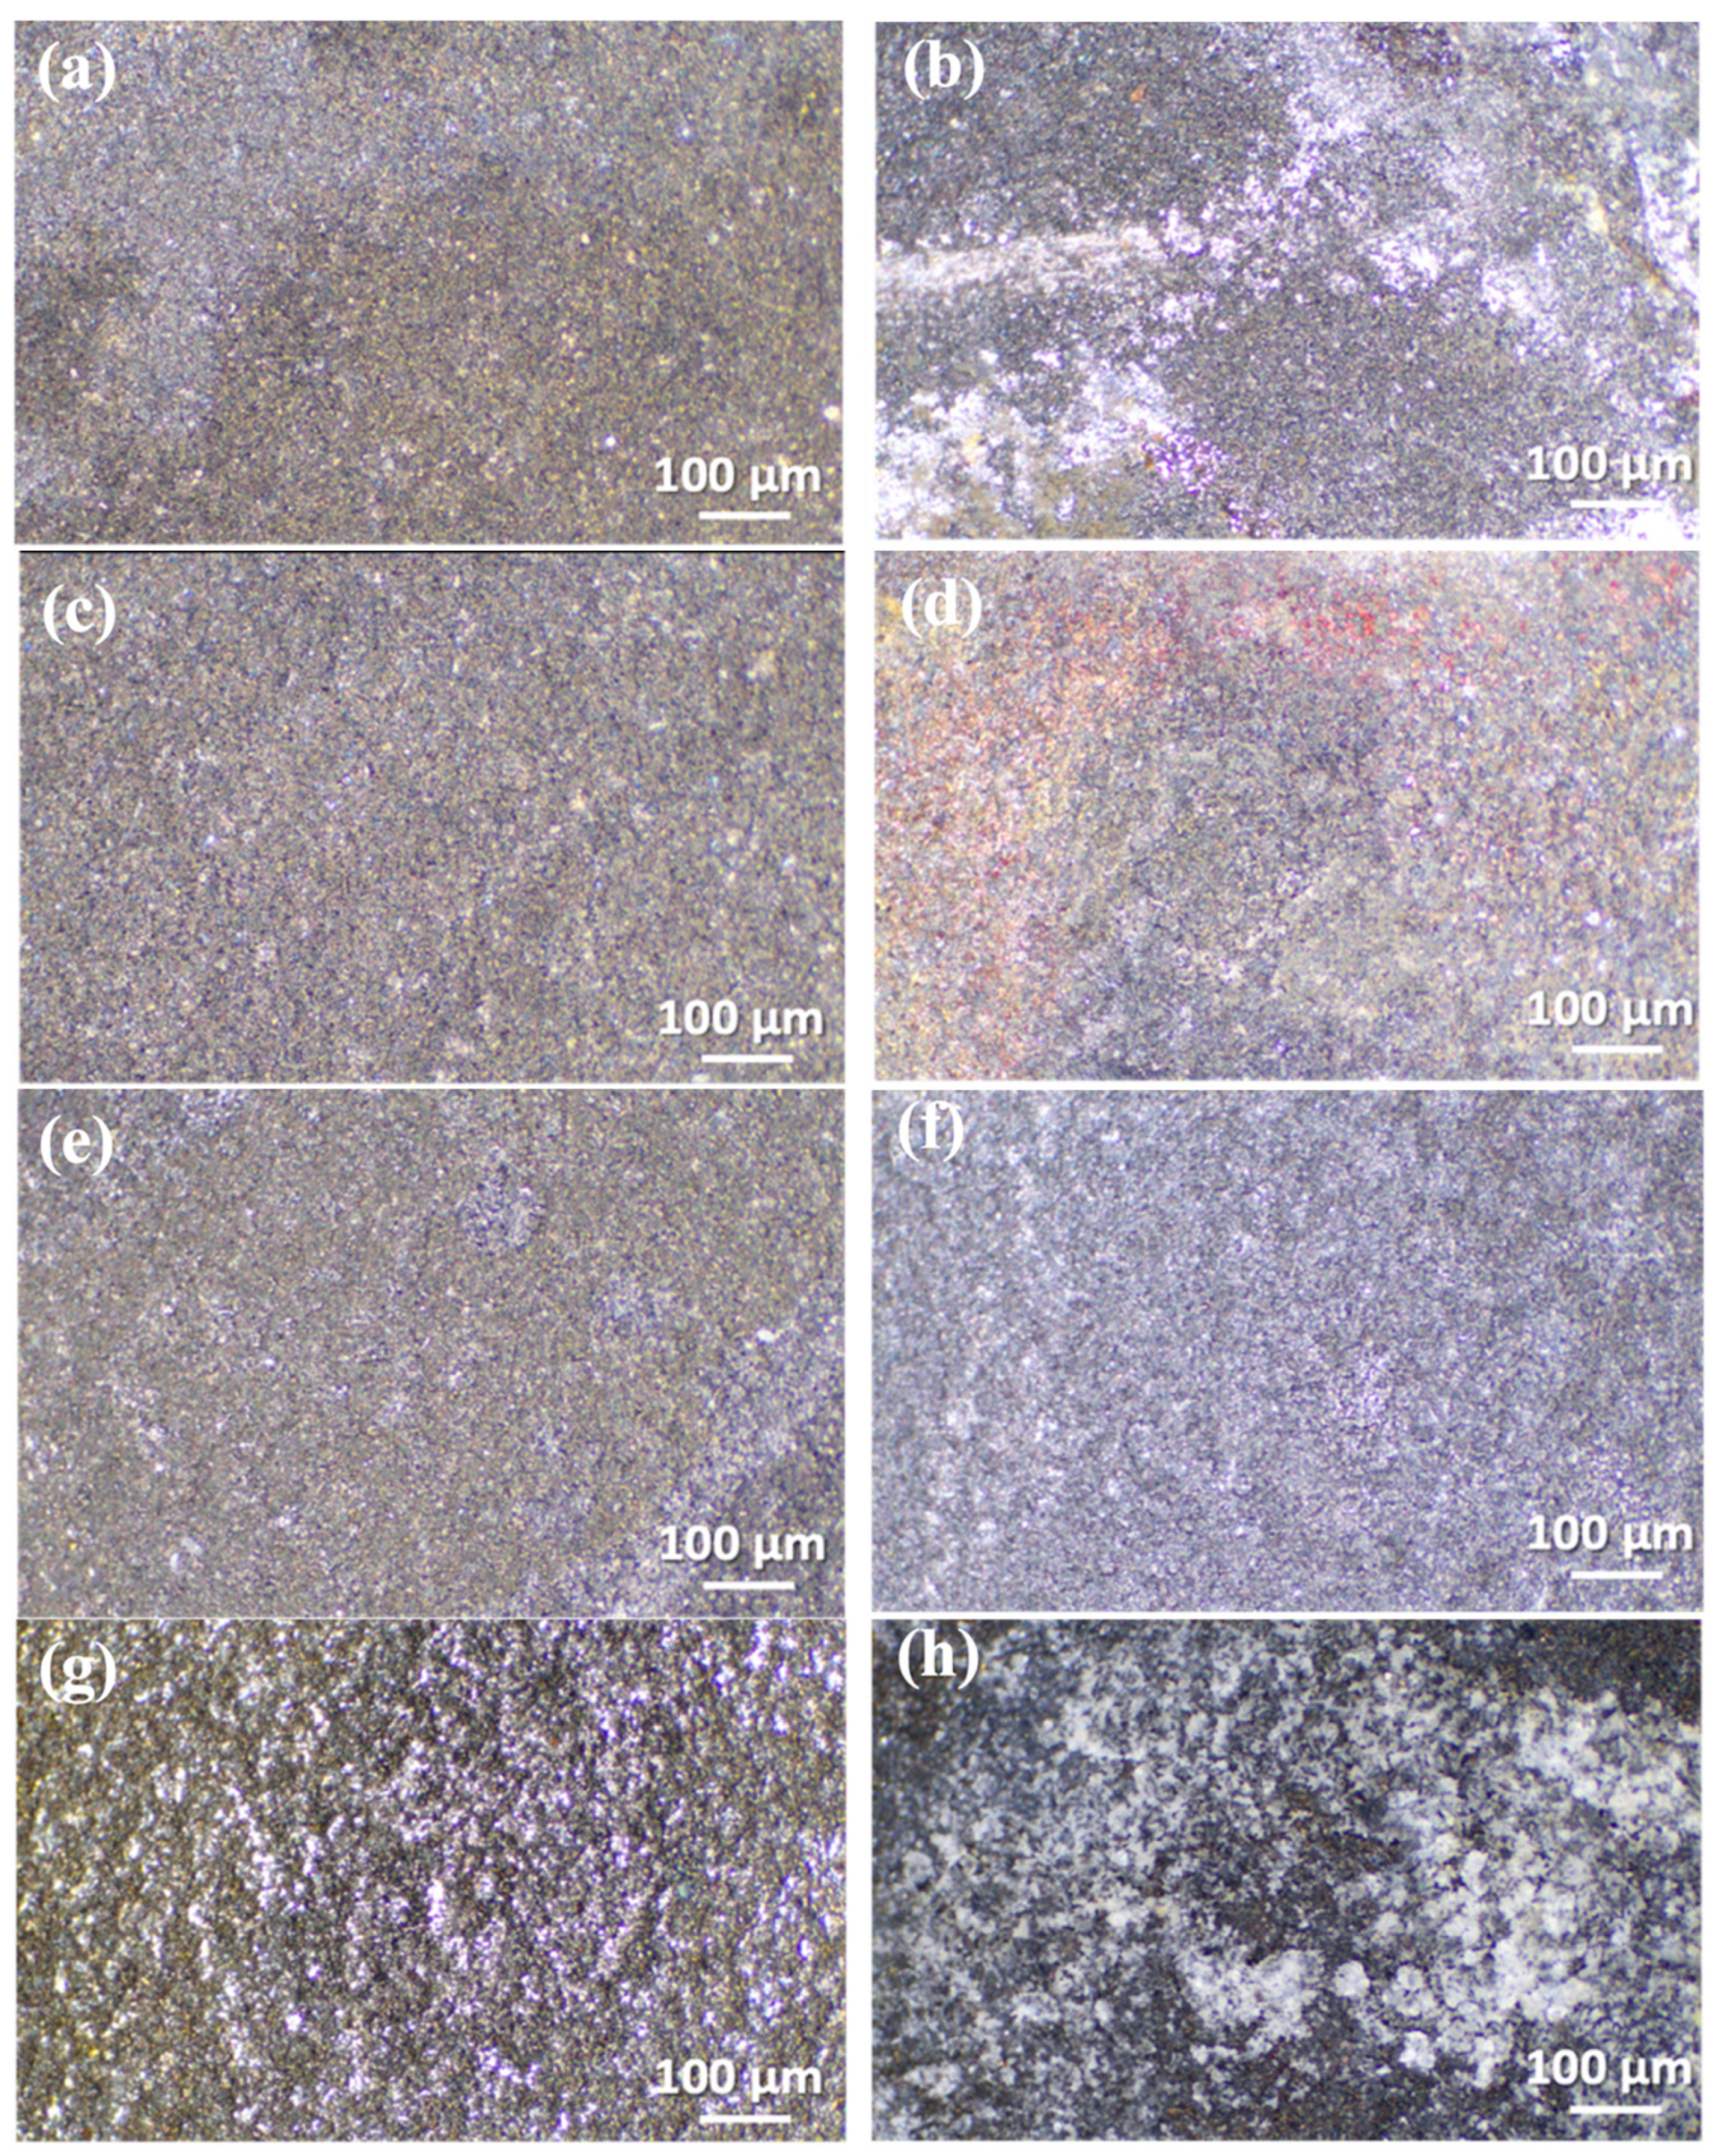
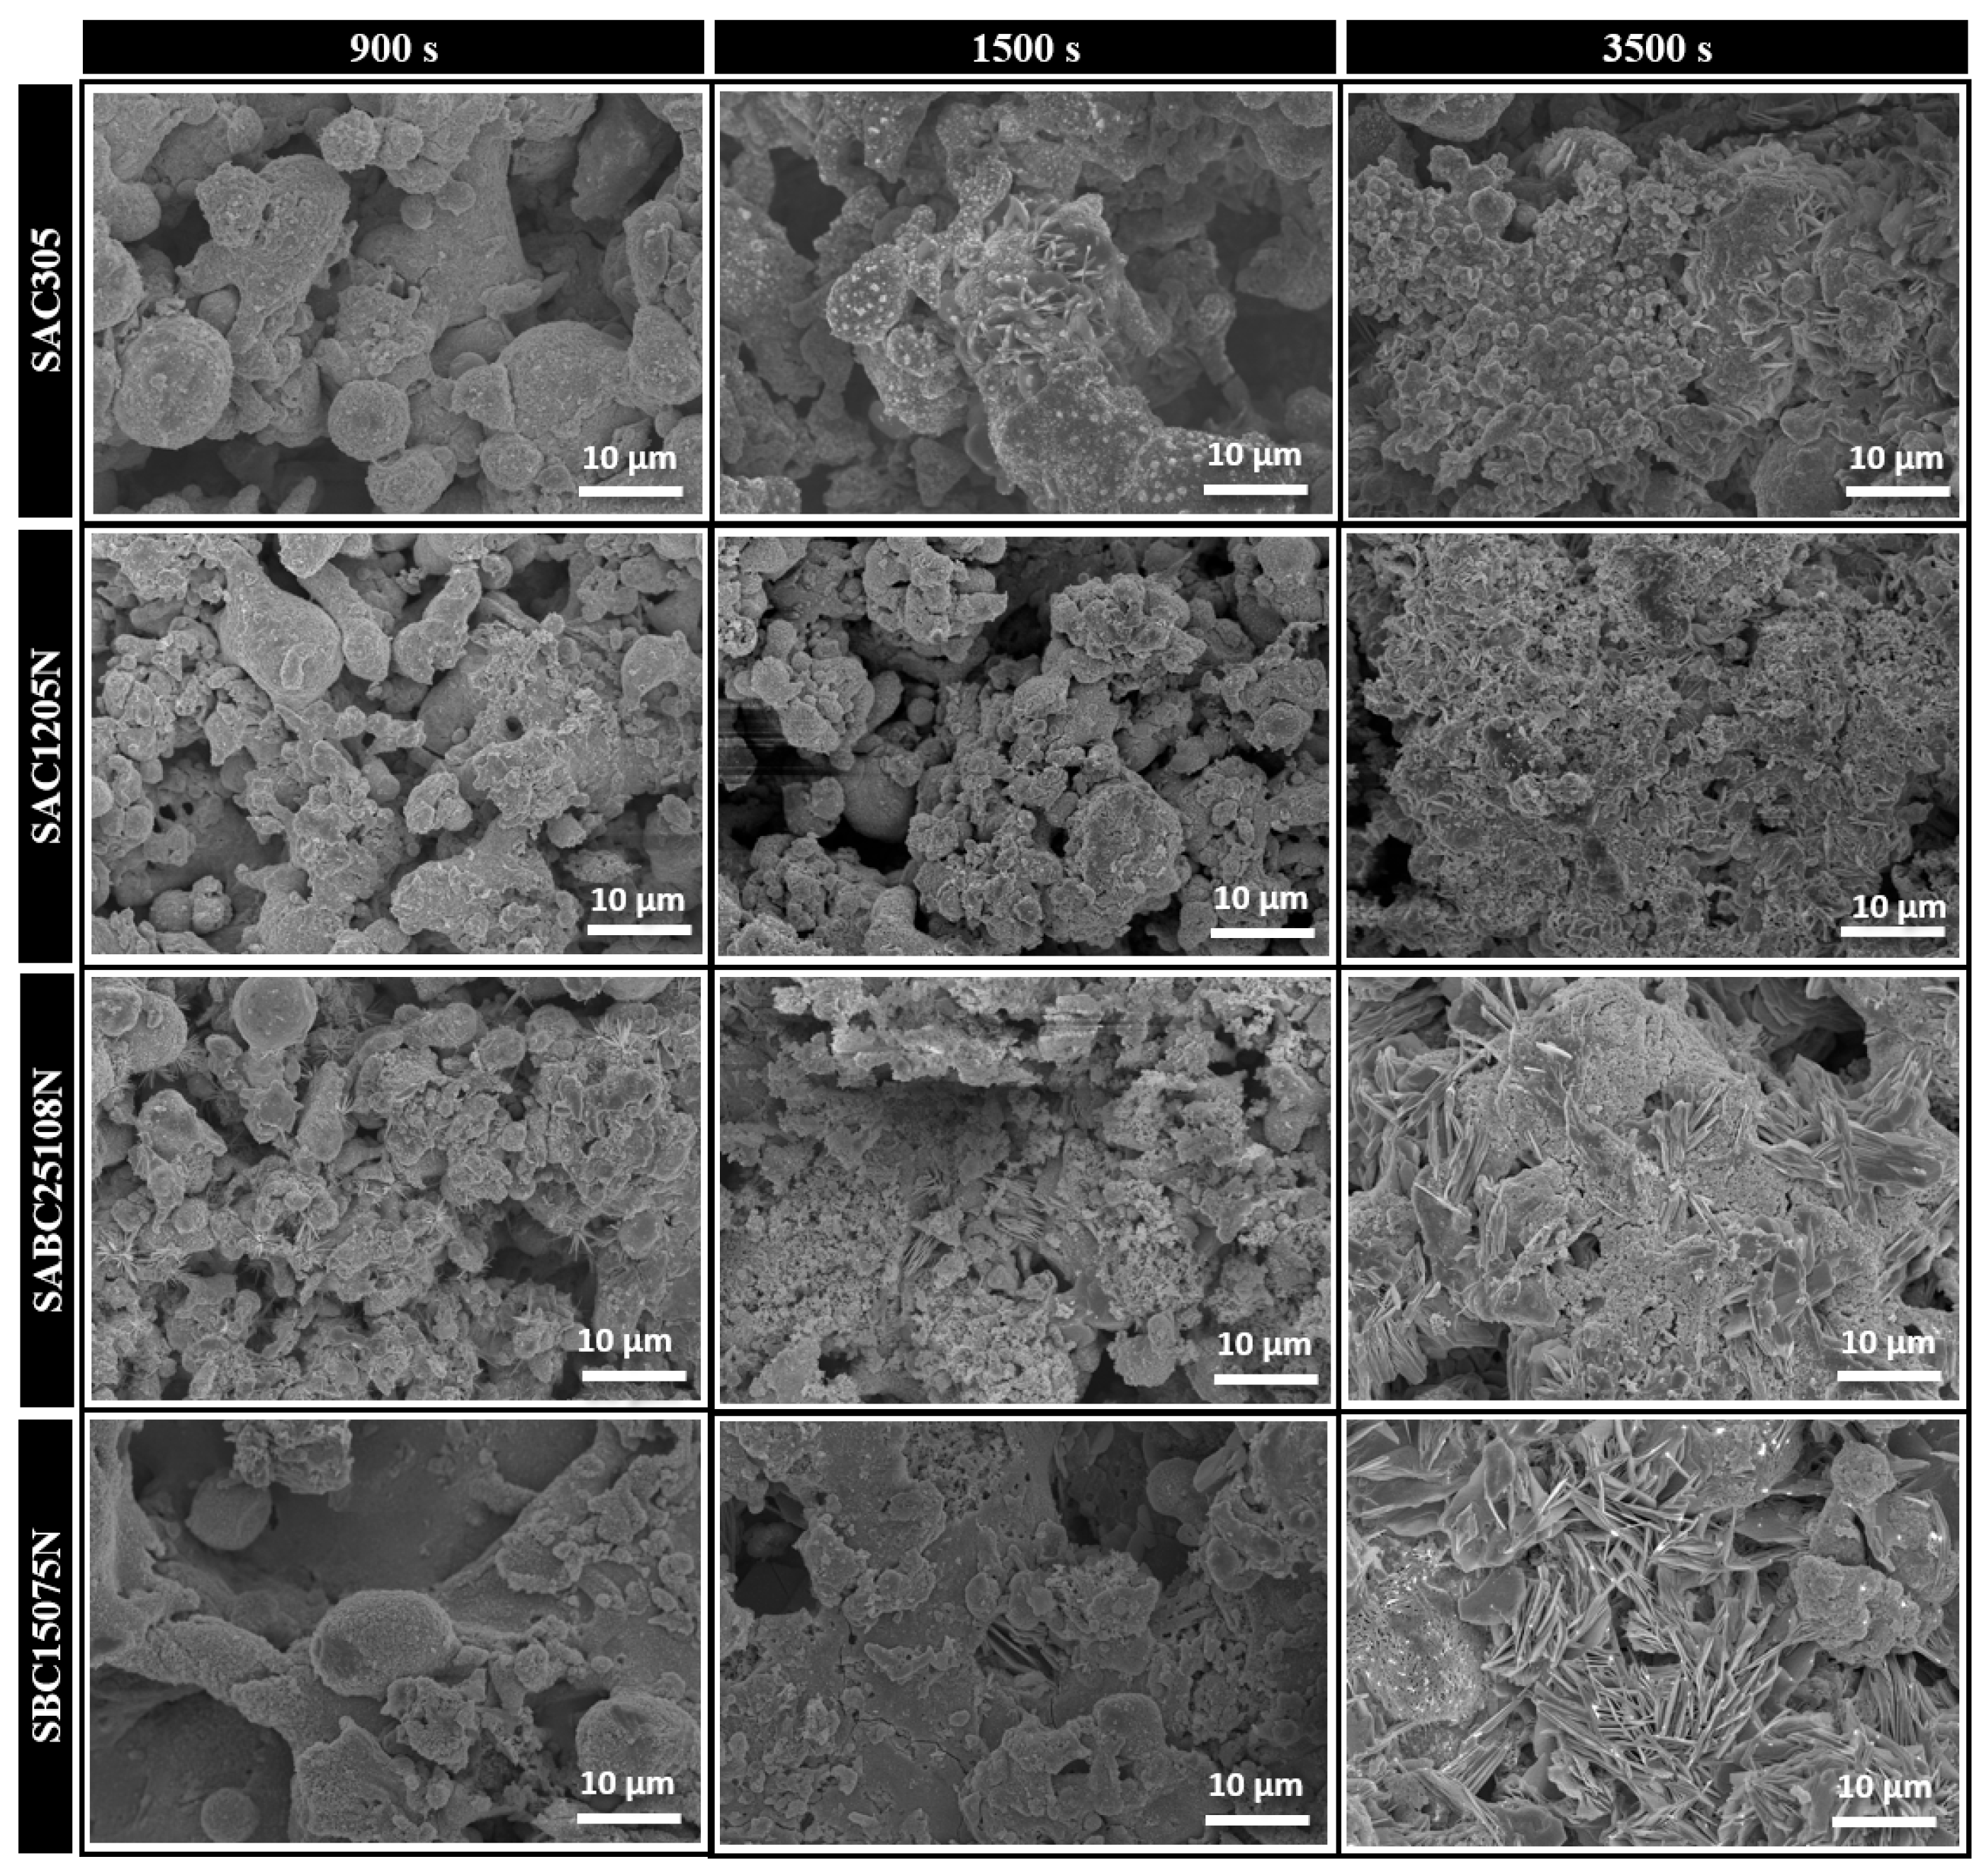
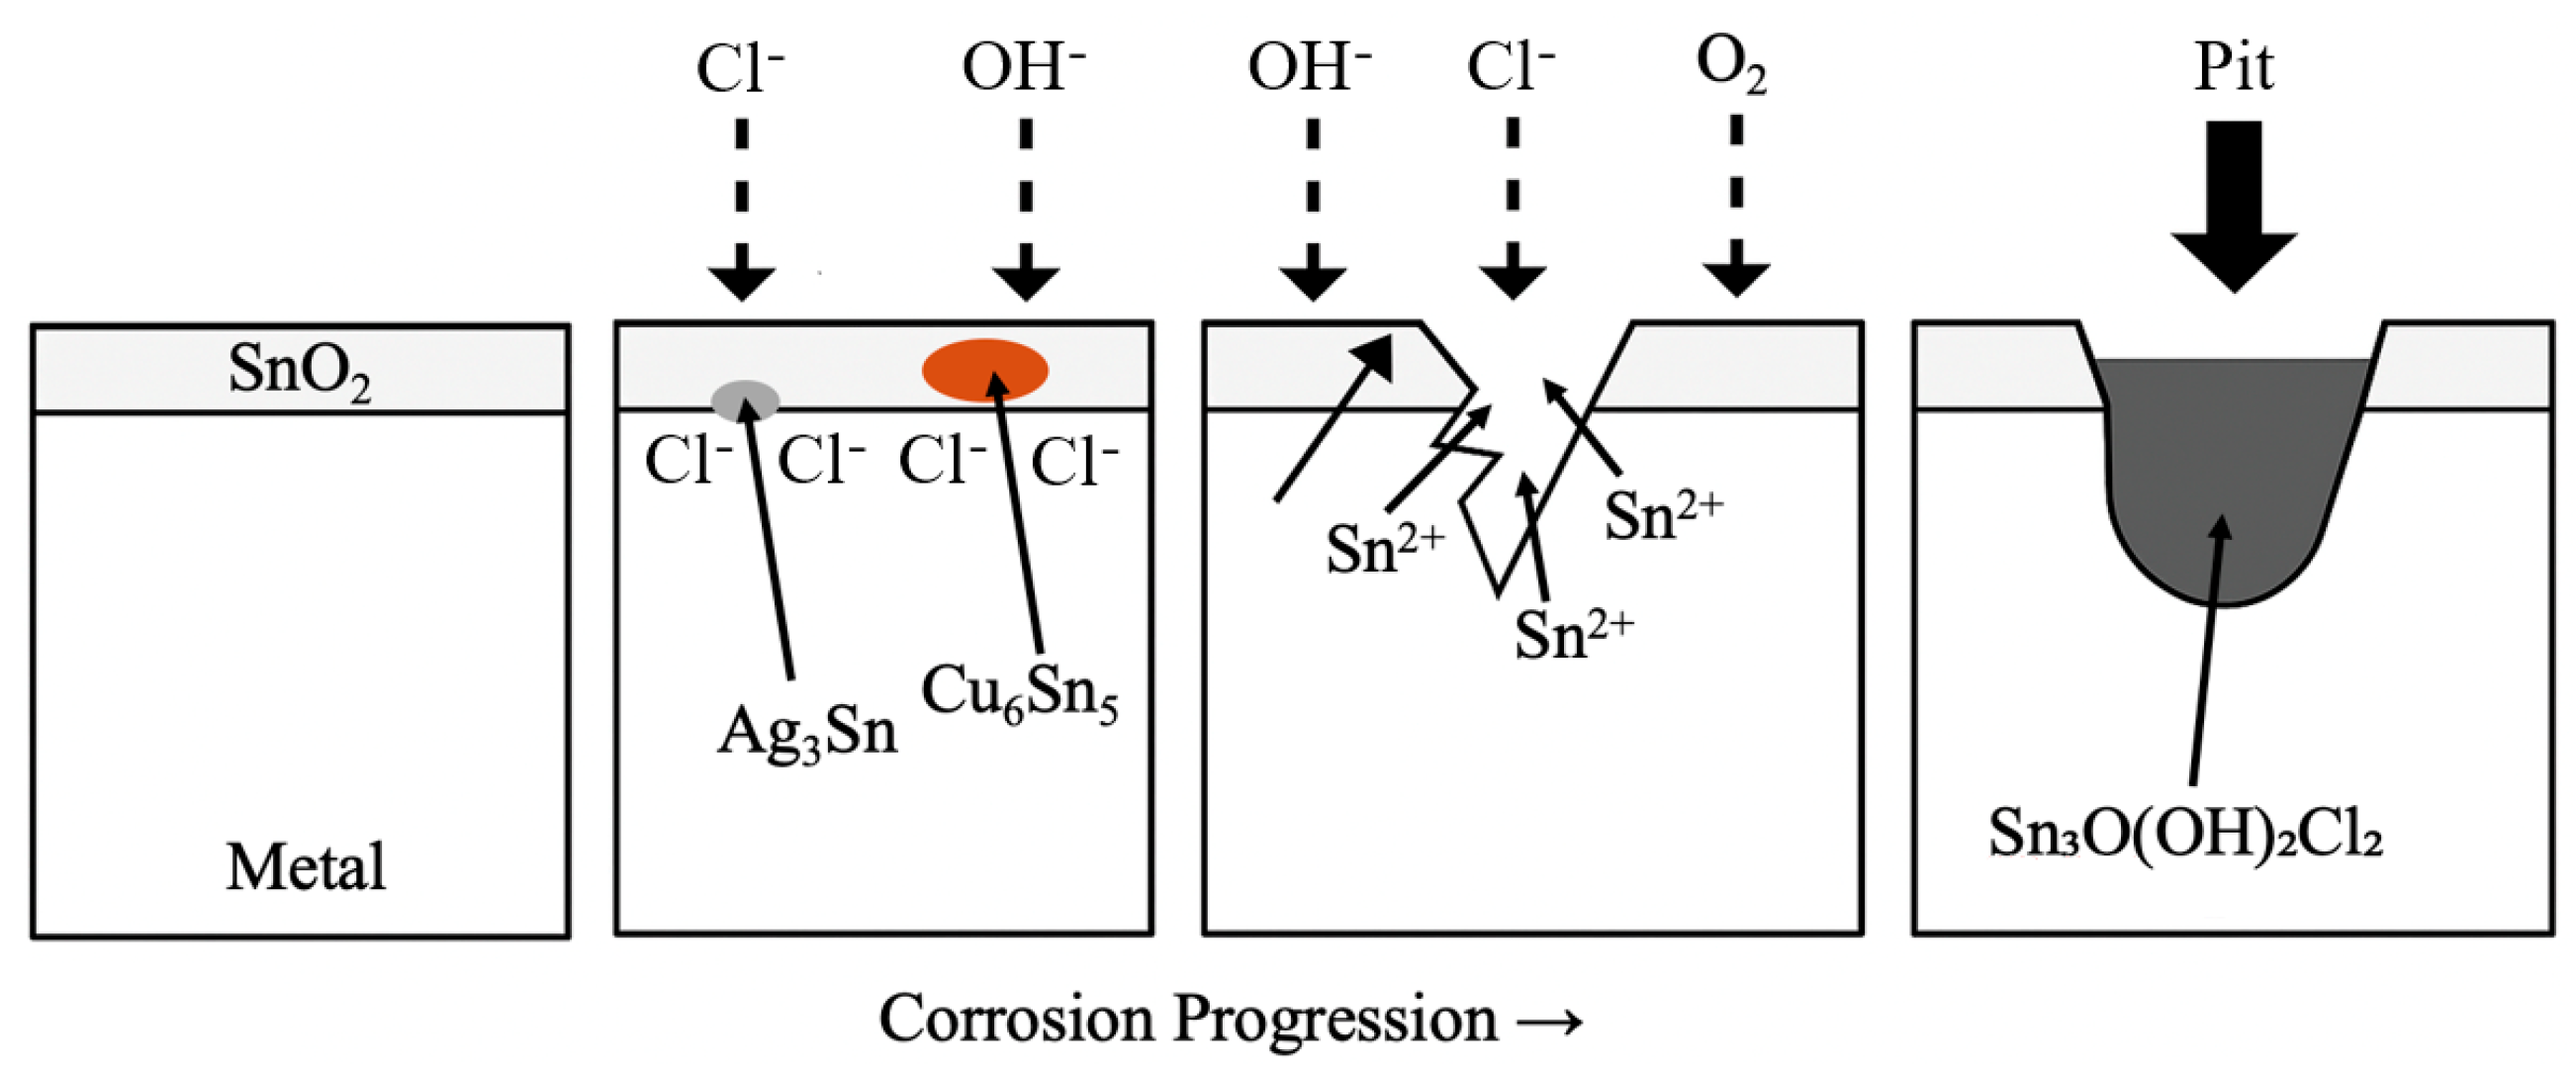
3.2. Microstructural Characterization

The surface morphologies of the solder plates after corrosion for 900 and 3500 s, as observed using an optical microscope, are shown in Figure 4. For all the solder compositions, corrosion products accumulated gradually on the plate surface as the corrosion time increased. Under 900 s of corrosion, the formation of corrosion products was at an early stage; however, in SBC15075N, a significantly larger amount of corrosion products was observed even at this early stage owing to its Ag-free characteristics. This visually confirms the lower corrosion resistance of SBC15075N compared with those of the other compositions. After 3500 s of corrosion, the accumulation of corrosion products increased in general, thus indicating more severe corrosion. Notably, in the SAC305 plate, corrosion-product crystals were highly concentrated in certain regions. This localized corrosion-product formation appeared to be more pronounced compared with the uniform corrosion products observed in SAC1205N and SABC25108N. Meanwhile, in SAC1205N, a reddish-colored surface was identified through optical microscopy, which was attributed to the formation of oxidation products. Comparing the corrosion resistance of each composition, SABC25108N demonstrated the highest corrosion resistance, followed by SAC305 and SAC1205N, which exhibited relatively high resistance. By contrast, SBC15075N was the most susceptible to corrosion. The corrosion consumption of β-Sn measured for each sample is summarized in Figure 5. These values were normalized after comparing the β-Sn consumption at 900 s and 1500 s. The results clearly confirm again the trend of increasing corrosion susceptibility in the order of SBC15075N > SAC1205N > SAC305 > SABC25108N. The superior oxidation resistance of SABC25108N was attributed to its Ag content and multicomponent composition, which resulted in the lowest formation of corrosion products. These findings reveal that the newly developed SABC25108N solder composition can be effectively applied in corrosive environments, such as saline conditions.
The X-ray diffraction (XRD) analysis results for the phases present on the surface of the solder plates after 900 s of corrosion testing are shown in Figure 6 (β-Sn: JCPDS No. 41-1445, Cu6Sn5: JCPDS No. 45-1488, Ag3Sn: JCPDS No. 44-1308, Bi: JCPDS No. 85-1331). The measured diffraction peak intensities were normalized. The XRD results of the solder alloys prior to the corrosion test can be found in a previously published report [59]. The diffraction peaks corresponding to the IMC precipitate phase of Ag3Sn were detected in all compositions except for the Ag-free SBC15075N. The peaks corresponding to the (020) and (211) planes of Ag3Sn were observed at 37.60° and 39.59° [60,61], respectively. A comparison of the Ag3Sn intensities revealed that SAC305 and SAC1205N exhibited similar peak intensities, whereas SABC25108N showed a relatively lower intensity. This suggests that the formation of the Ag3Sn phase in SABC25108N is more limited compared with those in SAC305 and SAC1205N, which may affect its stability and corrosion resistance in corrosive environments.
After conducting an additional 1500 s of corrosion testing, XRD analysis was re-performed, and the results are presented in Figure 7. To evaluate the extent of corrosion progression, the consumption of the β-Sn phase, which is expected to undergo active corrosion, was compared across different compositions. Diffraction peaks corresponding to the (220) and (211) planes of β-Sn were detected at 43.87° and 44.90° [62,63], respectively, with distinct intensity variations observed among the compositions. Estimations of β-Sn consumption from the reduced intensity showed that the SBC15075N solder plate exhibited the highest β-Sn depletion, followed by SAC1205N. By contrast, SAC305 and SAC1205N showed relatively high β-Sn intensities, thus indicating the lowest consumption levels. These results suggest that SBC15075N underwent the most rapid formation of corrosion products through β-Sn ionization, whereas SAC1205N exhibited a relatively high corrosion-reaction rate.
Following 3500 s of corrosion testing, the progression of corrosion was comparatively evaluated by analyzing the formation of the primary corrosion product, stannic oxychloride (Sn3O(OH)2Cl2, JCPDS No. 39-0314), based on XRD patterns, as shown in Figure 8. The peak intensities at 30.90° and 35.43°, which correspond to the main diffraction peaks of Sn3O(OH)2Cl2, were analyzed. The results indicate that the amount of Sn3O(OH)2Cl2 formation followed the order of SBC15075N > SAC1205N > SAC305 > SABC25108N. Additionally, an analysis of the main diffraction peak of another IMC precipitate phase, Cu6Sn5 (30.09°), revealed a trend similar to that observed for Sn3O(OH)2Cl2 formation. Because the Cu content in SAC305 and SAC1205N was significantly higher (0.5 wt%) than that in SABC25108N (0.8 wt%), the results above were unexpected. Furthermore, as shown in Figure 8, the β-Sn phase was completely consumed in all compositions, thus indicating that prolonged corrosion resulted in the complete transformation of Sn into corrosion products.
In summary, the Ag-free SBC15075N exhibited the highest formation of corrosion products, followed by SAC1205N. By contrast, SABC25108N, which had a lower Ag content than SAC305, displayed a similar or lower degree of corrosion progression than SAC305. This suggests that a multicomponent composition containing a certain threshold of Ag, along with Bi and Ni, contributes to improved corrosion resistance.
Figure 9 illustrates the morphological changes on the solder plate surfaces after 900, 1500, and 3500 s of corrosion based on representative SEM images. The SEM images of the solder alloys prior to the corrosion test are available in a previously published report [59]. Based on the preceding results, the condition at 900 s is regarded as the active state, that at 1500 s as the transition to the passive state, and that at 3500 s as the passive state. In the plates corroded for 900 s, the Sn matrix structure remained intact, with IMC phases observed in the localized regions. This structural characteristic is consistent with the XRD results shown in Figure 6, in which peaks corresponding to the original solder alloy phases were detected. However, after 3500 s of corrosion, a substantial amount of corrosion product Sn3O(OH)2Cl2 was formed on the solder plate surfaces. As the amount of Sn3O(OH)2Cl2 increased, a tendency to transition into rod- and plate-like structures was indicated. The areas in Figure 9 where rod- and plate-shaped Sn3O(OH)2Cl2 phases were observed to correlate with the Sn3O(OH)2Cl2 peak intensities in the XRD results shown in Figure 7. This indicates that as corrosion progresses over extended periods, the Sn3O(OH)2Cl2 phase develops rod- and plate-like morphologies, which gradually shield the surface of the solder plate.
In the case of SABC25108N, Ag3Sn phases with a weed-like morphology were present locally after 900 s of corrosion. However, these phases disappeared after 3500 s of corrosion, and compared with the other compositions, the formation of rod- and plate-shaped Sn3O(OH)2Cl2 was significantly lower. This further confirms that corrosion progression in SABC25108N was relatively minimal. Conversely, in SBC15075N, the largest amount of rod- and plate-shaped Sn3O(OH)2Cl2 was observed after 3500 s of corrosion, thus reaffirming that SBC15075N exhibited the lowest corrosion resistance.
The schematic illustration in Figure 10 summarizes the time-dependent corrosion behavior of solder sample surfaces in the NaCl-containing seawater environment discussed above. Initially, a passive layer composed of SnO2 forms on the surface. However, as Cl and OH ions penetrate the surface, localized oxidation and crack initiate and proceed around intermetallic compounds (IMCs) such as Ag3Sn and Cu6Sn5. Subsequently, the leaching of Sn2+ ions leads to the progressive development of pitting corrosion. In the final stage, corrosion products such as Sn3O(OH)2Cl2 are formed within the pits.
This study demonstrated that subtle variations in solder composition significantly affect the subsequent corrosion behavior. Additionally, multicomponent compositions containing a sufficient amount of Ag, such as SABC25108N, effectively enhanced corrosion resistance. These findings provide valuable insights for designing optimized solder compositions with improved corrosion resistance and serve as a useful reference for the development of new solder alloys.

4. Conclusions

In this study, the electrochemical corrosion behavior of newly developed SABC25108N and SBC15075N solder compositions was evaluated in a 3.5 wt% NaCl solution and compared with those of conventional representative solder compositions (SAC305 and SAC1205N). Specifically, potentiodynamic polarization tests were conducted to measure the corrosion potential and corrosion current density for each composition, thus enabling a comparative assessment of the corrosion resistance. Additionally, XRD and SEM analyses were performed to investigate the formation behavior of the corrosion products.
Analysis of the potentiodynamic polarization curves revealed that the SBC15075N composition exhibited the lowest Ecorr and highest Icorr, thus indicating the lowest corrosion resistance. By contrast, SABC25108N exhibits the lowest Icorr, thus confirming its superior corrosion resistance. Notably, SABC25108N exhibited relatively slower corrosion progression in the active state the longest passive state. This behavior was attributed to the sufficient Ag content and multicomponent composition of SABC25108N, which facilitated the stable formation of corrosion products on the specimen surface, thus providing a protective effect.
SEM and XRD analyses of the 900 s corroded samples revealed that the microstructure primarily comprised an Sn matrix, with IMC phases, such as Ag3Sn and Cu6Sn5, distributed in localized regions. However, after 3500 s of corrosion, Sn3O(OH)2Cl2 emerged as the dominant corrosion product, which resulted in distinct microstructural differences among the compositions. Notably, SBC15075N exhibited the highest amount of Sn3O(OH)2Cl2, which corresponded with the lowest corrosion resistance. By contrast, SABC25108N showed a significantly limited formation of Sn3O(OH)2Cl2 compared with the other compositions, thus confirming its superior corrosion resistance.

Author Contributions

Conceptualization, J.-H.L.; methodology, J.-H.L.; validation, S.H.J.; formal analysis, S.H.J. and J.-H.L.; investigation, S.H.J.; resources, S.H.J. and J.-H.L.; data curation, S.H.J.; writing—original draft preparation, S.H.J. and J.-H.L.; writing—review and editing, J.-H.L.; visualization, S.H.J.; supervision, J.-H.L.; project administration, J.-H.L.; funding acquisition, J.-H.L. All authors have read and agreed to the published version of the manuscript.

Funding

This research was conducted with the support of the Ministry of Trade, Industry, and Energy’s Global Key Technology Development Program for Root Technology Development (Project No. 20018332).

Data Availability Statement

The original contributions presented in the study are included in the article, and further inquiries can be directed to the corresponding author.

Conflicts of Interest

The authors declare no conflicts of interest.

References

  1. Herat, S. Green electronics through legislation and lead free soldering. Clean 2008, 36, 145–151. [Google Scholar] [CrossRef]
  2. Suganuma, K. Advances in lead-free electronics soldering. Curr. Opin. Solid State Mater. Sci. 2001, 5, 55–64. [Google Scholar] [CrossRef]
  3. Terachima, S.; Kariya, Y.; Hosoi, T.; Tanaka, M. Effect of silver content on thermal fatigue life of Sn-xAg-0.5 Cu flip-chip interconnects. J. Electron. Mater. 2003, 32, 1527–1533. [Google Scholar] [CrossRef]
  4. Syed, A.; Scanlan, J.; Cha, S.W.; Kang, W.J.; Sohn, E.S.; Kim, T.S.; Ryu, C.G. Impact of package design and materials on reliability for temperature cycling, bend, and drop loading conditions. In Proceedings of the 58th Electronic Components and Technology Conference, Lake Buena Vista, FL, USA, 27–30 May 2008. [Google Scholar]
  5. Zhao, X.J.; Caers, J.F.J.M.; De Vries, J.W.C.; Kloosterman, J.; Wong, E.H.; Rajoo, R. Improvement of mechanical impact resistance of BGA packages with Pb-free solder bumps. In Proceedings of the 8th Electronics Packaging Technology Conference, Singapore, 6–8 December 2006. [Google Scholar]
  6. Birzer, C.; Rakow, B.; Steiner, R.; Walter, J. Drop test reliability improvement of lead-free fine pitch BGA using different solder ball composition. In Proceedings of the 7th Electronic Packaging Technology Conference, Singapore, 7–9 December 2005. [Google Scholar]
  7. Terashima, S.; Kohno, T.; Mizusawa, A.; Arai, K.; Okaga, O.; Wakabayashi, T.; Tanaka, M.; Tatsumi, K. Improvement of thermal fatigue properties of Sn-Ag-Cu lead-free solder interconnects on Casio’s wafer-level packages based on morphology and grain boundary character. J. Electron. Mater. 2009, 38, 33–38. [Google Scholar] [CrossRef]
  8. Chen, Z.; Shi, Y.; Xia, Z.; Yan, Y. Properties of lead-free solder SnAgCu containing minute amounts of rare earth. J. Electron. Mater. 2003, 32, 235–243. [Google Scholar] [CrossRef]
  9. Xiao, W.; Shi, Y.; Lei, Y.; Xia, Z.; Guo, F. Comparative study of microstructures and properties of three valuable SnAgCuRE lead-free solder alloys. J. Electron. Mater. 2006, 35, 1095–1103. [Google Scholar] [CrossRef]
  10. Tsao, L.C. An investigation of microstructure and mechanical properties of novel Sn3.5Ag0.5Cu–XTiO2 composite solders as functions of alloy composition and cooling rate. Mater. Sci. Eng. A 2011, 529, 41–48. [Google Scholar] [CrossRef]
  11. Gain, A.K.; Fouzder, T.; Chan, Y.C.; Sharif, A.; Wong, N.B.; Yung, W.K.C. The influence of addition of Al nano-particles on the microstructure and shear strength of eutectic Sn–Ag–Cu solder on Au/Ni metallized Cu pads. J. Alloys Compd. 2010, 506, 216–223. [Google Scholar] [CrossRef]
  12. Shen, J.; Chan, Y.C. Effects of ZrO2 nanoparticles on the mechanical properties of Sn–Zn solder joints on Au/Ni/Cu pads. J. Alloys Compd. 2009, 477, 552–559. [Google Scholar] [CrossRef]
  13. Lee, I.; Lee, Y.-W.; Valliappan, A.; Lee, T.-K. Crack propagation mechanism study on bismuth contained Sn base lead free solder under thermo-mechanical stress. In Proceedings of the SMTA International Conference, Rosemont, IL, USA, 14–18 October 2018. [Google Scholar]
  14. Son, J.Y.; Lee, S.G.; Park, J.W.; Lee, Y.W.; Jung, S.B. Modifying of tin based solder composition with optimized Bi, Ni and Cu contents for high TC and drop shock reliability. In Proceedings of the 24th Electronics Packaging Technology Conference, Singapore, 7–9 December 2022. [Google Scholar]
  15. Li, D.; Conway, P.P.; Liu, C. Corrosion characterization of tin–lead and lead free solders in 3.5 wt% NaCl solution. Corros. Sci. 2008, 50, 995–1004. [Google Scholar] [CrossRef]
  16. Nguyen, C.K.; Clark, B.N.; Stone, K.R.; Edwards, M.A. Acceleration of galvanic lead solder corrosion due to phosphate. Corros. Sci. 2011, 53, 1515–1521. [Google Scholar] [CrossRef]
  17. Cheng, C.Q.; Yang, F.; Zhao, J.; Wang, L.H.; Li, X.G. Leaching of heavy metal elements in solder alloys. Corros. Sci. 2011, 53, 1738–1747. [Google Scholar] [CrossRef]
  18. Hu, J.; Luo, T.; Hu, A.; Li, M.; Mao, D. Electrochemical corrosion behaviors of Sn-9Zn-3Bi-xCr solder in 3.5% NaCl solution. J. Electron. Mater. 2011, 40, 1556–1562. [Google Scholar] [CrossRef]
  19. Yan, X.; Liu, S.; Long, W.; Huang, J.; Zhang, L.; Chen, Y. The effect of homogenization treatment on microstructure and properties of ZnAl15 solder. Mater. Des. 2013, 45, 440–445. [Google Scholar] [CrossRef]
  20. Jumali, N.; Mohamad, A.A.; Mohd Nazeri, M.F. Corrosion properties of Sn-9Zn solder in acidic solution. Mater. Sci. Forum 2017, 888, 365–372. [Google Scholar] [CrossRef]
  21. Pu, C.; Li, C.; Dong, T.; Miao, Y.; Gao, P.; Zhang, X.; Peng, J.; Yi, J. Effect of Ag addition on the microstructure and corrosion properties of Sn–9Zn lead-free solder. J. Mater. Res. Technol. 2023, 27, 6400–6411. [Google Scholar] [CrossRef]
  22. Lopez, K.G.; Xiao, J.; Crokett, C.; Lytle, C.; Grubbs, H.; Edwards, M. Zinc orthophosphate can reduce nitrate-induced corrosion of lead solder. ACS EST Water 2024, 4, 3153–3162. [Google Scholar]
  23. Pu, C.; Li, C.; Miao, Y.; Lu, Q.; Peng, J.; Xu, Z.; Zhang, X.; Yi, J. Electrochemical corrosion behavior and corrosion mechanism of Sn-9Zn-xGe solder alloys in NaCl solution. Corros. Sci. 2024, 228, 111809. [Google Scholar] [CrossRef]
  24. Osório, W.R.; Spinelli, J.E.; Afonso, C.R.M.; Peixoto, L.C.; Garcia, A. Microstructure, corrosion behaviour and microhardness of a directionally solidified Sn–Cu solder alloy. Electrochim. Acta 2011, 56, 8891–8899. [Google Scholar] [CrossRef]
  25. Osório, W.R.; Freitas, E.S.; Spinelli, J.E.; Garcia, A. Electrochemical behavior of a lead-free Sn-Cu solder alloy in NaCl solution. Corros. Sci. 2014, 80, 71–81. [Google Scholar] [CrossRef]
  26. Huang, H.; Shuai, G.; Wei, X.; Yin, C. Effects of sulfur addition on the wettability and corrosion resistance of Sn-0.7Cu lead-free solder. Microelectron. Reliab. 2017, 74, 15–21. [Google Scholar] [CrossRef]
  27. Yang, W.; Du, Z.; Yu, S.; Li, Y.; Feng, J.; Wei, X.; Li, Q.; Zhan, Y. The effect of rare earths additions on the microstructure and the corrosion behavior of Sn-0.7Cu 0.075Al solder alloy. Materials 2019, 12, 3731. [Google Scholar] [CrossRef]
  28. Huang, H.; Lu, D.; Shuai, G.; Wei, X. Effects of phosphorus addition on the corrosion resistance of Sn-0.7Cu lead-free solder alloy. T. Indian. I. Metals 2016, 69, 1537–1543. [Google Scholar]
  29. Yan, Z.; Xian, A.P. Pitting corrosion behavior of Sn-0.7Cu lead free alloy in simulated marine atmospheric environment and the effect of trace Ga. Acta Metal. Sin. 2011, 47, 1327–1334. [Google Scholar]
  30. Yan, Z.; Xian, A.P. Corrosion of Ga-doped Sn-0.7Cu solder in simulated marine atmosphere. Metall. Mater. Trans. A 2012, 44, 1462–1474. [Google Scholar] [CrossRef]
  31. Freitas, E.S.; Osório, W.R.; Spinelli, J.E.; Garcia, A. Mechanical and corrosion resistances of a Sn-0.7wt%Cu lead-free solder alloy. Microelectron. Reliab. 2014, 54, 1392–1400. [Google Scholar] [CrossRef]
  32. Bui, Q.V.; Nam, N.D.; Noh, B.I.; Kar, A.; Kim, J.G.; Jung, S.B. Effect of Ag addition on the corrosion properties of Sn-based solder alloys. Mater. Corros. 2010, 61, 30–33. [Google Scholar] [CrossRef]
  33. Ameer, M.A.; Ghoneim, A.A.; Fekry, A.M. The electrochemical behavior of Sn-Ag binary alloys in sulfate solutions. Mater. Corros. 2010, 61, 580–589. [Google Scholar] [CrossRef]
  34. Ameer, M.A.; Fekry, A.M.; Ghoneim, A.A. Electrochemical behavior of Sn-Ag alloys in alkaline solutions. Corrosion 2009, 65, 589–594. [Google Scholar] [CrossRef]
  35. Wang, H.; Gao, Z.; Liu, Y.; Li, C.; Ma, Z.; Yu, L. Evaluation of cooling rate on electrochemical behavior of Sn-0.3Ag-0.9Zn solder alloy in 3.5wt% NaCl solution. J. Mater. Sci. Mater. Electron. 2014, 26, 11–22. [Google Scholar] [CrossRef]
  36. Osório, W.R.; Garcia, L.R.; Peixoto, L.C.; Garcia, A. Electrochemical behavior of a lead-free SnAg solder alloy affected by the microstructure array. Mater. Des. 2011, 32, 4763–4772. [Google Scholar] [CrossRef]
  37. Rosalbino, F.; Angelini, E.; Zanicchi, G.; Marazza, R. Corrosion behaviour assessment of lead-free Sn-Ag-M (M=In, Bi, Cu) solder alloys. Mater. Chem. Phys. 2008, 109, 386–391. [Google Scholar] [CrossRef]
  38. Vuong, B.X.; Vu, N.S.H.; Manh, T.D.; Vaka, M.; Du, D.X.; Nam, N.D. Role of cerium in microstructure and corrosion properties of Sn-1.0Ag solder alloys. Mater. Lett. 2018, 228, 309–313. [Google Scholar] [CrossRef]
  39. Wierzbicka-Miernik, A.; Guspiel, J.; Zabdyr, L. Corrosion behavior of lead-free SAC-type solder alloys in liquid media. Arch. Civ. Mech. Eng. 2015, 15, 206–213. [Google Scholar] [CrossRef]
  40. Qiao, C.; Wang, M.; Hao, L.; Liu, X.; Jiang, X.; An, X.; Li, D. Temperature and NaCl deposition dependent corrosion of SAC305 solder alloy in simulated marine atmosphere. J. Mater. Sci. Technol. 2021, 75, 252–264. [Google Scholar] [CrossRef]
  41. Curioni, M. The behaviour of magnesium during free corrosion and potentiodynamic polarization investigated by real-time hydrogen measurement and optical imaging. Electrochim. Acta 2014, 120, 284–292. [Google Scholar] [CrossRef]
  42. Brooks, E.; Tobias, M.; Krautsak, K.; Ehrensberger, M. The influence of cathodic polarization and simulated inflammation on titanium electrochemistry. J. Biomed. Mater. Res. B Appl. Biomater. 2014, 102, 1445–1453. [Google Scholar] [CrossRef]
  43. Bou-Saleh, Z.; Shahryari, A.; Omanovic, S. Enhancement of corrosion resistance of a biomedical grade 316LVM stainless steel by potentiodynamic cyclic polarization. Thin Solid Film. 2007, 515, 4727–4737. [Google Scholar] [CrossRef]
  44. Liu, Y.; Liu, Z.; Xu, A.; Liu, X. Understanding pitting corrosion behavior of AZ91 alloy and its MAO coating in 3.5% NaCl solution by cyclic potentiodynamic polarization. J. Magnes. Alloys 2022, 10, 1368–1380. [Google Scholar] [CrossRef]
  45. Zhao, T.; Liu, Z.; Du, C.; Sun, M.; Li, X. Effects of cathodic polarization on corrosion fatigue life of E690 steel in simulated seawater. Int. J. Fatigue 2018, 110, 105–114. [Google Scholar] [CrossRef]
  46. Ahmed, S.L.; Thamida, S.K.; Narasaiah, N. Novel optimization technique to determine polarization characteristics of a corroding metal. Electrochem. Energy Technol. 2017, 3, 1–8. [Google Scholar]
  47. Bellezze, T.; Giuliani, G.; Roventi, G. Study of stainless steels corrosion in a strong acid mixture. Part 1: Cyclic potentiodynamic polarization curves examined by means of an analytical method. Corros. Sci. 2018, 130, 113–125. [Google Scholar] [CrossRef]
  48. Saidman, S.B.; Bessone, J.B. Cathodic polarization characteristics and activation of aluminium in chloride solutions containing indium and zinc ions. J. Appl. Electrochem. 1997, 27, 731–737. [Google Scholar] [CrossRef]
  49. Li, M.; Luo, S.; Zeng, C.; Shen, J.; Lin, H.; Cao, C. Corrosion behavior of TiN coated type 316 stainless steel in simulated PEMFC environments. Corros. Sci. 2004, 46, 1369–1380. [Google Scholar] [CrossRef]
  50. Liu, X.; MacDonald, D.D.; Wang, M.; Xu, Y. Effect of dissolved oxygen, temperature, and pH on polarization behavior of carbon steel in simulated concrete pore solution. Electrochim. Acta 2021, 366, 137437. [Google Scholar] [CrossRef]
  51. Ramón, J.E.; Martínez, I.; Gandía-Romero, J.M.; Soto, J. Improved Tafel-based potentiostatic approach for corrosion rate monitoring of reinforcing steel. J. Nondestruct. Eval. 2022, 41, 70. [Google Scholar] [CrossRef]
  52. Cui, S.; Zhai, H.; Tong, W.; Li, W.; Li, X.; Fan, X.; Xiong, D. Passivation behavior and surface chemistry of Fe-based amorphous coating in NaCl solution: Influence of applied potential and immersion time. Intermetallics 2024, 172, 108391. [Google Scholar] [CrossRef]
  53. Siddiqui, M.A.; Ren, L.; Macdonald, D.D.; Yang, K. Effect of Cu on the passivity of Ti–xCu (x = 0, 3 and 5 wt%) alloy in phosphate-buffered saline solution within the framework of PDM-II. Electrochim. Acta 2021, 386, 138466. [Google Scholar] [CrossRef]
  54. Pandey, A.K.; Gautam, R.K.; Behera, C.K. Corrosion and wear behavior of Ti–5Cu-xNb biomedical alloy in simulated body fluid for dental implant applications. J. Mech. Behav. Biomed. Mater. 2023, 137, 105533. [Google Scholar] [CrossRef]
  55. Mathew, Z.P.; Shamnamol, G.K.; Greeshma, K.P.; John, S. Insight on the corrosion inhibition of nanocomposite chitosan/boron nitride integrated epoxy coating system against mild steel. Corros. Commun. 2023, 9, 36–43. [Google Scholar] [CrossRef]
  56. Wan, T.; Chu, K.; Fang, J.; Zhong, C.; Zhang, Y.; Ge, X.; Ding, Y.; Ren, F. A high strength, wear and corrosion-resistant, antibacterial and biocompatible Nb-5 at.% Ag alloy for dental and orthopedic implants. J. Mater. Sci. Technol. 2021, 80, 266–278. [Google Scholar] [CrossRef]
  57. Hussein, M.A.; Ogunlakin, N.O.; Kumar, A.M.; Sorour, A.A.; Azeem, M.A. Electrochemical and wear properties of biomedical Ti–Nb–Ag alloy. J. Mater. Res. Technol. 2024, 33, 5744–5754. [Google Scholar] [CrossRef]
  58. Peng, Z.; Ding, D.; Zhang, W.; Gao, Y.; Chen, G.; Xie, Y.; Liao, Y. Tensile property and corrosion performance of Ag microalloying of Al-Cu alloys for positive electrode current collectors of Li-ion batteries. Materials 2022, 15, 5126. [Google Scholar] [CrossRef]
  59. Lee, H.-M.; Moon, J.T.; Lee, Y.-W.; Kim, H.J.; Lee, S.G.; Lee, J.-H. Solidification behavior and mechanical properties of Sn-2.5Ag-0.8Cu-0.05Ni-1Bi and Sn-0.75Cu-0.065Ni-1.5Bi solder alloys, and microstructures in joints formed using them. Korean J. Met. Mater. 2024, 62, 511–523. [Google Scholar] [CrossRef]
  60. Chantaramanee, S.; Sungkhaphaitoon, P. Combined effects of Bi and Sb elements on microstructure, thermal and mechanical properties of Sn-0.7 Ag-0.5 Cu solder alloys. Trans. Nonferrous Met. Soc. China 2022, 32, 3301–3311. [Google Scholar] [CrossRef]
  61. Bhavan, J.S.; Pazhani, A.; Unnikrishnan, T.G. EBSD characterization of Ag3Sn phase transformation in Sn–Ag lead-free solder alloys: A comparative study before and after heat treatment. J. Mater. Sci. Mater. Electron. 2024, 35, 1577. [Google Scholar] [CrossRef]
  62. Mousa, M.M.; El-Rehim, A.F.A.; Abdelaziz, S.M. Influence of Cr inclusion on the microstructural evolutions and tensile properties of Sn-5 wt% Sb solder alloy. J. Mater. Sci. Mater. Electron. 2024, 35, 1888. [Google Scholar] [CrossRef]
  63. Wu, X.; Hou, Z.; Xie, X.; Lin, P.; Huo, Y.; Wang, Y.; Zhao, X. Mechanical properties and microstructure evolution of Sn–Bi-based solder joints by microalloying regulation mechanism. J. Mater. Res. Technol. 2024, 31, 3226–3237. [Google Scholar] [CrossRef]
Figure 1. (a) Experimental setup for potentiodynamic polarization test using three-electrode system with solder plate as working electrode; (b) simplified schematic illustration of three-electrode configuration.
Metals 15 00670 g001
Figure 2. Potentiodynamic polarization curves of four solder compositions.
Metals 15 00670 g002
Figure 3. Cu Tafel extrapolation of potentiodynamic polarization curves for four solder compositions. Ecorr and Icorr were determined for each composition, which highlighted differences in corrosion resistance.
Metals 15 00670 g003
Figure 4. Optical microscopy images of (a,b) SAC305, (c,d) SAC1205N, (e,f) SABC25108N, and (g,h) SBC15075N solder plates after corrosion testing for (a,c,e,g) 900 and (b,d,f,h) 3500 s.
Metals 15 00670 g004
Figure 5. Comparison of β-Sn phase corrosion consumption among different solder alloys.
Metals 15 00670 g005
Figure 6. (a) XRD patterns of solder plates after corrosion test for 900 s; (b) magnified XRD patterns in 2θ range of 36–41° highlighting Ag3Sn peaks.
Metals 15 00670 g006
Figure 7. (a) XRD patterns of solder plates after corrosion test for 1500 s; (b) magnified XRD patterns in 2θ range of 43–47° highlighting β-Sn peaks.
Metals 15 00670 g007
Figure 8. XRD patterns of solder plates after corrosion test for 3500 s, with Sn3O(OH)2Cl2 formation and β-Sn consumption shown.
Metals 15 00670 g008
Figure 9. Surface SEM images of SAC305, SAC1205N, SABC25108N, and SBC15075N solder plates after corrosion test for 900 s, 1500 s, and 3500 s.
Metals 15 00670 g009
Figure 10. Schematic representation of the time-dependent corrosion behavior of the solder samples in a NaCl aqueous solution.
Metals 15 00670 g010
Table 1. The chemical compositions of the alloy studied.
CompositionAbbreviation
Sn-3.0(wt%)Ag-0.5CuSAC305
Sn-1.2Ag-0.5Cu-0.05NiSAC1205N
Sn-2.5Ag-1.0Bi-0.8Cu-0.05NiSABC25108N
Sn-1.5Bi-0.75Cu-0.065NiSBC15075N
Table 2. Experimental conditions for potentiodynamic polarization testing, including parameters such as electrolyte composition, scan rate, and potential range.
Reference ElectrodeCounter
Electrode
Temp.
(°C)
SolutionOCP
Measurement
Potential
Scan Range
Scan Rate
(mV/min)
SCEPt mesh25 (±1)3.5 wt%
NaCl
600 s
(OCP vs. SCE)
−0.75 V
(vs. OCP)~
+1.5 V
(vs. R.E.)
30
Table 3. Representative results extracted from the potentiodynamic polarization tests for each solder alloy.
ElectrolyteSampleEcorr
(mV)
Icorr
(×10−9 A/cm2)
Corrosion Rate
(mm/yr)
3.5 wt%
NaCl solution
SAC305−5651200.114
SAC1205N−7051840.175
SABC25108N−59437.90.036
SBC15075N−4222960.281
Disclaimer/Publisher’s Note: The statements, opinions and data contained in all publications are solely those of the individual author(s) and contributor(s) and not of MDPI and/or the editor(s). MDPI and/or the editor(s) disclaim responsibility for any injury to people or property resulting from any ideas, methods, instructions or products referred to in the content.

