
Influence of Microstructure and Texture on Tensile Properties of an As-Rolled Ti2AlNb-Based Alloy


Abstract
1. Introduction
2. Materials and Methods
2.1. Materials
2.2. Methods
3. Results
3.1. Microstructure of the Rolled Sheet and Its Evolution During Heat Treatment
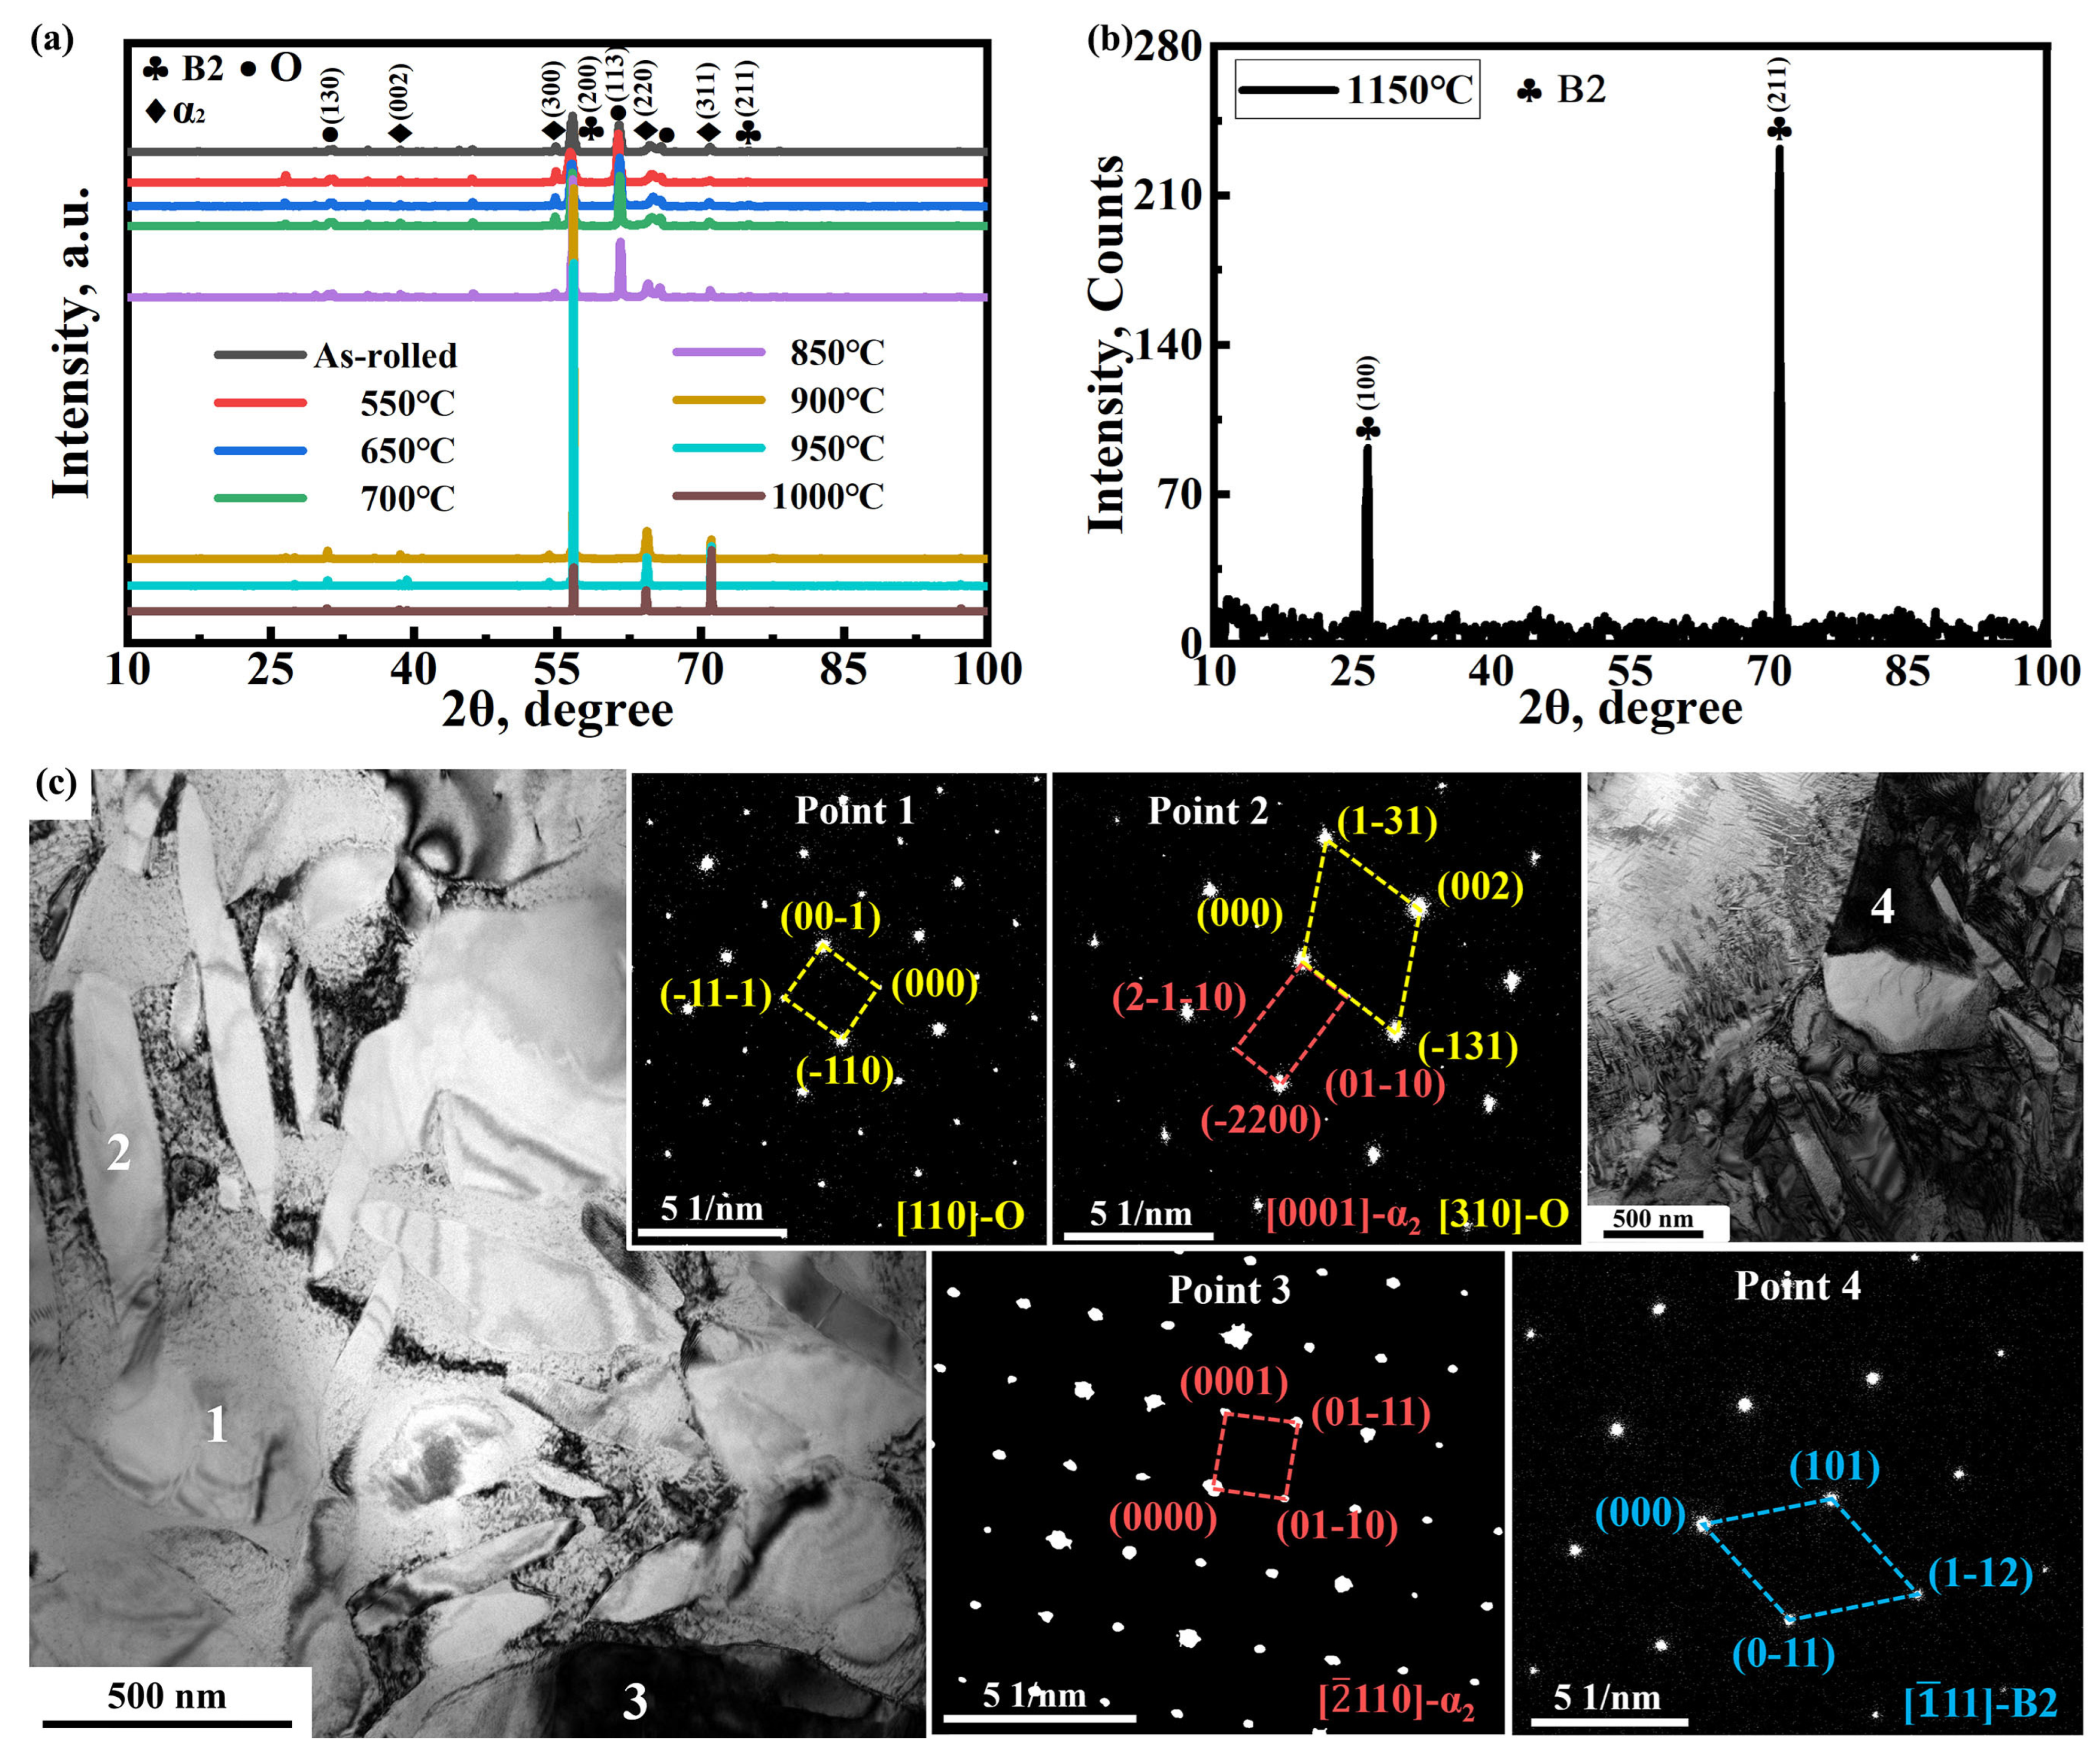
3.1.1. XRD and TEM
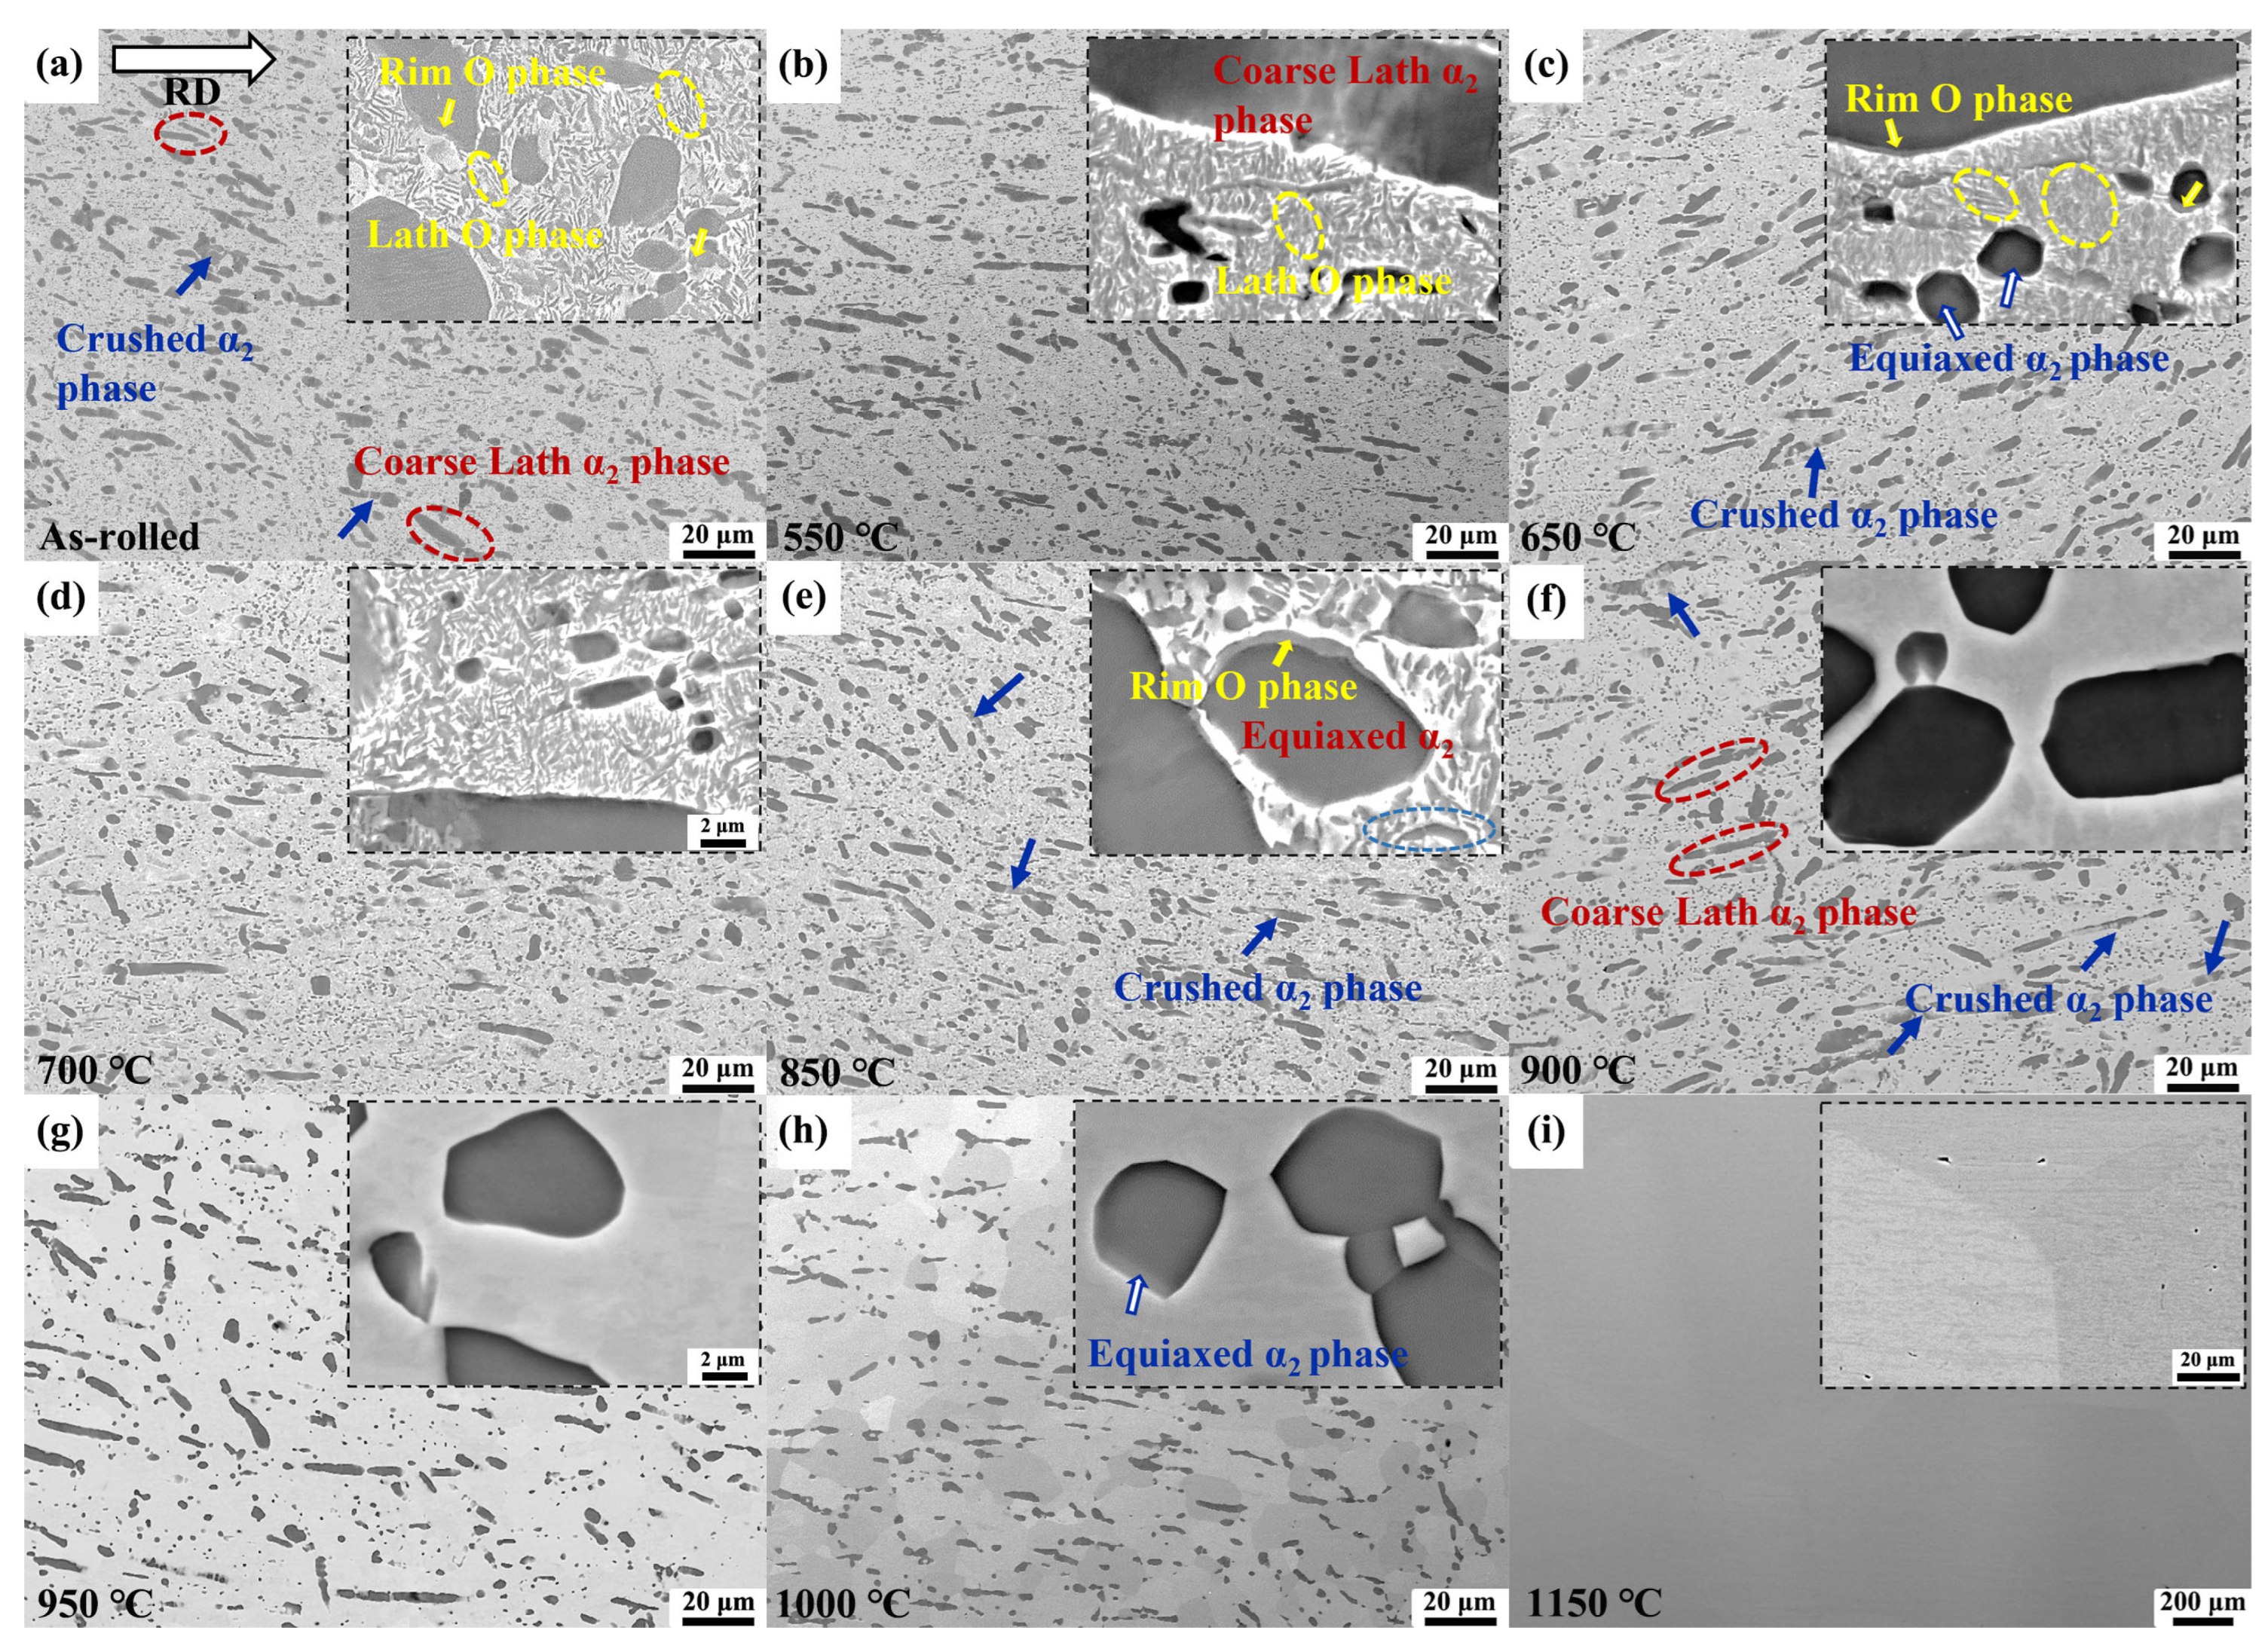
3.1.2. SEM
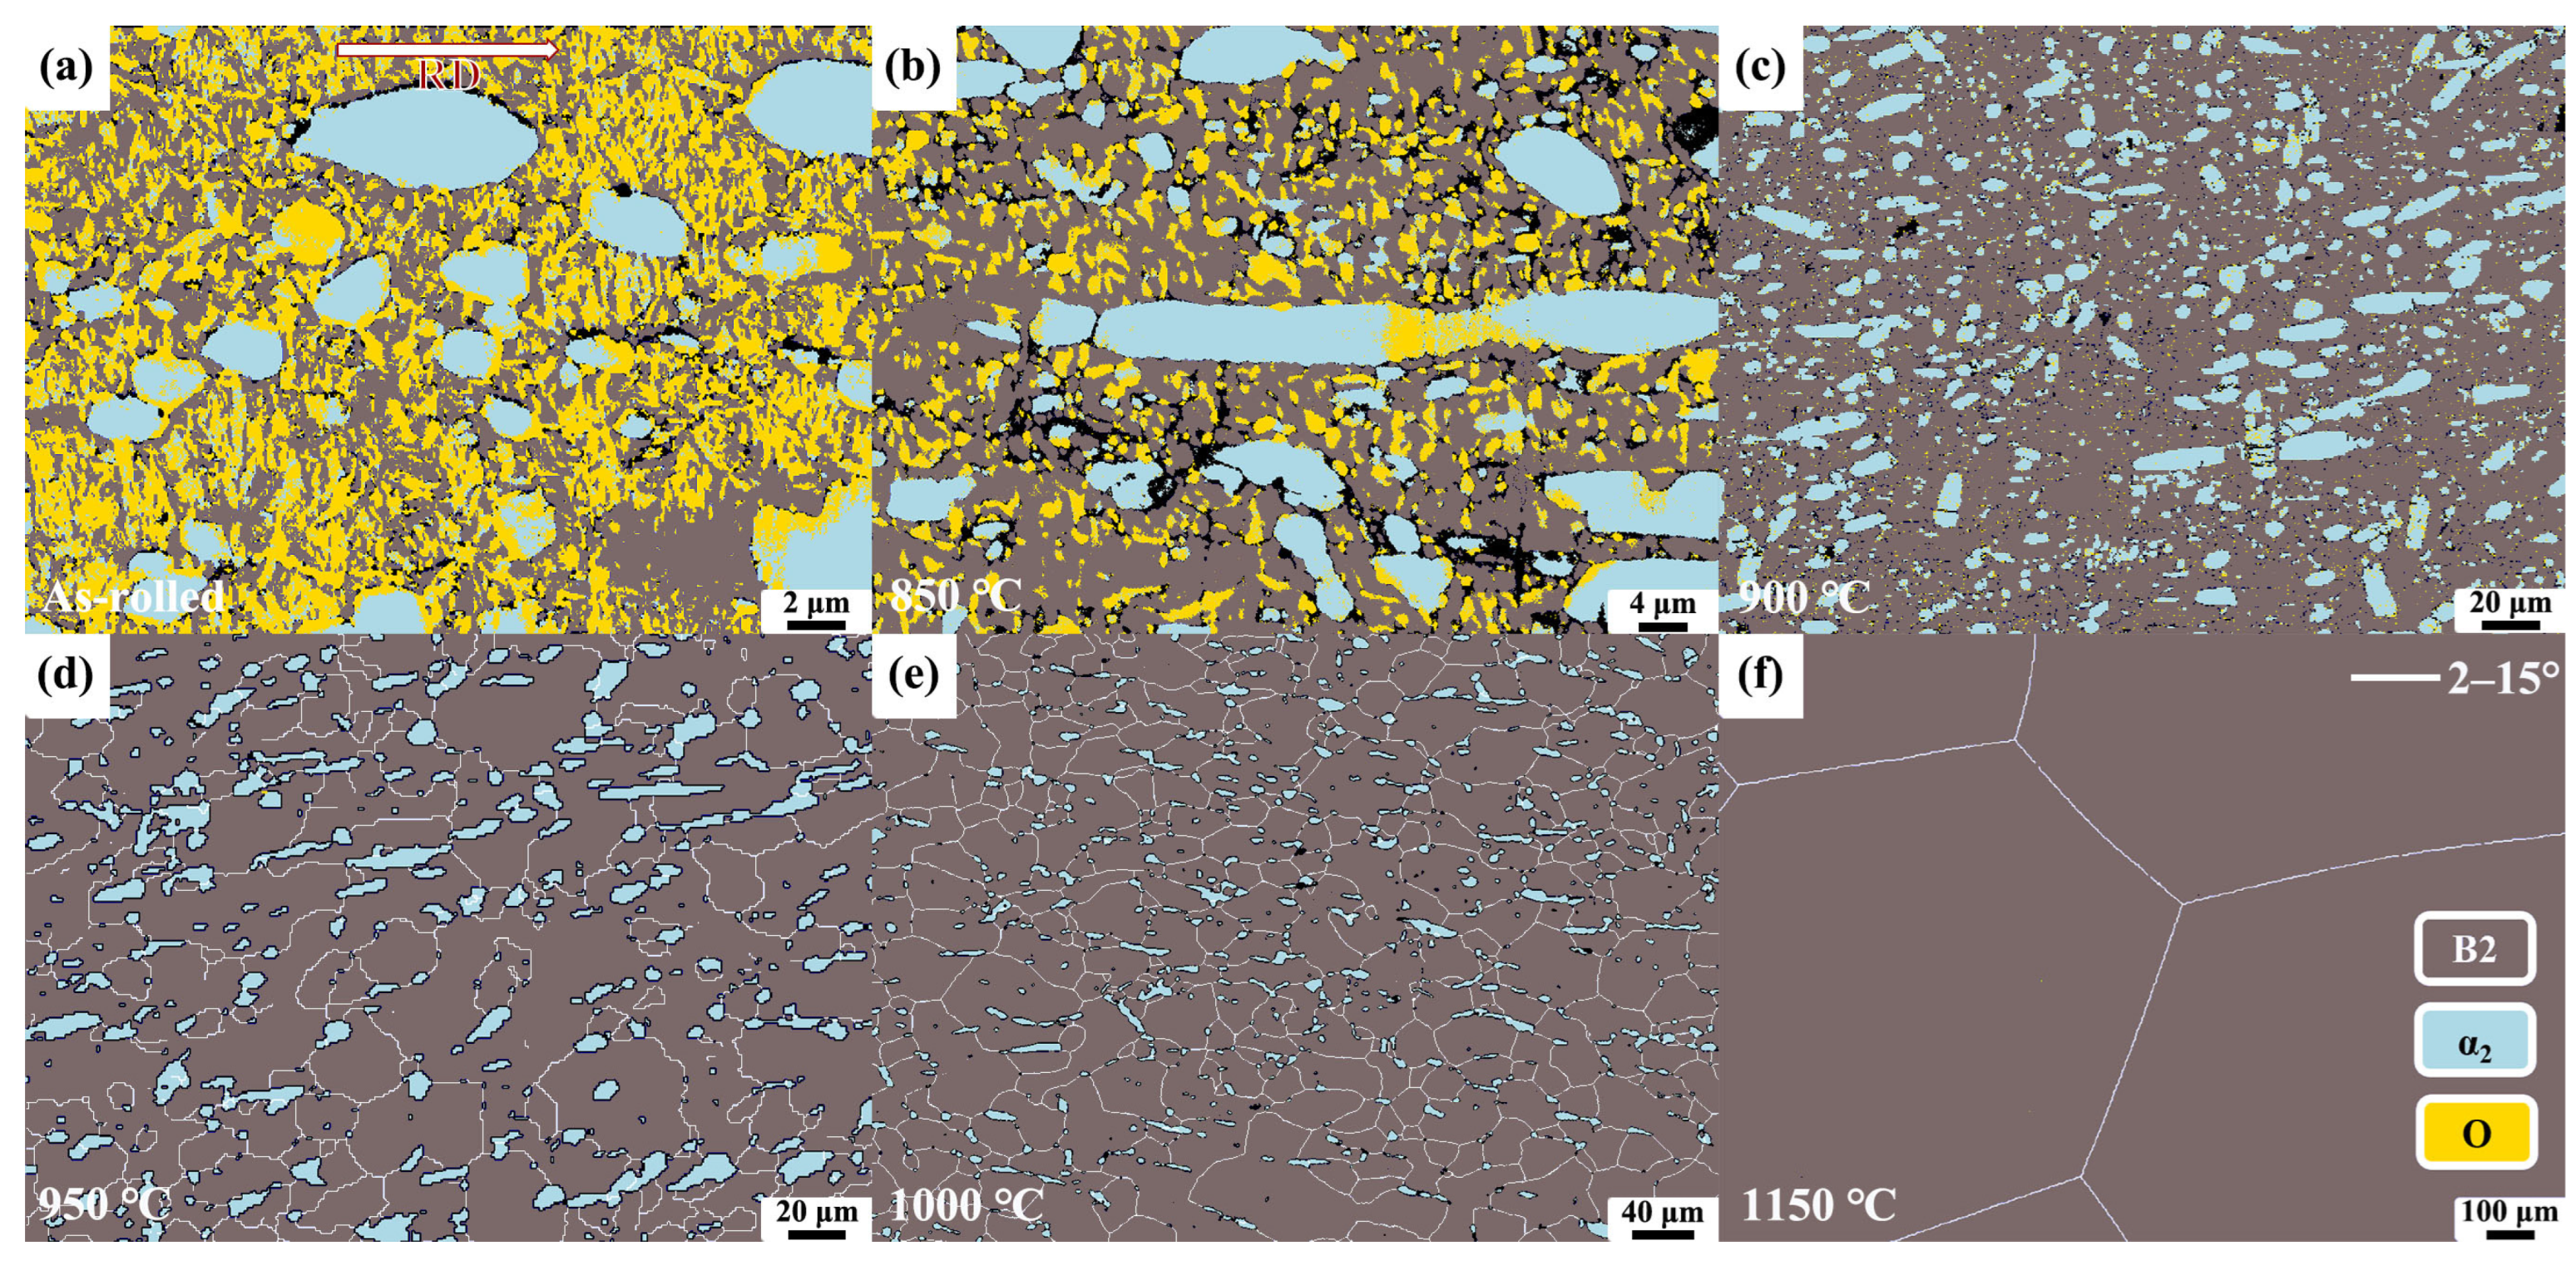
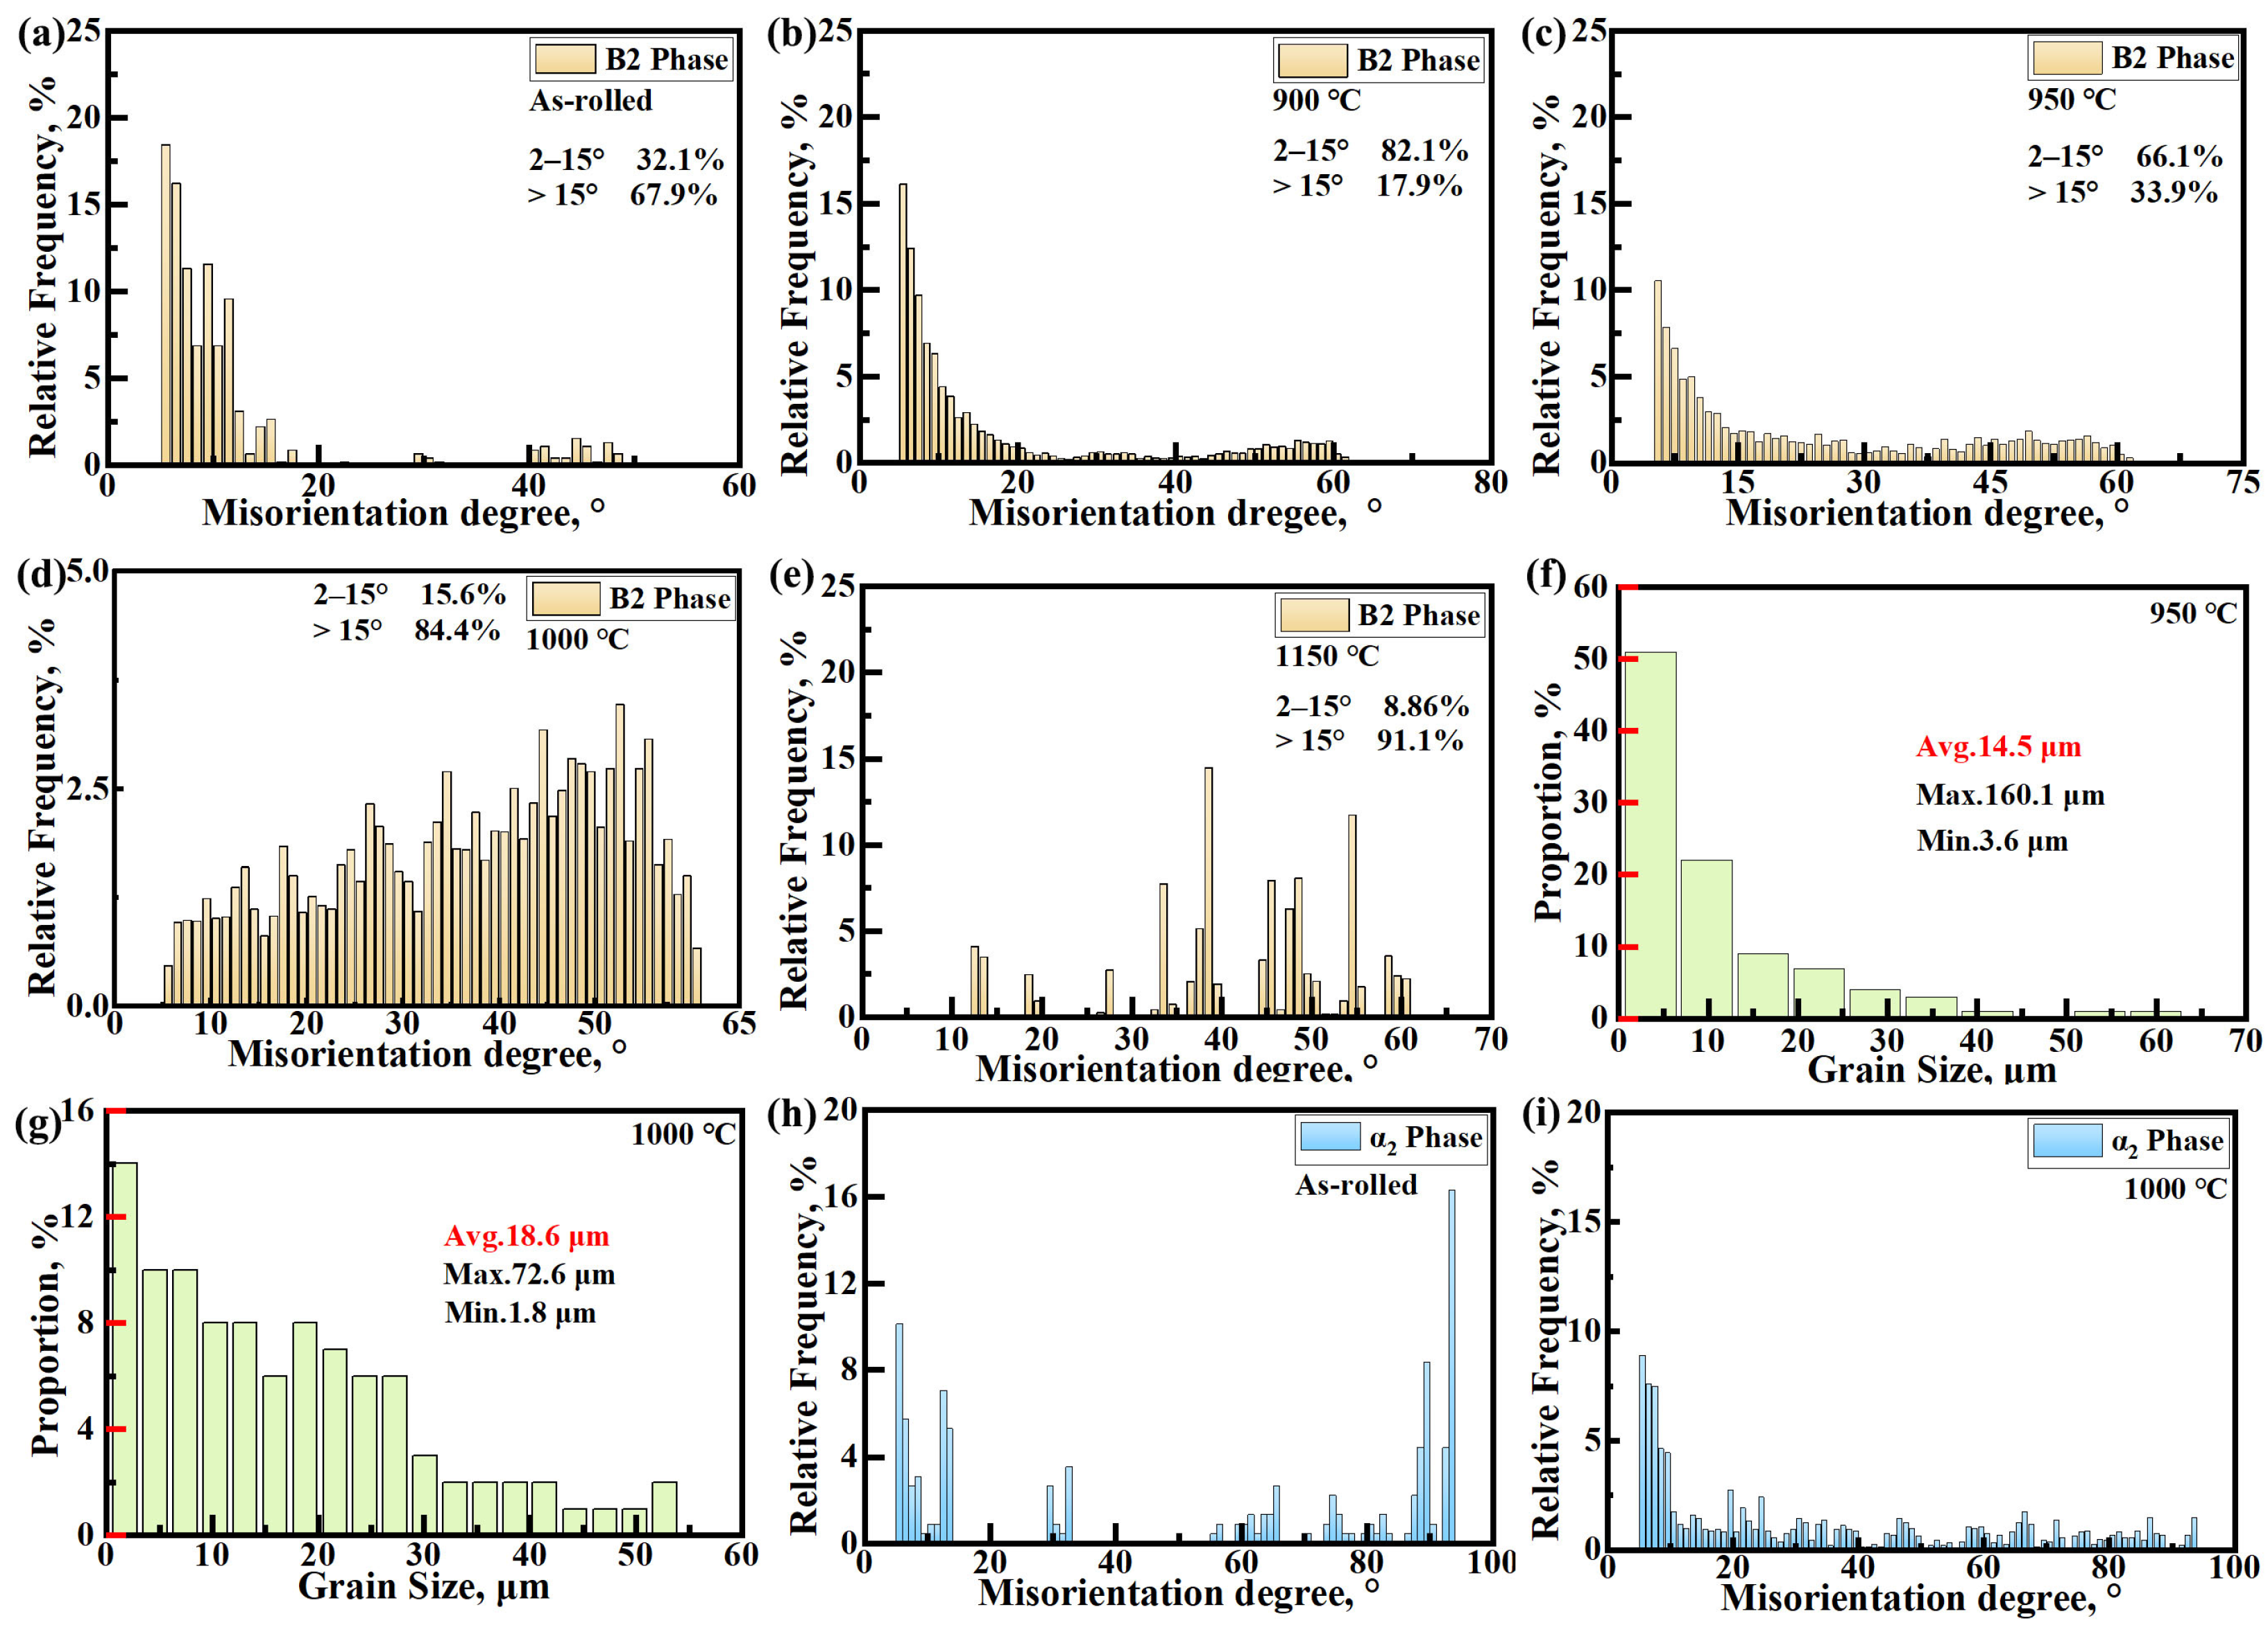
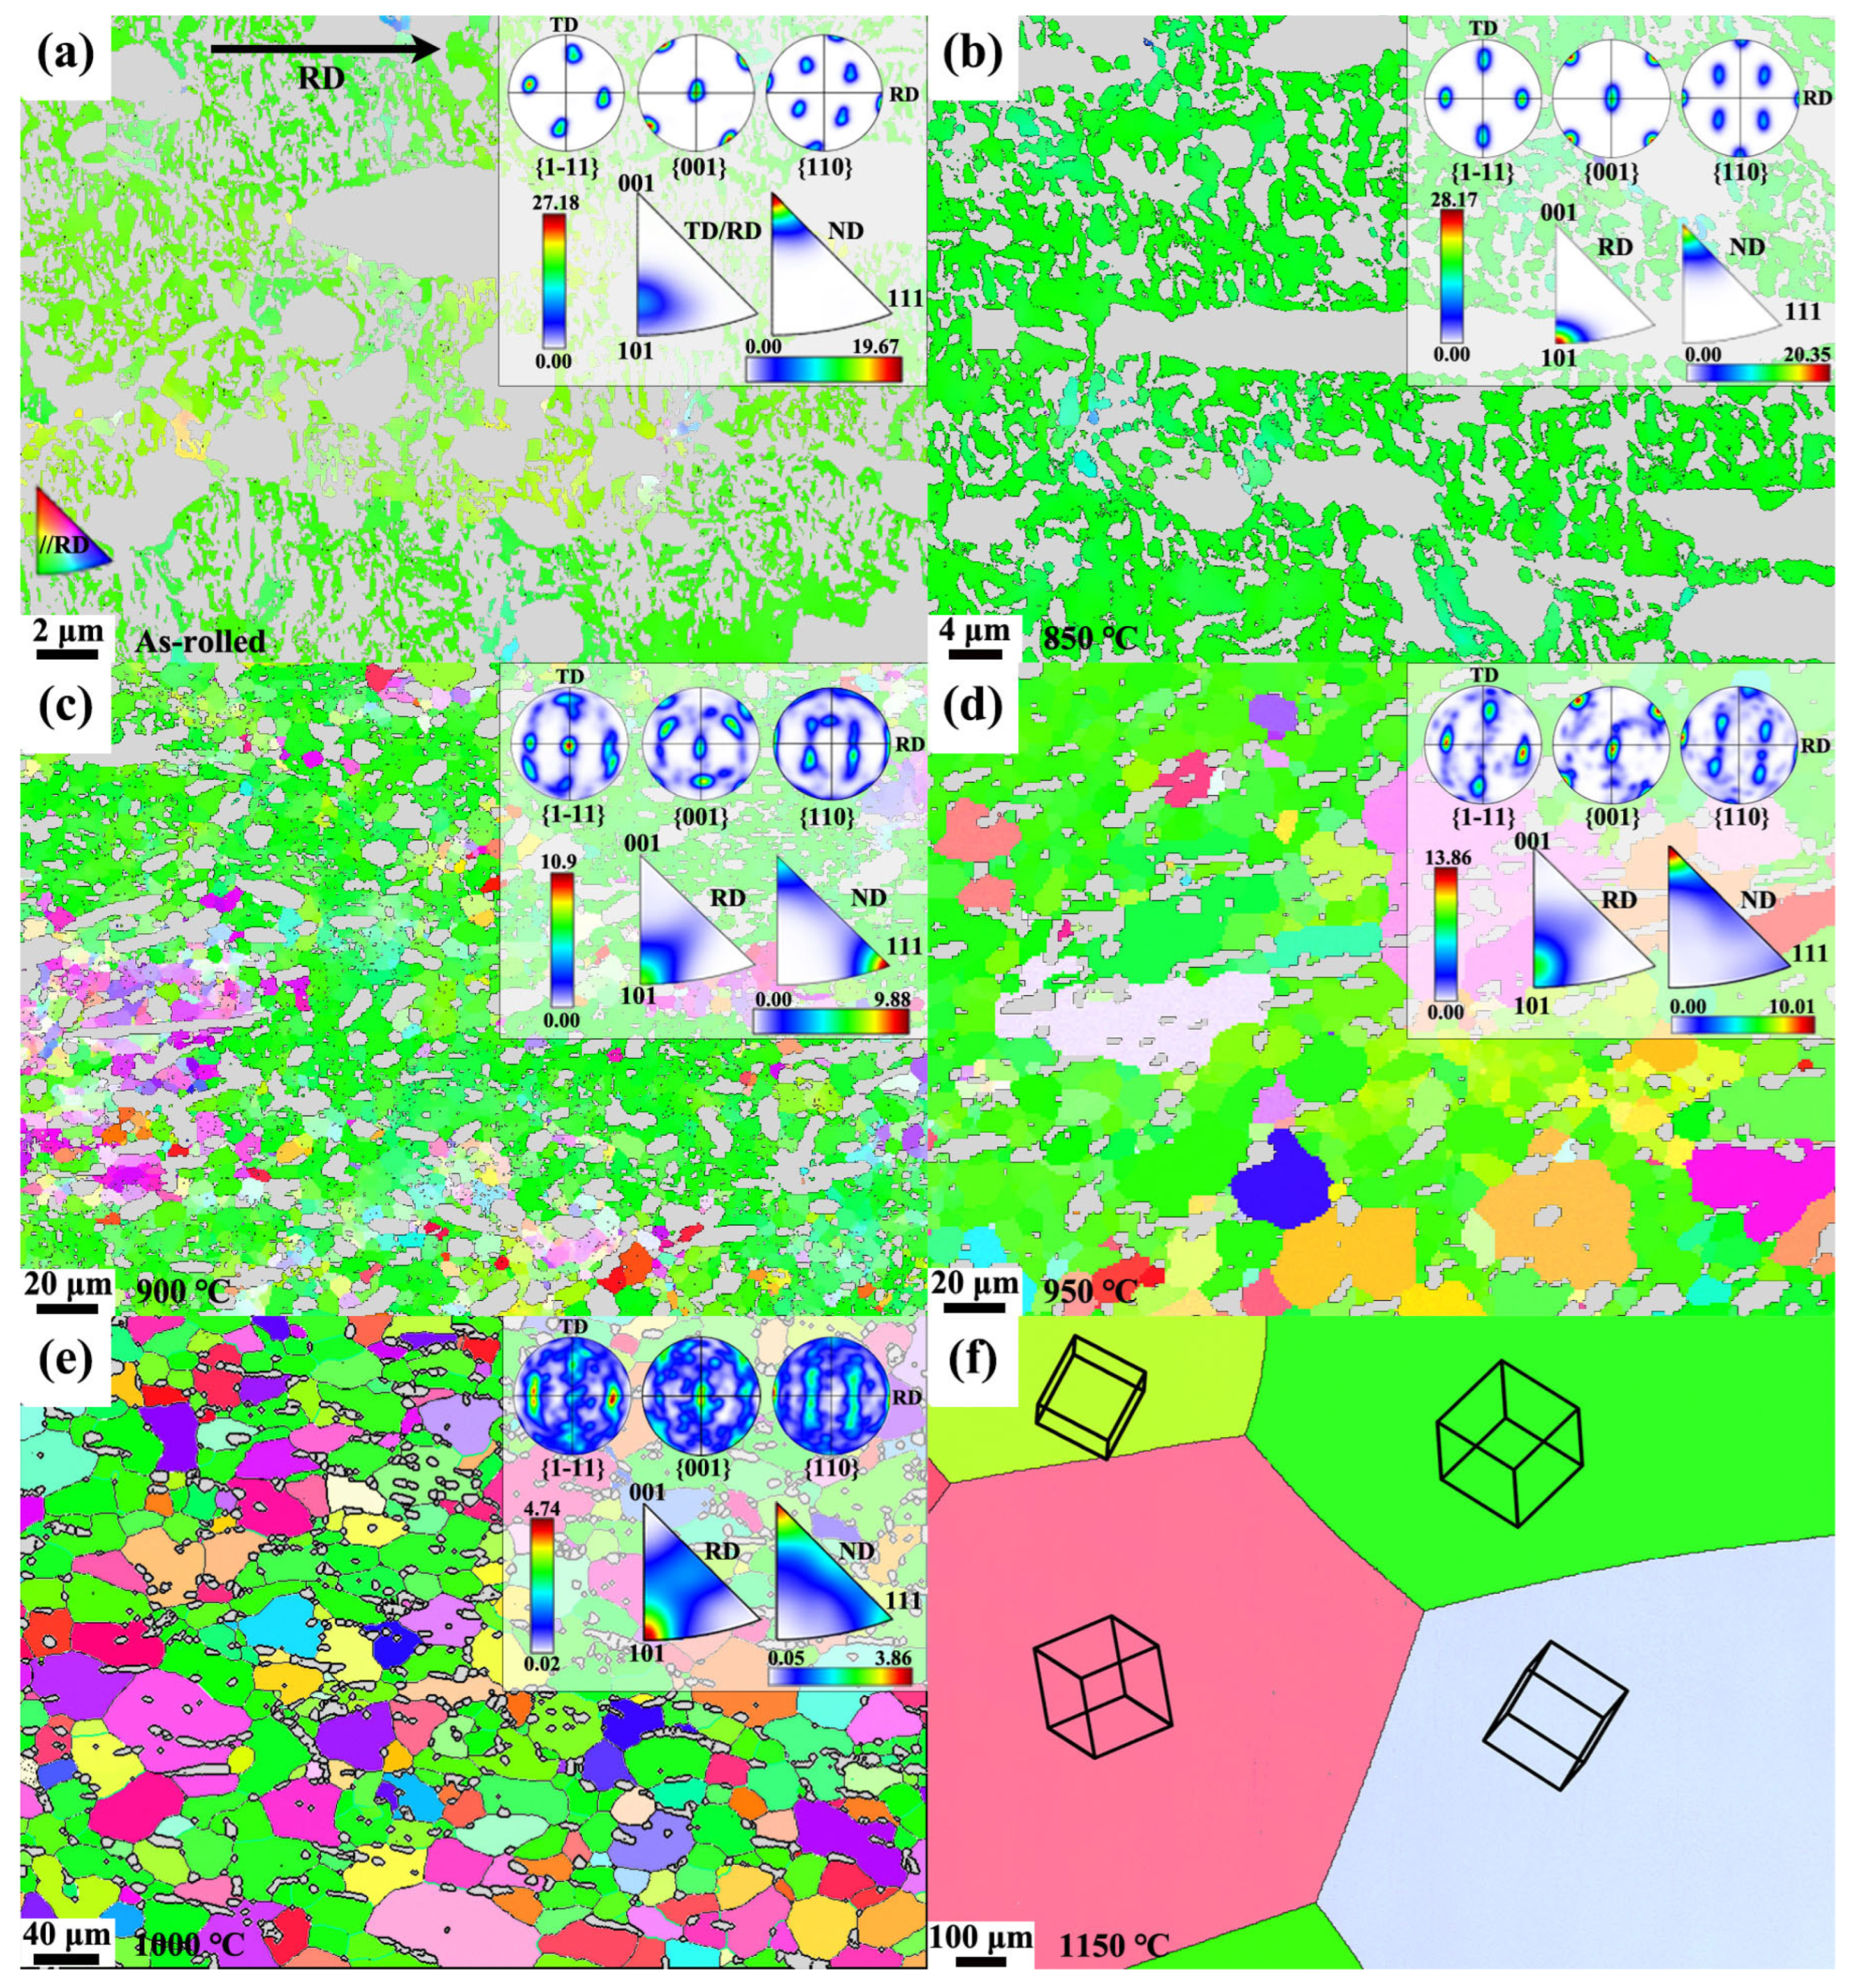
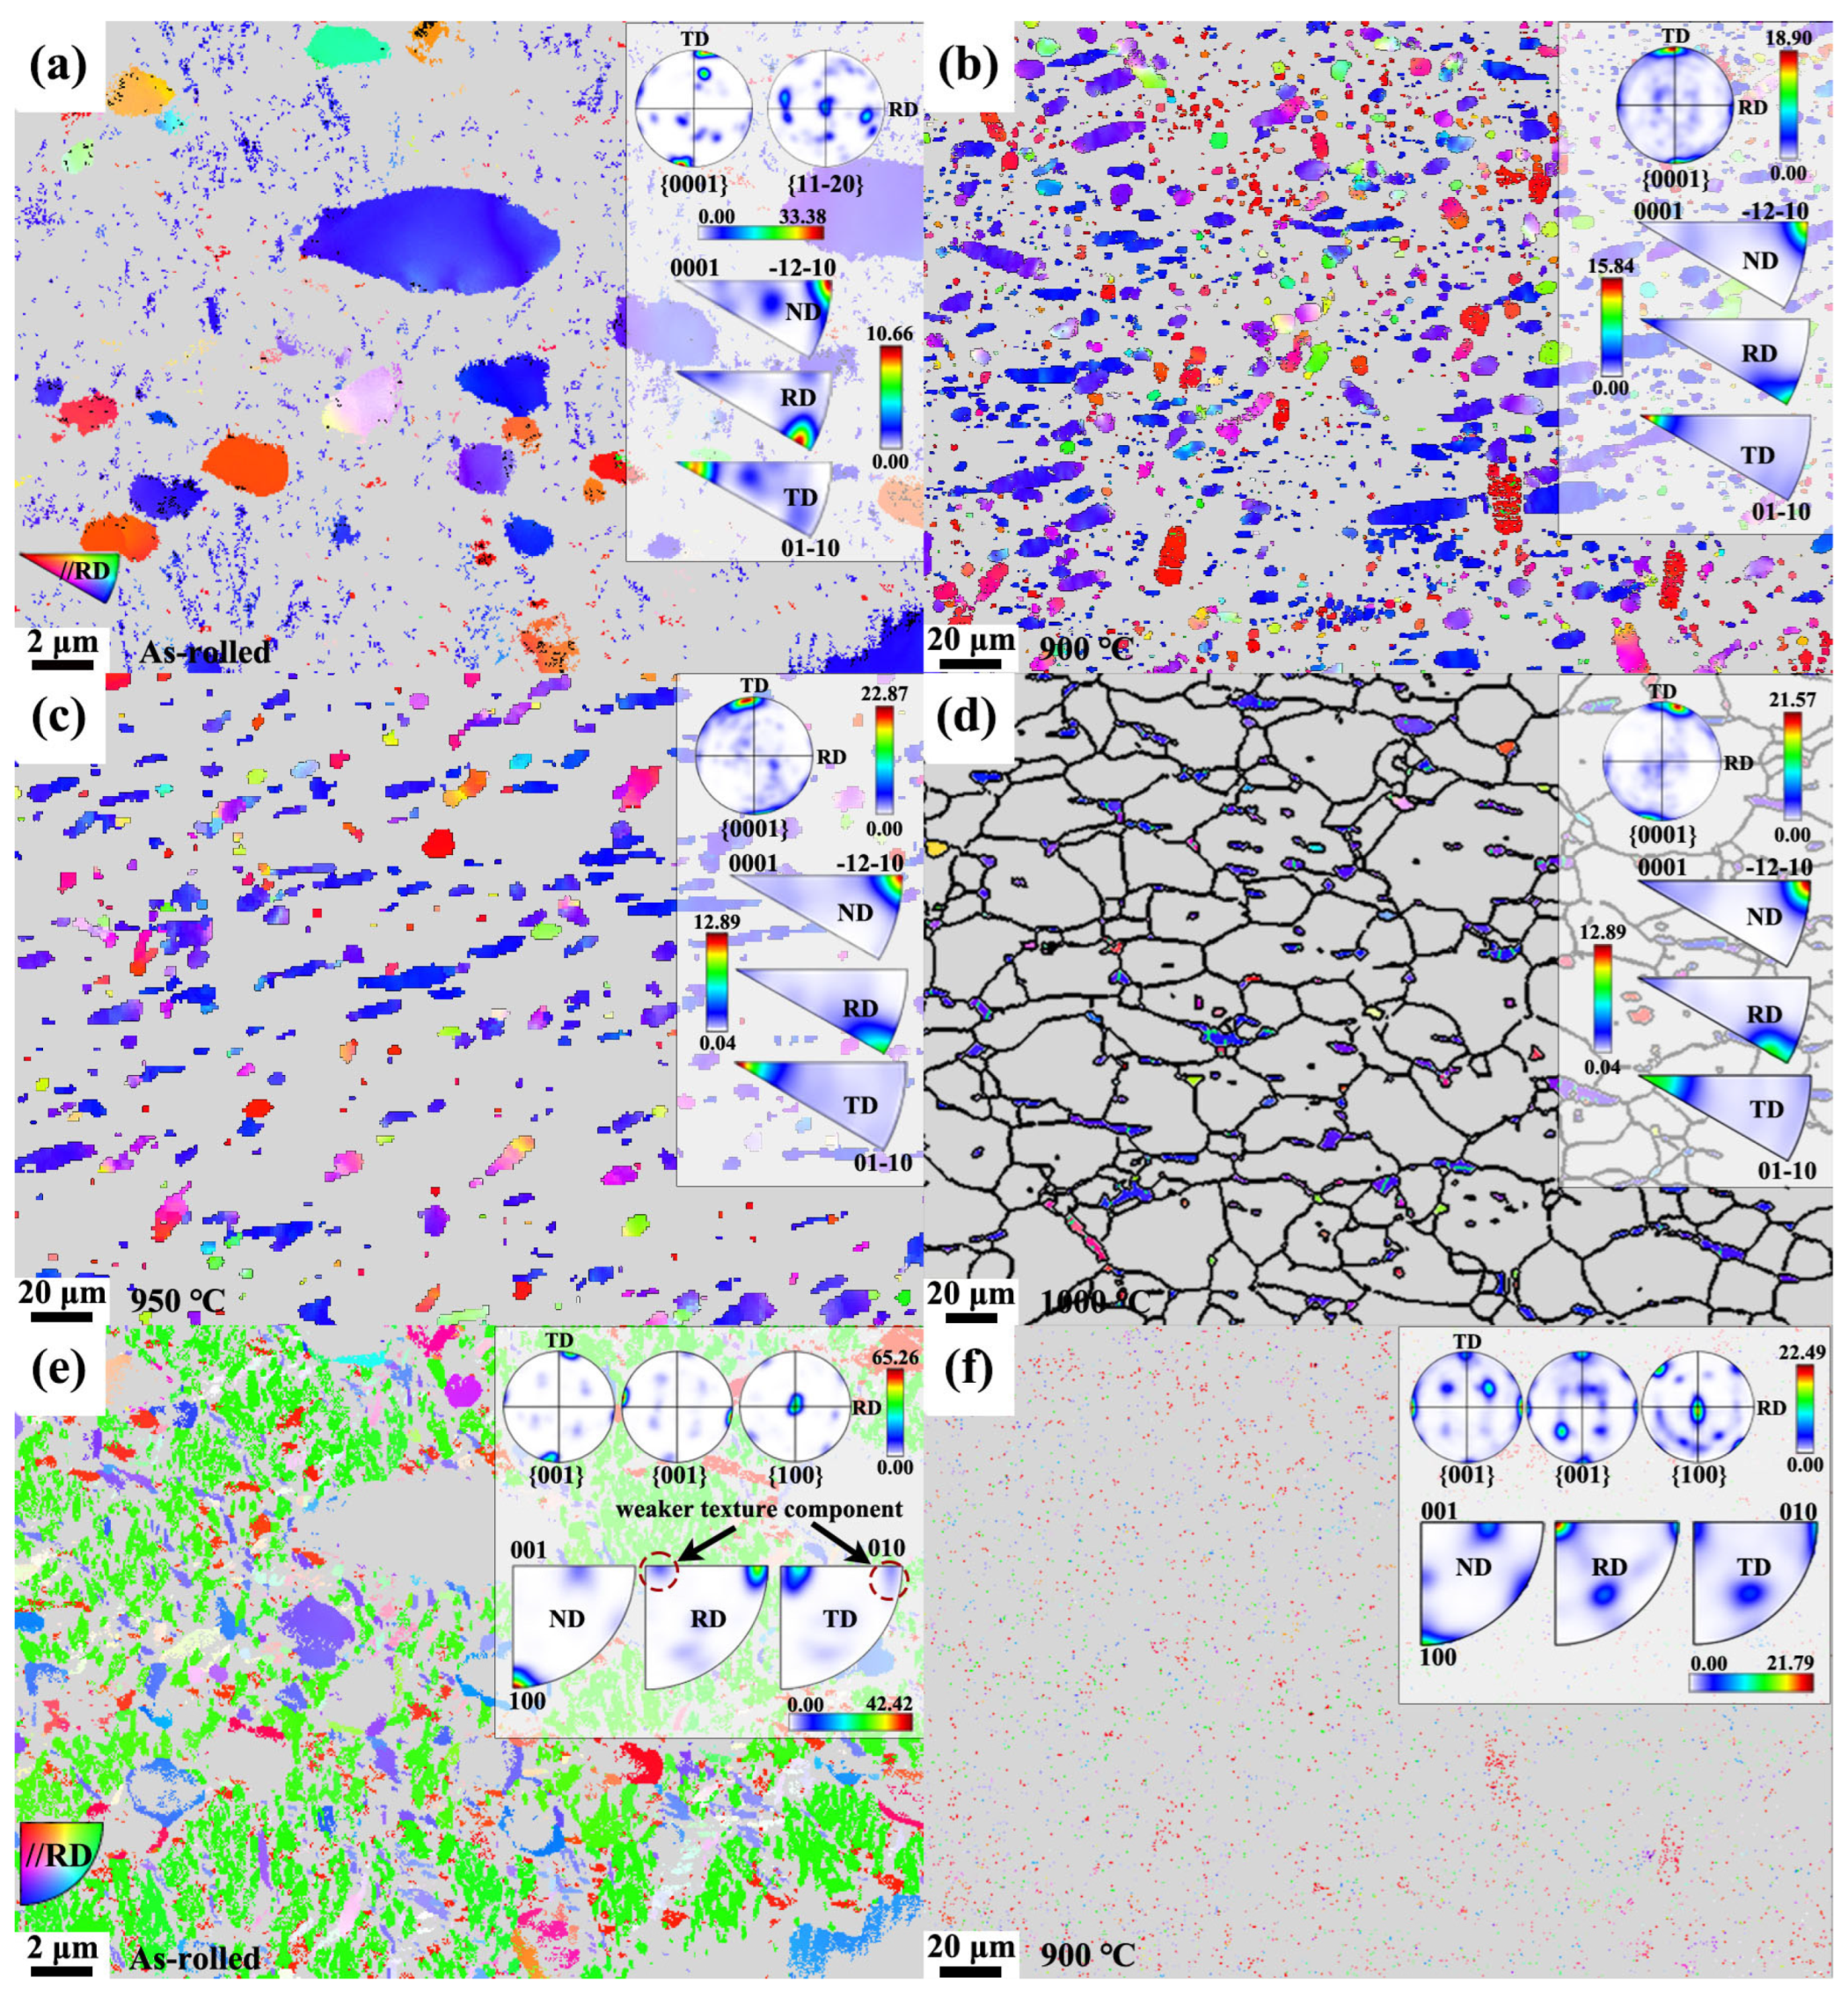
3.1.3. EBSD
3.2. Texture of the B2, O, and α2 Phases
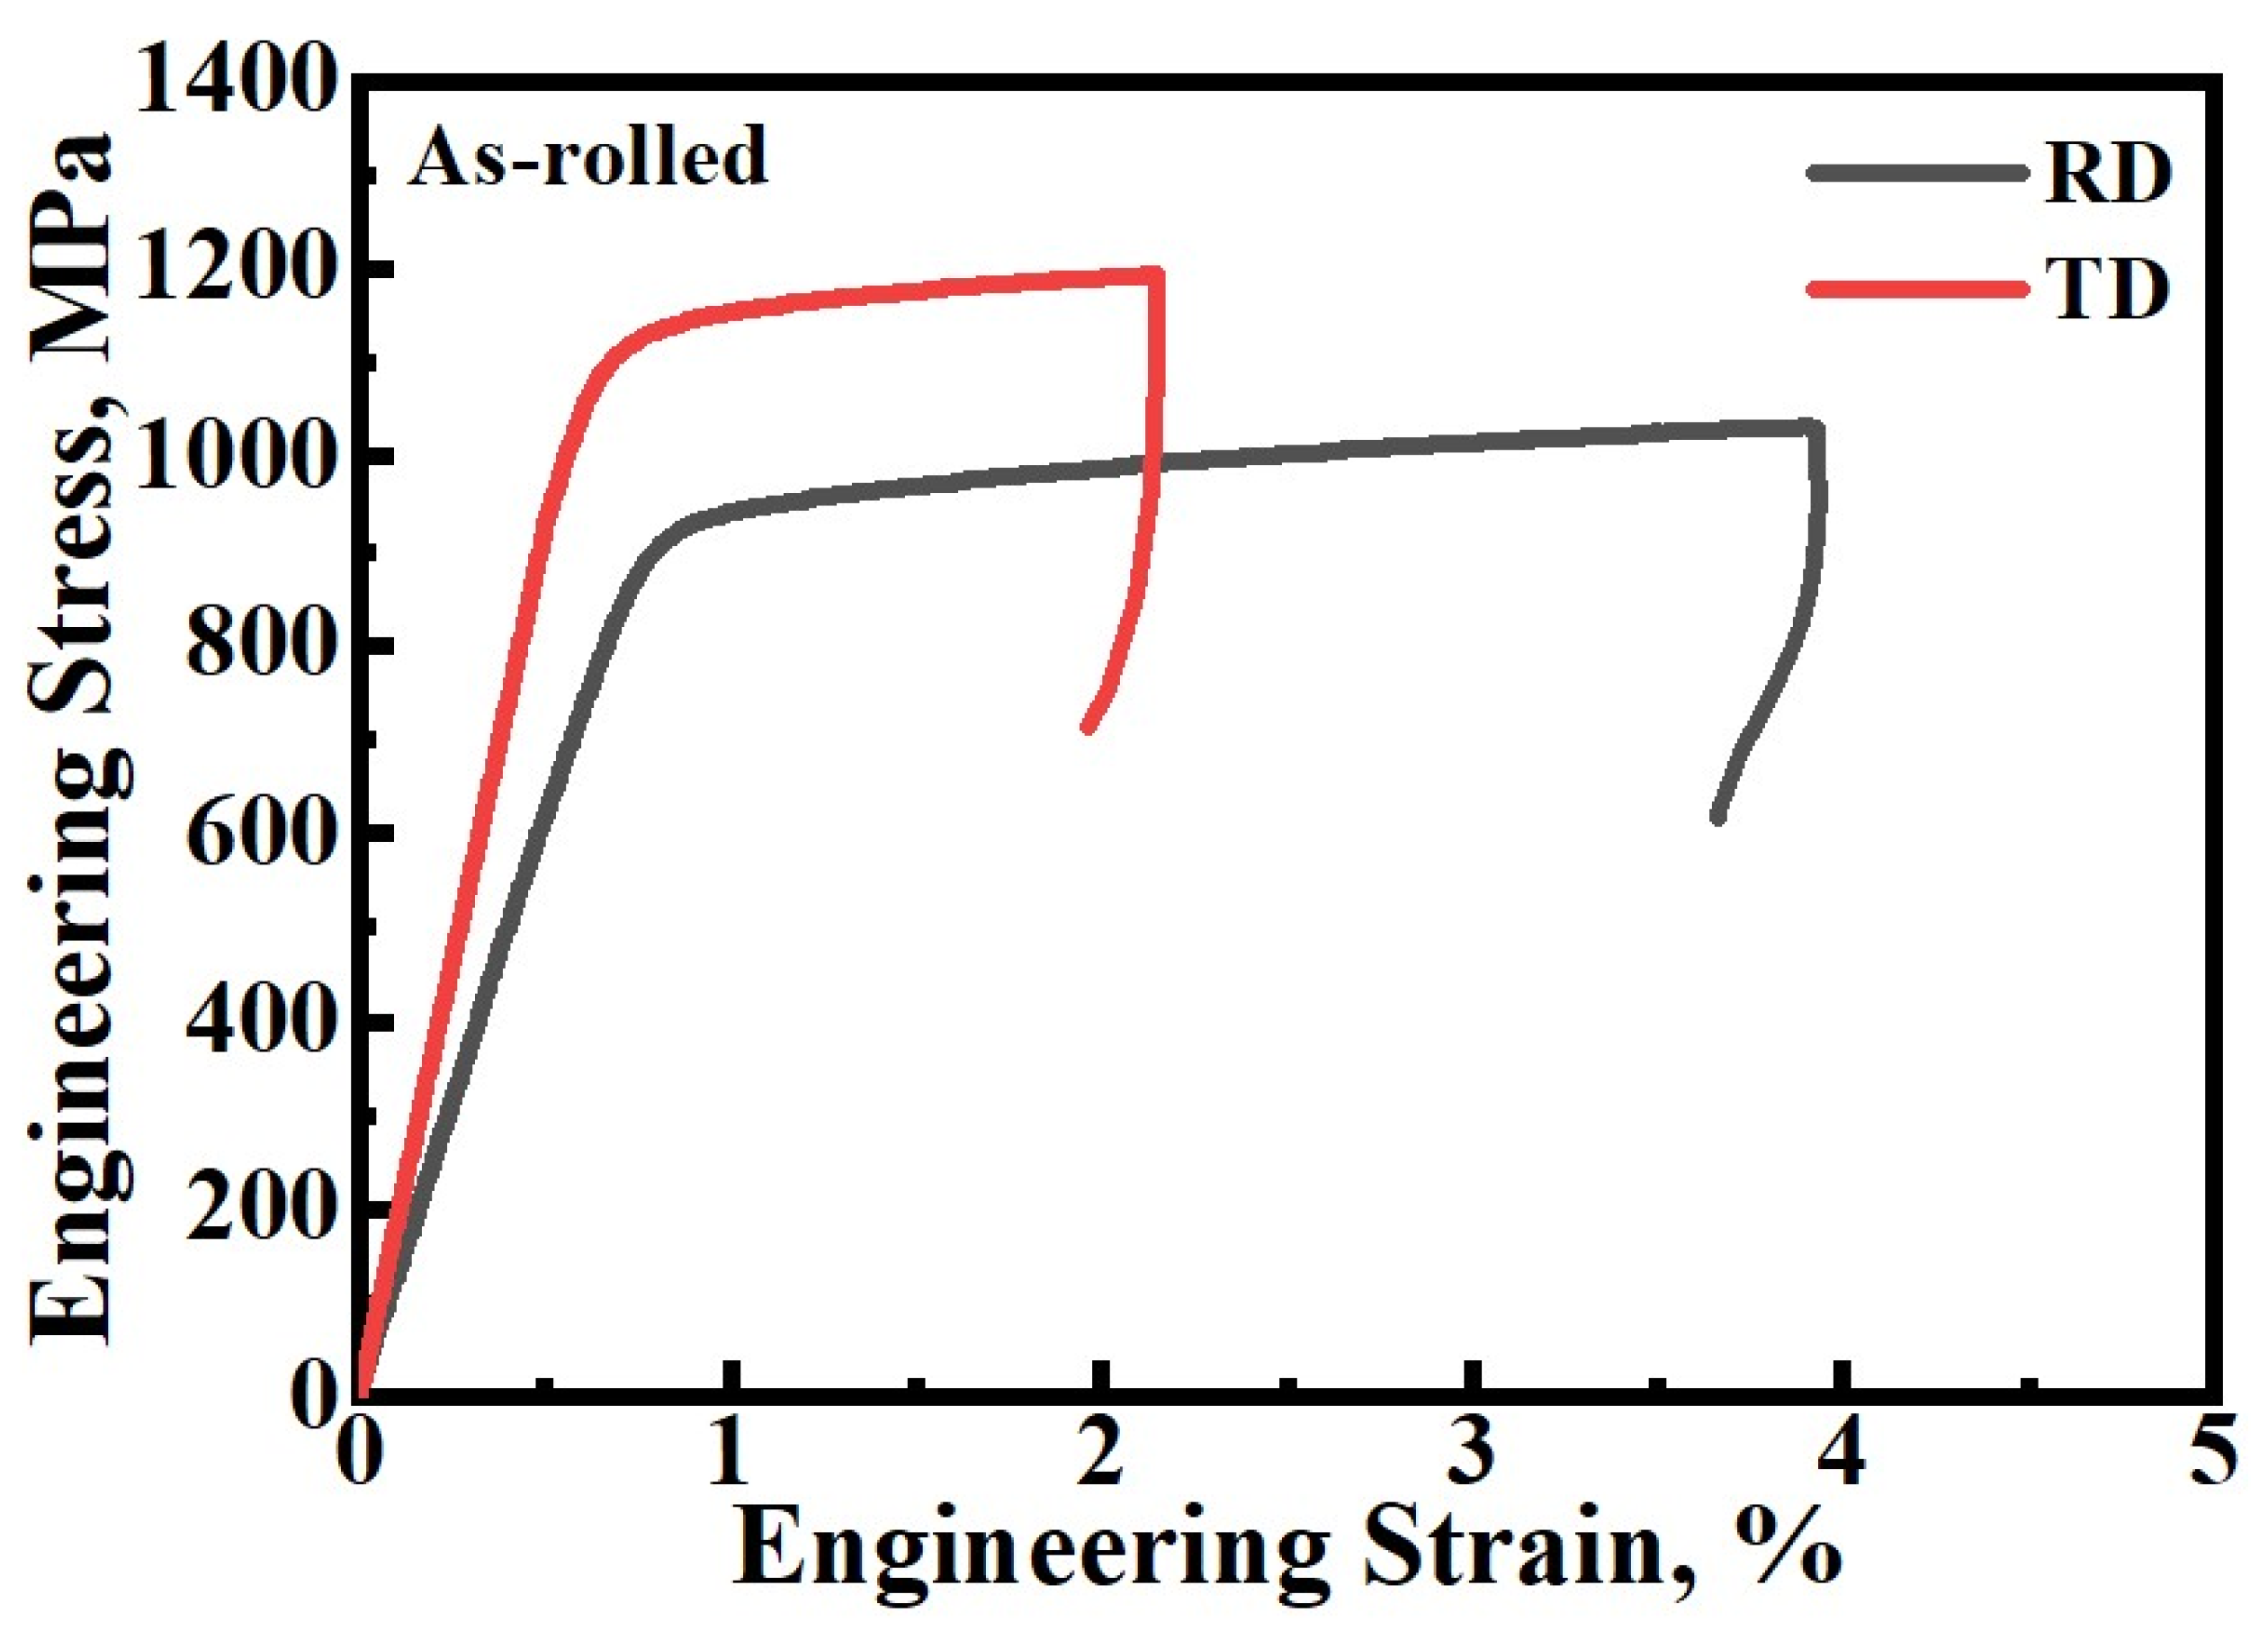
3.3. Tensile Properties
4. Discussion
4.1. Spheroidization of the α2 Phase and Coarsening of the O Phase
4.2. Formation Mechanism of Texture
4.3. Relationship Between Texture and Tensile Properties
5. Conclusions
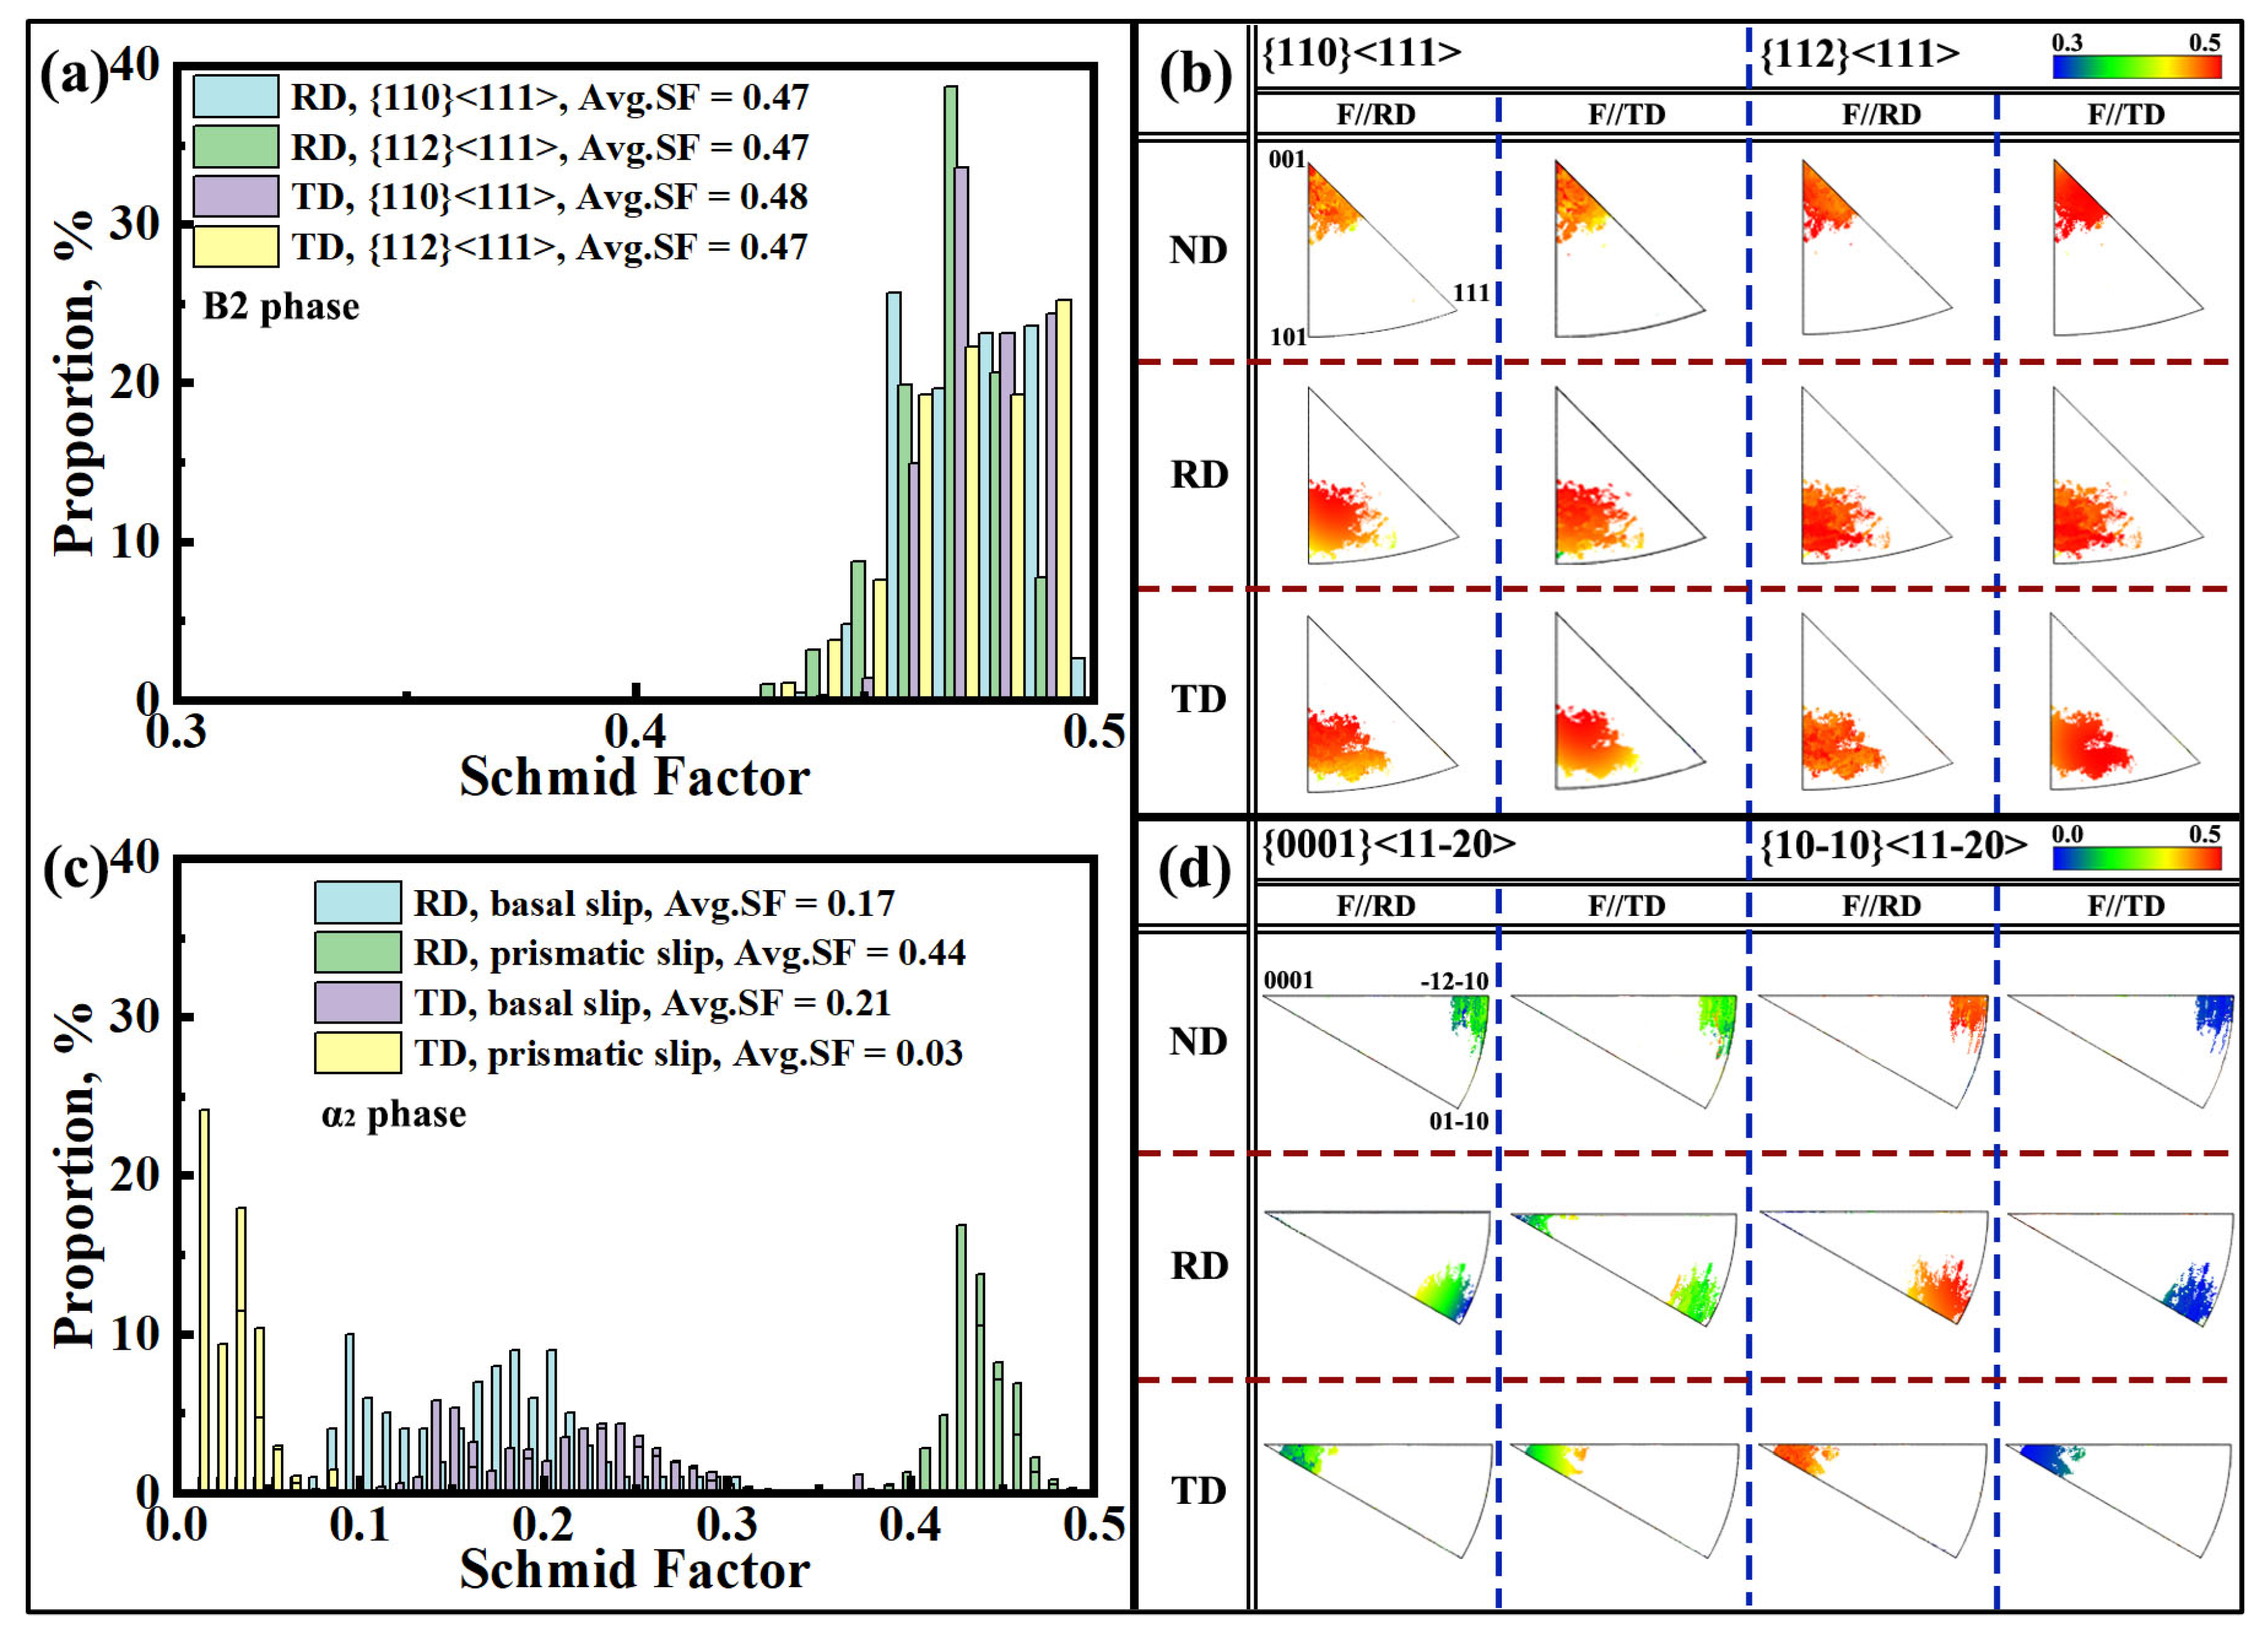
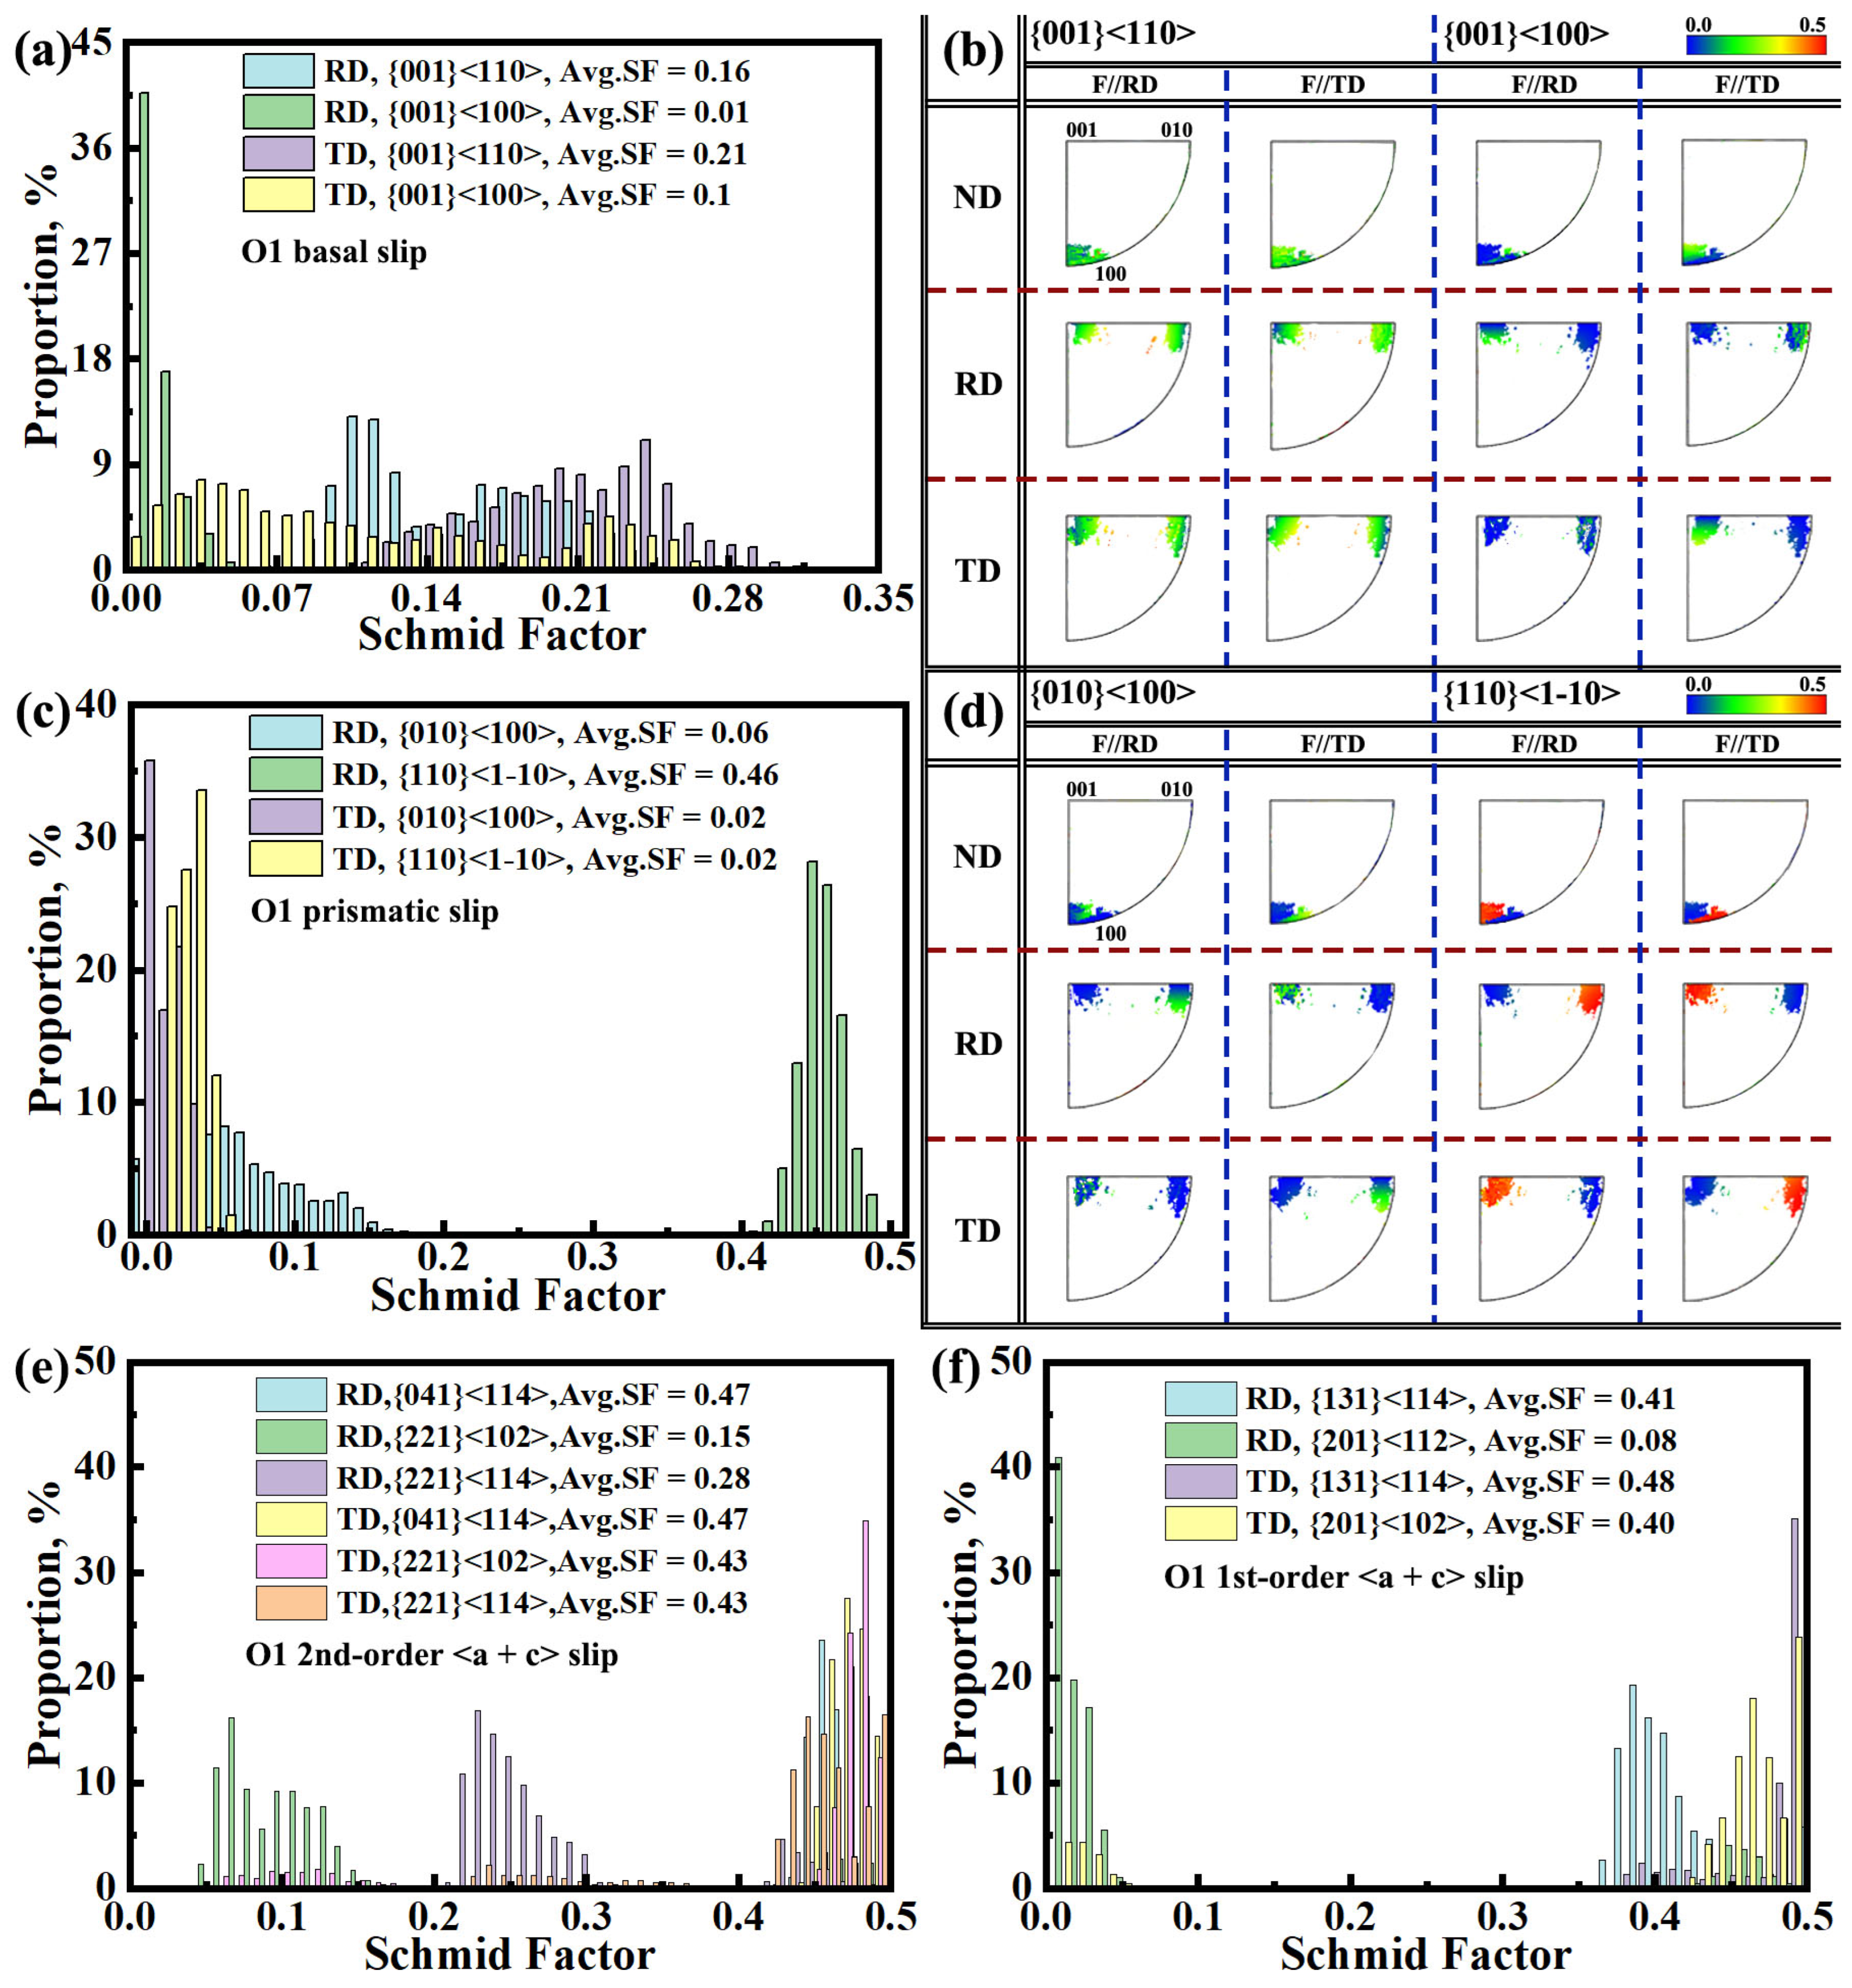
- In the rolled Ti2AlNb-based alloy sheet, all three phases exhibit significant textures. The BCC phase develops a near-cubic texture; the α2 phase is characterized by textures such as [0001]//TD, <20>//ND, and {110}<010>; and the O phase exhibits a strong {100}<010> rolling texture. During heat treatment, the texture of the BCC phase weakens due to recovery and recrystallization, the texture of the α2 phase remains largely unaffected, while the intensity of the O-phase texture shows a weakening trend with a decreasing phase content.
- The α2 phase exhibits a tendency to spheroidize at 1000 °C, driven by the mechanisms involving grain boundary separation and recrystallization. During heat treatment, the O phase undergoes coarsening. When heat treatment is performed in or near the single-phase region, coarsening occurs due to the transformation from B2 to O phase. In contrast, when heat treatment is conducted in the two-phase region, coarsening is governed by the Ostwald ripening mechanism.
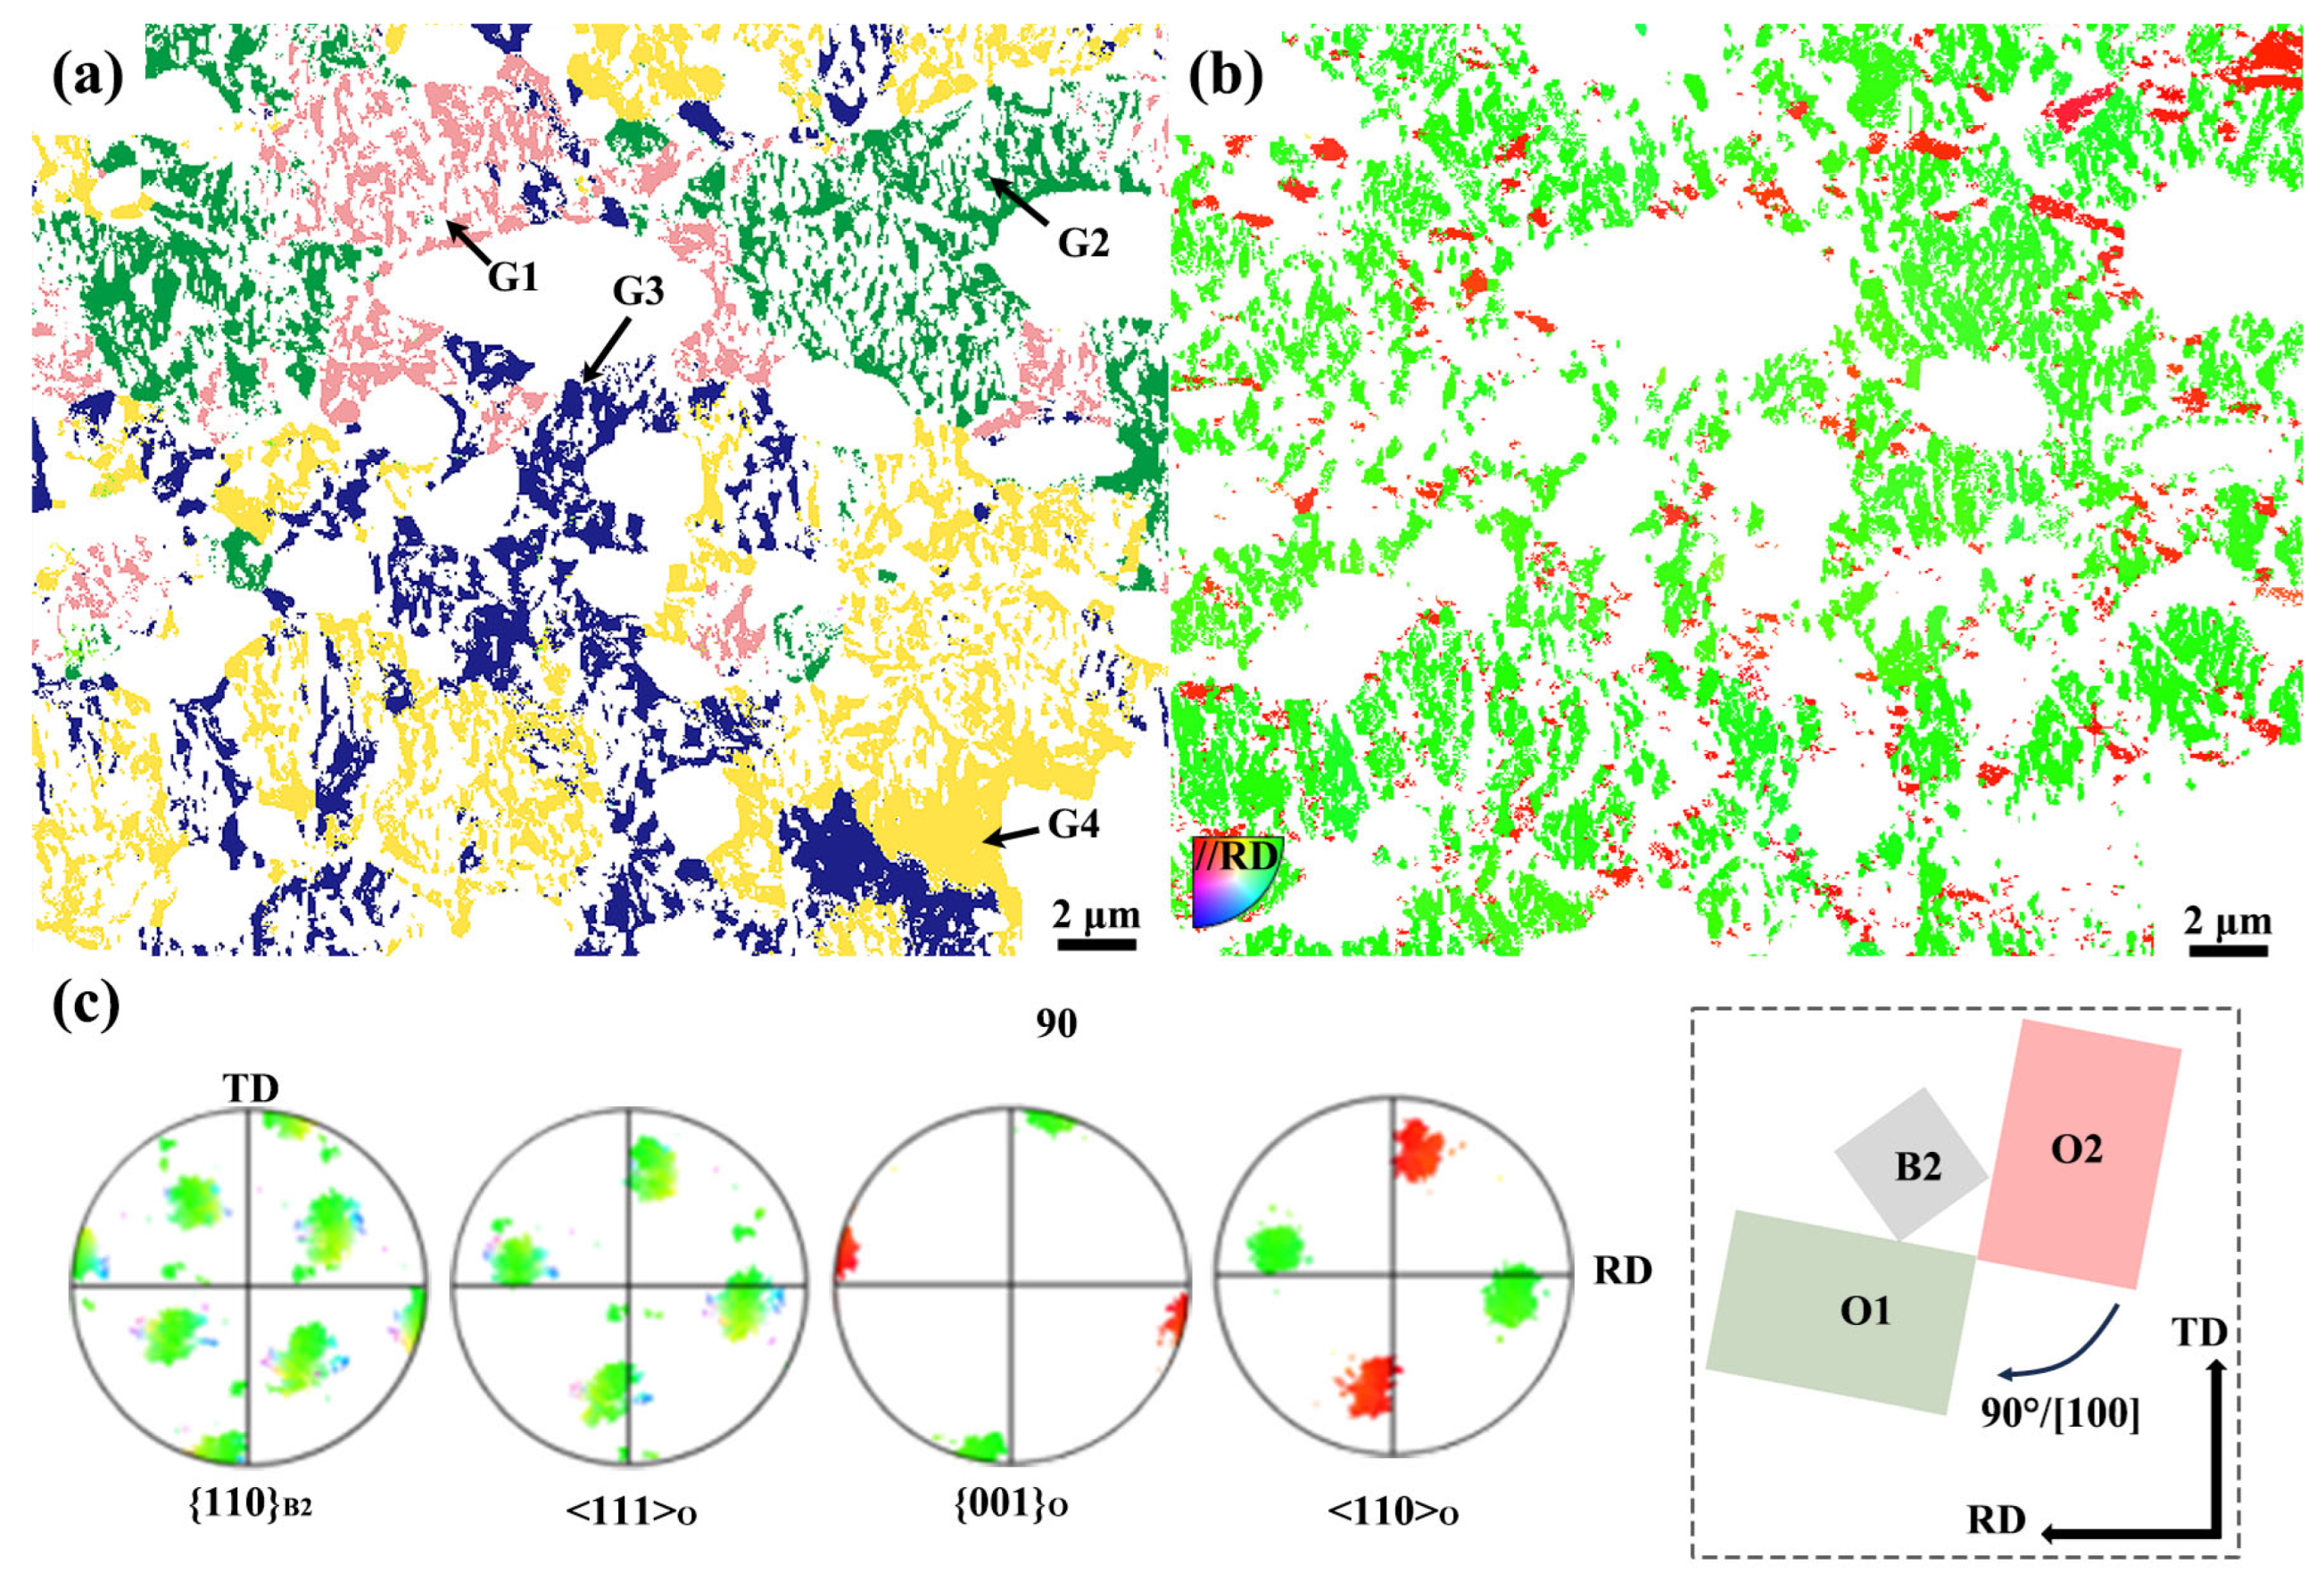
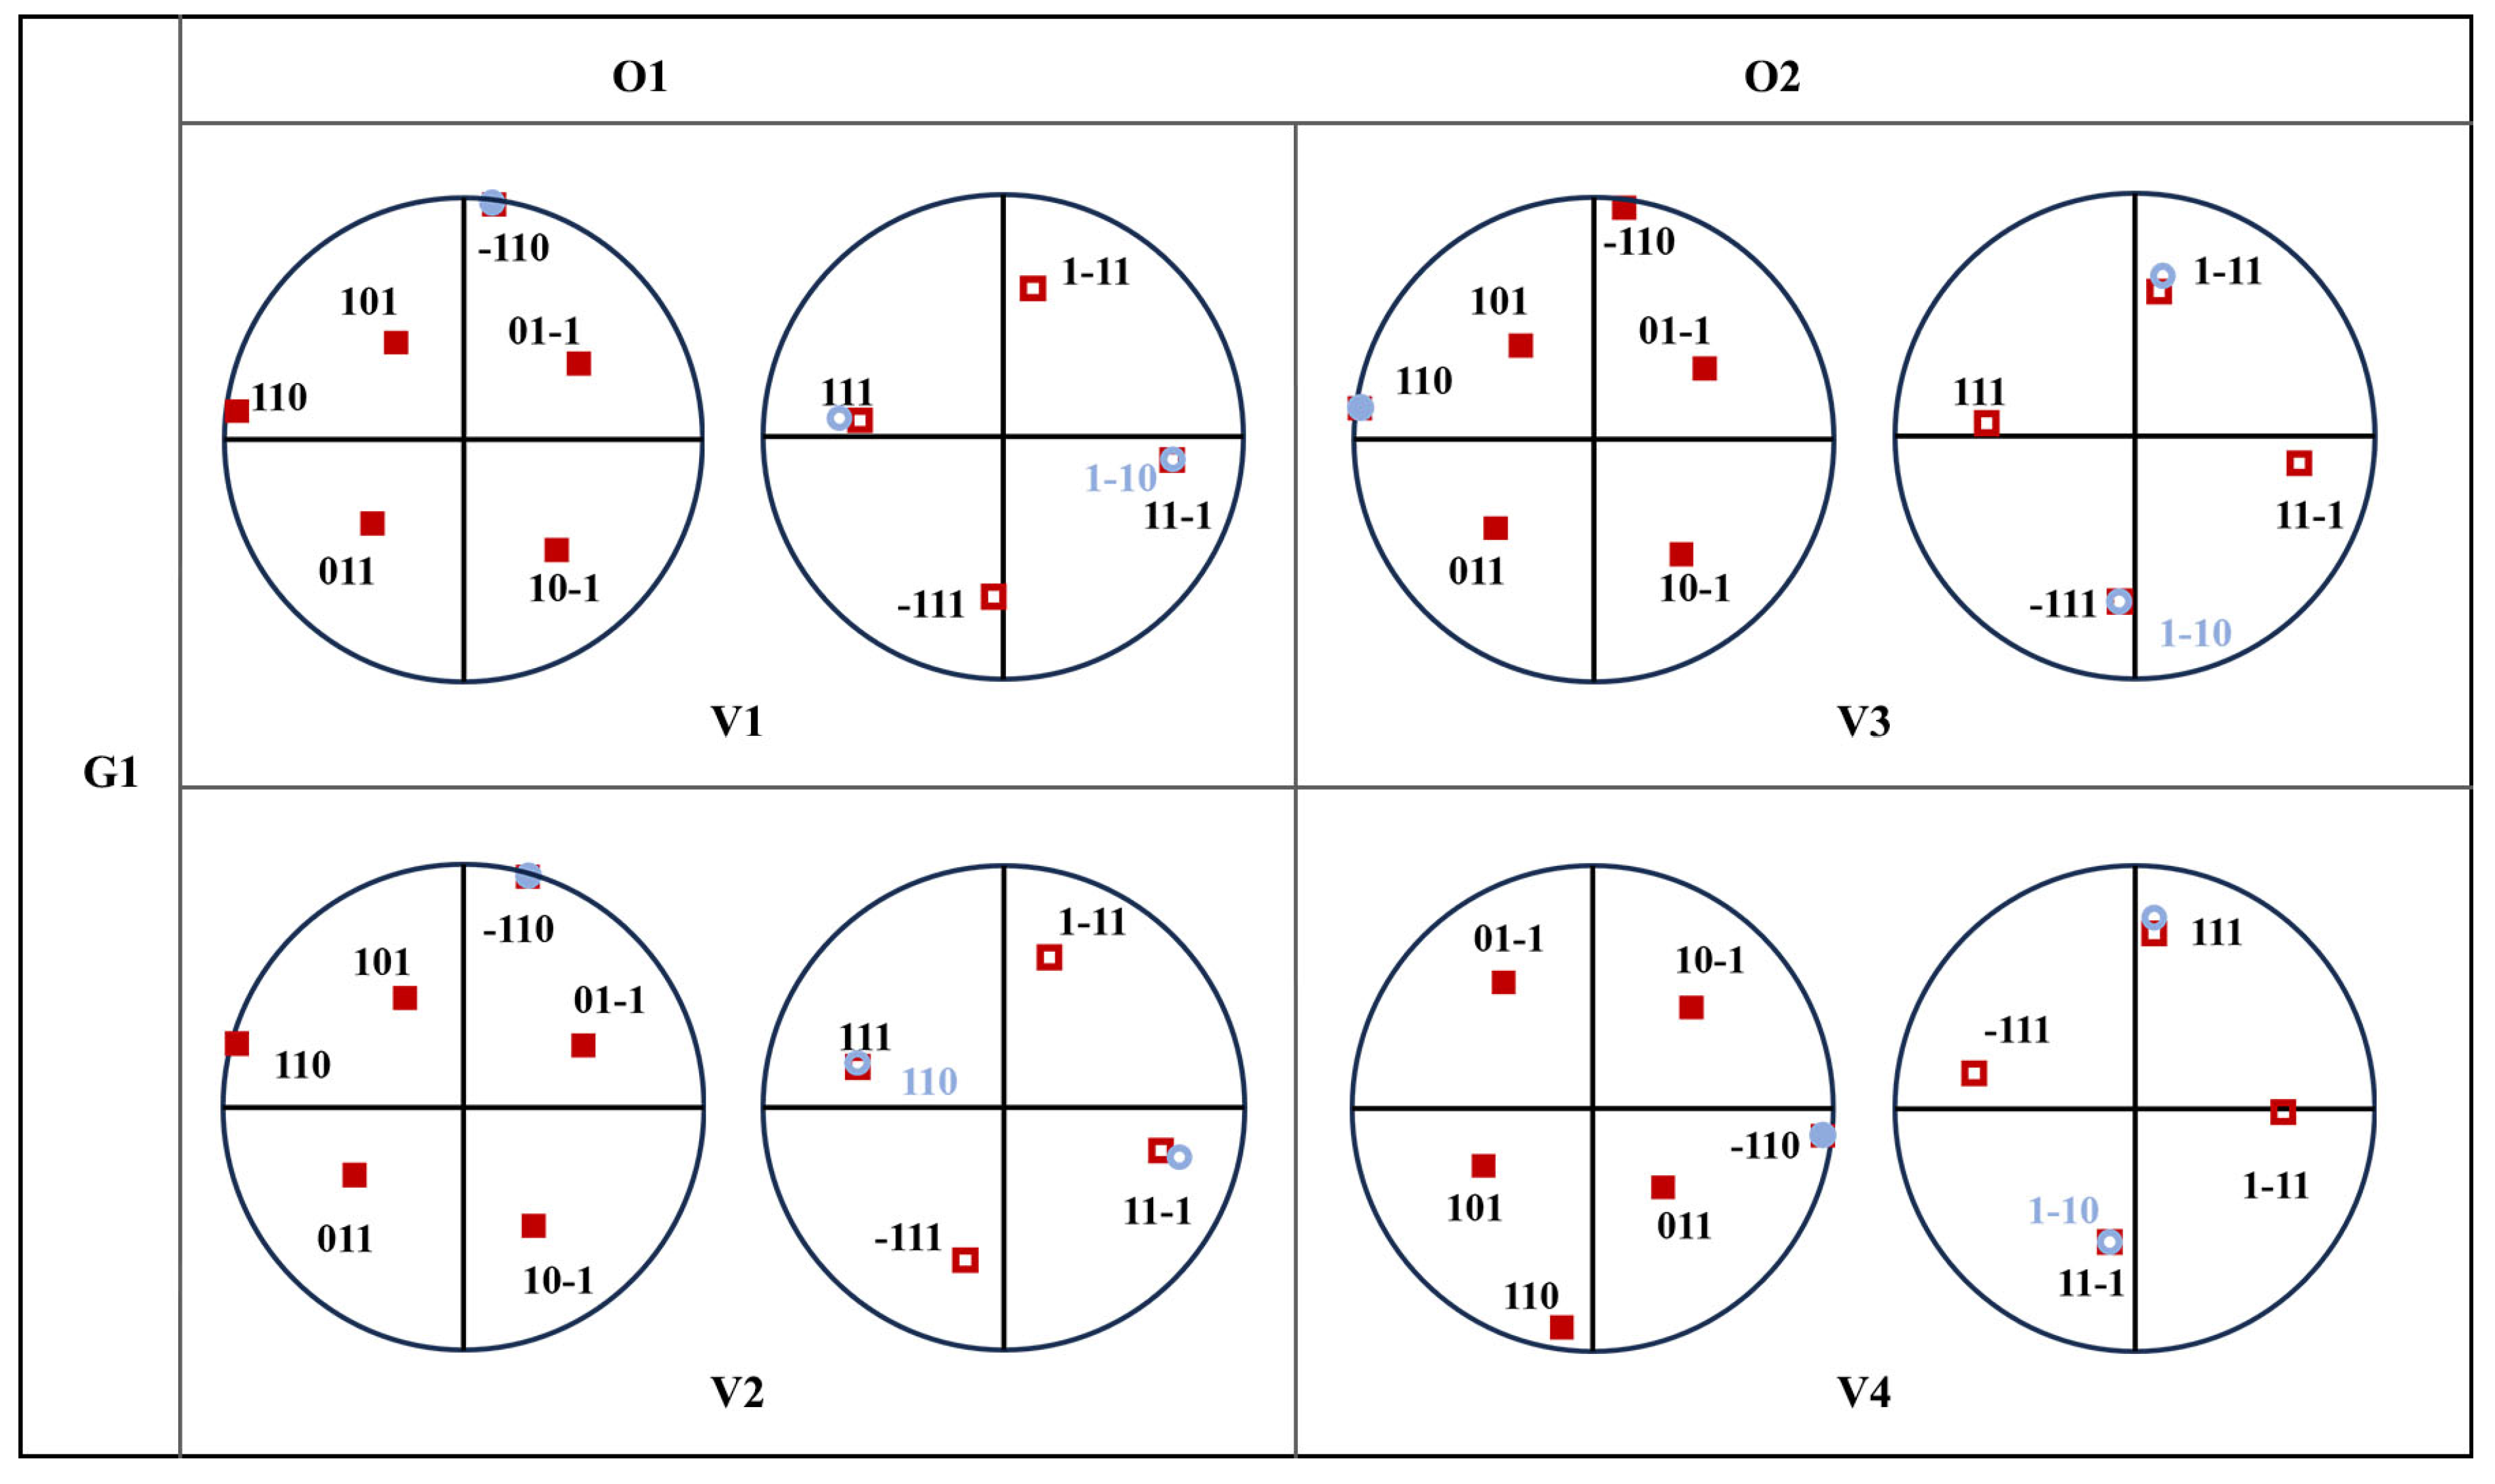
- The {110}<010> texture of the α2 phase is a hot deformation texture formed during the rolling process. The strong texture of the O phase is influenced by both the texture of the B2 phase and the variant selection effect during its formation. Each B2 grain can only precipitate four variants, with O1 and O2 in the same B2-phase grain each comprising two variants.
- The Ti2AlNb-based alloy sheet demonstrates enhanced ductility in the RD and superior yield strength in the TD, reaching a maximum value of 1136 MPa. The anisotropy in its tensile properties is primarily attributed to the difference in CRSS values between the prismatic slip system and the first-order pyramidal slip system of the O phase.
Author Contributions
Funding
Data Availability Statement
Conflicts of Interest
Abbreviations
| RD | Rolling Direction |
| TD | Transverse Direction |
| ND | Normal Direction |
| CRSS | Critical Resolved Shear Stress |
| SF | Schmid Factor |
| IPF | Inverse Pole Figure |
| O1 | The O Phase with Strong Texture |
| O2 | The O Phase with Weaker Texture Component |
| SEM | Scanning Electron Microscopy |
| EBSD | Electron Backscatter Diffraction |
| TEM | Transmission Electron Microscopy |
| XRD | X-ray Diffraction |
| HAGBs | High-angle Grain Boundaries |
References
- Banerjee, D.; Gogia, A.K.; Nandi, T.K.; Joshi, V.A. A new ordered orthorhombic phase in a Ti3Al-Nb alloy. Acta Metall. 1988, 36, 871–882. [Google Scholar] [CrossRef]
- Goyal, K.; Sardana, N. Phase stability and microstructural evolution of Ti2AlNb alloys—A review. Mater. Today Proc. 2021, 41, 951–968. [Google Scholar] [CrossRef]
- Hu, K.; Huang, J.; Wei, Z.; Peng, Q.; Xie, Z.; Sa, B.; Wu, B. Elastic and thermodynamic properties of the Ti2AlNb orthorhombic phase from first-principles calculations. Phys. Status Solidi B 2017, 254, 1600634. [Google Scholar] [CrossRef]
- Wang, K.; Xiang, H.; Xu, L.; Feng, A.; Qu, S.; Wang, H.; Chen, D. The Effect of Nb Doping on the Properties of Ti-Al Intermetallic Compounds Using First-Principles Calculations. Materials 2024, 17, 358. [Google Scholar] [CrossRef]
- Chen, H.; Li, X.; Chen, Z.; Zhang, R.; Ma, X.; Zheng, F.; Ma, Z.; Pan, F.; Lin, X. Investigation on electronic structures and mechanical properties of Nb–doped TiAl2 intermetallic compound. J. Alloys Compd. 2019, 780, 41–48. [Google Scholar] [CrossRef]
- Liu, X.; Lin, Q.; Zhang, W.; Horne, C.V.; Cha, L. Microstructure Design and Its Effect on Mechanical Properties in Gamma Titanium Aluminides. Metals 2021, 11, 1644. [Google Scholar] [CrossRef]
- Li, Y.; Dai, J.; Song, Y. First-principles investigation on stability and oxygen adsorption behavior of a O/B2 interface in Ti2AlNb alloys. J. Alloys Compd. 2020, 818, 152926. [Google Scholar] [CrossRef]
- Feng, A.H.; Chen, Q.; Wang, J.; Wang, H.; Qu, S.J.; Chen, D.L. Thermal Stability of Microstructures in Low-Density Ti2AlNb-Based Alloy Hot Rolled Plate. Acta Metall. Sin. 2023, 59, 777–786. [Google Scholar] [CrossRef]
- Chen, W.; Li, J.W.; Xu, L.; Lu, B. Development of Ti2AlNb Alloys: Opportunities and Challenges. Adv. Mater. Process 2014, 172, 23–27. [Google Scholar] [CrossRef]
- Xiang, J.M.; Mi, G.B.; Qu, S.J.; Huang, X.; Chen, Z.; Feng, A.H.; Shen, J.; Chen, D.L. Thermodynamic and microstructural study of Ti2AlNb oxides at 800 °C. Sci. Rep. 2018, 8, 12761. [Google Scholar] [CrossRef]
- Qu, S.; Feng, A.; Shagiev, M.R.; Xie, H.; Li, B.B.; Shen, J. Superplastic behavior of the fine-grained Ti-21Al-18Nb-1Mo-2V-0.3Si intermetallic alloy. Lett. Mater. 2018, 8, 567–571. [Google Scholar] [CrossRef]
- Ayadh, W.; Denand, B.; Halkoum, A.; Boulet, P.; Sennour, M.; Delfosse, J.; Sallot, P.; Esin, V.A. Effect of prior α2 phase on precipitation kinetics of O-phase in advanced Ti2AlNb alloy. Acta Mater. 2023, 252, 118930. [Google Scholar] [CrossRef]
- Boehlert, C.J. Part III. The tensile behavior of Ti-Al-Nb O+Bcc orthorhombic alloys. Metall. Mater. Trans. A 2001, 32, 1977–1988. [Google Scholar] [CrossRef]
- Boehlert, C.J.; Chen, Z.; Gutiérrez-Urrutia, I.; Llorca, J.; Pérez-Prado, M.T. In situ analysis of the tensile and tensile-creep deformation mechanisms in rolled AZ31. Acta Mater. 2012, 60, 1889–1904. [Google Scholar] [CrossRef]
- Jin, S.; Marthinsen, K.; Li, Y. Formation of {11-21} twin boundaries in titanium by kinking mechanism through accumulative dislocation slip. Acta Mater. 2016, 120, 403–414. [Google Scholar] [CrossRef]
- Nandy, T.K.; Banerjee, D. Deformation mechanisms in the O phase. Intermetallics 2000, 8, 1269–1282. [Google Scholar] [CrossRef]
- Zhang, P.; Zeng, W.; Jia, R.; Kou, Y.; Xu, J.; Liang, X.; Zhao, Y. Tensile behavior and deformation mechanism for Ti–22Al–25Nb alloy with lamellar O microstructures. Mater. Sci. Eng. A 2021, 803, 140492. [Google Scholar] [CrossRef]
- Zhang, H.; Yan, N.; Liang, H.; Liu, Y. Phase transformation and microstructure control of Ti2AlNb-based alloys: A review. J. Mater. Sci. Technol. 2021, 80, 203–216. [Google Scholar] [CrossRef]
- Hémery, S.; Villechaise, P. In situ EBSD investigation of deformation processes and strain partitioning in bi-modal Ti-6Al-4V using lattice rotations. Acta Mater. 2019, 171, 261–274. [Google Scholar] [CrossRef]
- Zheng, Y.; Zeng, W.; Li, D.; Zhao, Q.; Liang, X.; Zhang, J.; Ma, X. Fracture toughness of the bimodal size lamellar O phase microstructures in Ti-22Al-25Nb (at.%) orthorhombic alloy. J. Alloys Compd. 2017, 709, 511–518. [Google Scholar] [CrossRef]
- Wei, W.; Weidong, Z.; Chen, X.; Xiaobo, L.; Jianwei, Z. Designed bimodal size lamellar O microstructures in Ti2AlNb based alloy: Microstructural evolution, tensile and creep properties. Mater. Sci. Eng. A 2014, 618, 288–294. [Google Scholar] [CrossRef]
- Wang, W.; Zeng, W.; Xue, C.; Liang, X.; Zhang, J. Microstructure control and mechanical properties from isothermal forging and heat treatment of Ti–22Al–25Nb (at.%) orthorhombic alloy. Intermetallics 2015, 56, 79–86. [Google Scholar] [CrossRef]
- Zhang, H.; Li, C.; Ma, Z.; Yu, L.; Liu, Y. Effect of dual aging treatments on phase transformation and microstructure in a pre-deformed Ti2AlNb-based alloy containing O + β/B2 structures. Vacuum 2019, 164, 175–180. [Google Scholar] [CrossRef]
- Zheng, Y.; Zeng, W.; Zhang, P.; Ma, H.; Li, D.; Xu, J.; Ma, X. Anti-correlation between solution strengthening and precipitation strengthening in lamellar O microstructures of a Ti2AlNb based alloy. J. Alloys Compd. 2020, 847, 156470. [Google Scholar] [CrossRef]
- Zhang, Y.L.; Qu, S.J.; Feng, A.H.; Shen, J.; Chen, D.L. Microstructure and low cycle fatigue of a Ti2AlNb-based lightweight alloy. J. Mater. Sci. Technol. 2020, 44, 140–147. [Google Scholar] [CrossRef]
- Sui, X.C.; Liu, Q.; Luo, S.Y.; Liu, Y.K.; Li, Z.L.; Kang, Q.X.; Wang, G.F. Achieving high ductility of Ti2AlNb sheet without sacrificing the tensile strength without post heat treatment. Mater. Sci. Eng. A 2022, 840, 142897. [Google Scholar] [CrossRef]
- Wang, G.; Sui, X.; Liu, Q.; Liu, Y. Fabricating Ti2AlNb sheet with high tensile strength and good ductility by hot packed rolling the spark plasma sintered pre-alloyed powder. Mater. Sci. Eng. A 2021, 801, 140392. [Google Scholar] [CrossRef]
- Zavodov, A.V.; Nochovnaya, N.A.; Lyakhov, A.A.; Filonova, E.V. Effect of deformation band on the strength of a rolled plate of intermetallic titanium alloy based on Ti–22Al–25Nb system. Mater. Charact. 2021, 180, 111438. [Google Scholar] [CrossRef]
- Zhang, P.; Zeng, W.; Ma, H.; Zhang, F.; Xu, J.; Liang, X.; Zhao, Y. Research on tensile anisotropy of Ti-22Al-25Nb alloy isothermally forged in B2 phase region related with texture and variant selection. Mater. Charact. 2023, 201, 112899. [Google Scholar] [CrossRef]
- Dey, S.R.; Suwas, S.; Fundenberger, J.J.; Ray, R.K. Evolution of crystallographic texture and microstructure in the orthorhombic phase of a two-phase alloy Ti–22Al–25Nb. Intermetallics 2009, 17, 622–633. [Google Scholar] [CrossRef]
- Rollett, A.D.; Smith, P.R.; James, M.R. Texture and anisotropy of Ti-22Al-23Nb foil. Mater. Sci. Eng. A 1998, 257, 77–86. [Google Scholar] [CrossRef]
- Wang, S.; Xu, W.; Zong, Y.; Zhong, X.; Shan, D. Effect of initial microstructures on hot deformation behavior and workability of Ti2AlNb-based alloy. Metals 2018, 8, 382. [Google Scholar] [CrossRef]
- Liu, Z.; Zhao, Z.; Liu, J.; Wang, Q.; Guo, Z.; Wang, J.; Yang, G.; Gong, S. Anisotropy in microstructure and tensile properties of Ti–5Al–5Mo–5V–1Cr–1Fe produced via additive manufacturing. Mater. Sci. Eng. A 2020, 798, 140093. [Google Scholar] [CrossRef]
- Boehlert, C.J.; Majumdar, B.S.; Seetharaman, V.; Miracle, D.B. Part I. The microstructural evolution in Ti-Al-Nb O+Bcc orthorhombic alloys. Metall. Mater. Trans. A 1999, 30, 2305–2323. [Google Scholar] [CrossRef]
- Liu, S.; Cao, J.; Zhou, Y.; Hou, C.; Dai, S.; Huang, X. Microstructure evolution and mechanical properties of a high-strength Ti2AlNb alloy processed by large-strain two-pass hot extrusion. J. Alloys Compd. 2022, 925, 166715. [Google Scholar] [CrossRef]
- Zhang, Y.L.; Chen, Z.; Qu, S.J.; Feng, A.H.; Mi, G.B.; Shen, J.; Huang, X.; Chen, D.L. Microstructure and cyclic deformation behavior of a 3D-printed Ti–6Al–4V alloy. J. Alloys Compd. 2020, 825, 153971. [Google Scholar] [CrossRef]
- Zhang, Y.; Chen, Z.; Qu, S.; Feng, A.; Mi, G.; Shen, J.; Huang, X.; Chen, D. Multiple α sub-variants and anisotropic mechanical properties of an additively-manufactured Ti-6Al-4V alloy. J. Mater. Sci. Technol. 2021, 70, 113–124. [Google Scholar] [CrossRef]
- Ma, J.; Zhang, Y.; Li, J.; Wang, Z.; Wang, J. Variant selection within one β grain in laser solid formed Ti-6Al-4V alloys. Mater. Charact. 2022, 185, 111744. [Google Scholar] [CrossRef]
- Shi, R.; Dixit, V.; Fraser, H.L.; Wang, Y. Variant selection of grain boundary α by special prior β grain boundaries in titanium alloys. Acta Mater. 2014, 75, 156–166. [Google Scholar] [CrossRef]
- Li, W.; Zheng, K.; Zhao, G.; Zhang, Y.; Jin, Y. Variant Selection in the Thermally Treated Ti-6Al-4V Processed by Laser Metal Deposition. Metallogr. Microstruct. Anal. 2023, 12, 645–650. [Google Scholar] [CrossRef]
- Okayasu, M.; Ogawara, T.; Matsushima, M. Formability Improvement for Bending Magnesium Alloy AZ31 Sheet via Microstructural Control. J. Mater. Eng. Perform. 2024. [Google Scholar] [CrossRef]
- Won, J.W.; Suh, B.-C.; Kim, J.H.; Lee, D.W.; Hyun, Y.-T. Texture development of pure Ti by rolling at various temperatures and its effect on sheet formability. J. Mater. Res. Technol. 2024, 32, 2214–2223. [Google Scholar] [CrossRef]
- Froes, F.H.; Suryanarayana, C.; Eliezer, D. Synthesis, properties and applications of titanium aluminides. J. Mater. Sci. 1992, 27, 5113–5140. [Google Scholar] [CrossRef]
- Xu, Y.; Xu, L.; Ding, L.; Zhang, S.; Zhang, B.; Pan, H.; Lu, X.; Jiang, P. Microstructure and microtexture evolution of hot-rolled Ti-6321 alloy at different post-annealing temperatures. J. Alloys Compd. 2022, 902, 163842. [Google Scholar] [CrossRef]
- Wang, Z.; Chen, Y.; Wang, X.; Wang, J. Texture of Ti2AlNb sheet and its effect on anisotropy of tensile properties. Acta Metall. Sin. 2024, 1–13. Available online: https://www.ams.org.cn/CN/10.11900/0412.1961.2024.00074 (accessed on 27 May 2025).
- Zherebtsov, S.; Murzinova, M.; Salishchev, G.; Semiatin, S.L. Spheroidization of the lamellar microstructure in Ti–6Al–4V alloy during warm deformation and annealing. Acta Mater. 2011, 59, 4138–4150. [Google Scholar] [CrossRef]
- Dong, X.j.; Lu, S.; Zheng, H. Dynamic spheroidization kinetics behavior of Ti–6.5Al–2Zr–1Mo–1V alloy with lamellar microstructure. Trans. Nonferr. Met. Soc. China 2016, 26, 1301–1309. [Google Scholar] [CrossRef]
- Shell, E.B.; Semiatin, S.L. Effect of initial microstructure on plastic flow and dynamic globularization during hot working of Ti-6Al-4V. Metall. Mater. Trans. A 1999, 30, 3219–3229. [Google Scholar] [CrossRef]
- Semiatin, S.L.; Seetharaman, V.; Weiss, I. Flow behavior and globularization kinetics during hot working of Ti–6Al–4V with a colony alpha microstructure. Mater. Sci. Eng. A 1999, 263, 257–271. [Google Scholar] [CrossRef]
- Stefansson, N.; Semiatin, S.L.; Eylon, D. The kinetics of static globularization of Ti-6Al-4V. Metall. Mater. Trans. A 2002, 33, 3527–3534. [Google Scholar] [CrossRef]
- Xu, J.W.; Zeng, W.D.; Jia, Z.Q.; Sun, X.; Zhou, J.H. Microstructure coarsening behavior of Ti-17 alloy with equiaxed alpha during heat treatment. J. Alloys Compd. 2015, 618, 343–348. [Google Scholar] [CrossRef]
- Salishchev, G.A.; Zerebtsov, S.V.; Mironov, S.Y.; Semiatin, S.L. Formation of grain boundary misorientation spectrum in alpha-beta titanium alloys with lamellar structure under warm and hot working. Mater. Sci. Forum 2004, 467–470, 501–506. [Google Scholar] [CrossRef]
- Wang, K.; Wu, M.; Ren, Z.; Zhang, Y.; Xin, R.; Liu, Q. Static globularization and grain morphology evolution of α and β phases during annealing of hot-rolled TC21 titanium alloy. Trans. Nonferr. Met. Soc. China 2021, 31, 2664–2676. [Google Scholar] [CrossRef]
- Sharma, G.; Ramanujan, R.V.; Tiwari, G.P. Instability mechanisms in lamellar microstructures. Acta Mater. 2000, 48, 875–889. [Google Scholar] [CrossRef]
- Chen, X.; Zeng, W.; Wang, W.; Liang, X.; Zhang, J. Coarsening behavior of lamellar orthorhombic phase and its effect on tensile properties for the Ti–22Al–25Nb alloy. Mater. Sci. Eng. A 2014, 611, 320–325. [Google Scholar] [CrossRef]
- Lin, P.; He, Z.; Yuan, S.; Shen, J.; Huang, Y.; Liang, X. Instability of the O-phase in Ti–22Al–25Nb alloy during elevated-temperature deformation. J. Alloys Compd. 2013, 578, 96–102. [Google Scholar] [CrossRef]
- Wang, W.; Zeng, W.; Sun, Y.; Zhou, H.; Liang, X. Microstructure, Tensile, and Creep Behaviors of Ti-22Al-25Nb (at.%) Orthorhombic Alloy with Equiaxed Microstructure. Materials 2018, 11, 1224. [Google Scholar] [CrossRef]
- Zheng, Y.; Zeng, W.; Li, D.; Xu, J.; Ma, X.; Liang, X.; Zhang, J. Orthorhombic precipitate variant selection in a Ti2AlNb based alloy. Mater. Des. 2018, 158, 46–61. [Google Scholar] [CrossRef]
- Wu, Y.; Kou, H.; Tang, B.; Liu, D.; Li, J.; Li, J. O Phase Precipitation and Variant Selection in Ti–22Al–25Nb Alloy during the Hot Shear Spinning. Adv. Eng. Mater. 2018, 20, 1800153. [Google Scholar] [CrossRef]
- Zhang, P.; Zeng, W.; Zhang, F.; Ma, H.; Xu, J.; Liang, X.; Zhao, Y. In-situ investigation of tensile anisotropy mechanism in an advanced Ti2AlNb-based alloy associated with CRSS ratio and damage model. Mater. Sci. Eng. A 2024, 890, 145894. [Google Scholar] [CrossRef]
- Zhang, F.; Zeng, W.; Ma, H.; Zhang, P.; Liang, X. Variant selection of orthorhombic phase precipitation and its effect on colony side plates formation in Ti–22Al–25Nb alloy. J. Mater. Res. Technol. 2023, 25, 4686–4699. [Google Scholar] [CrossRef]
- Banerjee, R.; Bhattacharyya, D.; Collins, P.C.; Viswanathan, G.B.; Fraser, H.L. Precipitation of grain boundary α in a laser deposited compositionally graded Ti–8Al–xV alloy—An orientation microscopy study. Acta Mater. 2004, 52, 377–385. [Google Scholar] [CrossRef]
- Xu, S.; Gao, C.; Xiao, N.; Zhang, H.; Cui, Z. Sensitivity of heterogeneous microstructure evolution and preferential variant selection to thermomechanical conditions in a near α titanium alloy. J. Alloys Compd. 2023, 947, 169623. [Google Scholar] [CrossRef]
- Kato, M.; Onaka, S.; Fujii, T. Energy consideration for variant selection in precipitation on dislocations. Sci. Technol. Adv. Mater. 2001, 2, 375–380. [Google Scholar] [CrossRef]
- Jain, A.; Duygulu, O.; Brown, D.W.; Tomé, C.N.; Agnew, S.R. Grain size effects on the tensile properties and deformation mechanisms of a magnesium alloy, AZ31B, sheet. Mater. Sci. Eng. A 2008, 486, 545–555. [Google Scholar] [CrossRef]
- Liu, Z.G.; Frommeyer, G.; Kreuss, M. Field ion microscopy and atom probe investigations on two phase intermetallic TiAlTi3Al alloy. Scr. Metall. Mater. 1991, 25, 1205–1210. [Google Scholar] [CrossRef]
- Zhang, H.; Wei, B.; Ou, X.; Ni, S.; Yan, H.; Song, M. Atomic-level study of {101} deformation twinning in pure Ti and Ti-5at.% Al alloy. Int. J. Plast. 2022, 153, 103273. [Google Scholar] [CrossRef]
- Shao, B.; Shan, D.; Guo, B.; Zong, Y. Plastic deformation mechanism and interaction of B2, α2, and O phases in Ti-22Al-25Nb alloy at room temperature. Int. J. Plast. 2019, 113, 18–34. [Google Scholar] [CrossRef]
- Imayev, R.; Gabdullin, N.; Salishchev, G. Effect of grain size on superplasticity of an intermetallic Ti3Al compound. Intermetallics 1997, 5, 229–236. [Google Scholar] [CrossRef]
- Song, L.; Wang, L.; Oehring, M.; Hu, X.; Appel, F.; Lorenz, U.; Pyczak, F.; Zhang, T. Evidence for deformation twinning of the DO19-α2 phase in a high Nb containing TiAl alloy. Intermetallics 2019, 109, 91–96. [Google Scholar] [CrossRef]
- Inui, H.; Toda, Y.; Yamaguchi, M. Plastic deformation of single crystals of a DO19 compound with an off-stoichiometric composition (Ti-36·5 at.% Al) at room temperature. Philos. Mag. A 1993, 67, 1315–1332. [Google Scholar] [CrossRef]
- Zhang, C.; Hou, H.; Zhao, Y.; Yang, X.; Guo, Y. First-principles study on structural, elastic and thermal properties of γ-TiAl and α2-Ti3Al phases in TiAl-based alloy under high pressure. Int. J. Mod. Phys. B 2017, 31, 1750079. [Google Scholar] [CrossRef]
- Court, S.A.; Löfvander, J.P.A.; Loretto, M.H.; Fraser, H.L. The influence of temperature and alloying additions on the mechanisms of plastic deformation of Ti3Al. Philos. Mag. A 1990, 61, 109–139. [Google Scholar] [CrossRef]
- Kishida, K.; Takahama, Y.; Inui, H. Deformation twinning in single crystals of a DO19 compound with an off-stoichiometric composition (Ti–36.5at.%Al). Acta Mater. 2004, 52, 4941–4952. [Google Scholar] [CrossRef]


| Phase | As-Rolled | 850 °C | 900 °C | 950 °C | 1000 °C | 1150 °C |
|---|---|---|---|---|---|---|
| B2 | 35.8% | 45.5% | 70.3% | 86.7% | 91.3% | 100% |
| O | 41.3% | 19% | 2.6% | 0 | 0 | 0 |
| α2 | 18.7% | 22.8% | 22.8% | 12.5% | 7% | 0 |
| Strain Rate, s−1 | YS, MPa | UTS, MPa | El% | |
|---|---|---|---|---|
| RD-1 | 1 × 10⁻³ | 936 | 1032 | 3.1 |
| RD-2 | 1 × 10⁻³ | 953 | 1063 | 4.0 |
| RD-3 | 1 × 10⁻³ | 942 | 1044 | 2.9 |
| TD-1 | 1 × 10⁻³ | 1136 | 1194 | 1.8 |
| TD-2 | 1 × 10⁻³ | 1018 | 1150 | 1.5 |
| TD-3 | 1 × 10⁻³ | 1055 | 1194 | 1.5 |
| O1 | O2 | |||
|---|---|---|---|---|
| G1 | V1 | (10)B2//(001)O, [11]B2//[10]O | V3 | (110)B2//(001)O, [11]B2//[10]O |
| V2 | (10)B2//(001)O, [111]B2//[110]O | V4 | (110)B2//(001)O, [11]B2//[110]O | |
| G2 | V1 | (10)B2//(001)O, [111]B2//[10]O | V3 | (110)B2//(001)O, [11]B2//[110]O |
| V2 | (10)B2//(001)O, [11]B2//[110]O | V4 | (110)B2//(001)O, [11]B2//[10]O | |
| G3 | V1 | (110)B2//(001)O, [11]B2//[110]O | V3 | (10)B2//(001)O, [111]B2//[10]O |
| V2 | (110)B2//(001)O, [11]B2//[10]O | V4 | (10)B2//(001)O, [11]B2//[110]O | |
| G4 | V1 | (110)B2//(001)O, [11]B2//[110]O | V3 | (10)B2//(001)O, [111]B2//[110]O |
| V2 | (110)B2//(001)O, [11]B2//[10]O | V4 | (10)B2//(001)O, [11]B2//[10]O | |
Disclaimer/Publisher’s Note: The statements, opinions and data contained in all publications are solely those of the individual author(s) and contributor(s) and not of MDPI and/or the editor(s). MDPI and/or the editor(s) disclaim responsibility for any injury to people or property resulting from any ideas, methods, instructions or products referred to in the content. |
© 2025 by the authors. Licensee MDPI, Basel, Switzerland. This article is an open access article distributed under the terms and conditions of the Creative Commons Attribution (CC BY) license (https://creativecommons.org/licenses/by/4.0/).
Share and Cite
Jing, C.; Qu, S.; Feng, A.; Wang, H.; Chen, D. Influence of Microstructure and Texture on Tensile Properties of an As-Rolled Ti2AlNb-Based Alloy. Metals 2025, 15, 631. https://doi.org/10.3390/met15060631
Jing C, Qu S, Feng A, Wang H, Chen D. Influence of Microstructure and Texture on Tensile Properties of an As-Rolled Ti2AlNb-Based Alloy. Metals. 2025; 15(6):631. https://doi.org/10.3390/met15060631
Chicago/Turabian StyleJing, Caihong, Shoujiang Qu, Aihan Feng, Hao Wang, and Daolun Chen. 2025. "Influence of Microstructure and Texture on Tensile Properties of an As-Rolled Ti2AlNb-Based Alloy" Metals 15, no. 6: 631. https://doi.org/10.3390/met15060631
APA StyleJing, C., Qu, S., Feng, A., Wang, H., & Chen, D. (2025). Influence of Microstructure and Texture on Tensile Properties of an As-Rolled Ti2AlNb-Based Alloy. Metals, 15(6), 631. https://doi.org/10.3390/met15060631