Article

Modeling the Impact of Hydrogen Embrittlement on the Fracture Toughness of Low-Carbon Steel Using a Machine Learning Approach

Mewbourne School of Petroleum and Geological Engineering, University of Oklahoma, Norman, OK 73019, USA
*
Author to whom correspondence should be addressed.
Metals 2025, 15(6), 588; https://doi.org/10.3390/met15060588
Submission received: 25 April 2025 / Revised: 20 May 2025 / Accepted: 21 May 2025 / Published: 25 May 2025
(This article belongs to the Special Issue Hydrogen Embrittlement of Metals: Behaviors and Mechanisms)

Abstract

This study aims to advance the understanding of hydrogen embrittlement (HE) in low-carbon and low-alloy steels by developing a predictive framework for assessing fracture toughness (FT), a critical parameter for mitigating HE in hydrogen infrastructure. A machine learning (ML) model was constructed by analyzing data from relevant literature to evaluate the fracture toughness of steels exposed to hydrogen environments. Seven ML modeling techniques were initially considered, with four selected for detailed evaluation based on predictive accuracy. The chosen modeling techniques were k-nearest neighbors (KNN), random forest (RF), gradient boosting (GB), and decision tree regression (DT). The selected models were further evaluated for their predictive accuracy and reliability, and the best model was used to perform parametric studies to investigate the impact of relevant parameters on FT. According to the results, the KNN model demonstrated reliable predictive performance, supported by high R-squared values and low error metrics. Among the variables considered, hydrogen pressure and yield strength emerged as the most influential, with hydrogen pressure alone accounting for 32% of the variation in FT. The model revealed a distinct trend in FT behavior, showing a significant decline at low hydrogen pressures (0–6.9 MPa) and a plateau at higher pressures (>8 MPa), indicating a saturation point. Alloying element contents, specifically those of carbon and phosphorus, also played a notable role in FT prediction. Additionally, the study confirmed that low concentrations of oxygen (<200 ppm) mitigate HE in X70 steel, likely by limiting hydrogen uptake. FT predictions do not show noticeable variations with lower displacement rates (<0.1 mm/min), indicating the need for low-rate measurements for accurate ML model training.

1. Introduction

1.1. Overview

Because hydrogen can potentially be a sustainable replacement for fossil fuels, interest in it as an energy source is rising dramatically. It has the advantages of being accessible, having excellent energy efficiency, and producing no carbon emissions. Hydrogen’s low density means it is usually transported and stored in either a compressed or liquid state [1]. With a greater energy density by mass than fossil fuels, hydrogen fuel presents an attractive economic option for usage as a substitute, potentially bringing about more sustainable energy solutions. Hydrogen utilization, however, poses a major risk to metallic components found in fuel storage facilities and pipelines [2,3]. Natural gas transmission systems traditionally are made of carbon and low-alloy steel pipes because of their remarkable qualities, which include durability, high tensile strength, and weldability. One of the most important factors in determining this preference is the material’s weldability, which is strongly related to its specific chemical composition, carbon equivalent value, and thermal behavior. These factors are critical in ensuring that the material can be welded efficiently without producing imperfections [4]. Medium-grade steel, especially that designated as API 5L pipe grades X42, X46, and X52 by the American Petroleum Institute (API), are used in these transmission systems [5]. Based on research by Marchi and Somerday [6], these pipelines are intended to operate at pressures as high as 13 MPa.
Numerous research works have examined the impact of hydrogen on the fracture toughness of various grades of carbon steel, such as X70 pipeline steel and clad steel pipes with or without a Ni-interlayer [7], CrMo and CrMoV steels [8], API 5L X80 pipeline steel [9], and API 5L X70 steel [10]. These investigations have used microstructure analysis and fracture toughness testing to determine how hydrogen affects the mechanical characteristics of the steels. The results of these investigations provide important light on the connection between hydrogen exposure and carbon steel fracture toughness.
According to a recent notion advanced by certain experts, transmission costs may be reduced if oil and gas pipelines are built using high-strength steel. The potential to use pipes with thinner walls that can withstand higher pressures is assumed to be the cause of these savings. However, even with these benefits, there is a known concern that pipeline steels of a higher grade are more prone to HE. This phenomenon can significantly compromise the pipeline’s structural integrity [11,12]. Scientists and engineers are actively developing solutions, including new materials resistant to embrittlement and methods to reduce the effects of HE on current materials [13]. Significant investments from important worldwide companies in hydrogen innovation further highlight the growing momentum supporting hydrogen as a sustainable energy alternative. Meanwhile, greater emphasis is being placed on establishing laws and procedures that lessen the risks associated with HE. This demonstrates the worldwide effort to advance hydrogen energy while protecting the infrastructure from weaknesses [14]. Research into HE is ongoing, but a complete understanding is still needed. Hence, more experimental and modeling studies are required to draw conclusions.

1.2. Problem Statements and Mitigation Strategies

With the growing global emphasis on clean energy, hydrogen has gained significant attention due to its zero-emission potential. However, when hydrogen is introduced into natural gas pipelines, HE presents a major challenge. These pipelines are primarily constructed from carbon steel, highly susceptible to HE. Several critical research and knowledge gaps remain, particularly in developing accurate and reliable models for predicting the service life of pipelines operating with hydrogen-containing natural gas. Such predictive models are essential for optimizing operating conditions, selecting appropriate pipeline materials, and formulating effective HE mitigation strategies. Key operating parameters such as pressure, temperature, hydrogen concentration, and pressure fluctuations play a central role in determining pipeline service life. Adjusting hydrogen concentration can extend service life to the desired level, while minimizing detrimental pressure fluctuations through effective maintenance planning and enhancements in pipeline reliability can further mitigate HE risk.
For newly constructed pipelines, the selection of suitable materials is vital. Given the limited field experience with hydrogen transport, predictive modeling enables the evaluation and comparison of materials based on their performance under hydrogen exposure, facilitating the selection of cost-effective yet HE-resistant options. Moreover, inhibition strategies apply to both new and existing pipelines. Prior research has demonstrated that certain gas impurities, including oxygen and carbon dioxide, exhibit HE-inhibiting properties. By leveraging predictive models, the concentrations of such impurities can be optimized to maximize their inhibiting effects, thereby enhancing the pipeline’s resistance to hydrogen-induced degradation.

1.3. ML Model Capability and Applicability

Each ML model exhibits distinct capabilities and applicability in predicting the critical mechanical properties of metals exposed to hydrogen environments, particularly when faced with limited datasets from diverse sources and varying environmental conditions and testing parameters. For instance, support vector machines (SVMs) are powerful classifiers well-suited to handling non-linear and high-dimensional data, making it particularly effective for fracture toughness modeling, where material properties and environmental variables often interact in complex, non-linear ways. However, SVM performance depends heavily on the selection of appropriate kernel functions and careful tuning of model parameters (e.g., regularization and kernel coefficients). Additionally, SVMs are sensitive to feature scaling and outliers, which can significantly impact their predictive accuracy [15,16].
Although tree-based modeling techniques, such as decision trees, random forests, or gradient boosting, share some similarities, they exhibit different capabilities and features that suit their respective applicability. For instance, random forests exhibit enhanced model robustness against overfitting and noise in datasets. This technique is particularly effective in handling missing data and identifying key predictors through its inherent feature importance measures [17]. Due to their interpretability and low variance, random forests are well-suited to modeling complex physical systems characterized by high-dimensional and nonlinear data structures [18,19]. Gradient boosting methods, such as XGBoost and CatBoost, offer superior predictive accuracy by iteratively improving upon residual errors from previous models [20]. These methods are particularly well-suited to capturing complex nonlinear relationships and evaluating the relative importance of input features. XGBoost offers scalability and efficiency for large-scale structured data applications [21], while CatBoost introduces an unbiased approach for handling categorical variables, thereby enhancing model accuracy and robustness [22]. Decision trees, while prone to overfitting when used in isolation, serve as a fundamental building block in ensemble learning methods. Their primary advantages lie in their simplicity and interpretability, which are particularly valuable in fields such as materials science, where model transparency facilitates physical validation and domain-informed analysis [23].
K-nearest neighbors (KNN) and artificial neural network (ANN) models also possess specialized learning features and prediction capabilities. KNN is simple and intuitive, but struggles with scalability and sensitivity to feature distribution. It is primarily used as a baseline model due to its reliance on local data structure, which can be distorted in high-dimensional datasets [24]. Nonetheless, it is efficient in understanding local variation in the predicted feature. ANNs are highly effective in modeling complex, nonlinear relationships within high-dimensional datasets, such as stress–strain behavior, microstructural variability, and the effects of environmental exposure on fracture toughness. While ANNs typically require large volumes of training data and are computationally demanding, they have demonstrated strong predictive capabilities when sufficient data are available [25,26].

1.4. Advances in ML Modeling for HE Analysis

Understanding the fracture behavior of carbon steel is crucial for maintaining the structural integrity and reliability of components in hydrogen environments. Lee and Gangloff’s study [27] has enhanced our understanding of hydrogen’s impact on ultra-high-strength steel by focusing on measuring and modeling hydrogen-assisted cracking. Their findings reveal the mechanisms by which fracture toughness is reduced in hydrogen environments. A significant advancement in recent research is integrating ML and numerical simulations to study HE. By combining ML methods with experimental data, predictive models of fracture toughness can be developed. These innovations are essential for evaluating the effects of hydrogen on the fracture resistance of carbon steel and offer valuable insights into how to counteract its impacts on high-strength steels.
Hoar et al. [28] utilized ML, specifically an RF model, to predict fracture toughness in stainless steels embrittled by hydrogen isotopes, leveraging extensive experimental data accumulated over decades at the Savannah River National Laboratory. The model accurately predicted fracture toughness, although there were instances of overfitting due to limited data. Thankachan et al. [29] used ANNs to examine how hydrogen gas affects the mechanical characteristics of aluminum alloys, and the results showed a strong correlation (0.99) between yield strength, ultimate tensile strength, and elongation between the anticipated and real values. However, the scope of their research is limited to determining how susceptible aluminum alloys are to embrittlement in hydrogen conditions.
According to Kim et al. [30], alloying elements and testing conditions influence the HE index of austenitic steels, identifying Ni and Mo as critical factors. Based on the testing of ML models, including random forest (RF), linear regression (LR), Bayesian ridge (BR), and support vector machine (SVM) models, the RF model proved to be the most accurate. This approach is aimed at helping develop steels optimized for hydrogen applications.
Most recently, Nayem et al. [31] explored HE in carbon and low-alloy steels, considering seven machine learning (ML) techniques to predict the tensile property (reduction of area) of carbon steel. Among these, the CatBoost model emerged as the most effective, demonstrating high predictive accuracy with key metrics including a mean absolute error (MAE) of 7.32 and a coefficient of determination (R2) of 77.62% and 72.50% for training and test data. This research highlights the potential of ML in advancing hydrogen energy infrastructure by pinpointing critical factors affecting HE. In another study [32], the performance of a two-parameter modeling approach for predicting fracture behavior was explored, demonstrating ongoing efforts to enhance the understanding and prediction of fracture toughness in materials.
Research into the effects of hydrogen on the fracture characteristics of carbon steel encompasses a complex field that involves advanced modeling techniques, microstructural analysis, and experimental testing. This paper investigates carbon steel’s fracture toughness under pressurized hydrogen gas conditions, using various supervised ML methods to determine the most effective model for predicting HE. Our study is distinctive because it analyzes the impact of hydrogen gas exposure on the embrittlement of carbon steel under conditions that simulate actual field environments. This represents the first attempt to apply ML techniques to evaluate the susceptibility of carbon and low-alloy steels to HE in hydrogen gas environments, specifically their fracture toughness. This research addresses a significant gap in the existing literature and provides crucial insights directly applicable to the design and maintenance of pipelines for hydrogen transportation. Doing so significantly enhances the knowledge required for the safe and efficient transportation of hydrogen fuel, thereby promoting the development of sustainable energy solutions.

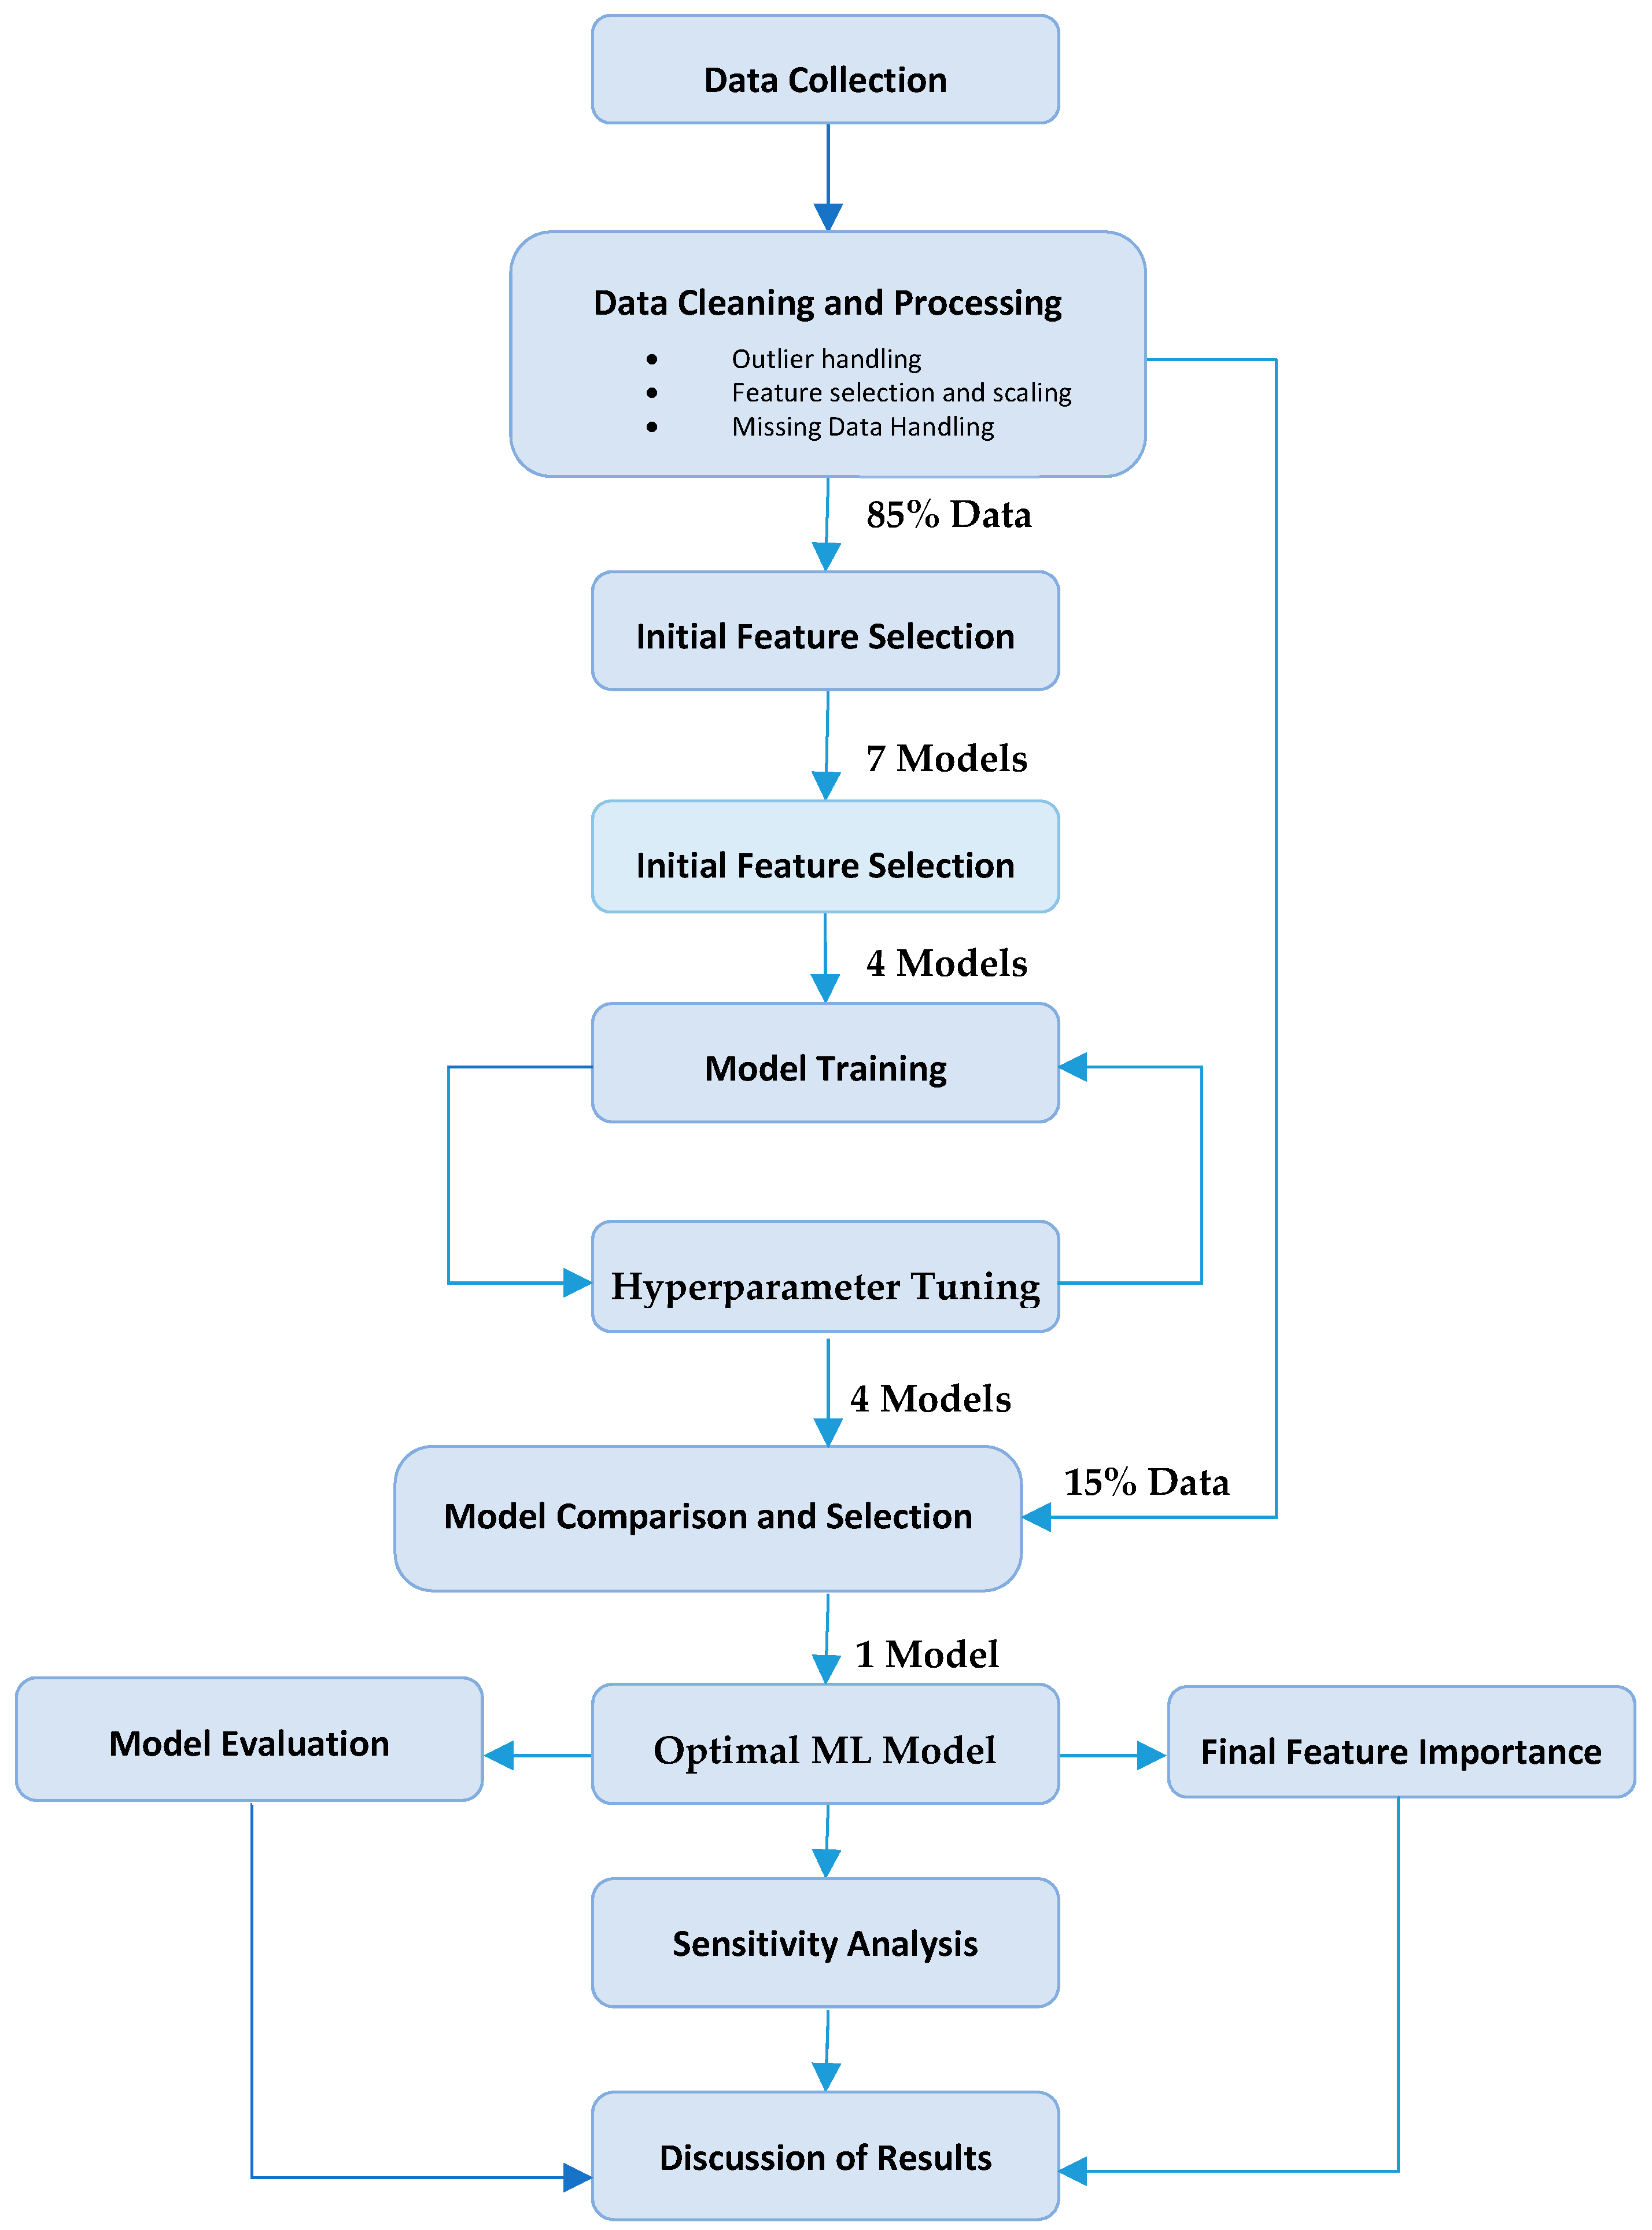
2. Modeling Approach

Figure 1 summarizes the comprehensive modeling process utilized in our research, structured around seven pivotal stages (data collection, data cleaning and processing, feature importance analysis, model prescreening, model training and tuning, model comparison and selection, and modeling evaluation and sensitivity analysis) designed to advance our predictive capabilities regarding fracture toughness. The model development began with an intensive data collection and organization phase. We prioritized maintaining data integrity during this initial stage, which involved implementing stringent data cleaning protocols and sophisticated feature engineering techniques. Special attention was given to managing outliers, scaling variables appropriately, and addressing incomplete data to ensure a solid foundation for subsequent analyses. The modeling phase commenced with the consideration of seven distinct ML models: support vector machine (SVM), random forest (RF), gradient boosting (GB), k-nearest neighbors (KNN), artificial neural network (ANN), decision tree (DT), and CatBoost models. This variety allowed us to explore a wide range of predictive approaches.
We divided our dataset into an 85% segment for training purposes and a 15% segment reserved for testing. This strategic division was crucial for validating the models’ effectiveness. A key aspect of our workflow is to identify most influential features impacting fracture toughness. This step involved training and tuning of the models to perform feature importance analysis and selection processes that helped us determine the variables most critical to our model output.
The feature importances guided our model evaluation and screening following which we selected four models based on their ability to consistently identify key predictors such as hydrogen pressure and yield strength as the most important features affecting fracture toughness. The models selected for further refinement were KNN, DT, RF, and GB.
These four models underwent further refinement through rigorous training and a parametric tuning (i.e., hyperparameter tuning) process tailored to enhance the precision and accuracy of predictions. Each model was evaluated based on a comprehensive set of performance metrics (regression coefficient, error levels, degree of overfitting, and feature importance rating), allowing us to identify and select the model with the most robust predictive power and the lowest error level. After choosing the best model, the final phase of our study involved a detailed model evaluation and sensitivity analysis. This analysis was crucial for testing the model’s performance across various scenarios, thus ensuring its reliability and robustness. Through this analysis, we could confirm the model’s ability to consistently predict fracture toughness under varying conditions, further confirming its validity. This process demonstrates our commitment to precision and meticulous research practices and emphasizes our findings’ reliability and potential impact in the broader field of materials science.

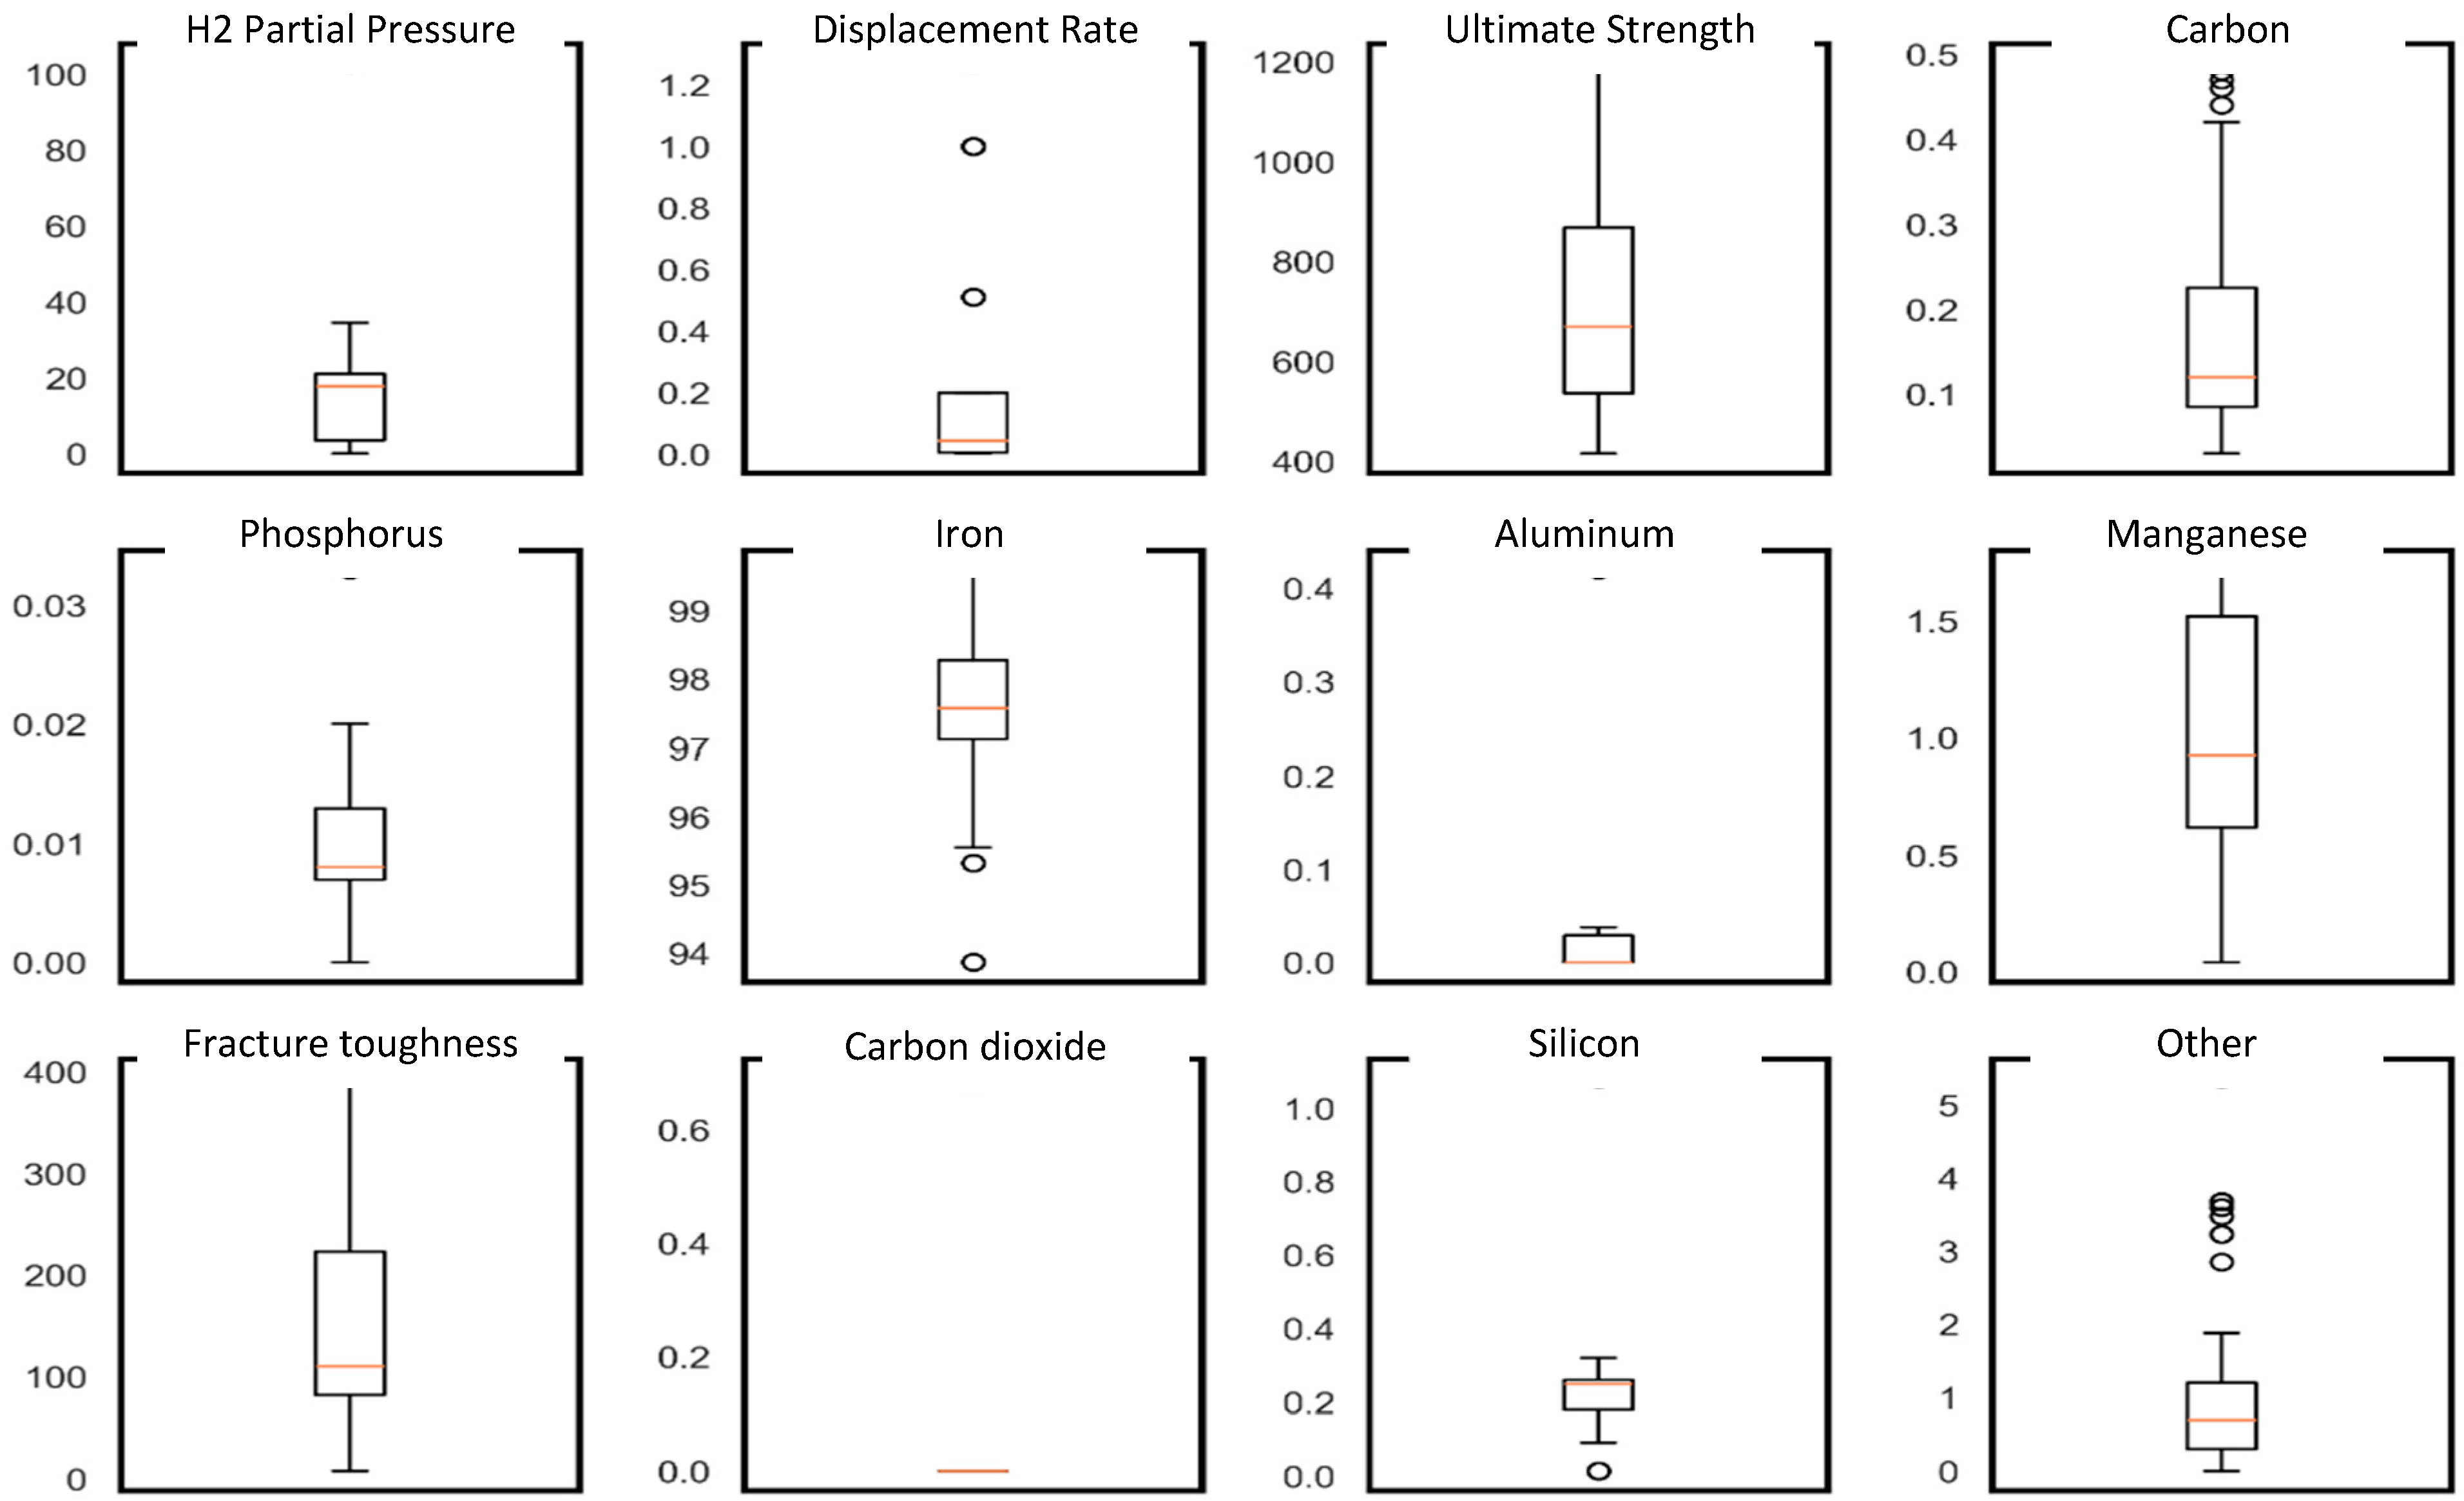
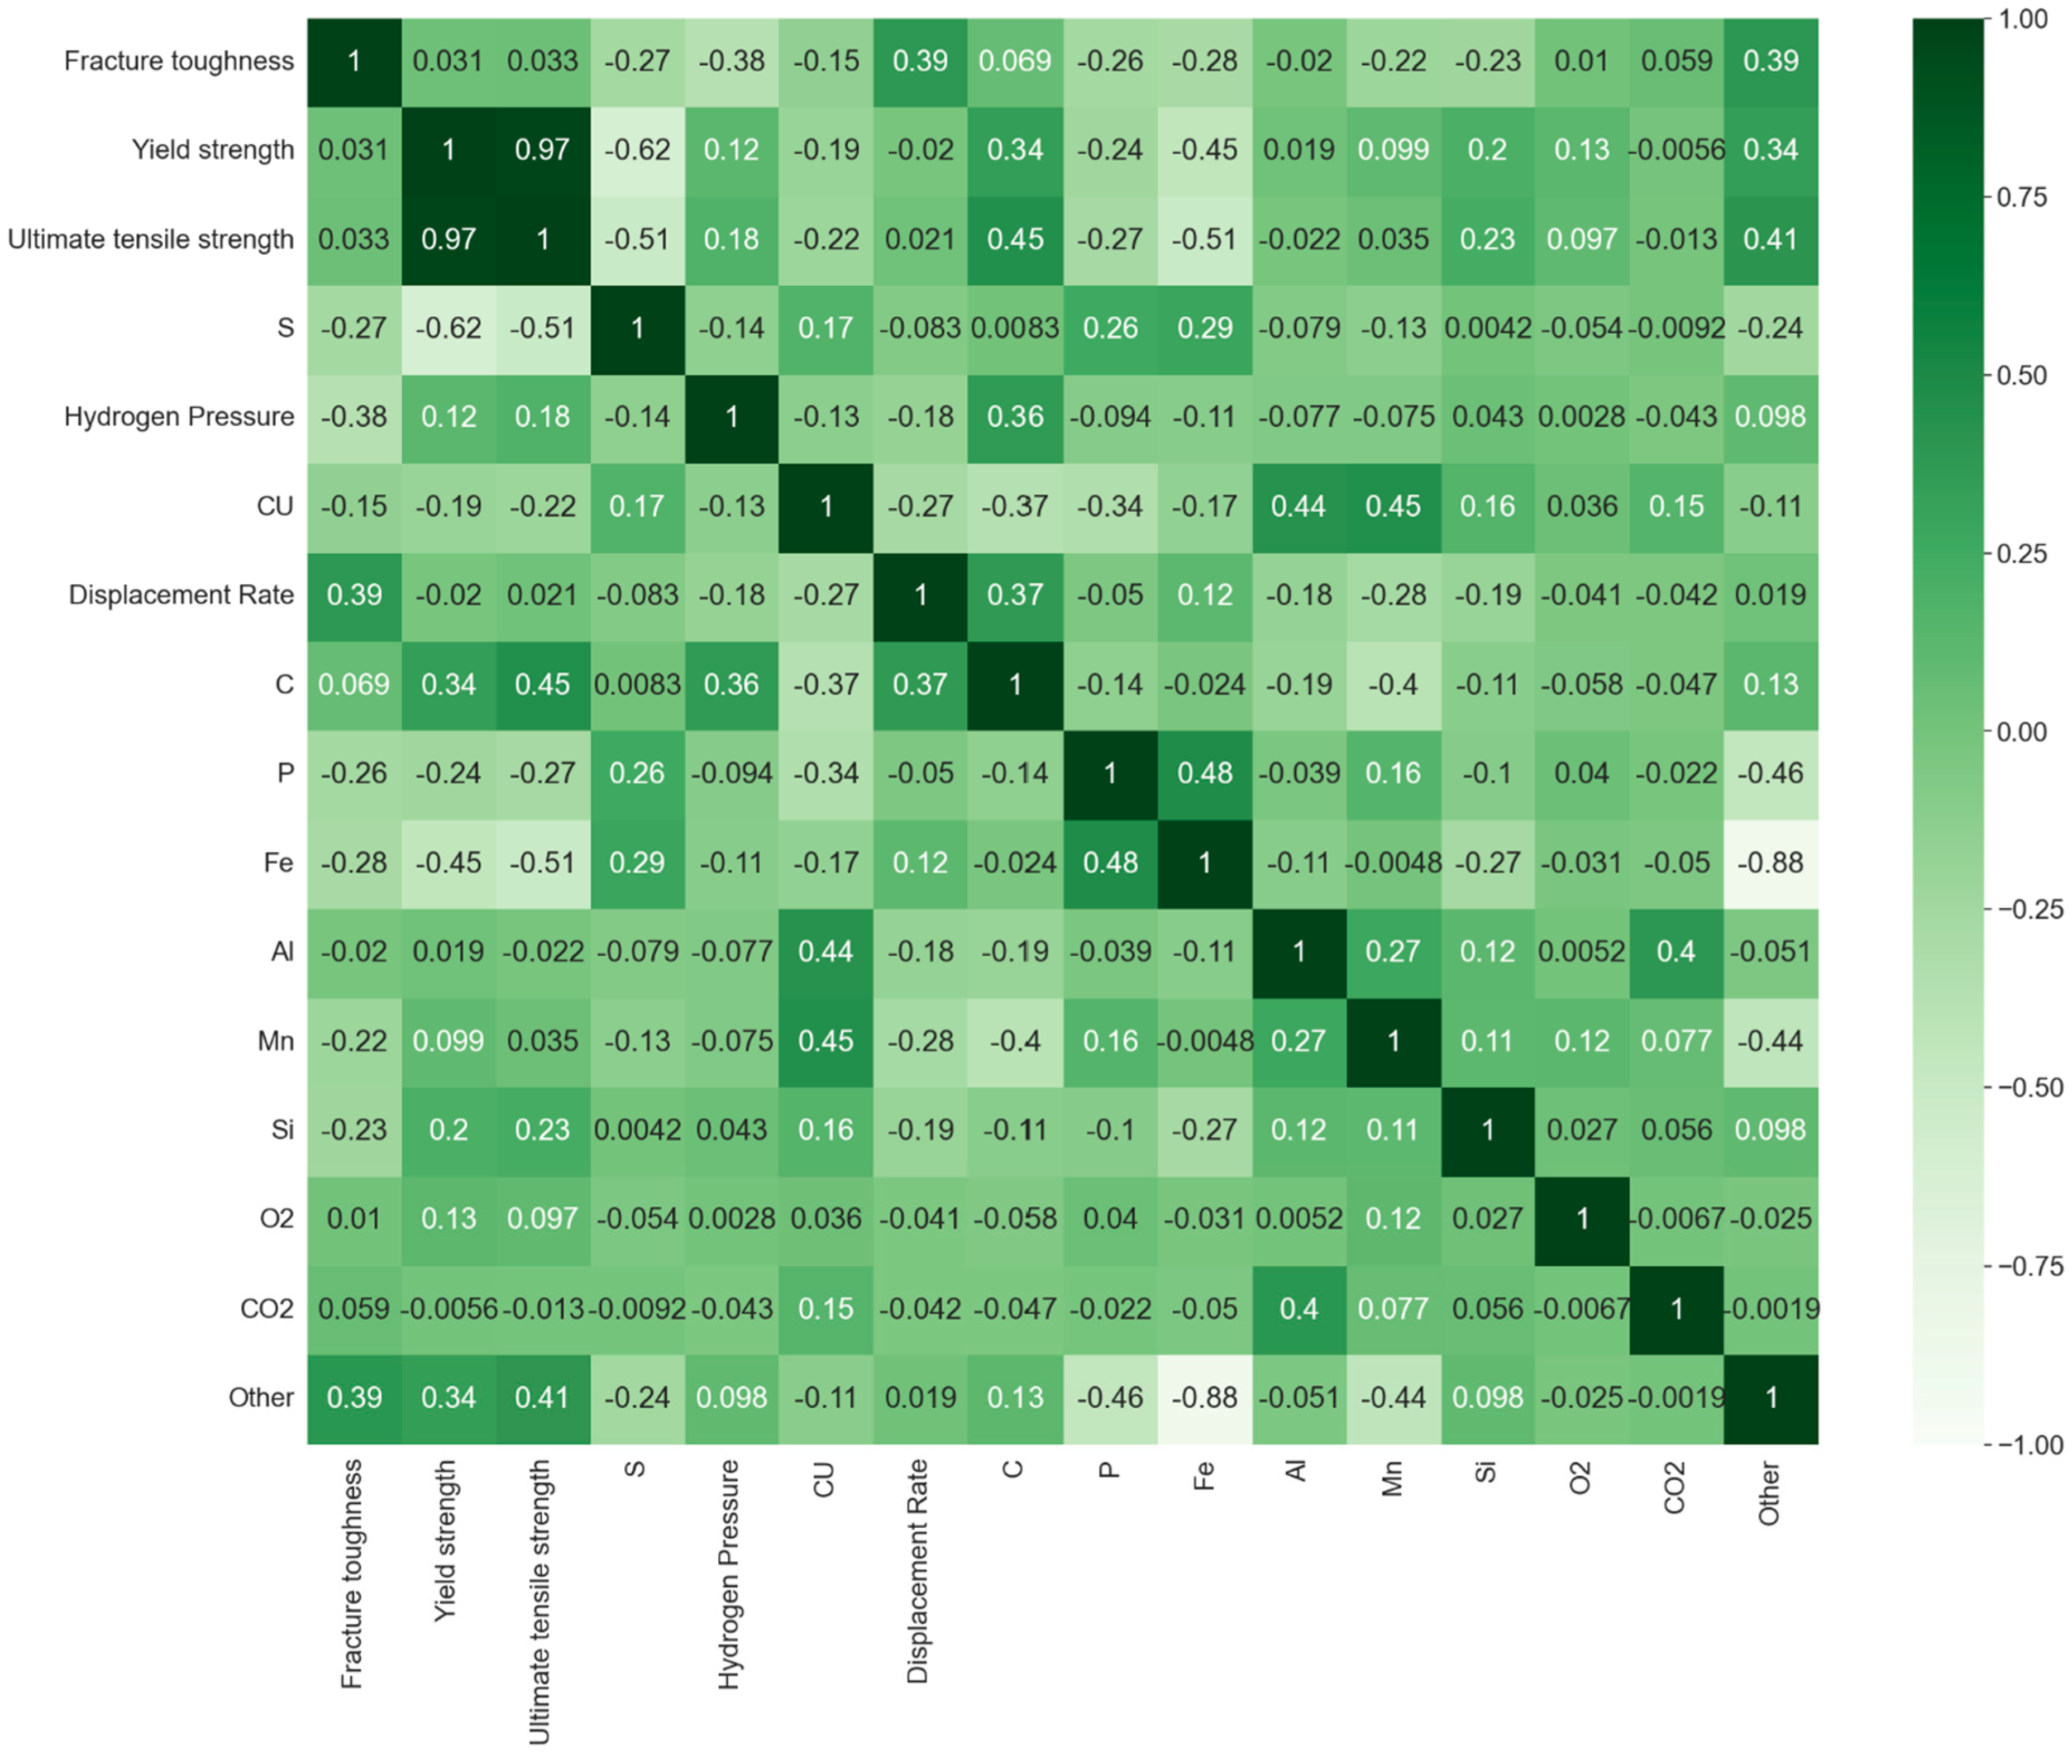
2.1. Database Creation and Exploratory Data Analysis

The database was developed from datasets meticulously extracted from credible sources [8,33,34,35,36,37,38,39,40,41,42,43,44,45,46,47], which include peer-reviewed publications, technical reports from research organizations, and conference proceedings from professional meetings. As shown in Table 1, the dataset primarily contains data from fracture toughness tests conducted in various settings under ambient temperature conditions, using pressure-charged specimens with an emphasis on carbon and low-alloy steels. Fracture toughness values obtained from different sources were not normalized across studies, as all measurements were conducted in accordance with the relevant standardized testing procedures (e.g., ASTM E1820 [48] or equivalent). These standards (Table 1) are designed to ensure consistency and comparability of results across different laboratories, testing setups, and specimen types. Also, environmental differences were controlled by selecting data from experiments conducted under ambient temperature conditions and using specimens that were exposed to gaseous hydrogen.
The database covers a wide range of experimental conditions, including air, natural gas, high-pressure hydrogen gas, and gaseous impurities such as oxygen and carbon dioxide. It is methodically organized and contains various information, such as the materials’ mechanical characteristics, chemical composition, and the testing environment. At first, the database contained data from 210 different fracture toughness tests covering 18 different characteristics or features (Table 2). The database underwent a rigorous data-cleaning procedure, reducing the number of datasets from 210 to 180 in preparation for ML analysis. Through this improvement, the quality and reliability of the database were enhanced, and the issues with incomplete datasets were resolved.

2.2. Data Cleaning and Outlier Handling.

The data-cleaning process began with preliminary exploratory data analyses, which included univariate assessments (using boxplots and histograms) and multivariate analyses (using cross-plots). Missing data were eliminated from the analyses. All input variables were then normalized. Outliers in our dataset were handled on a case-by-case basis. Given the inherent variability and wide range of material attributes, we view outlying material performances as crucial data that reflect the inherent variability of material reactions. Using this approach, we could more accurately and comprehensively understand material behavior by including these extreme but legitimate observations. Thus, we could ensure the model provides reliable and accurate fracture toughness predictions. Box plot visualizations depicting the data distribution are presented in Figure 2.

2.3. Feature Selection

A crucial element in ML is feature selection, which calls for recognizing and extracting important characteristics from unprocessed data. After a thorough investigation, 18 factors (Table 2) were considered to be crucial for evaluating fracture toughness in carbon and low-alloy steels. A subset of 15 parameters was first chosen to identify probable input characteristics. These parameters included the concentrations of Fe, C, Mn, P, S, Si, Al, Cu, O2, CO2, pressure, displacement rate, yield strength, ultimate strength, and other (i.e., concentration of minor alloying elements). Variables such as product form and heat treatment procedures were removed from the feature set because of inconsistent reporting and high level of incompleteness (about 65%).
However, metal fracture toughness is known to be controlled by heat treatment techniques used during metal manufacturing [51,52,53]. In order to independently assess the significance of heat treatment on fracture toughness, we conducted a variable importance analysis using 35% of the dataset that had complete records of the heat treatment variable. This was carried out using a random forest model. This analysis demonstrated that heat treatment is a weak contributor to HE, as shown in Figure 3. Hydrogen pressure is, by far, the most significant single feature, followed by yield strength and displacement rate. Steel composition including all the constituent elements, however, is the most important feature. This result is consistent with the findings of Nayem et al. [27], who also demonstrated that heat treatment accounts for less than 4% of the overall assessment of HE. This procedure allowed us to neglect heat treatment and use 15 input features for our subsequent analyses. Further investigation was undertaken to establish a relationship between these parameters, and the cross-correlation matrix plot (Figure 4) was then generated and used to investigate and illustrate the interdependency among these parameters.
Figure 4 illustrates that ultimate and yield strengths showed a strong positive correlation of 0.97, indicating these parameters are highly interrelated. Consequently, we decided to eliminate ultimate tensile strength (UTS) from the list and use yield strength as the primary mechanical characteristic of the material. This feature selection was mainly based on the frequent documentation and ready availability of yield strength data, significantly enhancing our model’s practicality and wider applicability. By employing a commonly available and extensively recorded parameter, our model gains increased versatility and user-friendliness, making it suitable for a broader range of real-world applications and datasets. After these modifications, 13 parameters (Fe, C, Mn, P, Al, Si, Cu, O2, CO2, displacement rate, hydrogen pressure, yield strength, and other) were selected as the input characteristics for the creation of the ML model. It should be noted that other presents total concentration of minor alloying elements with limited impact individually, such as molybdenum (Mo), nickel (Ni), chromium (Cr), niobium (Nb), and titanium (Ti).

2.4. Feature Scaling

The database used in our study has various parameters, all assessed in various scales or units. This might increase the likelihood of overfitting and lengthen the training period. The use of feature scaling is seen as crucial in overcoming these obstacles. We chose to evenly rescale the dataset using the standardization approach, often known as z-score normalization. This technique is especially useful for characteristics with different scales or units since it neutralizes any bias from these differences [54].

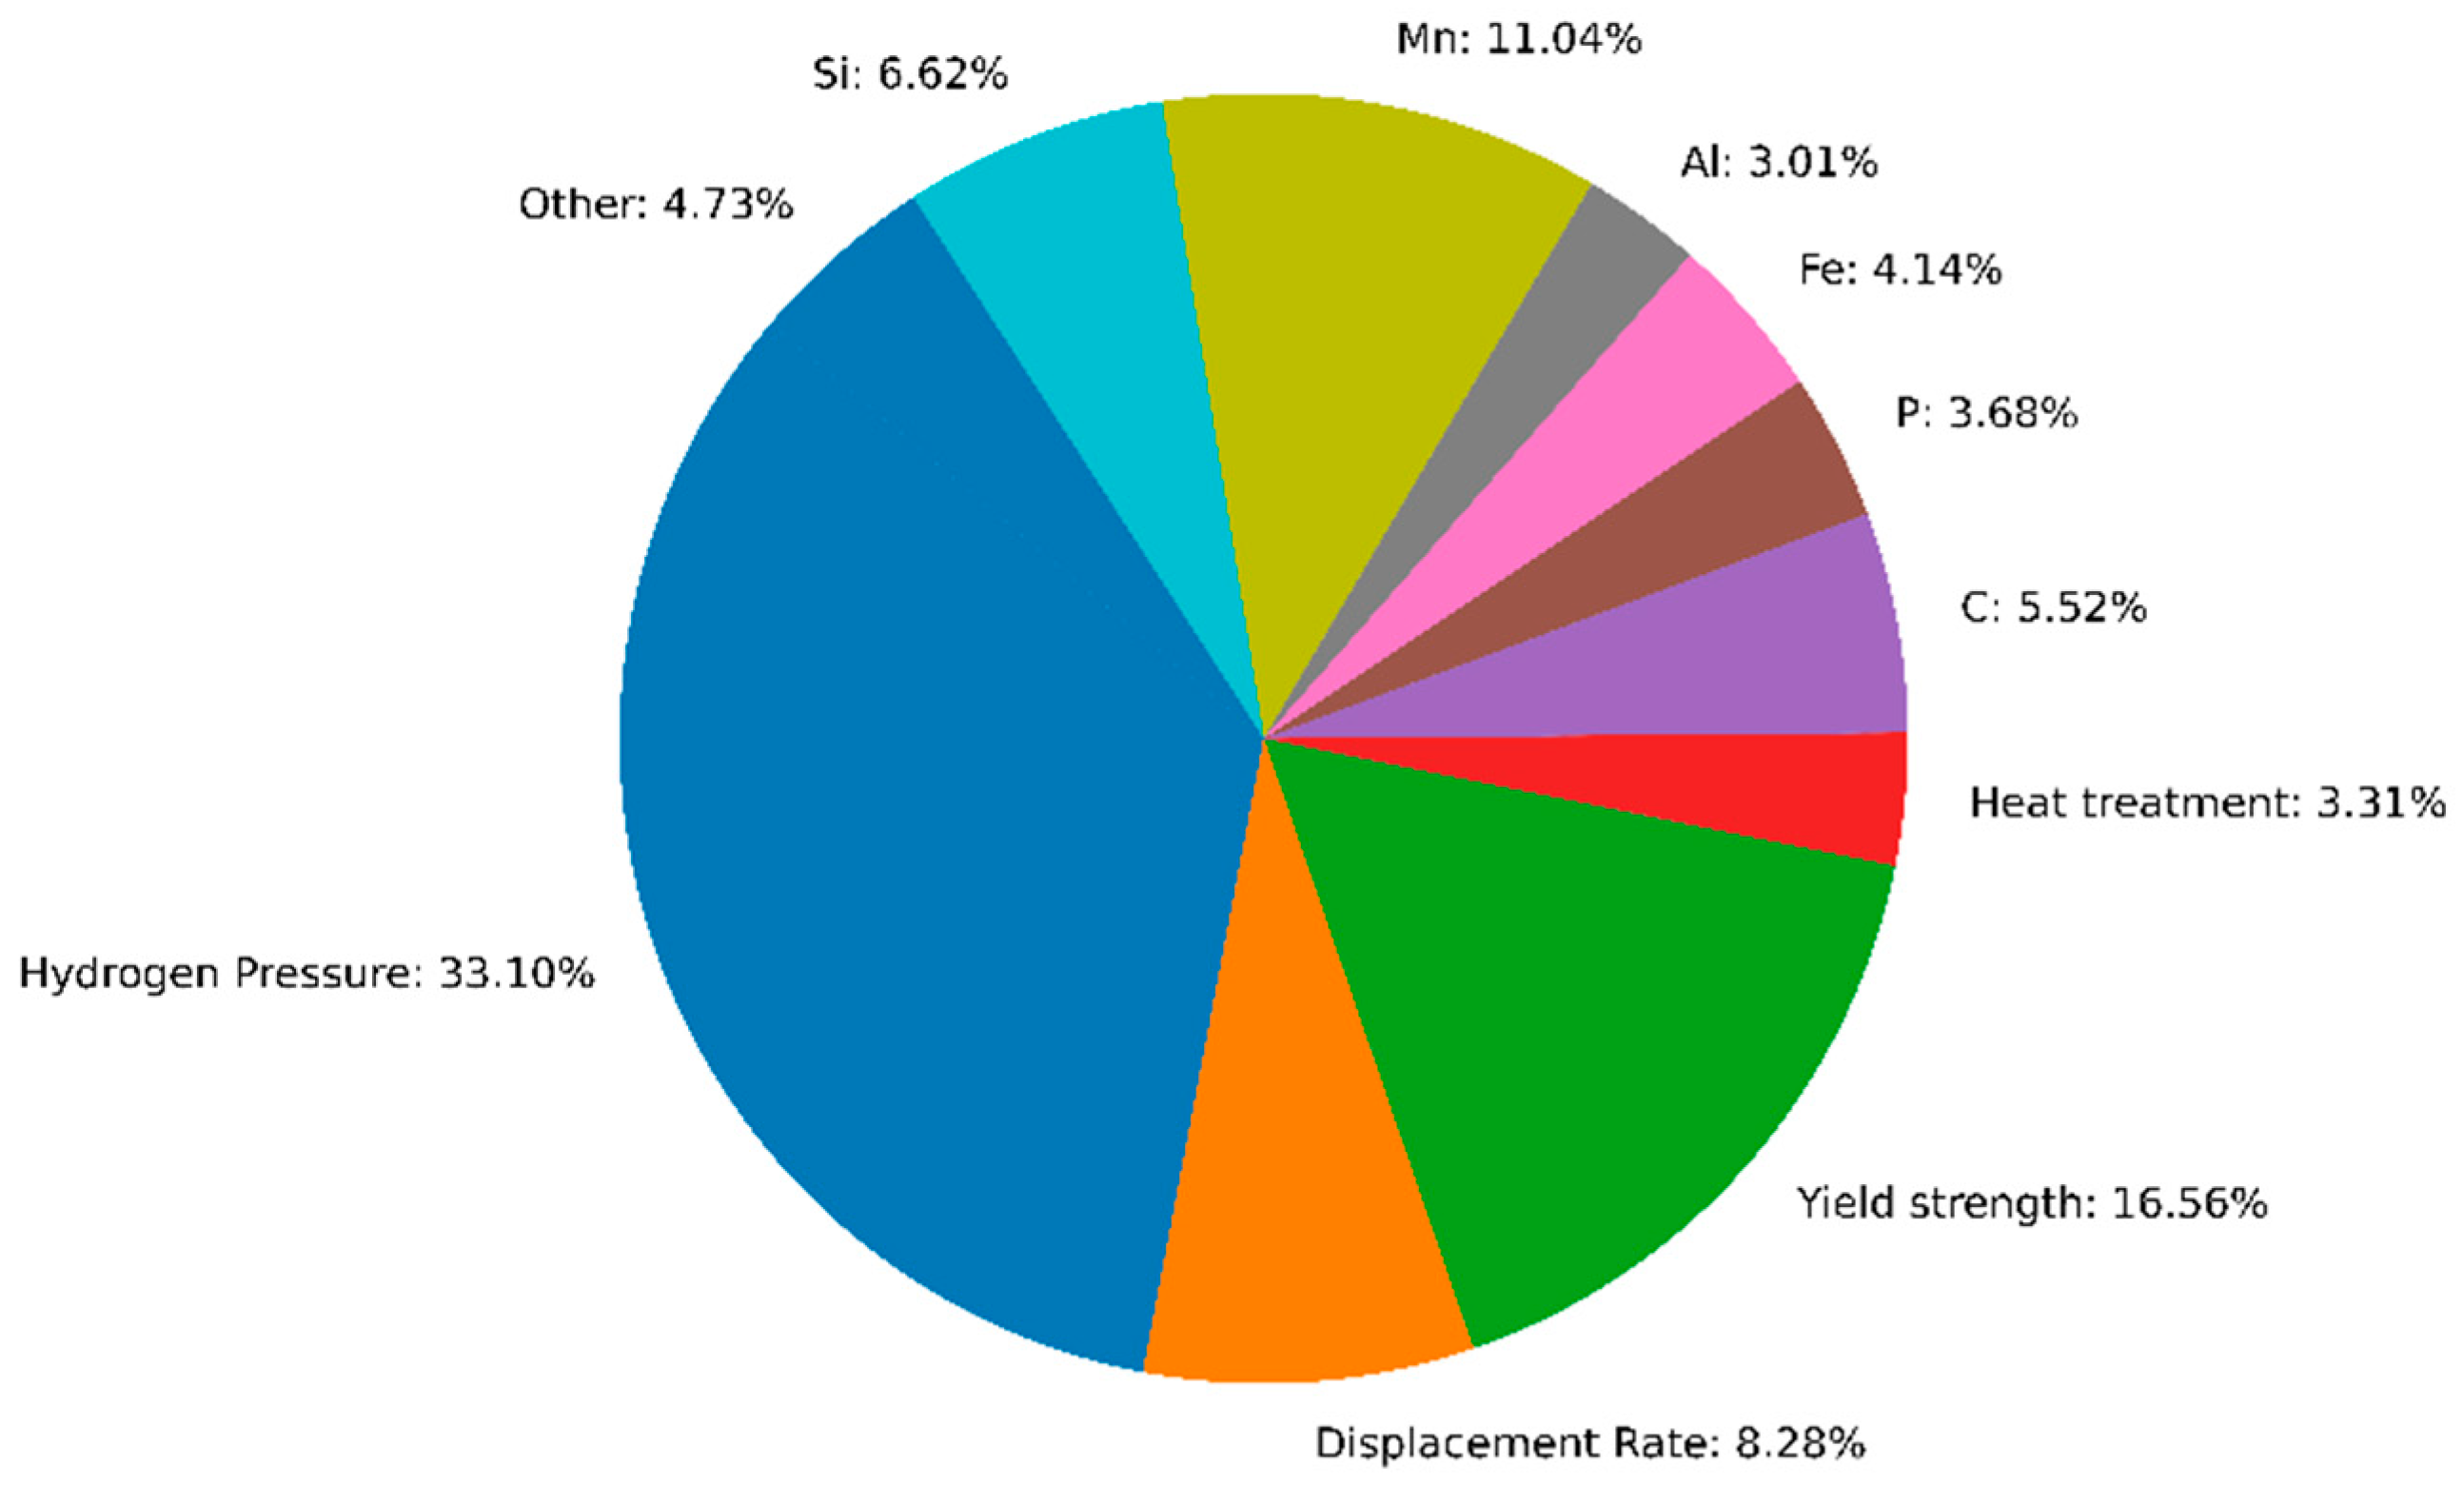
2.5. Model Screening and FI Analysis

The selection of the most suitable ML models for predicting fracture toughness in hydrogen environments was conducted through a feature importance (FI) analysis, as detailed in Table 3. Feature importance quantifies the influence of each predictor variable on the model’s predictive performance, thereby identifying the most critical factors affecting fracture toughness. ML models often provide different feature importance ratings for the same input data. The variation in the feature importance rating across different ML models results from the distinct ways each model learns patterns, handles feature interactions, and interprets relationships in the data. Models like support vector machines assume simple, often linear relationships between features and the target variable. As a result, they highlight features that show strong, direct correlations. In contrast, tree-based models such as decision trees, random forests, or gradient boosting can capture complex, nonlinear relationships and interactions between features. This allows them to identify features that may not be significant on their own but become important when combined with others.
For conducting a preliminary screening, seven ML models were initially trained and optimized: random forest (RF), decision tree (DT), k-nearest neighbors (KNN), gradient boosting (GB), support vector machine (SVM), CatBoost, and artificial neural network (ANN) models. Each model assigned an importance score to individual predictor variables, and these scores were used to rank features based on their relative contribution [54] to fracture toughness predictions. The ranking approach involved comparing the feature importance scores across all models and determining the degree of agreement with the average ranking derived from all models. The model that demonstrated the closest alignment with this average ranking was considered the most reliable and was ranked as “1st”, signifying its ability to provide a balanced representation of feature importance. The remaining models were ranked accordingly based on their alignment with the average feature importance scores. The feature importance results (Table 3) identified hydrogen pressure and yield strength as the two most influential parameters in predicting fracture toughness. Models that consistently ranked these two features as the most important: KNN, GB, RF, and DT were selected for further evaluation. In contrast, SVM, CatBoost, and ANN highlighted different feature combinations that were inconsistent with experimental observations reported in the literature. As a result, these models were deemed unsuitable for predicting fracture toughness in hydrogen environments and were excluded from further analysis.

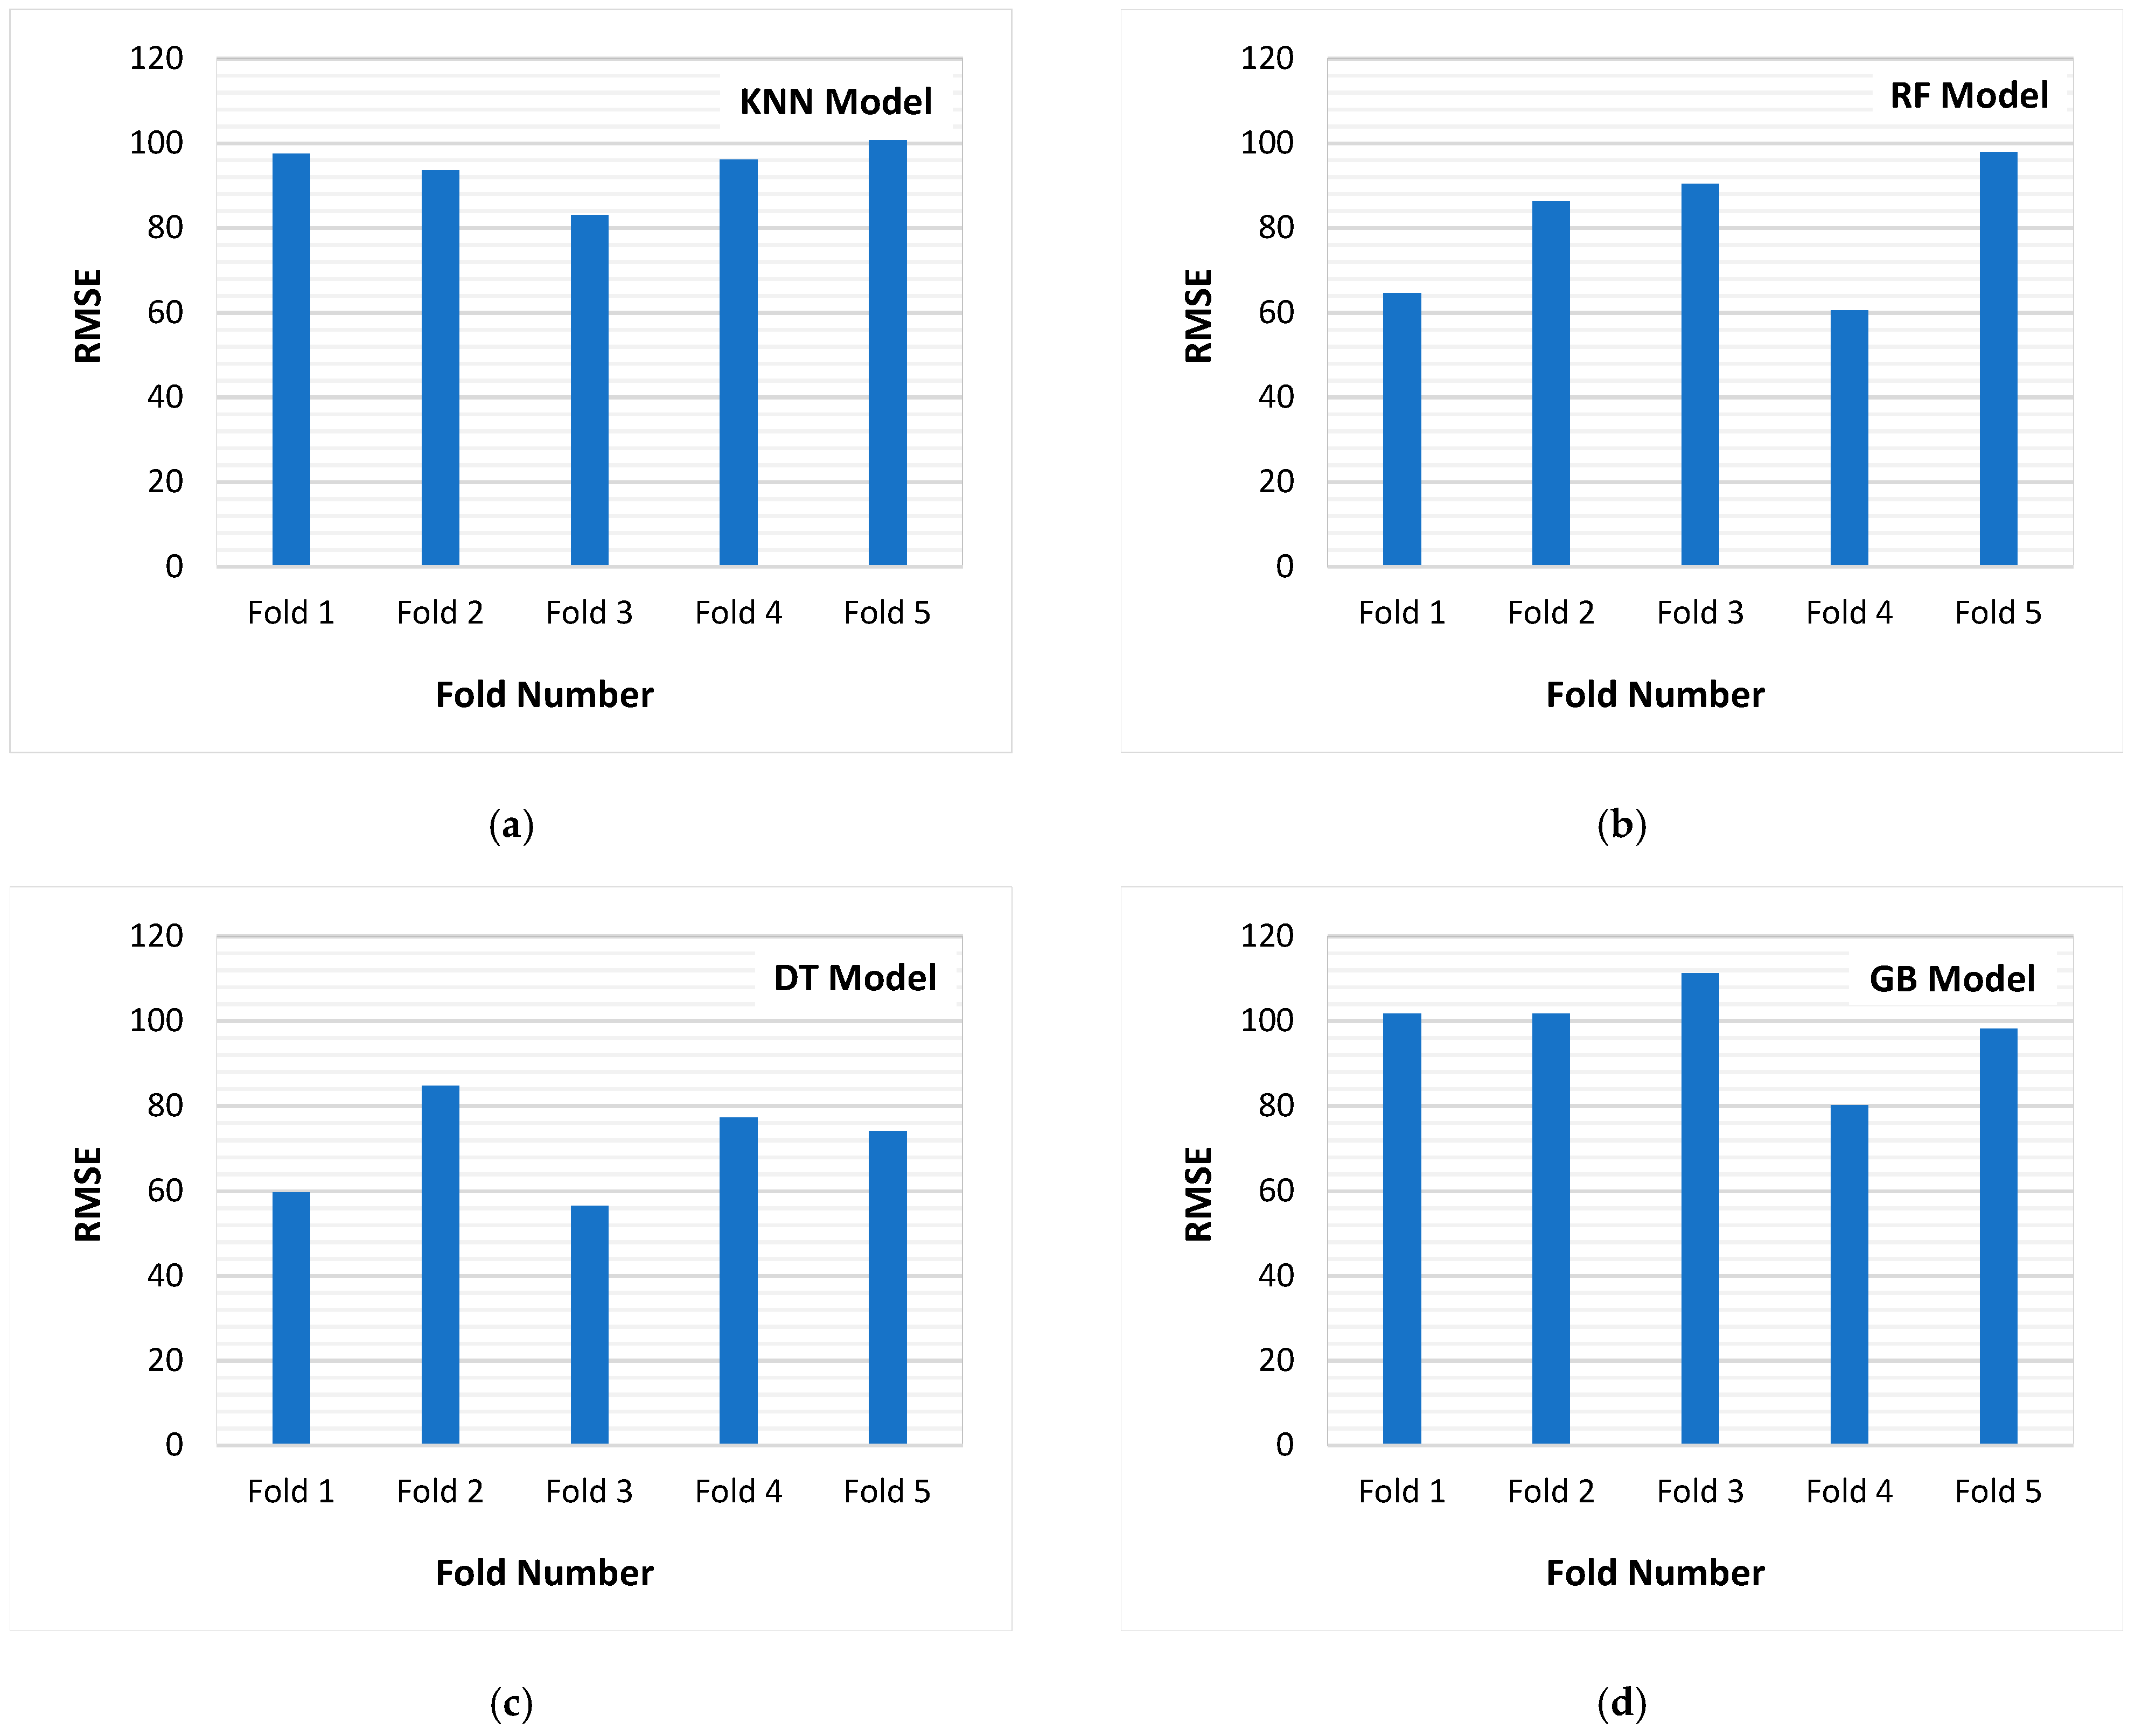
2.6. Model Cross-Validation

Further evaluation and comparison of ML models were conducted using 5-fold cross-validation to ensure robust performance assessment and mitigate the risks of overfitting. This approach systematically partitions the dataset into five equal subsets (folds), where each model is trained on four folds and tested on the remaining fold, rotating this process until all folds have served as the validation set. This methodology enhances the reliability of performance evaluation by providing a comprehensive assessment of the model’s predictive ability across different data partitions [54]. Hyperparameter tuning presented in Appendix A (Table A1) was performed using grid search optimization, systematically exploring a range of parameter combinations to determine the best-performing configuration for each model. Combining grid search and cross-validation ensures the models are fine-tuned for optimal accuracy and generalizability.
Figure 5 presents the root mean square error (RMSE) values for the selected ML models (KNN, RF, DT, and GB) across the five cross-validation folds. RMSE was chosen as the evaluation metric due to its sensitivity to large errors, making it an effective measure for assessing model performance in predicting fracture toughness. The KNN model (Figure 5a) exhibited the lowest variation in RMSE across folds, indicating greater stability and higher predictive reliability. In contrast, the other models exhibited significant fluctuations in RMSE values, indicating higher sensitivity to data partitioning and potential issues of overfitting or underfitting. The relatively lower RMSE values and consistent performance of KNN across all folds validate its superior predictive accuracy and robustness. The findings underscore the effectiveness of cross-validation and hyperparameter tuning in optimizing model performance while minimizing overfitting risks.

2.7. Model Performance

Model performance was evaluated using multiple statistical metrics, as presented in Table 4, to determine the most suitable machine learning (ML) model for predicting fracture toughness in hydrogen-exposed steels. The assessment criteria included the coefficient of determination (R2), mean absolute error (MAE), and root mean square error (RMSE), each providing a distinct measure of predictive accuracy and generalization capability. The primary indicators of model accuracy were MAE and RMSE, where lower values denote reduced deviation between predicted and actual observations, signifying superior predictive performance. The k-nearest neighbors (KNN) model exhibited the lowest MAE (25.95) and RMSE (33.57), suggesting that it produced the most precise predictions among the evaluated models. Conversely, the decision tree (DT) model displayed the highest RMSE (44.43) and MAE (33.99), indicating greater prediction error.
The coefficient of determination (R2) was analyzed for both training and testing datasets to quantify how well each model explains variance in the data. Higher R2 values indicate a better fit, with KNN achieving the highest R2 for both training (0.85) and testing (0.84), signifying strong predictive capability. The RF, DT, and GB models exhibited slightly lower R2 values, indicating reduced explanatory power. Moreover, the difference between training and testing R2 values (ΔR2) was used to assess overfitting. A smaller ΔR2 suggests that the model generalizes well across different datasets, whereas a larger ΔR2 indicates that the model may have learned patterns specific to the training data, reducing its ability to make accurate predictions on unseen data. The KNN and RF models both exhibited the smallest ΔR2 (0.01), implying minimal overfitting and strong generalization capability. In contrast, the DT model had the highest ΔR2 (0.05), suggesting a greater tendency to overfit.

2.8. Model Comparison and Selection

The selection of the most suitable model for predicting fracture toughness in a hydrogen environment was conducted through a comprehensive evaluation of multiple performance parameters. The assessment methodology involved ranking models based on statistical metrics, cross-validation performance, and examining feature importance ratings, as summarized in Table 5. The KNN model ranked first across all statistical metrics, indicating superior predictive capability with minimal overfitting. In contrast, the DT model consistently ranked last, demonstrating the lowest predictive accuracy. To ensure the models’ generalization ability, a 5-fold cross-validation approach was implemented, and the models were ranked based on their cross-validation performance. KNN exhibited the highest ranking, confirming its robustness across multiple data partitions. The GB and RF models ranked second and third, respectively, while the DT model ranked last, further supporting its lower predictive reliability. The models were also evaluated based on their ability to prioritize key predictive features, ensuring alignment with experimental findings. All models identified hydrogen pressure and yield strength as the most influential parameters, corroborating literature-reported experimental observations. Models with stable feature importance rankings were preferred, reinforcing the selection of KNN as a more reliable model. Consequently, KNN was selected as the optimal model, while DT was deemed the least suitable due to its lower accuracy and higher prediction variability.

2.9. Model Applicability and Limitations

Machine learning is an empirical modeling approach, and as such, its applicability is inherently constrained by the range of input parameters (Table 1) used during model training. Therefore, the model’s predictions are most reliable for steels whose mechanical properties and elemental compositions fall within the bounds of the training dataset. For example, while the current model may predict the fracture behavior of X100 steel in a hydrogen environment, this prediction is only valid if the material properties of X100 steel lie within the range captured during training. Steels with properties significantly outside this range, such as duplex or ultra-high-strength steels, may require additional data and model retraining to ensure accurate predictions.

3. KNN Modeling and Evaluation

3.1. Model Development

The KNN method is a simple, non-parametric approach to regression and classification. It generates predictions by considering k numbers of the closest data points in the feature space to a given input [55]. The forecast is then based on the average of these neighbors or the majority vote. KNN requires extensive preprocessing, necessitating suitable k values and a closeness (distance) evaluation method. Hence, considerable effort is devoted to hyperparameter tuning to determine the optimal k value. Also, data normalization is necessary to ensure that every characteristic contributes equally to distance computations [55]. By combining these techniques, KNN makes accurate predictions, providing resilience against noisy data.

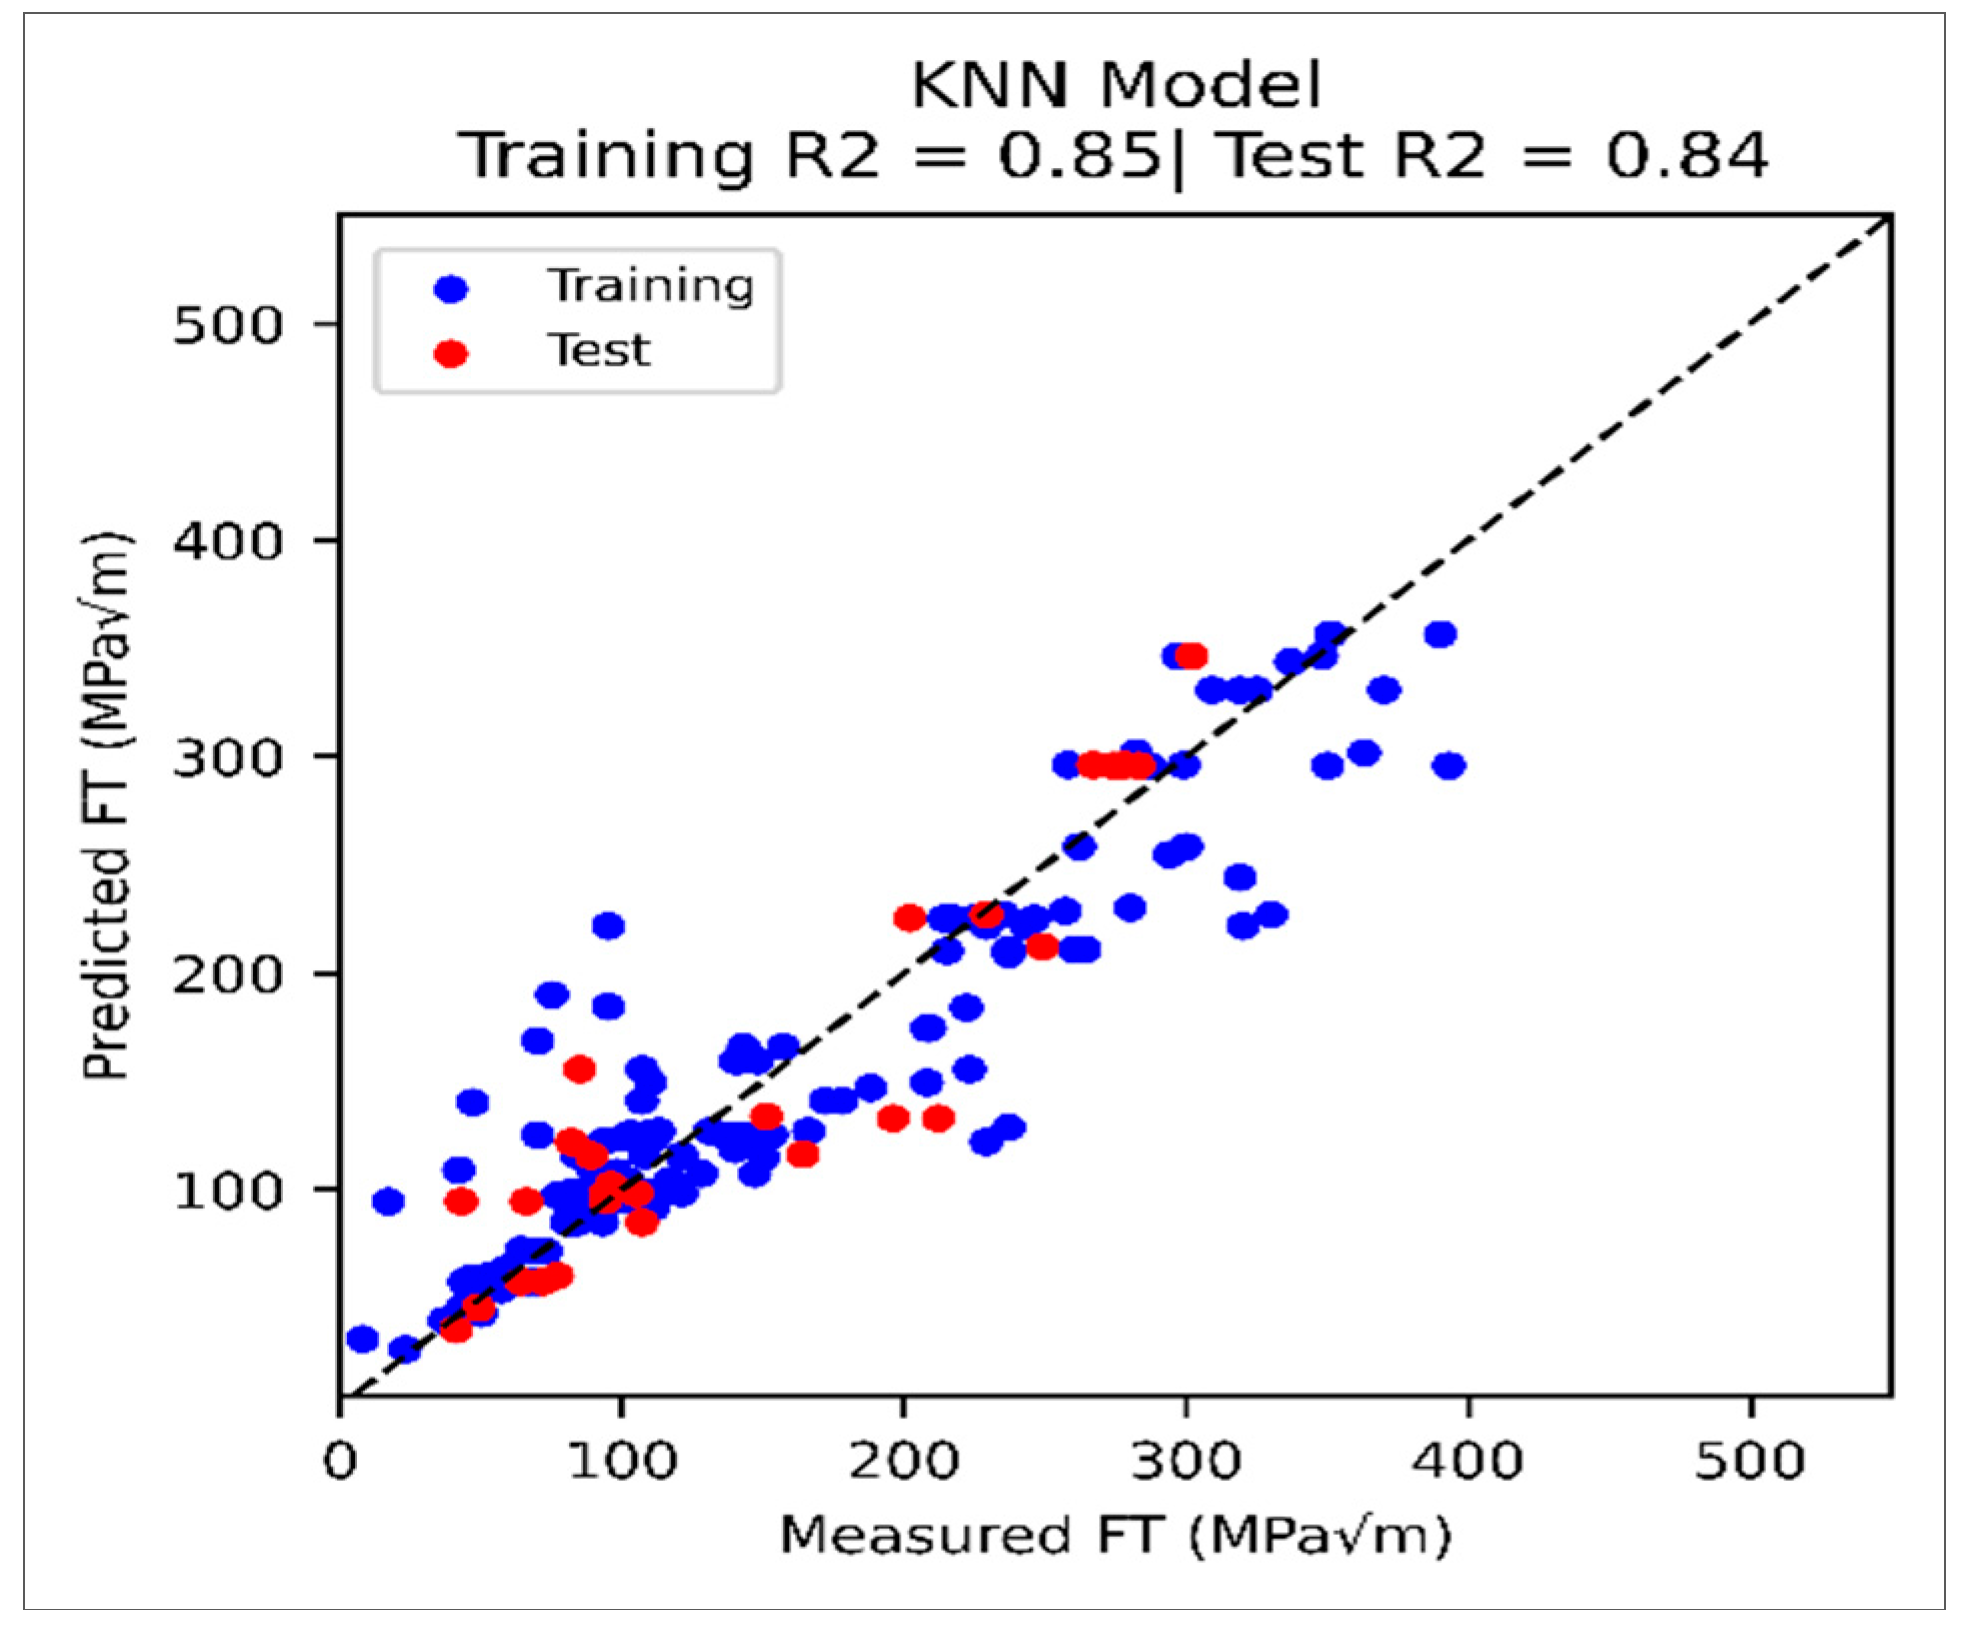
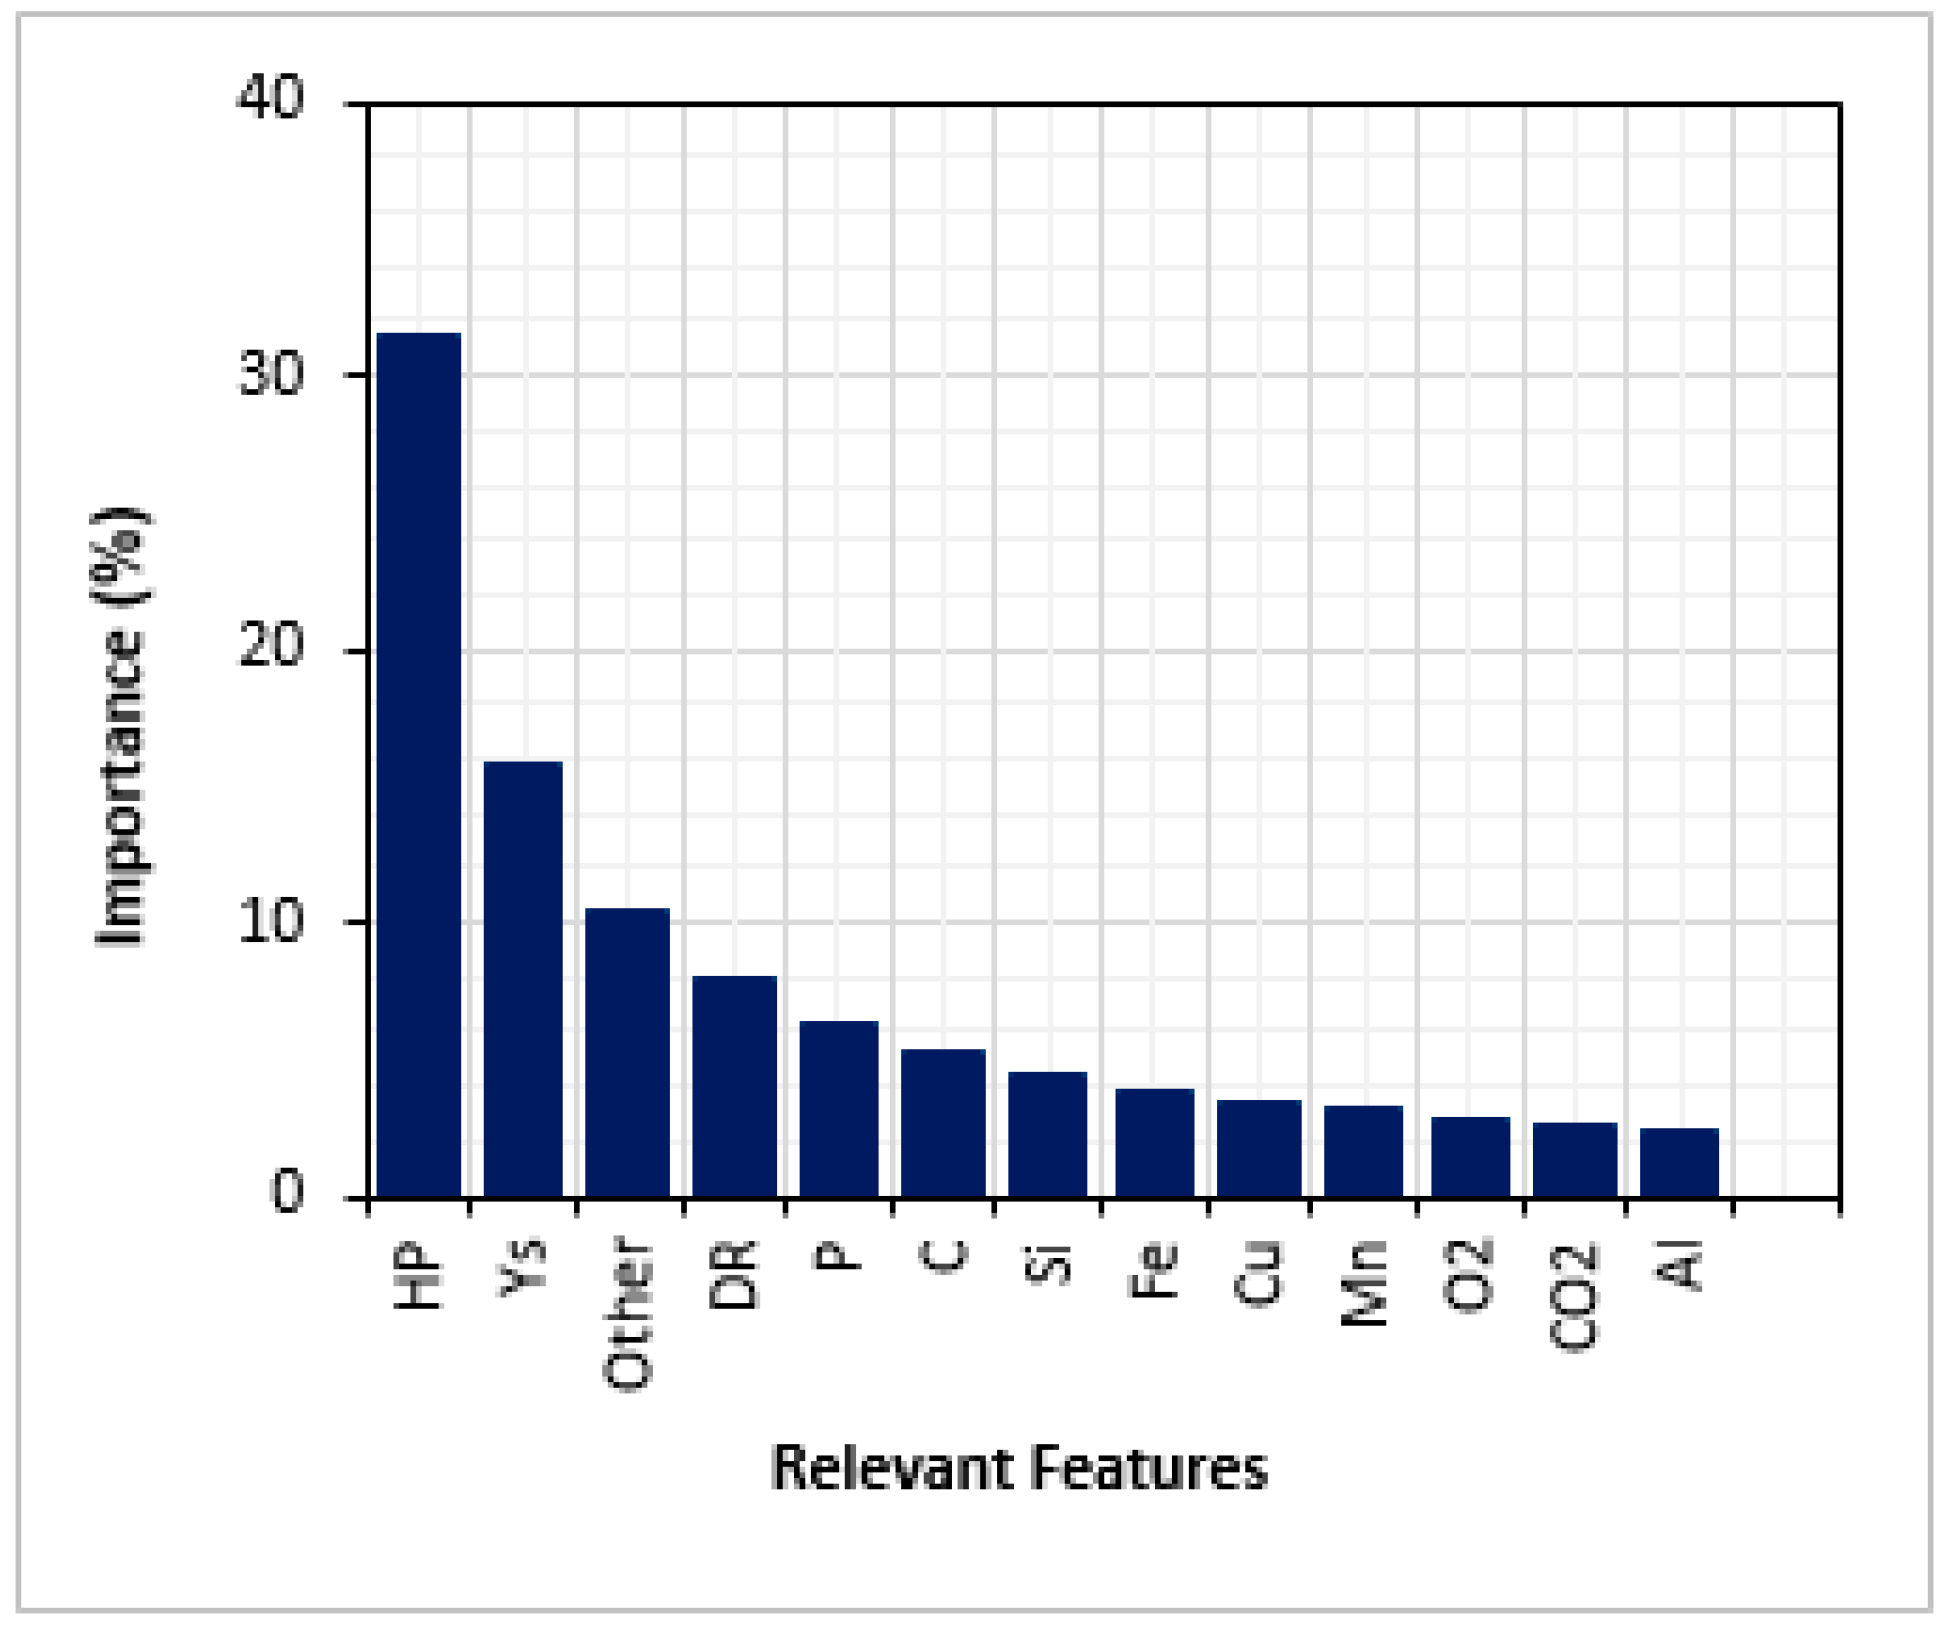
3.2. Model Performance and Feature Importance

Table 4 and Table 5 present the performance parameters of the KNN model, highlighting its accuracy in predicting fracture toughness. The model achieves the lowest MAE and RMSE values, as well as the highest R2 values, and a better cross-validation ranking. Furthermore, the cross-plot shown in Figure 6 demonstrates the accuracy of the models. The data points are predominantly clustered near the perfect-fit line, signifying minimal deviation.
Although most ML models directly evaluate feature relevance, the KNN method is inherently non-parametric and lacks this capability. To overcome this limitation, a surrogate model is used, such as gradient boosting, which provides a reasonable approximation of the KNN model’s decision-making process. Figure 7 presents the feature significance obtained using this surrogate. Hydrogen pressure is the dominant factor influencing the model’s prediction of HE susceptibility, accounting for a 32% impact on FT. This is consistent with laboratory observations [6]. Other important factors are the yield strength (Ys) and the total concentration of minor alloying elements (other), which contribute 15.72% and 10.48%, respectively. These parameters, which primarily affect the material’s FT, are crucial in defining the model’s prediction. The material strength is essential to understanding how materials react under stress before failure [56,57,58]. According to Álvarez et al. [43], high steel strength lead to a stronger reduction in toughness due to hydrogen. The displacement rate is the fourth important parameter that affects fracture toughness measurements [59]. This realization highlights the intricate interplay between material properties and mechanical testing conditions, underscoring the need to carefully select displacement rates to accurately assess the impact of HE on the material’s toughness. Together with hydrogen pressure, these factors provide a comprehensive framework for evaluating a material’s susceptibility to HE, highlighting the delicate balance between chemical composition and mechanical properties in managing HE.
The main alloying elements, carbon (C) and phosphorus (P), significantly impact fracture toughness, contributing about 12% in total. The mechanical properties of steel are largely determined by its carbon content, which primarily affects the metal’s hardness and elasticity. An increase in carbon content directly correlates with increased hardness [60,61,62]. However, this increased hardness also raises the material’s susceptibility to hydrogen and reduces fracture toughness [12]. While beneficial for certain mechanical characteristics, this enhancement can inadvertently heighten the material’s vulnerability to HE. Additionally, higher phosphorus concentration increases a material’s susceptibility to HE by weakening material interfaces and decreasing ferrite ductility, which facilitates crack initiation and propagation [62]. These elements significantly influence the material’s behavior in hydrogen environments, highlighting the complex interplay among the constituents that affects the material’s vulnerability to HE.
Iron (Fe), manganese (Mn), copper (Cu), and aluminum (Al) contributed 3.93%, 3.14%, 3.49%, and 2.42%, respectively, to the model’s predictions. Iron content is crucial in defining steel’s overall microstructure and behavior in hydrogen-rich environments. Though not as influential as carbon, manganese can significantly increase material strength, making it more susceptible to HE [61]. Aluminum alone has a minor effect on model predictions, but its influence becomes noticeable when combined with other alloying elements. This synergistic impact of alloying elements complicates the understanding of HE phenomena. In conclusion, recognizing the critical roles of material susceptibility, tensile stress, and the presence of a reactive hydrogen environment is essential for comprehending HE. These material and environmental parameters collectively influence the degree of HE in affected metals [63].
Furthermore, gaseous impurities such as oxygen and carbon dioxide contributed 2.86% and 2.62%, respectively, to the model’s output. Many theories have been proposed in the literature to explain how these impurities impact HE. Higher hydrogen purity is typically regarded to aggravate steel embrittlement. Because impurities such as O2 preferentially adsorb on the metal surface and stop H2 from being absorbed in the crack tip, the partial pressure of hydrogen may have an impact on the action of oxygen. Also, it is important to note that CO2 and O2 could have opposite effects. Barthélémy [64] classified several gases based on their impact on HE. According to the study, O2 was found to be an inhibitor, and CO2 was discovered to be an HE accelerator.
It should be noted that other alloying components such as Mo, Ni, Cr, Nb, and Ti were collectively reported as “Other” in this analysis. Although individual components might seem to have little effect, together as a whole, they have a considerable impact, contributing approximately 10% to the models’ predictions on HE. The interplay and synergy between several chemical elements increase the susceptibility of materials to HE, outweighing the impact of individual components. This illustrates the complex dynamics of embrittlement and the need to account for all little details in a thorough HE assessment.

3.3. Sensitivity Analysis

The sensitivity analysis evaluated the behavior of the k-nearest neighbors (KNN) model in response to variations in a critical parameter influencing material toughness in a hydrogen environment. By systematically varying a single key parameter from its minimum to maximum value while keeping all other variables constant, the study quantified its impact on the model’s predictions. This approach ensures a comprehensive assessment of the model’s predictive capability across its intended applicability range. The input parameters utilized for sensitivity analysis are presented in Table 6, where one parameter is selectively modified to validate the model’s performance. The analysis was conducted using API-grade steels (X52, X60, and X70) to examine the material-dependent effects on fracture toughness predictions.

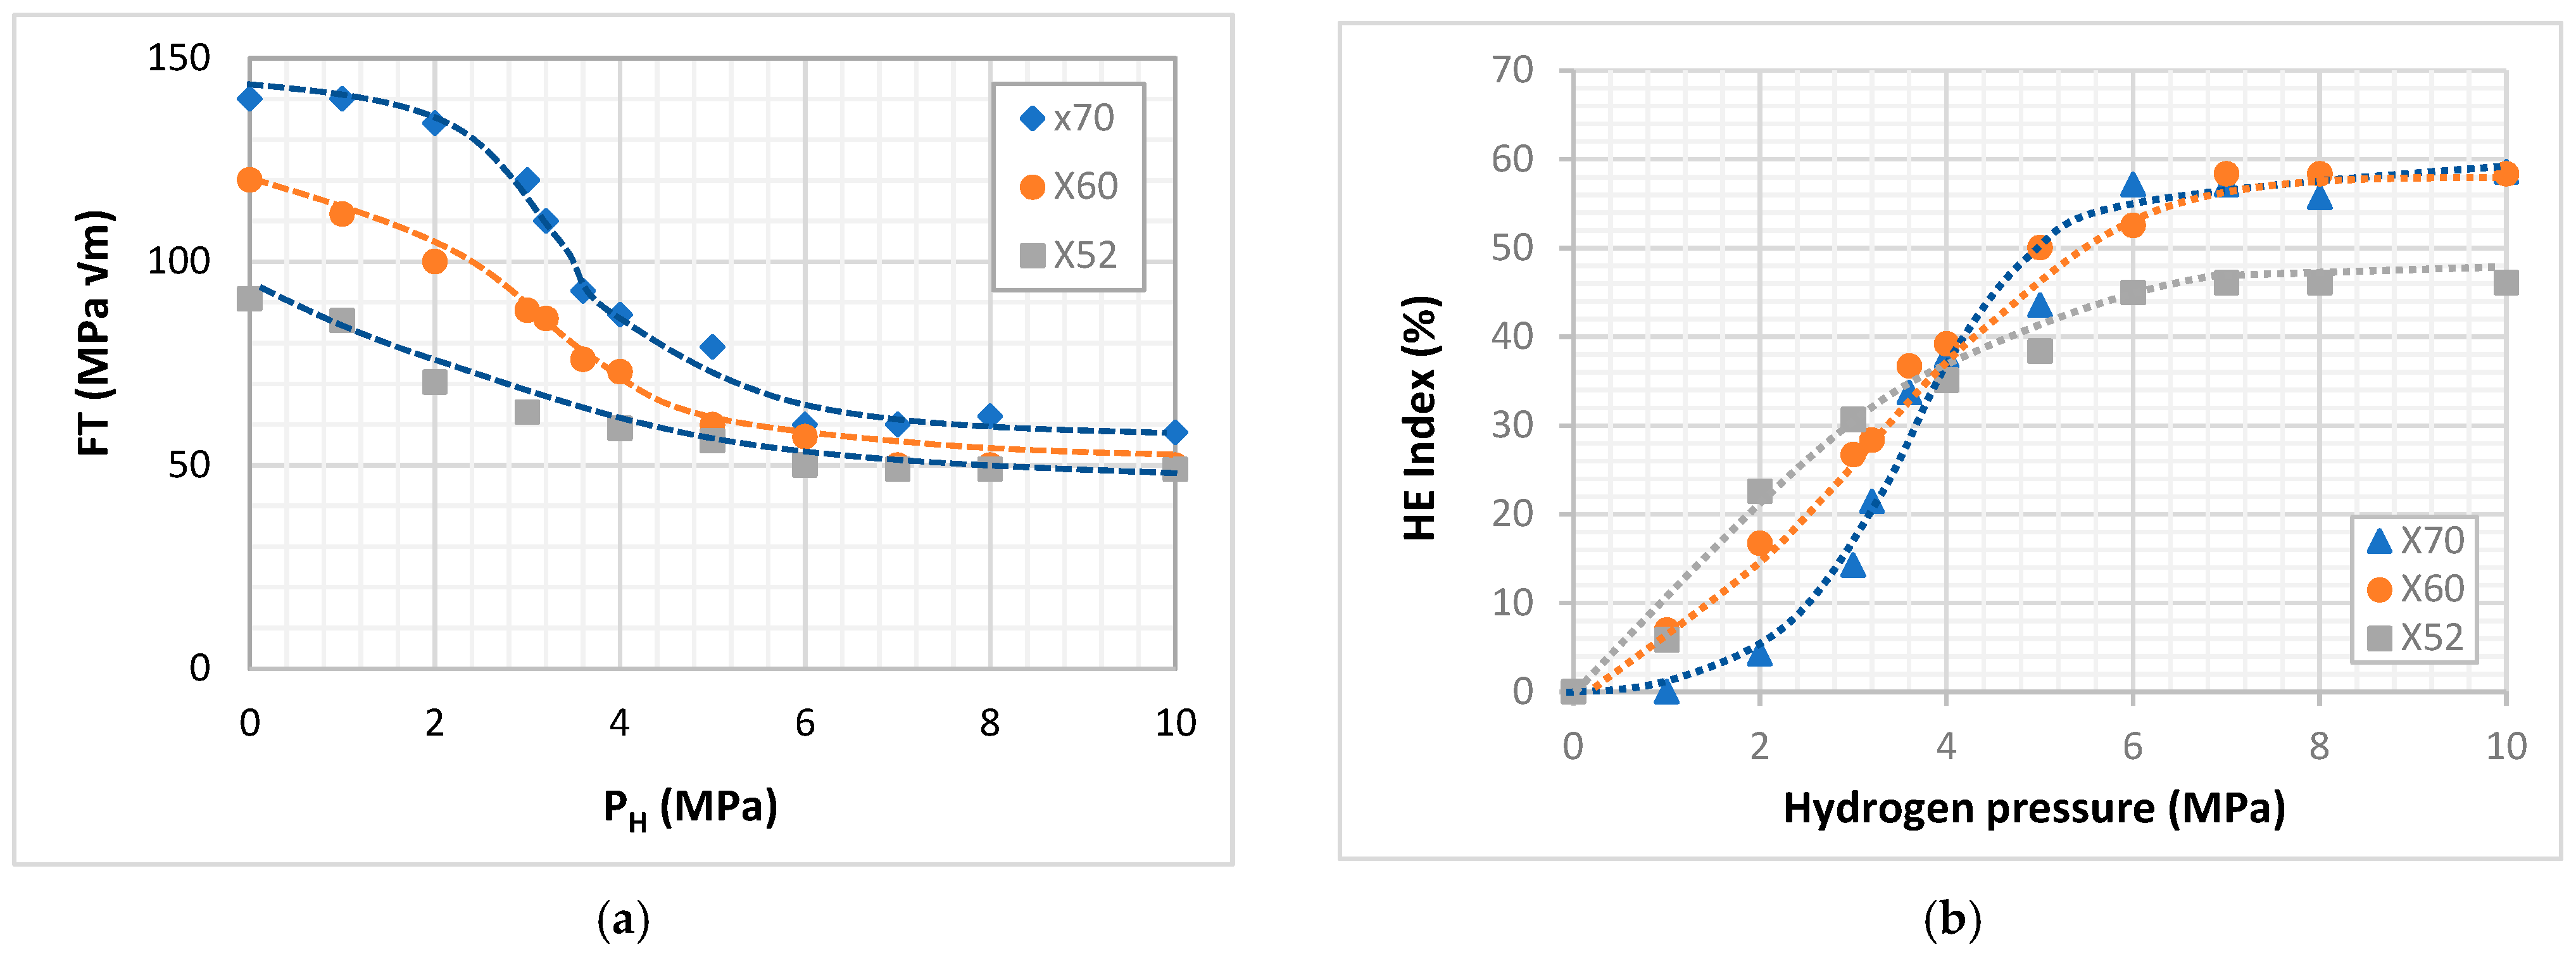
3.3.1. Effect of Hydrogen Pressure

As demonstrated in Figure 8a, hydrogen pressure plays a critical role in the degradation of fracture toughness (FT) in low-carbon pipeline steels. The results indicate a pronounced decrease in FT at lower hydrogen pressures (below 6.9 MPa), with the rate of decline stabilizing as pressure increases. The embrittlement mechanisms become more pronounced in this pressure range, facilitating crack initiation and propagation. However, beyond 6.9 MPa, the reduction in FT diminishes, and the material response reaches a plateau at approximately 8 MPa. This suggests a saturation point where further increases in hydrogen pressure do not substantially exacerbate the embrittlement effect. This trend is consistently observed across X52, X60, and X70 steels, underscoring their comparable susceptibility to hydrogen embrittlement (HE). The similarity in response among different steel grades confirms that their low-carbon content contributes to their comparable HE sensitivity. The observed trends align with previous research findings [6], reinforcing that hydrogen diffusion and trapping mechanisms govern the pressure-dependent degradation of FT.
The hydrogen embrittlement index (HE index), as defined in Equation (1), quantifies the percentage reduction in FT to assess the severity of embrittlement in different materials. Figure 8b illustrates the relationship between the HE index and hydrogen pressure for X70, X60, and X52 steels, revealing distinct embrittlement behaviors across the evaluated pressure range. Despite the similar fracture toughness trends observed with increasing hydrogen pressure, the HE index follows different patterns for each material. Notably, all curves converge at a critical pressure of approximately 4 MPa, where all three materials exhibit a comparable embrittlement index of 35%. This suggests a threshold pressure beyond which embrittlement mechanisms transition in dominance across different steels. Below this critical pressure, X52 exhibits the highest embrittlement index, indicating the most significant loss in fracture toughness, while X70 demonstrates the lowest embrittlement severity. This suggests that X52 is more susceptible to hydrogen-induced degradation at lower pressures, likely due to differences in microstructure or hydrogen diffusion characteristics. However, above 4 MPa, the trend reverses: X52 experiences the lowest reduction in fracture toughness, resulting in a lower HE index, whereas X60 and X70 show a strong embrittlement effect. This shift indicates that at higher pressures, hydrogen embrittlement mechanisms intensify more rapidly in X60 and X70, suggesting increased hydrogen uptake or a more pronounced impact on microstructural integrity in higher-strength steels. These findings highlight the complex interplay between hydrogen pressure and embrittlement susceptibility in different grades of pipeline steel. Identifying a critical pressure at 4 MPa, where embrittlement behavior changes, is particularly significant for designing hydrogen infrastructure, as it underscores the necessity of material-specific pressure thresholds for mitigating hydrogen-induced degradation.
H E   I n d e x % = F T 0 F T H F T 0 × 100
where FTH and FT0 are FT values obtained with and without hydrogen, respectively.

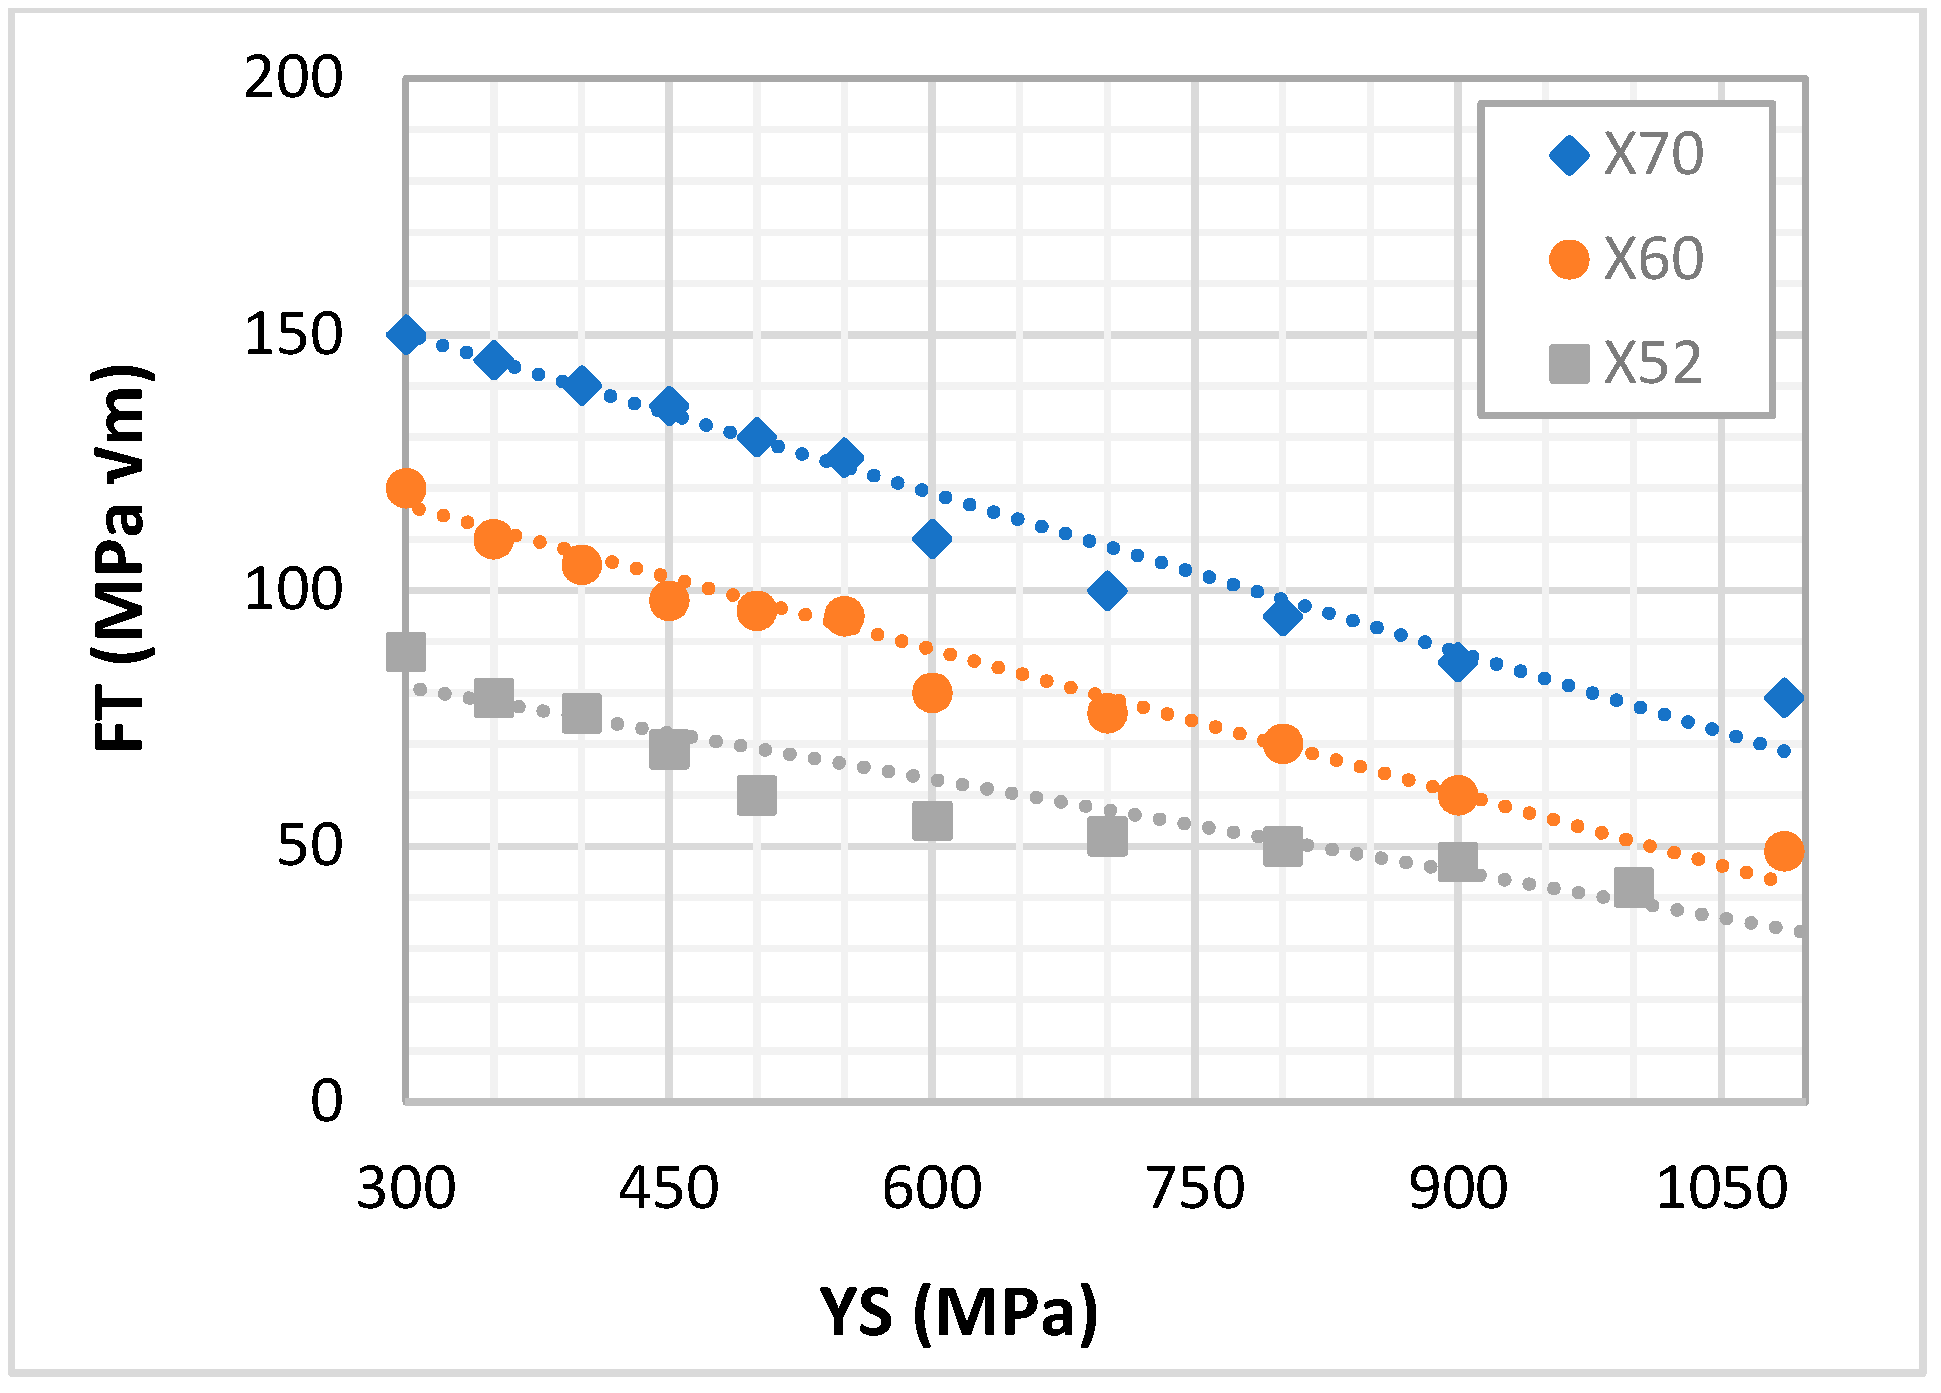
3.3.2. Effect of Yield Strength

The relationship between yield strength (YS) and FT in the presence of hydrogen, as depicted in Figure 9, demonstrates a distinct negative correlation. The data reveal that fracture toughness decreases consistently as yield strength increases, suggesting that higher-strength steels are more susceptible to HE. This trend aligns with previous studies establishing an inverse relationship between these mechanical properties [37]. The observed nearly linear decrease in FT with increasing YS highlights a fundamental trade-off in material performance. While higher yield strength enhances a material’s ability to resist plastic deformation, it concurrently reduces its ability to absorb fracture energy, making it more vulnerable to hydrogen-assisted cracking. This trend is consistent across all three steel grades (X70, X60, and X52), reinforcing the intrinsic link between mechanical strength and embrittlement susceptibility in hydrogen-containing environments.
Increased yield strength generally correlates with a finer microstructure [65] and an increased density of hydrogen trapping sites, such as dislocations and grain boundaries. Furthermore, grain boundaries trap more hydrogen atoms than dislocations in the finer microstructure [66]. These factors enhance hydrogen localization, accelerating embrittlement processes such as hydrogen-enhanced de-cohesion (HEDE) and hydrogen-enhanced localized plasticity (HELP). Consequently, high-strength steels, such as X70, exhibit a steeper decline in FT reduction than lower-strength steels like X52, confirming their greater susceptibility to hydrogen-assisted failure. The observed yield strength–fracture toughness trade-off significantly affects material selection in hydrogen infrastructure, pipeline systems, and pressure vessels. Engineering applications requiring high strength and resistance to HE must carefully balance these properties to minimize fracture risks. Optimizing alloying elements, controlling microstructure, and implementing hydrogen mitigation techniques (e.g., surface coatings or inhibitors) can help enhance toughness without compromising strength. The negative correlation between yield strength and fracture toughness in a hydrogen environment highlights a critical challenge in material design for hydrogen applications.

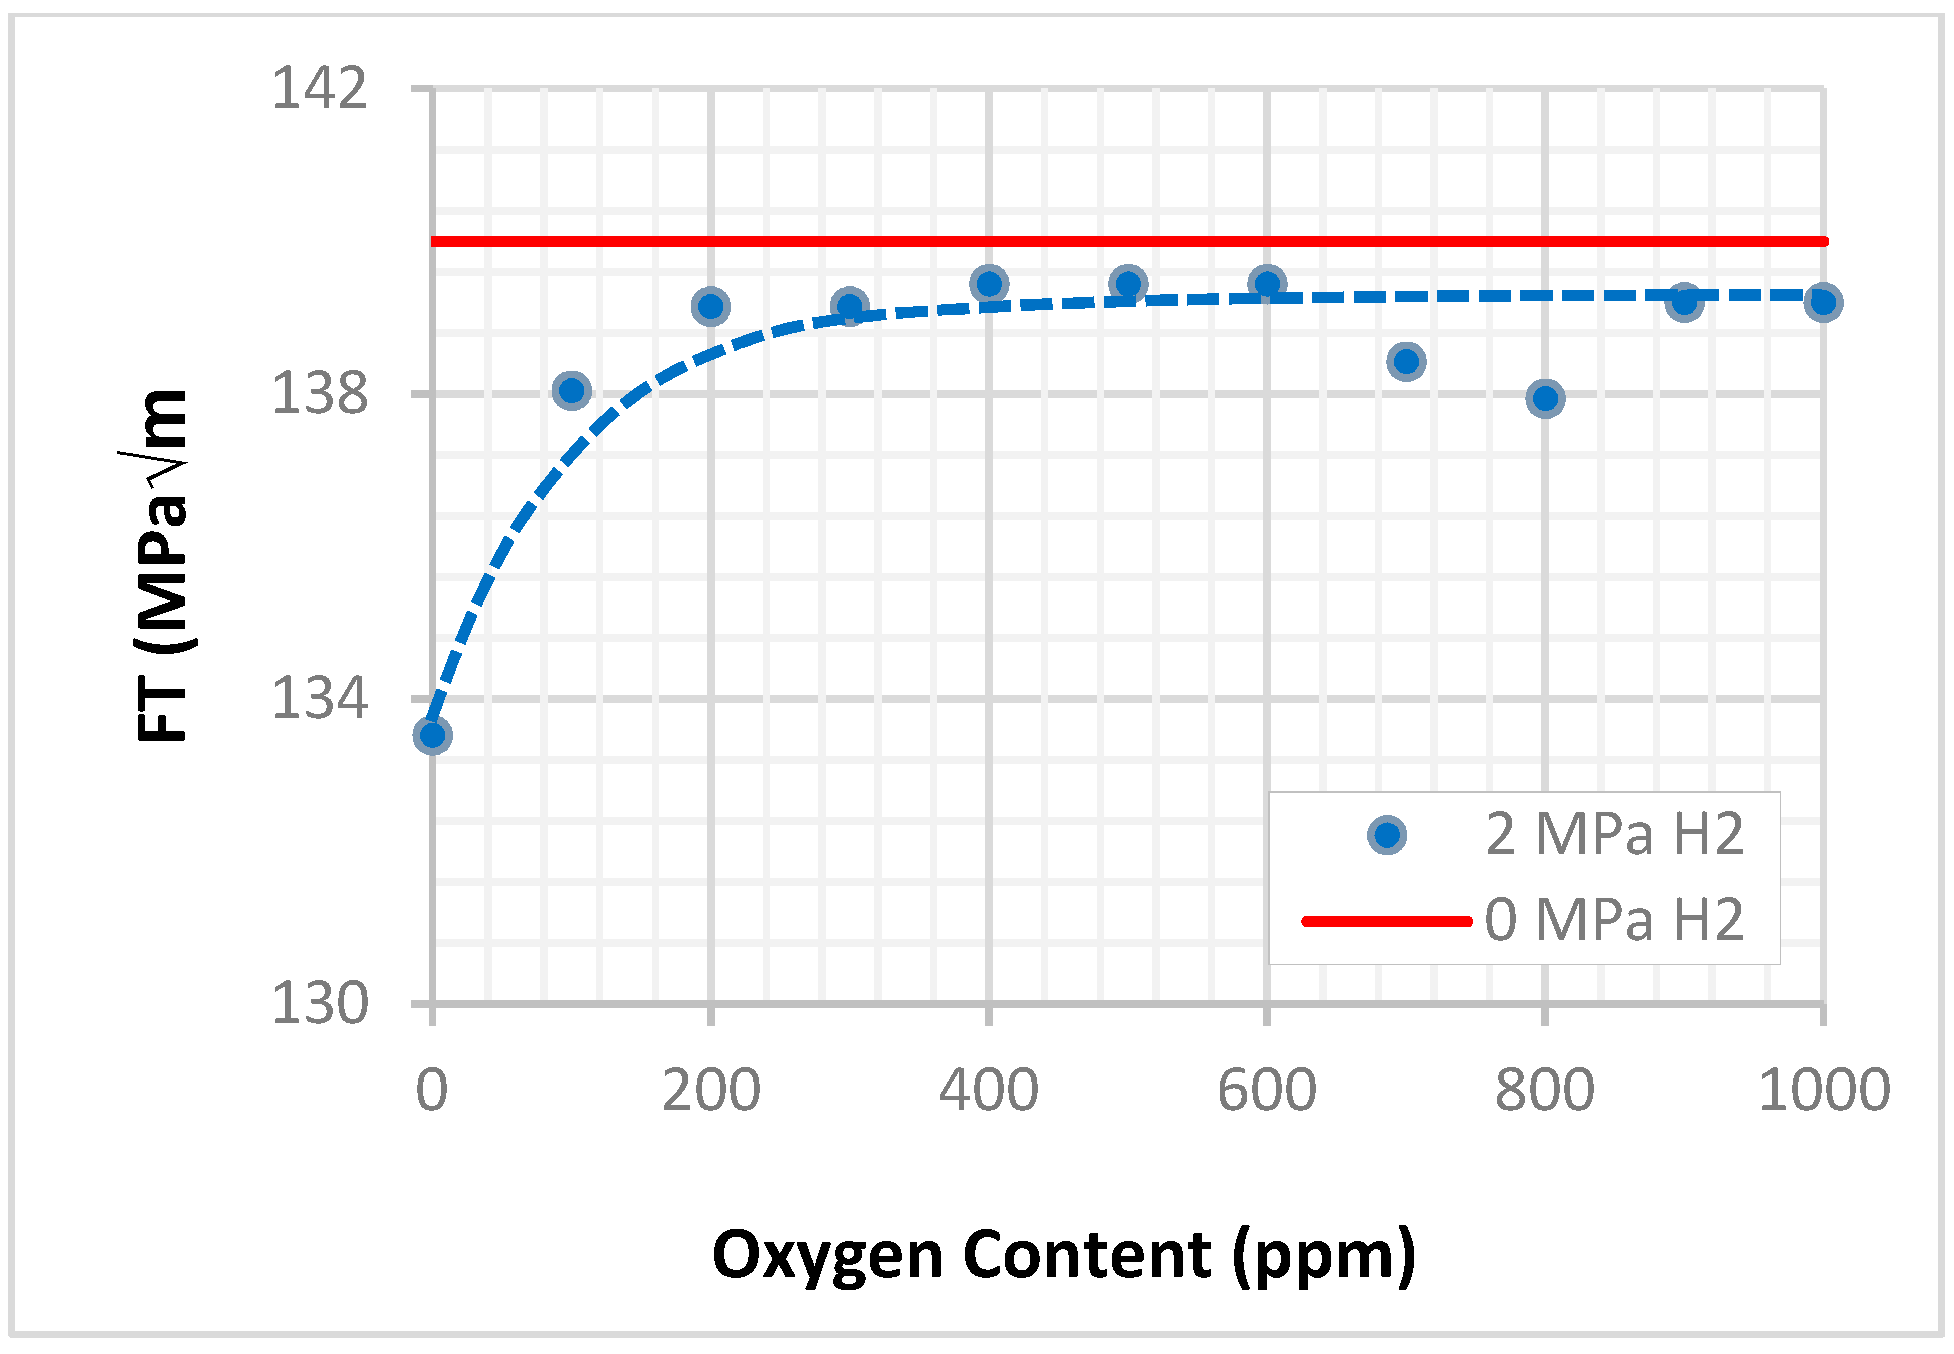
3.3.3. Effect of Oxygen Content

The sensitivity analysis presented in Figure 10 indicates that oxygen acts as a HE inhibitor, which agrees with prior studies [64]. The model was trained using measured FT values at 0.5 and 100 ppm oxygen concentrations for X70 steel. As a result, reliable predictions for other materials, such as X52 and X60, are not feasible due to the lack of corresponding experimental data for other materials. Nevertheless, the model captures the high sensitivity of FT to oxygen content at low concentrations (below 200 ppm), suggesting that small amounts of oxygen in the test environment can minimize HE, likely by reducing hydrogen uptake or altering hydrogen–microstructure interactions. Beyond 200 ppm, a plateau in FT values is observed. This behavior likely reflects the inhibitory effect’s saturation, where the FT approaches values observed under hydrogen-free conditions, as indicated by the red solid line in Figure 10.
The observation of the FT plateau is consistent with the saturation of hydrogen adsorption sites, a well-established mechanism by which oxygen mitigates HE [67,68]. Once these sites are occupied, additional oxygen no longer contributes to increased FT, resulting in the convergence of the FT curves for hydrogen-exposed and hydrogen-free environments. This convergence suggests that the HE index approaches zero at higher oxygen concentrations.
Further experimental data are needed to enhance the model’s generalizability and predictive accuracy, especially for varying steel grades, hydrogen pressures, and yield strengths. Given the critical role of these parameters in HE susceptibility, exploring their interaction with oxygen content would provide a more comprehensive understanding of oxygen’s role in hydrogen-containing environments.

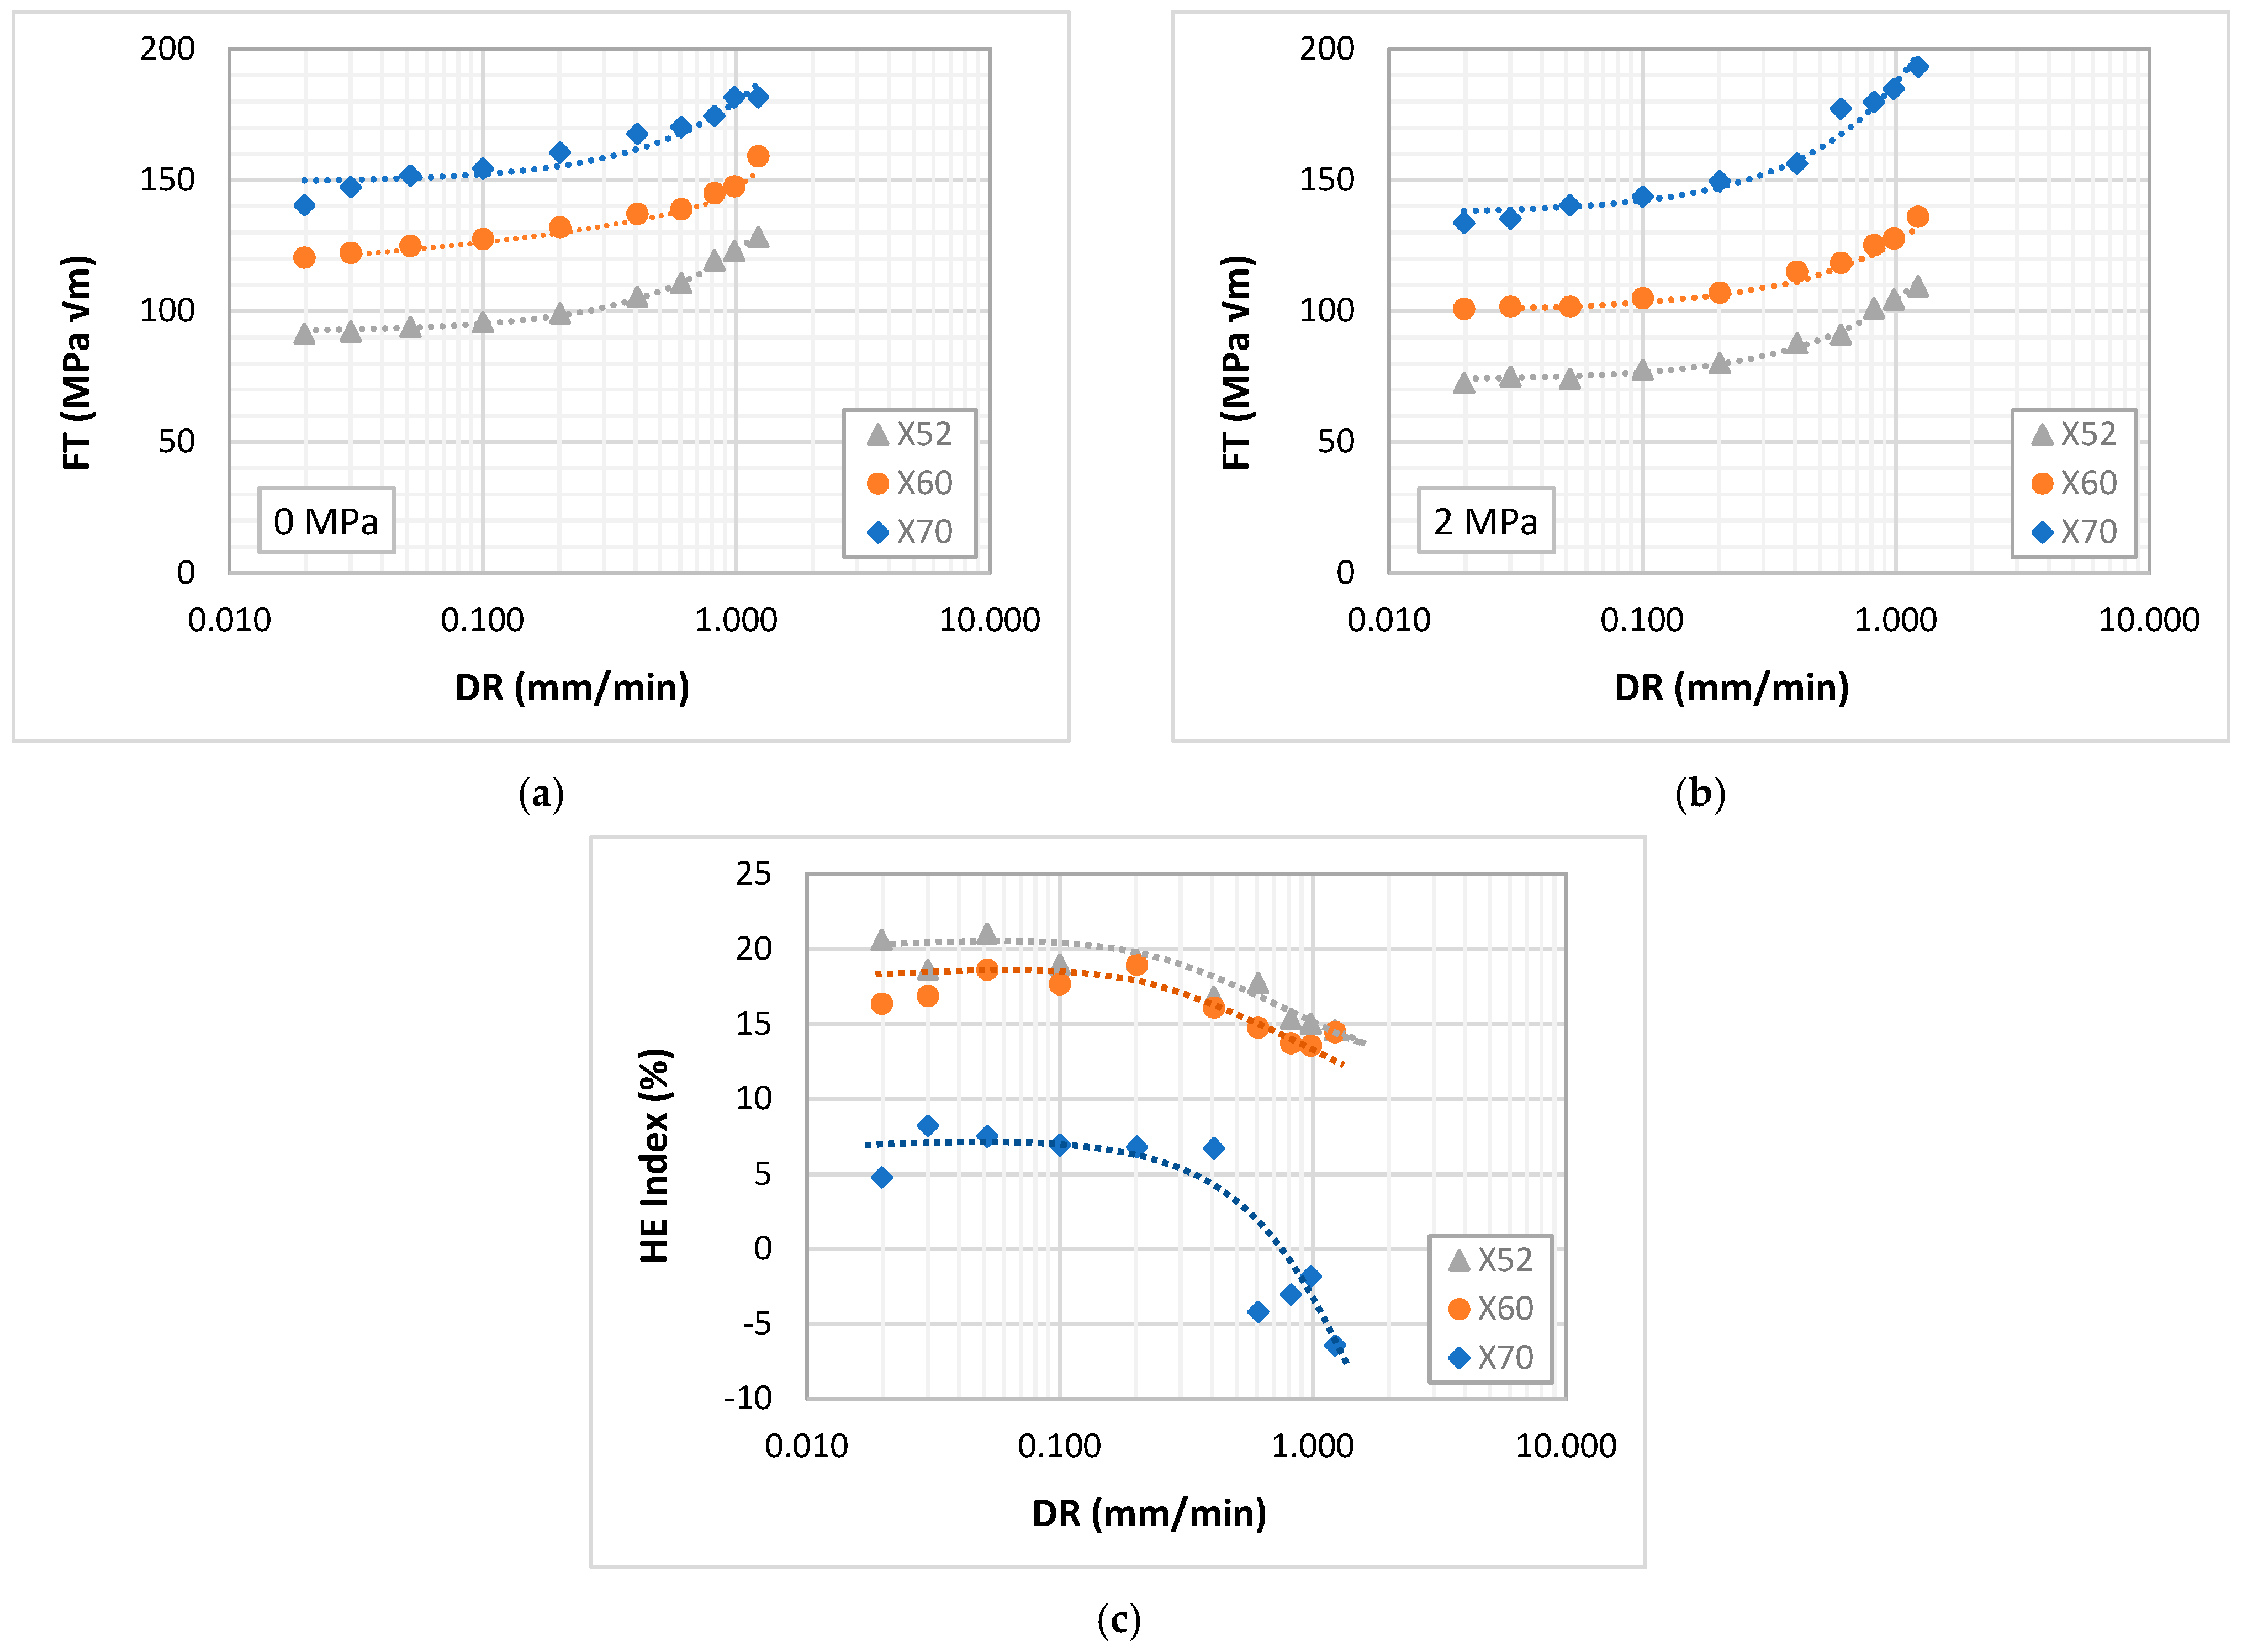
3.3.4. Effect of Displacement Rate

The effect of displacement rate on FT and HE index is illustrated in Figure 11 and reveals a consistent and rate-sensitive response across all tested materials (X52, X60, and X70). This increase in FT with displacement rate is consistent with the literature [43,59]. An increase in displacement rate results in a notable increase in FT measurements, particularly beyond 0.1 mm/min, under both inert (0 MPa hydrogen) and hydrogenated (2 MPa) conditions. At low displacement rates (<0.1 mm/min), the observed variations in FT are minimal and largely negligible, indicating a relatively stable measurement regime. Therefore, measurements obtained with displacement rates of less than 0.1 mm/min are suitable for accurate ML modeling of FT despite longer testing durations.
Regarding the HE index, a contrasting trend is evident. At lower displacement rates (<0.4 mm/min), the HE index remains relatively stable across all materials, suggesting that the exposure time is sufficient for hydrogen diffusion and interaction with stress concentration at the crack tip. However, a significant reduction in the HE index is observed at higher displacement rates, especially for the X70 steel. This decline could be indicative of insufficient hydrogen uptake during rapid loading, which masks the true embrittlement susceptibility of the material. The insensitivity of X70 to HE at elevated rates likely reflects its microstructural characteristics and slower hydrogen permeation at the simulated conditions (Figure 8b), leading to an underestimation of embrittlement effects. Consequently, while high displacement rate tests may be effective for screening and comparative assessments, they may fail to capture critical embrittlement behavior under service-relevant conditions, where slower crack growth allows more time for hydrogen ingress.

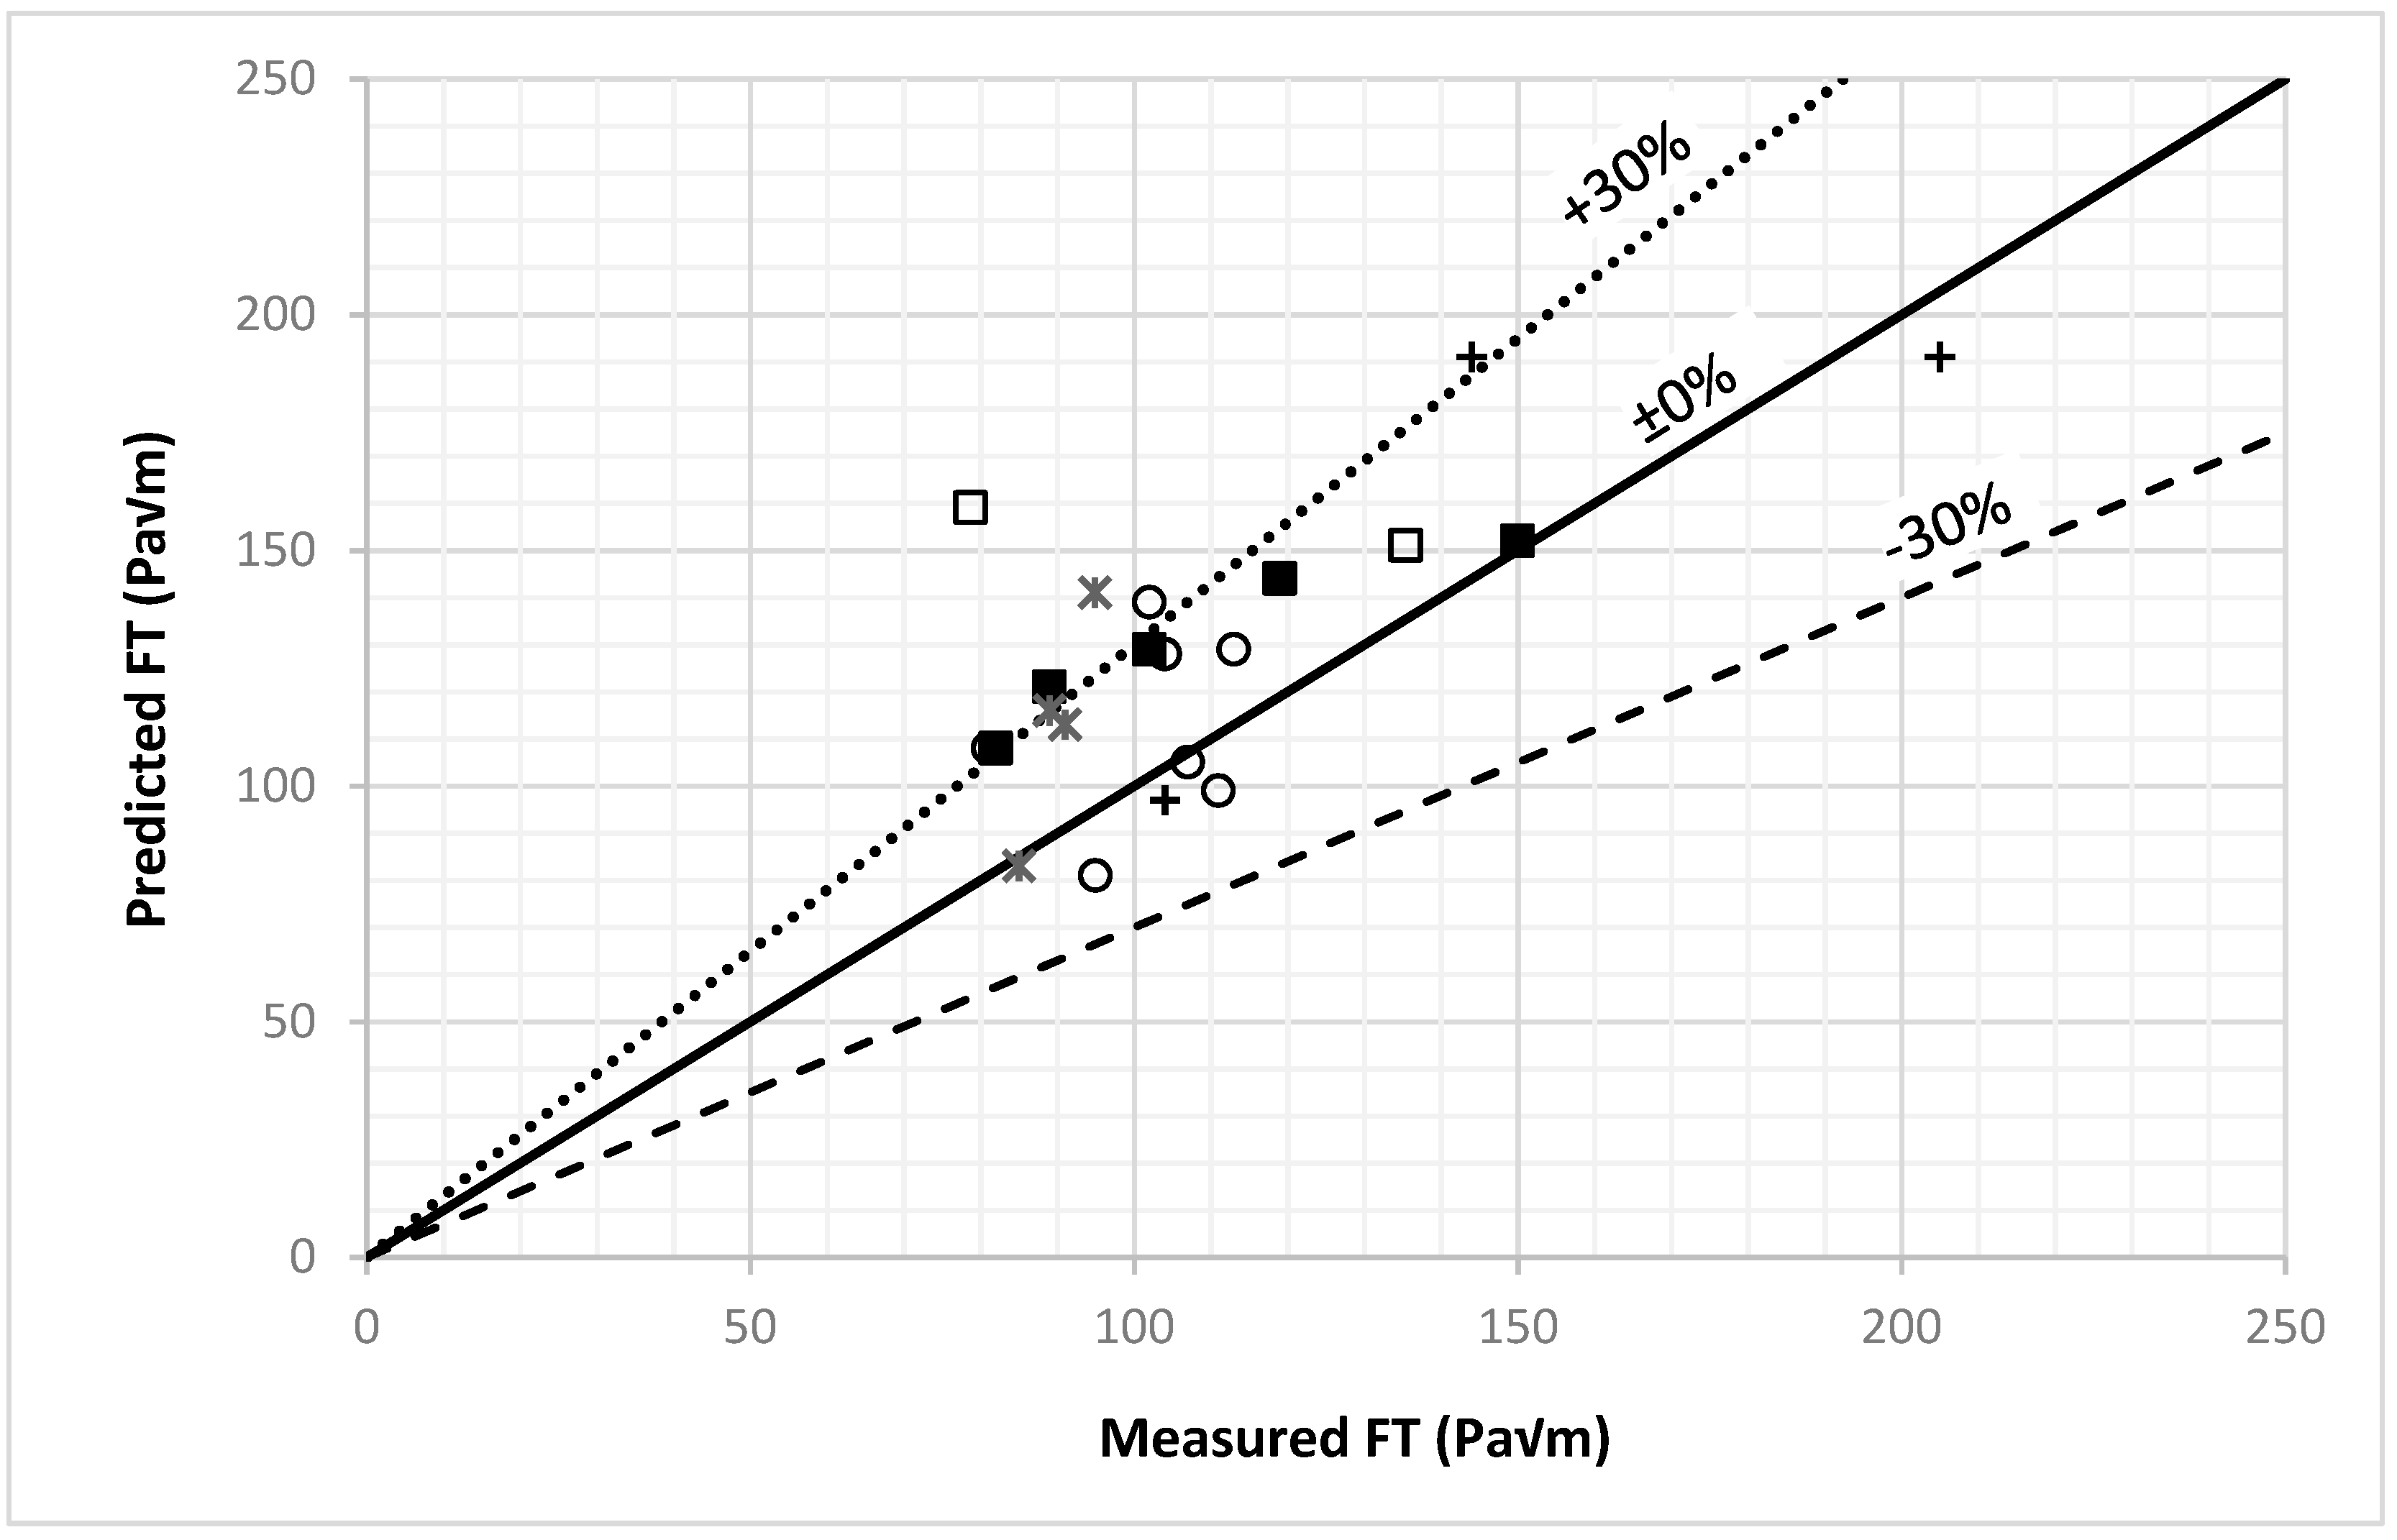
3.4. Model Validation with Unseen Data

Figure 12 presents a cross-plot comparing predicted FT values with experimentally measurements that have never been used in training or testing the model. The solid diagonal line represents the ideal ±0% line, where predictions perfectly match measurements, while the dashed lines indicate ±30% deviation boundaries. Most of the 22 data points are clustered around the perfect-fit ±0% line, with a substantial portion falling within the ±30% range, indicating that the model exhibits reasonable predictive accuracy across various studies. Each data point corresponds to a distinct literature source, represented by unique markers, and the relatively even distribution around the perfect-fit line supports the model’s generalizability across different experimental datasets and steel types.
A slight upward deviation in the upper-right region suggests a tendency of the model to overpredict FT at higher toughness levels, possibly reflecting nonlinear behavior that the model has not captured. A few data points fall outside the ±30% deviation limits, indicating notable discrepancies between measurements and predictions. Table A2 details the materials used in this validation, including their elemental compositions, yield strengths, and test pressures. Despite several NR (not reported) values, the model generally achieves predictions that closely align with experimental values. The maximum observed error is +102%. Minor alloying elements were not reported in some of the studies considered in this comparison. Therefore, model predictions were based on the assumption that unreported values were zero. This results in significant discrepancies in some of the FT forecasts. When critical data, such as minor alloying element concentrations, are missing, model performance is impacted by the completeness and quality of the input features. The results confirm the model’s robustness and generalizability, while highlighting the importance of comprehensive input data in enhancing predictive accuracy.

4. Conclusions and Recommendations

This study mainly focused on developing an HE prediction model using ML techniques. The investigation considered FT as the primary assessment parameter for the HE of carbon and low-alloy steels. The model developed in this study examined the impact of key influential factors, such as hydrogen pressure, yield strength, and material composition, on the fracture toughness of these materials. The results have yielded the following important conclusions:
  • The KNN model predicts FT with reasonable accuracy, as demonstrated by high R-squared values, minimal mean absolute error (MAE), and root mean square error (RMSE).
  • Pressure and yield strength are the two most important factors influencing the HE susceptibility of carbon steel, with hydrogen pressure being the most significant factor, impacting FT prediction by 32%.
  • FT in carbon steels declines notably with hydrogen pressure at lower pressures (between 0 and 6.9 MPa) and stabilizes at higher pressures (more than 8 MPa). This pattern suggests a crucial saturation point at which FT becomes independent of hydrogen pressure, aligning with published research.
  • The main alloying elements, carbon and phosphorus, emerged as significant factors in the model’s predictions of fracture toughness, contributing 5.24% and 6.29% toward FT prediction, respectively.
  • Oxygen effectively mitigates hydrogen embrittlement in X70 steel at low concentrations (<200 ppm), as evidenced by the model’s sensitivity to oxygen-induced increases in fracture toughness, likely due to reduced hydrogen uptake.
  • FT predictions increase with displacement rate, particularly above 0.1 mm/min, indicating that lower displacement rate (<0.1 mm/min) experiments provide more stable and reliable data for accurate ML modeling despite longer testing times.
  • The evaluation of the model with unseen data confirms the model’s robustness and generalizability, while highlighting the importance of comprehensive input data in improving predictive accuracy.

Author Contributions

Conceptualization, R.A. and M.G.; methodology, R.A., M.G. and N.A.; validation, R.A., M.G. and N.A.; formal analysis, M.G. and N.A.; investigation, R.A., C.T., M.G. and N.A.; resources, R.A. and C.T.; data curation, M.G. and N.A.; writing—original draft, M.G.; writing—review & editing, R.A., C.T. and D.D.; supervision, R.A. and C.T.; project administration, R.A.; funding acquisition, R.A. and C.T. All authors have read and agreed to the published version of the manuscript.

Funding

The Pipeline and Hazardous Materials Safety Administration (PHMSA) of the US Department of Transportation (DOT) supported this work under Award No. 693JK32250004CAAP.

Data Availability Statement

The original contributions presented in this study are included in the article. Further inquiries can be directed to the corresponding author(s).

Conflicts of Interest

The authors declare that they have no commercial or financial relationships that could be construed as conflicts of interest.

Nomenclature

HEHydrogen Embrittlement
MLMachine Learning
RFRandom Forest
DTDecision Tree
GBGradient Boosting
CatboostCategorical Boosting
ANNArtificial Neural Network
SVMSupport Vector Machine
KNNK-Nearest Neighbors
MAEMean Absolute Error
RMSEMean Square Error
R2coefficient of determination
FTFracture Toughness
YSYield Strength
PHHydrogen Pressure
RFRandom Forest
UTSUltimate Tensile Strength

Appendix A

Appendix A.1. Comparative Analysis of Hyperparameter Optimization for Four ML Models

After a comprehensive grid search, four machine learning models were given their optimal hyperparameters. To determine the ideal settings, our approach investigated several combinations of hyperparameters. The findings are summarized in Table A1, which also displays each model’s best-performing hyperparameters.
Table A1. Grid search of hyperparameters for four ML models.
AlgorithmHyperparametersRangeBest Hyperparameter
RFCriterionSquared error, PoissonSquared error
Maximum depth5, 10, 15, 20, None15
Maximum features0.5, 1.0, sqrt, log21.0
Minimum samples leaf2, 4, 62
Minimum samples split10, 20, 3010
No of estimators100, 200, 300200
BootstrapTrue, FalseTrue
DTMaximum depth5, 10, 15, None10
Minimum samples split2, 5, 10, 205
Minimum samples leaf1, 2, 4, 5, 8, 101
Maximum featuresauto, sqrt, log2sqrt
GBMaximum depth2, 3, 5, 105
No estimators100, 200, 500, 1000200
Learning rate0.01, 0.05, 0.1, 0.20.1
Subsample0.5, 0.7, 0.9, 1.00.5
Minimum samples split2, 10, 20, 3010
Minimum samples leaf1, 5, 10, 205
Maximum featuressqrt, log2, NoneNone
Lossls, lad, Huber, quantilels
KNNNumber of neighbors1–204
MetricEuclidean, Manhattan, MinkowskiEuclidean
WeightDistance, uniformDistance
Algorithmauto, ball_tree, kd_tree, bruteauto

Appendix A.2. Model Predictions Comparison

Table A2 compares model predictions with unseen data. It also shows all model inputs used in making the predictions, including the elemental composition and properties of the material, operating conditions, and environmental parameters.
Table A2. Comparison of model prediction with measurements.
SourceCPFeAlMnSiCuSCrNiYS (MPa)P (MPa)Measured
(MPa√m)
MaterialModel
(MPa√m)
Error
(%)
R & S [69]0.210.01298.5NR1.040.21NR0.02NRNR3750150A5161521
R & S [69]0.2100.0198.5NR1.040.21NR0.02NRNR3753.5119A51614421
R & S [69]0.2100.0198.5NR1.040.21NR0.02NRNR3756.9102A51612927
R & S [69]0.2100.0198.5NR1.040.21NR0.02NRNR37520.789A51612136
R & S [69]0.2100.0198.5NR1.040.21NR0.02NRNR37534.582A51610832
S. et al. [70]0.0600.0097.5NR1.770.21NRNR0.26NR6600258.5X80157−39
S. et al. [70]0.0600.0097.5NR1.770.21NRNR0.26NR6603135.4X8015111
S. et al. [70]0.0600.0097.5NR1.770.21NRNR0.26NR6601078.7X80159102
Xu [71]0.1400.0298.30.010.980.290.000.01NRNR4696.9102X5213936
Xu [71]0.1200.0198.30.001.290.250.030.020.020.014736.9104X6012823
Xu [71]0.0900.0197.00.421.500.310.310.010.130.085846.995X7081−15
Xu [71]0.0500.0197.50.041.520.12NRNR0.250.146766.9111X8099−11
Xu [71]0.2600.0198.4NR1.060.23NR0.02NRNR2976.981A10610833
Xu [71]0.2100.0198.5NR1.040.21NR0.02NRNR3756.9113A51612914
Xu [71]0.2600.0198.1NR1.500.010.020.030.040.023666.9107X42105−1
N. et al. [72]0.0700.0197.9NR1.68NR0.100.010.070.145840205X70191−7
N. et al. [72]0.0700.0197.9NR1.68NR0.100.010.070.145840.1144X7019133
N. et al. [72]0.0700.0197.9NR1.68NR0.100.010.070.1458410104X7097−7
S. et al. [73]0.1700.0198.9NR0.650.24NR0.04NRNR2891089X4211630
S. et al. [73]0.2300.0298.3NR0.940.230.180.040.040.05320191X4611324
S. et al. [73]0.2300.0298.3NR0.940.230.180.040.040.053201085X4683−2
S. et al. [73]0.1200.0297.9NR1.560.25NR0.01NRNR4911094.9X7014148
Not rated (NR).

References

  1. Nanninga, N.E.; Levy, Y.; Drexler, E.; Condon, R.; Stevenson, A.; Slifka, A. Comparison of hydrogen embrittlement in three pipeline steels in high pressure gaseous hydrogen environments. Corros. Sci. 2012, 59, 1–9. [Google Scholar] [CrossRef]
  2. Li, H.; Niu, R.; Li, W.; Lu, H.; Cairney, J.; Chen, Y.-S. Hydrogen in pipeline steels: Recent advances in characterization and embrittlement mitigation. J. Nat. Gas Sci. Eng. 2022, 105, 104709. [Google Scholar] [CrossRef]
  3. Zhao, W.; Zhang, T.; Wang, Y.; Qiao, J.; Wang, Z. Corrosion Failure Mechanism of Associated Gas Transmission Pipeline. Materials 2018, 11, 1935. [Google Scholar] [CrossRef] [PubMed]
  4. Lee, Y.-H.; Kim, G.-I.; Kim, K.-M.; Ko, S.-J.; Kim, W.-C.; Kim, J.-G. Localized Corrosion Occurrence in Low-Carbon Steel Pipe Caused by Microstructural Inhomogeneity. Materials 2022, 15, 1870. [Google Scholar] [CrossRef]
  5. Melaina, M.W.; Antonia, O.; Penev, M. Blending Hydrogen into Natural Gas Pipeline Networks: A Review of Key Issues; National Renewable Energy Laboratory: Golden, CO, USA, 2013.
  6. Marchi, C.S.; Somerday, B.P. Effects of High-Pressure Gaseous Hydrogen on Structural Metals. SAE Trans. 2007, 116, 94–109. [Google Scholar]
  7. Jemblie, L.; Bjaaland, H.; Nyhus, B.; Olden, V.; Akselsen, O. Fracture Toughness and Hydrogen Embrittlement Susceptibility on the Interface of Clad Steel Pipes With and Without a Ni-Interlayer. Mater. Sci. Eng. A 2017, 685, 87–94. [Google Scholar] [CrossRef]
  8. Peral, L.B.; Zafra, A.; Belzunce, J.; Rodríguez, C. Effects of hydrogen on the fracture toughness of CrMo and CrMoV steels quenched and tempered at different temperatures. Int. J. Hydrogen Energy 2019, 44, 3953–3965. [Google Scholar] [CrossRef]
  9. Hoyos, J.J.; Masoumi, M.; Pereira, V.; Tschiptschin, A.; Paes, M.; Avila, J. Influence of Hydrogen on the Microstructure and Fracture Toughness of Friction Stir Welded Plates of API 5L X80 Pipeline Steel. Int. J. Hydrogen Energy 2019, 44, 23458–23471. [Google Scholar] [CrossRef]
  10. Giarola, J.M.; Avila, J.A.; Cintho, O.M.; Pinto, H.C.; de Oliveira, M.F.; Filho, W.W.B. The effect of hydrogen on the fracture toughness of friction-stir welded API 5L X70 pipeline steels. Fatigue Fract. Eng. Mater. Struct. 2022, 45, 3009–3024. [Google Scholar] [CrossRef]
  11. Dong, C.F.; Liu, Z.; Li, X.; Cheng, Y. Effects of hydrogen-charging on the susceptibility of X100 pipeline steel to hydrogen-induced cracking. Int. J. Hydrogen Energy 2009, 34, 9879–9884. [Google Scholar] [CrossRef]
  12. Mustapha, A.; Charles, E.A.; Hardie, D.W.F. Evaluation of environment-assisted cracking susceptibility of a grade X100 pipeline steel. Corros. Sci. 2012, 54, 5–9. [Google Scholar] [CrossRef]
  13. Becker, W.T.; Shipley, R.J. (Eds.) Hydrogen damage and embrittlement. In Failure Analysis and Prevention; ASM International: Materials Park, OH, USA, 2002; pp. 809–822. [Google Scholar]
  14. Weforum. Which Countries Could Become the World’s Hydrogen Superpowers? Available at: World Economic Forum. 2020. Available online: https://www.weforum.org/agenda/2022/02/clean-hydrogen-energy-low-carbon-superpowers/ (accessed on 21 October 2023).
  15. Cortes, C.; Vapnik, V. Support-vector networks. Mach. Learn. 1995, 20, 273–297. [Google Scholar] [CrossRef]
  16. Ben-Hur, A.; Weston, J. A user’s guide to support vector machines. In Data Mining Techniques for the Life Sciences; Humana Press: Totowa, NJ, USA, 2010; pp. 223–239. [Google Scholar]
  17. Breiman, L. Random forests. Mach. Learn. 2001, 45, 5–32. [Google Scholar] [CrossRef]
  18. Hatwell, J.; Gaber, M.M.; Azad, R.M.A. CHIRPS: Explaining random forest classification. Artif. Intell. Rev. 2020, 53, 5747–5788. [Google Scholar] [CrossRef]
  19. Hapfelmeier, A.; Hothorn, T.; Ulm, K.; Strobl, C. A new variable importance measure for random forests with missing data. Stat. Comput. 2014, 24, 21–34. [Google Scholar] [CrossRef]
  20. Friedman, J.H. Greedy function approximation: A gradient boosting machine. Ann. Stat. 2001, 29, 1189–1232. [Google Scholar] [CrossRef]
  21. Chen, T.; Guestrin, C. XGBoost: A scalable tree boosting system. In Proceedings of the 22nd ACM SIGKDD International Conference on Knowledge Discovery and Data Mining, San Francisco, CA, USA, 13–17 August 2016; pp. 785–794. [Google Scholar]
  22. Prokhorenkova, L.; Gusev, G.; Vorobev, A.; Dorogush, A.V.; Gulin, A. CatBoost: Unbiased boosting with categorical features. Adv. Neural Inf. Process. Syst. 2018, 31, 6638–6648. [Google Scholar]
  23. Quinlan, J.R. Induction of decision trees. Mach. Learn. 1986, 1, 81–106. [Google Scholar] [CrossRef]
  24. Altman, N.S. An introduction to kernel and nearest-neighbor nonparametric regression. Am. Stat. 1992, 46, 175–185. [Google Scholar] [CrossRef]
  25. LeCun, Y.; Bengio, Y.; Hinton, G. Deep learning. Nature 2015, 521, 436–444. [Google Scholar] [CrossRef]
  26. Hinton, G.E. Connectionist learning procedures. Artif. Intell. 1990, 40, 555–610. [Google Scholar] [CrossRef]
  27. Lee, Y.-W.; Gangloff, R.P. Measurement and Modeling of Hydrogen Environment–Assisted Cracking of Ultra-High-Strength Steel. Metall. Mater. Trans. A 2007, 38, 2174–2190. [Google Scholar] [CrossRef]
  28. Hoar, E.T.; Hitchcock, D.A.; Krentz, T.M.; Roy, L.E. Machine Learning Prediction of Fracture Toughness in Hydrogen-charged Stainless Steels. In Proceedings of the 2023 American Nuclear Society Annual Meeting, Indianapolis, IN, USA, 11–14 June 2023. [Google Scholar]
  29. Thankachan, T.; Prakash, K.S.; Pleass, C.D.; Rammasamy, D.; Prabakaran, B.; Jothi, S. Artificial neural network to predict the degraded mechanical properties of metallic materials due to the presence of hydrogen. Int. J. Hydrogen Energy 2017, 42, 28612–28621. [Google Scholar] [CrossRef]
  30. Kim, S.-G.; Shin, S.-H.; Hwang, B. Machine learning approach for prediction of hydrogen environment embrittlement in austenitic steels. J. Mater. Res. Technol. 2022, 19, 2794–2798. [Google Scholar] [CrossRef]
  31. Ahmed, N.; Aldaw, M.; Ahmed, R.; Teodoriu, C. Modeling of necking area reduction of carbon steel in hydrogen environment using machine learning approach. Eng. Fail. Anal. 2024, 156, 107864. [Google Scholar] [CrossRef]
  32. Wang, Y.; Wang, G.; Tu, S.; Xuan, F. Validation and Application of a Two-parameter J-Ad Approach for Fracture Behaviour Prediction. Fatigue Fract. Eng. Mater. Struct. 2020, 43, 2998–3011. [Google Scholar] [CrossRef]
  33. Ronevich, J.A.; Song, E.J.; Somerday, B.P.; Marchi, C.W.S. Hydrogen-assisted fracture resistance of pipeline welds in gaseous hydrogen. Int. J. Hydrogen Energy 2021, 46, 7601–7614. [Google Scholar] [CrossRef]
  34. Ronevich, J.; Marchi, C.S.; Kolasinski, R.; Thurmer, K.; Bartelt, N.; El Gabaly, F.; Somerday, B. Oxygen Impurity Effects on Hydrogen Assisted Fatigue and Fracture of X100 Pipeline Steel. In Proceedings of the ASME 2018 Pressure Vessels and Piping Conference, Prague, Czech Republic, 15–20 July 2018. [Google Scholar]
  35. Nibur, K.A.; Somerday, B.P.; Marchi, C.S.; Foulk, J.W.; Dadfarnia, M.; Sofronis, P. The Relationship Between Crack-Tip Strain and Subcritical Cracking Thresholds for Steels in High-Pressure Hydrogen Gas. Metall. Mater. Trans. A 2013, 44, 248–269. [Google Scholar] [CrossRef]
  36. San Marchi, C.; Somerday, B.P.; Nibur, K.A.; Stalheim, D.G.; Boggess, T.; Jansto, S. Fracture Resistance and Fatigue Crack Growth of X80 Pipeline Steel in Gaseous Hydrogen. In Proceedings of the ASME 2011 Pressure Vessels and Piping Conference, Baltimore, MD, USA, 17–21 July 2011. [Google Scholar]
  37. Stalheim, D.; Boggess, T.; San Marchi, C.; Jansto, S.; Somerday, B.; Muralidharan, G.; Sofronis, P. Microstructure and Mechanical Property Performance of Commercial Grade API Pipeline Steels in High Pressure Gaseous Hydrogen. In Proceedings of the 2010 8th International Pipeline Conference, Calgary, AB, Canada, 27 September–1 October 2010. [Google Scholar]
  38. Nishihara, Y.; Okano, H. Effect of High Pressure Hydrogen Gas on Fatigue and Fracture Properties of API X65 LinepIpe Steels. In Proceedings of the ASME 2023 Pressure Vessels & Piping Conference, Atlanta, GA, USA, 16–21 July 2023. [Google Scholar]
  39. San Marchi, C.; Somerday, B.P.; Nibur, K.A.; Stalheim, D.G.; Boggess, T.; Jansto, S. Fracture and Fatigue of Commercial Grade API Pipeline Steels in Gaseous Hydrogen. In Proceedings of the ASME 2010 Pressure Vessels and Piping Division/K-PVP Conference, Bellevue, WA, USA, 18–22 July 2010. [Google Scholar]
  40. Hoover, W.R.; Robinson, S.L.; Stoltz, R.E.; Spingarn, J.R. Hydrogen Compatibility of Structural Materials for Energy Storage and Transmission; Final Report; Sandia Labs.: Livermore, CA, USA, 1981.
  41. Hoover, W.R.I.; Robinson, S.L.; Stoltz, R.E.; Spingarn, J.R. Hydrogen Compatibility of Structural Materials for Energy Storage and Transmission; Annual Report; University of North Texas Libraries, UNT Digital Library: Denton, TX, USA, 1980; Available online: https://digital.library.unt.edu (accessed on 5 May 2025).
  42. Gutierrez-Solana, F.; Elices, M. High-Pressure Hydrogen Behavior of a Pipeline Steel. In Current Solutions to Hydrogen Problems in Steels; Interrante, C.G., Pressouyre, G.M., Eds.; American Society for Metals: Metals Park, OH, USA, 1982; pp. 181–185. [Google Scholar]
  43. Álvarez, G.; Peral, L.; Rodríguez, C.; García, T.; Belzunce, F. Hydrogen embrittlement of structural steels: Effect of the displacement rate on the fracture toughness of high-pressure hydrogen pre-charged samples. Int. J. Hydrogen Energy 2019, 44, 15634–15643. [Google Scholar] [CrossRef]
  44. Álvarez, G.; Zafra, A.; Belzunce, F.; Rodríguez, C. Hydrogen embrittlement testing procedure for the analysis of structural steels with Small Punch Tests using notched specimens. Eng. Fract. Mech. 2021, 253, 107906. [Google Scholar] [CrossRef]
  45. Cialone, H.J.; Holbrook, J.H. Sensitivity of Steels to Degradation in Gaseous Hydrogen; ASTM International: West Conshohocken, PA, USA, 1988. [Google Scholar]
  46. Zawierucha, R.; Kang, X. Hydrogen pipeline steels. Mater. Sci. Technol. 2005, 3, 5. [Google Scholar]
  47. Duncan, A.; Lam, P.-S.; Adams, T. Tensile Testing of Carbon Steel in High Pressure Hydrogen. In Proceedings of the ASME 2007 Pressure Vessels and Piping Conference, San Antonio, TX, USA, 22–26 July 2007. [Google Scholar]
  48. ASTM E1820-18; ASTM E1820-18: Standard Test Method for Measurement of Fracture Toughness. ASTM International: West Conshohocken, PA, USA, 2018. [CrossRef]
  49. Duncan, A.J.; Adams, T.M.; Lam, P.-S. Fracture Property Testing of Carbon Steel in High Pressure Hydrogen. In Proceedings of the ASME 2009 Pressure Vessels and Piping Conference, Prague, Czech Republic, 26–30 July 2009. [Google Scholar]
  50. ASTM E399-17; Standard Test Method for Linear-Elastic Plane-Strain Fracture Toughness of Metallic Materials. ASTM International: West Conshohocken, PA, USA, 2017. [CrossRef]
  51. Morgan, M.; Tosten, M.H.; Chapman, G.K. The Effects of Hydrogen, Tritium, and Heat Treatment on the Deformation and Fracture Toughness Properties of Stainless Steel. In Proceedings of the 2012 International Hydrogen Conference, Moran, WM, USA, 9–12 September 2012. [Google Scholar]
  52. Li, J.; Jin, L.; Dong, J.; Wang, F.; Dong, S. Effects of microstructure on fracture toughness of wrought Mg-8Gd-3Y-0.5Zr alloy. Mater. Charact. 2019, 157, 109899. [Google Scholar] [CrossRef]
  53. Alam, M.E.; Wang, J.; Henager, C.; Setyawan, W.; Odette, G. The effect of hot rolling on the strength and fracture toughness of 90W–7Ni3Fe tungsten heavy metal alloys. Mater. Sci. Eng. A Struct. Mater. Prop. Microstruct. Process. 2021, 824, 141738. [Google Scholar] [CrossRef]
  54. Pedregosa, F.; Varoquaux, G.; Gramfort, A.; Michel, V.; Thirion, B.; Grisel, O.; Blondel, M.; Prettenhofer, P.; Weiss, R.; Dubourg, V.; et al. Scikit-learn: Machine Learning in Python. J. Mach. Learn. Res. 2011, 12, 2825–2830. [Google Scholar]
  55. El Morr, C.; Jammal, M.; Ali-Hassan, H.; El-Hallak, W. (Eds.) K-Nearest Neighbors. In Machine Learning for Practical Decision Making: A Multidisciplinary Perspective with Applications from Healthcare; Engineering and Business Analytics; Springer International Publishing: Cham, Switzerland, 2022; pp. 301–318. [Google Scholar]
  56. Lee, J.A. 17—Hydrogen embrittlement of nickel, cobalt and iron-based superalloys. In Gaseous Hydrogen Embrittlement of Materials in Energy Technologies; Gangloff, R.P., Somerday, B.P., Eds.; Woodhead Publishing: Sawston, UK, 2012; pp. 624–667. [Google Scholar]
  57. Park, I.-J.; Lee, S.M.; Jeon, H.H.; Lee, Y.K. The advantage of grain refinement in the hydrogen embrittlement of Fe–18Mn–0.6C twinning-induced plasticity steel. Corros. Sci. 2015, 93, 63–69. [Google Scholar] [CrossRef]
  58. Moustafa, M.A. Effect of iron content on the formation of β-Al5FeSi and porosity in Al–Si eutectic alloys. J. Mater. Process. Technol. 2009, 209, 605–610. [Google Scholar] [CrossRef]
  59. Hirsch, P.B. Fracture, Plastic Flow and Structural Integrity in the Nuclear Industry: Proceedings of the 7th Symposium Organised by the Technical Advisory Group on Structural Integrity in the Nuclear Industry; CRC Press: Boca Raton, FL, USA, 2019. [Google Scholar]
  60. Krauss, G.; Committee, A.H. Microstructures, Processing, and Properties of Steels. In Properties and Selection: Irons, Steels, and High-Performance Alloys; ASM International: Materials Park, OH, USA, 1990; pp. 126–139. [Google Scholar]
  61. Effects of Mn, P, S, Si & V on the Mechanical Properties of Steel. Available online: https://leonghuat.com/articles/elements.htm (accessed on 15 January 2025).
  62. Dong, F.; Venezuela, J.; Li, H.; Shi, Z.; Zhou, Q.; Chen, L.; Chen, J.; Du, L.; Atrens, A. The influence of phosphorus on the temper embrittlement and hydrogen embrittlement of some dual-phase steels. Mater. Sci. Eng. A 2022, 854, 143379. [Google Scholar] [CrossRef]
  63. Barnoush, A.; Vehoff, H. Recent developments in the study of hydrogen embrittlement: Hydrogen effect on dislocation nucleation. Acta Mater. 2010, 58, 5274–5285. [Google Scholar] [CrossRef]
  64. Barthélémy, H. Effects of pressure and purity on the hydrogen embrittlement of steels. Int. J. Hydrogen Energy 2011, 36, 2750–2758. [Google Scholar] [CrossRef]
  65. Zheng, C.; Li, L.; Yang, W.; Sun, Z. Relationship between microstructure and yield strength for plain carbon steel with ultrafine or fine (ferrite+cementite) structure. Mater. Sci. Eng. A 2014, 617, 31–38. [Google Scholar] [CrossRef]
  66. Turk, A.; Joshi, G.R.; Gintalas, M.; Callisti, M.; Rivera-Díaz-del-Castillo, P.E.J.; Galindo-Nava, E.I. Quantification of hydrogen trapping in multiphase steels: Part I—Point traps in martensite. Acta Mater. 2020, 194, 118–133. [Google Scholar] [CrossRef]
  67. Nanninga, N.; Slifka, A.; Levy, Y.; White, C. A review of fatigue crack growth for pipeline steels exposed to hydrogen. J. Res. Natl. Inst. Stand. Technol. 2010, 115, 437–452. [Google Scholar] [CrossRef] [PubMed]
  68. Röthig, M.; Hoschke, J.; Tapia, C.; Venezuela, J.; Atrens, A. A review of gas phase inhibition of gaseous hydrogen embrittlement in pipeline steels. Int. J. Hydrogen Energy 2024, 60, 1239–1265. [Google Scholar] [CrossRef]
  69. Robinson, S.L.; Stoltz, R.E. Toughness Losses and Fracture Behavior of Low Strength Carbon-Manganese Steels in Hydrogen. In Hydrogen Effects in Metals; Bernstein, I.M., Thompson, A.W., Eds.; The Metallurgical Society of AIME: Warrendale, PA, USA, 1981; pp. 987–995. [Google Scholar]
  70. Shang, J.; Wang, J.Z.; Chen, W.F.; Wei, H.T.; Zheng, J.Y.; Hua, Z.L.; Zhang, L.; Gu, C.H. Different effects of pure hydrogen vs. hydrogen/natural gas mixture on fracture toughness degradation of two carbon steels. Mater. Lett. 2021, 296, 129924. [Google Scholar] [CrossRef]
  71. Xu, K. Hydrogen embrittlement of carbon steels and their welds. In Gaseous Hydrogen Embrittlement of Materials in Energy Technologies; Gangloff, R.P., Somerday, B.P., Eds.; Woodhead Publishing: Sawston, UK, 2012; Volume 2, pp. 526–561. [Google Scholar] [CrossRef]
  72. Nguyen, T.T.; Heo, H.M.; Park, J.; Nahm, S.H.; Beak, U.B. Fracture properties and fatigue life assessment of API X70 pipeline steel under the effect of an environment containing hydrogen. J. Mech. Sci. Technol. 2021, 35, 1445–1455. [Google Scholar] [CrossRef]
  73. Steiner, M.; Marewski, U.; Silcher, H. DVGW Project SyWeSt H2: “Investigation of Steel Materials for Gas Pipelines and Plants for Assessment of their Suitability with Hydrogen”; Final Report; DVGW-Hauptgeschäftsstelle: Bonn, Germany, 2023. [Google Scholar]
Figure 1. Flow diagram of modeling approach.
Metals 15 00588 g001
Figure 2. Box plot visualizations depicting the distribution of the data.
Metals 15 00588 g002
Figure 3. Pie chart illustrating feature importance based on 35% of our data with complete heat treatment reporting.
Metals 15 00588 g003
Figure 4. Cross–correlation matrix plot of selected features.
Metals 15 00588 g004
Figure 5. Performance comparison of four ML models based on 5-fold cross validation: (a) k-nearest neighbors, (b) random forest, (c) decision tree, (d) gradient boosting.
Metals 15 00588 g005
Figure 6. Cross-plot of KNN predicted FT vs. measured.
Metals 15 00588 g006
Figure 7. Importance of relevant features in the KNN model.
Metals 15 00588 g007
Figure 8. Results of sensitivity analysis: (a) fracture toughness vs. hydrogen; and (b) HE index vs. hydrogen.
Metals 15 00588 g008
Figure 9. Fracture toughness vs. yield stress.
Metals 15 00588 g009
Figure 10. Fracture toughness vs. oxygen content for X70.
Metals 15 00588 g010
Figure 11. FT vs. displacement rate without hydrogen (a) and with hydrogen (b); and HE index vs. displacement rate (c).
Metals 15 00588 g011
Figure 12. Predicted FT vs. measured FT. ▪ R & S [69], □ S. et al. [70], ◦ Xu [71], + N. et al. [72], * S. et al. [73].
Metals 15 00588 g012
Table 1. Data sources and descriptions.
ReferencesNumber of Data PointsTest Parameter RangesSpecimen
Type
Standard Used
Pressure
(MPa)
Displacement
Rate (mm/min)
Álvarez et al. [43]819.50.001–0.1DENASTM E1820 [48] Equivalent
Álvarez et al. [44]619.50.1–0.001SENASTM E1820 [48]
Cialone and Holbrook [45]94.14–6.90.012–0.12CTASTM E1820 [48]
Duncan et al. [47,49]1710.31.272ASASTM E399 [50]
Gutierrez-Solana & Elices [42]10457040.15SENASTM E1820 [48]
Hoover et al. [40,41]53.5–34.50.51DENASTM E1820 [48] Equivalent
Hoover et al. [40]96.90.51SENASTM E1820 [48]
Nishihara and Okano [38]3250.12CTASTM E1820 [48]
Peral et al. [8]3619.50.01–1CTASTM E1820 [48]
Ronevich, et al. [33]371000.005CT/ASASTM E1820 [48]/E399 [50]
Ronevich, et al. [34]81.4–210.005–0.05CTASTM E1820 [48]
San Marchi et al. [36]421–1030.005CTASTM E1820 [48]
San Marchi et al. [39]85.5–210.0055CTASTM E1820 [48]
Stalheim et al. [37]45.5–20.70.005CTASTM E1820 [48]
Zawierucha & Kang [46]113.5–20.70.05CTASTM E1820 [48]
CT = compact tension specimen, SBN = single edge notch specimen, DEN = double edge notch specimen, AS = arc-shaped specimen.
Table 2. Features affecting fracture toughness and their ranges in the database.
CategoriesParametersRange
(Min/Max)
Units
Chemical PropertiesIron (Fe)93.86/99.604%
Carbon (C)0.03/0.49%
Manganese (Mn)0.04/1.72%
Phosphorus (P)0.0/0.033%
Sulfur (S)0.00/0.035%
Silicon (Si)0.014/1.08%
Copper (Cu)0.00/0.31%
Aluminum (Al)0.00/0.42%
Other *0.00/5.36%
Mechanical Properties and Test ConditionsYield Strength (Su)280/1086MPa
Ultimate Strength (Su)415/1198MPa
Fracture toughness (FT)20/393MPa√m
Hydrogen Partial Pressure0.10/97.00MPa
Displacement Rate1.272/0.001mm/min
Heat TreatmentDifferent heating treatment-
Product FormDiverse product +-
Oxygen5/100ppm
Carbon dioxide0/0.69Mpa
* Total concentration of minor alloying elements such as Mo, Ni, Cr, Nb, and Ti. + Pipeline, structural steel, pressure vessel (seamless pipe test rings).
Table 3. Results of feature importance analysis.
ModelLevel of Importance
1st2nd3rd
KNNHydrogen PressureYield strengthOther
GBHydrogen PressureYield strengthOther
RFHydrogen PressureYield strengthOther
DTHydrogen PressureYield strengthOther
SVMSiMnP
ANNFeMnHydrogen
CatBoostPSiYield strength
Table 4. Model performance parameters.
ModelCoefficient of DeterminationRMSEMAE
Train R2Test R2∆R2
RF0.770.760.0141.4129.06
DT0.780.730.0544.4333.99
GB0.820.800.0238.4128.72
KNN0.850.840.0133.5725.95
max0.850.840.0546.7333.99
min0.770.700.0133.5725.95
Table 5. Summary of model performance parameter ranking and feature importance rating.
ModelStatistical Metrics RankingCross-Validation RankingFeature Important Rating
Train R2Test R2∆R2RMSEMAEPressureYSOthersDR
RF4th3rd3rd3rd3rd3rd1st2nd3rd4th
DT3rd4th4th4th4th4th1st2nd3rd4th
GB2nd2nd2nd2nd2nd2nd1st2nd3rd4th
KNN1st1st1st1st1st1st1st2nd1st4th
Displacement rate (DR) and yield strength (YS).
Table 6. Baseline input parameters for sensitivity analysis.
ParameterX70X60X52
Hydrogen pressure (MPa)222
DR (mm/min)0.020.020.02
Oxygen Content (ppm)000
Yield Strengths (MPa)483414359
Material
composition (%)
Fe97.8198.0498.57
C0.050.220.30
Mn0.521.431.11
P0.0160.0130.013
Si0.230.080.02
Cu0.020.060.08
Al0.040.010.01
Other *0.310.1471.279
* Mo, Ni, Cr, Nb, Ti, and others.
Disclaimer/Publisher’s Note: The statements, opinions and data contained in all publications are solely those of the individual author(s) and contributor(s) and not of MDPI and/or the editor(s). MDPI and/or the editor(s) disclaim responsibility for any injury to people or property resulting from any ideas, methods, instructions or products referred to in the content.

