Abstract
As a third-generation advanced high-strength steel (AHSS), δ-TRIP steel exhibits the characteristics of high strength, high plasticity, and low density. However, the addition of Al to steel will affect solidification and segregation, which may impact the final microstructure and mechanical properties of the product. In this study, thermodynamic calculations and microsegregation model analysis were employed to investigate the effects of Al addition on the solidification path, peritectic reaction range, equilibrium partition coefficients, and microsegregation behavior of δ-TRIP steel. The results show that with an increase in the Al content, the carbon content range in which δ ferrite is retained without complete transformation during the solid-state phase transition becomes broader. Simultaneously, the carbon concentration range of the peritectic zone expands. The segregation of the C, Si, Mn, P, and S elements increases with increasing Al content, whereas the segregation of Al decreases as the Al content increases. Under non-equilibrium solidification conditions, unlike equilibrium solidification, the temperature difference between the solid and liquid phases initially increases, then decreases, and subsequently levels off with further Al addition. This study provides information for the composition design and production process optimization of δ-TRIP steel, and the research results can provide a reference for similar high-aluminum, low-density steels.
1. Introduction
In recent years, the automobile industry has experienced rapid development, with lightweighting emerging as a key focus for its future progress [1]. As a third-generation advanced high-strength steel for automotive applications, δ-TRIP steel offers high strength, high ductility, and low density. This material system has garnered significant research attention in recent years [2,3,4].
When Al is added to steel, much of the research focuses on the precipitation of inclusions [5,6,7] and the changes in the final microstructure and properties [8,9,10]. δ-TRIP steel relies on significant concentrations of ferrite-stabilizing solutes (Al) so that δ ferrite, which forms during solidification, is retained in the microstructure [11]. During the solidification process of δ-TRIP steel, the peritectic reaction will occur, which will bring difficulties to its continuous casting production [12,13]. As a ferrite-stabilizing element, Al can expand the ferrite region and increase the C content range within which the peritectic reaction occurs in the iron–carbon phase diagram [14]. Xu et al. [15] showed that in low-alloy steel, Al will increase the carbon content of the peritectic point, and the calculation formula of the peritectic point was fit and established. Ren et al. [16] showed that the peritectic range is affected by the interaction of each element, rather than the effect of each element alone. Thermodynamic calculation is very suitable for predicting solidification patterns and has good accuracy [17,18,19]. Therefore, it is necessary to use thermodynamic methods to study the changes in the peritectic reaction range and ferrite zone at higher Al contents.
During the solidification process of metals, the redistribution of solute elements within the solid–liquid coexistence zone leads to compositional variations at the grain scale (or within individual grains), referred to as microsegregation. This phenomenon affects the mechanical properties and corrosion resistance of castings and can also contribute to macrosegregation [20]. Although the segregation behavior can be reduced or weakened by adjusting the continuous casting process [21,22], sub-rapid solidification [23], and under-pressure process [24], during the reheating process, elements with low diffusion rates in the solid phase—particularly Al and Mn—are unable to achieve chemical homogenization. Consequently, segregation formed during solidification may persist throughout subsequent processing stages and exert a substantial influence on the formation of banded microstructures, especially Al, which has been identified as having the greatest impact on the formation of band structures in high-strength TRIP-assisted dual-phase (DP) steels [25].
In the actual solidification process, the microsegregation phenomenon is caused by the solute distribution between the liquid phase and the solid phase (liquidus/solidus). Solute redistribution can be observed and quantified in the solid phase—more precisely, at the solid–liquid (S/L) interface. Microsegregation cannot be measured because it is “destroyed” by diffusion into the solid during solidification. However, solute microsegregation can be theoretically calculated as a temporary phenomenon at the temporary S/L interface, which needs to be mathematically described. The Scheil model [26] can properly describe the microsegregation that occurs on the moving S/L interface and satisfy the mass balance. However, this model does not consider diffusion into the solid. The Brody–Flemings model [27] can simultaneously describe both solute microsegregation and solute redistribution after back diffusion by adding the α-back diffusion parameter. Its disadvantage is that the α-back diffusion parameter tends to infinity.
The Brody–Flemings model incorporates the effects of back diffusion in the solid by introducing an α back diffusion parameter, enabling a more comprehensive description of solute redistribution and microsegregation. A notable drawback of this model is that the α parameter may approach infinity under certain conditions, which complicates its physical interpretation and computational stability. Clyne-Kurz et al. [28] and Kobayashi et al. [29] modified the Brody–Flemings model to make the α-back diffusion parameter more reasonable in the calculation process. Ohnaka [30], Voler, and Beckermann [31], You [32], Wolczynski [33], Han [34], and other researchers further supplemented the parameters and computational methods of the microsegregation models. Among them, Won et al. [35] comprehensively considered the corrections to the α-back diffusion parameter, dendrite morphology, and dendrite coarsening in their work and proposed the Won–Thomas model, which has been widely applied in the analysis of microsegregation during steel solidification. In the microsegregation model, the equilibrium partition coefficient (k) is an important physical parameter, which determines the redistribution behavior and segregation characteristics of the solute elements during the solidification process of the alloy, and has a significant impact on the prediction results [32,36]. The equilibrium partition coefficient, calculated based on thermodynamic databases, can be employed to investigate the influence of different alloying elements on solute redistribution [37]. When applied to microsegregation models, such thermodynamically derived distribution coefficients can substantially enhance the accuracy of the predictions [32,34,37]. Due to the relatively high Al content in δ-TRIP steel, the influence of Al addition on the equilibrium partition coefficient and microsegregation behavior during solidification remains insufficiently understood. Therefore, a combination of thermodynamic databases and microsegregation models can be used to study the effect of Al on the solute redistribution and microsegregation behavior during the solidification of δ-TRIP steel.
This study focuses on the basic composition of δ-TRIP steel, which is Fe-0.4C-0.5Si-2Mn-0.006P-0.003S-xAl. Thermodynamic calculations and a microsegregation model are employed to investigate the effect of Al addition on the δ ferrite solidification retention range and peritectic reaction zone. The relationship between the equilibrium partition coefficients of solute elements and the changes in temperature and the Al content is analyzed. A microsegregation model with variable equilibrium partition coefficients is established to examine the influence of Al on the microsegregation of solute elements and the solidification path in the steel. The findings of this research can provide valuable insights into the composition design and process optimization of δ-TRIP steel.
2. Thermodynamic Simulations
2.1. Thermodynamic Calculation
The FactSage 8.2 thermodynamic calculation software was used to perform thermodynamic calculations on the experimental compositions of Fe-C-0.5Si-2Mn-0.006P-0.003S-xAl. The Phase Diagram module was employed to calculate pseudo-binary Fe-C equilibrium phase diagrams under different Al contents, where x = 0, 1, 3, 5, 7, and 9 wt% were selected for the phase diagram calculations.
In order to compare the composition evolution of solute elements during the solidification of steel with varying Al contents, and based on the phase diagram results, the C content was fixed at 0.4 wt%, while only the Al and Fe contents were varied. The Equilib module in FactSage was employed for multicomponent, multiphase equilibrium calculations. The chemical compositions used in the calculations are listed in Table 1. The FSstel database was utilized for thermodynamic data. The maximum and minimum temperatures selected exceeded the actual solid–liquid phase transformation range, with a temperature step of 2 °C. The “Phase Transitions (Normal + Transformations)” option was selected to determine the phase transition temperatures.

Table 1.
Composition and number of test steel, wt%.
With the increasing application of thermodynamic databases, researchers [34,37] have calculated solute concentrations at different temperatures based on various compositional systems to obtain temperature-dependent equilibrium partition coefficients. In this study, the temperature-dependent equilibrium partition coefficient is used to calculate microsegregation. The calculation formula for the equilibrium partition coefficient ki of solute i between the solid and liquid phases is given as follows:
where CS,i is the concentration of the solute in the solid phase, and CL,i is the concentration of the solute in the liquid phase.
2.2. Microsegregation Model
In recent years, many scholars have made different assumptions about the microsegregation behavior of elements in steel and obtained various microsegregation models. This study adopts the microsegregation model proposed by Won and Thomas [35]. The model assumes that the solute is fully diffused in the liquid phase and that diffusion is limited in the solid phase. It also takes into account the effects of diffusion factor correction and dendrite coarsening. The fundamental form is as follows:
where CL,i (wt%) is the concentration of element i in the liquid phase at the solid–liquid interface; C0,i (wt%) is the initial content of element i; fs is the solid phase ratio; βi is the diffusion factor of element i; ki is the equilibrium partition coefficient of element i; αi is the Fourier number of element i; αi+ is the corrected Fourier number of element i; αc is the correction coefficient, which is taken as 0.1 here; DS,i (cm2/s) is the diffusion coefficient of element i in the solid phase; tf (s) is the local solidification time; and X (cm) is the range of the diffusion area, which is half of the secondary dendrite spacing (λSDAS/2).
In light of the fact that the equilibrium partition coefficient is susceptible to influence from a number of factors, including the composition of the alloy and the temperature at which the solidification process occurs, the conventional approach to microsegregation model research entails the use of 0~fs for integral solution. The fundamental equation is represented by Equation (2), and the equilibrium partition coefficient of the calculation process is a constant. The solute equilibrium partition coefficient at different temperatures can be calculated with the assistance of thermodynamic software such as FactSage. The semi-integral form of the microsegregation model [32,34] is used for solution to improve the accuracy of the calculation results. This study uses a model with a variable equilibrium partition coefficient. During the solidification process, the equilibrium partition coefficient and diffusion coefficient at the corresponding solid phase ratio are used to solve the solute composition at the solid phase ratio. The calculation formula is as follows [38]:
where n is the calculation step.
Based on the above analysis, in this study, the microsegregation behavior of elements in steel is calculated using Equations (2)–(6).
2.3. Calculation Parameters of Microsegregation Model
2.3.1. Secondary Dendrite Spacing λSDAS and Local Solidification Time tf
The secondary dendrite spacing λSDAS is calculated using the following equation [35]:
The local solidification time tf (s) is the temperature difference between the solidus and liquidus divided by the cooling rate:
where Tliq (K) and Tsol (K) are the liquidus temperature and solidus temperature of steel, respectively, and Rcool (K/s) is the cooling rate. In this study, Rcool = 10/60 K/s is taken, and the liquidus temperature and solidus temperature of steel are calculated by FactSage.
2.3.2. Relationship Between fs and T
In this study, the corresponding relationship between fs and temperature is needed. The temperature can be obtained by using the solidification path calculated by FactSage or by using an empirical formula. This study uses the empirical formula for calculation, which is as follows [39]:
where T0 is the melting point of pure iron, which is 1538 °C.
2.3.3. Equilibrium Partition Coefficient, ki
In this study, a variable equilibrium partition coefficient was applied in the microsegregation model calculations, with the values obtained using FactSage. For the L + δ + γ three-phase region in which the peritectic reaction occurs, a mixed-parameter approach was adopted [38], without distinguishing the specific phase transformation processes. The partition coefficient k(δ(+γ)/L) was used for the calculations. To ensure the continuity of parameters across the entire temperature range, linear interpolation of k was performed during the calculation process.
2.3.4. Diffusion Coefficients
The diffusion coefficients of solute elements in different phases are shown in Table 2. In the calculation process, the diffusion coefficients in the L + δ + γ three-phase region are calculated using Equation (10):
where Vδ and Vγ are the volume fractions of the δ phase and the γ phase in the solid phase, respectively. The calculation process of the volume fraction is detailed in reference [40].
Table 2.
Diffusion coefficients of the solute elements [41].
3. Result and Discussion
3.1. Effect of Al Content on Peritectic Range and δ Ferrite Solidification Retention Range
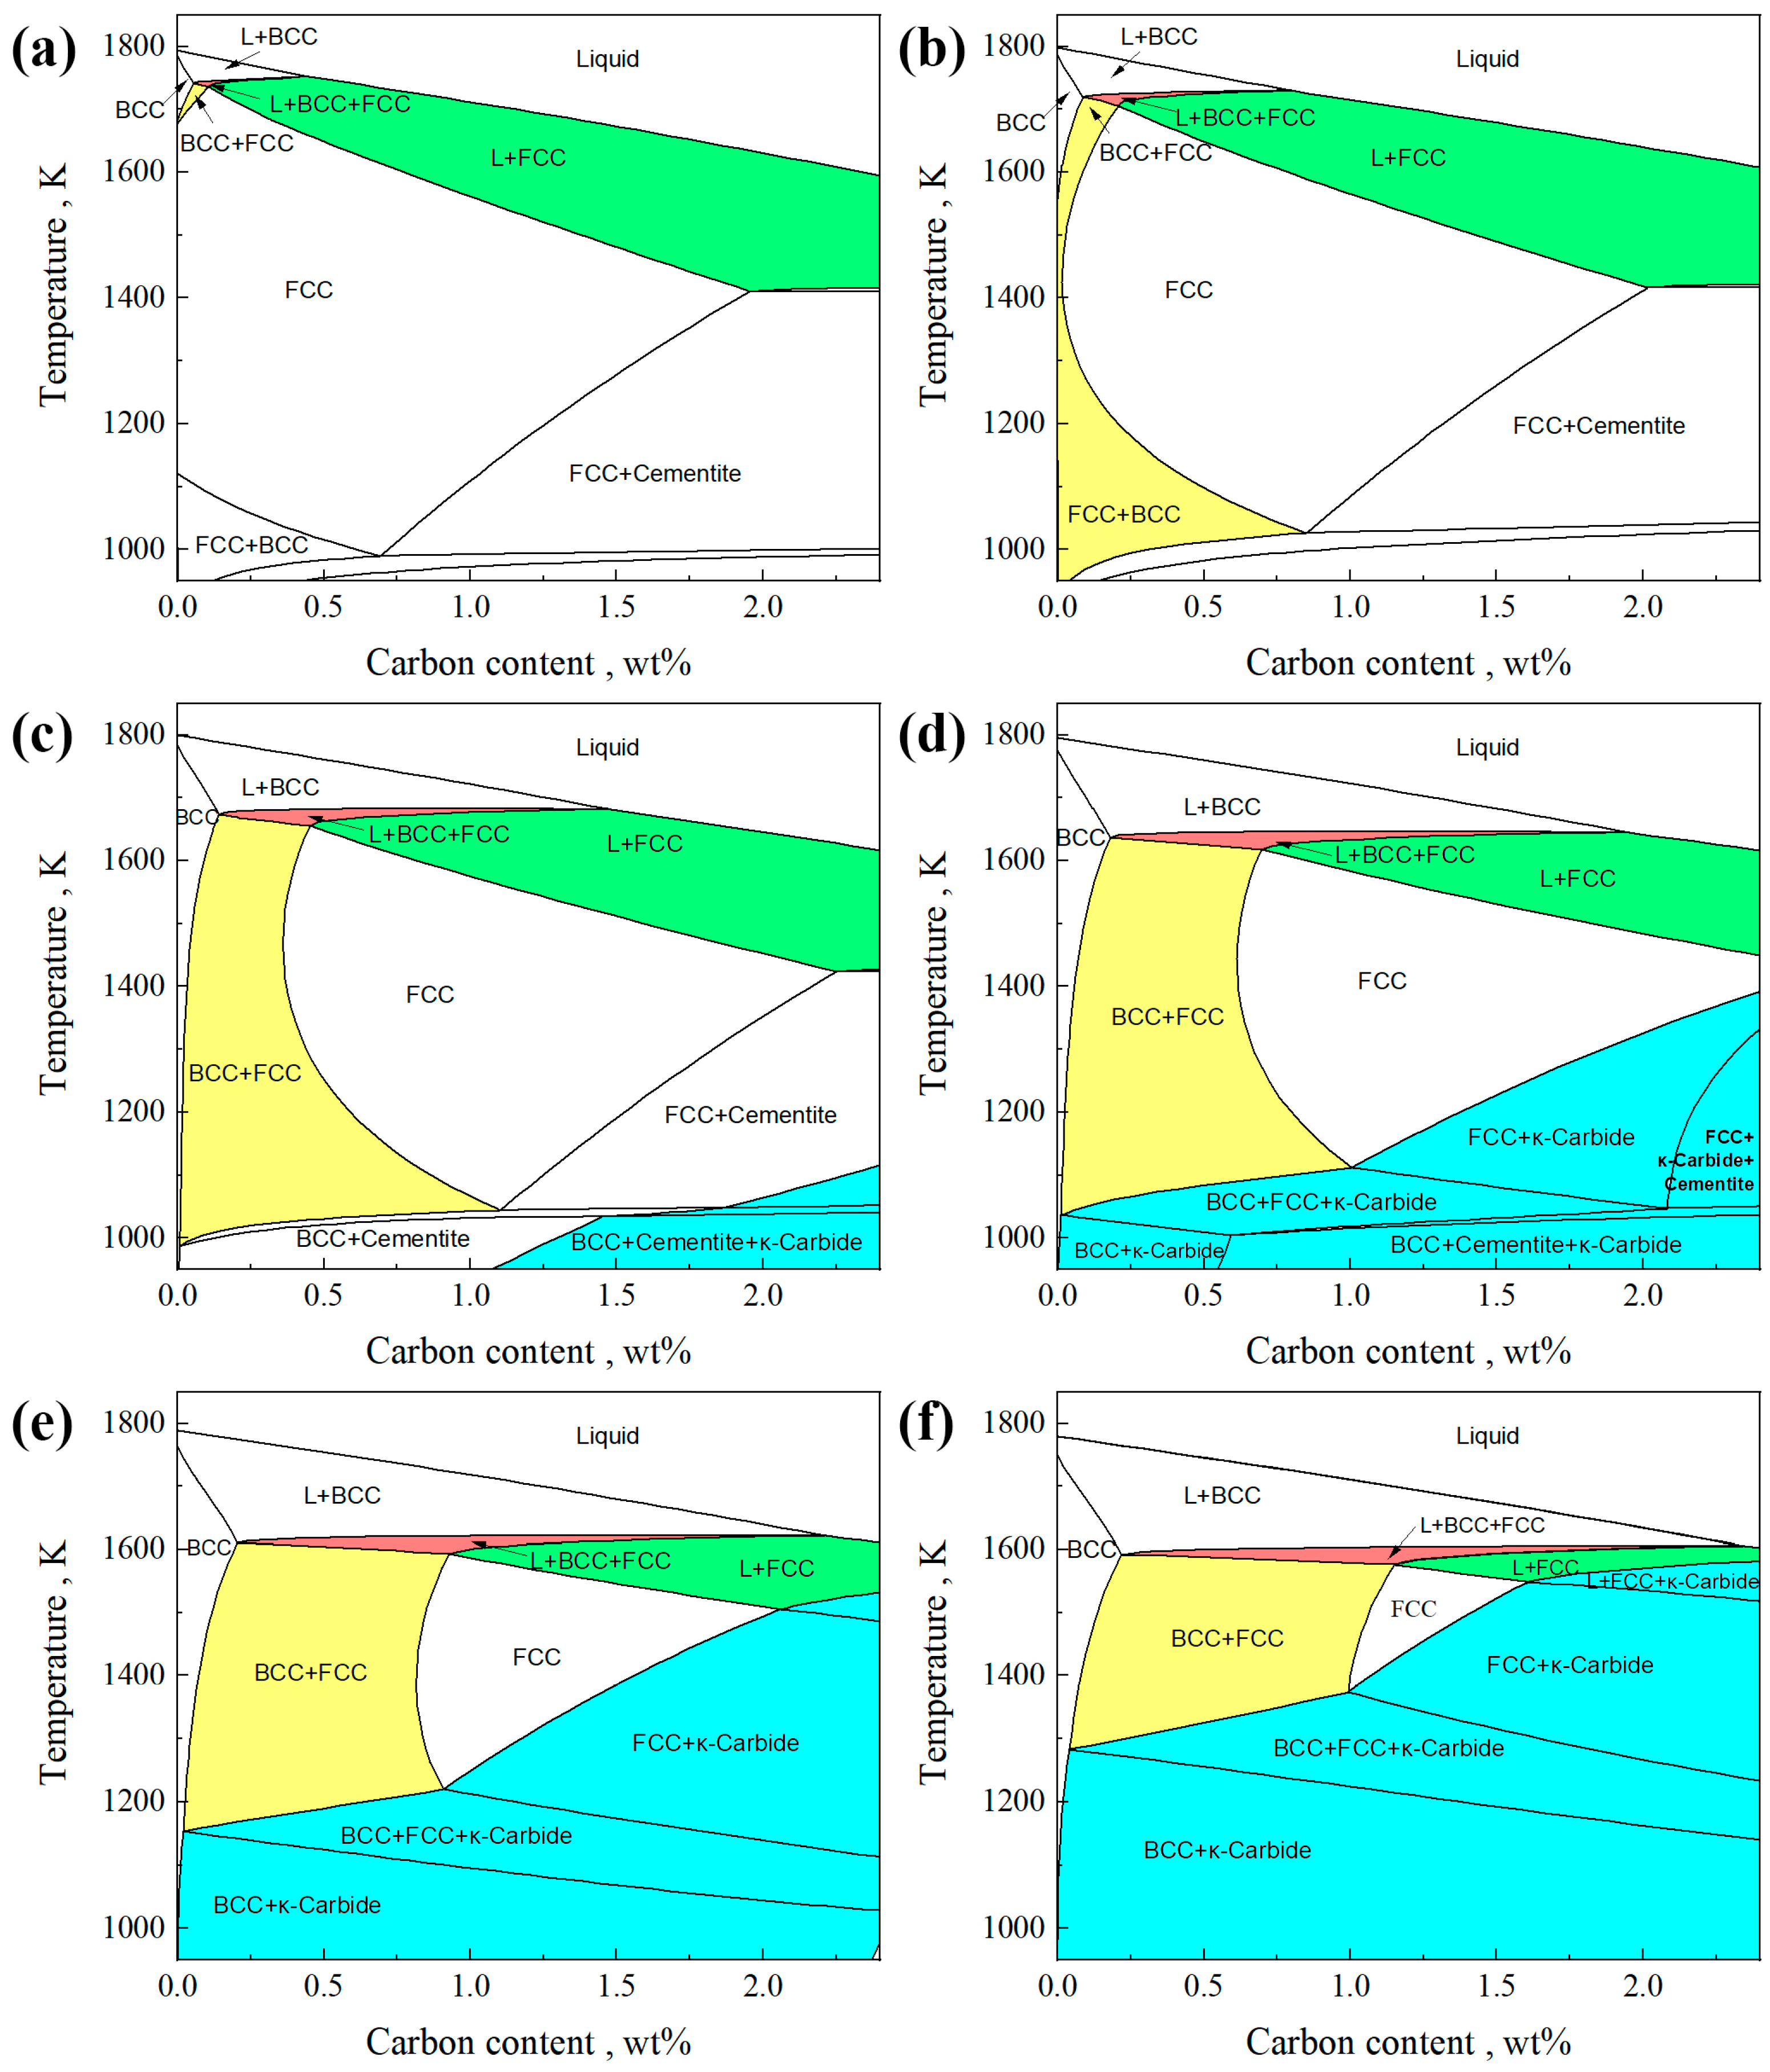
Figure 1 shows a pseudo-binary iron-carbon phase diagram of Fe-C-0.5Si-2Mn-0.006P-0.003S-(0,1,3,5,7,9)Al. It should be noted that MnS exists in the solid phase region of the phase diagram, and its curve almost overlaps with the solid phase line. We have hidden it in the phase diagram to make the result clearer. As shown in Figure 1, when the Al content is 0 or 1, within the calculation range, the solidification process passes through the γ single-phase region (FCC), and the initially solidified δ ferrite phase (BCC) is not retained. When the Al content is 3, 5, 7, or 9, the solidification path L→L + BCC(δ)→L + BCC(δ) + FCC(γ)→BCC(δ or δ + α) + FCC(γ) appears in the phase diagram. Under this solidification path, a portion of ferrite is retained without transformation from the δ phase to the γ phase. At the same time, as the Al content increases, the carbon content range in the BCC + FCC two-phase region expands. The addition of Al increases the precipitation temperature of κ-carbide.

Figure 1.
Pseudo-binary iron–carbon phase diagram of Fe-C-0.5Si-2Mn-0.006P-0.003S-xAl. The BCC is δ ferrite or α ferrite + δ ferrite, and the FCC is γ austenite. (a) 0 wt% Al, (b) 1 wt% Al, (c) 3 wt% Al, (d) 5 wt% Al, (e) 7 wt% Al, (f) 9 wt% Al.
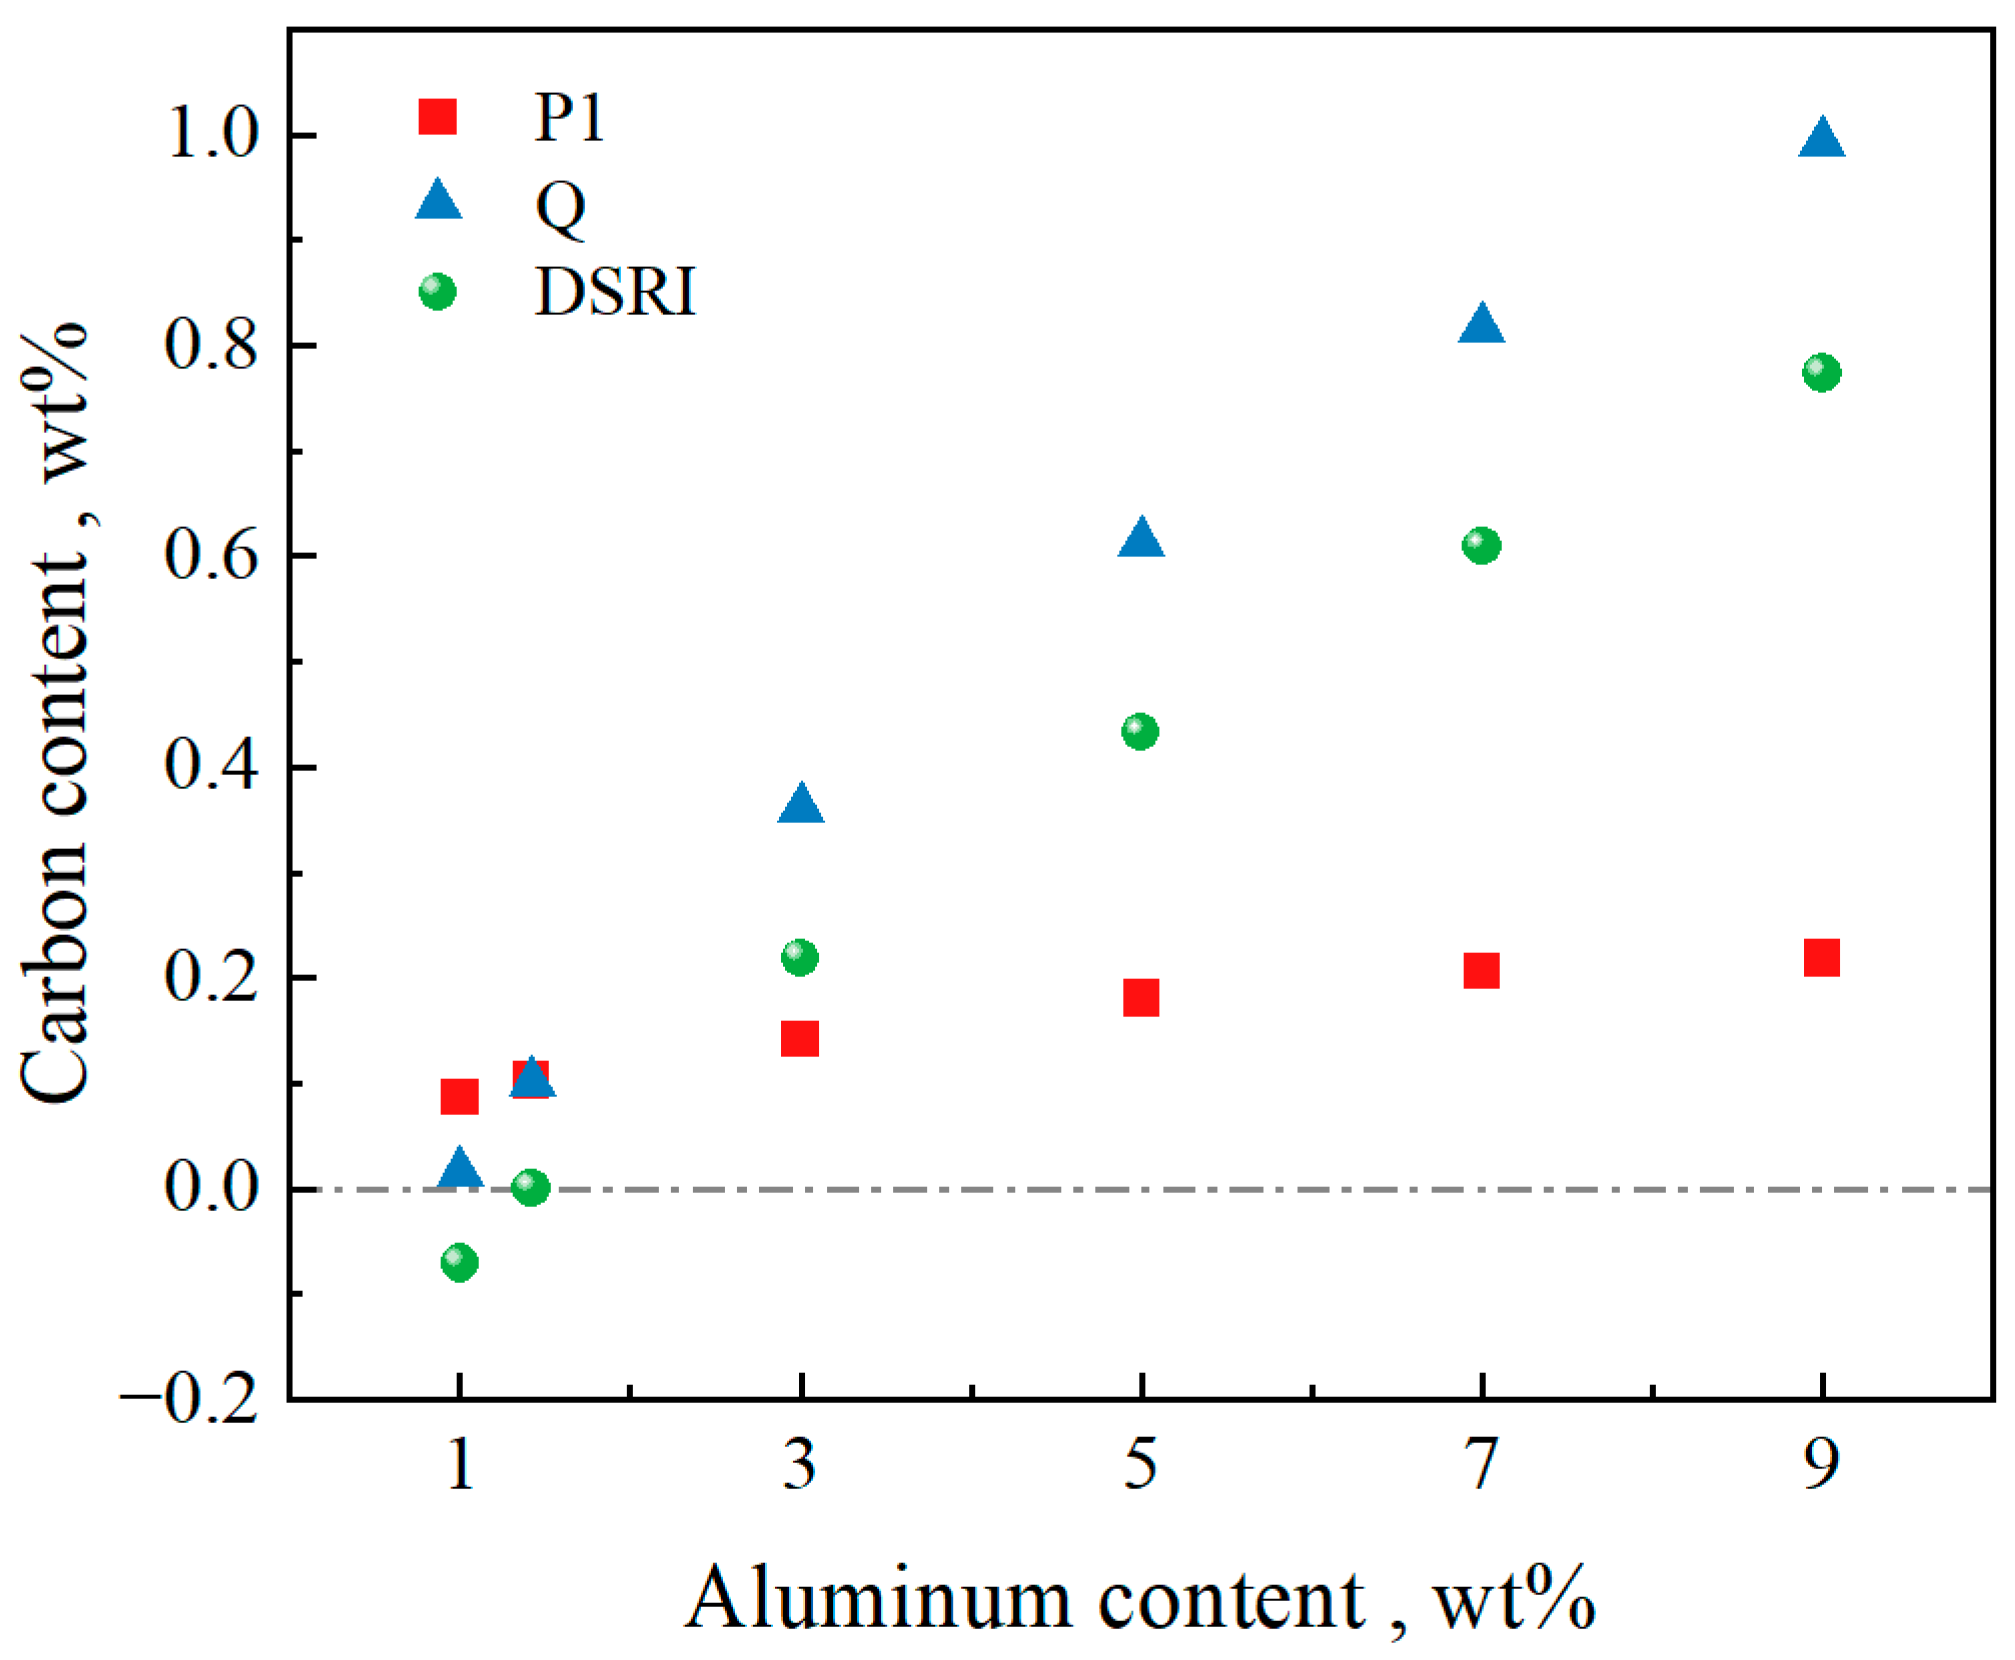
To investigate the effect of the Al content on the peritectic region and the δ ferrite solidification retention range, characteristic points on the phase diagram were identified and recorded. The locations of these characteristic points are illustrated in Figure 2. When the carbon content lies within the range from point P1 to P2, the steel undergoes a peritectic reaction during solidification. Point P0 represents the peritectic point, compositions between P1 and P0 correspond to hypoperitectic steels, while those between P0 and P2 correspond to hyperperitectic steels. Point Q is the leftmost point of the boundary between the BCC + FCC and FCC phases. For carbon contents ranging from P1 to Q, the δ ferrite will not completely disappear during the entire solid-state phase transition process after solidification. The steel with a C content in this range follows the phase transformation process in the δ-TRIP steel. For clarity, this carbon content range is named as the DSRI (Delta-ferrite Solidification Retention Interval). Figure 2 identifies the DSRI through yellow highlighting.
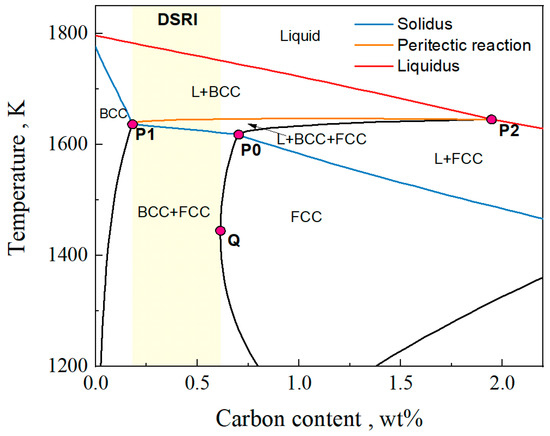
Figure 2.
Schematic diagram of iron–carbon phase diagram.
Figure 3 shows the relationship between the DSRI and Al content. When the Al content is 1, the DSRI is negative, that is, there is no C content range in which δ ferrite is retained at room temperature. In this composition system, when the Al content reaches 1.42 wt%, the DSRI is close to zero and the carbon concentration at the Q point is 0.101 wt%. In the range of Al content of 1~9 wt%, the DSRI increases by about 0.2 wt% for every 2 wt% increase in the Al content. This indicates that the addition of Al will expand the range of the C content in which the δ ferrite solid-state phase transformation process will not completely disappear.
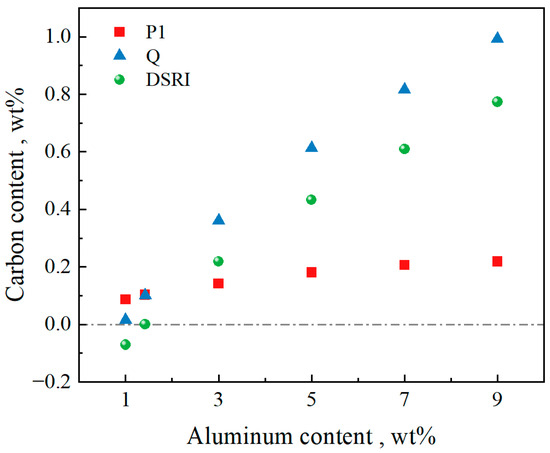
Figure 3.
Characteristic point C content range related to the DSRI.
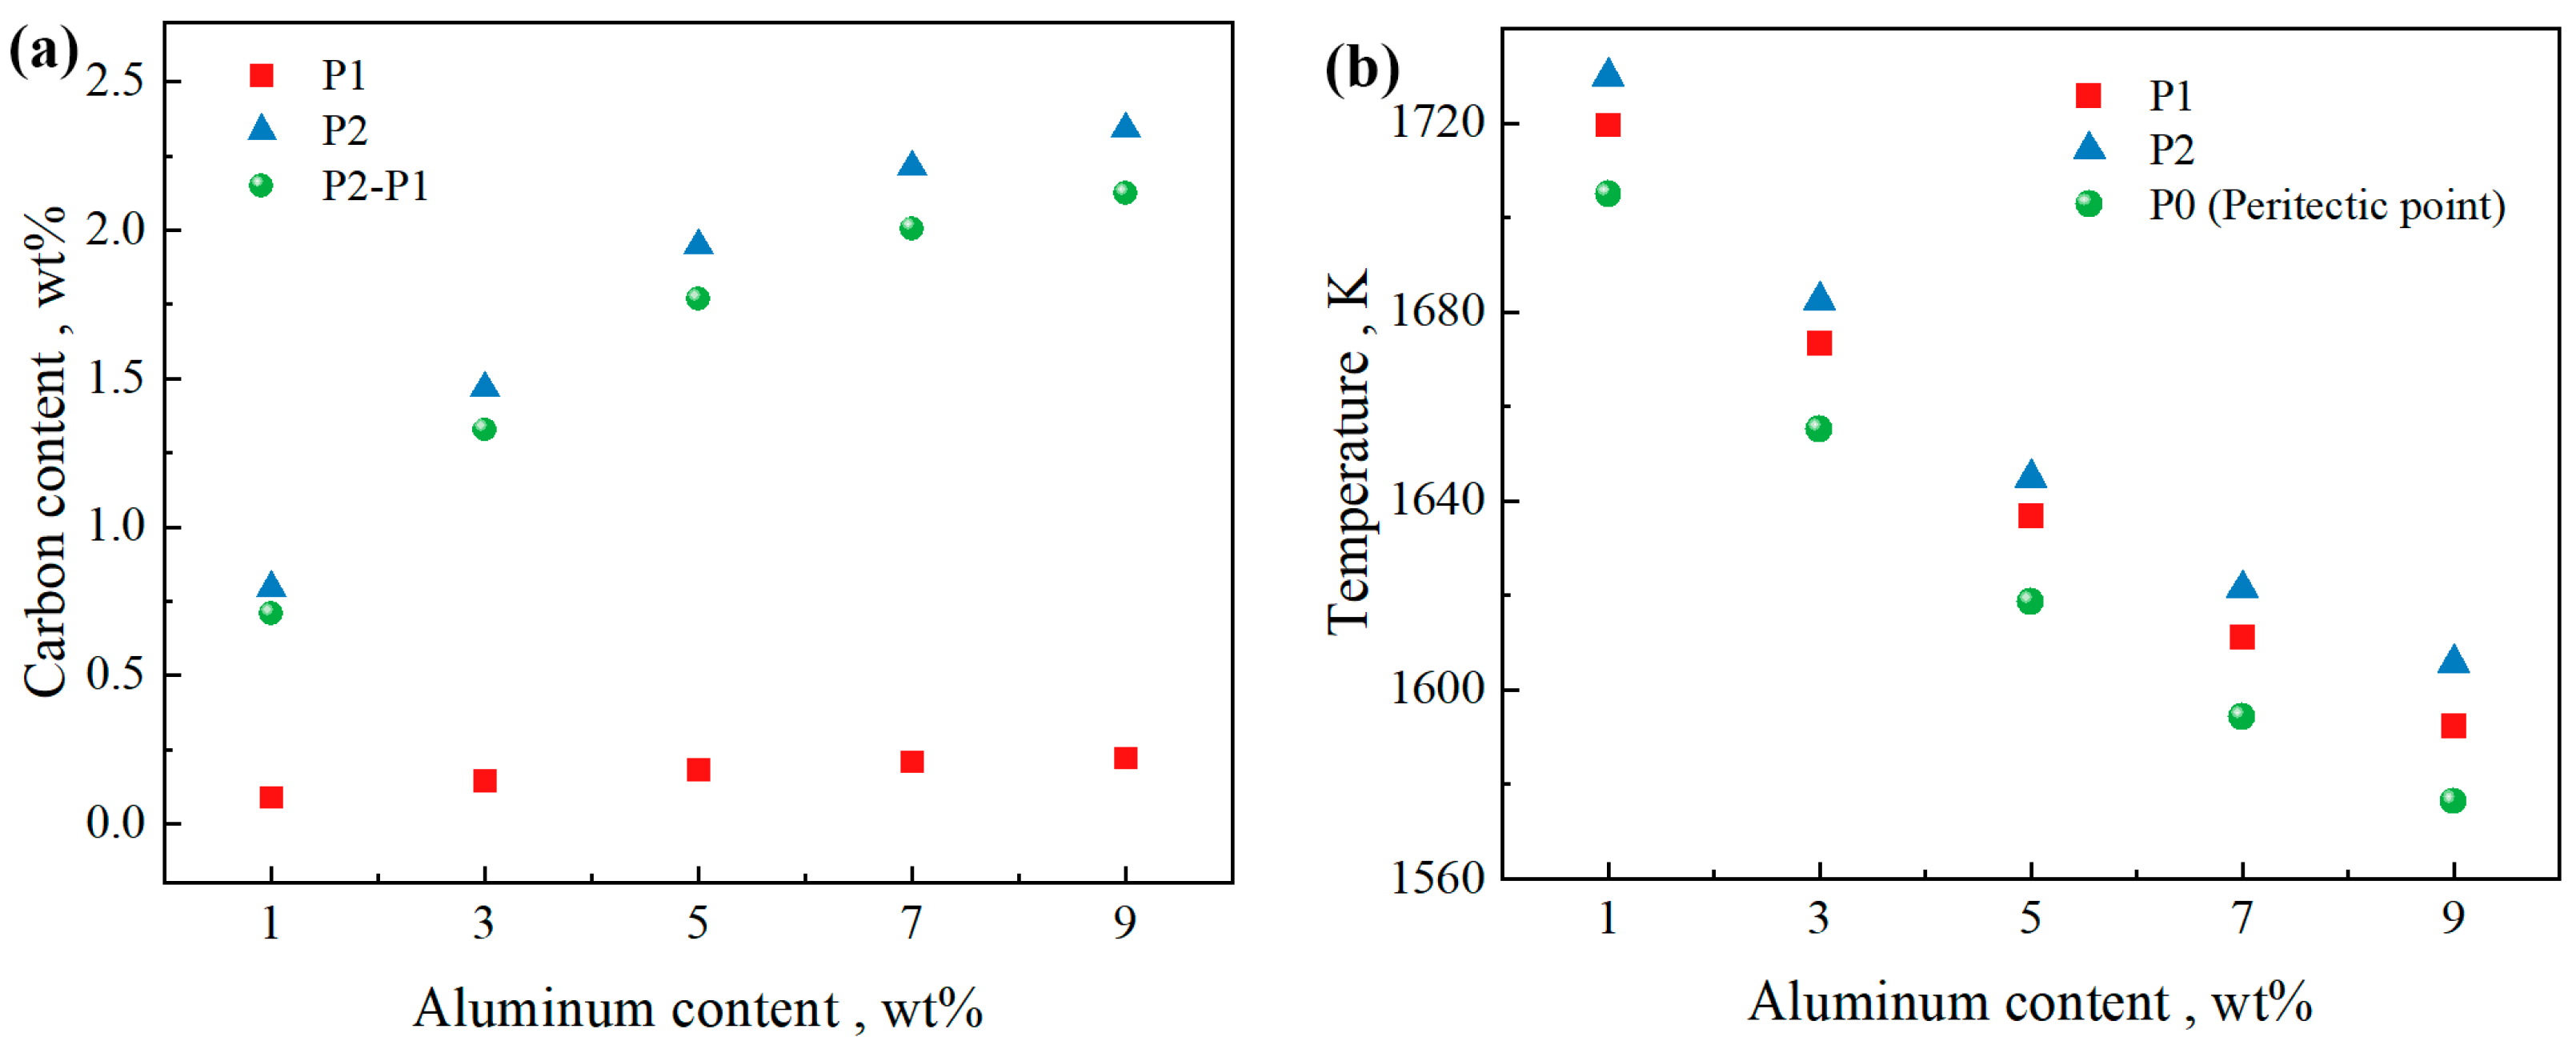
Figure 4a illustrates the relationship between the carbon content range of the peritectic reaction and the Al content. Within the Al content range of 1 to 9 wt%, the carbon content range of the peritectic reaction increases by approximately 0.35 wt% for every 2 wt% increase in Al. Figure 4b presents the temperatures of the characteristic points. When the Al content is in the range of 1 to 9, the temperature of the peritectic point P0 gradually decreases, while the corresponding carbon content increases. This indicates that increasing the Al content shifts the peritectic point toward lower temperatures and higher carbon concentrations. As the Al content increases, the peritectic zone expands and moves to the right, which indicates that at the same C content, the volume fraction of the liquid phase decreases when the peritectic reaction begins (lever rule), and the peritectic reaction occurs later in the solidification process. The peritectic reaction causes volume shrinkage and is prone to cracks [13]. Additionally, in the late stage of solidification, the ability of the residual liquid phase to compensate for shrinkage cavities is significantly reduced. If the solid phase fraction is greater than 0.9, the cracking zone cannot be refilled with the liquid because the dendrite arms are close enough to resist feeding of the liquid. The risk of crack formation increases.
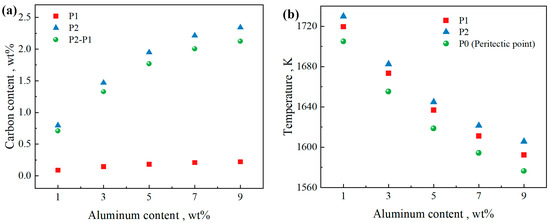
Figure 4.
Characteristic points related to peritectic reaction. (a) C content and (b) temperature versus Al content.
3.2. Effect of Temperature on the Phenomenon of Partitioning
Based on the results of the phase diagram calculations, a steel with the composition Fe-0.4C-0.5Si-2Mn-5Al-0.006P-0.003S (in wt%) was selected for multicomponent, multiphase equilibrium thermodynamic calculations. The temperature-dependent variation of the equilibrium partition coefficients for each element in δ-TRIP steel with 5 wt% Al content was investigated. The difference in the equilibrium partition coefficient between the δ phase and the γ phase was analyzed, aiming to better understand the element partitioning behavior during the solidification process.
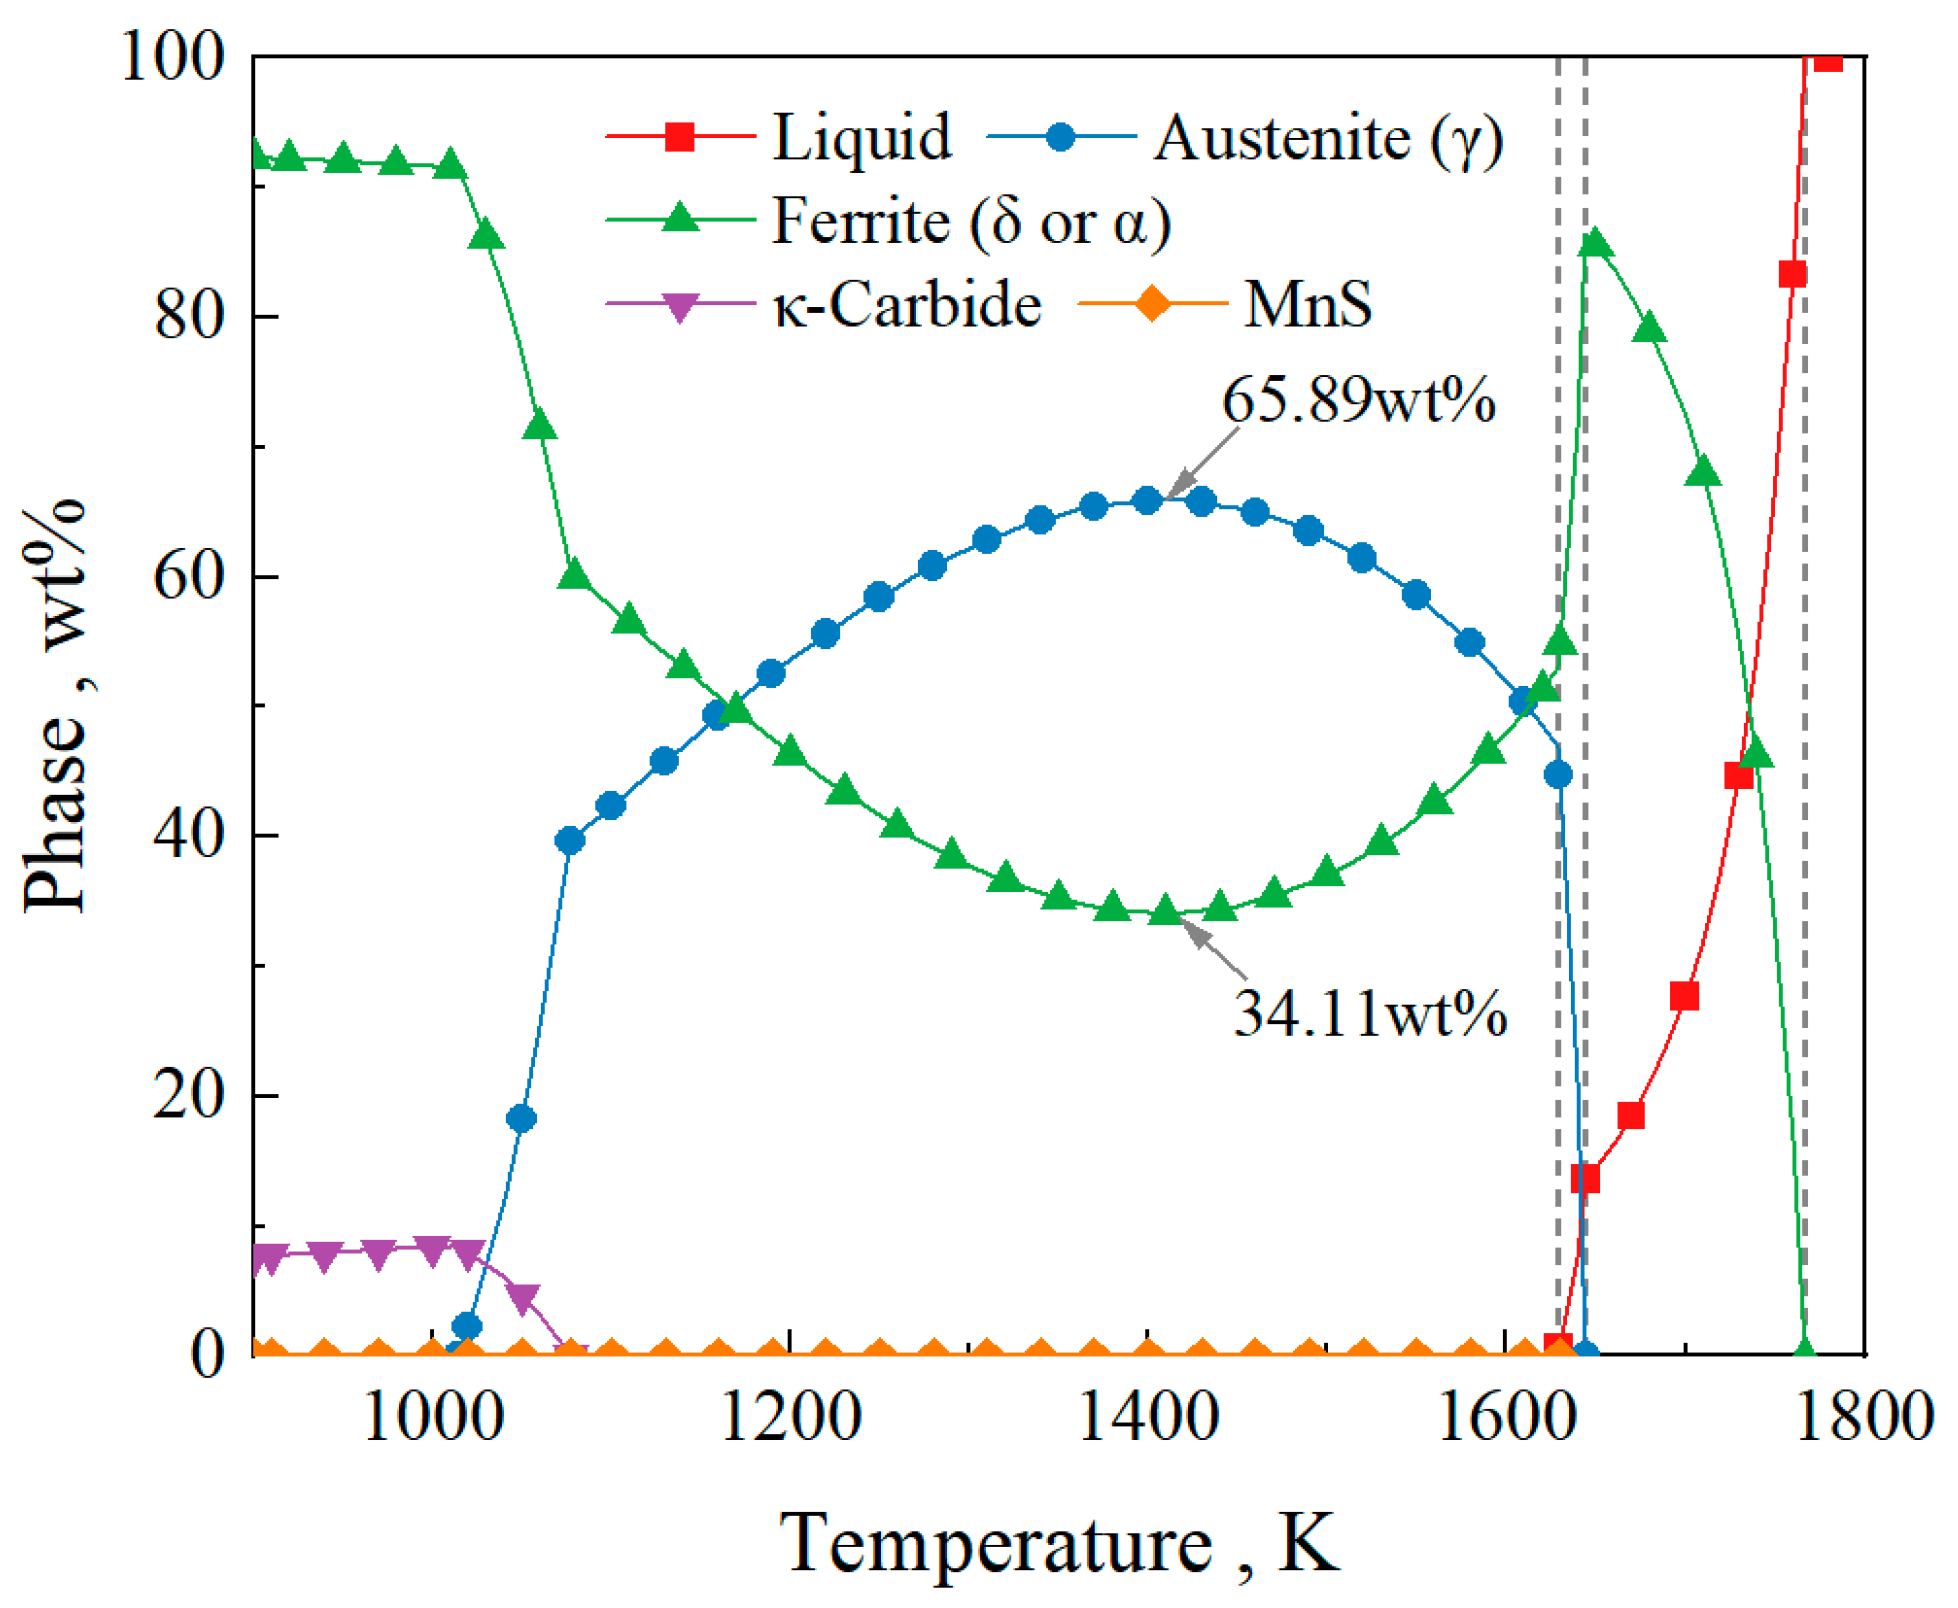
Figure 5 shows the phase transformation path of the Fe-0.4C-0.5Si-2Mn-5Al-0.006P-0.003S steel during equilibrium solidification. As shown in the figure, solidification begins at 1767.00 K with the precipitation of the δ ferrite phase (L→L + δ). The δ ferrite phase fraction increases and reaches a maximum of 86.42 wt% at 1644.42 K. From this temperature, the peritectic reaction (L + δ→L + γ + δ) initiates. At 1629.00 K, the liquid phase disappears, and the δ→γ transformation begins. The transformation of δ ferrite into γ austenite reaches its peak at 1410 K, with a γ phase fraction of 65.88 wt%, leaving 34.11 wt% of the δ ferrite phase untransformed. Subsequently, the γ→α transformation occurs. At 1014.23 K, all the γ austenite in the steel transforms into α ferrite. During the solidification process, MnS precipitates at 1629.57 K, and κ-carbide precipitates at 1077.28 K. During the equilibrium solidification process, theoretically, the remaining δ ferrite in the steel at room temperature is 34.11%.

Figure 5.
The phase transformation path of the Fe-0.4C-0.5Si-2Mn-5Al-0.006P-0.003S steel.
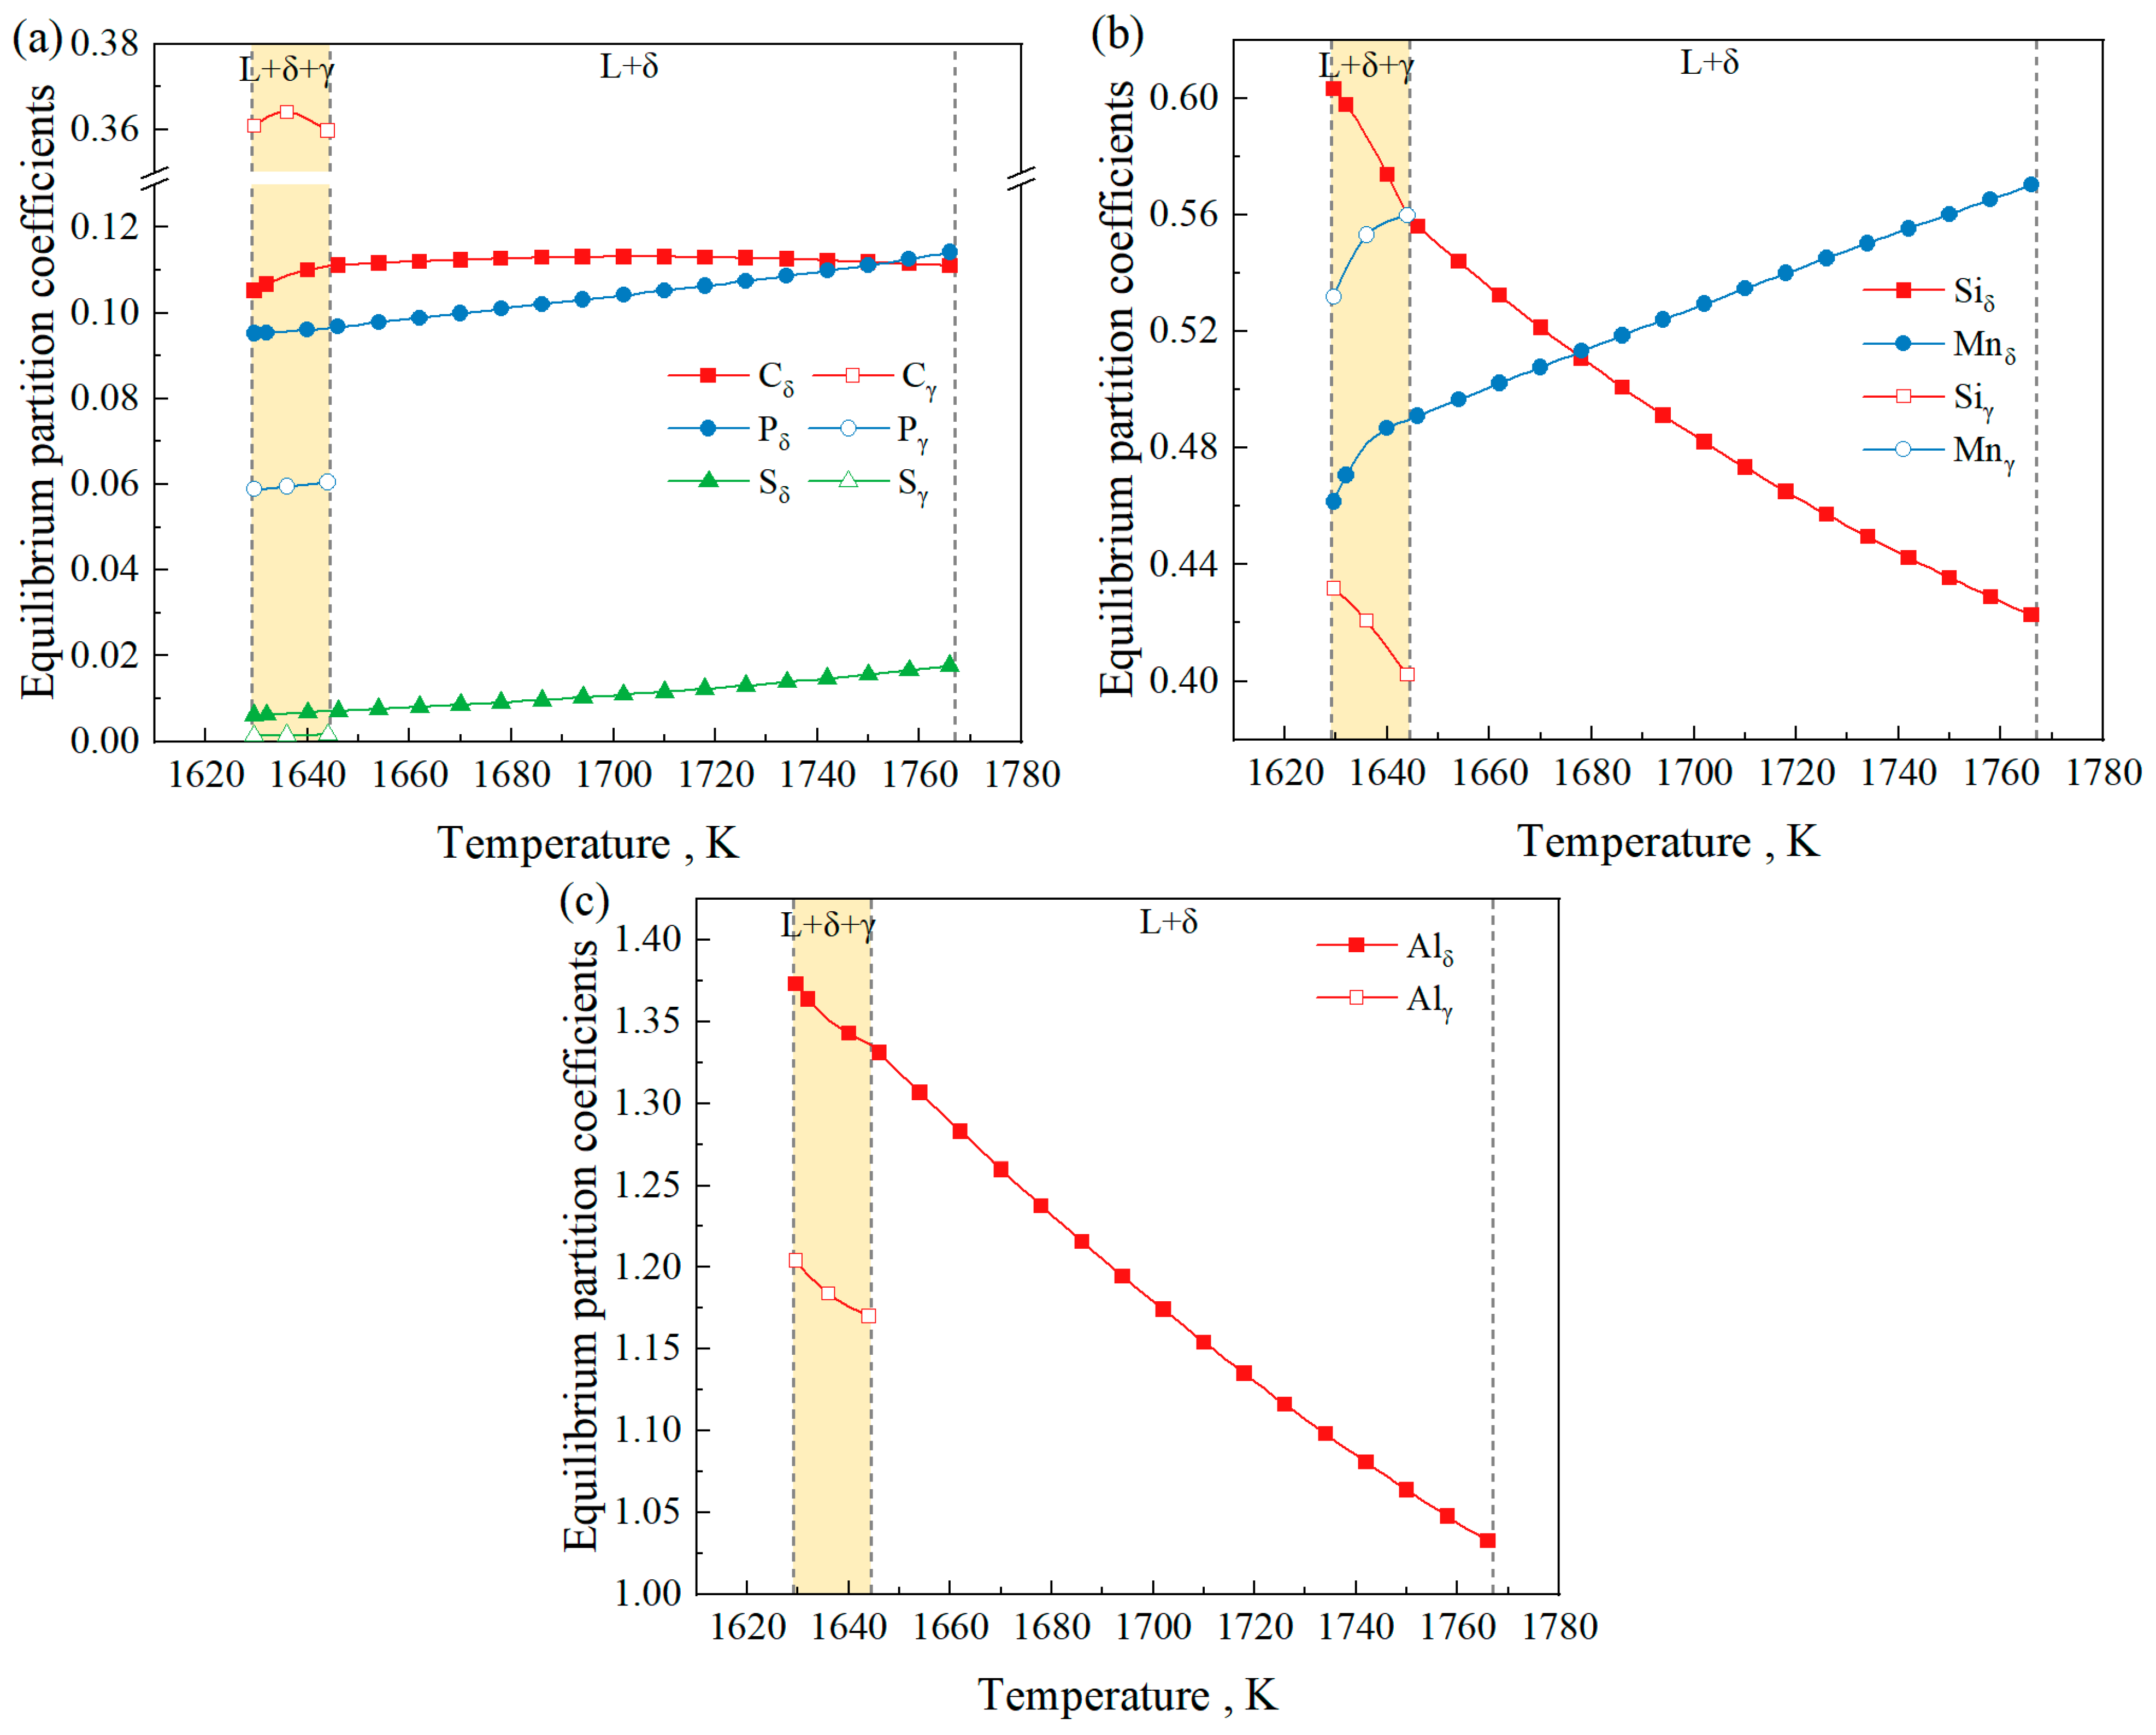
Figure 6 shows the equilibrium partition coefficients of Fe-0.4C-0.5Si-2Mn-5Al-0.006P-0.003S steel at different temperatures, and the value of 1644.42 K marked in the figure corresponds to the peritectic reaction temperature. It can be seen from the figure that the equilibrium partition coefficient of Al is greater than 1, which is a negative segregation element, consistent with the research of Shen et al. [42]. In the δ phase and γ phase, the equilibrium partition coefficients of Mn, P, and S decrease as the temperature decreases, while the equilibrium partition coefficients of Si and Al increase with decreasing temperature. The equilibrium partition coefficient of C in the δ phase shows a trend of initially decreasing, followed by an increase with decreasing temperature. Among the different phases, the partition coefficients of C and Mn in the δ phase are lower than those in the γ phase, whereas the partition coefficients of Si, P, S, and Al in the δ phase are higher than those in the γ phase. Regarding the variation in the equilibrium partition coefficient of each element in the δ phase and the γ phase with temperature, the calculated results of this system are consistent with those of the study of Wang et al. (20CrMnTi steel) [43] and Gui et al. (high-sulfur steel) [37]. The difference is that since the research system of reference [43] is hyper-peritectic steel, the liquid phase and the γ phase coexist for a longer time, so that at lower temperatures for 20CrMnTi steel, the equilibrium partition coefficients of Si and Al in the γ phase exceed those in the δ phase.
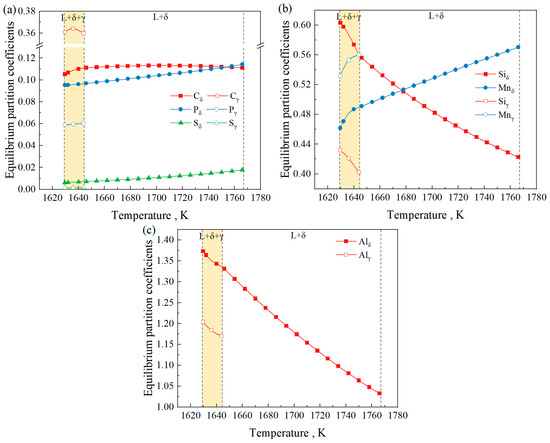
Figure 6.
The equilibrium partition coefficients of Fe-0.4C-0.5Si-2Mn-5Al-0.006P-0.003S steel at different temperatures. (a) C, P, and S; (b) Si and Mn; (c) Al.
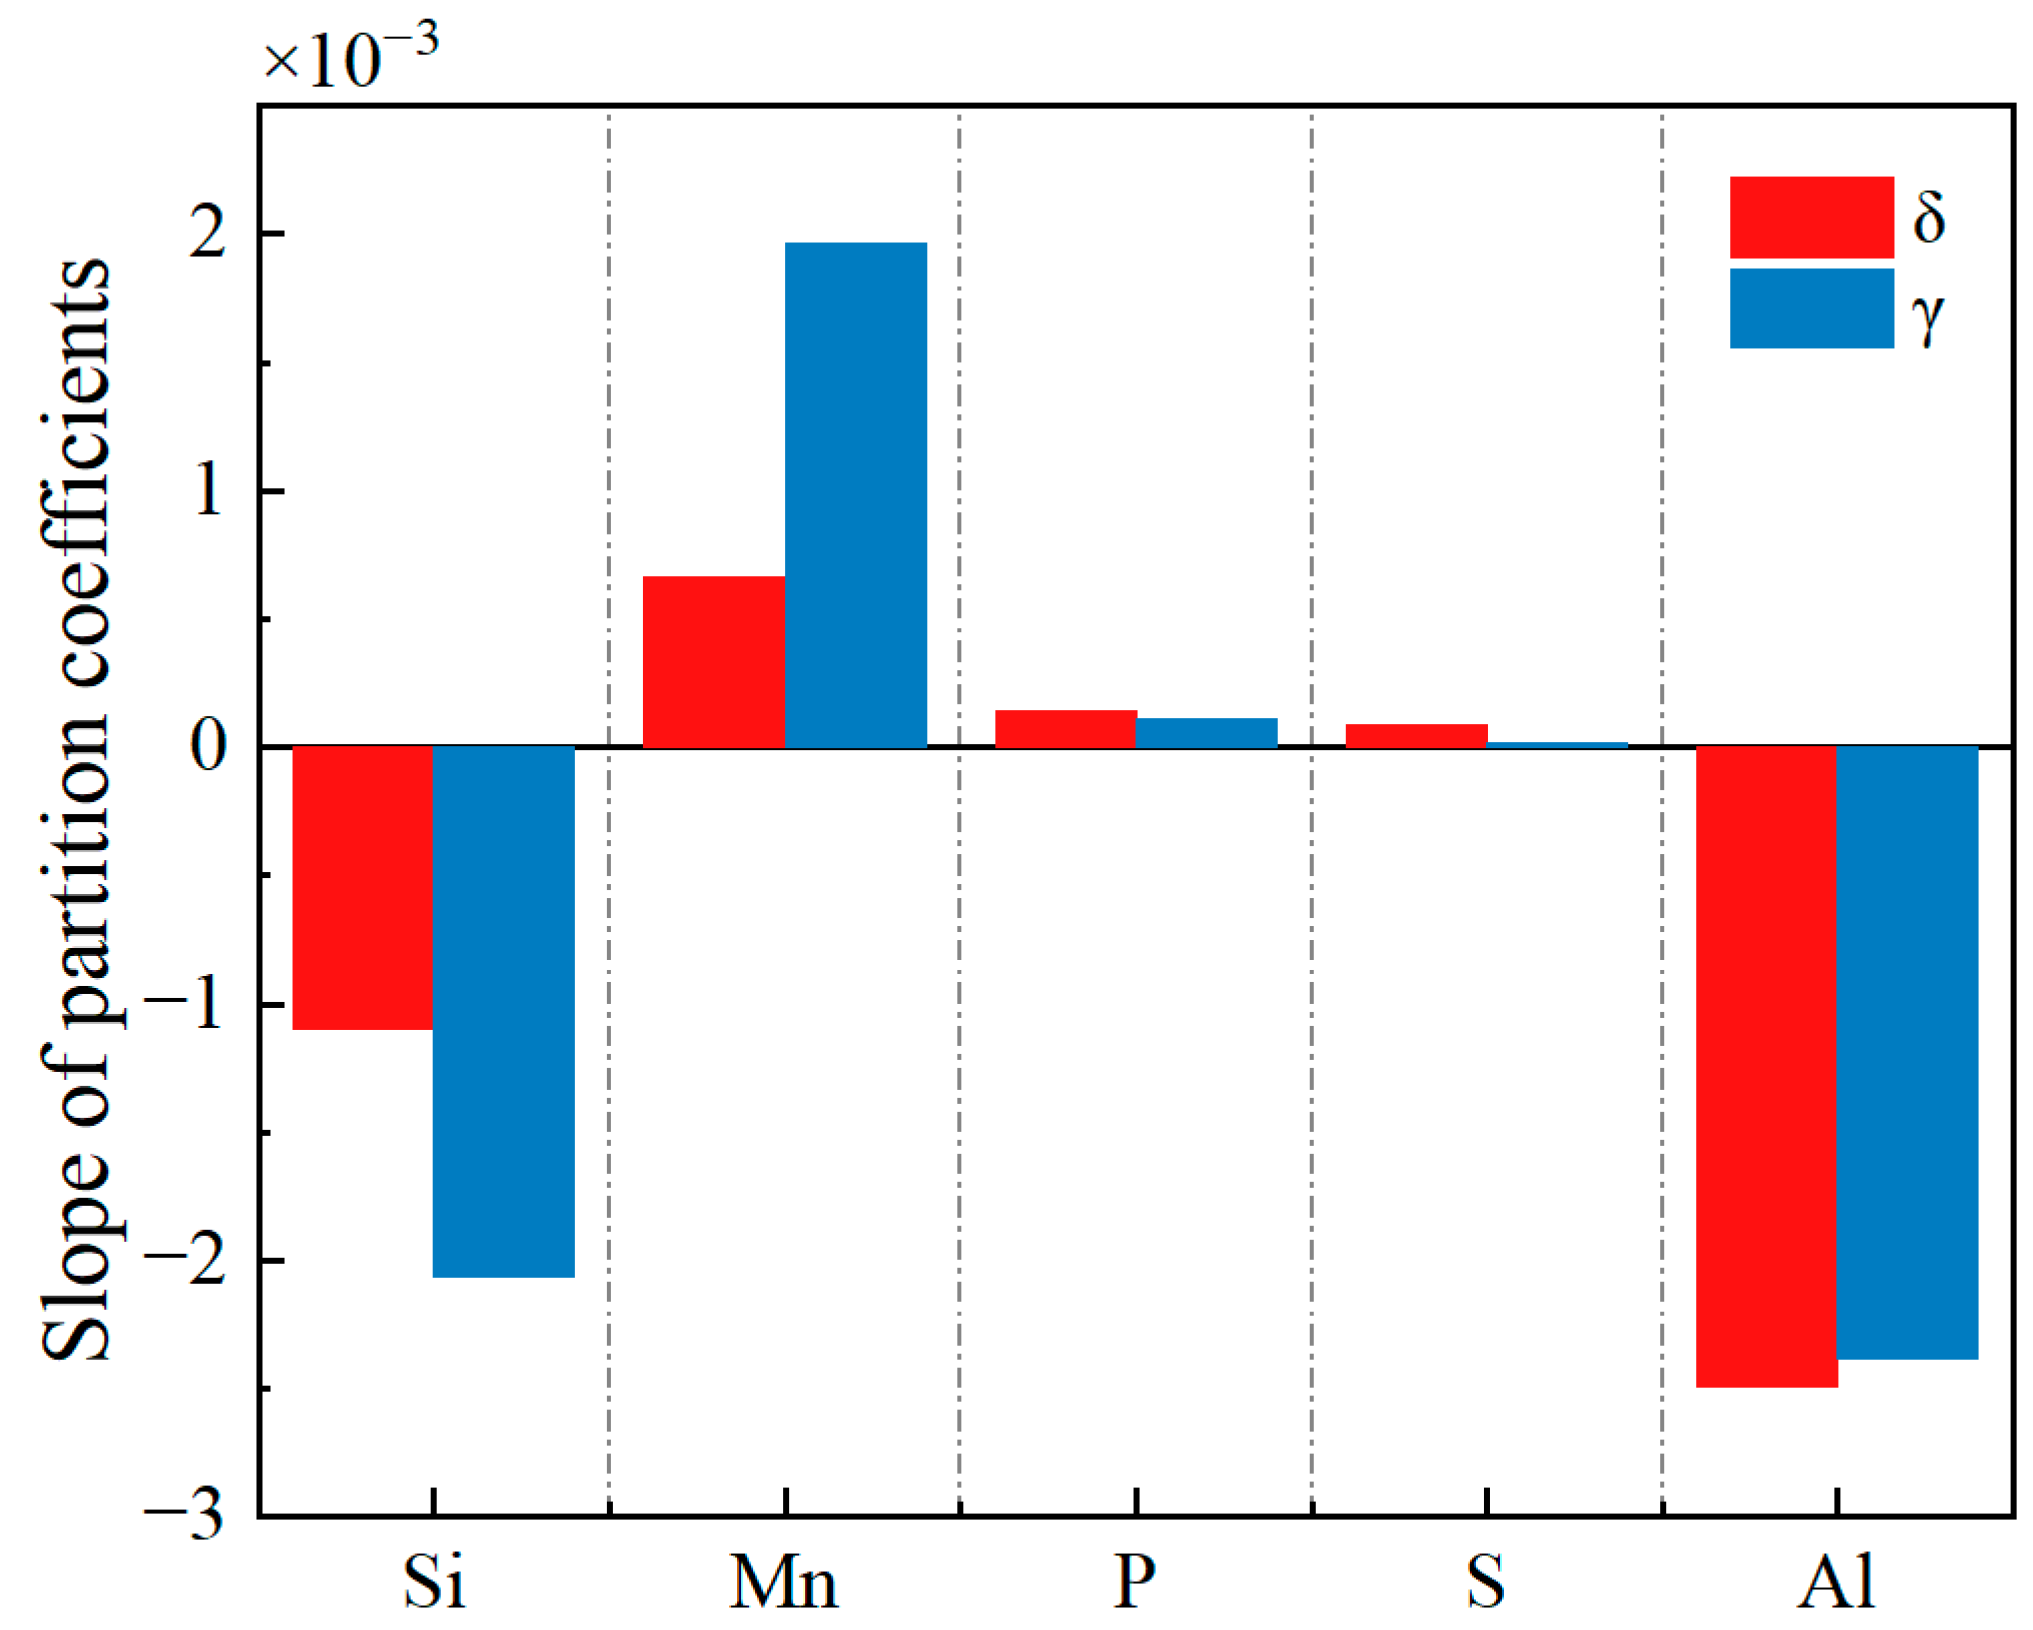
The change in the equilibrium partition coefficients of the Si, Mn, P, S, and Al elements with temperature can be approximated by a linear relationship. Linear fitting was conducted to determine the slope of the equilibrium partition coefficient for each element with respect to temperature. The R-squared of the linear fit is greater than 0.9, as shown in Figure 7. In terms of the quantitative relationship, the absolute values of the slope for Si, Mn, and Al are significantly greater than those for P and S, indicating that the effect of temperature on the equilibrium partition coefficients of Si, Mn, and Al is greater than that on the P and S elements. Comparing the δ and γ phases, the influence of temperature on the equilibrium partition coefficients of Si and Mn in the γ phase is greater than that in the δ phase. The results of linear fitting of the equilibrium partition coefficients of each element are consistent with the size variation law of the linear fitting of the equilibrium partition coefficients of Wang et al. [43], indicating that the addition of Al does not affect the variation trend of the equilibrium partition coefficients of each element but will cause changes in the values of the partition coefficients of each element due to the addition of Al.

Figure 7.
The slope of the equilibrium partition coefficient for each element with respect to temperature.
3.3. Effect of Al Content on Equilibrium Partition Coefficient
Figure 8 shows the average equilibrium partition coefficients of the steel with Al contents ranging from 3 wt% to 9 wt% at a C content of 0.4%. It can be seen from the figure that in the δ phase, as the Al content increases, the equilibrium partition coefficients of C, Si, Mn, P, and S decrease, and the equilibrium partition coefficient of Al also decreases. In the γ phase, with an increasing Al content, the equilibrium partition coefficient of C increases; those of Si, Mn, and P decrease; the equilibrium partition coefficient of S exhibits negligible variation; and the equilibrium partition coefficient of Al decreases. Under different initial Al contents, the partition coefficients of C and Mn in the δ phase are lower than those in the γ phase, whereas those of Si, P, and S in the δ phase are higher than those in the γ phase. Regarding the equilibrium partition coefficient of Al, kδ > kγ when the initial Al content is 3 wt% and 5 wt%, and kδ < kγ when the initial Al content is 7 wt% and 9 wt%.
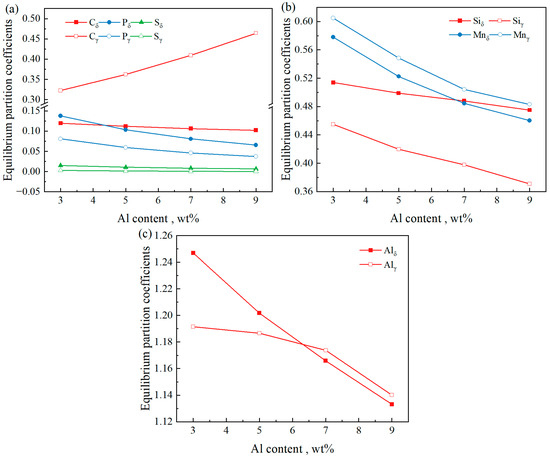
Figure 8.
Average equilibrium partition coefficient of steel with different Al contents when C = 0.4%. (a) C, P, and S; (b) Si and Mn; (c) Al.
3.4. Effect of Al Content on Microsegregation and Solidification Path
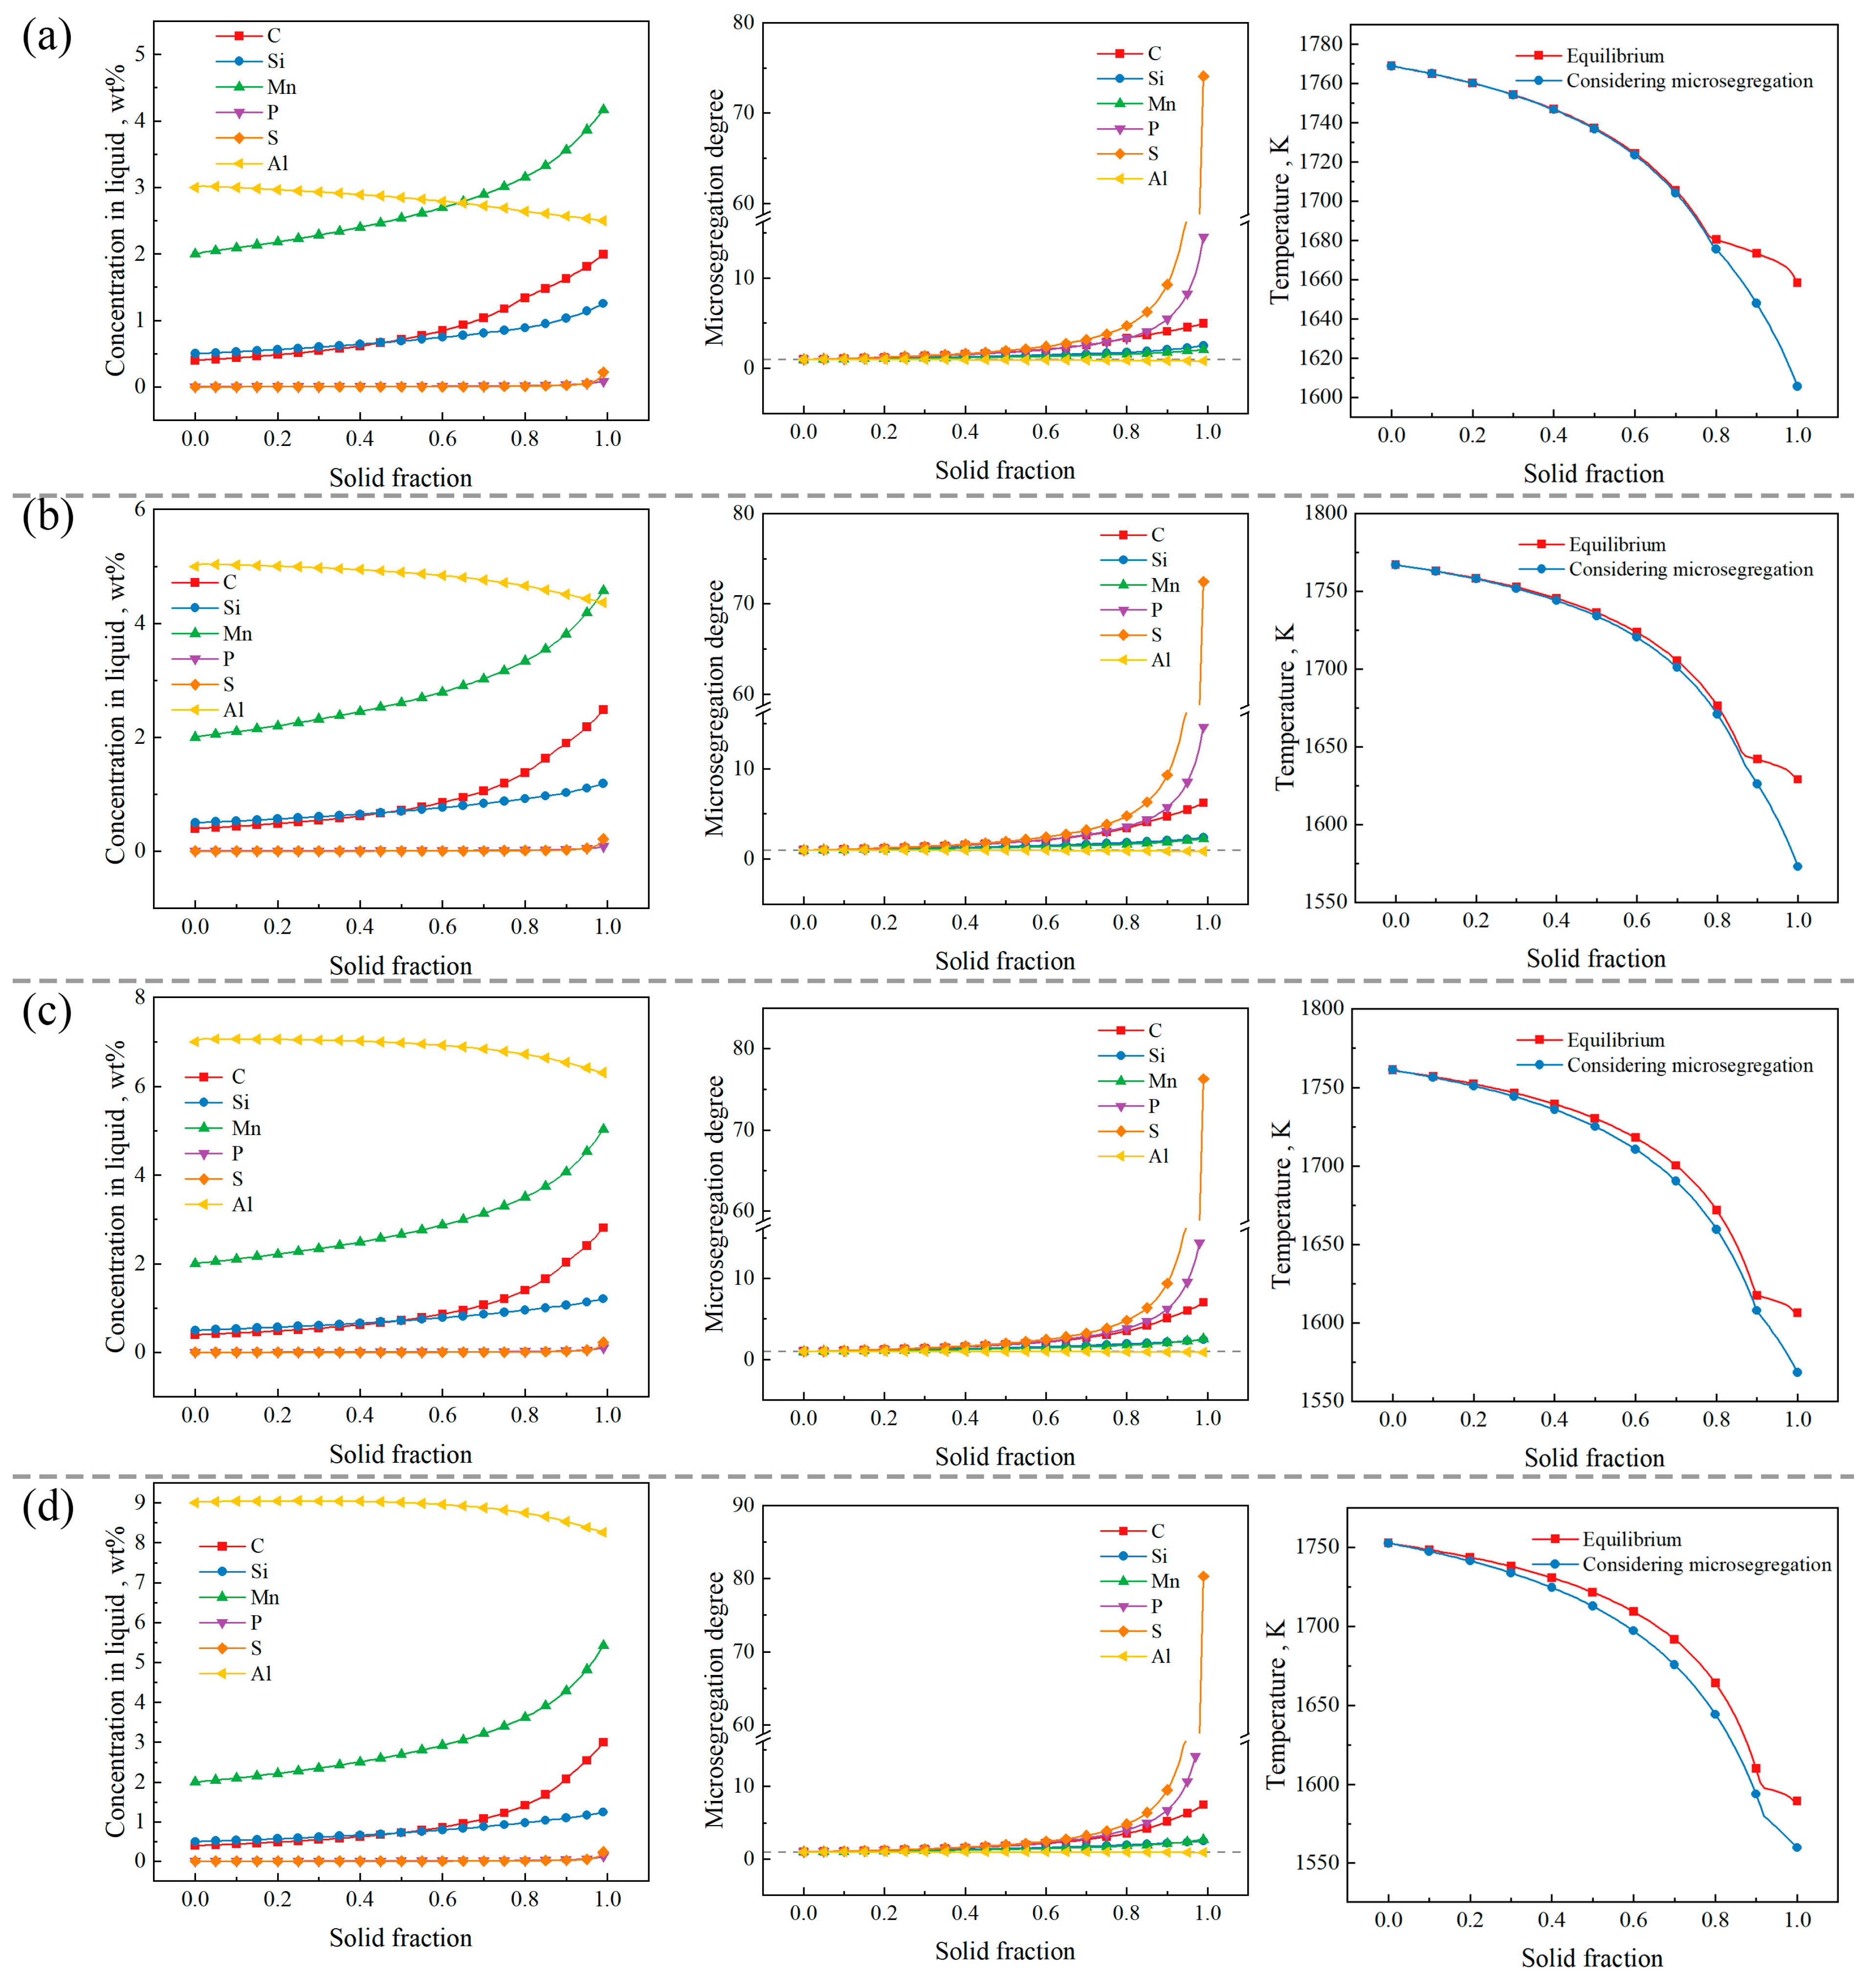
Figure 9 shows the relationship between the element concentration, microsegregation degree, and temperature during the solidification of different steels with a fixed C content of 0.4 wt%. The microsegregation degree (ε) is defined as the ratio of the element concentration in liquid to that in the initial molten steel, which is as follows [37,39]:
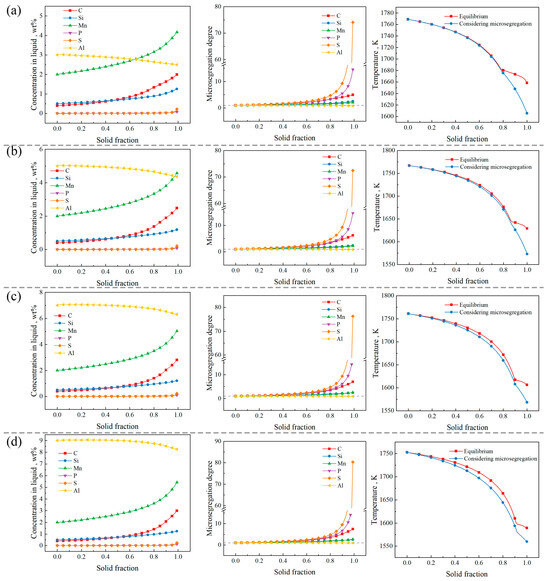
Figure 9.
Microsegregation curves, microsegregation degree curves, and solidification paths when Al content is (a) 3 wt%, (b) 5 wt%, (c) 7 wt%, (d) 9 wt%.
The microsegregation degree is used to evaluate the extent of solute element microsegregation during solidification. As can be seen from Figure 9, among the steels with Al contents ranging from 3 wt% to 9 wt%, S exhibits the highest microsegregation degree during solidification, followed by P and C. The S segregation is serious, which is consistent with other reference [21,34,38] reports. The microsegregation degrees of Mn and Si are comparable, which is attributed to the similarity in their equilibrium partition coefficients. Al is a negatively segregating element, and its microsegregation degree remains consistently below 1. On the solidification path, as the Al content increases, the deviation between the actual solidification path and the equilibrium solidification path gradually increases.
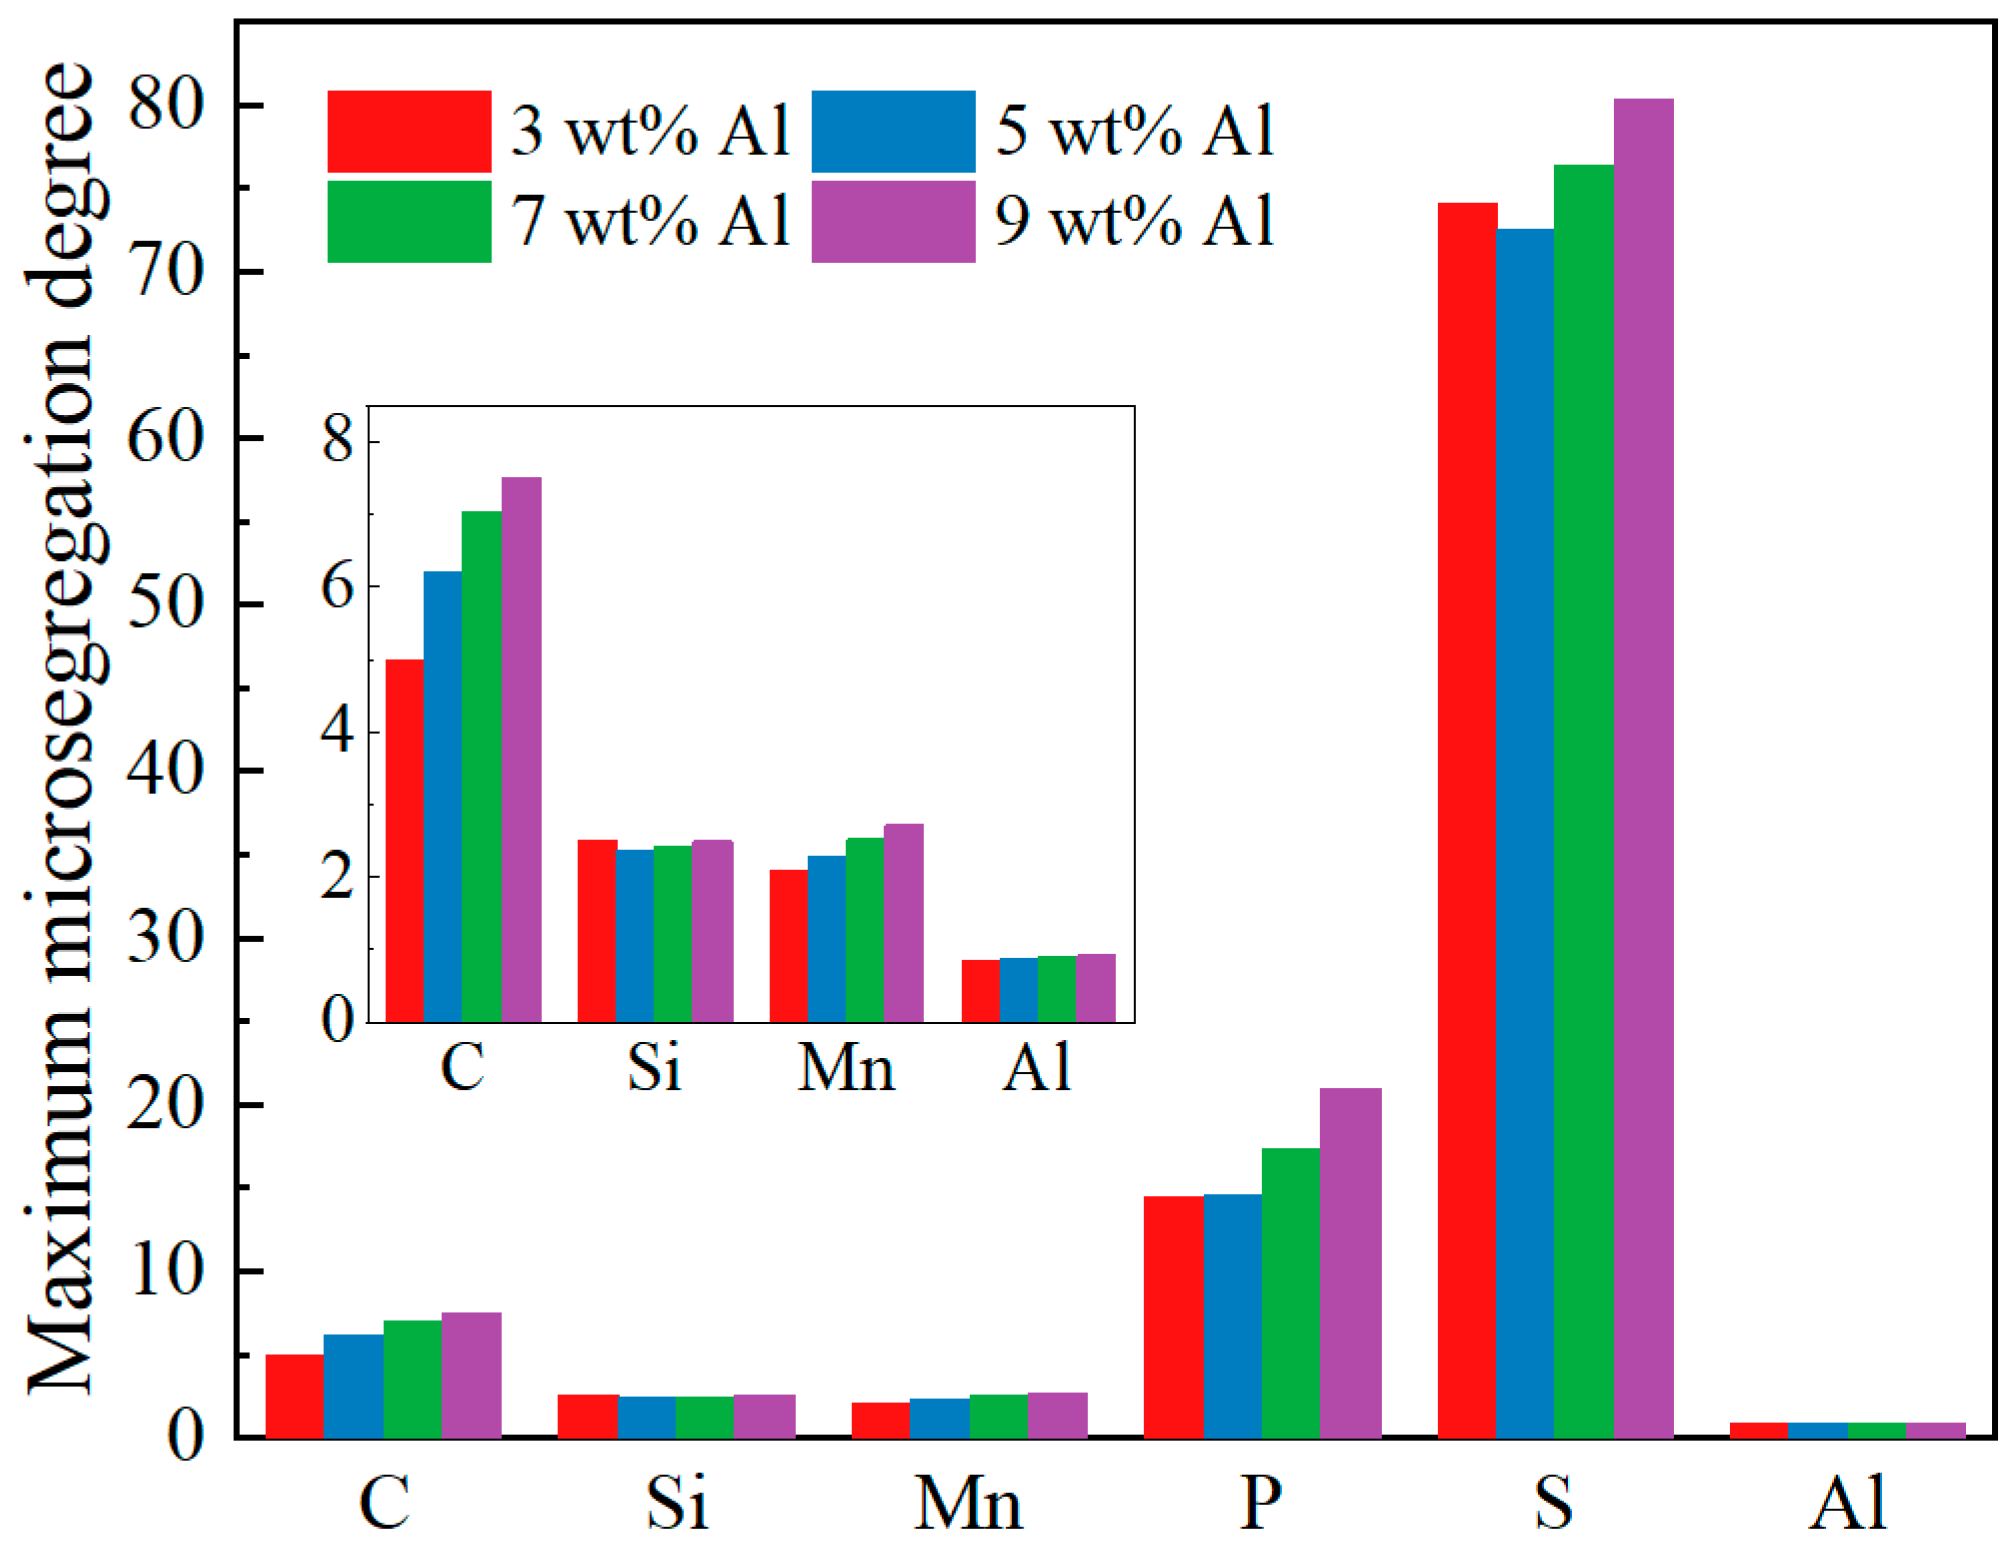
Figure 10 presents a bar chart illustrating the maximum microsegregation degree (maximum value of microsegregation degree) of each element in the steels with Al contents ranging from 3 wt% to 9 wt%. It can be seen from the figure that, in the steels with Al contents of 3 wt% and 5 wt%, the ranking of maximum microsegregation degree for the elements is S > P > C > Si > Mn > Al. In contrast, for steels with Al contents of 7 wt% and 9 wt%, the ranking becomes S > P > C > Mn > Si > Al. The reason for the change in the microsegregation degree of the Mn and Si elements is that as the Al concentration increases (5–7 wt%), the solid–liquid phase temperature range is widened from 138 K to 154.76 K, thereby prolonging the solidification time. It can be seen from Figure 5 that the equilibrium partition coefficient of Si increases with decreasing temperature, whereas Mn displays an opposite relationship. Furthermore, Figure 6 shows that with the increase in the Al content, the partition coefficient of Mn decreases more than that of Si. The combined effect of these factors causes the reversal of the microsegregation degree of Mn and Si. Notably, the maximum microsegregation degree of S is significantly higher than that of other elements, with an average value of 75.798, whereas the average maximum microsegregation degree value for P is only 16.867. The reason for the maximum microsegregation degree of the S element is that under different Al contents, the equilibrium partition coefficients of S in the δ phase and γ phase are the smallest (as shown in Figure 6), with average values of 0.0102 and 0.0014, respectively, which are significantly lower than the equilibrium partition coefficients of other elements. Therefore, during the solidification process, the S element is more likely to accumulate in the liquid phase at the solid–liquid interface, resulting in the highest degree of microsegregation.
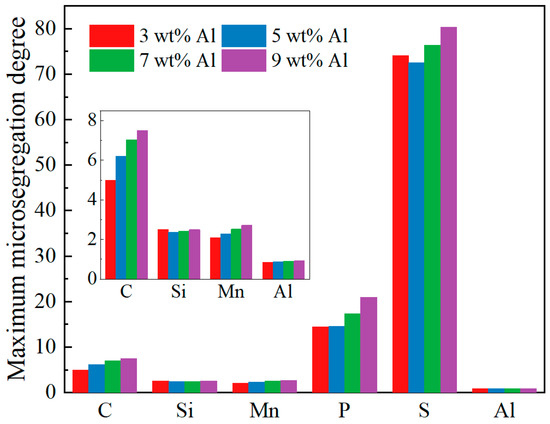
Figure 10.
Maximum microsegregation degree of each element at different Al contents.
Among the elements, the maximum microsegregation degree of C, Mn, P, and Al increases with increasing Al content, indicating that the segregation tendencies of the C, Mn, and P elements intensify, while that of Al decreases, as the initial Al content in the steel increases. For silicon (Si), the maximum microsegregation degree values follow the order 3 wt% Al > 9 wt% Al > 7 wt% Al > 5 wt% Al, while for sulfur (S), the order is 9 wt% Al > 7 wt% Al > 3 wt% Al > 5 wt% Al. The maximum microsegregation degree behavior of Si and S at 3 wt% Al deviates from the trends observed for other elements. A possible explanation for this phenomenon is that the steel with a 3 wt% initial Al content exhibits a peritectic reaction temperature of 1680.86 K under equilibrium solidification, with a corresponding solid phase fraction of 0.79. This indicates that the peritectic reaction occurs earlier during solidification compared to the other steels, whose solid phase fractions at the peritectic point are 0.87 for 5 wt% Al, 0.90 for 7 wt% Al, and 0.92 for 9 wt% Al. Since the equilibrium partition coefficients of Si and S in the γ phase are lower than those in the δ phase, the earlier occurrence of the peritectic reaction leads to an increased enrichment of these elements in the remaining liquid phase, thereby enhancing segregation.
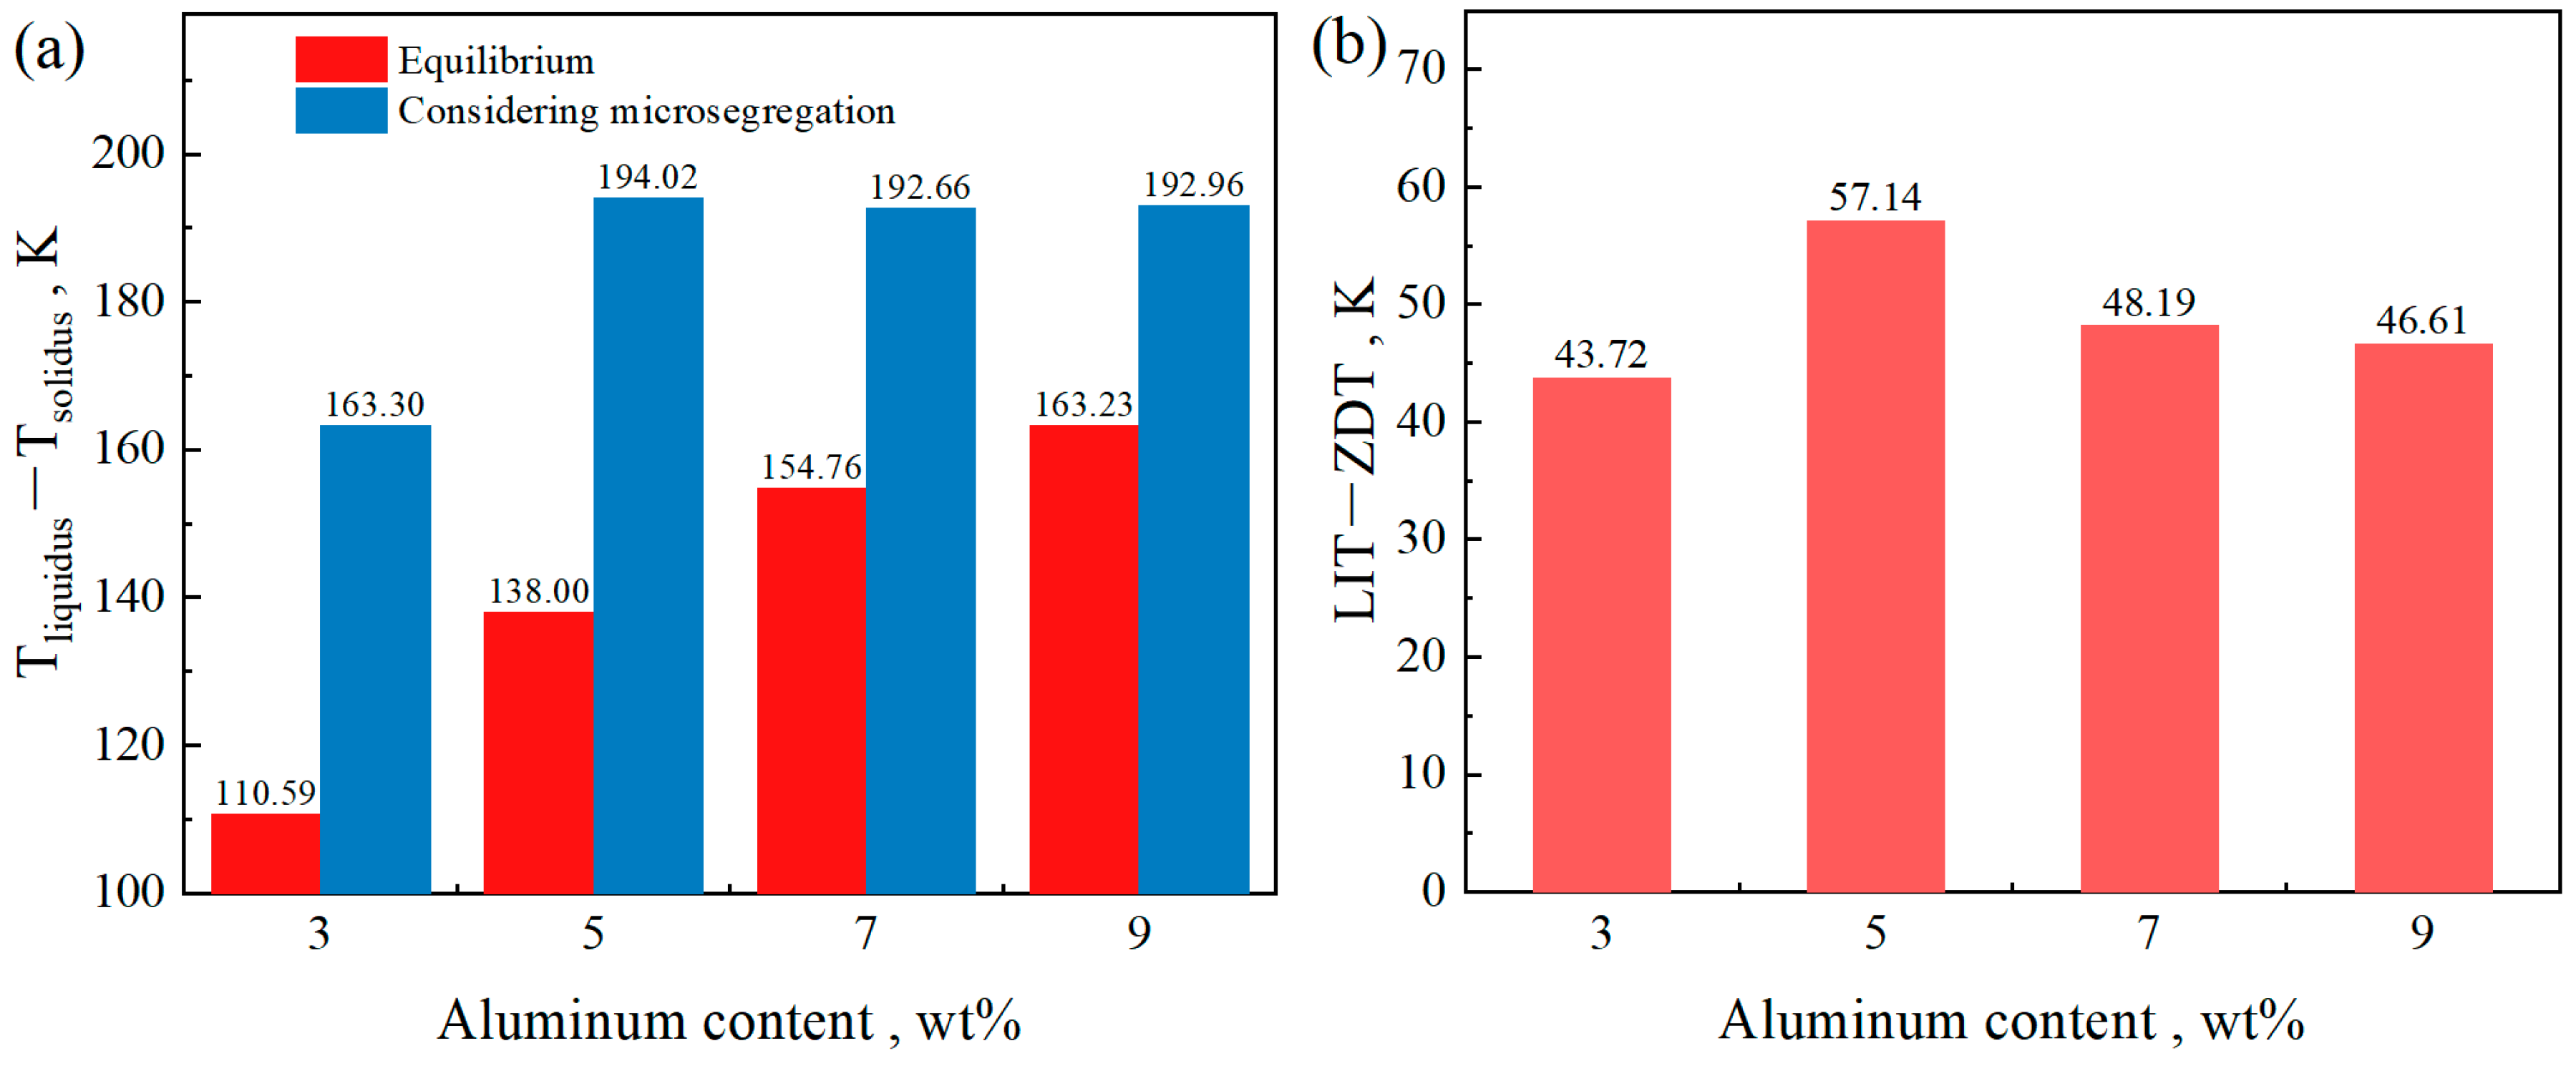
Figure 11a shows the temperature range of the solid–liquid two-phase region of the steels under equilibrium and non-equilibrium solidification conditions, with Al contents ranging from 3 wt% to 9 wt%. It can be observed from the figure that, after accounting for microsegregation, the temperature range of the solid–liquid two-phase region becomes wider than that under equilibrium solidification. Under equilibrium conditions, the temperature range of the solid–liquid two-phase region increases with increasing Al content. However, under non-equilibrium solidification, a different trend is observed: with increasing Al content, the temperature range first increases, then decreases, and subsequently stabilizes. An increase in the temperature range of the solid–liquid two-phase region indicates a slower solidification process and an extended persistence of liquid between dendrites. This extended duration promotes solute segregation and increases the susceptibility to cracking under external stress. Internal cracks are more likely to initiate between the liquid impenetrable temperature (LIT) and the zero ductility temperature (ZDT) [21]. According to the definition proposed by Won et al. [35], the LIT is defined as the temperature at which the solid fraction reaches 0.9, while the ZDT corresponds to a solid fraction of 0.99. The brittle temperature range, defined as ΔTb = LIT − ZDT, is commonly used to evaluate the risk of crack formation during solidification. The corresponding results are also shown in Figure 11b. It can be seen that the variation in ΔTb is consistent with the trend observed under non-equilibrium solidification. From the perspective of ΔTb, among the studied compositions, the steel with an Al content of 5 wt% exhibits the highest risk of cracking.
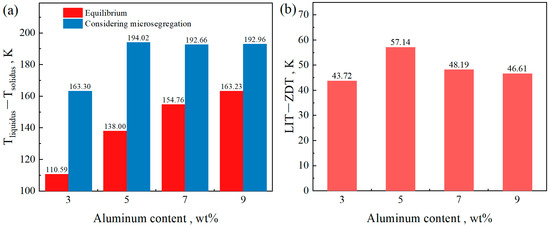
Figure 11.
The temperature range of the steels with different Al contents. (a) Solid–liquid two-phase, (b) ZDT − ZST.
4. Conclusions
In this study, the effect of the Al content on the phase transformation, equilibrium partition coefficients, and microsegregation during the solidification of the δ-TRIP steel composition system was investigated using thermodynamic calculations and a microsegregation model. The results are as follows:
- (1)
- For the steel composition Fe-0.4C-0.5Si-2Mn-0.006P-0.003S-(0–9)Al, when the Al content is 0 or 1 wt%, the solidification process passes through the γ single-phase region, and the δ ferrite cannot be retained. When the Al content is 3–9, the solidification path of L→L + BCC(δ)→L + BCC(δ) + FCC(γ)→BCC(δ or δ + α) + FCC(γ) appears in the phase diagram. Under this solidification process, there is ferrite that does not undergo δ→γ phase transformation. Additionally, when the Al content increases by 2 wt%, the range of carbon content where δ ferrite does not completely disappear increases by about 0.2 wt% during solid-state phase transition, and the carbon content range of the peritectic zone increases by about 0.35 wt%. Increasing the Al content shifts the peritectic point toward lower temperatures and a higher carbon content.
- (2)
- The influence of temperature on the equilibrium partition coefficients of Si, Mn, and Al is greater than that on C, P, and S. For different initial Al contents, the partition coefficients of C and Mn in the δ phase are smaller than those in the γ phase, while the partition coefficients of Si, P, and S in the δ phase are larger than those in the γ phase. Regarding the equilibrium partition coefficient of Al, kδ > kγ when the initial Al content is 3 wt% and 5 wt%, and kδ < kγ when the initial Al content is 7 wt% and 9 wt%.
- (3)
- In the steels with Al contents of 3 wt% and 5 wt%, the maximum microsegregation degree of each element follows the order: S > P > C > Si > Mn > Al. In the steels with Al contents of 7 wt% and 9 wt%, the maximum microsegregation degree of each element is ranked as S > P > C > Mn > Si > Al.
- (4)
- Considering microsegregation, for the steel with the composition Fe-0.4C-0.5Si-2Mn-0.006P-0.003S-(3, 5, 7, 9)Al, as the Al content increases, the temperature range of the solid–liquid two-phase region and the brittle temperature range (ΔTb) initially increase, then decrease, and finally tend to stabilize. From the perspective of ΔTb, among the compositions studied, the steel with an Al content of 5 wt% exhibits the greatest cracking susceptibility.
Author Contributions
Conceptualization, H.C.; Data curation, R.W.; Formal analysis, R.W.; Funding acquisition, H.C.; Investigation, R.W.; Methodology, R.W. and H.C.; Project administration, Y.S. and H.C.; Resources, Y.S. and H.C.; Software, R.W.; Supervision, Y.S.; Validation, Y.S. and H.C.; Visualization, R.W.; Writing—original draft, R.W.; Writing—review and editing, Y.S. and H.C. All authors have read and agreed to the published version of the manuscript.
Funding
The authors are grateful to the Central Guidance on Local Science and Technology Development Fund of Inner Mongolia Autonomous Region (No. 2022ZY0001) for supporting this work.
Data Availability Statement
The original contributions presented in this study are included in the article. Further inquiries can be directed to the corresponding author.
Conflicts of Interest
The authors declare no conflict of interest.
References
- Li, P.X.; Yan, Z.X.; Yang, Y.M. Progress in automobile body processing technology: Multi-material and lightweight strategies for saving energy and reducing emissions. J. Braz. Soc. Mech. 2024, 46, 324. [Google Scholar] [CrossRef]
- Chatterjee, S.; Murugananth, M.; Bhadeshia, H.K.D.H. δ TRIP steel. Mater. Sci. Technol. 2007, 23, 819–827. [Google Scholar] [CrossRef]
- Yi, H. δ-TRIP Steel; Pohang University of Science and Technology: Pohang, Republic of Korea, 2010. [Google Scholar]
- Yi, H.L.; Chen, P.; Hou, Z.Y.; Hong, N.; Cai, H.L.; Xu, Y.B.; Wu, D.; Wang, G.D. A novel design: Partitioning achieved by quenching and tempering (Q–T & P) in an aluminium-added low-density steel. Scr. Mater. 2013, 68, 370–374. [Google Scholar] [CrossRef]
- Zhang, T.; Liu, C.; Mu, H.; Li, Y.; Jiang, M. Inclusion evolution after calcium addition in Al-killed steel with different sulphur content. Ironmak. Steelmak. 2018, 45, 447–456. [Google Scholar] [CrossRef]
- Fan, Y.W.; Hu, X.J.; Matsuura, H. Effect of Al and N Contents on the Characteristics of Non-metallic Inclusions and Precipitation Behaviors in Unidirectionally Solidified Fe-Mn-C-Al TWIP Alloys. Metall. Mater. Trans. B 2025, 56, 2070–2080. [Google Scholar] [CrossRef]
- Cao, L.; Han, L.L.; Wang, G.C.; Tao, K.; Xiao, Y.Y. Effects of Mn content on the formation of inclusions in high aluminum steel. Metall. Mater. Trans. B 2023, 54, 2680–2693. [Google Scholar] [CrossRef]
- Pinson, M.; Das, S.M.; Springer, H.; Depover, T.; Verbeken, K. The addition of aluminum to brittle martensitic steels in order to increase ductility by forming a grain boundary ferritic microfilm. Scr. Mater. 2022, 213, 114606. [Google Scholar] [CrossRef]
- Xu, B.; Chen, P.; Li, Z.; Wu, D.; Wang, G.; Guo, J.; Liu, R.; Misra, R.D.K.; Yi, H. The Significance of Optimizing Mn-Content in Tuning the Microstructure and Mechanical Properties of δ-TRIP Steels. Metals 2021, 11, 523. [Google Scholar] [CrossRef]
- Cui, H.; Chen, D.; Zhang, K. Effects of Al content on the high-temperature mechanical properties of Al-TRIP steel. Mater. Sci. Technol. 2020, 36, 484–491. [Google Scholar] [CrossRef]
- Yi, H.L.; Lee, K.Y.; Bhadeshia, H. Extraordinary ductility in Al-bearing δ-TRIP steel. Proc. R. Soc. A 2011, 467, 234–243. [Google Scholar] [CrossRef]
- Azizi, G.; Thomas, B.G.; Asle Zaeem, M. Review of Peritectic Solidification Mechanisms and Effects in Steel Casting. Metall. Mater. Trans. B 2020, 51, 1875–1903. [Google Scholar] [CrossRef]
- Li, Y.Q.; Liu, J.H.; Wang, Z.M.; Li, Y.Y.; He, Y.; Li, X.W. Solidification crack characteristics and sensitivity of peritectic steel. J. Iron. Steel Res. Int. 2024, 31, 1668–1679. [Google Scholar] [CrossRef]
- Song, R.; Huo, W.; Zhou, N.; Li, J.; Zhang, Z.; Wang, Y. Research progress and prospect of Fe-Mn-Al-C medium Mn steels. Chin. J. Eng. 2020, 42, 814–828. [Google Scholar] [CrossRef]
- Xu, J.; He, S.; Wu, T.; Long, X.; Wang, Q. Effect of elements on peritectic reaction in molten steel based on thermodynamic analysis. ISIJ Int. 2012, 52, 1856–1861. [Google Scholar] [CrossRef]
- Ren, Q.Q.; Liu, T.; Baik, S.I.; Mao, Z.G.; Krakauer, B.W.; Seidman, D.N. The effects of alloying elements on the peritectic range of Fe-C-Mn-Si steels. J. Mater. Sci 2021, 56, 6448–6464. [Google Scholar] [CrossRef]
- Luo, T.F.; Wang, W.L.; Shang, T.R.; Liu, H.L.; Luo, S.; Zhu, M.Y. Experimental and numerical investigations on solidification thermodynamics of H13 steel with multi components. Metall. Mater. Trans. B 2024, 55, 4001–4014. [Google Scholar] [CrossRef]
- Wang, Y.; Chen, C.; Ren, R.J.; Xue, Z.X.; Wang, H.Z.; Zhang, Y.Z.; Wang, J.X.; Wang, J.; Chen, L.; Mu, W.Z. Ferrite formation and decomposition in 316H austenitic stainless steel electro slag remelting ingot for nuclear power applications. Mater. Charact. 2024, 218, 114581. [Google Scholar] [CrossRef]
- Wang, Y.; Chen, C.; Yang, X.Y.; Zhang, Z.R.; Wang, J.; Li, Z.; Chen, L.; Mu, W.Z. Solidification modes and delta-ferrite of two types of 316L stainless steels: A combination of as-cast microstructure and HT-CLSM research. J. Iron. Steel Res. Int. 2025, 32, 426–436. [Google Scholar] [CrossRef]
- Gong, T.Z.; Chen, Y.; Li, S.S.; Cao, Y.F.; Li, D.Z.; Chen, X.Q.; Reinhart, G.; Nguyen-Thi, H. Revisiting dynamics and models of microsegregation during polycrystalline solidification of binary alloy. J. Mater. Sci. Technol. 2021, 74, 155–167. [Google Scholar] [CrossRef]
- Hou, Z.B.; Cheng, G.G.; Wu, C.C.; Chen, C. Time-Series Analysis Technologies Applied to the Study of Carbon Element Distribution along Casting Direction in Continuous-Casting Billet. Metall. Mater. Trans. B 2012, 43, 1517–1529. [Google Scholar] [CrossRef]
- Strzępek, P.; Mamala, A.; Boumerzoug, Z.; Baudin, T.; Brisset, F.; Zasadzińska, M.; Noga, P. Effect of horizontal continuous casting parameters on cyclic macrosegregation, microstructure, and properties of high-strength Cu–Mg alloy cast rod. Metall. Mater. Trans. A 2025, 56, 41–60. [Google Scholar] [CrossRef]
- Xu, H.; Wang, W.L.; Lyu, P.S.; Wang, L.K. New Method for the Production of Medium-Mn Steel with Micro-segregation Bands Induced by Sub-rapid Solidification. In Proceedings of the Characterization of Minerals, Metals, and Materials Symposium (MMMS), Orlando, FL, USA, 3 March 2024–7 March 2024; pp. 237–245. [Google Scholar]
- Dang, A.G.; Wang, M.Y.; Wang, H.D.; Feng, X.M.; Liu, W. Homogenization Path Based on 250 mm × 280 mm Bloom under Mixed Light and Heavy Presses: Simulation and Industrial Studies. Metals 2024, 14, 591. [Google Scholar] [CrossRef]
- Ennis, B.L.; Jimenez-Melero, E.; Mostert, R.; Santillana, B.; Lee, P.D. The role of aluminium in chemical and phase segregation in a TRIP-assisted dual phase steel. Acta Mater. 2016, 115, 132–142. [Google Scholar] [CrossRef]
- Scheil, E. Bemerkungen zur Schichtkristallbildung. Int. J. Mater. Res. 1942, 34, 70–72. [Google Scholar] [CrossRef]
- Brody, H.D.; Flemings, M.C. Solute redistribution in dendritic solidification. In Proceedings of the Merton C Flemings Symposium on Solidification and Materials Processing, Cambridge, MA, USA, 28–30 June 2000; pp. 13–21. [Google Scholar]
- Clyne, T.W.; Kurz, W. Solute redistribution during solidification with rapid solid state diffusion. Metall. Trans. A 1981, 12, 965–971. [Google Scholar] [CrossRef]
- Kobayashi, S. Solute redistribution during solidification with diffusion in solid phase: A theoretical analysis. J. Cryst. Growth 1988, 88, 87–96. [Google Scholar] [CrossRef]
- Ohnaka, I. Mathematical Analysis of Solute Redistribution during Solidification with Diffusion in Solid Phase. Trans. Iron Steel Inst. Jpn. 1986, 26, 1045–1051. [Google Scholar] [CrossRef]
- Voller, V.R.; Beckermann, C. A unified model of microsegregation and coarsening. Metall. Mater. Trans. A 1999, 30, 2183–2189. [Google Scholar] [CrossRef]
- You, D.; Bernhard, C.; Wieser, G.; Michelic, S. Microsegregation Model with Local Equilibrium Partition Coefficients During Solidification of Steels. Steel Res. Int. 2016, 87, 840–849. [Google Scholar] [CrossRef]
- Wolczynski, W. Pattern selection in the eutectic growth—Thermodynamic interpretation. Arch. Metall. Mater. 2020, 65, 653–666. [Google Scholar] [CrossRef]
- Han, L.; Li, H.; Santillana, B.; Zhuang, L. Microsegregation and solidification characteristics of an advanced high strength steel —Part I: Modelling and prediction on hot cracking susceptibility. Ironmak. Steelmak. 2022, 49, 101–108. [Google Scholar] [CrossRef]
- Won, Y.M.; Thomas, B.G. Simple model of microsegregation during solidification of steels. Metall. Mater. Trans. A 2001, 32, 1755–1767. [Google Scholar] [CrossRef]
- Huang, Y.; Long, M.; Liu, P.; Chen, D.; Chen, H.; Gui, L.; Liu, T.; Yu, S. Effects of partition coefficients, diffusion coefficients, and solidification paths on microsegregation in Fe-based multinary alloy. Metall. Mater. Trans. B 2017, 48, 2504–2515. [Google Scholar] [CrossRef]
- Gui, L.; Long, M.; Huang, Y.; Chen, D.; Chen, H.; Duan, H.; Yu, S. Effects of inclusion precipitation, partition coefficient, and phase transition on microsegregation for high-sulfur steel solidification. Metall. Mater. Trans. B 2018, 49, 3280–3292. [Google Scholar] [CrossRef]
- Gui, L.; Long, M.; Wu, S.; Dong, Z.; Chen, D.; Huang, Y.; Duan, H.; Vitos, L. Quantitative effects of phase transition on solute partition coefficient, inclusion precipitation, and microsegregation for high-sulfur steel solidification. J. Mater. Sci. Technol. 2019, 35, 2383–2395. [Google Scholar] [CrossRef]
- Jiang, L.; Liao, M.; Wang, Z.; Zhu, H.; Cui, H. Effect of cooling rate on the peritectic transformation of delta-TRIP steel. Chin. J. Eng. 2023, 45, 747–754. [Google Scholar] [CrossRef]
- Liu, K.; Cheng, S.; Li, Y. Study of Crack Sensitivity of Peritectic Steels. Coatings 2022, 12, 15. [Google Scholar] [CrossRef]
- Choudhary, S.K.; Ghosh, A. Mathematical Model for Prediction of Composition of Inclusions Formed during Solidification of Liquid Steel. ISIJ Int. 2009, 49, 1819–1827. [Google Scholar] [CrossRef]
- Shen, Y.; Liu, J.; Xu, H.; Liu, H. Micro-segregation Study of Directional Solidified Fe–Mn–C–Al TWIP Steels. Metall. Mater. Trans. B 2020, 51, 2963–2975. [Google Scholar] [CrossRef]
- Wang, Y.; Zhang, L. Thermodynamic calculation of solute equilibrium distribution coefficient in steel with full composition system. China Metall. 2023, 33, 44–52. [Google Scholar] [CrossRef]


Disclaimer/Publisher’s Note: The statements, opinions and data contained in all publications are solely those of the individual author(s) and contributor(s) and not of MDPI and/or the editor(s). MDPI and/or the editor(s) disclaim responsibility for any injury to people or property resulting from any ideas, methods, instructions or products referred to in the content. |
© 2025 by the authors. Licensee MDPI, Basel, Switzerland. This article is an open access article distributed under the terms and conditions of the Creative Commons Attribution (CC BY) license (https://creativecommons.org/licenses/by/4.0/).