

Advanced Porosity Control of CP780 Galvanized Steel During Gas Metal Arc Welding with Pulsed Arc

 , , ,
, , ,  ,
, 
Abstract
1. Introduction
2. Experimentation and Design Approach
2.1. Chemical Composition of the Base Materials
2.2. Design of Experiments (DOEs) and L9 Orthogonal Array
2.3. Welding Process
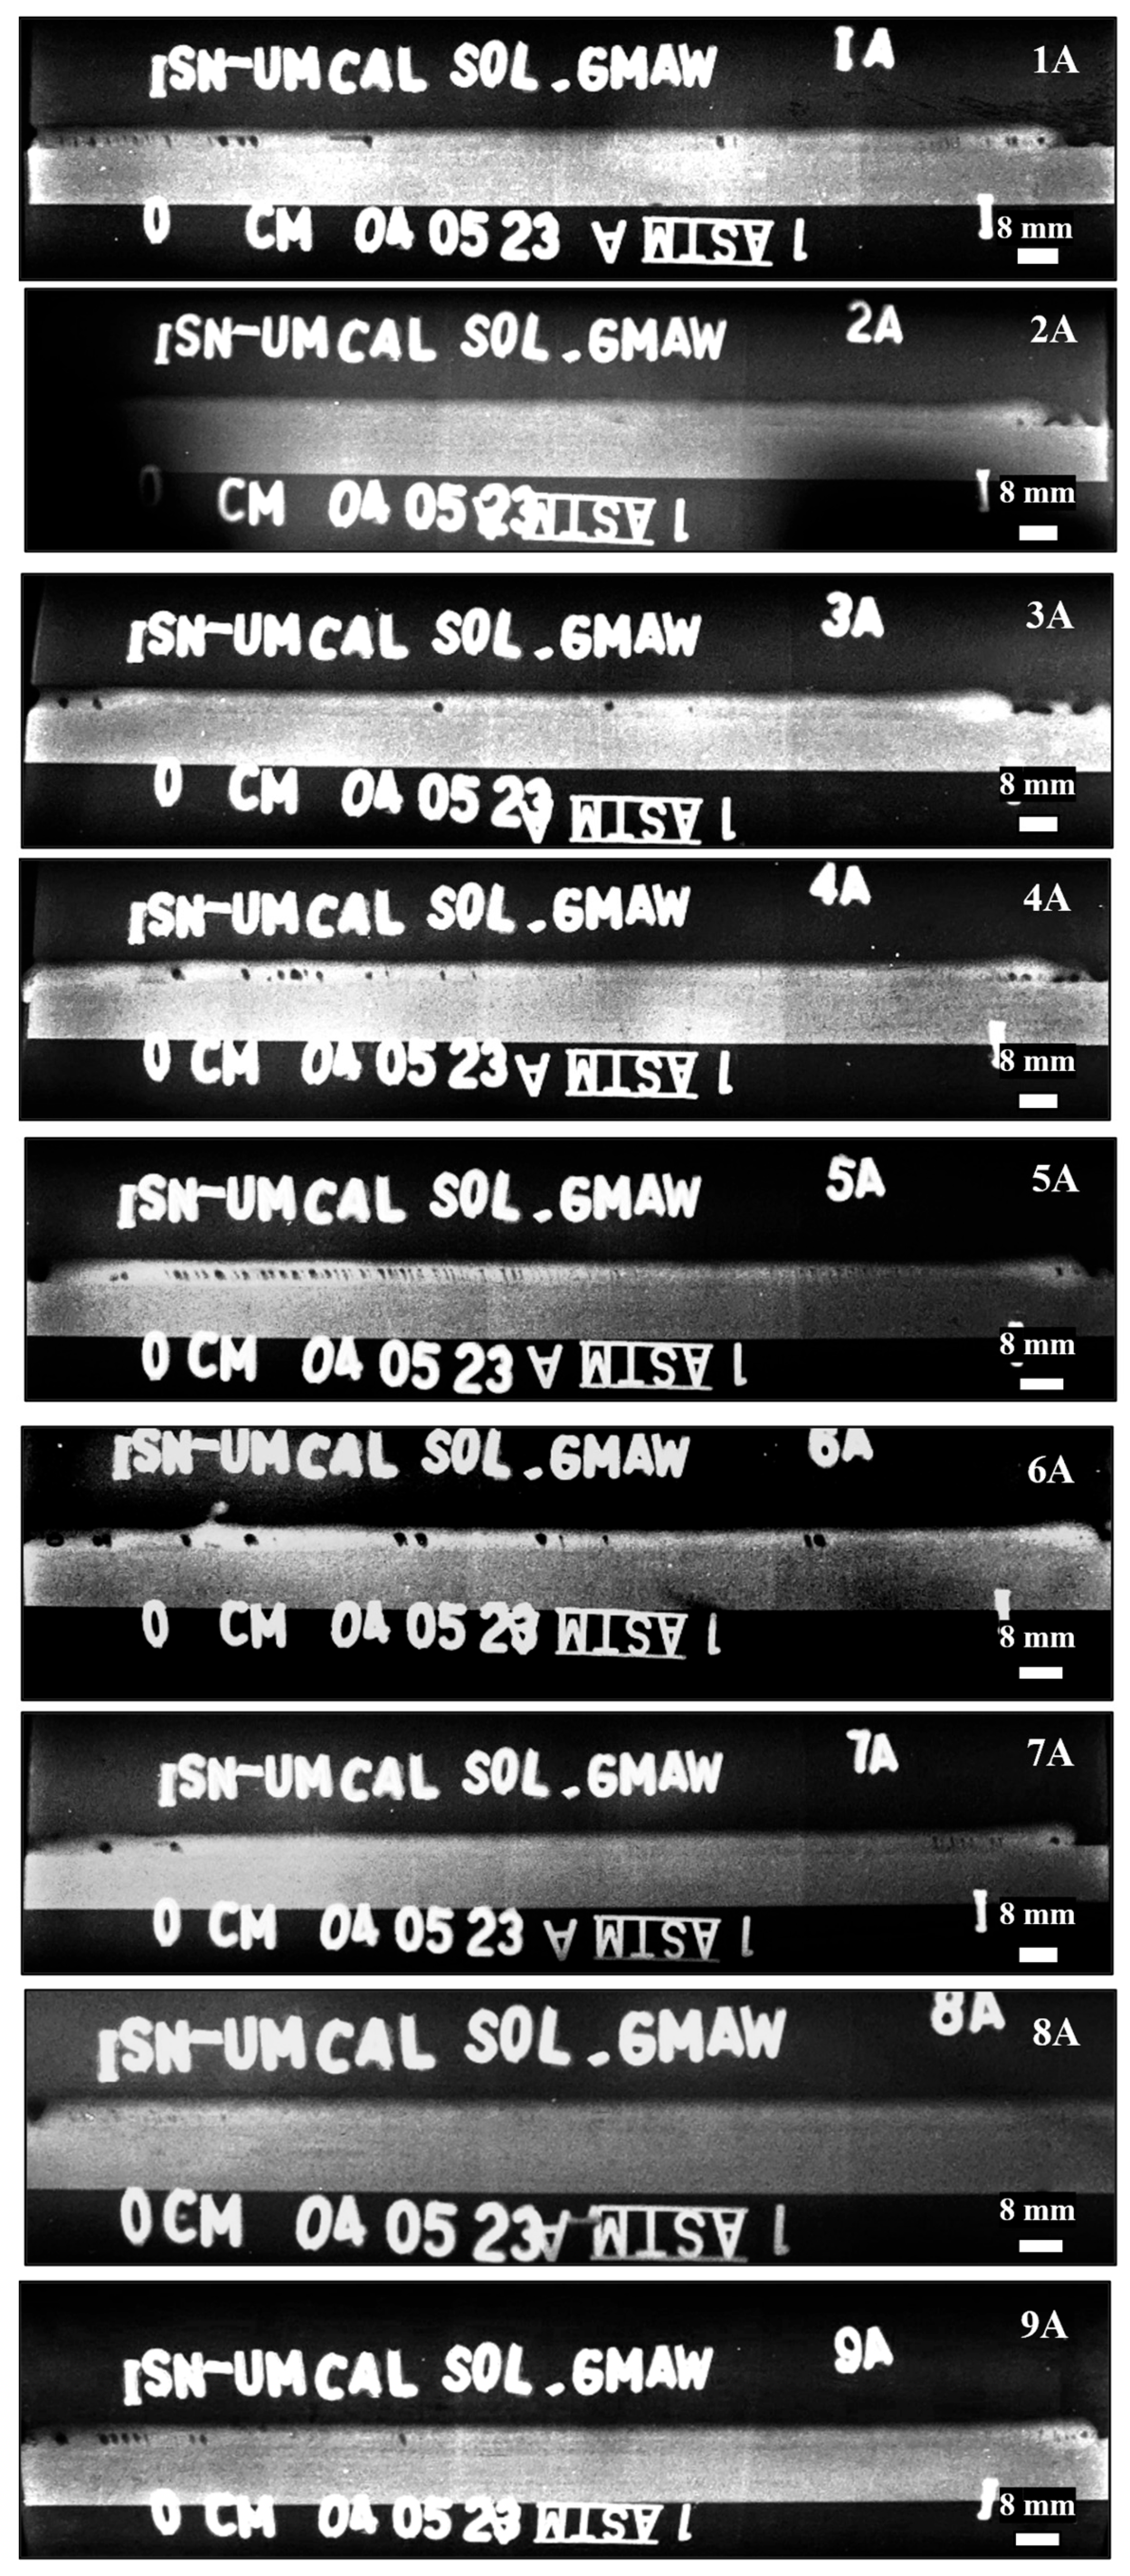
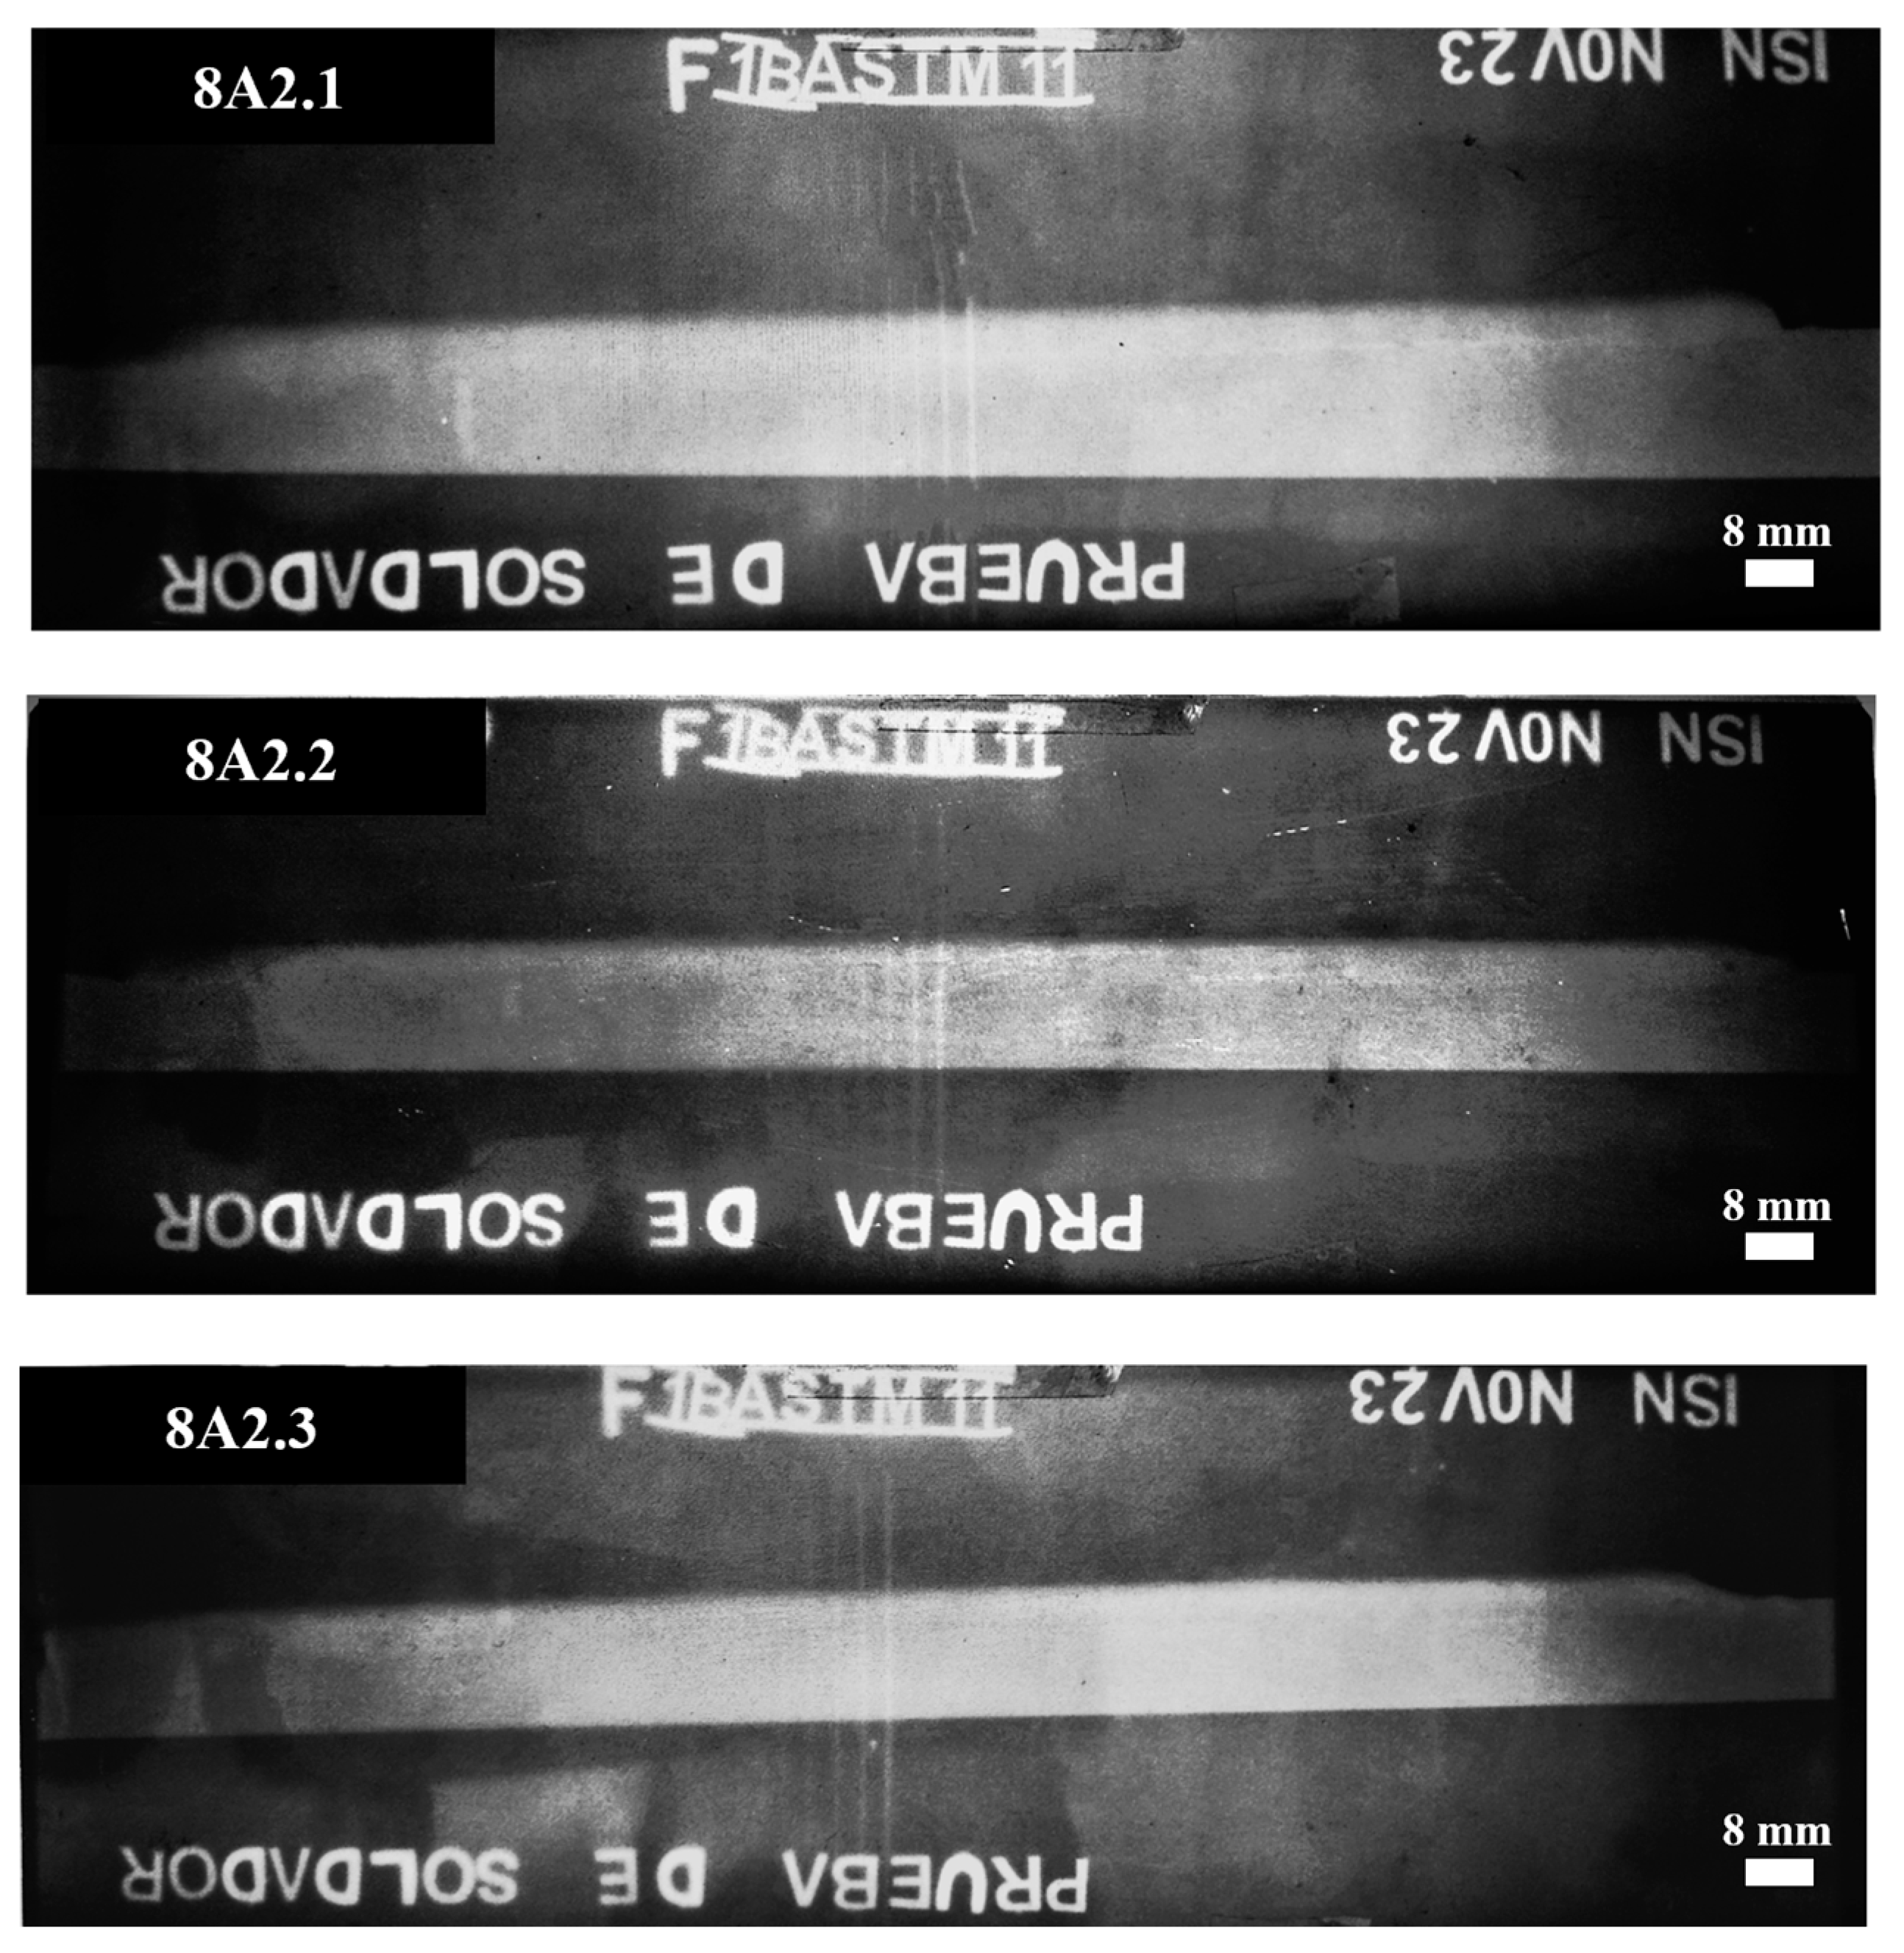
2.4. Radiographic Inspection
2.5. Microstructural Characterization
2.6. Root Strength Test
2.7. Image Capture of the Welding Process
3. Results
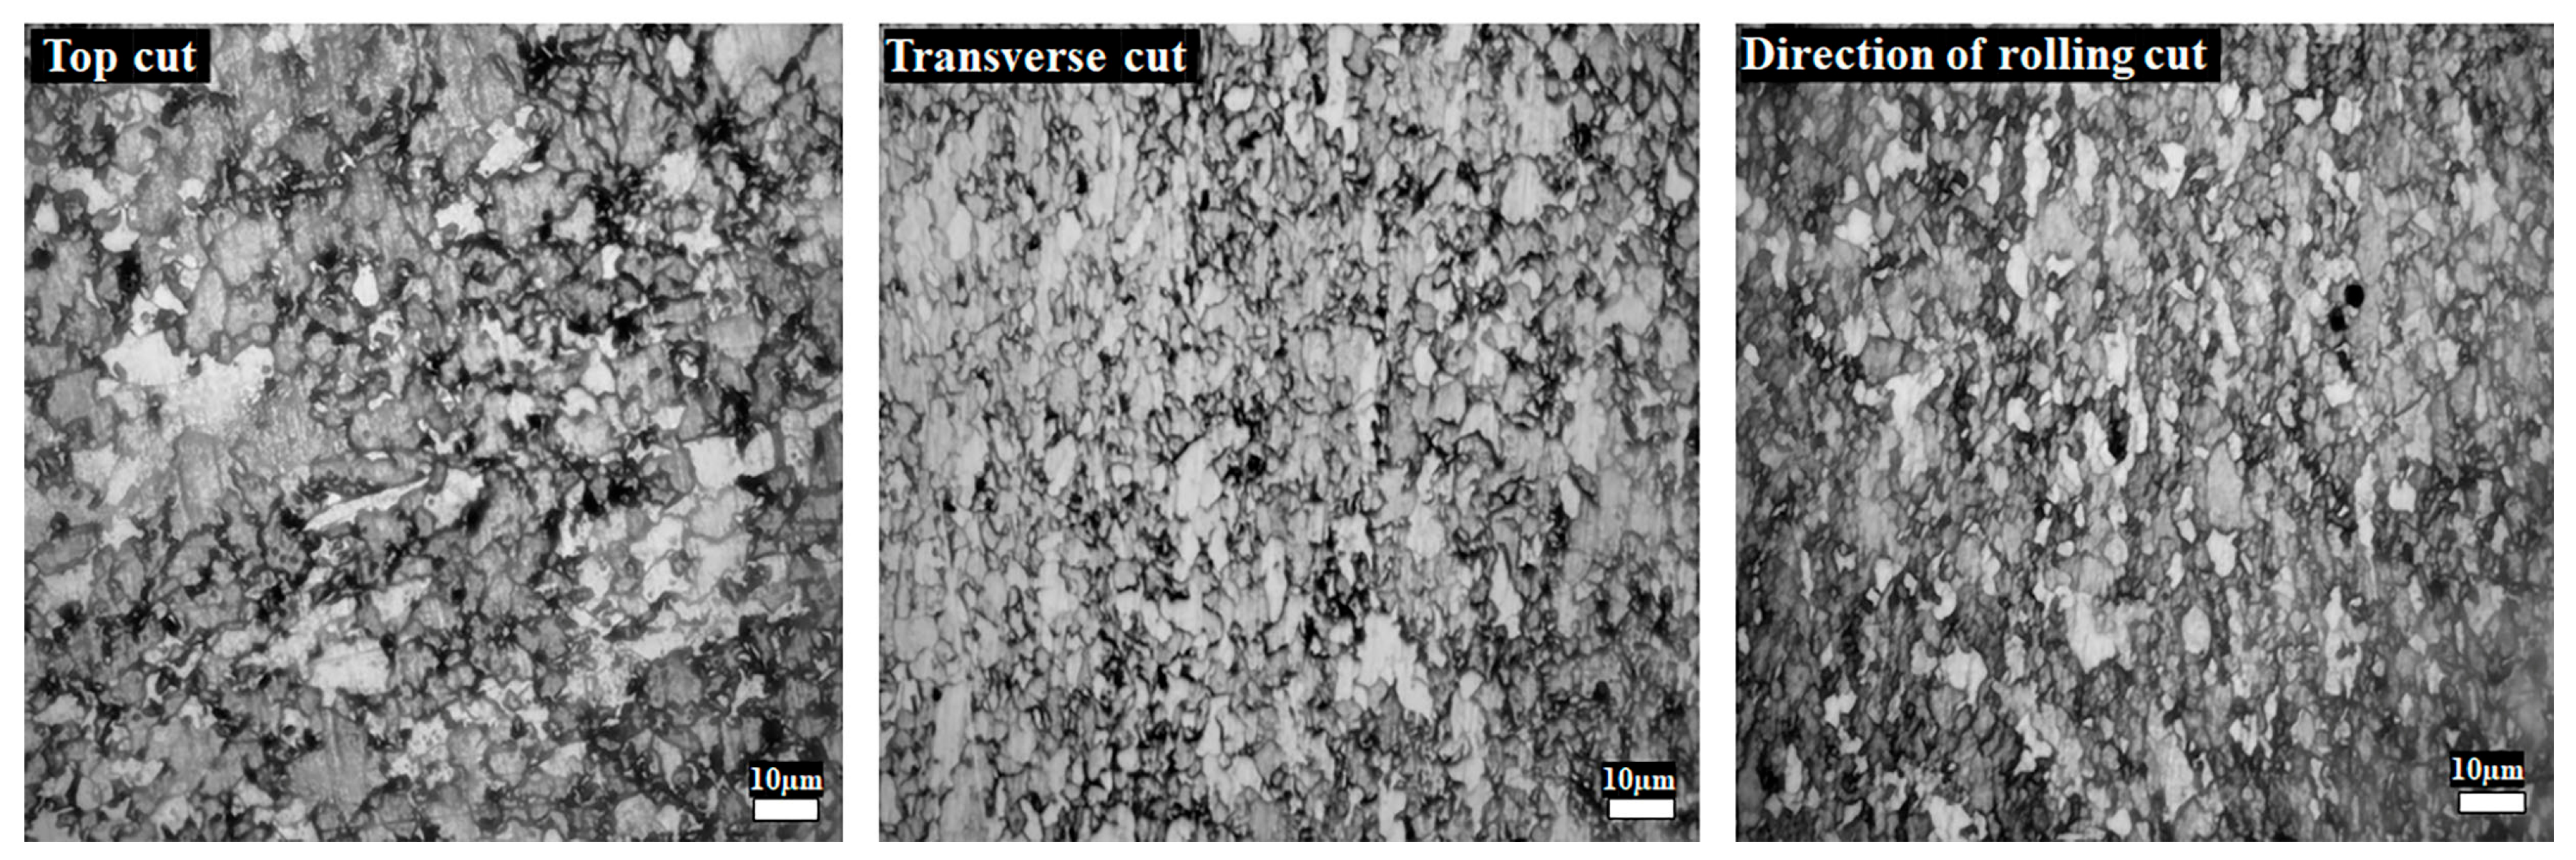
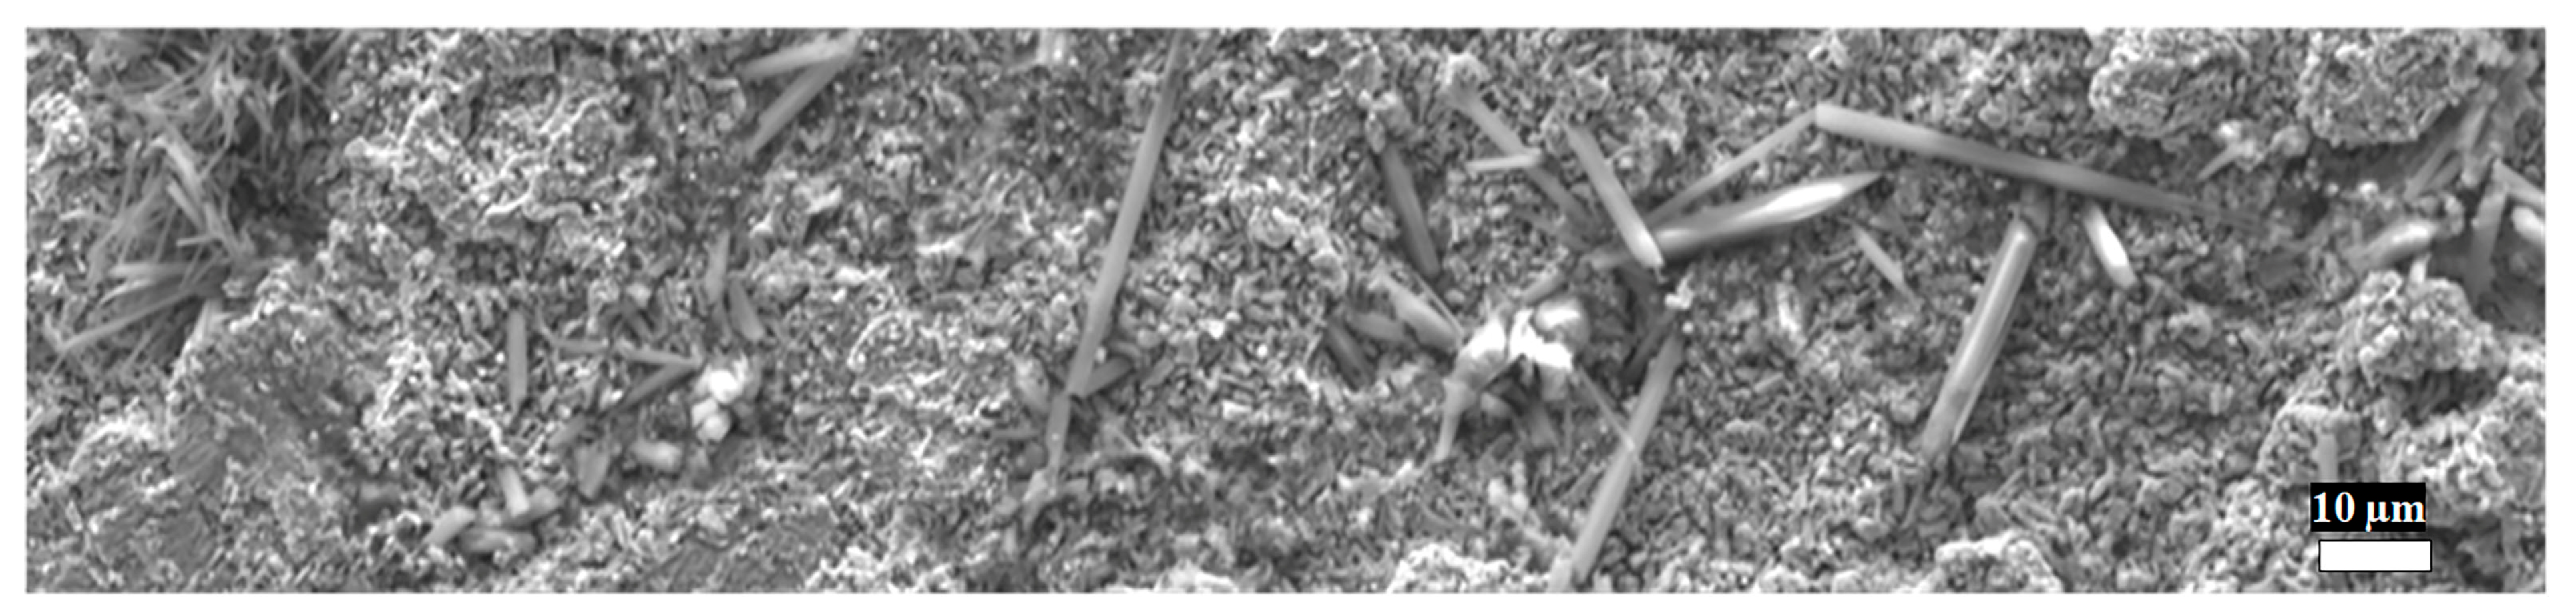
3.1. Base Material
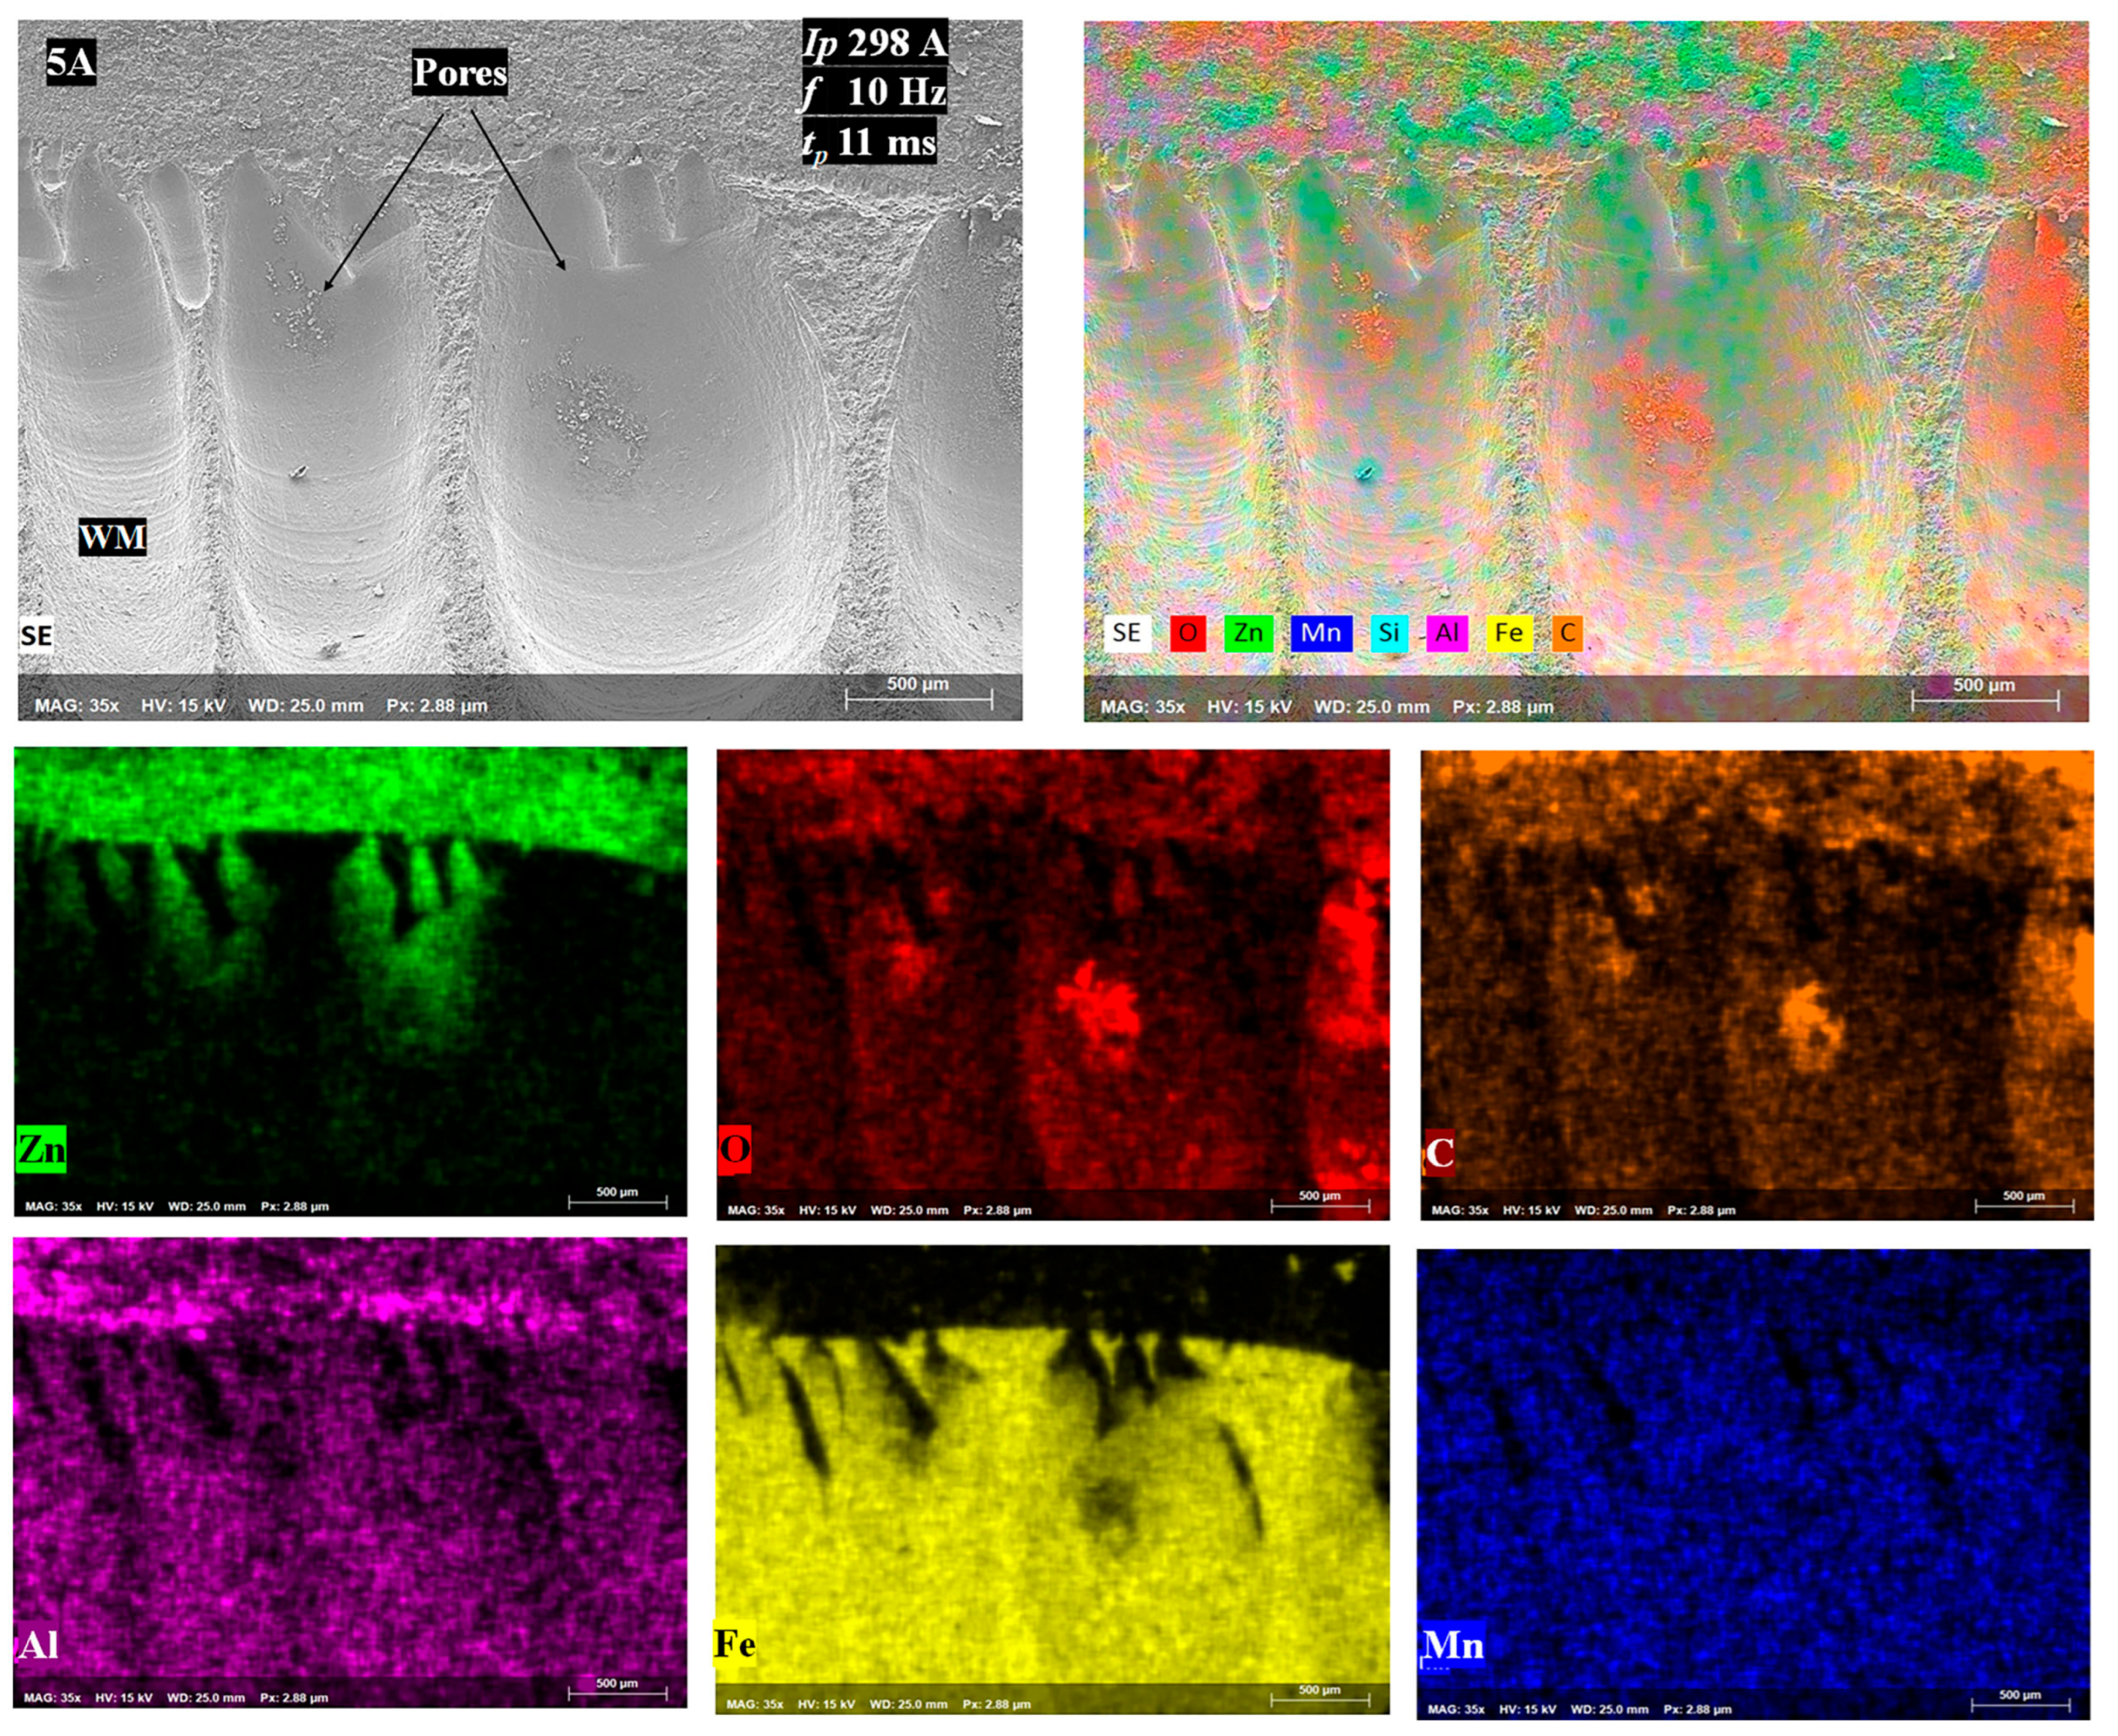
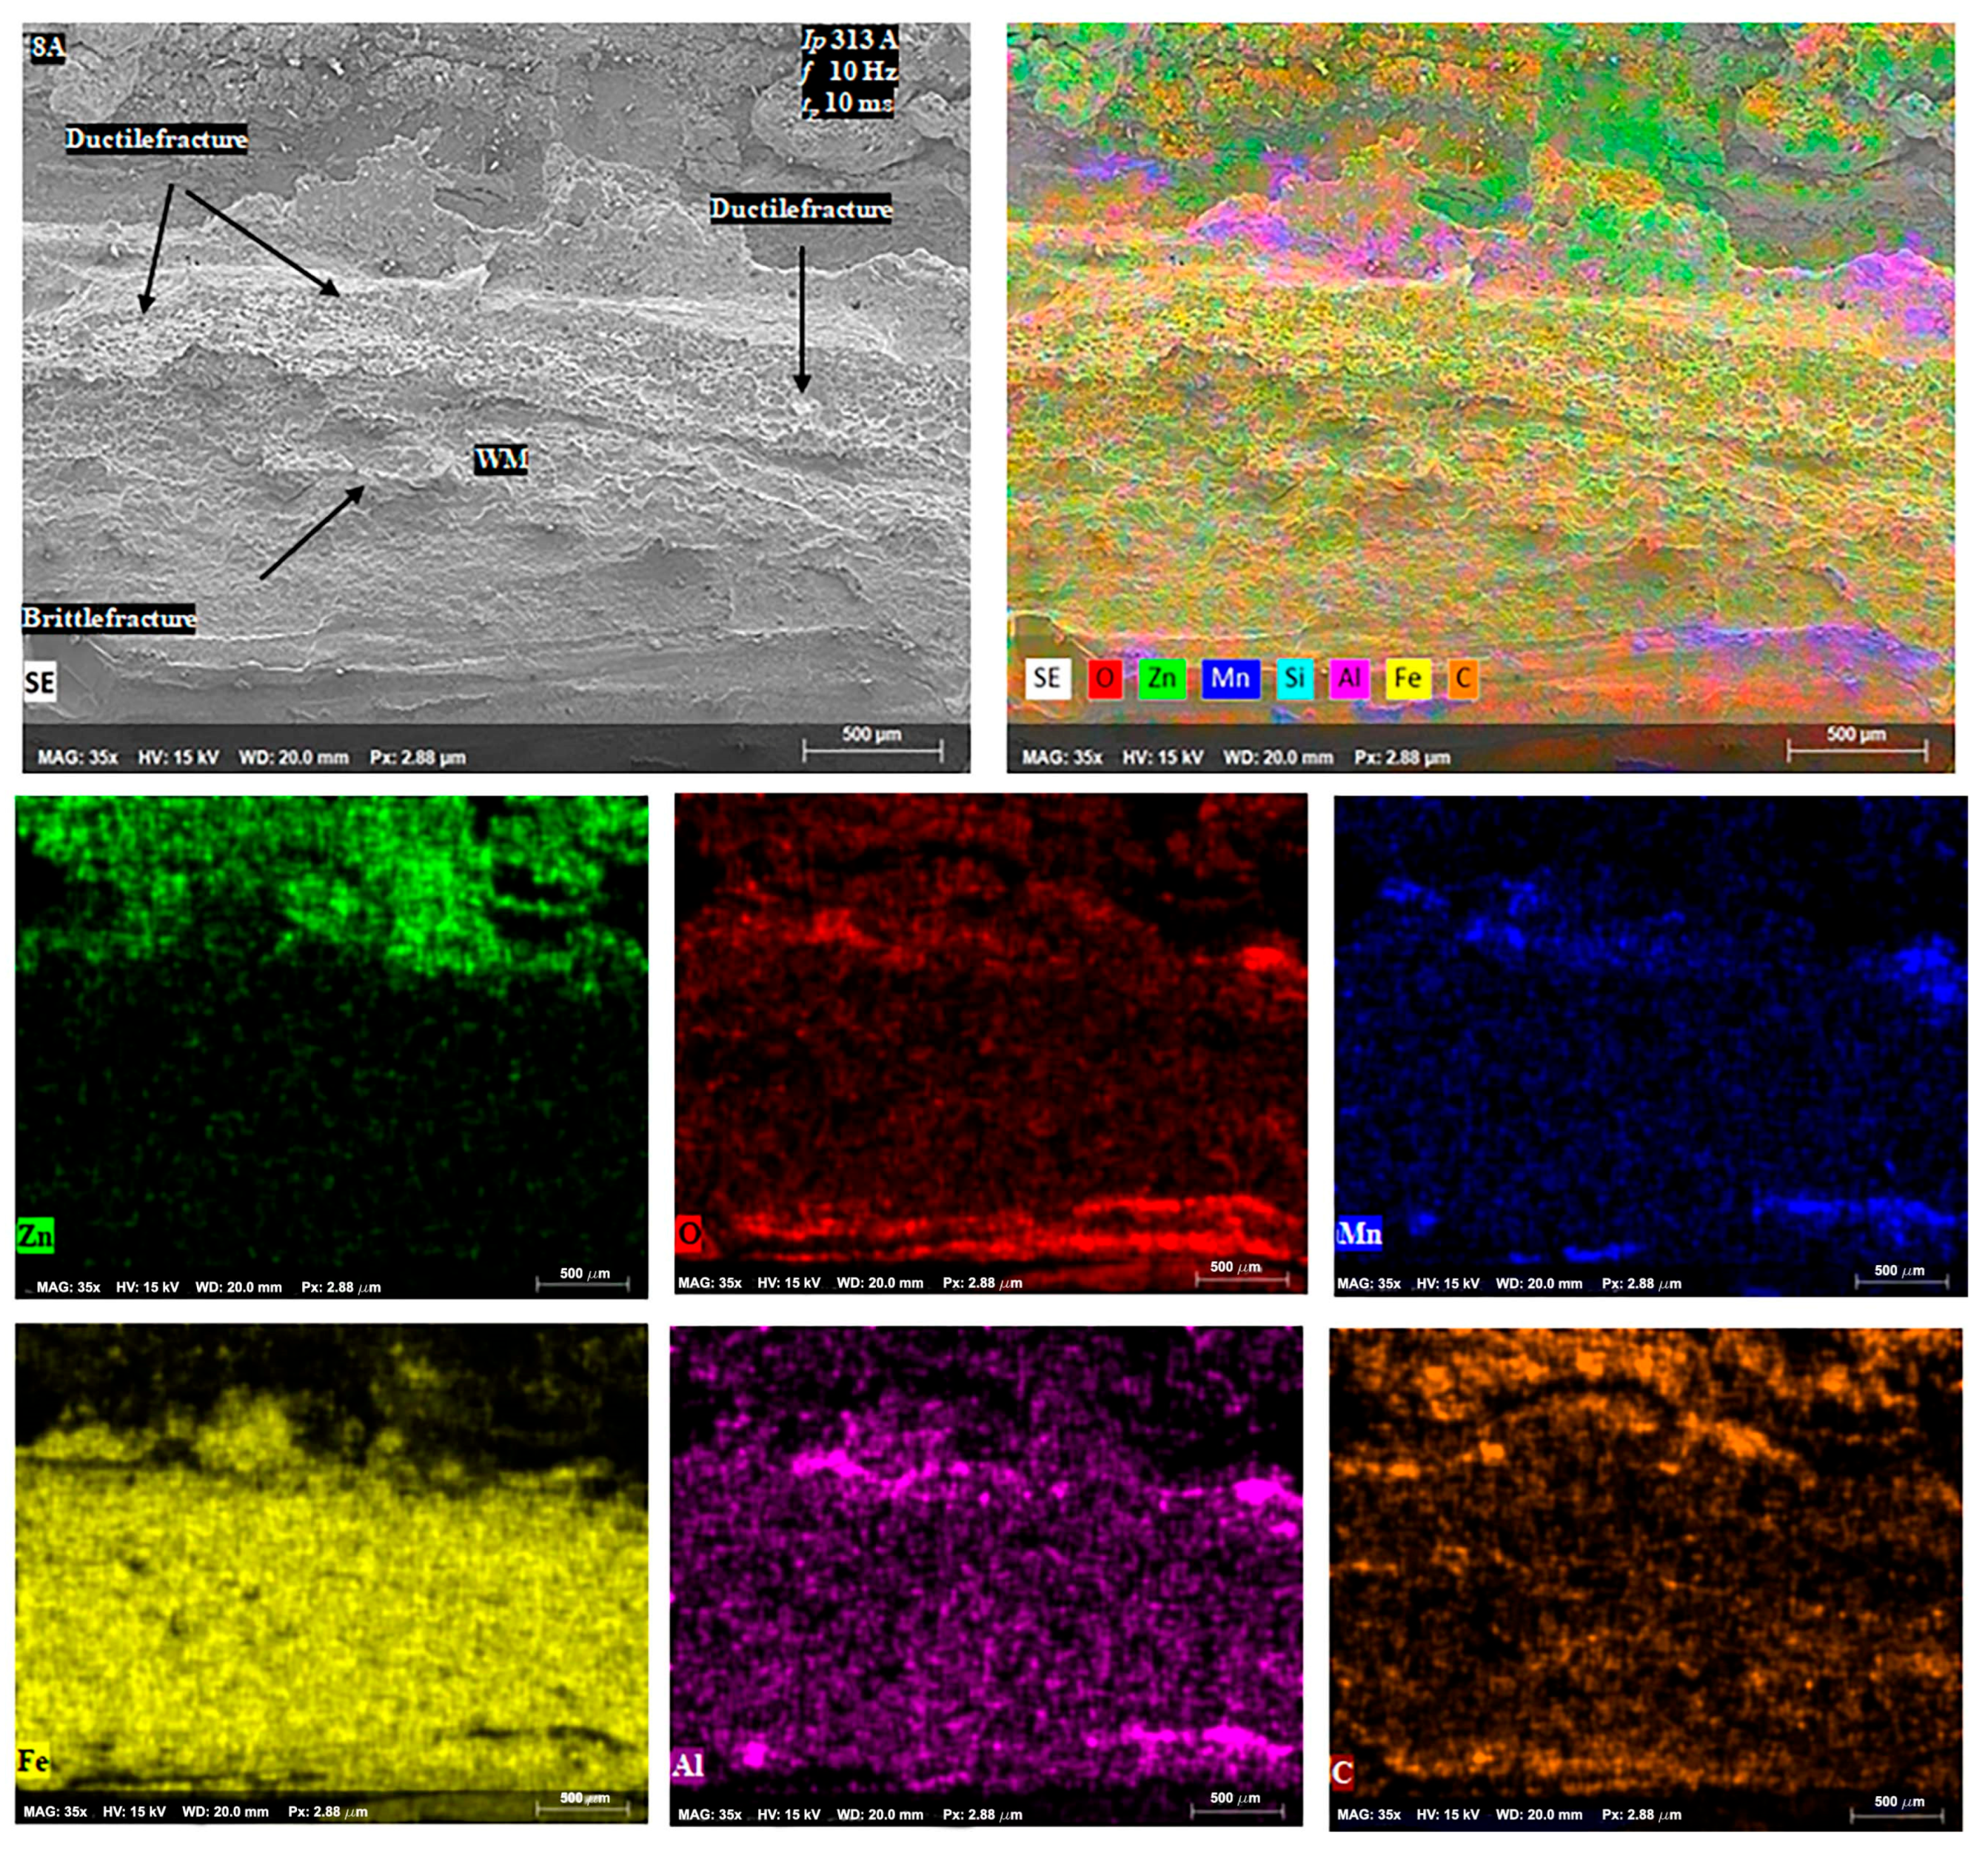
3.2. Porosity Assessment in the Welded Joint
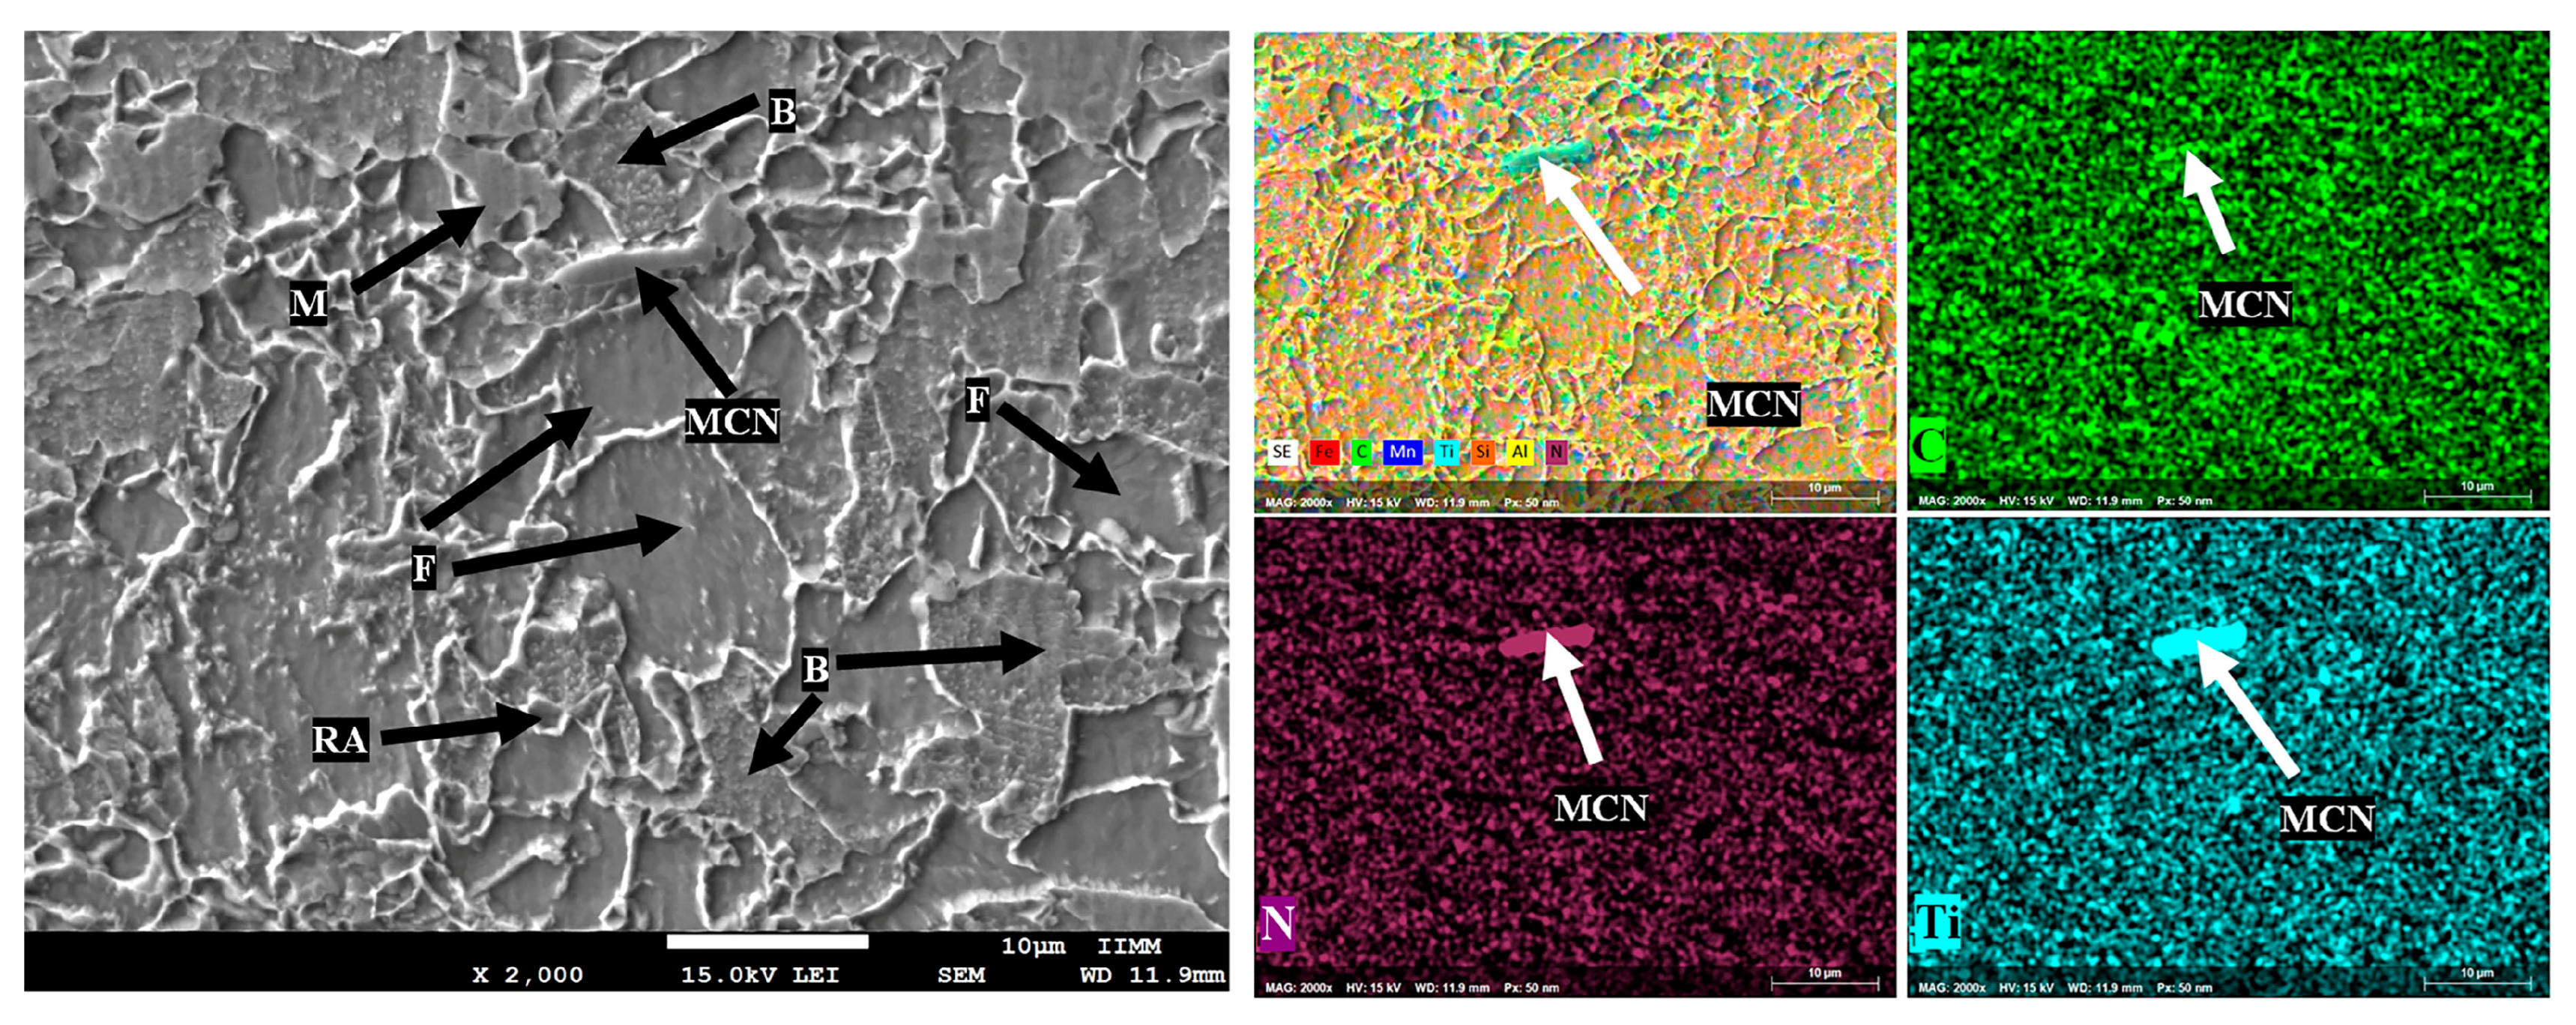
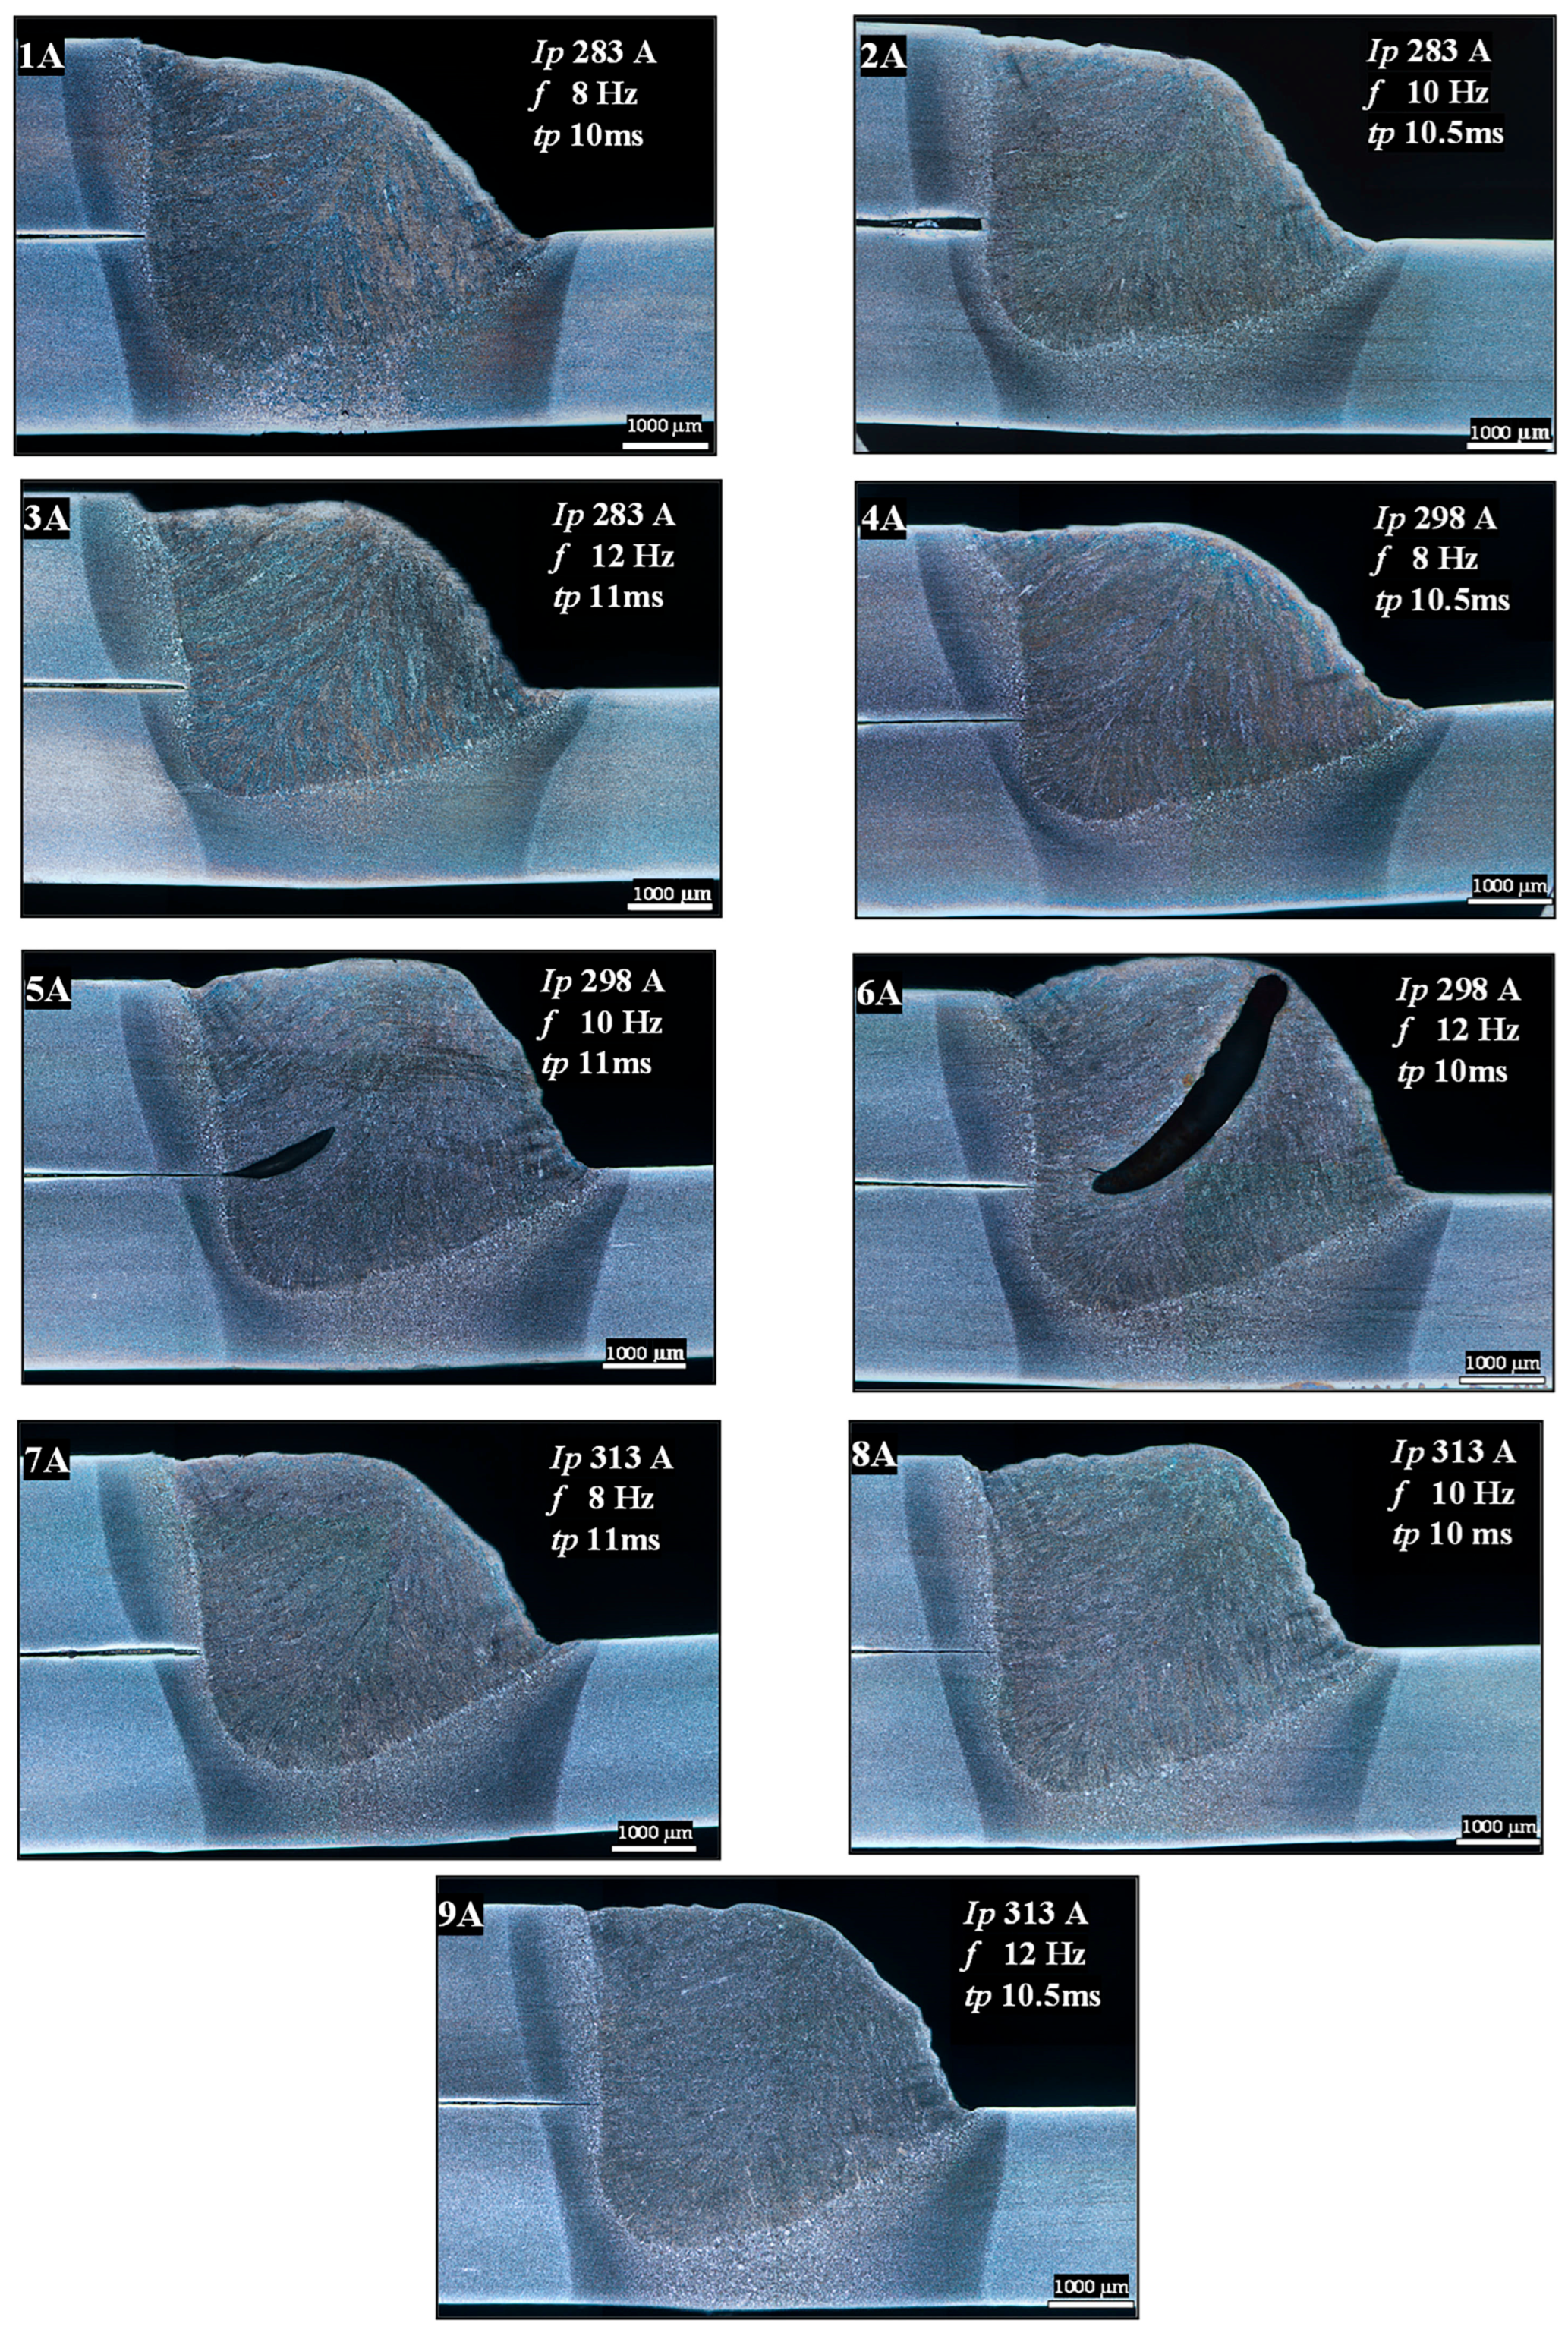
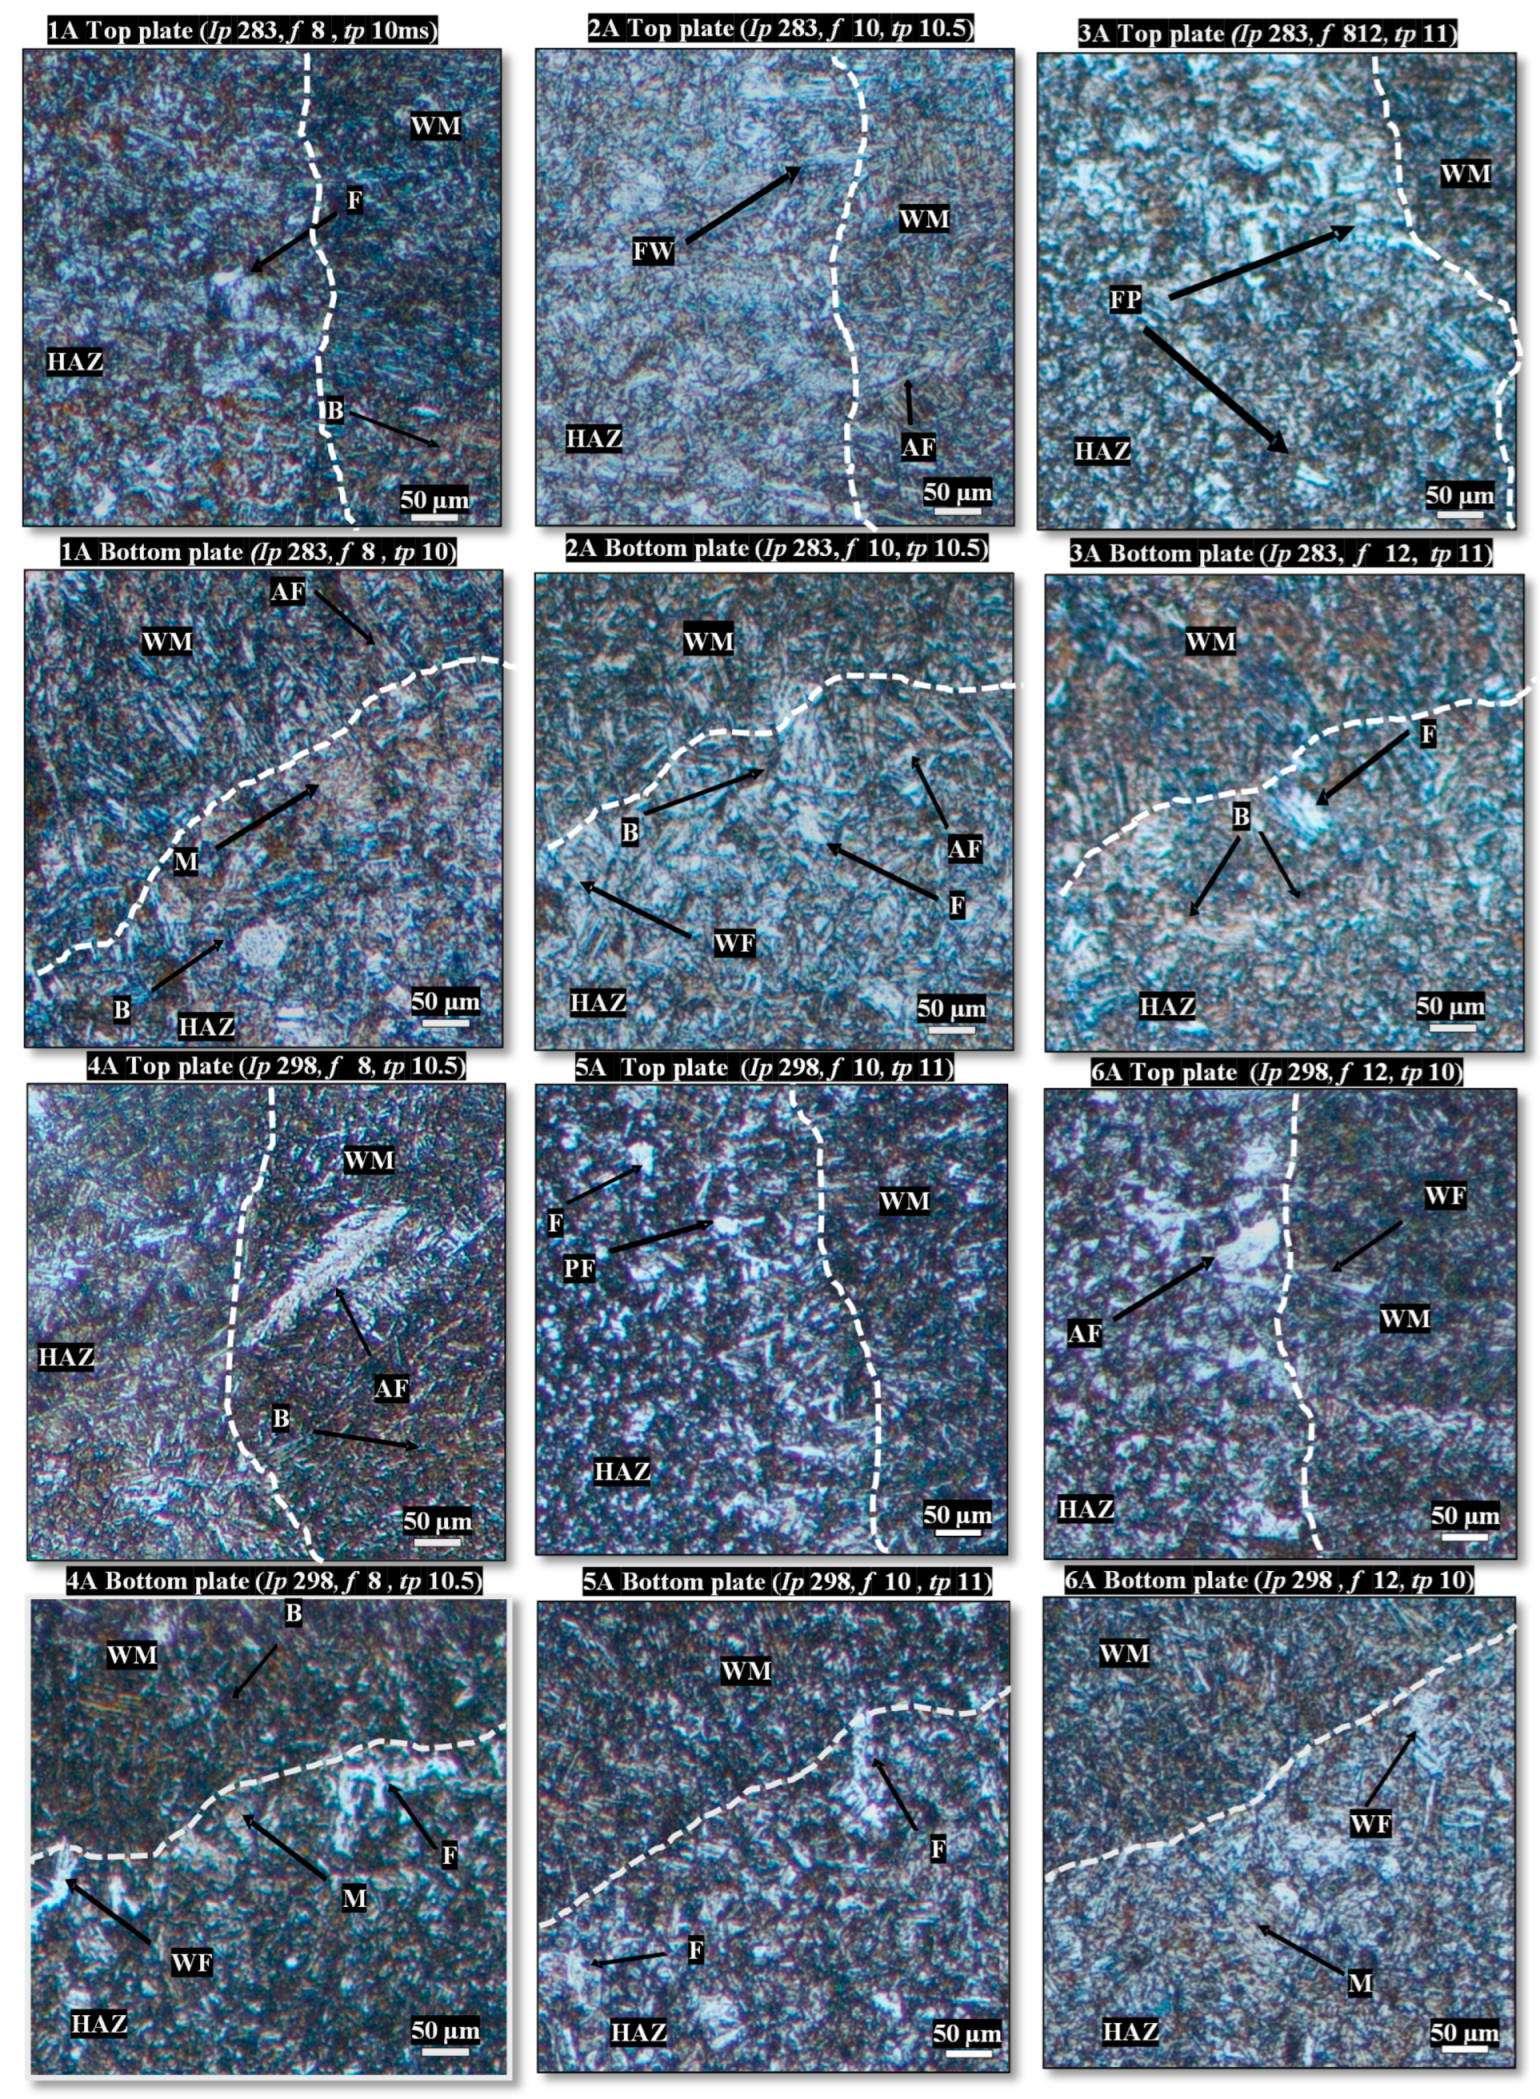
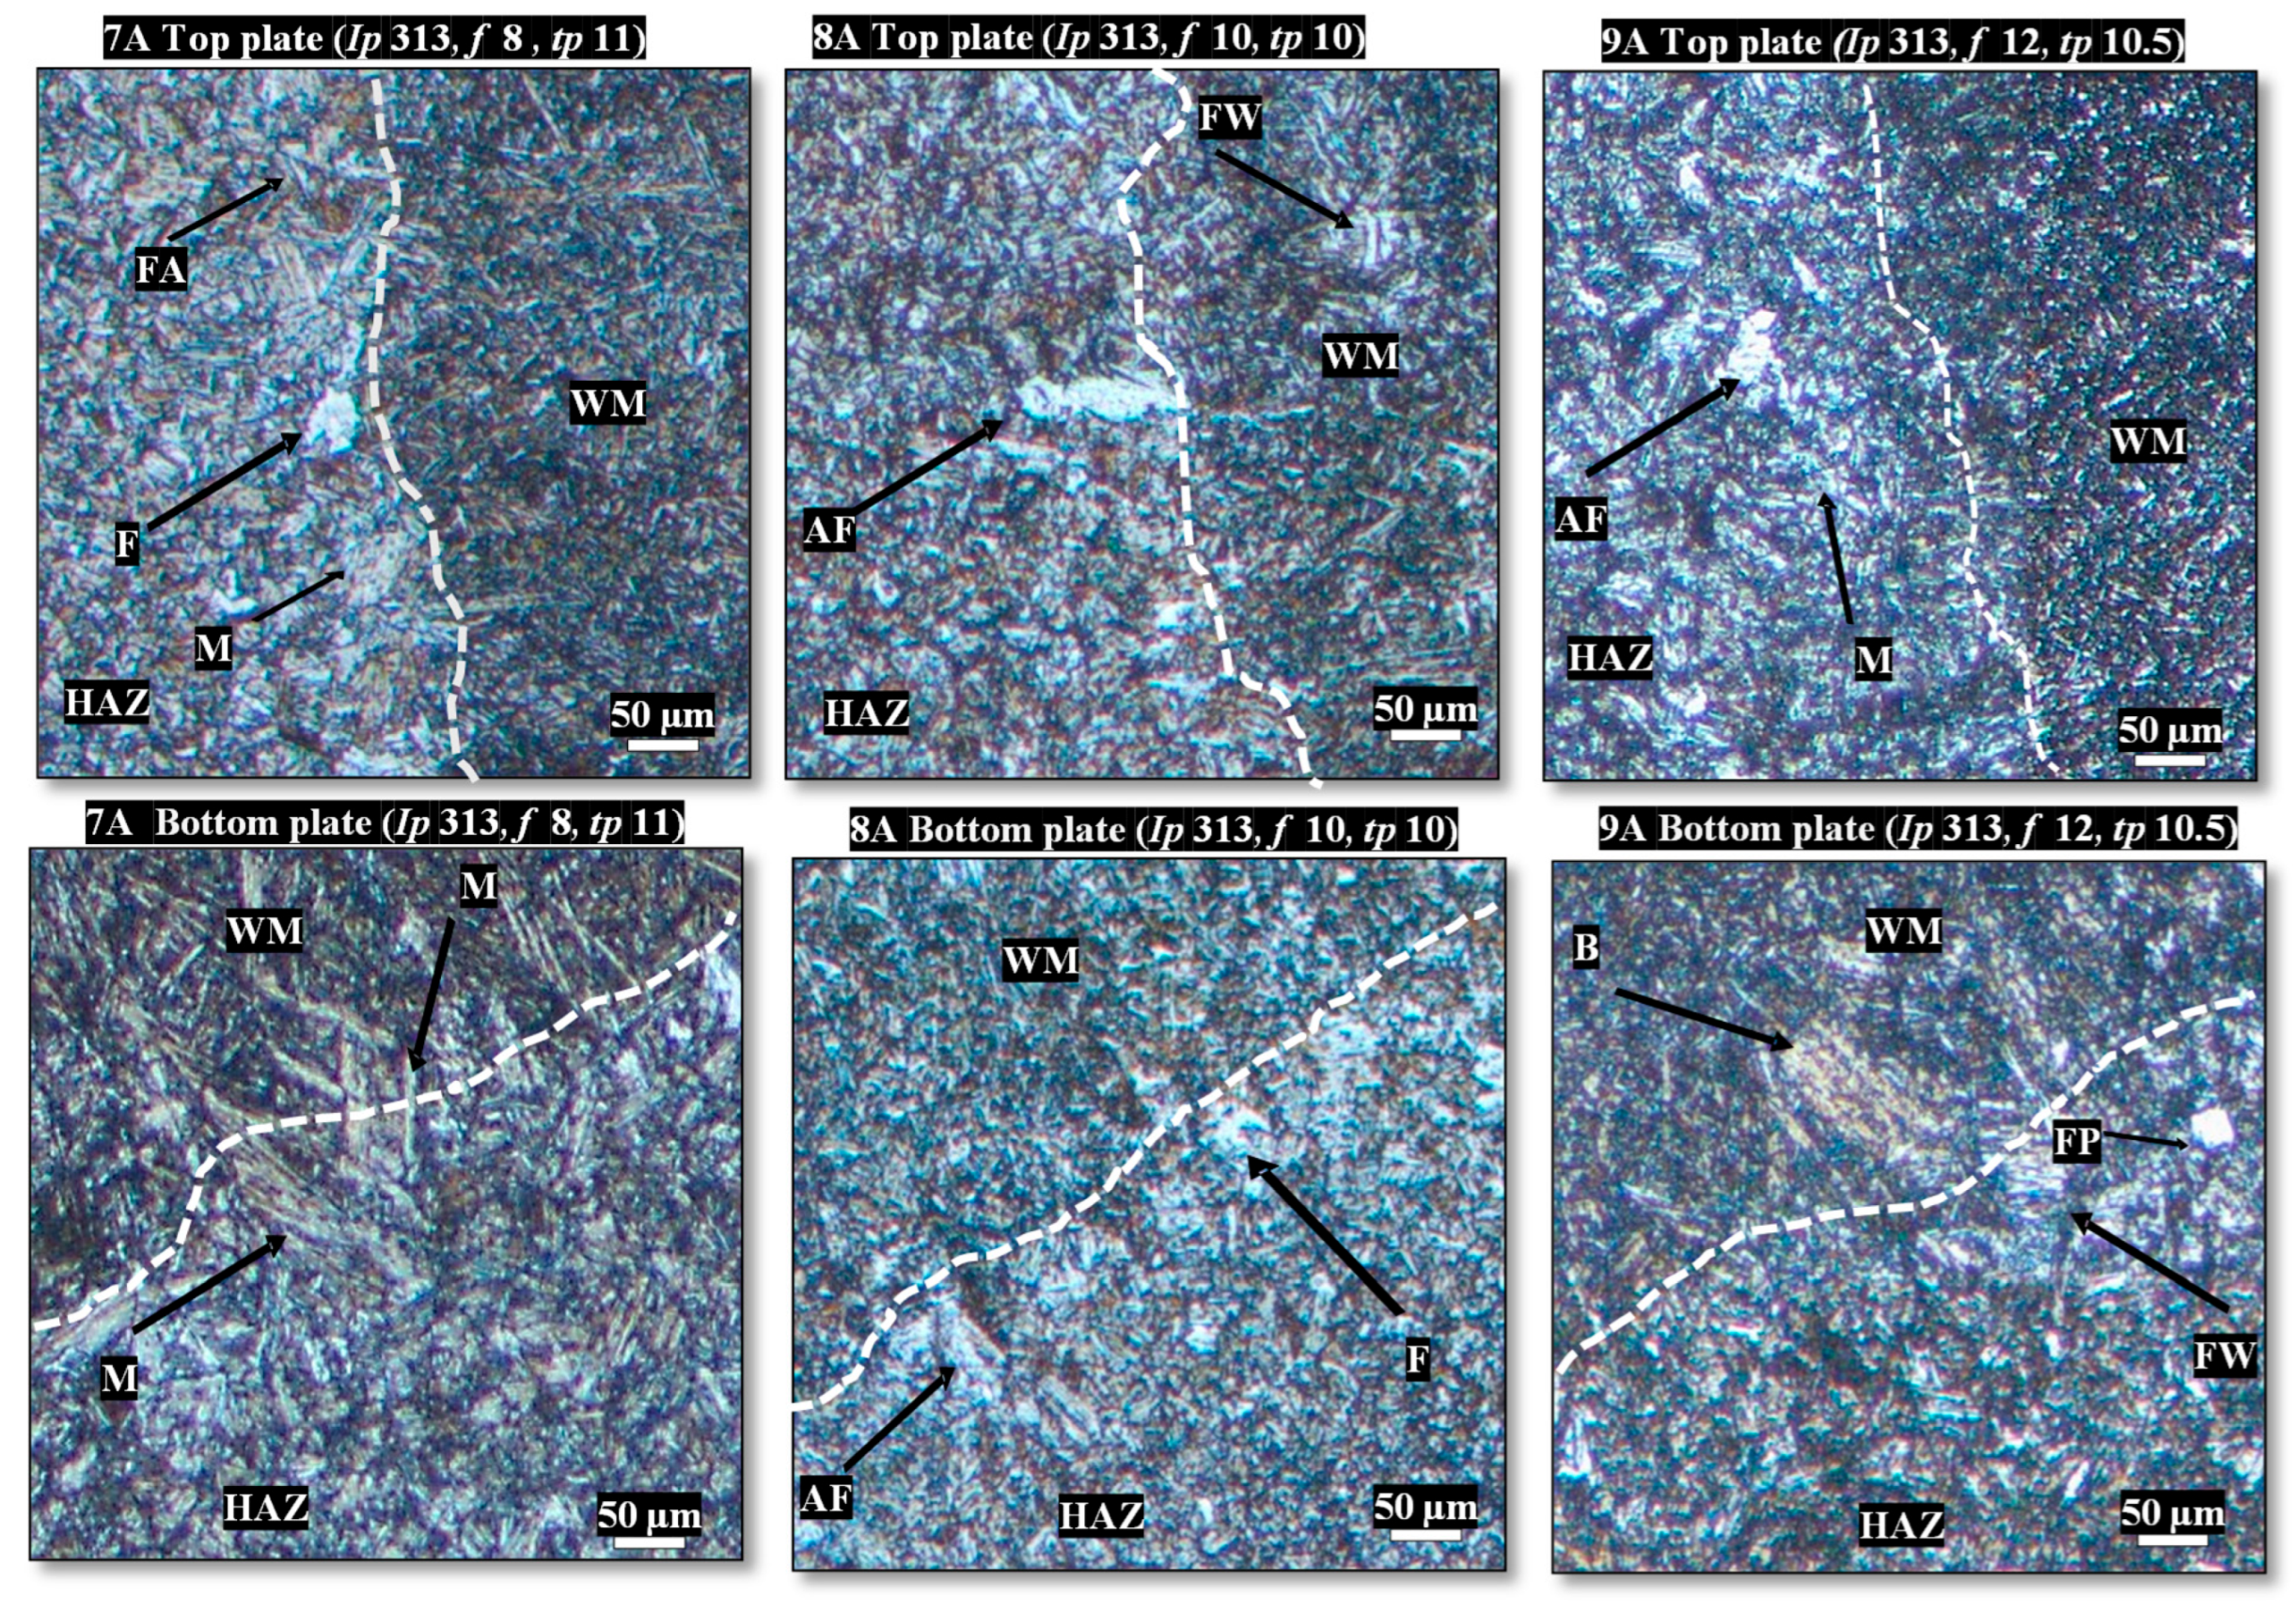
3.3. Macro- and Microstructural Analysis of the Welded Joints
3.4. Chisel Test
3.5. Analysis of Variance (ANOVA)
- ○
- Null Hypothesis (H0): There is no significant difference in porosity across the different levels of peak current (Ip).Alternative Hypothesis (H1): There is a significant difference in porosity across the different levels of peak current (Ip).Case: This hypothesis tests whether variations in the peak current (Ip) significantly affect the porosity levels in the welded joints. Peak current is a critical factor that influences the temperature and dynamics of the weld pool.
- ○
- Null Hypothesis (H0): There is no significant difference in porosity across the different levels of pulse time (tp).Alternative Hypothesis (H1): There is a significant difference in porosity across the different levels of pulse time (tp).Case: This hypothesis examines the influence of the pulse time (tp) on porosity formation. Pulse time affects the duration of each pulse and the cooling rate of the weld, which in turn impacts gas release and the formation of pores.
- ○
- Null Hypothesis (H0): There is no significant difference in porosity across the different levels of pulse frequency (f).Alternative Hypothesis (H1): There is a significant difference in porosity across the different levels of pulse frequency (f).Case: This hypothesis investigates how variations in the pulse frequency (f) influence the formation of porosity. Pulse frequency controls the number of pulses per unit of time, affecting the cooling and solidification rates of the weld pool.
- ○
- Null Hypothesis (H0): There is no significant interaction between the welding parameters (peak current, pulse time, and pulse frequency) on porosity formation.Alternative Hypothesis (H1): There is a significant interaction between the welding parameters (peak current, pulse time, and pulse frequency) on porosity formation.Case: This hypothesis tests whether the combined effects of the peak current, pulse time, and pulse frequency lead to a significant interaction that influences porosity formation. The interaction effects may result in non-linear effects that cannot be understood by examining each parameter individually.
3.6. Model Summary
- Best Predicted Results:
- At 313 A, 10 Hz, and 10.0 ms (penetration 1.8 mm), the model predicted 0.2308% porosity, which is very close to the optimal 0% porosity.
- Similarly, at 313 A, 12 Hz, and 10.5 ms (penetration 1.7 mm), the model predicted 0.6102% porosity, which is a small value, reflecting a good optimization for minimal porosity.
- Worst Predicted Results:
- At 298 A, 10 Hz, and 11.0 ms (penetration 1.5 mm), the model predicted 4.4100% porosity, indicating a suboptimal welding process that leads to higher porosity.
- At 298 A, 12 Hz, and 10.0 ms (penetration 1.6 mm), the model predicted 4.2586% porosity, which is also a higher value, suggesting that the process is not fully optimized for porosity reduction.
3.7. Optimization and Prediction of Porosity
3.8. Validation of Results
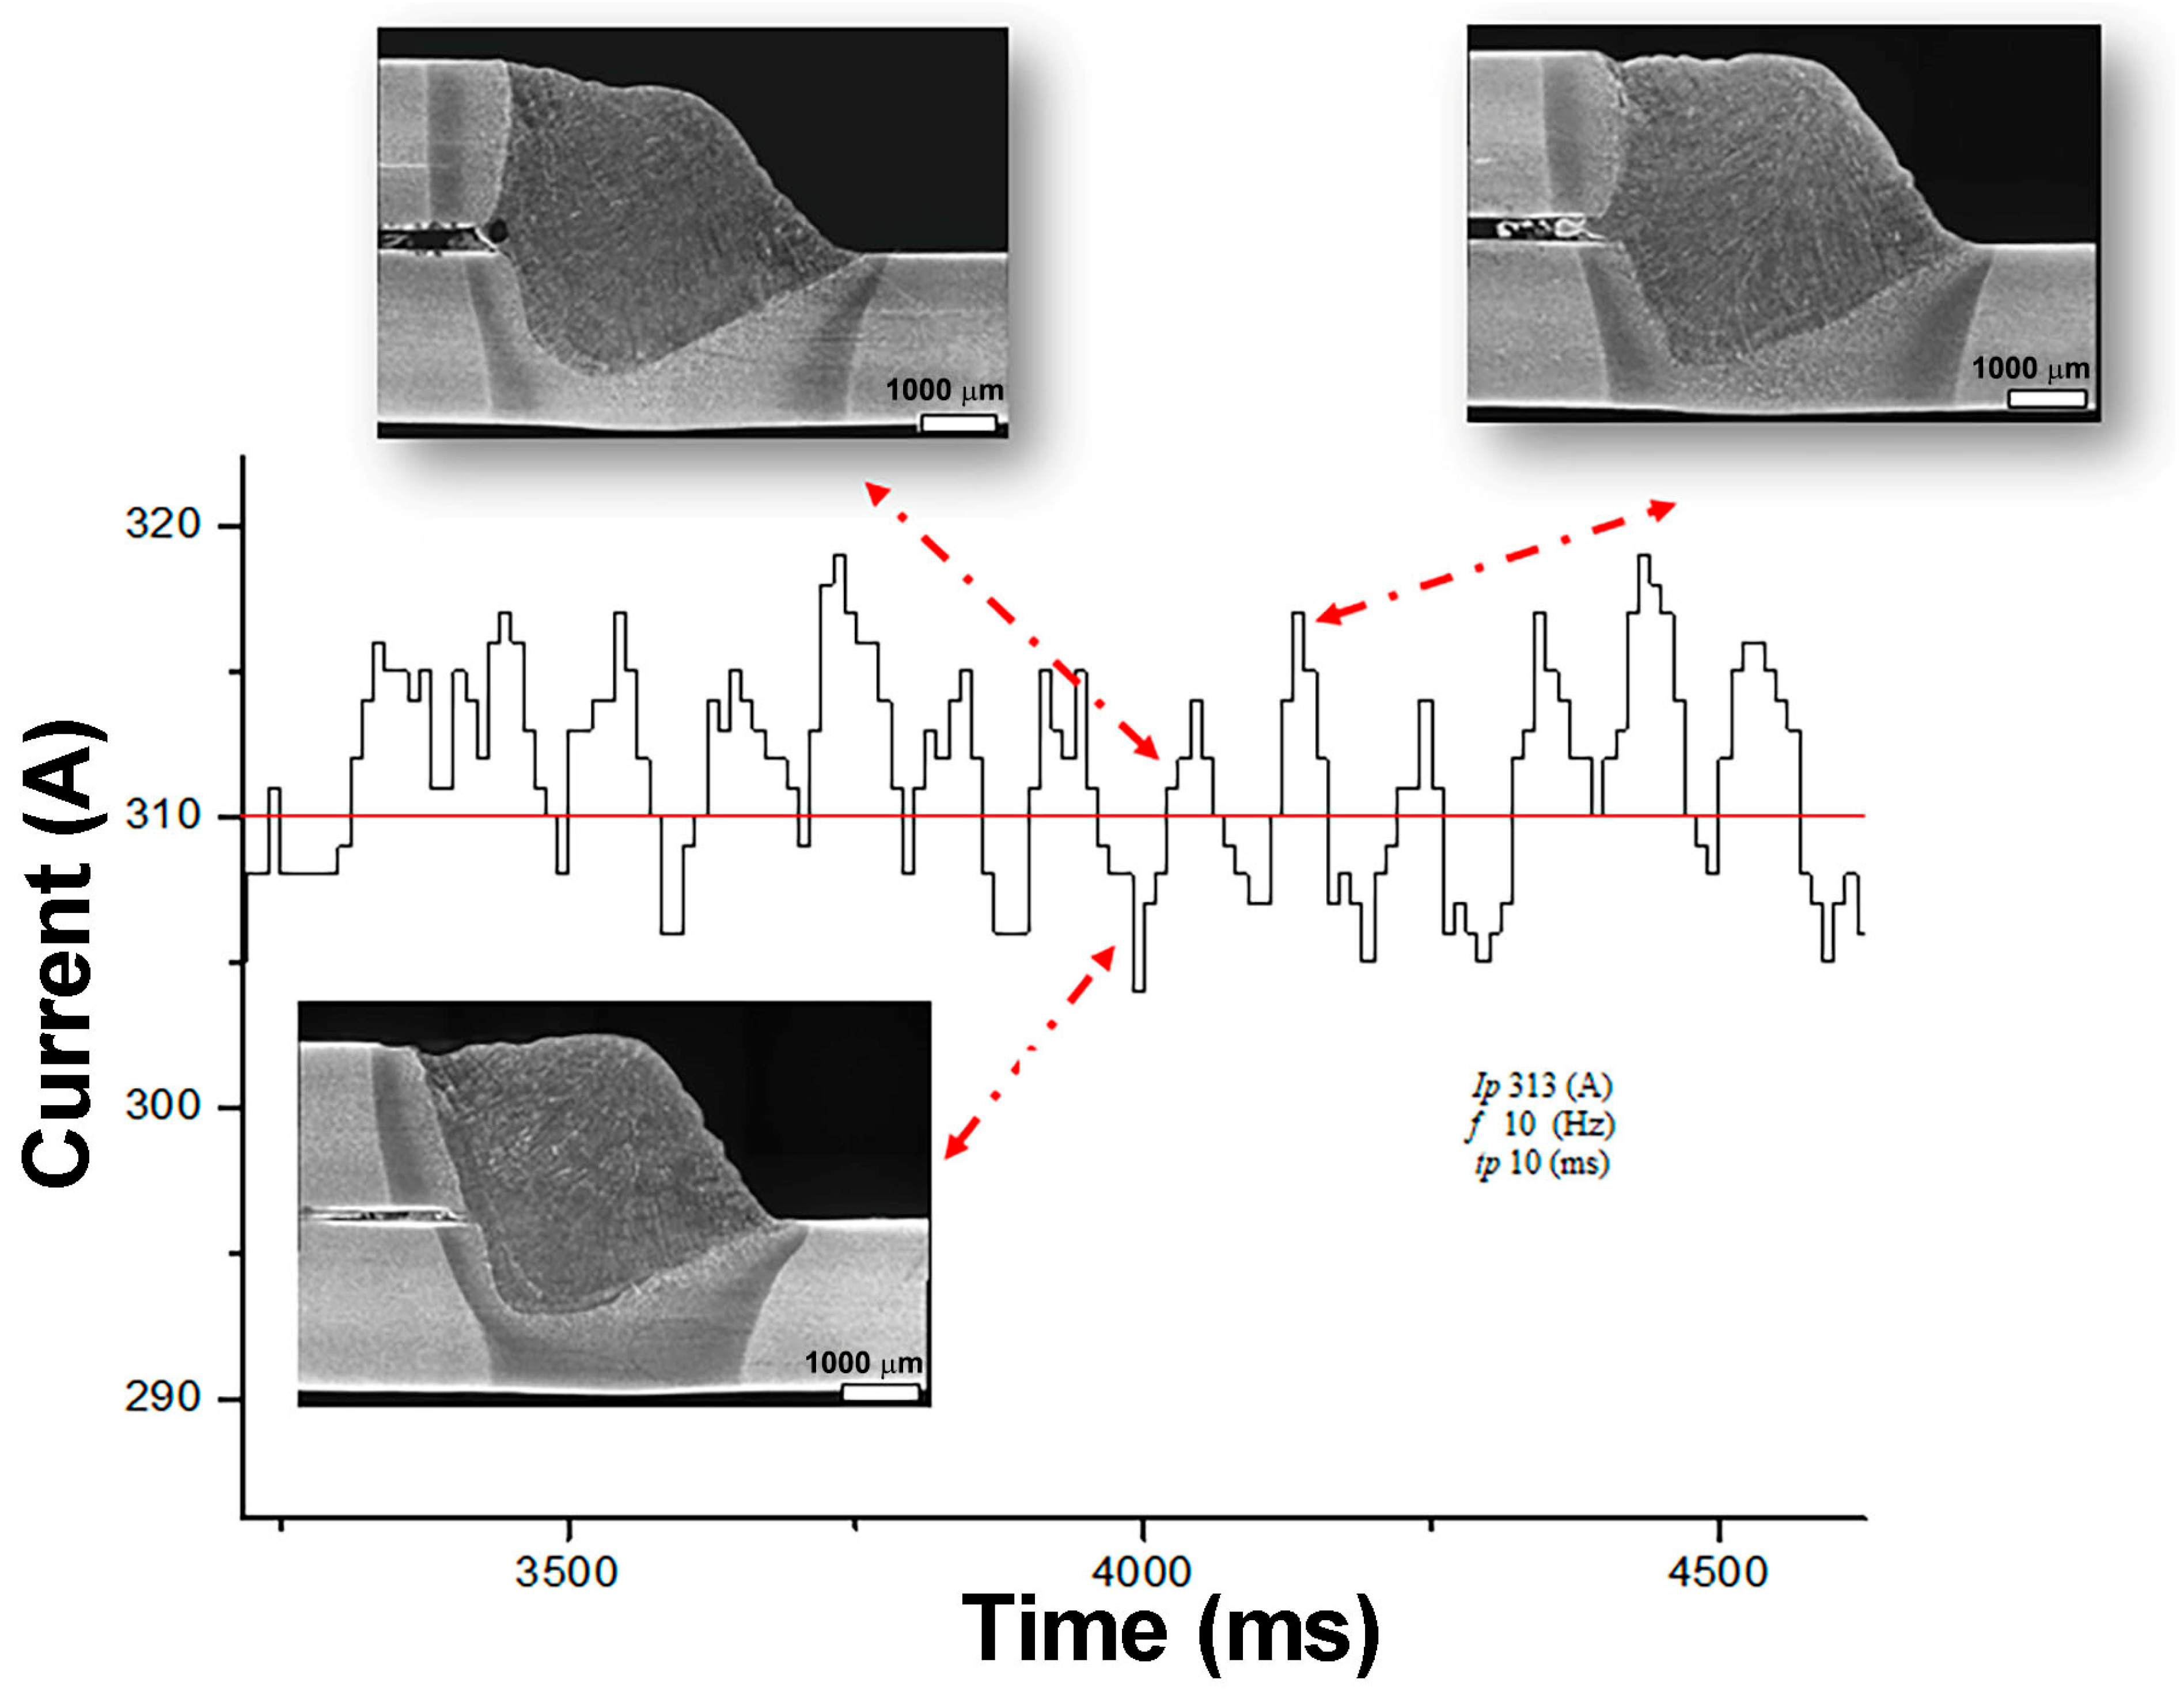
3.9. Effect of Pulsed Waveform
- (i)
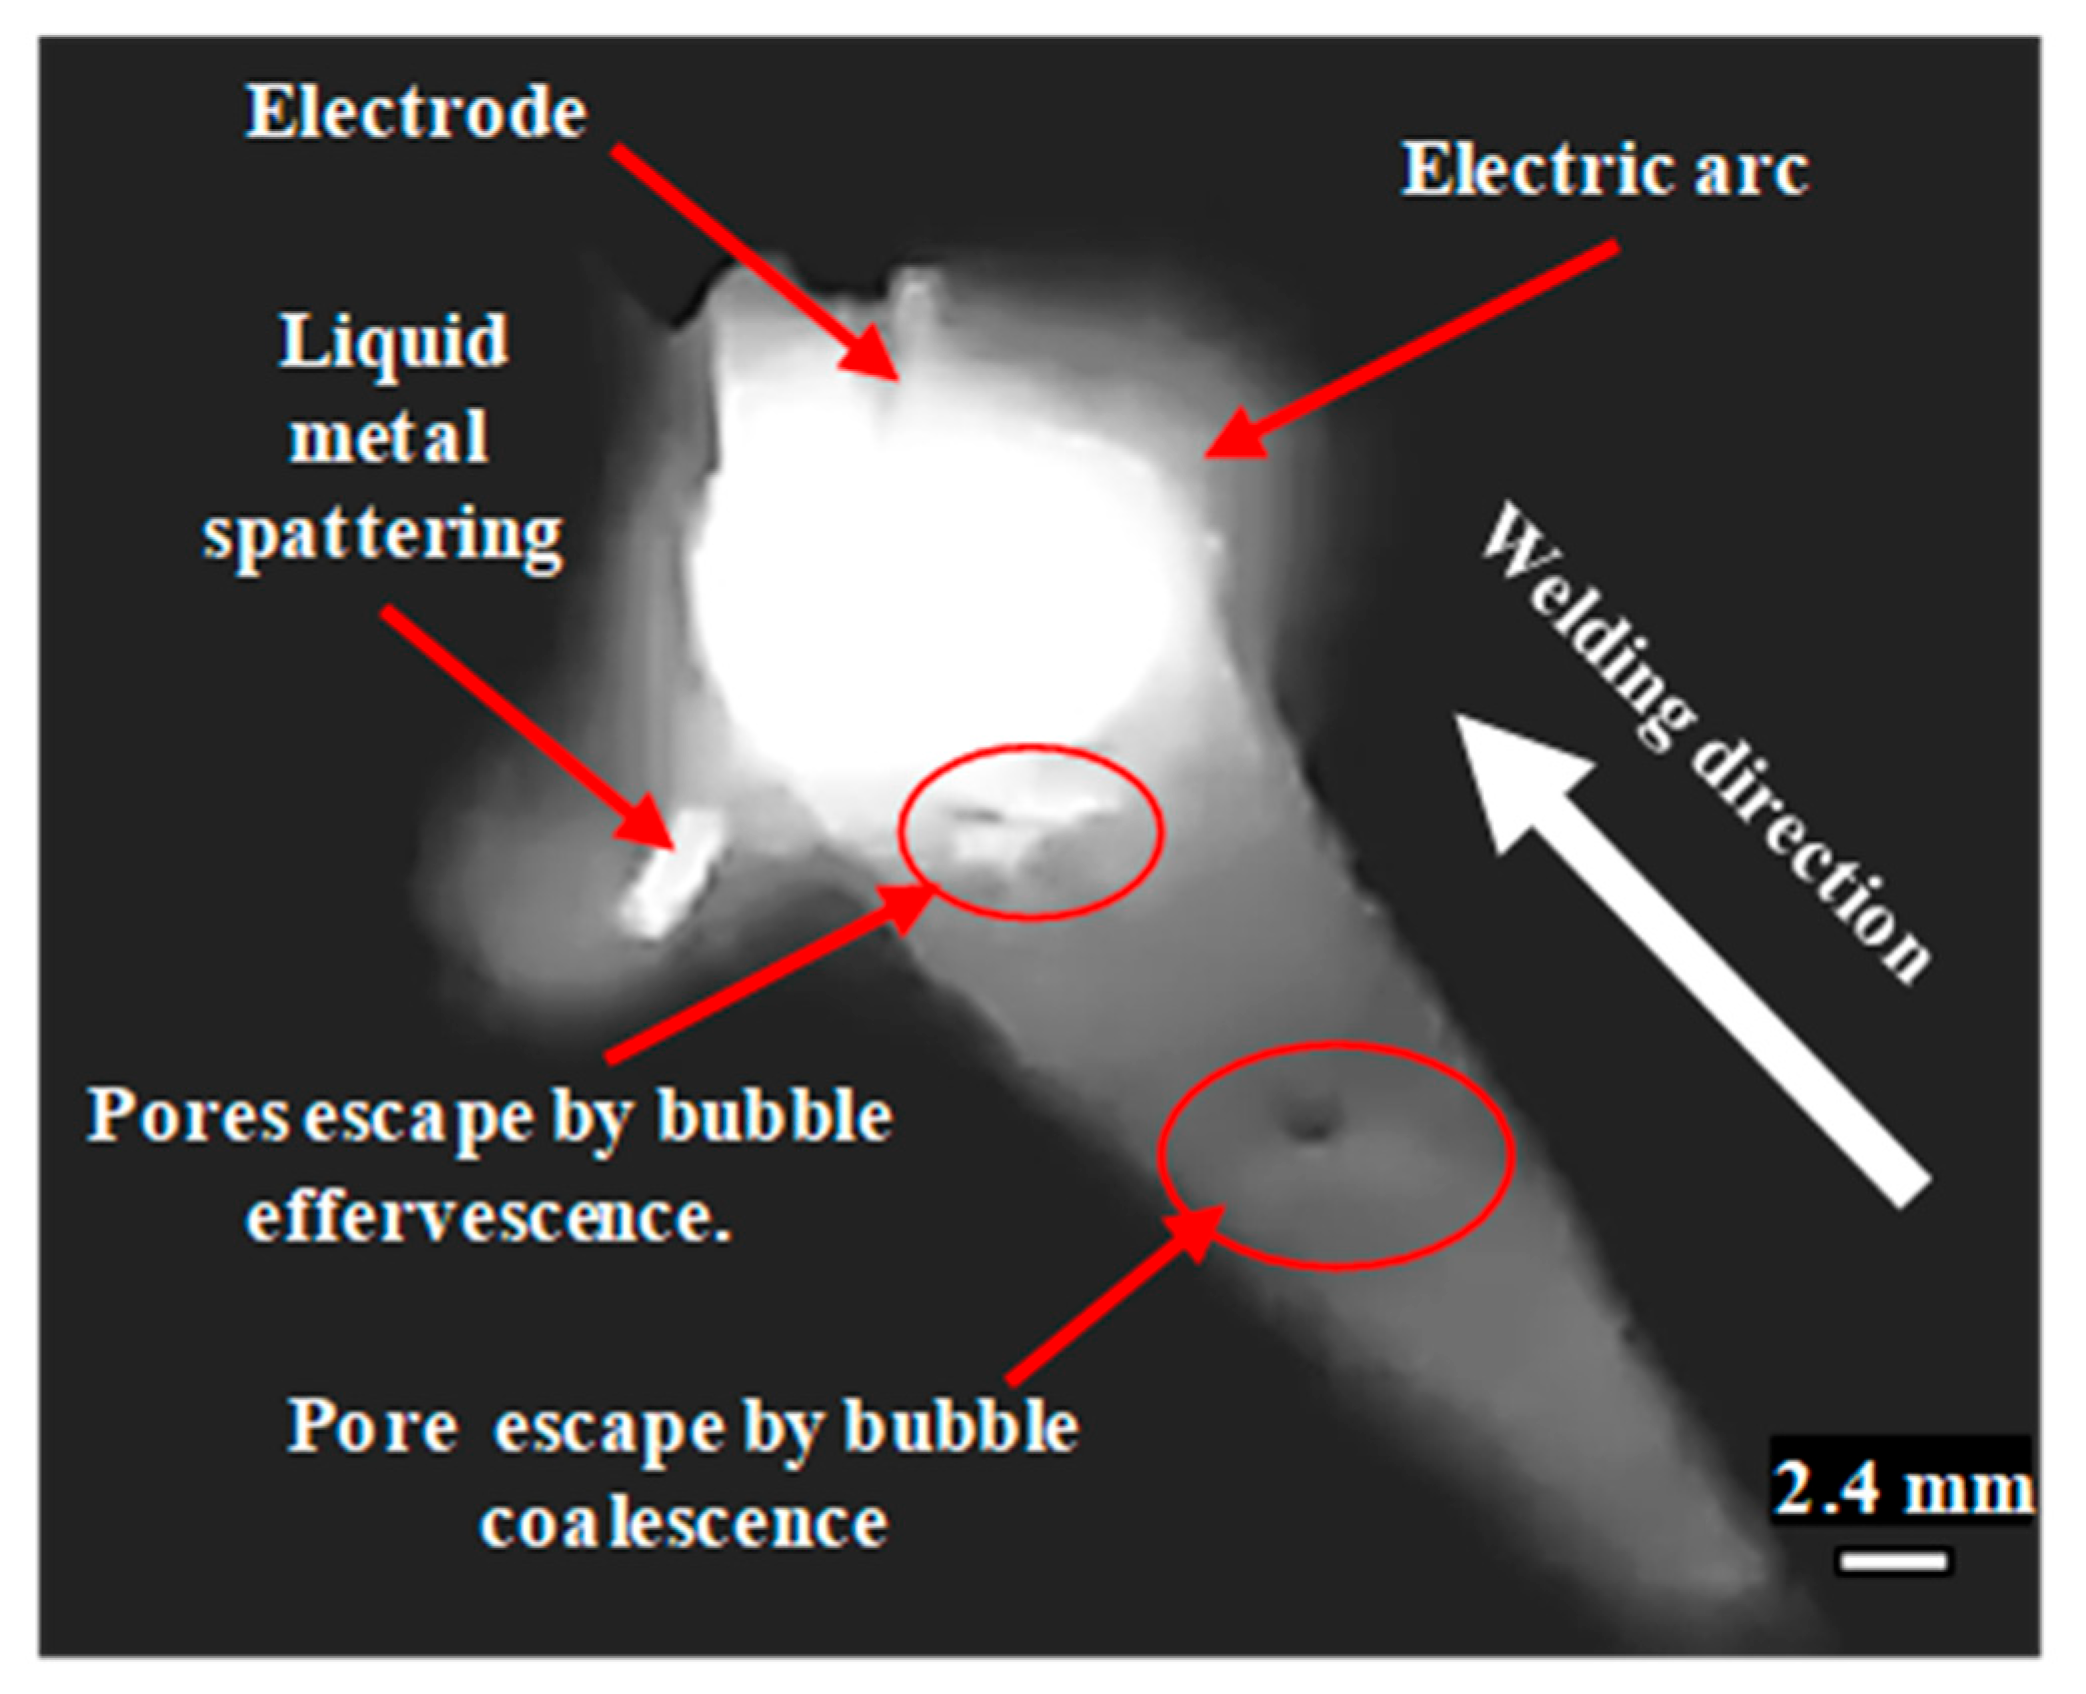
- Bubble effervescence, a phenomenon driven by the high temperature of the molten metal and at the periphery at the electric arc. Bubble effervescence is an extremely rapid formation and expulsion of the Zn vapor bubbles. This mechanism is further accelerated by the convective flows occurring in this region, induced by the movement and concomitant deposition of molten metal, facilitating the rapid release of high-pressure bubbles before coalescing and growing significantly. The bubble effervescence mechanism is pointed in the image of Figure 14.
- (ii)
- Bubble coalescence: the heat source moves forward, leaving behind liquid metal that is still at an elevated temperature, and small bubbles merge before escaping the weld pool. In this region, the molten metal begins to cool and increase in viscosity, making it more difficult for gas bubbles to escape. As a result, higher pressures are required to overcome the surface tension of the liquid metal and atmospheric pressure before escaping from the weld pool. A bubble escaping by this mechanism is also pointed in the image of Figure 14.
4. Conclusions
Author Contributions
Funding
Data Availability Statement
Acknowledgments
Conflicts of Interest
References
- Schmitt, J.H.; Iung, T. New developments of advanced high-strength steels for automotive applications. Comptes Rendus Phys. 2018, 19, 641–656. [Google Scholar] [CrossRef]
- Šmak, M.; Kubíček, J.; Kala, J.; Podaný, K.; Vaněrek, J. The influence of hot-dip galvanizing on the mechanical properties of high-strength steels. Materials 2021, 14, 5219. [Google Scholar] [CrossRef] [PubMed]
- Thierry, D.; LeBozec, N.; Gac, A.L.; Persson, D. Long-term atmospheric corrosion rates of hot dip galvanised steel and zinc-aluminium-magnesium coated steel. Mater. Corros. 2019, 70, 2220–2227. [Google Scholar] [CrossRef]
- Bhattacharya, D. Liquid metal embrittlement during resistance spot welding of Zn-coated high-strength steels. Mater. Sci. Technol. 2018, 34, 1809–1829. [Google Scholar] [CrossRef]
- Das, A.; Shome, M.; Das, C.R.; Goecke, S.F.; De, A. Joining of galvannealed steel and aluminium alloy using controlled short circuiting gas metal arc welding process. Sci. Technol. Weld. Join. 2015, 20, 402–408. [Google Scholar] [CrossRef]
- Ahsan, M.R.U.; Kim, Y.R.; Kim, C.; Kim, J.W.; Ashiri, R.; Park, Y.D. Porosity formation mechanisms in cold metal transfer (cmt) gas metal arc welding (GMAW) of zinc coated steels. Sci. Technol. Weld. Join. 2016, 21, 209–215. [Google Scholar] [CrossRef]
- Sarpe, M.; Treutler, K.; Wesling, V.; Dewald, P.; Schmale, H.C. Influence of classified pore contents on the quasi-static and cyclic strength properties of the welded joint in gas-shielded metal arc welding of galvanized, high-strength steels. J. Adv. Join. Process. 2022, 5, 100094. [Google Scholar] [CrossRef]
- Yao, P.; Zhou, K.; Lin, H.; Xu, Z.; Yue, S. Exploration of weld bead forming rule during double-pulsed GMAW process based on grey relational analysis. Materials 2019, 12, 3662. [Google Scholar] [CrossRef]
- García-Gómez, M.; Curiel-López, F.F.; Taha-Tijerina, J.J.; López-Morelos, V.H.; Verduzco-Juárez, J.C.; García-Ochoa, C.A. Reduction in porosity in GMAW-P welds of CP780 galvanized steel with Er70S-3 electrode using the Taguchi methodology. Metals 2024, 14, 857. [Google Scholar] [CrossRef]
- Garcia-Guerrero, J.C.; Curiel-López, F.F.; López, V.H.; Taha-Tijerina, J.; Sánchez-Cruz, T.J.; Ramírez-López, M.d.C.; Cortés-Carrillo, E.; Quinones-Salinas, M.A. Impact of welding parameters in the porosity of a dissimilar welded lap joint of CP800-XPF1000 steel weldment by GMAW-P. Metals 2024, 14, 309. [Google Scholar] [CrossRef]
- Szczucka-Lasota, B.; Węgrzyn, T.; Jurek, A. Formation of oxides and sulfides during the welding process of S700MC steel by using new electrodes wires. Materials 2024, 17, 2974. [Google Scholar] [CrossRef] [PubMed]
- Sánchez, C.; Bustos, Ó.; Artigas, A.; Bruna, H. Silicon effect and microstructural evolution of hot dip galvanized coating of structural steels. Metals 2023, 13, 1892. [Google Scholar] [CrossRef]
- Bondareva, O.S.; Turovsky, A.M.; Turovsky, Y.M. Application of nickel tablets in hot-dip galvanizing for silicon and phosphorus steel reactivity control. Mater. Sci. Forum 2020, 992, 689–694. [Google Scholar] [CrossRef]
- Tesfaye, F.K. Parameter optimizations of GMAW process for dissimilar steel welding. Int. J. Adv. Manuf. Technol. 2023, 126, 4513–4520. [Google Scholar] [CrossRef]
- AWS D9.1; Sheet metal welding code; AWS: Miami, FL, USA, 2018.
- AWS D8.8; Specification for automotive weld quality; AWS: Miami, FL, USA, 2007.
- ASTM E1742; Standard practice for eadiographic examination. ASTM International: West Conshohocken, PA, USA, 2010.
- AWS D8.7; Recomended practice for automotive weld quality; AWS: Miami, FL, USA, 2005.
- Romero-Orozco, A.J.; Taha-Tijerina, J.J.; De Luna-Alanís, R.; López-Morelos, V.H.; Ramírez-López, M.d.C.; Salazar-Martínez, M.; Curiel-López, F.F. Evaluation of microstructural and mechanical behavior of ahss CP780 steel welded by GMAW-pulsed and GMAW-pulsed-brazing processes. Metals 2022, 12, 530. [Google Scholar] [CrossRef]
- Rivero, P.J.; Berlanga, C.; Palacio, J.F.; Moraleda, M.V.B. Effect of Ti on microstructure, mechanical properties and corrosion behavior of a nickel-aluminum bronze alloy. Mater. Res. 2021, 24, e20200335. [Google Scholar] [CrossRef]
- Kamburova, K.; Boshkova, N.; Boshkov, N.; Radeva, T. Hybrid zinc coating with CuO nanocontainers containing corrosion inhibitor for combined protection of mild steel from corrosion and biofouling. Coatings 2022, 12, 1254. [Google Scholar] [CrossRef]
- ISO 5817; Fusion welding joints in steel, nickel, titanium, and their alloy. ISO International: Geneva, Switzerland, 2023.
- Zhang, Y.; Zhang, Y.; Yang, J.; Li, T.; Chen, Y. Influence of Ti/N ratio on inclusions, microstructures, and toughness in heat-affected zone of shipbuilding steel plates with Mg deoxidation after high heat input welding. Steel Res. Int. 2023, 95, 2300283. [Google Scholar] [CrossRef]
- Fu, Z.; Yang, G.; Xu, Y.; Han, R.; Yin, Q.; Bao, S.; Zhao, G. Continuous cooling transformation behaviour of 30CrMo steel simulated by CSP process. Ironmak. Steelmak. 2021, 48, 1094–1101. [Google Scholar] [CrossRef]
- Zhang, X.; Sun, H.; Gao, S.; Luo, Y. Processing fundamentals and performance investigation of selective laser melting of high-speed steel in reactive N2 atmosphere. Steel Res. Int. 2023, 94, 2200807. [Google Scholar] [CrossRef]
- Zhang, Z.; Ma, Y.; Liu, S.; Su, L.; Fletcher, L.; Li, H.; Wang, B.; Zhu, H. Inhomogeneous strain behaviors of the high strength pipeline girth weld under longitudinal loading. Materials 2024, 17, 2855. [Google Scholar] [CrossRef]
- Yang, M.; Lu, J.; Chen, J.; Li, Y.; Liu, Y.; Yang, H. Effect of welding speed on microstructure and corrosion resistance of Al–Li alloy weld joint. Mater. Corros. 2019, 71, 300–308. [Google Scholar] [CrossRef]
- Cooman, B.C.D.; Estrin, Y.; Kim, S.K. Twinning-induced plasticity (TWIP) steels. Acta Mater. 2018, 142, 283–362. [Google Scholar] [CrossRef]
- Kah, P. Advancements in Intelligent Gas Metal Arc Welding Systems: Fundamentals and Applications; Elsevier: Amsterdam, The Netherlands, 2021. [Google Scholar]
- Pineau, A.; Benzerga, A.A.; Pardoen, T. Failure of metals i: Brittle and ductile fracture. Acta Mater. 2016, 107, 424–483. [Google Scholar] [CrossRef]
- Saarimaa, V.; Kaleva, A.; Nikkanen, J.P.; Manni, J.; Lange, C.; Paunikallio, T.; Laihinen, T.; Heinonen, S.; Levänen, E.; Väisänen, P.; et al. Tailoring of versatile surface morphologies on hot dip galvanized steel in wet CO2: Aspects on formation, barrier properties, and utilization as a substrate for coatings. Acs Appl. Mater. Interfaces 2018, 10, 21730–21739. [Google Scholar] [CrossRef] [PubMed]
- Hertel, M.; Rose, S.; Füssel, U. Numerical simulation of arc and droplet transfer in pulsed GMAW of mild steel in Argon. Weld. World 2016, 60, 1055–1061. [Google Scholar] [CrossRef]
- Matsumoto, N.; Kawahito, Y.; Nishimoto, K.; Katayama, S. Effects of laser focusing properties on weldability in high-power fiber laser welding of thick high-strength steel plate. J. Laser Appl. 2016, 29, 012003. [Google Scholar] [CrossRef]
- Izutani, S.; Yamazaki, K.; Suzuki, R. New welding process,“J-solutionTM Zn”, suitable for galvanized steel in the automotive industry. Eng. Mater. Sci. 2013, 32, 16–23. [Google Scholar]
- Cardenas, C.; Hernandez, L.; Taha-Tijerina, J.J. Effects of GMAW conditions on the tensile properties of hot rolled Complex Phase 780 steel. In Proceedings of the Great Designs in Steel Seminar—GDSI (2015), Detroit, MI, USA, 13 May 2015. [Google Scholar]


| Material | C | Mn | Si | Cr | S | P | Nb | Ti | N | Al | Mo | Ni | Cu | Fe |
|---|---|---|---|---|---|---|---|---|---|---|---|---|---|---|
| CP780 | 0.06 | 1.14 | 0.62 | 0.044 | 0.0094 | 0.0073 | 0.0043 | 0.0021 | 0.011 | 0.055 | 0.024 | 0.061 | 0.011 | 97.72 |
| SM-70MT | 0.099 | 0.896 | 0.024 | 0.048 | 0.0099 | 0.003 | 0.0036 | 0.016 | 0.036 | 0.066 | 0.21 | 0.718 | 0.322 | 97.73 |
| Zn | Al | Mg | Sn | Cu | Fe |
|---|---|---|---|---|---|
| 99.4 | 0.05 | 0.051 | 0.003 | 0.002 | 0.1 |
| Welding Parameters | Symbol | Units | Levels | ||
|---|---|---|---|---|---|
| 1 | 2 | 3 | |||
| Peak current | Ip | (A) | 283 | 298 | 313 |
| Pulse frequency | f | (Hz) | 8 | 10 | 12 |
| Peak time | tp | (ms) | 10 | 10.5 | 11 |
| Welding Trial | Peak Current Ip (A) | Pulse Frequency f (Hz) | Peak Time tp (ms) |
|---|---|---|---|
| 1 | 283 | 8 | 10 |
| 2 | 283 | 10 | 10.5 |
| 3 | 283 | 12 | 11 |
| 4 | 298 | 8 | 10.5 |
| 5 | 298 | 10 | 11 |
| 6 | 298 | 12 | 10 |
| 7 | 313 | 8 | 11 |
| 8 | 313 | 10 | 10 |
| 9 | 313 | 12 | 10.5 |
| Welding Trials | |||||||||
|---|---|---|---|---|---|---|---|---|---|
| 1 A | 2 A | 3 A | 4 A | 5 A | 6 A | 7 A | 8 A | 9 A | |
| Total pores area (mm2) | 22.005 | 0 | 6.516 | 17.115 | 30.686 | 25.416 | 5.777 | 1.489 | 3.596 |
| Weld bead area (mm2) | 616 | 680 | 689 | 638 | 700 | 597 | 653 | 676 | 635 |
| Porosity of the weld (%) | 3.57 | 0 | 0.95 | 2.68 | 4.38 | 4.26 | 0.88 | 0.22 | 0.57 |
| Defect type | Clustered porosity | Lack offusion | Spherical porosity | Clustered porosity | Clustered porosity | Spherical porosity | Clustered porosity | None | Clustered porosity |
| Welding Trial | Arc Power (W) | Weld Penetration on Bottom Sheet (mm) | HAZ Size (mm2) |
|---|---|---|---|
| 1 | 6689 | 1.7 | 9.90 |
| 2 | 6765 | 1.5 | 9.48 |
| 3 | 6672 | 1.4 | 9.59 |
| 4 | 6615 | 1.3 | 10.17 |
| 5 | 6761 | 1.5 | 9.85 |
| 6 | 6804 | 1.6 | 10.74 |
| 7 | 6791 | 1.5 | 9.70 |
| 8 | 6785 | 1.8 | 9.65 |
| 9 | 6912 | 1.7 | 10.21 |
| Source | DF | SS Sec. | Contribution | SS Adj. | MS Adj. | F Value | p Value |
|---|---|---|---|---|---|---|---|
| Penetration | 1 | 0.3816 | 1.48% | 4.054 | 4.05402 | 494.08 | 0.029 |
| Ip | 2 | 19.221 | 74.78% | 16.949 | 8.47452 | 1032.83 | 0.022 |
| f | 2 | 3.003 | 11.68% | 4.1801 | 2.09006 | 254.73 | 0.044 |
| tp | 2 | 3.0885 | 12.02% | 3.0885 | 1.54423 | 188.2 | 0.051 |
| Error | 1 | 0.0082 | 0.03% | 0.0082 | 0.00821 | ||
| Total | 8 | 25.7022 | 100.00% |
| S | R-Squared | Adjusted R-Squared | PRESS | Predicted R-Squared |
|---|---|---|---|---|
| 0.0905822 | 99.97% | 99.74% | 2.25333 | 91.23% |
| Parameters and Covariate | Adjusted Mean | Standard Error of the Mean | Coef. | SE of Coef. | 95% CI | T-Value | p-Value | VIF |
|---|---|---|---|---|---|---|---|---|
| Ip 283 A | 1.7632 | 0.0536 | −0.1923 | 0.0443 | (−0.7554, 0.3707) | −4.34 | 0.144 | 1.44 |
| Ip 298 A | 4.853 | 0.0706 | 2.8974 | 0.0638 | (2.0871, 3.7078) | 45.43 | 0.014 | 2.97 |
| Ip 313 A | −0.7496 | 0.079 | −2.7051 | 0.073 | (−3.6328, −1.7775) | −37.05 | 0.017 | * |
| f 8 Hz | 3.0581 | 0.0601 | 1.1026 | 0.052 | (0.4423, 1.7628) | 21.22 | 0.03 | 1.97 |
| f 10 Hz | 1.0068 | 0.0574 | −0.9487 | 0.0488 | (−1.5692, −0.3283) | −19.43 | 0.033 | 1.74 |
| f 12 Hz | 1.8017 | 0.0526 | −0.1538 | 0.0431 | (−0.7016, 0.3939) | −3.57 | 0.174 | * |
| tp 10.0 ms | 0.9889 | 0.0931 | −0.9667 | 0.088 | (−2.0852, 0.1519) | −10.98 | 0.058 | 5.67 |
| tp 10.5 ms | 1.7581 | 0.0601 | −0.1974 | 0.052 | (−0.8577, 0.4628) | −3.8 | 0.164 | 1.97 |
| tp 11.0 ms | 3.1197 | 0.0706 | 1.1641 | 0.0638 | (0.3537, 1.9745) | 18.25 | 0.035 | * |
| Penetration (mm) | 1.556 | 0.159 | 1.8834 | 0.0847 | (0.8068, 2.9600) | 22.23 | 0.029 | 7 |
| Ip (A) | f (Hz) | tp (ms) | Penetration (mm) | %Porosity (Calculated) | %Porosity (Real) |
|---|---|---|---|---|---|
| 283 | 8 | 10 | 1.7 | 3.6102 | 3.6 |
| 283 | 10 | 10.5 | 1.5 | −0.041 | 0 |
| 283 | 12 | 11 | 1.4 | 0.9304 | 0.9 |
| 298 | 8 | 10.5 | 1.3 | 2.7308 | 2.7 |
| 298 | 10 | 11 | 1.5 | 4.41 | 4.4 |
| 298 | 12 | 10 | 1.6 | 4.2586 | 4.3 |
| 313 | 8 | 11 | 1.5 | 0.859 | 0.9 |
| 313 | 10 | 10 | 1.8 | 0.2308 | 0.2 |
| 313 | 12 | 10.5 | 1.7 | 0.6102 | 0.6 |
| Predicted Porosity (Fit) | Standard Error of Fit (SE Fit) | 95% Confidence Interval (CI) | 95% Prediction Interval (PI) |
|---|---|---|---|
| 0.230769 | 0.0851961 | (−0.851750, 1.31329) | (−1.34928, 1.81082) |
| Welding parameters | Factor | ||
| Ip (A) | f (Hz) | Tp (ms) | |
| 313 | 10 | 10 | |
Disclaimer/Publisher’s Note: The statements, opinions and data contained in all publications are solely those of the individual author(s) and contributor(s) and not of MDPI and/or the editor(s). MDPI and/or the editor(s) disclaim responsibility for any injury to people or property resulting from any ideas, methods, instructions or products referred to in the content. |
© 2025 by the authors. Licensee MDPI, Basel, Switzerland. This article is an open access article distributed under the terms and conditions of the Creative Commons Attribution (CC BY) license (https://creativecommons.org/licenses/by/4.0/).
Share and Cite
García Ochoa, C.A.; Verduzco Martínez, J.A.; Curiel-López, F.F.; López-Morelos, V.H.; Taha-Tijerina, J.J.; Medina Flores, A.; García Gómez, M. Advanced Porosity Control of CP780 Galvanized Steel During Gas Metal Arc Welding with Pulsed Arc. Metals 2025, 15, 513. https://doi.org/10.3390/met15050513
García Ochoa CA, Verduzco Martínez JA, Curiel-López FF, López-Morelos VH, Taha-Tijerina JJ, Medina Flores A, García Gómez M. Advanced Porosity Control of CP780 Galvanized Steel During Gas Metal Arc Welding with Pulsed Arc. Metals. 2025; 15(5):513. https://doi.org/10.3390/met15050513
Chicago/Turabian StyleGarcía Ochoa, Carlos Adrián, Jorge Alejandro Verduzco Martínez, Francisco Fernando Curiel-López, Víctor Hugo López-Morelos, José Jaime Taha-Tijerina, Ariosto Medina Flores, and Maleni García Gómez. 2025. "Advanced Porosity Control of CP780 Galvanized Steel During Gas Metal Arc Welding with Pulsed Arc" Metals 15, no. 5: 513. https://doi.org/10.3390/met15050513
APA StyleGarcía Ochoa, C. A., Verduzco Martínez, J. A., Curiel-López, F. F., López-Morelos, V. H., Taha-Tijerina, J. J., Medina Flores, A., & García Gómez, M. (2025). Advanced Porosity Control of CP780 Galvanized Steel During Gas Metal Arc Welding with Pulsed Arc. Metals, 15(5), 513. https://doi.org/10.3390/met15050513