Article

Optimizing the High-Temperature Oxidation Resistance of Nb-Si-Based Alloys by Adding Different Ti/Mo/Hf Elements

by
Youwei Zhang
1,2,3,
Zhongde Shan
1,*,
Lei Luo
4,*,
Zhaobo Li
5,*,
Xiao Liang
4,
Yanqing Su
4,
Tao Yang
1,
Yong Zang
2 and
Dehua Jin
1,3
1
China Academy of Machinery Science and Technology Group Co., Ltd., Beijing 100044, China
2
School of Mechanical Engineering, University of Science and Technology Beijing, Beijing 100044, China
3
China Academy of Machinery Shenyang Research Institute of Foundry Co., Ltd., Shenyang 110000, China
4
Harbin Institute of Technology Zhengzhou Research Institute, Zhengzhou 450000, China
5
Central Iron and Steel Research Institute, Beijing 100081, China
*
Authors to whom correspondence should be addressed.
Metals 2025, 15(4), 439; https://doi.org/10.3390/met15040439
Submission received: 22 February 2025 / Revised: 11 April 2025 / Accepted: 11 April 2025 / Published: 14 April 2025

Abstract

:
As a candidate material for turbine blades in aerospace engines, Nb-Si-based alloys have attracted significant research attention due to their high melting point and low density. However, their poor high-temperature oxidation resistance limits practical applications. Different alloying elements, including Ti, Mo, and Hf, were added to Nb-Si-based alloys to study the microstructural evolution of alloys. Additionally, the oxidation behavior and the oxidation kinetics of different alloys, as well as the morphology and microstructure of oxide scale and interior alloys at 1523 K from 1 h to 20 h were analyzed systematically. The current findings indicated that the Mo element is more conducive to promoting the formation of high-temperature precipitates of β-Nb5Si3 than the Ti and Hf elements. Inversely, the Ti element tends to cause the transition from high-temperature-phase β-Nb5Si3 to low-temperature-phase α-Nb5Si3, while the Hf element improves the appearance of the γ-Nb5Si3 phase but inhibits the other phases and refines the primary Nbss effectively. Noteworthily, compared with the oxidation weight gain of different alloys, Nb-16Si-20Ti-5Mo-3Hf-2Al-2Cr alloy has excellent high-temperature oxidation resistance, in which the oxidation products are TiNb2O7, Nb2O5, SiO2, TiO2, and HfO2. It can be determined that in the oxidation process, the Ti element will preferentially form an oxide film of TiO2, thereby wrapping around the matrix phases, protecting the matrix, and improving the antioxidant capacity, while the Hf element can form an infinite solid solution with the matrix and consume the small number of oxygen atoms entering the matrix, so as to achieve the effect of improving the oxidation resistance.

1. Introduction

As a turbine blade material, the following four requirements must be met [1]: high corrosion resistance, excellent overall performance (high creep resistance and strength, and a certain toughness), a low expansion coefficient, and good processing performance. As a candidate for new high-temperature structural materials, the melting point of silicon-based intermetallic compounds must exceed 2250 K [2,3]. Nb-Si intermetallic compounds are the most favorable competitor for turbine engine materials with comprehensive properties, especially Nb5Si3 intermetallic compounds [4], which have a melting point of 2757 K. The Nb-Si alloy has a lower density (7.16 g/cm3) and a higher melting point (about 1073 K) than the nickel-based superalloy intermetallic compound.
However, the high-temperature oxidation resistance of Nb-Si alloys is poor [5], which has caused a bottleneck restricting the development of Nb-Si alloys. However, its oxidation resistance can be effectively improved through alloying [1]. The common alloying elements of Nb-Si alloys are Ti [6], B [7], Hf [8], Al [9], Cr [10], Mo [11], Sn [12], Ta [13], etc. Among them, Ti and Hf can significantly reduce the diffusion rate of O in alloys. However, the content of Ti should not exceed 24% [14] to avoid further oxidation of the Nb-Si alloy. A high content of Cr can promote the formation of Laves (Cr2Nb) [15], which significantly improves the oxidation resistance of Nb-Si. The metastable phase (Nb3Si) will then be decomposed into Nbss and Nb5Si3 by the addition of Al [16], enhancing the stability of the phase (Nb5Si3) in the Nb-Si alloy. Al2O3 has a dense oxide film preventing O from permeating the Nb-Si alloy. Mechanical properties are taken into account while maintaining high-temperature oxidation resistance. Therefore, Cr and Al additions are generally kept at a low content [17,18,19]. Si can effectively enhance the oxidation resistance of the Nb-Si alloy by forming a dense SiO₂ layer, which inhibits oxygen diffusion. Even in Si-containing alloys, the optimized distribution and activity of Si further strengthen this protection [20,21,22]. It has been reported that Mo can reduce the pesting of Nb-Si alloys [23,24]. Sn elements can significantly reduce Nb-Si alloy’s pest-related oxidation sensitivity.
Research on the high-temperature oxidation resistance of multicomponent Nb-Si alloys is still in the preliminary stages, both at home and abroad. This article studies the oxidation behavior of Nb-Si-Ti-Mo-Hf-Al-Cr at 1523 K and analyzes the phase composition, microstructure, and composition of the oxide film after different oxidation times. A preliminary study on the high-temperature oxidation resistance of Nb-Si alloys has been conducted to study the mechanism of oxidation of Nb-Si-Ti-Mo-Hf-Al-Cr alloys.

2. Methods

2.1. Material Preparation

Six ingots with different chemical compositions (the chemical composition is expressed as atomic percentage, if not explicitly stated in this article), as shown in Table 1, were prepared by using raw materials of high purity Nb (>99.9 wt.%), Si (>99.99 wt.%), Ti (99.4 wt.%), Hf (>99.99 wt.%), Mo (>99.4 wt.%), Al (>99.9 wt.%) and Cr (>99.4 wt.%). Each ingot was arc-melted in a water-cooled copper crucible under argon atmosphere protection at 2473–2673 K, with a vacuum level lower than 5 × 10⁻³ Pa, and remelted 5 times for homogeneity. The weight and size of the samples were about 50 g and Φ20 mm × 30 mm; these were then cut into 6 × 6 × 3 mm3 dimensions for performing the microstructural analysis and oxidation tests. Unit area normalization was used to eliminate edge effects. The compositions used in this research were designed based on prior studies [6,8,17]. To balance the stability of the phase and the antioxidant properties, the ratio of Nb:Si deviated slightly from 3:1.

2.2. Measurement and Analysis Methods

The chemical compositions of the phases were determined by a combination of X-ray diffraction (XRD) (Empyrean, Panalytical, NL) and X-ray photoelectron spectroscopy (XPS, ESCALAB 250Xi, ThermoFisher, Waltham, MA, USA). The microstructure of the samples was analyzed using scanning electron microscopy (SEM, Quanta 200FEG, FEI, USA) with energy dispersive spectroscopy (EDS, Quanta 200FEG, FEI, USA). The primary dendrite size and the secondary dendrite size were measured and calculated using Image-Pro 11 software. The oxidation tests were performed in a high-temperature heat treatment furnace at 1523 K. The six surfaces of the specimen were polished until smooth with SiC papers and washed with alcohol. Then, each specimen was placed in a corundum crucible heated at 1523 K for 2 h to remove any moisture. Oxidized samples were extracted from the furnace at a particular time at 1523 K to measure the weight gain. Then, the mass difference before and after oxidation was calculated using a precision analytical balance with an accuracy of 0.0001 g to obtain the oxidation weight per unit area. The dendrite sizes of the samples were measured and counted using Image-Pro software.

3. Results and Discussion

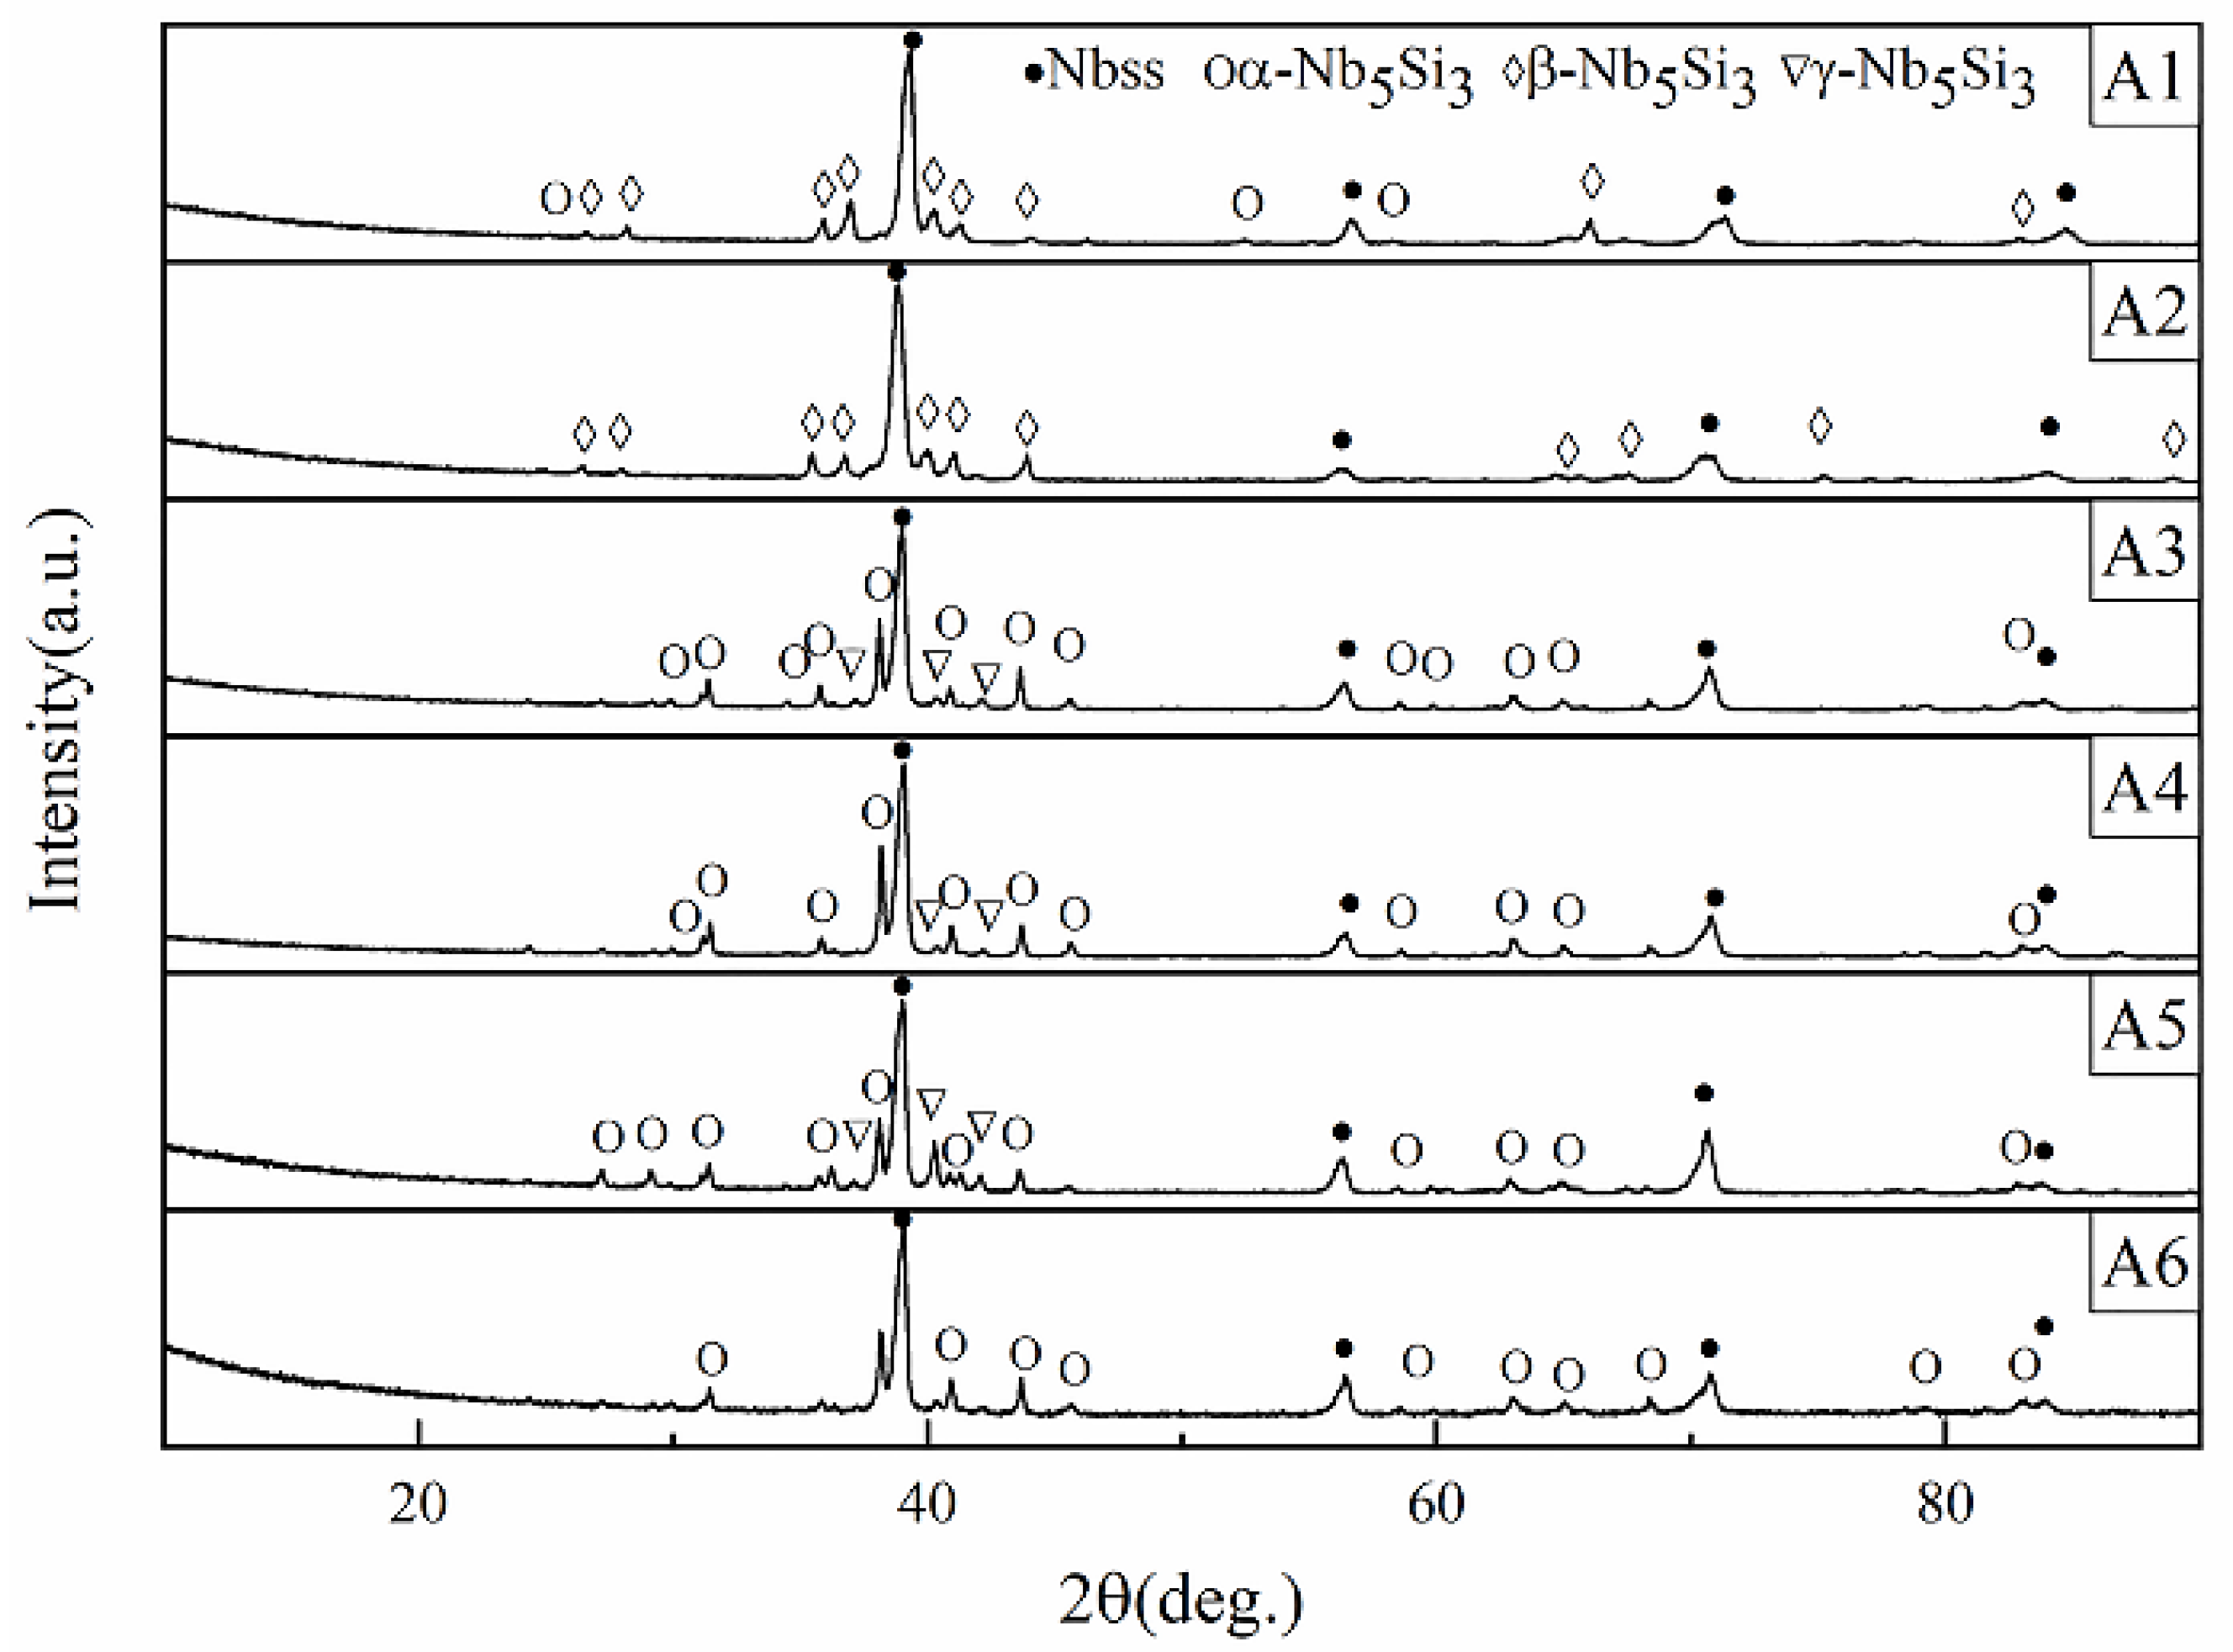
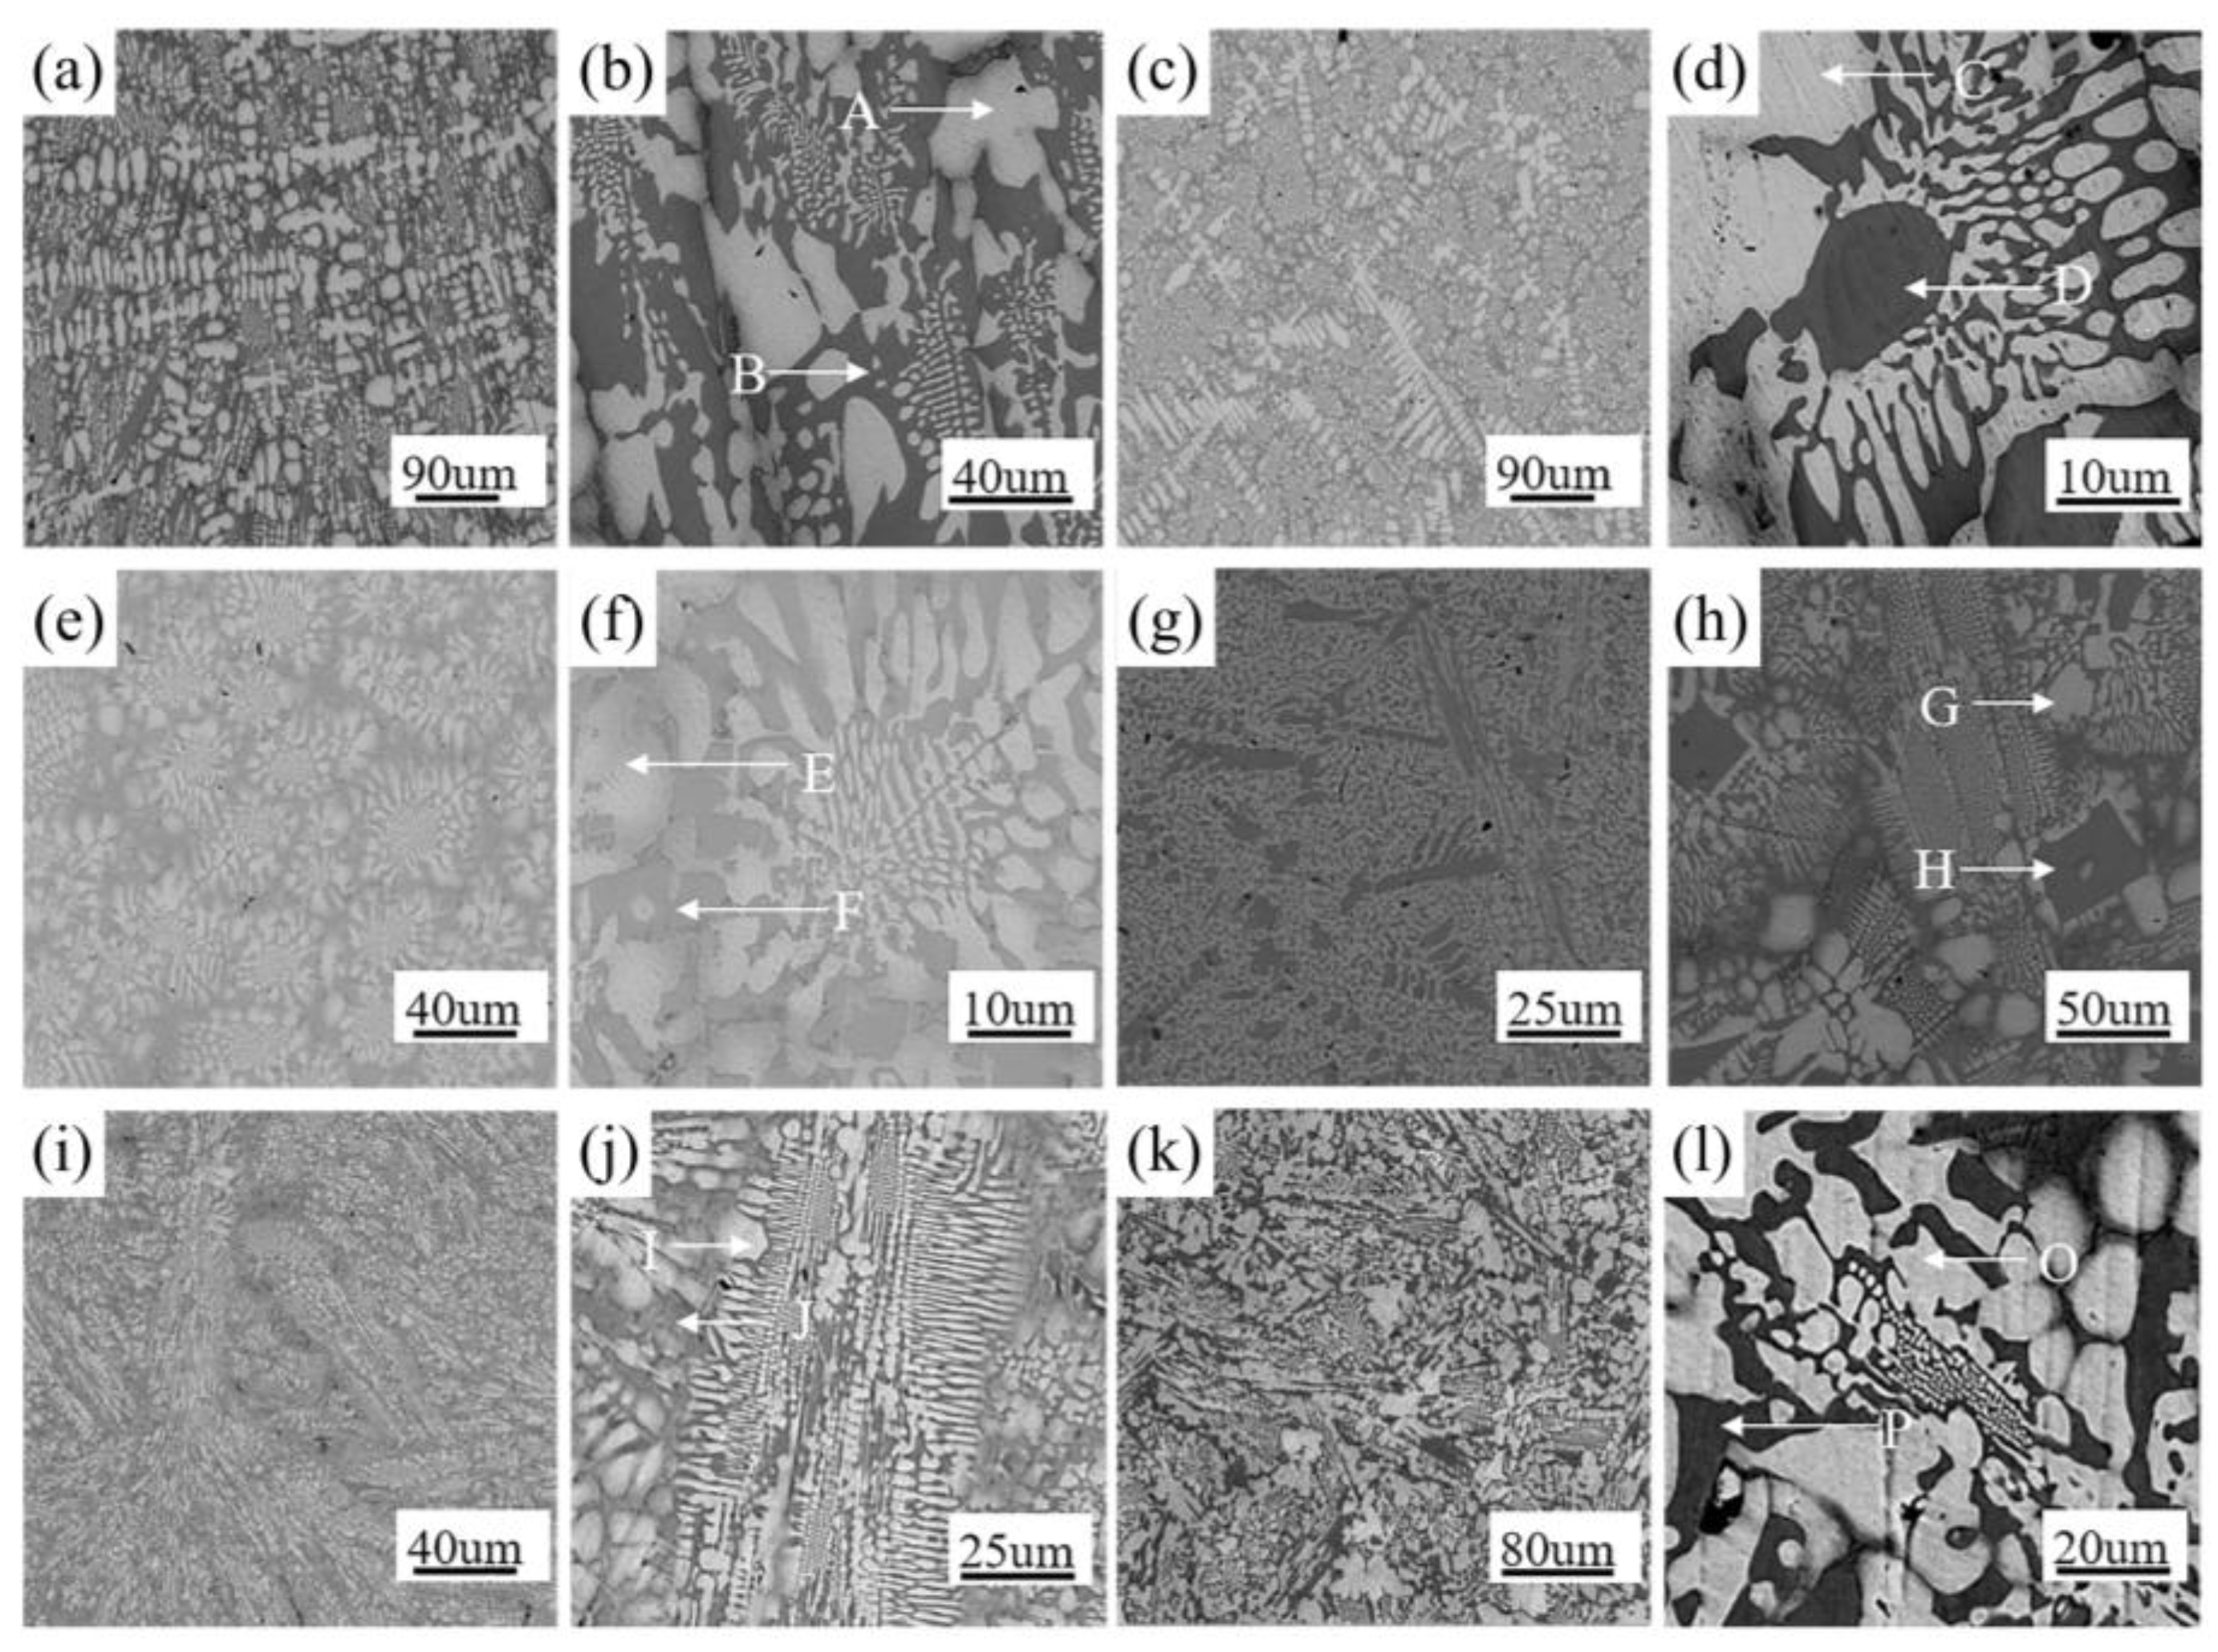
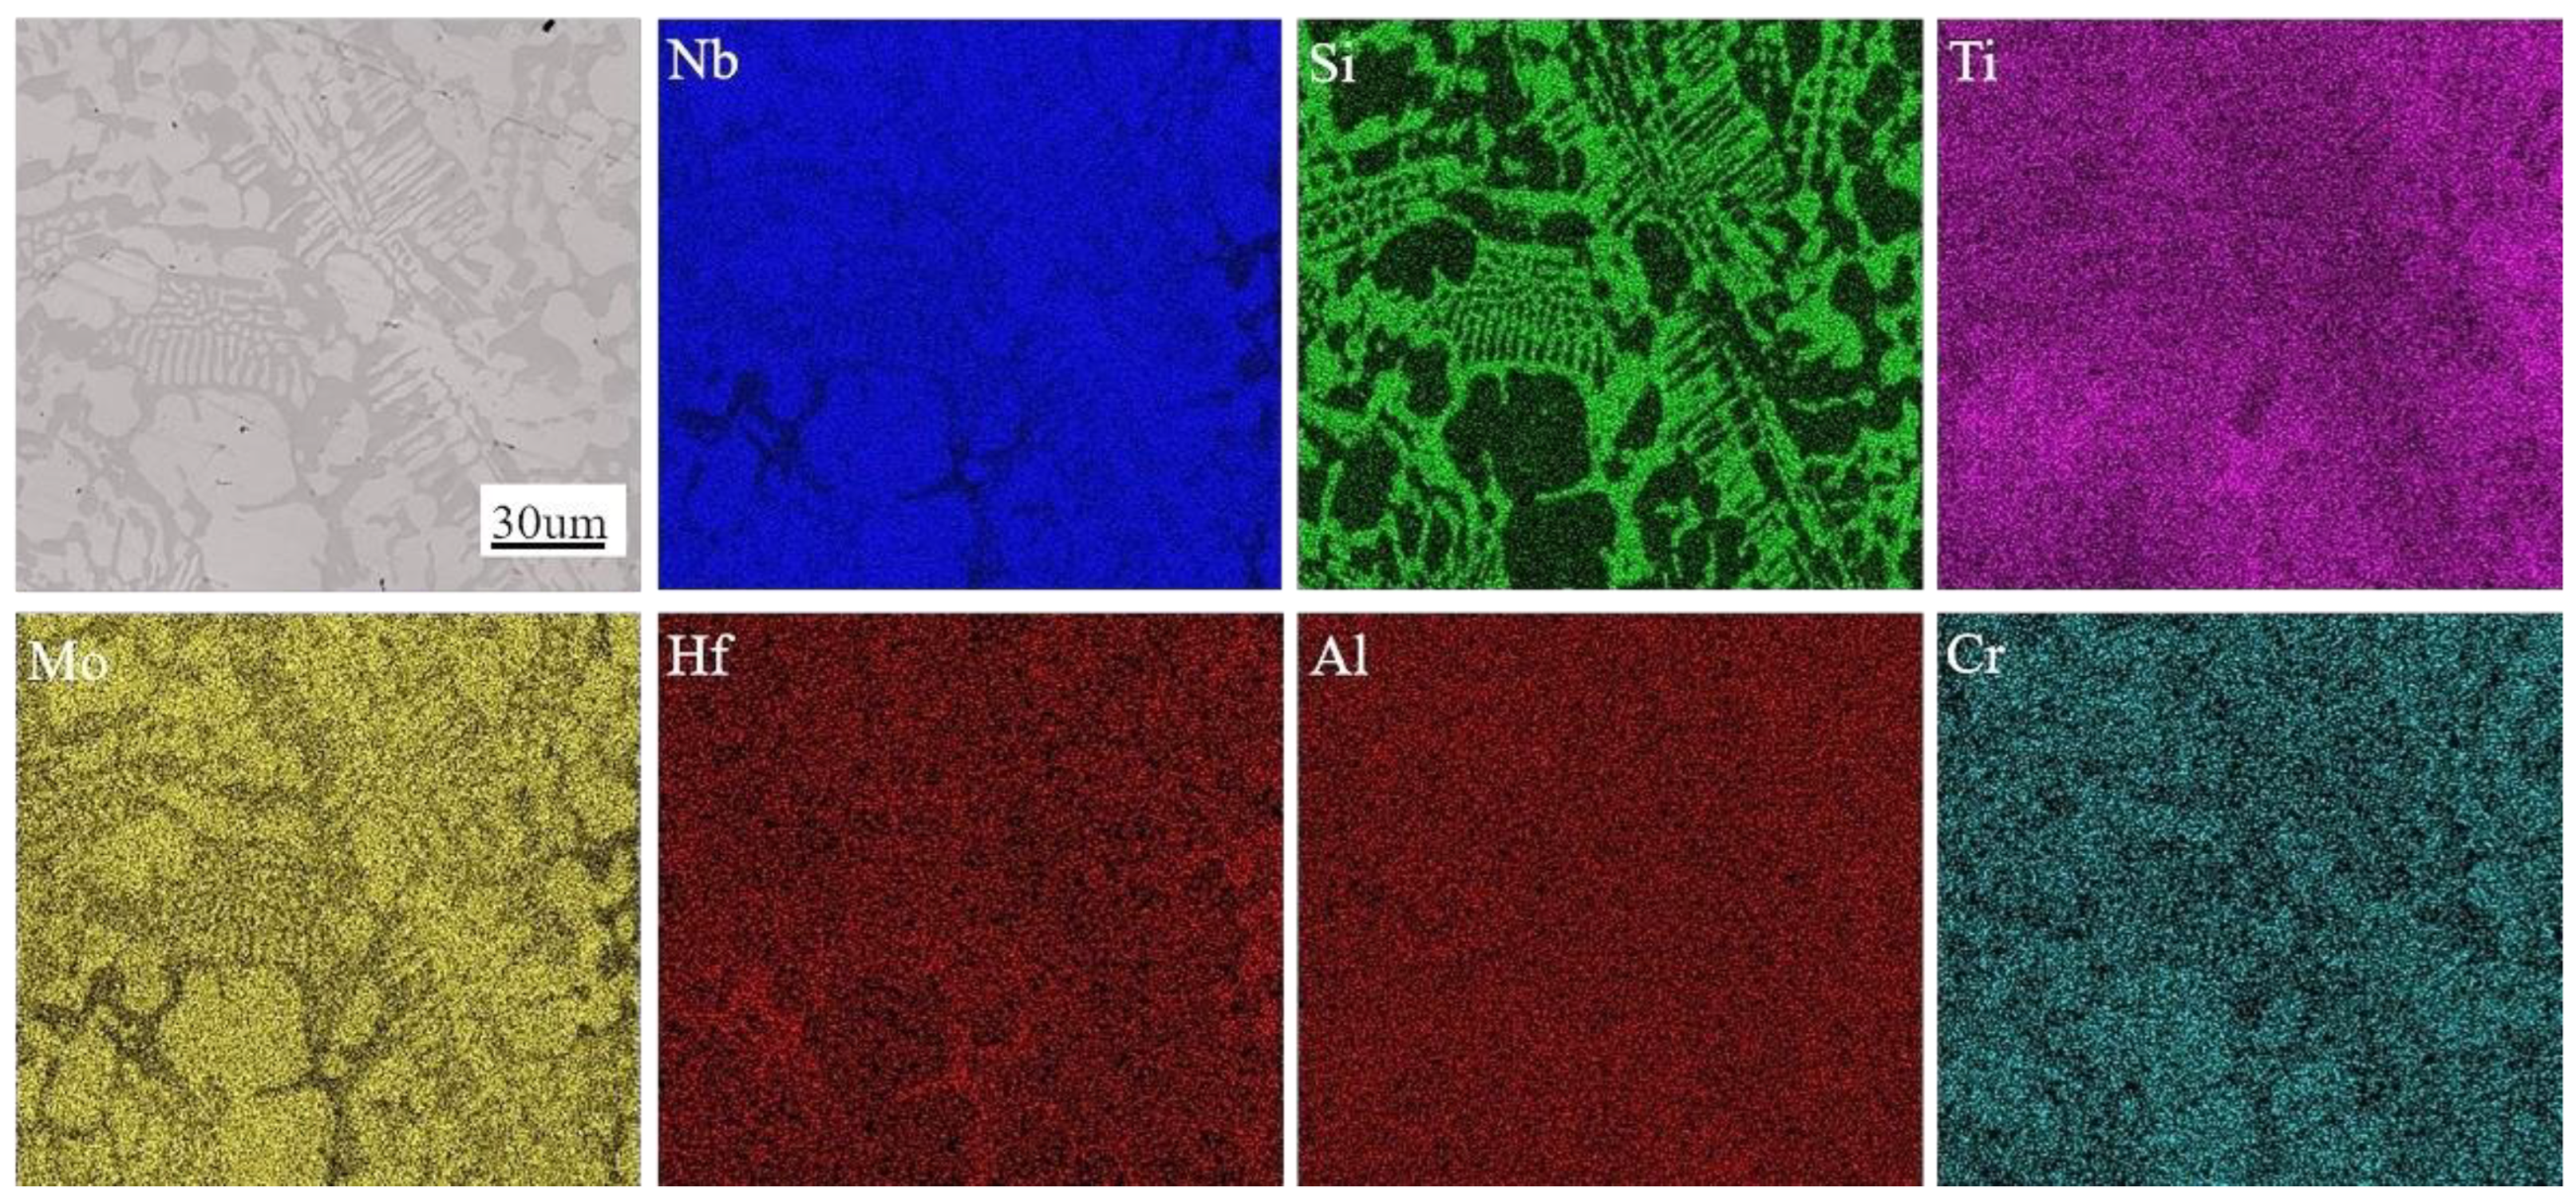
3.1. Microstructural Evolution Induced by Different Chemical Compositions in Nb-Si-Ti-Mo-Hf-Al-Cr Alloys

The XRD pattern shows that there are two main phases in terms of Nbss and Nb5Si3 phases in the alloys numbered A1 to A6, as well as the three isomers (α, β, γ) of Nb5Si3 that appeared [25], as demonstrated in Figure 1. These are the α-phase (low-T tetragonal Cr3B3 type), β-phase (high-T tetragonal W5Si3 type), and γ-phase (hexagonal Mn5Si3 type, stabilized by impurities). The samples were not annealed, but the cooling rates after arc melting were controlled (~100 k/s), ensuring that the β-Nb5Si3 phase could be preserved. The oxidation resistance of Nb5Si3 varies with different structures; the high-temperature stability of the β-Nb5Si3 phase is stronger, which is due to its higher structural stability and generally higher Si content. High Si content is conducive to promoting the formation of a protective SiO2 layer, thereby slowing oxygen diffusion and matrix oxidation. The second phase is γ-Nb5Si3, which can generate a denser oxide film at 1373 K; the main components are SiO2 and TiO2, which can effectively inhibit oxygen diffusion and reduce internal oxidation. The α-phase oxide film is porous and is mainly composed of Nb oxides (such as Nb2O5); it offers poor protection and is prone to severe internal oxidation. When alloying elements such as Ti, Hf, and Mo are added to Nb-Si-based alloys, the kinetics can be accelerated by lowering eutectoid reaction temperatures. In this case, only the stable Nb5Si3 phase can still occur in these alloys, which proves that alloying elements can effectively promote the eutectoid reaction of Nb3Si→Nbss + Nb5Si3. This is a significant finding for eliminating metastable phases [26]. Additionally, by comparing the 6 groups of samples, it can be seen that more phase fractions of β-Nb5Si3 can form in alloys with the highest Mo content (A1 and A2 alloys), indicating that the Mo element is more conducive to the formation of the high-temperature precipitate β-Nb5Si3 than Ti and Hf elements in Nb-Si alloy [27]. Assuming that the Si content remains unchanged in the alloys, the increase of Ti element addition can reduce the phase fraction of β-Nb5Si3 but promote the content of α-Nb5Si3, implying that the Ti element can transform the high-temperature phase β-Nb5Si3 to the low-temperature phase α-Nb5Si3. Moreover, in a comparison of A4, A5, and A6 alloys, it can be seen that the increase in Hf content will promote the formation of γ-Nb5Si3 instead of other phases [28].
In order to further understand the microstructural evolution of the different alloys, SEM analysis was performed as shown in Figure 2, and the sizes of the phases and dendrites were measured and calculated using Image-Pro software. In addition, EDS tests were conducted to determine the composition of the precipitated phase in alloys. The results are shown in Table 2, where the data represent averages of 5 points per phase (±0.5 at.% error). It can be seen that the size of the Nbss phase in A1 alloy is relatively large; the mean primary dendrite length is 83.9 μm, and the mean of the secondary dendrite size is 23.5 μm. Meanwhile, the distribution of Nbss/Nb5Si3 eutectic in the alloys is relatively scattered [29] and has a fishbone shape, as shown in Figure 2a,b. The Nbss phase of the A2 alloy still has dendritic morphology and the dendrites are able to grow more fully, with 168.1 μm as the mean primary dendrite size and 32.4 μm as the mean secondary dendrite size, as shown in Figure 2c,d. In addition, part of the Nbss phase presents dispersed small particles (34.2 μm), forming a flower-like eutectic structure as shown in Figure 2d. However, the microstructure of the A3 alloy is different from the others (Figure 2e,f). Specifically, the dendrite phase of the Nbss disappears and transforms to a granular morphology phase with a size of about 21.6 μm in the A3 alloys; this is evenly distributed to form a flower-type eutectic structure with Nb5Si3. The interlamellar spacing of these eutectics ranges from 1.0 μm to 1.6 μm. The A4 samples are hypereutectic alloys, and the primary phases are mainly formed from bulk or strip Nb5Si3. Some eutectic structures present a network shape (as shown in Figure 2g,h), but others are chaotic eutectic structures. In contrast, the A5 samples are hypo eutectic alloys, and the Nbss has a granular morphology, while the lamellar eutectic composition is an extended structure distributed in the Nbss matrix [30], as shown in Figure 2i,j. With regard to the hypoeutectic alloy of A6 samples in Figure 2k,l, the white phases are the Nbss and the black are the Nb5Si3. It can be seen that the Nbss has a granular morphology, but most of the Nb5Si3 is in the form of long strips, and the eutectic material has a network structure.
The elemental surface distribution analysis of the A3 alloy was carried out by spectral analysis with an electron probe, as depicted in Figure 3. As shown in the first picture in Figure 3, the white color is Nb SS, and the dark gray color is Nb₅Si₃, and the grid form is in the eutectic phase. It is easy to see that the Mo, Al, and Cr elements are mainly dissolved in the Nbss, while the Ti and Hf elements are primarily dissolved in the Nb5Si3. The distribution of each alloying element is relatively uniform in each phase, but the Cr element is more prominent in the eutectic structure, and Mo has a distinct transition layer at the interface of Nbss/Nb5Si3. Although Ti and Nb are infinitely mutually soluble, Ti more easily reacts with Si to form a (Nb, Ti)5Si3 compound in the eutectic structure [31].
To study the specific distribution of alloying elements in the microstructure in detail, a surface scanning analysis of the A6 alloy was conducted, as shown in Figure 4. The alloy elements are uniformly distributed in the alloys, without significant segregation from the surface scan of the alloy. Mo and Cr elements are mainly dissolved in the Nbss. Ti, Hf, and Al elements are primarily distributed in the Nb5Si3. In this case, Al occupies the Si sites, forming Nb5(Si, Al)₃ solid solutions [31]. The solid solubility of Ti and Mo in Nbss is higher than that of Hf because the radius of Mo atoms is close to that of Nb atoms [32], which causes the lattice distortion of Nbss to be smaller. At the same time, Hf exhibits the opposite relationship, which causes the significant lattice distortion of Nbss.

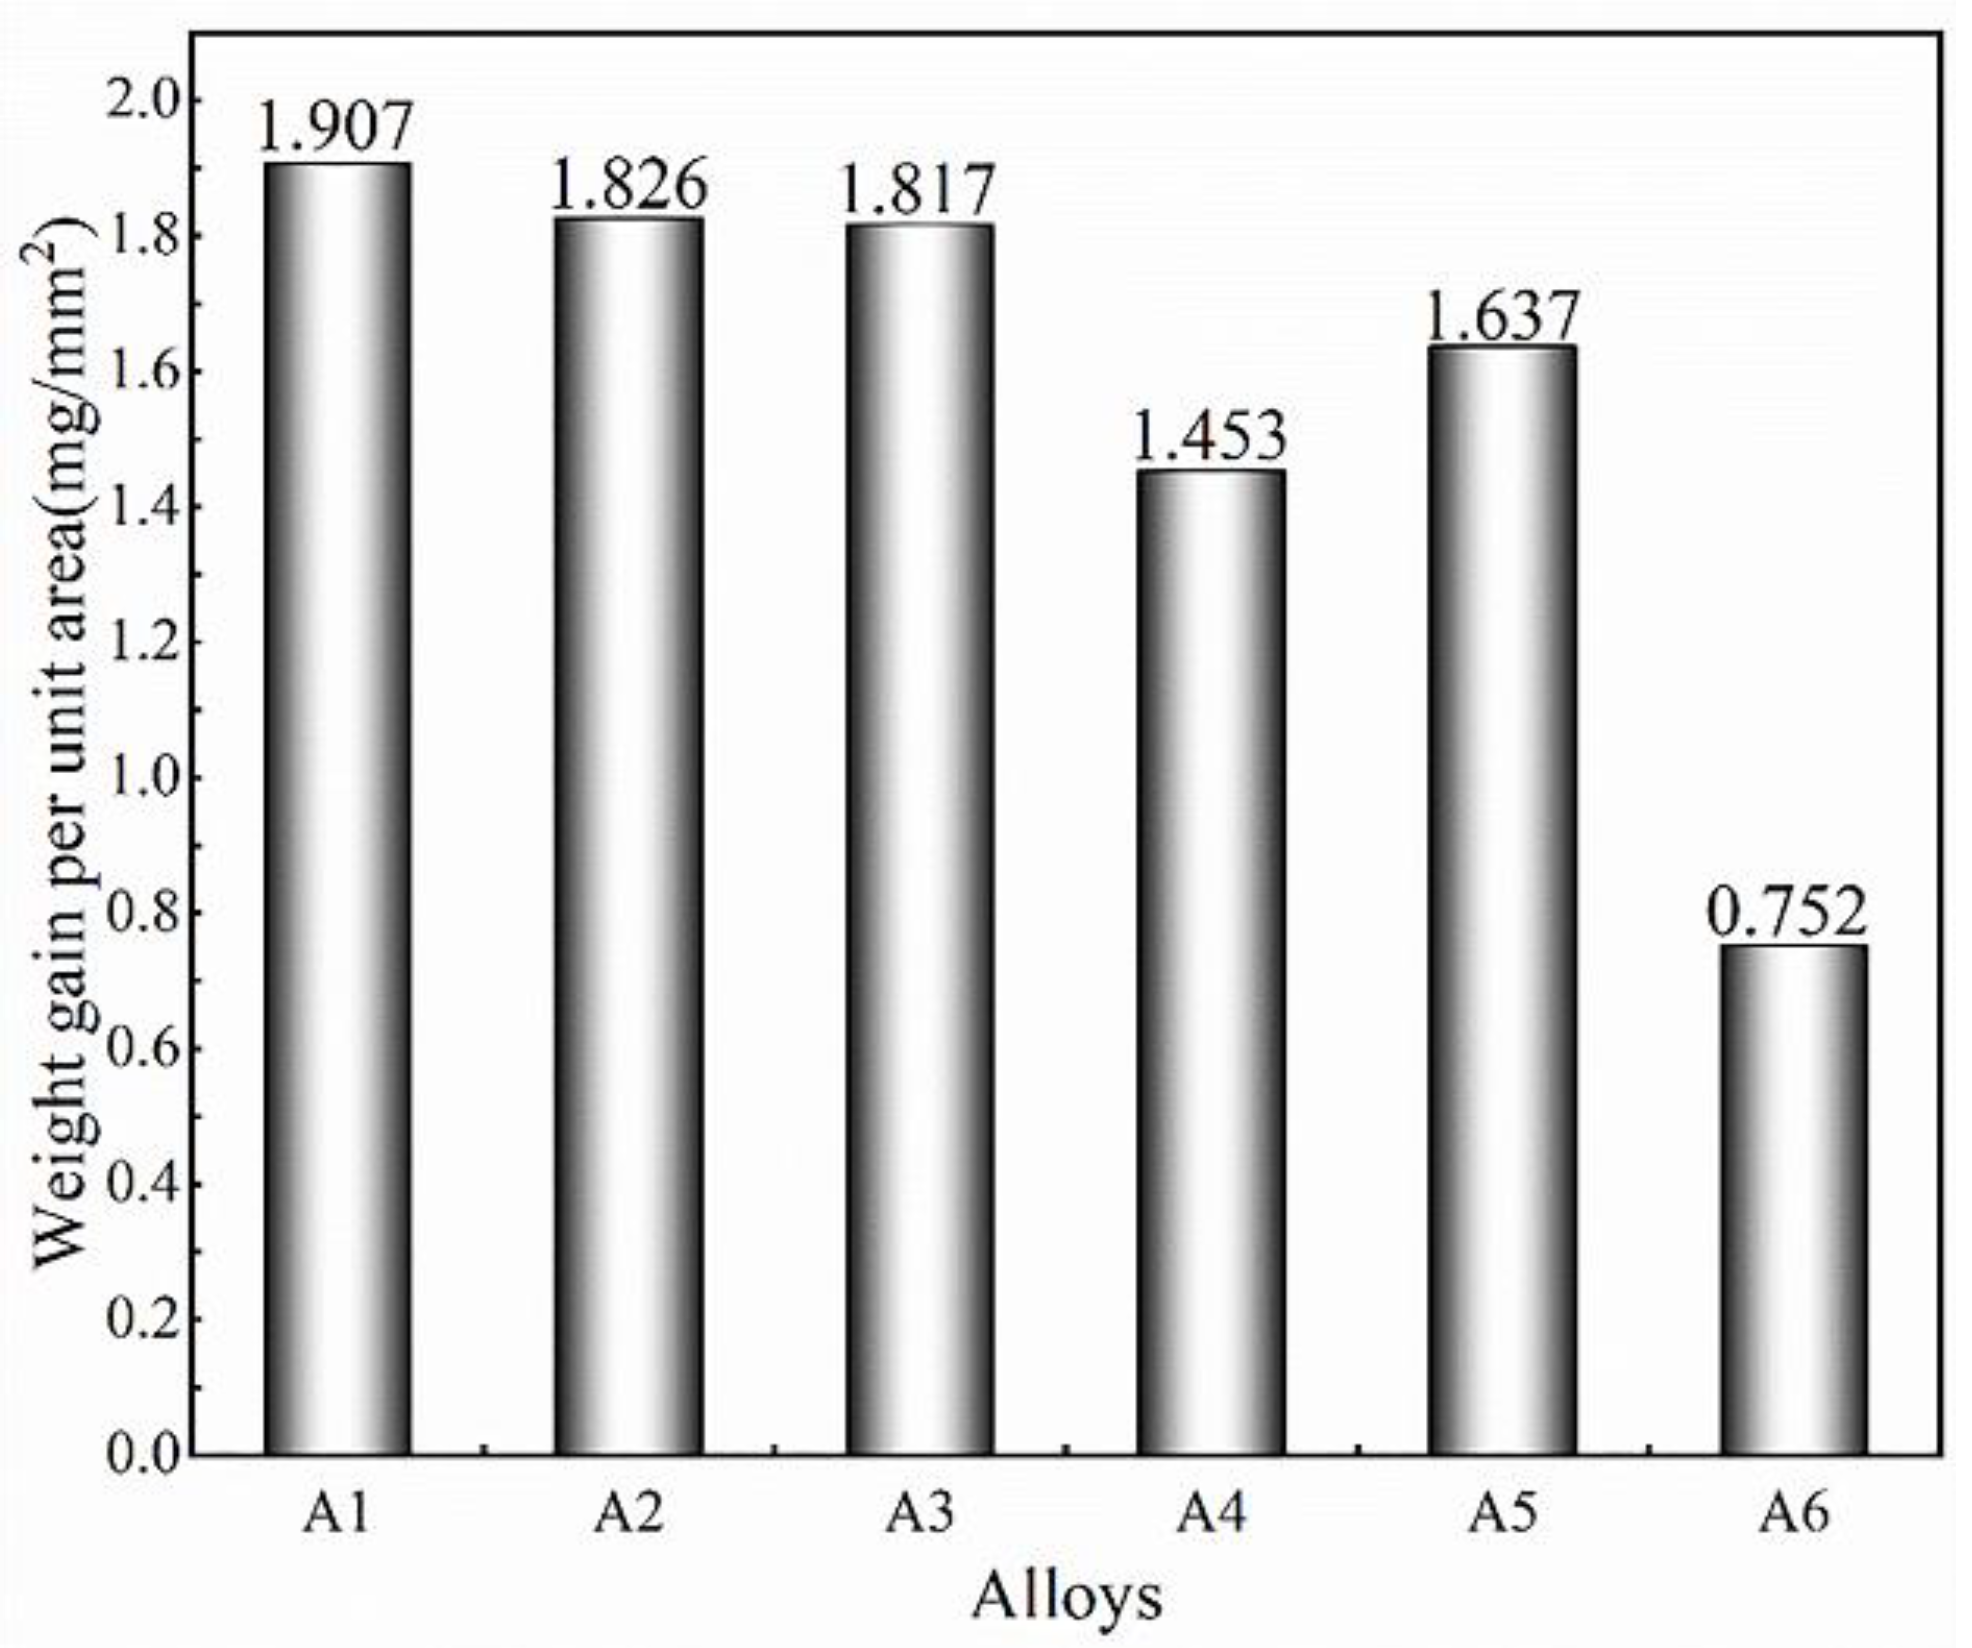
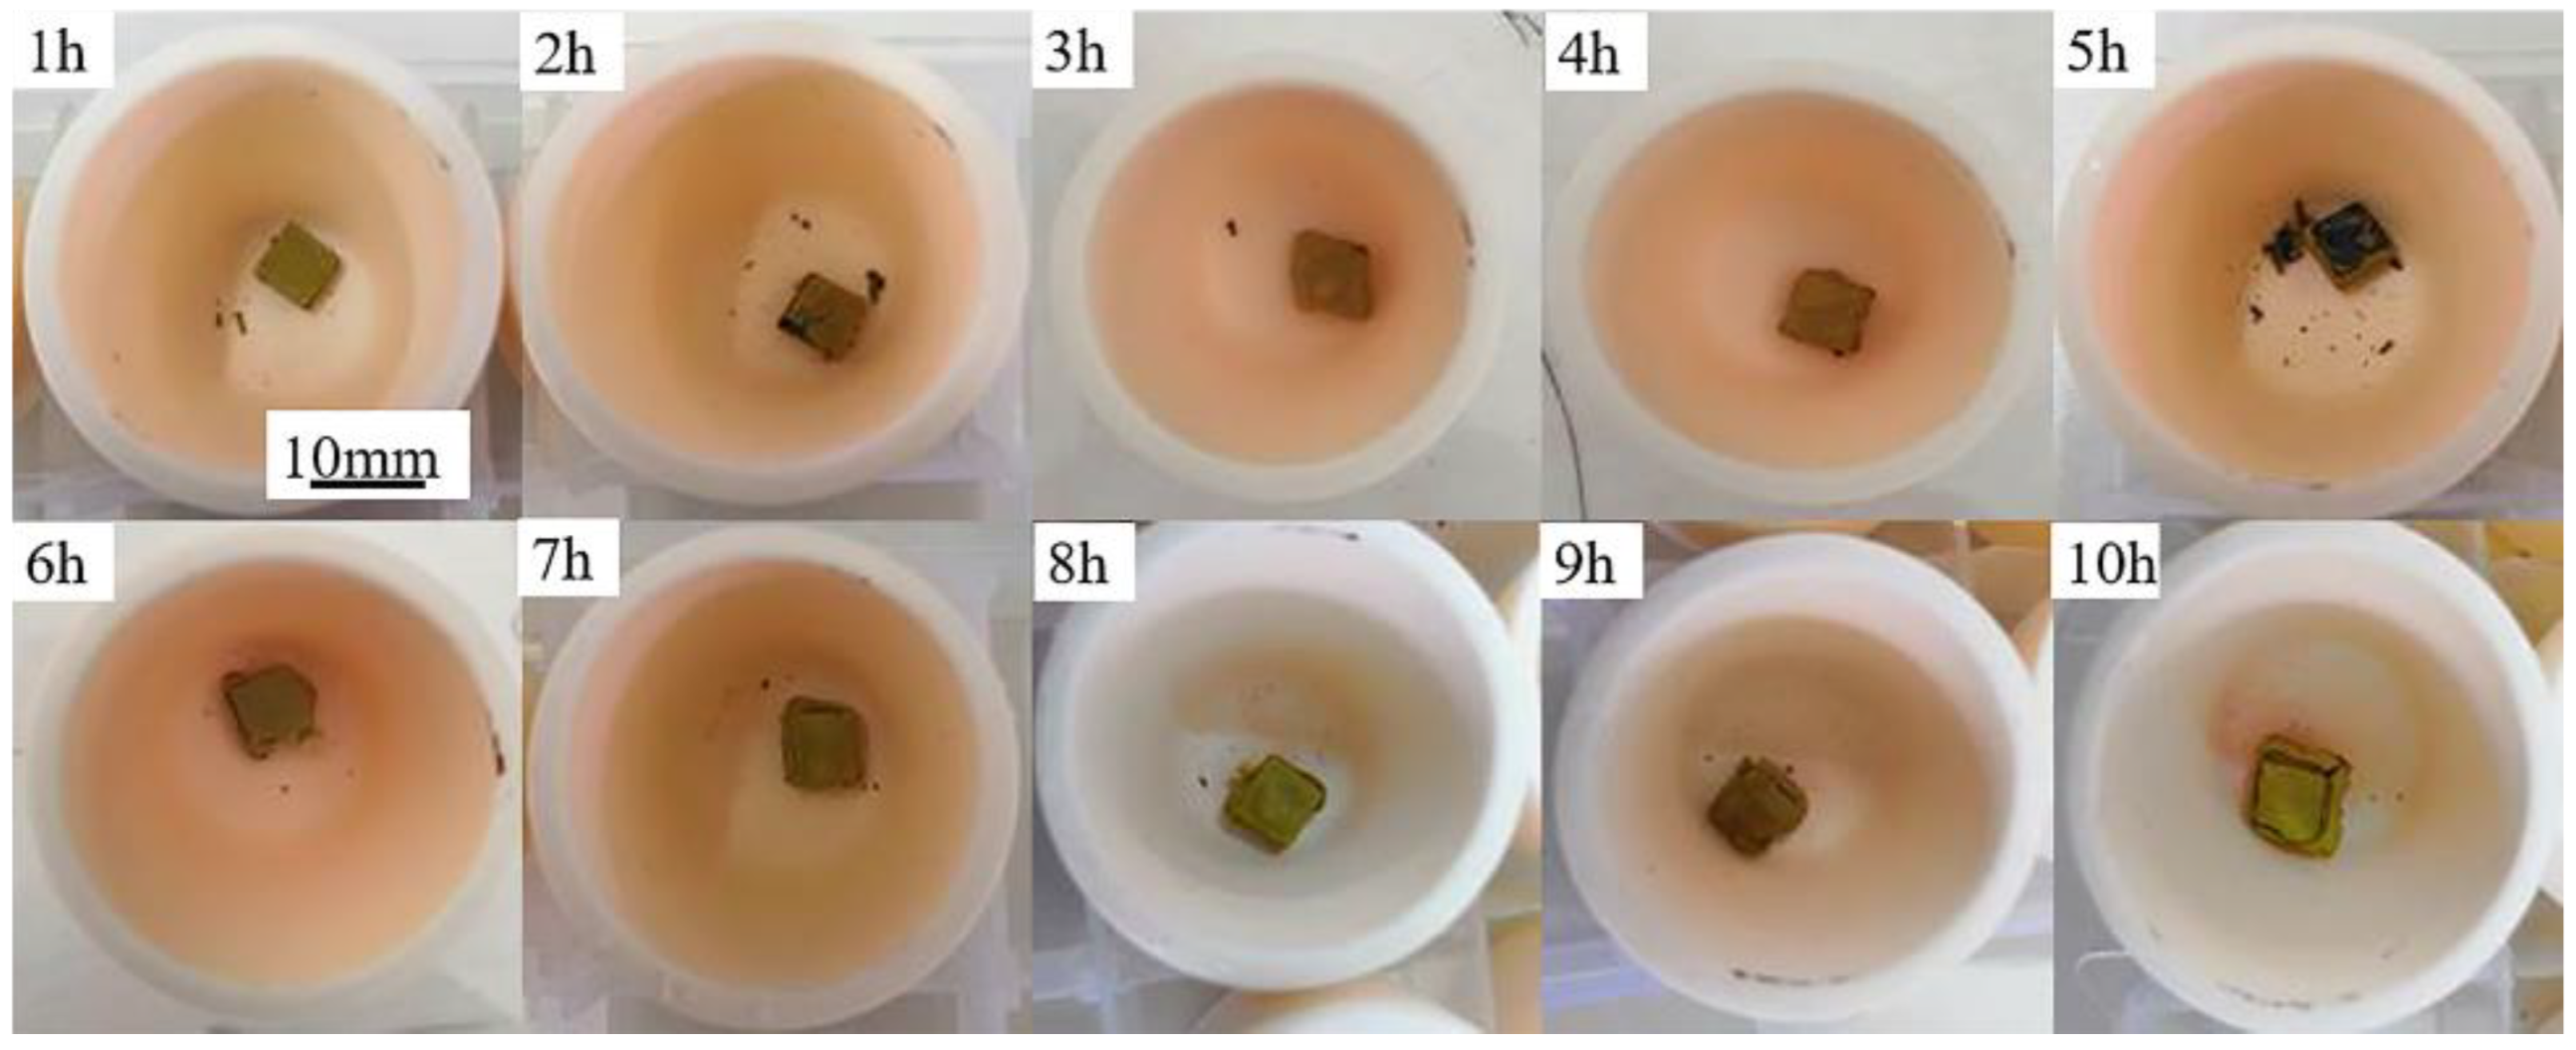
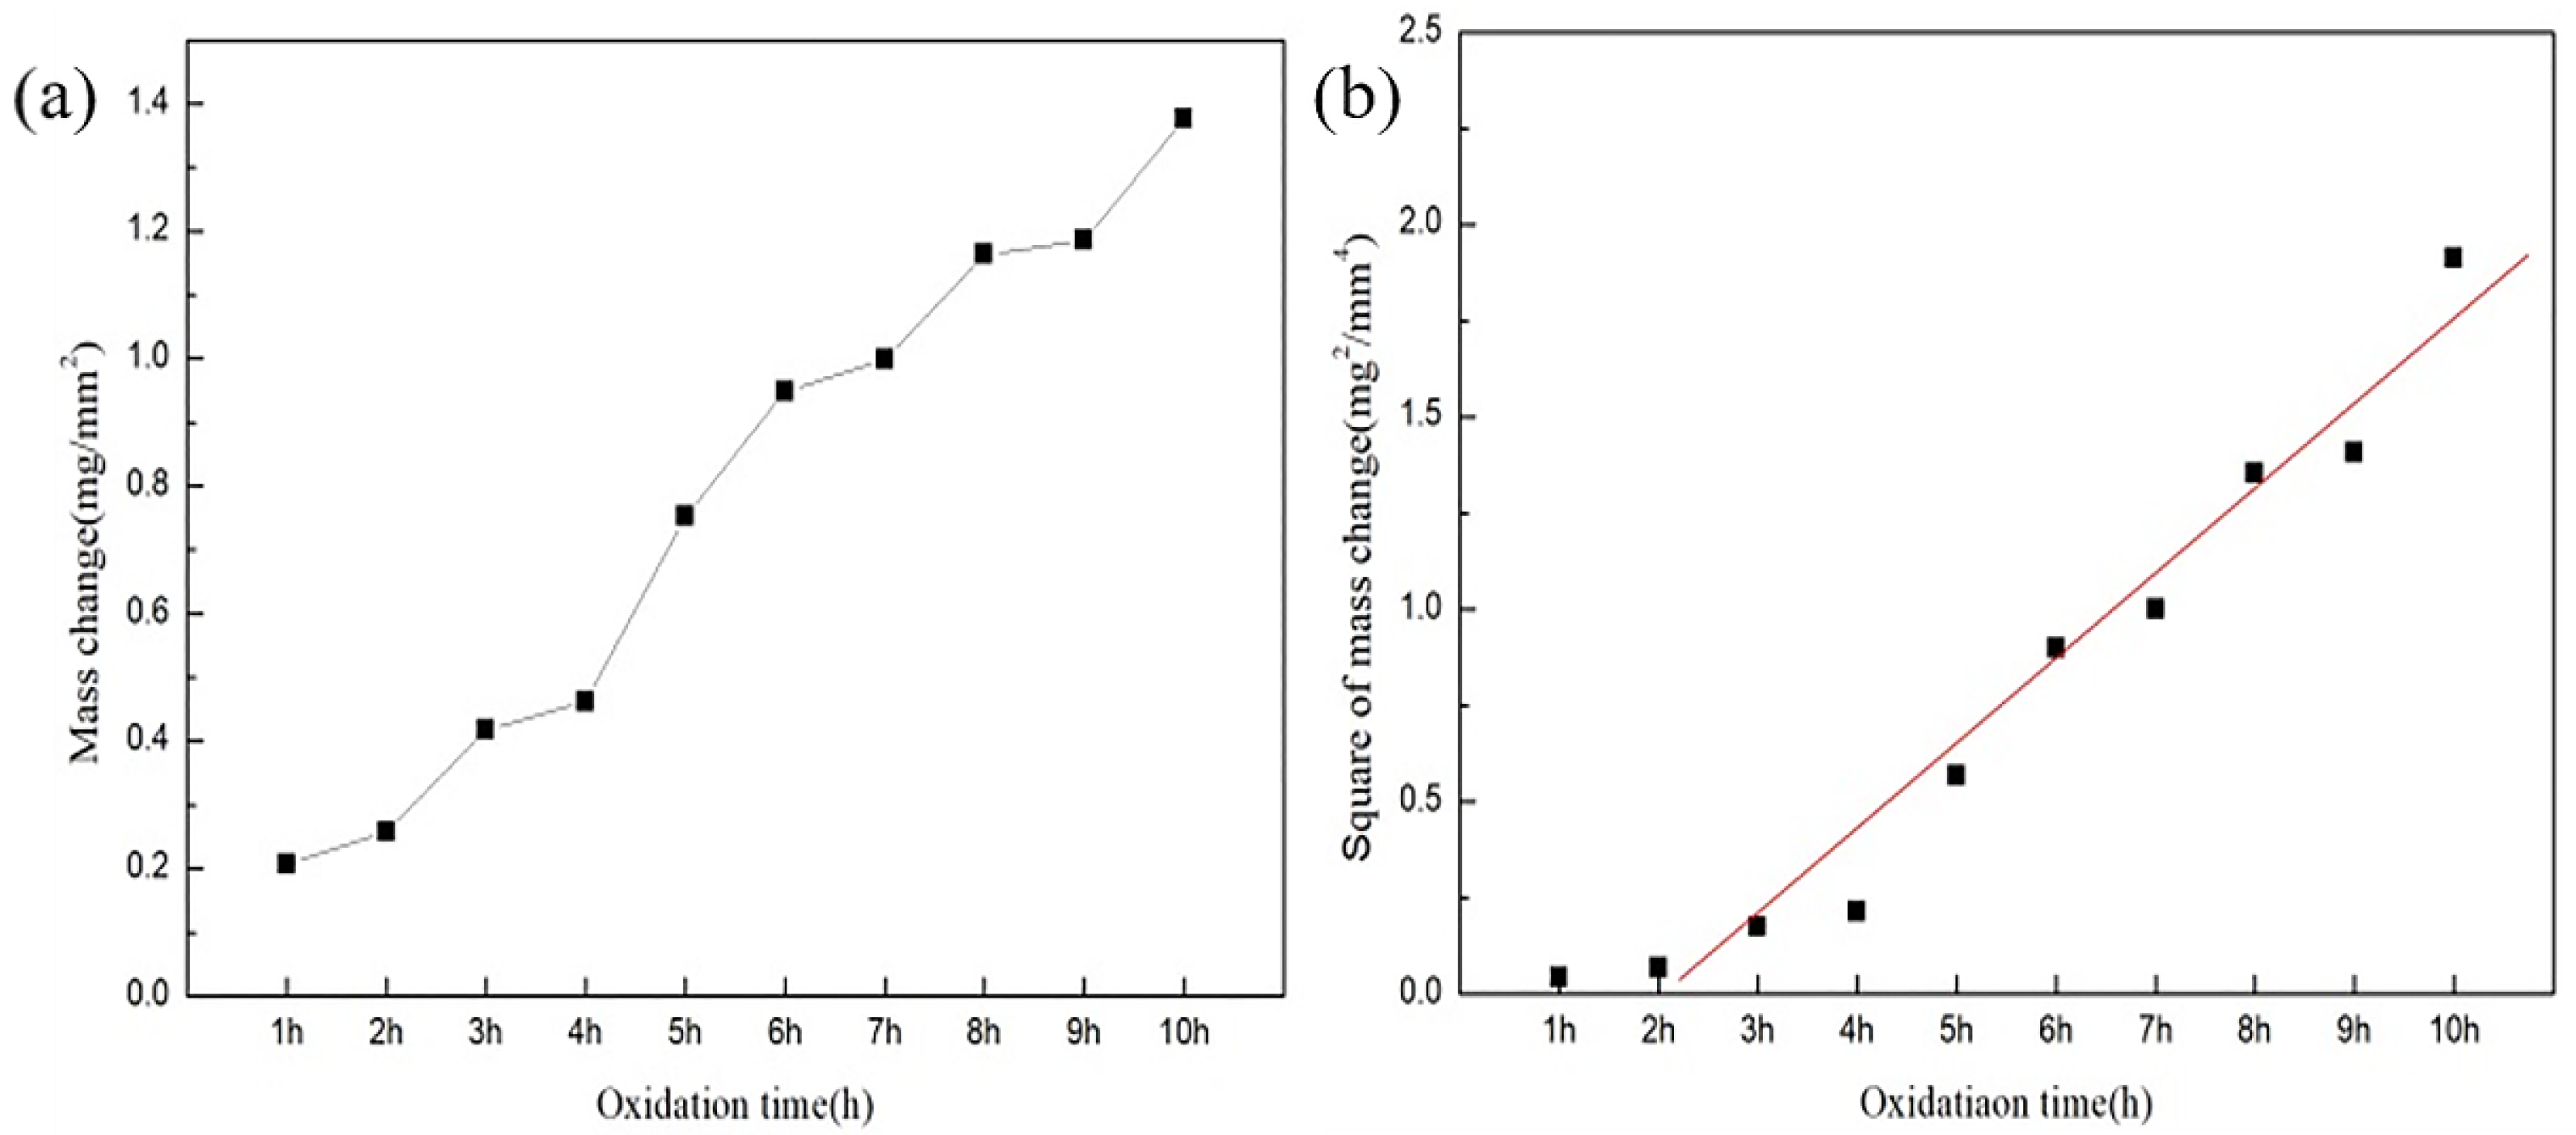
3.2. Oxidation Behaviour and Oxidation Kinetics of Alloys at 1523 K for Different Time Periods

The 6 × 6 × 3 mm3 samples were cut from the alloy ingots and subjected to a static oxidation test at 1523 K. The oxidation weight gain per unit area of the A1 to A6 alloys was obtained after 5 h of oxidation, as shown in Figure 5. It can be seen that the oxidation gain of the A6 alloy was the smallest, meaning that this alloy had the most significant high-temperature oxidation resistance.
In order to further explore the oxidation mechanism, the A6 alloy was oxidized for 1 to 10 h (time interval is 1 h), and the weight gain per unit area of the samples was calculated, as shown in Figure 6. The samples were oxidized simultaneously at 1523 K, with one specimen being quenched in water hourly. The furnace temperature fluctuation was controlled within ±5 °K. From 1 h to 10 h, the samples’ macroscopic morphology shows that the adhesion between the oxide layer and the substrate was good. There was no crack on the surface of the oxide layer after oxidation for 1 h. However, the adhesion became poorer with an increase in oxidation time. Tiny cracks appeared between the oxide layer and the substrate after oxidation for 5 h. The cracks became larger after oxidation for 10 h. Table 3 shows the average thickness and oxidation weight gain per unit area of A6 alloy at different oxidation times.
According to the Wagner theoretical model [33], the diffusion rate of the internal positive and negative ions through the oxide film determines the oxidation rate of the metal during high-temperature oxidation. The chemical position is the main driving force of ion diffusion. When the alloy undergoes high-temperature oxidation, its oxidation kinetic curve follows the laws of parabola. The model assumes that when t = 0 and Δm = 0, then:
Δ m = k p t
We differentiate Equation (1) as follows:
d Δ m d t = k p 2 Δ m
where kp is the alloy oxidation parabolic constant, Δm is the alloy oxidation weight gain, and t is time. Equation (2) is the oxidation weight gain model of the Wagner theoretical model. However, this model does not take that into account during the actual experiment. The high temperature of the oxidizing gas flow will cause uneven heat in the region, resulting in uneven temperatures in the oxidized alloy. The Wagner model assumes that the oxidation temperature at any time is constant, at a fixed value. Therefore, the oxidation kinetic curve, when calculated according to the model, shows a significant error compared to the actual situation. Based on this situation, this paper uses the method of Daniel Monceau et al. [34] to correct the oxidation calculation of the alloy when using the Wagner model. When t = ti and Δm = Δmi, Equations (1) and (2) become Equations (3) and (4), as follows:
Δ m Δ m i = k p t t i
d Δ m d t = k p 2 Δ m i
The oxidation weight gain of the A6 alloy is taken as the ordinate. The oxidation time is the abscissa used to draw the oxidation kinetic curve of the A6 alloy, as shown in Figure 7a. Furthermore, the relationship between the square of oxidation weight gain (Δm)2 and the oxidation time t is obtained [35]. As shown in Figure 7b, it can be seen that (Δm)2 is substantially linear, with an oxidation time of t. Thus, the oxidation curve of the A6 alloy follows a parabolic law [36].
It can be seen from Equation (4) that the kp value of the alloy can be determined by calculating the oxidation weight gain at different times. The optimized alloy’s 1523 K oxidation parabolic constant was calculated to be two-stage parabolic kinetics, such as the transient state (0–3 h, kₚ = 0.12 mg2/(mm4·h)) and the steady state (3–10 h, kₚ = 0.24 mg2/(mm4·h)). The value of kp of the A6 alloys aligned with the literature values of kₚ = 0.18–0.30 mg2/(mm4·h) for Nb-Si-B alloys [33], which confirmed that the A6 alloy had superior oxidation resistance.

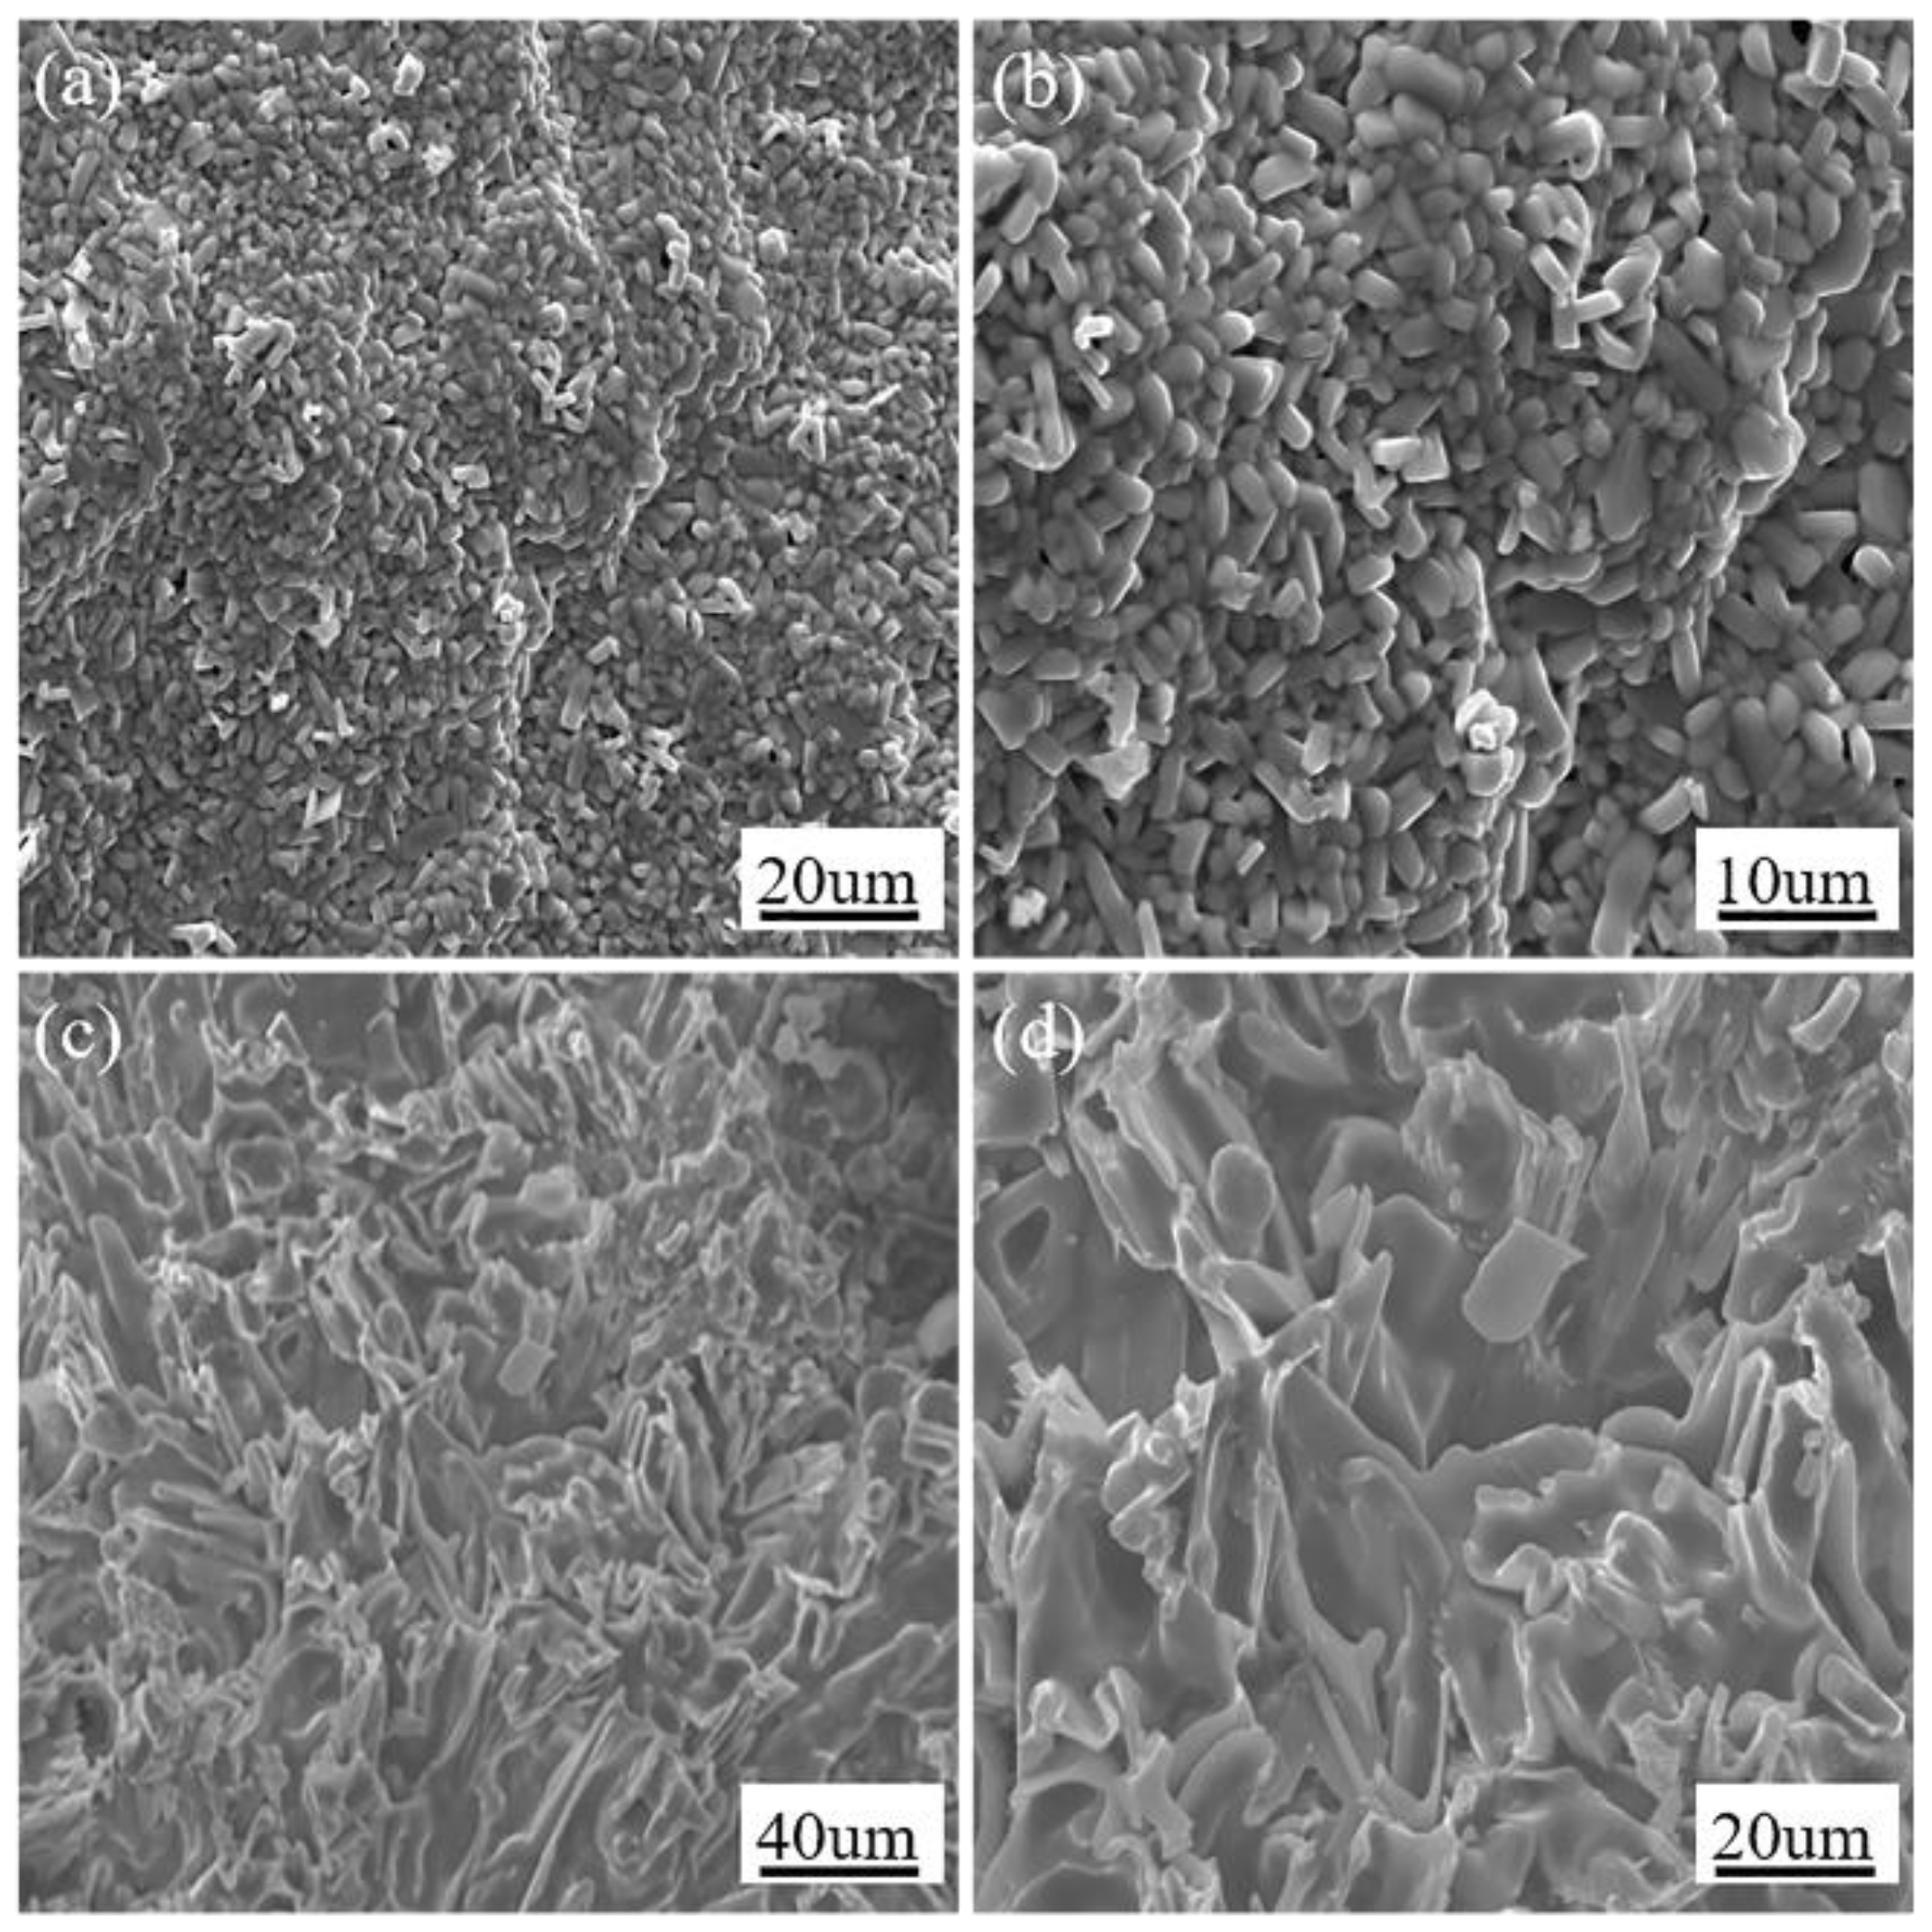
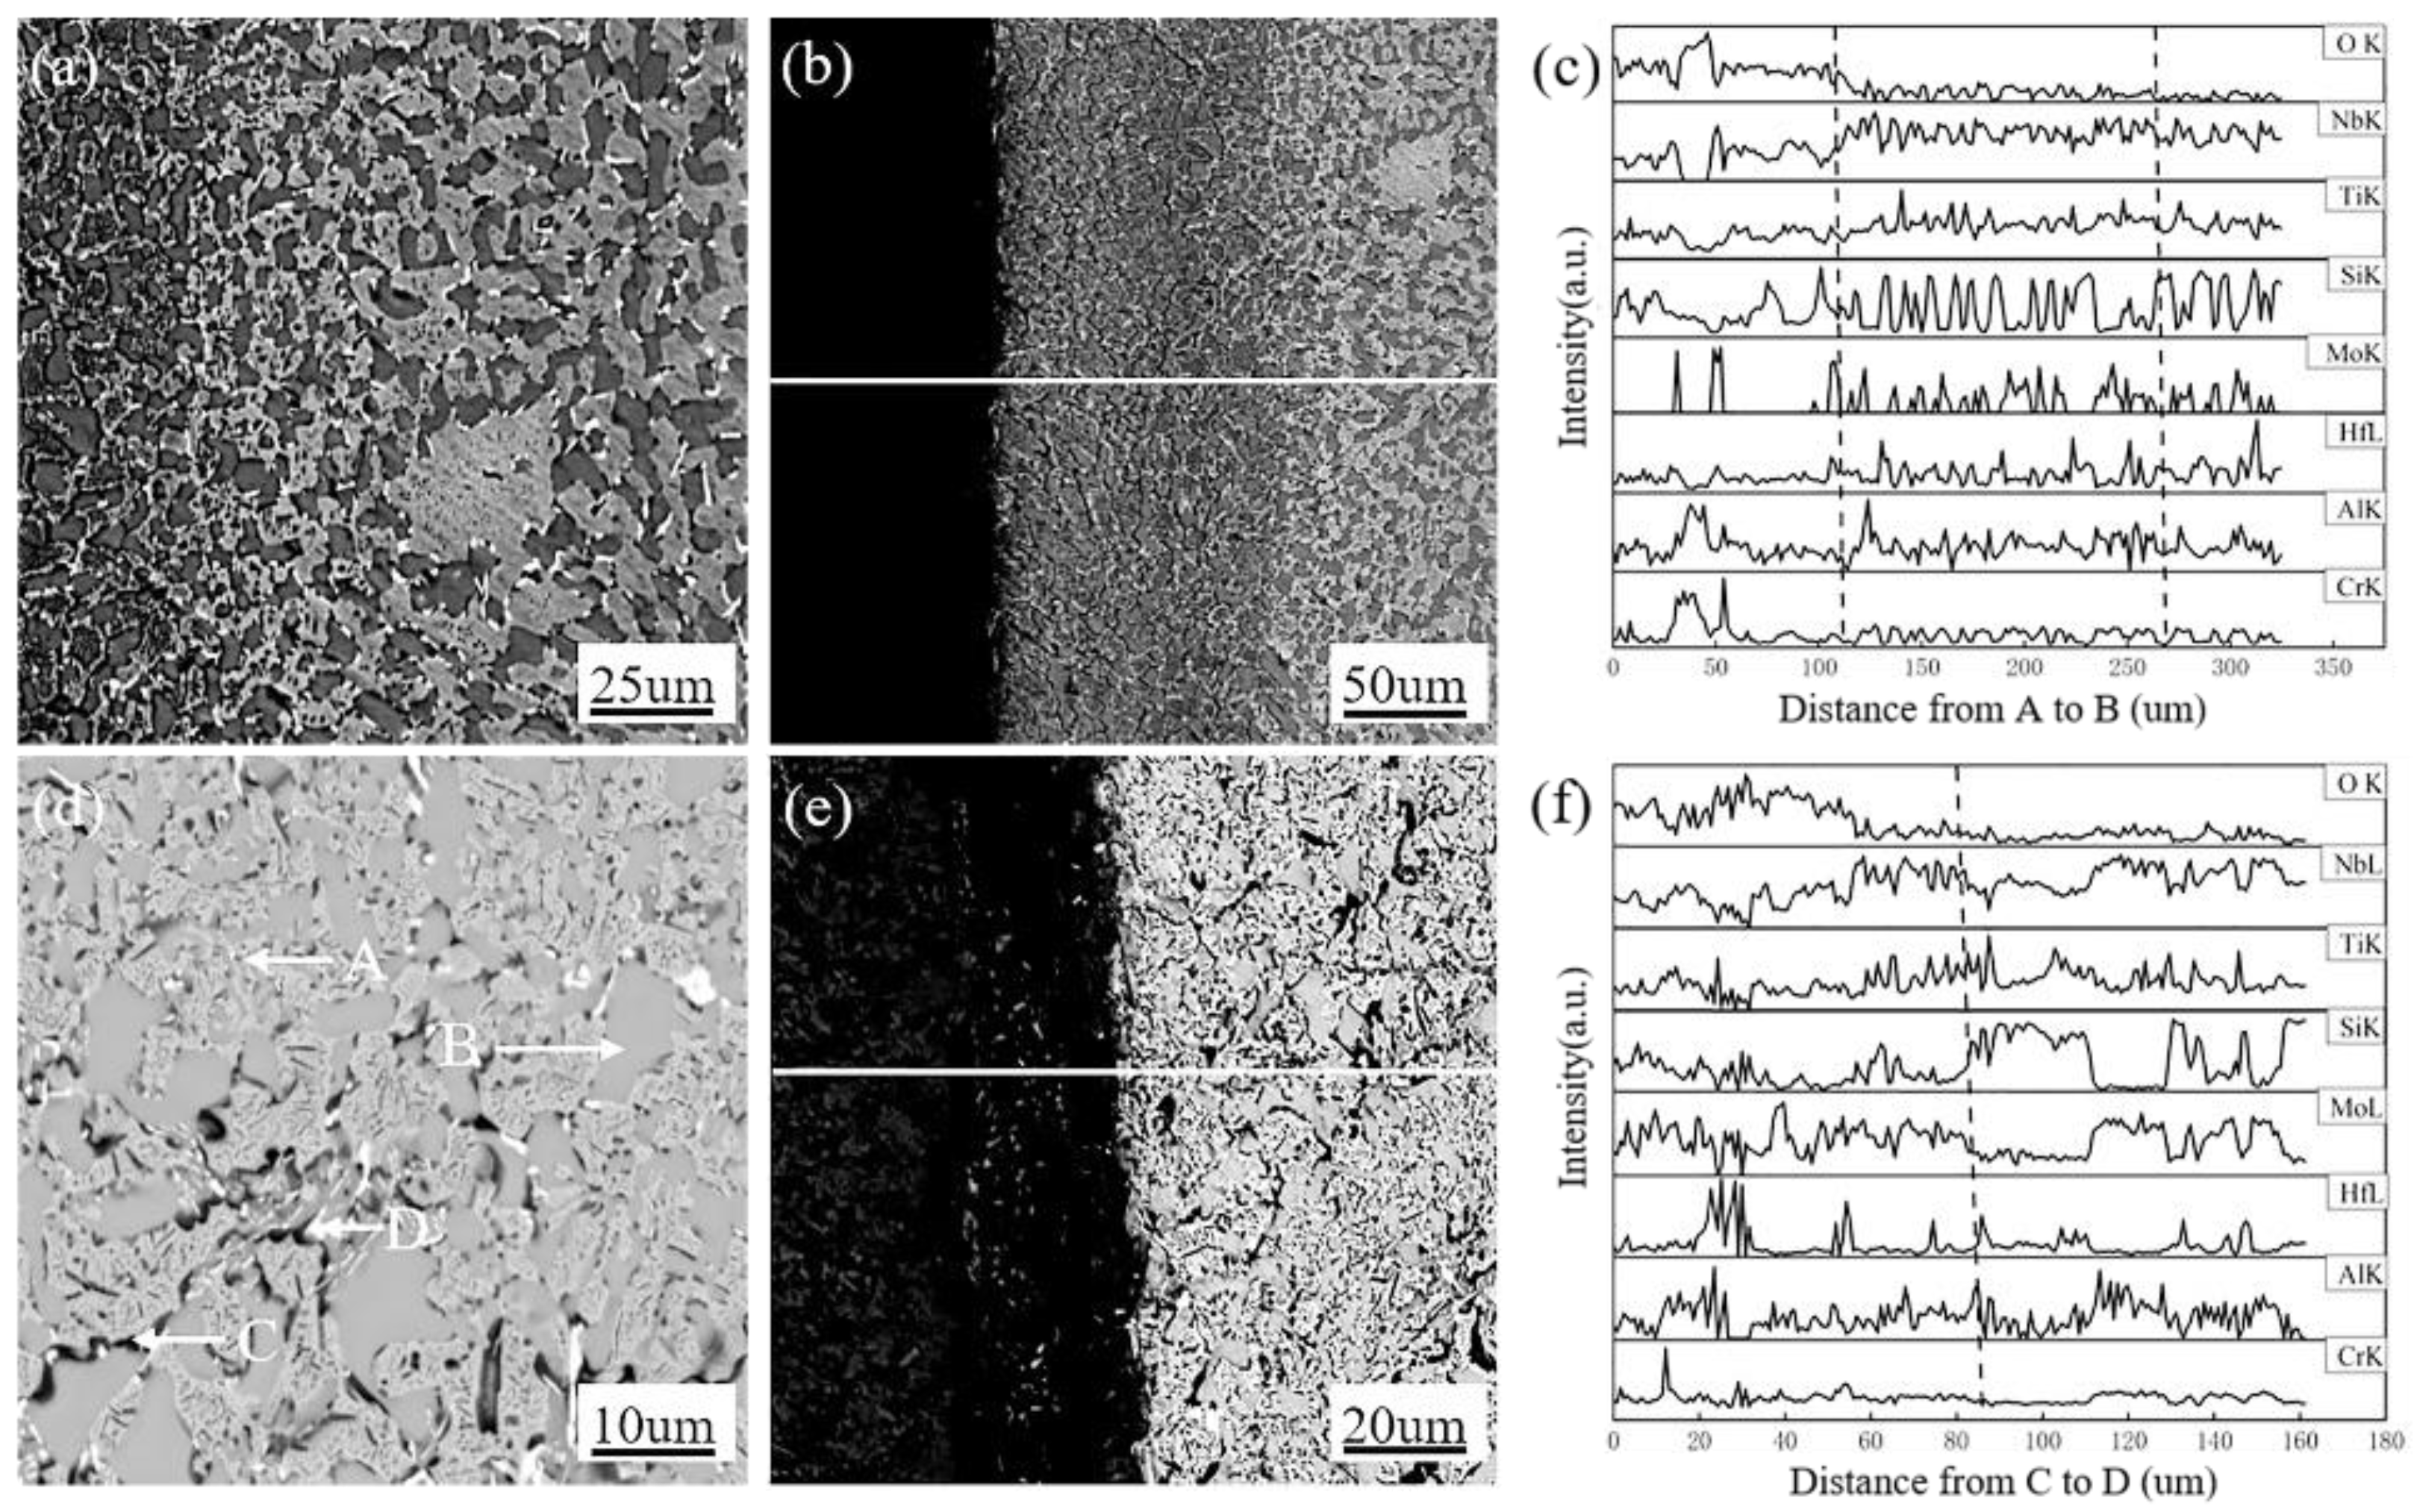
3.3. Morphologies and Microstructure of Oxide Scale and Interior Alloys

Figure 8 shows the morphology of the oxide film of the A5 alloy and A6 alloy after 5 h. It can be seen from Figure 8 that a few cracks grew by a rod-shaped oxide, with a growth direction perpendicular to the oxidized surface. The oxides were in close contact with each other in the A6 alloy. This structure prevented O from quickly entering the interior alloy during oxidation. Thus, the structure effectively prevented the alloy from oxidation, which is one of the reasons why the oxidation weight of A6 gain was most significant after oxidation for 5 h. The oxide film of A5 alloy grows in a sheet form, and the contact between the oxides is not tight. This sheet structure makes it easy for it to form microcracks. Then, O can diffuse into the interior alloy through these microcracks [37], producing severe oxidation.
After the alloy had oxidized, the oxide film that formed on the surface was peeled off and then ground into a fine powder. X-ray diffraction analysis was used to analyze the phase composition of the oxide film. The X-ray diffraction pattern of the A6 alloy oxidation from 5 h to 20 h is shown in Figure 9.
The oxidation products of the A6 alloy after oxidation were mainly TiNb2O7, Nb2O5, SiO2, TiO2, and HfO2. The phase corresponding to the most substantial peak in the XRD pattern was TiNb2O7. However, the volume fraction of Nb2O5 and TiO2 was not large, indicating that the Nb and Ti elements react with O simultaneously during oxidation. Because the activity of Ti is higher than the Nb, during the oxidation process, the growth rate of TiO2 exceeds the growth rate of Nb2O5, and the faster-growing TiO2 will gradually wrap around the slower-growing Nb2O5. The XRD results in Figure 9 show that the peak of TiO2 in the oxide film was 458.5eV (Ti 2p3/2), confirming the formation of the TiO2 passivation layer, which is superior to Nb2O5 formation and improves oxidation resistance by wrapping around the matrix phase. Then, a solid phase reaction occurs [38]: Nb2O5 + TiO2→TiNb2O7. With the prolongation of oxidation time, the content of TiNb2O7 increases, and the content of Nb2O5 and TiO2 also increases. This also proves that Nb and Ti simultaneously react with O at the beginning of oxidation. The content of HfO2 also increases with increasing oxidation time, because the Hf is sufficiently diffused to combine with O as the oxidation time lengthens [39].
When the A6 alloy is oxidized, its structure (from the outside to the inside) is the oxidized outer layer (oxide film) to the transition layer of the interior metal, through which the phase composition of the oxidized outer layer is analyzed by X-ray diffraction. The transition layer and the interior metal microstructure are shown in Figure 10. It can be seen from Figure 10 that as the oxidation time increases, the thickness of the transition layer gradually decreases until it disappears after oxidation for 20 h. This is because when the oxidation time is short, the alloying elements cannot diffuse to the outside [40]. Most of the O is consumed when O passes through the oxide film. The remaining small part of O is consumed by the active element Hf in the alloy, so the interior alloy remains unoxidized, as shown in Figure 10b. When the oxidation time is extended, the alloying elements of the internal alloy have this longer diffusion time to combine with an increased amount of O entering the internal alloy, which causes severe oxidation.
Through the internal alloy figures given for the alloy after different oxidation times, it is known from [41] that a small amount of white granular oxide begins to appear in Nbss. Most granular oxide appears at the interface of Nbss/Nb5Si3 in the initial oxidation stage. As the oxidation time is prolonged, the content of white oxide increases, showing two shapes, namely, blocks and strips. The bulk oxide is in Nbss, and the long strip oxide appears at the interface of the Nbss/Nb5Si3 phase, while the black needle-like oxide appears in Nbss, which is messy in its distribution.
To determine the composition of each phase, EDS analysis was performed on the internal alloy after oxidation for 20 h, as shown in Figure 10d and Table 4. The gray smooth tissue (Point A) in the tissue is the Nb5Si3 phase. It can be seen that the Nb5Si3 phase has a high antioxidant capacity, while the Nbss (Point B) is easily attacked by O. The alloying elements that are dissolved in the Nbss will react with O to form a variety of oxides. The content of Ti in the black acicular oxide (Point C) is significantly higher than that in Nbss, indicating that it is TiO2. The white bulk oxide (Point D) is HfO2.
To study the oxidation mechanism of A6 alloy in detail, it is necessary to know the type and electronegativity of the oxides of each alloying element. The physical parameters of each alloying element are shown in Table 5. It can be seen from Table 4 that the electronegativity of elements in the A6 alloy (Nb-16Si-20Ti-5Mo-3Hf-2Al-2Cr) has the following order from small to large: Hf, Ti, Nb, Mo, Al, Cr, and Si [42]. It is known from its electronegativity that Hf is the most active and has a significant affinity with O. Therefore, when O enters the internal alloy, Hf first combines with O to form HfO2. Second, Ti reacts with O. At this point, the A6 alloy experiences selective oxidation. By comparing the content of Hf in Nbss before and after oxidation, it can be seen that the content of Hf after oxidation is significantly reduced because Hf combines with O to form granular HfO2 under low O partial pressure. The formation of bulk HfO2 mainly occurs because metal bonds bond the metal atoms in Nbss, meaning that the diffusion of Hf in Nbss is relatively easy [41]. When O is present at the interface of Nbss/Nb5Si3, O preferentially reacts with Hf, resulting in a concentration gradient of Hf in the local microstructure. Then, the Hf in Nbss diffuses from the interior of Nbss along the concentration gradient to the interface, forming oxides of Hf. The Hf in the Nb5Si3 is more robust, due to the formation of the Si-Hf-Si covalent bond [43], meaning that the Hf in Nb5Si3 is difficult to diffuse to the Nbss/Nb5Si3 interface. The electronegativity of the Ti element is lower than Hf, meaning that TiO2 quickly appears at the interface of the two phases.
Figure 10c,f shows the linear scanning of the A6 alloy at 1523 K for 7 h and 20 h along the vertical oxide film/internal interface, indicating the gradients of O, Ti, and Hf. Working from the dotted line region (transition layer) in Figure 10b, the content of O in the oxide film is the highest, and the O content in the transition layer is low. However, the O content in the internal alloy is the lowest, and it is maintained at the same level. This shows that when O passes through the transition layer, the O is mainly consumed, and the amount of O entering the matrix is extremely small. Ti, Hf, and Al have multiple peaks in the transition layer, and the peak value corresponds to that of O. This indicates that Ti, Hf, and Al preferentially react with O to form oxides in the transition layer, consuming the O molecules from the outside. Then, various oxides also prevent O from continuing to penetrate the internal alloy, which is why the O content of the internal alloy is very low [44]. The Hf in the internal alloy also shows a peak, indicating that a small amount of O entering the internal alloy is first consumed by Hf, resulting in no severe oxidation phenomenon.
After oxidation for 20 h, the transition layer has disappeared. High Ti, Hf, Si, and Al peaks are seen near the interface between the oxide film and the internal alloy. This indicates that Ti, Hf, Si, and Al migrate to the vicinity of the interface and undergo oxidation. The content of Mo is still significantly lower than that of the oxide film, but the content of Mo in the internal alloy is increased. This is similar to the change in Nb, which occurs because Mo and Nb are infinitely miscible with each other [45]. When O enters the internal alloy, Mo does not preferentially react with O. It is protected by active elements when the alloy is oxidized. Conversely, Mo oxide (MoO3) [46,47] evaporates easily at high temperatures, which is also one of the reasons why the content of Mo in the internal alloy is higher than that in the transition layer.

4. Conclusions

(1)
We mainly identified Nbss and Nb5Si3 and a small amount of metastable phase (Nb3Si) in the Nb-Si-Ti-Mo-Hf-Al-Cr alloy. These alloying elements (Ti, Hf, Mo) can eliminate the metastable phase. The Mo element has the function of stabilizing β-Nb5Si3, while the presence of Hf can refine the primary Nbss in the alloy, and the Ti element can promote the formation of α-Nb5Si3.
(2)
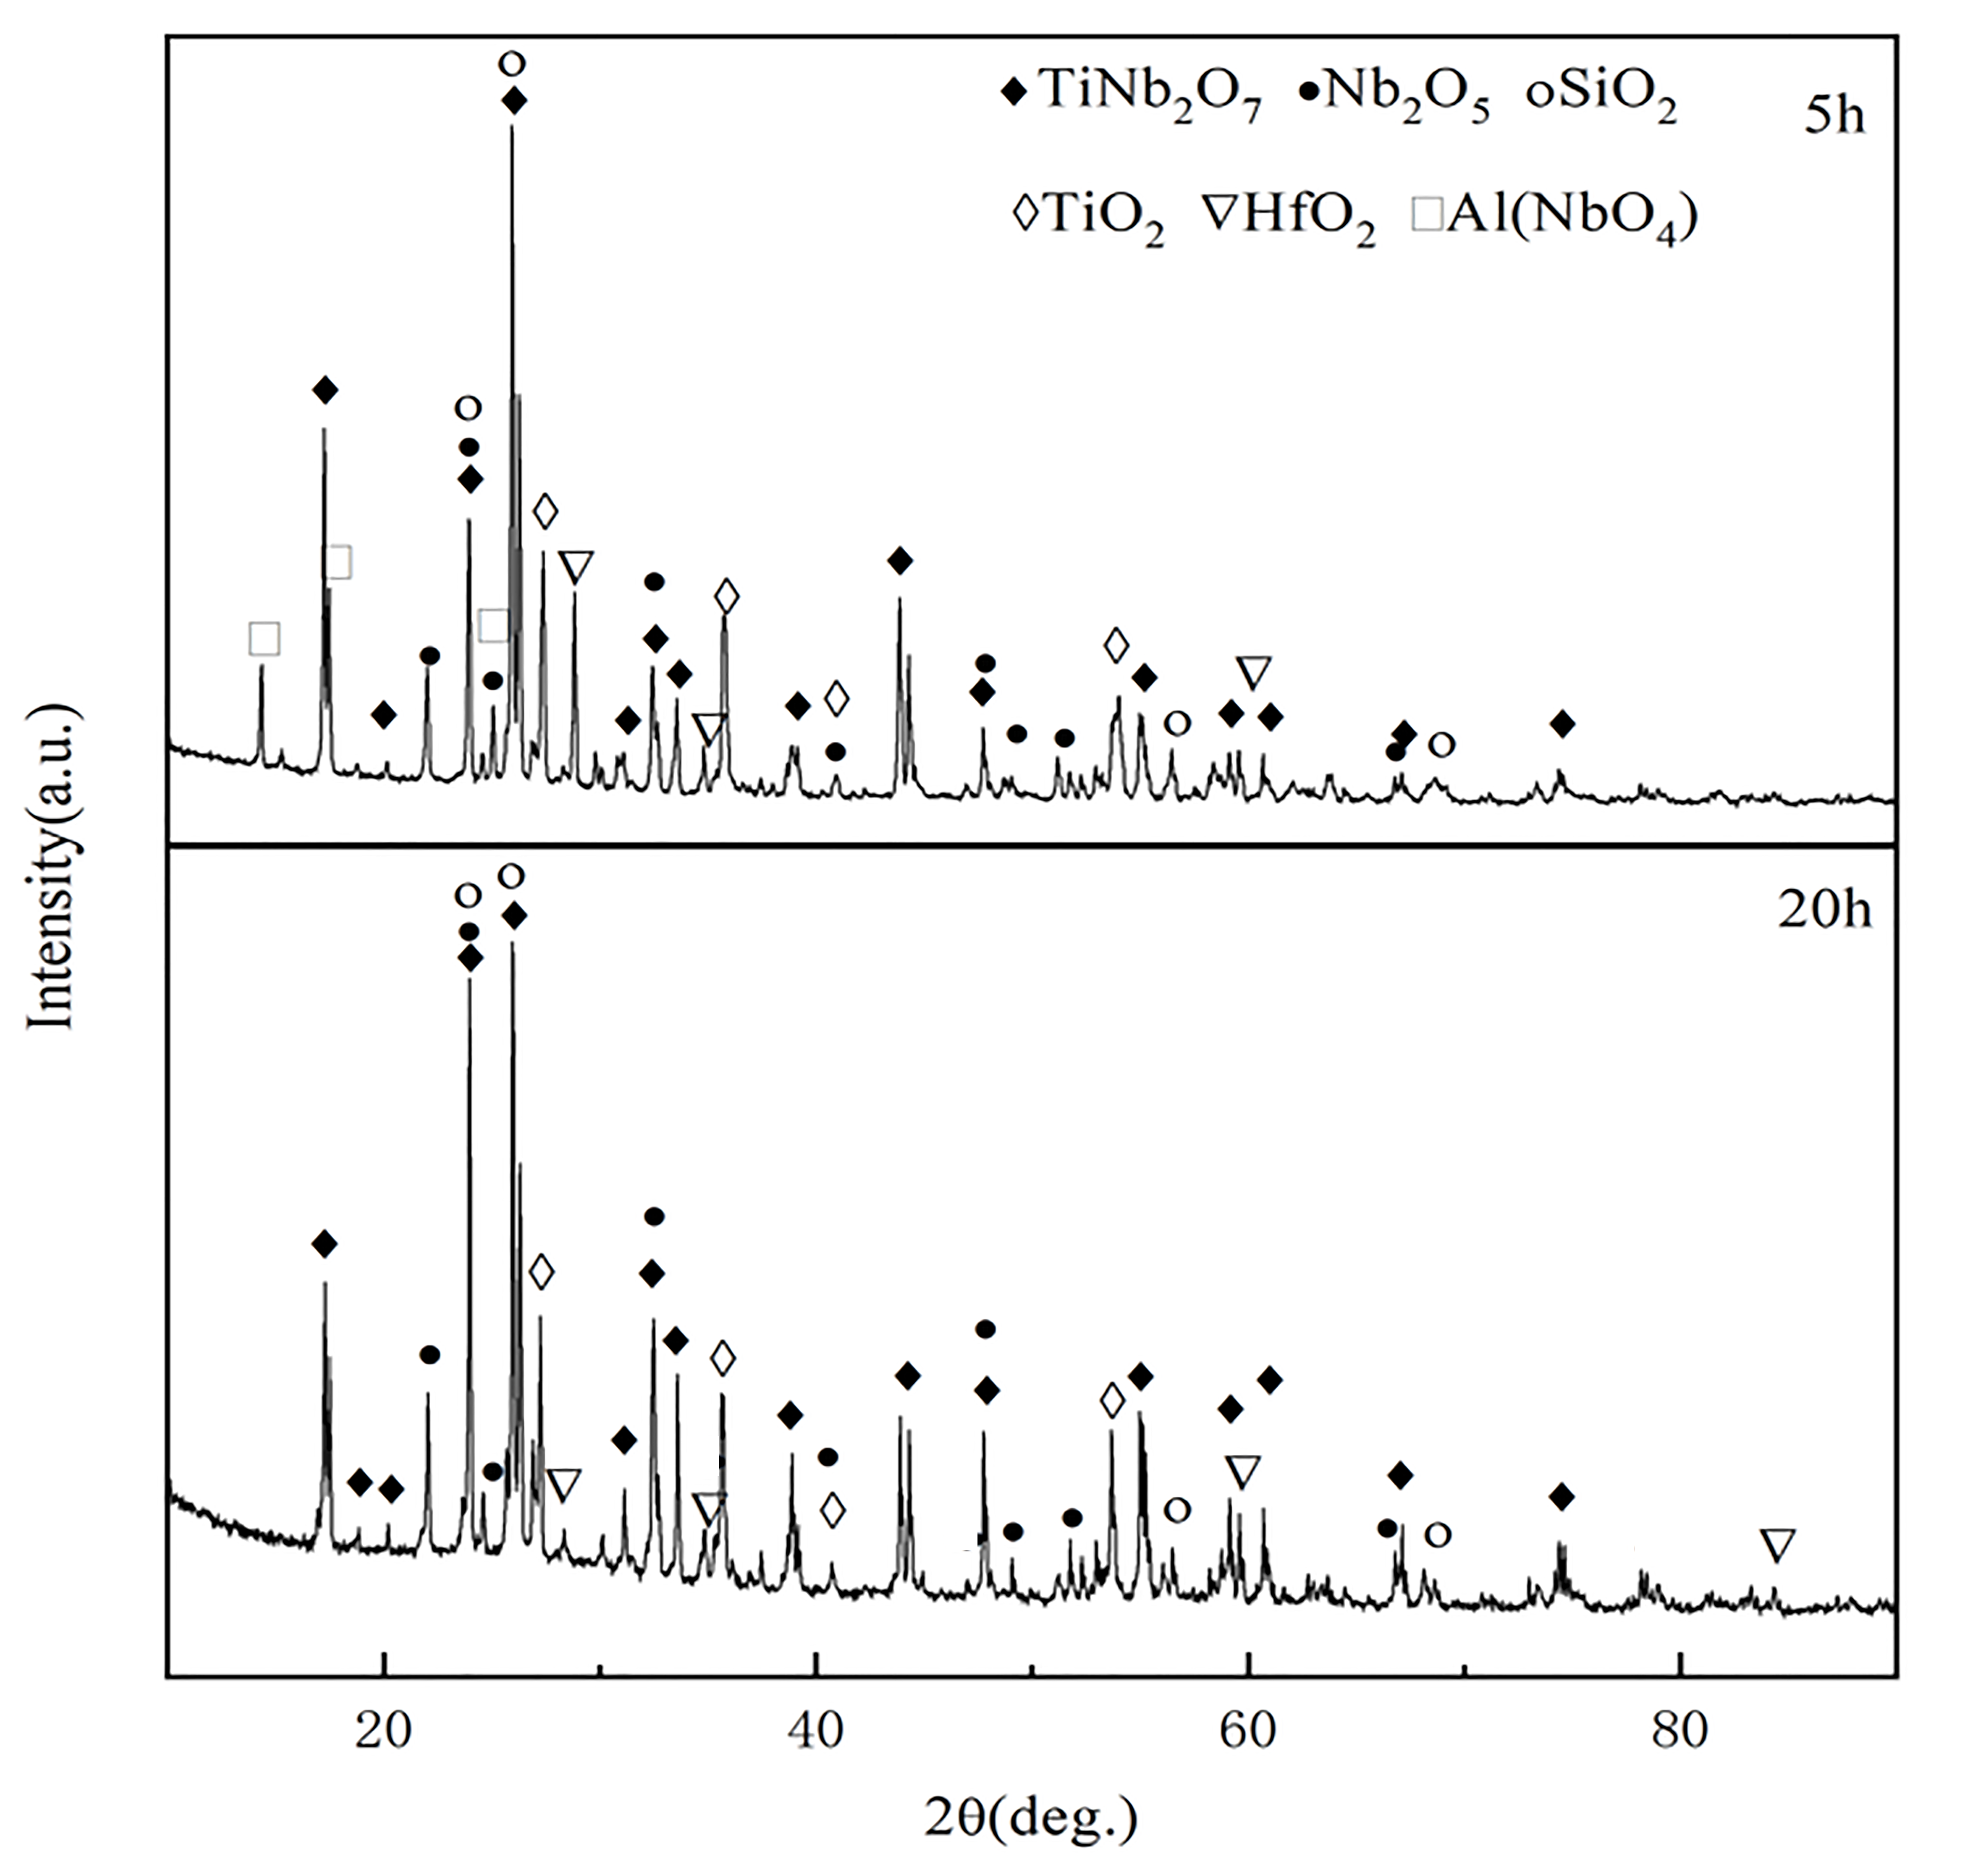
Nb-Si-Ti-Mo-Hf-Al-Cr alloy oxidizes at 1523 K at different times. The oxidation products are TiNb2O7, Nb2O5, SiO2, TiO2, and HfO2, respectively. During the oxidation process, a solid phase reaction occurs: Nb2O5 + TiO2→TiNb2O7. The formation of TiNb2O7 can effectively inhibit oxygen diffusion, while Hf consumes oxygen via a solid solution.
(3)
The oxidation resistance of Nb-Si-Ti-Mo-Hf-Al-Cr alloys is primarily affected by solid solution elements. When the alloy is oxidized, the Nb5Si3 shows extreme oxidation resistance, but O cracks quickly corrode the Nbss and are generated due to the deformation stress between the Nbss and Nb5Si3, which exacerbates the oxidation of the internal alloy. Hf can rapidly migrate to the Nbss/Nb5Si3 interface to form HfO2, which consumes O, preventing O from diffusing into the internal alloy and effectively improving the oxidation resistance of the alloy. Optimizing the Ti/Hf/Mo ratios synergistically can effectively improve the oxidation resistance and mechanical properties of alloys.

Author Contributions

Y.Z. (Youwei Zhang): Funding acquisition and investigation. Z.S.: Supervision and methodology. L.L.: Investigation, writing—original draft, funding acquisition, and project administration. Z.L.: Investigation and formal analysis. X.L.: Data curation and supervision. Y.S.: Conceptualization and supervision. T.Y.: Methodology and validation. Y.Z. (Yong Zang): Methodology, review, and editing. D.J.: Validation, review, and editing. All authors have read and agreed to the published version of the manuscript.

Funding

This research was funded by [National Natural Science Foundation for Young Scientists of China] grant number [52305377], [Open Research Fund of the State Key Laboratory of Precision Manufacturing for Extreme Service Performance] grant number [Kfkt2023-04], [National Science and Technology Major Project of China] grant number [2024ZD0710101], and [Liaoning Provincial Science and Technology Plan Joint Plan project] grant number [2023JH2/101700049].

Data Availability Statement

The original contributions presented in this study are included in the article. Further inquiries can be directed to the corresponding authors.

Conflicts of Interest

Youwei Zhang, Zhongde Shan, Dehua Jin and Tao Yang were employed by China Academy of Machinery Shenyang Research Institute of Foundry Co., Ltd. The remaining authors declare that the research was conducted in the absence of any commercial or financial relationships that could be construed as a potential conflict of interest.

References

  1. Liu, B.; Zhou, X.; Shuitcev, A.; Zarinejad, M.; Tong, Y. Effects of Nb addition on the microstructure and martensitic transformation in NiTiHf-based high-temperature shape memory alloys. Intermetallics 2025, 182, 108790. [Google Scholar] [CrossRef]
  2. Zhu, E.; Xia, D.; Chen, P.; Han, Q.; Wang, X.; Liu, Z.; Jiang, K. Study on the Effect of Niobium on the High Temperature Oxidation Resistance of Ferritic Stainless Steel. Metals 2024, 14, 25. [Google Scholar] [CrossRef]
  3. Zhang, W.; Qiao, Y.; Guo, X.; Li, L.; Nan, X. Excellent oxidation resistance: A dense and well-bonded MoSi2/(Nb,X)Si2 composite coating on Nb-Si based alloy. Corros. Sci. 2025, 249, 112863. [Google Scholar] [CrossRef]
  4. Hou, Q.; Li, M.; Chen, Z.; Zhou, C. Effect of TiN diffusion barrier on interdiffusion between Mo–Si–B coating and Nb–Si based alloy. Mater. Chem. Phys. 2025, 337, 130584. [Google Scholar] [CrossRef]
  5. Huang, Y.; Jia, L.; Kong, B.; Guo, Y.; Wang, N. Microstructure and room temperature fracture toughness of Nb–Si-based alloys with Sr addition. Rare Met. 2024, 43, 3904–3912. [Google Scholar] [CrossRef]
  6. Yue, G.; Guo, X.; Qiao, Y.; Luo, F. Isothermal oxidation and interdiffusion behavior of MoSi2/WSi2 compound coating on Nb-Ti-Si based alloy. Appl. Surf. Sci. 2020, 504, 144477. [Google Scholar] [CrossRef]
  7. Yin, X.; Liang, J.; Zhang, X.; Wang, C.; Chen, S.; Shang, S.; Liu, C. Improving the mechanical properties and oxidation resistance of Nb-16Si-20Ti alloys with B4C addition. Int. J. Refract. Met. Hard Mater. 2024, 119, 106543. [Google Scholar] [CrossRef]
  8. Liu, W.; Huang, S.; Ye, C.; Jia, L.; Kang, Y.; Sha, J.; Chen, B.; Wu, Y.; Xiong, H. Progress in Nb-Si ultra-high temperature structural materials: A review. J. Mater. Sci. Technol. 2023, 149, 127–153. [Google Scholar] [CrossRef]
  9. Holgate, C.; Frey, C.; Endsley, M.; Suzuki, A.; Levi, C.; Pollock, T. Design of an alumina forming coating for Nb-base refractory alloys. Mater. Des. 2025, 251, 113652. [Google Scholar]
  10. Guo, Y.; Jia, L.; Su, H.; Zhang, F.; Peng, H.; Zhang, H. Surface Remelting-Mediated Improvement in Oxidation Resistance of Cr2Nb-Containing Nb-Si-Based Alloys at High Temperatures. Adv. Eng. Mater. 2019, 21, 1900425. [Google Scholar] [CrossRef]
  11. Li, Z.; Luo, L.; Wang, B.; Su, B.; Luo, L.; Wang, L.; Su, Y.; Guo, J.; Fu, H. Cooperative effects of Mo and B additions on the microstructure and mechanical properties of multi-elemental Nb-Si-Ti based alloys. Mater. Charact. 2023, 206, 113421. [Google Scholar]
  12. Geng, J.; Tsakiropoulos, P. A study of the microstructures and oxidation of Nb-Si-Cr-Al-Mo in situ composites alloyed with Ti, Hf and Sn. Intermetallics 2007, 15, 382–395. [Google Scholar] [CrossRef]
  13. Yu, J.; Chen, D.; Xu, F.; Wang, S.; Cui, X.; Gong, W.; Chen, R. Simultaneous improving high temperature oxidation resistance and room temperature toughness of Nb–Si based alloy via appropriate Ta content addition strategy. Int. J. Refract. Met. Hard Mater. 2024, 124, 106800. [Google Scholar]
  14. Zhang, W.; Qiao, Y.; Guo, X.; Li, L.; Nan, X. Microstructure characteristics and oxidation behavior of a dense Si-Cr-Fe-Ti coating with a multi-layer structure on Nb-Si based alloy by slurry sintering. Corros. Sci. 2025, 246, 112743. [Google Scholar] [CrossRef]
  15. Perrin, A.; Fernandez-Zelaia, P.; Ledford, C.; Lin, Y.; Berry, E.; Dehoff, R.; Kirka, M.; Yang, Y. Design of Silicide-Strengthened Nb–Si–Cr–(Mo) alloys for additive manufacturing. Mater. Des. 2025, 251, 113616. [Google Scholar] [CrossRef]
  16. Guo, Y.; He, J.; Li, Z.; Jia, L.; Su, H.; Zhang, J.; Zhang, H. Tuning microstructures and improving oxidation resistance of Nb-Si based alloys via electron beam surface melting. Corros. Sci. 2020, 163, 108281. [Google Scholar] [CrossRef]
  17. Grammenos, I.; Tsakiropoulos, P. Study of the role of Al, Cr and Ti additions in the microstructure of Nb-18Si-5Hf base alloys. Intermetallics 2010, 18, 242–253. [Google Scholar]
  18. Zelenitsas, K.; Tsakiropoulos, P. Study of the role of Al and Cr additions in the microstructure of Nb-Ti-Si in situ composites. Intermetallics 2005, 13, 1079–1095. [Google Scholar] [CrossRef]
  19. Su, Z.; Liu, B.; Zhang, Y.; Song, J.; Qian, B.; Liu, W.; Sun, S.; Qiu, J.; Dai, Y. Precision processing of Nb-Si alloy via water-jet guided laser: Realization of inhibited-oxidation and small-taper. Opt. Laser Technol. 2025, 187, 112853. [Google Scholar] [CrossRef]
  20. Tian, X.; Guo, X. Structure and oxidation behavior of Si-Y co-deposition coatings on an Nb silicide based ultrahigh temperature alloy prepared by pack cementation technique. Surf. Coat. Technol. 2009, 204, 313–318. [Google Scholar] [CrossRef]
  21. Wen, S.H.; Zhou, C.G.; Sha, J.B. Microstructural evolution and oxidation behaviour of Mo-Si-B coatings on an Nb-16Si-22Ti-7Cr-2Al-2Hf alloy at 1250 °C prepared by spark plasma sintering. Surf. Coat. Technol. 2018, 352, 320–329. [Google Scholar] [CrossRef]
  22. Zhang, P.; Guo, X. Preparation and oxidation resistance of silicide/aluminide composite coatings on an Nb-Ti-Si based alloy. Surf. Coat. Technol. 2015, 274, 18–25. [Google Scholar] [CrossRef]
  23. Hou, Q.; Li, M.; Shao, W.; Zhou, C. Oxidation and interdiffusion behavior of Mo-Si-B coating on Nb-Si based alloy prepared by spark plasma sintering. Corros. Sci. 2020, 169, 108638. [Google Scholar] [CrossRef]
  24. Pang, J.; Wang, W.; Zhou, C. Microstructure evolution and oxidation behavior of B modified MoSi2 coating on Nb–Si based alloys. Corros. Sci. 2016, 105, 1–7. [Google Scholar]
  25. Wang, W.; Yuan, B.; Zhou, C. Formation and oxidation resistance of germanium modified silicide coating on Nb based in situ composites. Corros. Sci. 2014, 80, 164–168. [Google Scholar]
  26. Grammenos, I.; Tsakiropoulos, P. Study of the role of Hf, Mo and W additions in the microstructure of Nb-20Si silicide based alloys. Intermetallics 2011, 19, 1612–1621. [Google Scholar]
  27. Cheng, G.M.; He, L.L. Microstructure evolution and room temperature deformation of a unidirectionally solidified Nb-22Ti-16Si-3Ta-2Hf-7Cr-3Al-0.2Ho (at.%) alloy. Intermetallics 2011, 19, 196–201. [Google Scholar] [CrossRef]
  28. Gao, R.; Peng, H.; Guo, H.; Chen, B. Additively manufactured Nb-Ti-Si based alloy: As-built and heat-treated conditions. Add. Manuf. Lett. 2024, 11, 100242. [Google Scholar] [CrossRef]
  29. Wang, X.; Wang, Q.; Chen, R.; Wang, X.; Su, Y.; Fu, H. Gadolinium doping induced the microstructure evolution and mechanical properties improvement of Nb-Si based in-situ superalloy. J. Alloys Compd. 2024, 1004, 175942. [Google Scholar] [CrossRef]
  30. Sun, Z.; Guo, X.; He, Y.; Guo, J.; Yang, Y.; Chang, Y. Investigation on the as-cast microstructure of Nb silicide based multicomponent alloys. Intermetallics 2010, 18, 992–997. [Google Scholar] [CrossRef]
  31. Tian, Y.X.; Guo, J.T.; Sheng, L.; Cheng, G.; Zhou, L.; He, L.; Ye, H. Microstructures and mechanical properties of cast Nb-Ti-Si-Zr alloys. Intermetallics 2008, 16, 807–812. [Google Scholar]
  32. He, D.; Feng, Q.; Fu, Y.; Zhang, M.; Chen, G.; Gao, P.; Li, C. Erosion behaviors of BaZrO3 and BaZrO3/Y2O3 dual-phase refractories within Nb–Si melts during vacuum induction melting. J. Mater. Res. Technol. 2024, 33, 9726–9734. [Google Scholar] [CrossRef]
  33. Cheng, J.; Yi, S.; Park, J.S. Oxidation behaviors of Nb-Si-B ternary alloys at 1100°C under ambient atmosphere. Intermetallics 2012, 23, 12–19. [Google Scholar] [CrossRef]
  34. Wang, Q.; Wang, Q.; Chen, R.; Wang, X.; Zou, Y.; Su, Y.; Fu, H. Formation of near core-shell-like structure and dual-phase nanoprecipitation behavior in Nb-Si-Ti based alloys. Compos. Part B Eng. 2024, 283, 111634. [Google Scholar] [CrossRef]
  35. Wang, W.; Zhang, B.; Zhou, C. Formation and oxidation resistance of Hf and Al modified silicide coating on Nb-Si based alloy. Corros. Sci. 2014, 86, 304–309. [Google Scholar] [CrossRef]
  36. Xu, J.; Shi, Z.; Zhang, Z.; Huang, H.; Liu, X. Significant enhancement of high temperature oxidation resistance of pure titanium via minor addition of Nb and Si. Corros. Sci. 2020, 166, 108430. [Google Scholar]
  37. Geng, T.; Li, C.; Zhao, X.; Xu, H.; Guo, C.; Du, Z. Experimental study on the as-cast solidification of the Si-rich alloys of the Nb-Si-Mo ternary system. Intermetallics 2010, 18, 1007–1015. [Google Scholar] [CrossRef]
  38. Su, L.; Jia, L.; Jiang, K.; Zhang, H. The oxidation behavior of high Cr and Al containing Nb-Si-Ti-Hf-Al-Cr alloys at 1200 and 1250 °C. Int. J. Refract. Met. Hard Mater. 2017, 69, 131–137. [Google Scholar] [CrossRef]
  39. Nelson, J.; Ghadyani, M.; Utton, C.; Tsakiropoulos, P. A Study of the Effects of Al, Cr, Hf, and Ti Additions on the Microstructure and Oxidation of Nb-24Ti-18Si Silicide Based Alloys. Materials 2018, 11, 1579. [Google Scholar] [CrossRef]
  40. Wang, Y.; Guo, X. Re-Melting Nb–Si-Based Ultrahigh-Temperature Alloys in Ceramic Mold Shells. Metals 2019, 9, 721. [Google Scholar] [CrossRef]
  41. Lefez, B.; Jouen, S.; Hannoyer, B.; Bacos, M.P.; Beucher, E. Oxidation behaviour of the 47Nb-16Si-25Ti-8Hf-2Al-2Cr alloy sheet and vibrational spectroscopy. Mater. High Temp. 2014, 26, 15–20. [Google Scholar]
  42. Esparza, N.; Rangel, V.; Gutierrez, A.; Arellano, B.; Varma, S.K. A comparison of the effect of Cr and Al additions on the oxidation behaviour of alloys from the Nb-Cr-Si system. Mater. High Temp. 2016, 33, 105–114. [Google Scholar] [CrossRef]
  43. Geng, J.; Tsakiropoulos, P.; Shao, G. Oxidation of Nb-Si-Cr-Al in situ composites with Mo, Ti and Hf additions. Mater. Sci. Eng. A 2006, 441, 26–38. [Google Scholar] [CrossRef]
  44. Jiang, W.; Shao, W.; Sha, J.; Zhou, C. Experimental studies and modeling for the transition from internal to external oxidation of three-phase Nb-Si-Cr alloys. Prog. Nat. Sci. Mater. Int. 2018, 28, 740–748. [Google Scholar]
  45. Sun, L.; Fu, Q.G.; Fang, X.Q.; Sun, J. A MoSi2-based composite coating by supersonic atmospheric plasma spraying to protect Nb alloy against oxidation at 1500 °C. Surf. Coat. Technol. 2018, 352, 182–190. [Google Scholar] [CrossRef]
  46. Andreev, D.; Vdovin, Y.; Yukhvid, V.; Golosova, O. Mo–Nb–Si–B Alloy: Synthesis, Composition, and Structure. Metals 2021, 11, 803. [Google Scholar] [CrossRef]
  47. Yang, T.; Guo, X. Effects of Nb Content on the Mechanical Alloying Behavior and Sintered Microstructure of Mo-Nb-Si-B Alloys. Metals 2019, 9, 653. [Google Scholar] [CrossRef]
Figure 1. X-ray diffraction pattern of A1 to A6 alloys.
Metals 15 00439 g001
Figure 2. BSE micrographs of the experimental Nb-Si-based alloys. Images (a,b) are of A1 samples, (c,d) are of A2 samples, (e,f) are of A3 samples, (g,h) are of A4 samples, (i,j) are of A5 samples, and (k,l) are of A6 samples. Note: Points A, C, E, G, I, O means the Nbss phase, while the Points B, D, F, H, J, P means the Nb5Si3 Phase.
Metals 15 00439 g002
Figure 3. Element mapping of the A3 alloy.
Metals 15 00439 g003
Figure 4. Element mapping the A6 alloy.
Metals 15 00439 g004
Figure 5. The oxidation weight gain of different alloys when heated for 5 h at 1523 K.
Metals 15 00439 g005
Figure 6. The macroscopic morphology of A6 alloy (Nb-16Si-20Ti-5Mo-3Hf-2Al-2Cr) with oxidation, monitored from 1 h to 10 h.
Metals 15 00439 g006
Figure 7. The oxidation weight gain of A6 alloy at 1523 K: (a) oxidation kinetics curve; (b) oxidation increment versus the time curve.
Metals 15 00439 g007
Figure 8. The surface oxidation morphologies after 5 h: (a,b) show A6 alloy; (c,d) show A5 alloy.
Metals 15 00439 g008
Figure 9. X-ray diffraction pattern of the oxide film of A6 alloy after oxidation for 5 h and 20 h.
Metals 15 00439 g009
Figure 10. The organization and linear scanning of A6 alloy after oxidation for 7 h and 20 h: (ac) are the internal alloy, oxidation interface, and linear scanning results for 7 h, respectively; (df) are the internal alloy, oxidation interface, and linear scanning results for 20 h, respectively. Note: Points A, B, C, and D means the position of energy spectrum points.
Metals 15 00439 g010
Table 1. Nominal chemical composition (in at.%) of the experimental alloys, including Si, Ti, Mo, Hf, Al, Cr, and balance Nb.
No.SiTiMoHfAlCrNb
A1161810522Bal
A2162015122Bal
A316225322Bal
A418205322Bal
A516205522Bal
A616205322Bal
Table 2. Energy spectrum analysis of micrographs in Figure 2; at.%.
Energy Spectrum PointNbSiTiHfMoAlCr
A39.719.119.03.015.41.42.4
B38.239.311.95.24.70.50.3
C45.52.817.22.627.52.02.5
D29.136.324.43.34.31.41.4
E45.23.817.04.49.71.518.5
F21.438.025.17.81.81.44.4
G61.45.213.92.014.41.61.5
H42.039.410.63.32.51.80.4
I55.46.118.33.412.42.52.1
J37.838.811.05.24.81.70.7
O58.54.718.22.611.72.02.3
P38.836.214.13.95.80.80.5
Table 3. Oxidation thickening and the resulting oxidation weight gain of A6 alloy after oxidation for 1 h to 10 h.
Oxidation Time1 h2 h3 h4 h5 h6 h7 h8 h9 h10 h
thickness (um)2377.9116.5129.5144.5188.5243323429438
Oxidation weight gain (mg/mm2)0.210.260.420.460.750.951.001.161.191.38
Square of oxidation weight gain (mg2/mm4)0.040.070.180.210.570.901.001.361.411.90
Table 4. Energy spectrum analysis of the oxidation of A6 alloy for 20 h in Figure 10d; at.%.
Spectrum PointONbSiTiHfMoAlCr
A2.838.737.111.83.44.21.50.5
B11.059.24.77.31.012.01.73.3
C14.229.923.322.02.64.42.61.1
D19.221.327.512.515.51.91.50.5
Table 5. Physical parameters of the alloying elements.
ElementNbSiTiHfMoAlCr
Highest valence oxideNb2O5SiO2TiO2HfO2MoO3Al2O3Cr2O3
Electronegativity1.411.911.381.161.471.611.65
Disclaimer/Publisher’s Note: The statements, opinions and data contained in all publications are solely those of the individual author(s) and contributor(s) and not of MDPI and/or the editor(s). MDPI and/or the editor(s) disclaim responsibility for any injury to people or property resulting from any ideas, methods, instructions or products referred to in the content.

