Abstract
The plastic deformation during equal-channel angular pressing (ECAP) can be affected by various material- and processing-related factors. For instance, the initial crystal orientation and grain size play an important role in determining the material flow, which may cause localized deformation in terms of macroscopic deformation banding. In this study, we use a continuous cast AA1080 aluminum alloy with coarse columnar grains to analyze the influence of casting texture on the local material flow during ECAP. Billets are extracted with their columnar grains inclined either in the same direction as the ECAP shear plane or opposite to it. Visio-plastic analysis is performed on split billets. The pass is interrupted halfway through the ECAP tool to accurately capture steady-state deformation conditions. Flow lines at several positions within the billet are identified based on the positions of deformed and undeformed marker points and fitted to a phenomenological model based on a super-ellipse function. For further characterization, hardness measurements, optical and electron microscopy are carried out on the ECAP-deformed samples. Significant differences in terms of local material flow and microstructure evolution regarding the resulting crystal orientation and deformation banding are observed. Our results confirm and emphasize the importance of initial grain size and texture effects for ECAP processing.
1. Introduction
Among the variety of severe plastic deformation processes that have been studied in the past decades, equal-channel angular pressing (ECAP) has emerged as one of the best established techniques for the production of ultrafine-grained microstructures in bulk materials up to industrial scale [1,2]. In recent years ECAP has been successfully adapted for the improvement of mechanical properties in conventional, easy as well as hard to deform materials such as aluminum [3] and magnesium [2,4], respectively, and also for the processing of metal matrix composites [5], high-entropy alloys [6,7], or even metal chips as a novel approach for solid state recycling [8,9].
In principle, ECAP can be understood as pressing a metallic billet (of usually circular or square cross-section) through an angled die, as shown schematically in Figure 1a. As it passes the region near the intersection of the entrance and exit channels, the material is heavily sheared. This region is referred to as plastic deformation zone (PDZ). The amount of (shear) strain imposed on the material thus depends strongly on the used die geometry, often described in terms of the channel angle Φ and the angle of curvature Ψ (see Figure 1a). The Iwahashi formula [10] is typically used to estimate the equivalent strain (per pass) based solely on these two parameters. While this approach allows for a first-order approximation of the total strain based on die geometry alone, it does not account for several effects documented repeatedly in experimental work regarding the overall degree of grain refinement and the homogeneity of the billet after deformation [11]: On the one hand, this includes processing conditions such as processing temperature [12,13], friction [11,14,15], or back-pressure [16,17,18], which have been shown to considerably affect the resulting microstructures and their homogeneity. On the other hand, material-related properties such as the stacking-fault energy [19,20,21], (as-received) grain size [22], and initial material conditions in terms of pre-ECAP thermal [23] and/or mechanical [24] treatments can significantly affect the efficiency of ECAP. More particularly, the characteristic texture of the initial material can play a key role in determining the homogeneity of strain accumulation during ECAP.
Experimental studies on ECAP of single crystals of aluminum [25,26,27], copper [21,28,29], and nickel [30] have documented the formation of clearly inhomogeneous deformation structures, which often take the form of macroscopically visible striations with different orientations within the deformed billets. These macroscopic deformation (or shear) bands are mostly oriented in the same direction as the shear plane of the ECAP tool, although the tilt angle varies for individual experiments and even within the same sample [26]. Orientation differences between the center and the sides of the billet have, for instance, been attributed to frictional effects between the billet and the die walls [30]. In the vertical direction (i.e., y-direction in Figure 1, placing the deformed billets in the exit channel), the processed Al and Cu single crystals showed significant variations in the thickness of the deformations bands that were oriented horizontally in the cross-sectional plane [21,25] whereas the cross-section of the deformed Ni single crystal showed thin horizontal bands only in the lower half of the billet; the upper region was characterized by a more complex structure of two perpendicular groups of broad bands that were inclined at an angle of about 45° with respect to the horizontal axis [30].
The influence of initial grain orientation has recently also been studied on an atomistic scale for different crystal structures by means of molecular dynamics modeling [31,32,33]. These investigations demonstrate that there are significant orientation effects on the homogeneity and magnitude of shear strains as well as grain rotation angle and grain fragmentation during ECAP of single crystals. For aluminum, the differences between an initial <100> orientation ([100] direction oriented parallel to the x-axis and [010] direction oriented parallel to the y-axis, when described in our reference coordinate system, Figure 1) and an initial <111> orientation ([111] direction oriented parallel to the x-axis and [10] direction oriented parallel to the y-axis) were most pronounced. The <100> sample experienced smaller amounts of shear strain and the highest degree of lattice rotation, while the <111> sample experienced the highest shear strains and the lowest lattice rotation, because its initial orientation is favorable for the activation of multiple slip systems [31]. Plastic deformation of single crystals by the activation of multiple slip systems can lead to the formation of deformation bands with different crystal rotations that may span the entire crystal and therefore often become macroscopically visible. For polycrystalline materials, deformation banding again depends on the initial orientation of the individual grains, and also on grain size and strain (i.e., on ECAP die geometry), and the generated bands are constrained by the grain boundaries [34,35].

Figure 1.
(a) Illustration of the ECAP principle. The channel angle Φ and the angle of curvature Ψ have a significant influence on the degree of straining in the material. (b) Schematic representation of the Tóth flow line model, adapted from refs. [36,37]. Material flow in the PDZ approximately follows a super-circular arch, and the curvature of the flow line can be defined by the flow parameter n. Increasing values of n correspond to a more pronounced change of direction—i.e., more pronounced shear—along the flow line.

A different type of macroscopic band formation has been observed during processing of a polycrystalline AA6060 aluminum alloy that was extruded at room temperature prior to ECAP [24]. The material underwent severe cold working and exhibited a strong texture with mainly <111>-oriented crystallites parallel to the direction of extrusion, i.e., parallel to the longitudinal axis of the ECAP billet. As a result, strain partitioning by recurrent shear localization during ECAP occurred, leading to the formation of alternating matrix and shear bands oriented parallel to the shear plane. These matrix and shear bands, with a characteristic thickness of about 300 microns, are characterized by relatively low and considerably higher local shear strains, respectively. This also affects the local mechanical properties as well as the resulting macro-scale of the ECAP-deformed material, which can be considered as a new type of bulk-laminate structure. Clearly, the texture prior to ECAP plays a key role in triggering the strain partitioning mechanism that leads to the formation of shear and matrix bands, but this effect is not yet understood in detail.
In the present study, we analyze the effect of a strong casting texture on the local material flow during ECAP and on the resulting microstructures of a continuous cast, commercially pure aluminum alloy with directionally grown coarse columnar grains. In previous studies we have already demonstrated that extrusion of this material leads to unusual macro- and microstructures that are formed due to the initial orientation of the columnar grains with respect to the direction of extrusion and the local tensile and shear deformation during extrusion [38]. To describe homogeneous vs. inhomogeneous deformation, we further employ the flow line model of Tóth et al. [36,37], which describes the material flow in the plastic deformation zone along different super-circular paths characterized by the flow exponent n, as shown schematically in Figure 1b. This analytical approach has been successfully applied to ECAP of OFHC copper [39] and of an AA6060 aluminum alloy [40] and facilitates a quantitative comparison of the local flow behavior.
2. Materials and Methods
We used a commercially pure AA1080 aluminum alloy obtained from Hydro Aluminium Deutschland GmbH (Bonn, Germany). The continuous cast material had a chemical composition of 0.03Si-0.08Fe-balance Al (wt.%) and consisted of coarse columnar grains that grew at an angle of about 22° with respect to the casting direction (CD) as discussed in detail in [38]. Billets with dimensions of 15 × 15 × 47 mm3 were extracted with their longitudinal axes parallel to the radial direction (RD) of the cast material (see Figure 2a) for ECAP processing. For visio-plastic analysis of the local material flow, these billets were cut in half along the CD-RD plane and etched with a macro etchant (300 mL of distilled water, 225 mL of hydrochloric acid, 112 mL of nitric acid, and 40 mL of hydrofluoric acid) prior to deformation to ensure the correct sample orientation during ECAP. One semi-billet of each sample condition was marked with a dot grid consisting of 14 flow lines, as shown schematically in Figure 1b. The dots (with a diameter of about 450 µm and spacings of 1 mm) were applied by laser etching. The billet halves were then reassembled and ECAP-deformed in a modular, friction-optimized ECAP tool with a channel angle of 90°, as shown schematically in Figure 2b. The ECAP pass was interrupted at a plunger stroke of about 30 mm in order to allow for analysis of the material flow during steady state deformation. The movable die walls (green) and the front wall (blue) were then removed for extraction of the L-shaped billet halves.
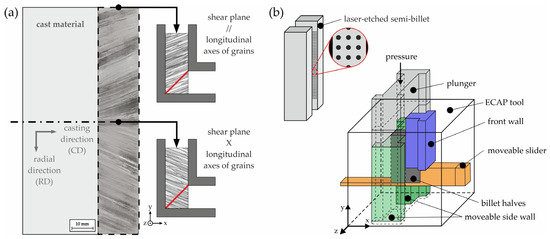
Figure 2.
Overview of billet extraction and ECAP processing: (a) (Semi-)billets were extracted with their longitudinal axes parallel to the radial direction of the cast material. Resulting from their initial tilt, the columnar grains (as visible in the macro-graph) are inclined either in the same (//) or the opposite (X) direction as the ECAP shear plane (highlighted in red). (b) For visio-plastic analysis of the local material flow, one semi-billet per condition was laser-etched (to obtain a dot grid pattern) and then processed with its original counterpart in a modular ECAP tool.
For optical flow line analysis, the deformed billets were photographed with a mirrorless camera and a macro lens. The center point coordinates, as well as the distances of the flow lines from the outer billet edges, were determined from the photographs using the CorelDRAW 2017 (Corel Corporation, Ottawa, ON, Canada) graphic design software. After a slight correction of the data to better meet the symmetry criterion of the super-ellipse function
of Tóth’s flow line model [36,37], the data points were fitted to Equation (1) in the OriginPro 2022 (OriginLab Corporation, Northhampton, MA, USA) software using the method of total least squares for regression analysis. In this model, n = 2 represents flow along a circular arch, whereas n → ∞ corresponds to a sharp corner in the flow line, which would result from ideal simple shear in a vanishing PDZ. Experimentally observed flow lines typically fall between these two limiting cases [36,37,39].
Vickers hardness (HV1) measurements were conducted on the y-z-plane in the fully deformed material sections of the billets after the visio-plastic analysis using an automated hardness tester (Wilson TUKON 1102, ITW Test & Measurement GmbH, Leinfelden-Echterdingen, Germany). The distance between indentation sites was 1 mm. For each constant value of y, three measurements were performed in the center region of the billet.
For microstructural characterization, ECAP processing was additionally performed using bulk material billets. The deformation was also interrupted as described above. For optical microscopy, samples from longitudinal and cross-sectional cuts were embedded and prepared by a standard grinding and polishing routine, and subsequently etched for about 1 min in a solution consisting of 100 mL of distilled water, 6 mL of hydrochloric acid, 2 mL of phosphoric acid, and 12 mL of hydrofluoric acid. Stereo-microscopic images were taken with a Zeiss Stemi 2000-C (Carl Zeiss AG, Oberkochen, Germany) optical microscope. Bright field images and interference contrast images were taken with an Olympus GX51 (Olympus Deutschland GmbH, Hamburg, Germany) microscope. Vibratory polishing of the samples was conducted for 60 min in an aqueous colloidal silica solution to allow for additional electron-backscatter diffraction (EBSD) measurements. EBSD data were collected using a Neon 40 EsB field emission scanning electron microscope (Carl Zeiss AG) equipped with a DigiView IV EBSD camera (EDAX Inc., Mahwah, NJ, USA). Post-processing in the OIM Analysis 8.6 (EDAX Inc.) software included careful clean-up of the raw data based on the neighbor confidence index correlation (<0.05). Additionally, X-ray diffraction (XRD) was performed on the deformed material for global texture analysis. Incomplete {200}, {220}, and {111} pole figures (0 ≤ ξ ≤ 80°) were collected in a Bruker D8 DISCOVER (Bruker Corporation, Billerica, MA, USA) using Co-Kα-radiation and a collimator with a diameter of 1 mm. Post-processing of the raw data included background correction; calculation of corresponding orientation density functions; and plotting of complete {100}, {110}, and {111} pole figures, and was carried out in the MTEX toolbox (version 5.8.2) for the MatLab R2020a (MathWorks, Natick, MA, USA) software package [41].
3. Results and Discussion
3.1. Flow Line Analysis and Mechanical Properties
Figure 3 shows photographs of the billets used for the evaluation of local material flow. Though only one half-billet in each experiment was prepared with a dot grid (right-hand side images), the pattern was also imprinted on the other billet half (left-hand side) during deformation. Plastic flow during conventional ECAP, in principle, is a two-dimensional deformation, with no displacement in the z-direction. The internal surfaces correspondingly remain planar during ECAP, and only some minor surface roughening was observed. Therefore, an analysis of indent positions provides direct information on the material flow.
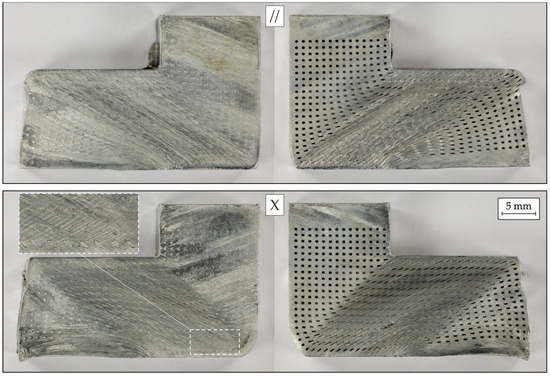
Figure 3.
Macro-scale photographs of the semi-processed billet halves for ECAP with the sample orientations // (top) and X (bottom).
The overview images in Figure 3 clearly demonstrate that the initial orientation of the coarse columnar grains with respect to the shear plane significantly alters the material flow. We also note that, first, the laser-engraved dots are much more compressed for the sample orientation //, which complicates the identification of individual points in the optical flow line analysis. Second, compared to ECAP with the shear plane parallel (//) to the longitudinal axes of grains, the so-called corner gap—i.e., the region exempt from material flow, clearly visible by the absence of material near the outer corners of the L-shaped billets—for the sample orientation X is much more pronounced. Third, processing with this sample orientation (X) leads to the formation of macroscopic deformation bands, oriented perpendicularly to the shear plane (see magnified inset), near the bottom part of the billet.
Figure 4 shows the results of the visio-plastic flow line analysis as a function of the normalized distance from the top of the billet s = (d − y)/d. This means that s = 0 corresponds to a position on the top surface while s = 1 corresponds to a position at the bottom; we have previously introduced the parameter s as it facilitates a comparison of differently sized billets, e.g., [39]. Since the two flow lines near the inner corner of the billet consist only of a small number of data points within the PDZ, the fitting process could not be carried out successfully in this narrow region. Therefore, the distributions of n-values (Figure 4a) and of the resulting equivalent von Mises strains (Figure 4b) are plotted only for the flow lines starting from s = 0.2. For sample orientation //, the n-values increase slightly for s-values corresponding to the region near the inner tool corner. With increasing distance from the inner corner, starting from s ≈ 0.6, the n-values increase more strongly. In contrast, for sample orientation X, the distribution of n-values is more homogeneous and at an intermediate level compared to //. Towards the outer regions of the billet the values are slightly decreasing. In general, both distributions diverge from the nearly linear increase in n-values from top to bottom that we observed in previous studies for ECAP of OFHC copper [39] and an AA6060 aluminum alloy [40] using the same ECAP tool. The distribution of n-values for // is quite similar to the findings of Panigrahi et al. [16], who performed industrial scale ECAP in a similarly designed ECAP tool using a commercially pure aluminum alloy (AA1050) and who also found an increase of the flow exponent with a larger slope in the bottom part of the billet starting from about s ≈ 0.6. It is interesting to note that, despite differences in terms of the initial material condition (rolled) and ECAP processing parameters (backpressures of 30 MPa and 60 MPa), Panigrahi et al.’s and our results represent quite similar flow exponent distributions.
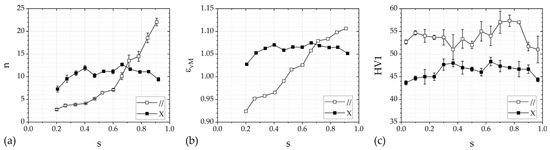
Figure 4.
Distributions of (a) n-values obtained from the visio-plastic flow line analysis, (b) equivalent von Mises strains, and (c) Vickers hardness as a function of the normalized position along the billet height, s.
Calculating equivalent (von Mises) strain values based on the flow exponent, n, is quite tedious for arbitrary tool geometries [39]. While the relation between n and equivalent strain is non-linear, it is at least monotonous: larger n-values correspond to larger amounts of accumulated equivalent strain. Moreover, for 90° tools such as the ECAP tool used in the present study, integration along a flow line through the PDZ can be reduced to [36,37,39]
Equation (2) has been used to determine local plastic strain values in the present study. In general, the distributions of local plastic strains, shown in Figure 4b, are somewhat similar to the distribution of n-values. However, for small values of the flow exponent (2 ≤ n ≤ 5), deviations between adjacent flow lines result in more pronounced differences with respect to the amount of plastic strain compared to n-values of 15 and higher. The distribution of von Mises strain values is, therefore, nearly linear for sample orientation //, covering strains from about 0.92 to 1.11. In contrast, the calculated local strains for sample orientation X range approximately from 1.03 to 1.08. They are at a comparatively high level and can be considered to be almost constant in the center part of the billet.
It is generally accepted that complex deformation histories and multi-axial stress-states can affect microstructural evolution and the resulting mechanical properties of structural and functional materials [42,43]. An increase in hardness after severe plastic deformation, likewise, is to be expected in most materials subjected to ECAP. It is less clear, however, whether the gradients in strain distributions observed in our present study (Figure 4b) can be directly related to similar gradients in the hardness distributions across a billet. Figure 4c shows the results of the Vickers hardness measurements, which we consider to be representative of local mechanical properties. For sample orientation X, the distribution of hardness is similar to the distribution of the equivalent von Mises strain in the analyzed region of about 0.2 ≤ s ≤ 0.9. For sample orientation //, however, there are marked differences between the respective distributions. On the one hand, the calculated local equivalent strains indicate that the deformation and corresponding hardness is significantly decreased for the upper and middle part of the billet up to about s = 0.6 compared to sample orientation X, whereas the hardness is higher in the top part of the billet and slightly drops toward the center of the billet with an increase towards s ≈ 0.8 and an additional decrease in the bottom region. On the other hand, the hardness for sample orientation // is generally higher than for sample orientation X, although the calculated equivalent von Mises strains were higher only for the lower third of the billet. We are, therefore, inclined to conclude that there is no simple correlation between flow line exponents/equivalent strain values and local hardness values; while this has already been shown for a quasi-isotropic, cast AA6060 aluminum alloy [40], the present study further emphasizes the influence of macroscopic anisotropy. Further work, e.g., using nano-indentation, which allows for a much better spatial resolution to probe the local mechanical properties [31], is required to fully analyze these observations.
3.2. Microstructural Evolution in the Plastic Deformation Zone
To study the differences in local material flow as a function of the initial orientation of the columnar grains with respect to the ECAP shear plane, microstructural analysis was performed on semi-processed billets. Stereo-microscopic images of the region near the PDZ are shown in Figure 5a,b for the sample orientations // and X, respectively. Independent of their initial orientation, the grains generally align with the direction of shearing during ECAP. As the grains pass through the PDZ, they experience a shear deformation that also results in further grain elongation. For orientation //, which exhibited an initial tilt angle of the columnar grains of about 22°, the tilt angle with respect to the x-axis is about 30° after ECAP. The transition in the PDZ is hardly noticeable. In contrast, processing billets with an initial grain orientation X results in a pronounced change in grain orientation: the grains exhibit a tilt angle of about 22° with respect to the x-axis. In addition, the macroscopic deformation is not distributed homogeneously. Prominent deformation banding can be observed in the lower section of the billet for sample orientation X, as marked with a solid white line (see also Figure 3 for reference). Macroscopic deformation bands have also been observed after ECAP of face-centered cubic single crystals [21,25,26,27] as well as for a strongly <111>-textured polycrystalline aluminum alloy [24]. Compared to these reports, the band structures shown in Figure 5b are far less pronounced, and it is worth highlighting that they are not oriented parallel to the main direction of shear but instead perpendicular to it.
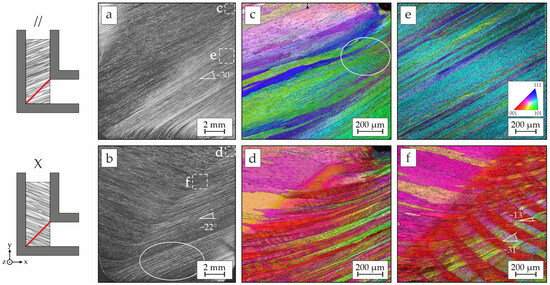
Figure 5.
Microstructural features near the PDZ (interrupted pass) with the sample orientations // (top row) and X (bottom row), as indicated by the schematic illustrations on the left. (a,b) Stereo-microscopic images of the entire deformation zone with markings of the locations of the detail views (dashed boxes) given in subfigures (c–f) obtained by EBSD measurements with a step size of 1 µm (c,d) and 3 µm (e,f), respectively. The color-coded orientation maps represent the crystal orientation parallel to the exit channel and are superimposed with the corresponding image quality maps.
The color-coded detail views (Figure 5c–f) were obtained from the EBSD measurements in the respective marked areas and indicate the crystal orientation parallel to the exit channel (x-axis). While the predominant orientation after processing with sample orientation X ranges from <001> to <101>, it is predominantly between <111> and <101> for sample orientation //. The EBSD data confirm the distinct differences in grain deformation and rotation that were already observed macroscopically. In addition, they allow for a more in-depth characterization of the shear bands that not only occur in the lower part of the billet but also in more central regions, as shown in Figure 5f. The two types of bands take up about the same material volume and are characterized by different crystal orientations and tilt angles of the grain boundaries. For bands with a crystal orientation near <001>, the tilt angle is about 13° with respect to the x-axis. For the alternating bands, the tilt angle is about 31°, and the crystal orientation is more complex with a higher tilt away from <001> towards <101> and <111>. On average, the two types of bands also result in the macroscopically observed tilt angle of about 22°. While no macroscopic shear bands were observed for the sample orientation //, microscopic bands formed within the large columnar grains to accommodate the severe shear deformation, see marked area in Figure 5c.
It is instructive to further analyze the macroscopic and local reorientation of the strongly elongated grains of the as-cast condition after ECAP in the light of our flow line results. Neglecting, in a first-order approximation, local strain partitioning, the 2D material flow can be described by the deformation gradient [39]
that maps a point Xj prior to deformation to a point xi after passing the PDZ:
In the 90° ECAP die, the shear component S can be determined from n as
where Γ is the transcendental Gamma function [44]. Considering the central axes of our elongated, as-cast grains, with an orientation of either +22° (//) or −22° (X) relative to the x-direction, and taking an average n-value of 10 based on the distributions in Figure 4a, Equation (3) yields post-ECAP orientations of the sheared and rotated grains with angles of 33° and 23° for // and X, respectively, which is in excellent agreement with the experimentally observed orientations.
3.3. Microstructure and Texture in the Fully Deformed Material
Additional metallographic samples were taken from the parts of the ECAP billets that had fully passed the PDZ. The cross-sections were characterized by means of optical and scanning electron microscopy as well as XRD. The micrographs in Figure 6 show distinct band structures for both processing conditions X and //, highlighted by black and white lines (hatchings). The bands exhibit varying widths and form heterogeneously over the cross sections, i.e., they are, in general, more pronounced in the lower section of the billets, as shown in the optical micrographs in Figure 6a–d.
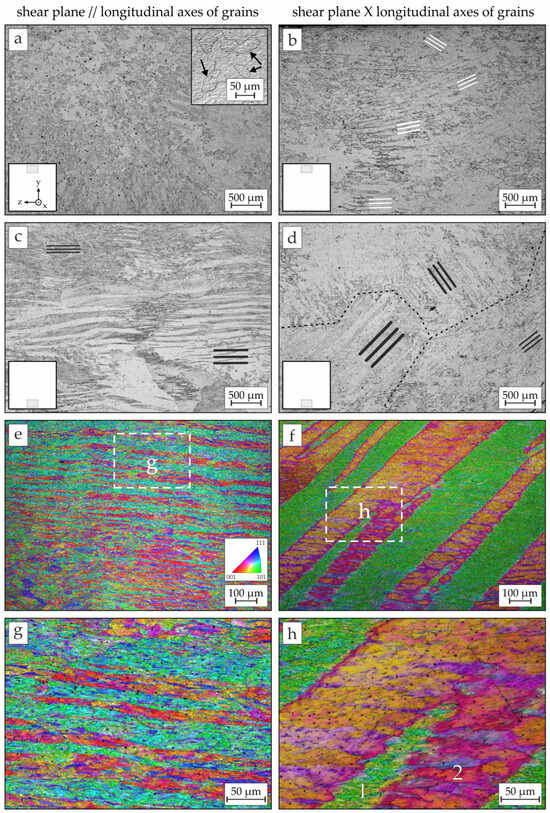
Figure 6.
Microstructural features after ECAP with the shear plane // (left) and X (right) to the longitudinal axes of the columnar grains. (a–d) Optical micrographs taken from the top and bottom regions of the fully deformed cross sections, as illustrated for each subfigure. Black and white hatchings indicate the orientation of intra- and inter-granular deformation bands. (e–h) Color-coded orientation maps superimposed with the image quality maps obtained from EBSD measurements in the bottom region of the fully deformed cross sections. The step sizes of the measurements were 1.5 µm and 0.5 µm for overview measurements (e,f) and detail views (g,h), respectively.
In the upper section of the billet processed with the initial orientation //, there are narrow horizontal bands that occur only within some grains (see arrows in the inset in Figure 6a). In contrast, the bands in the lower section of the billet are much broader and span across several grains (c). These bands are characterized by crystal orientations near <104> or <313> (e) and contain lamellar sub-grains (g). The formation of bands for this sample orientation is likely to result from the activation of different slip systems that contribute with similar amounts to the macroscopic plastic deformation but also entail crystal rotation towards different stable orientations. The local differences regarding shear banding in the upper and lower billet sections fall in line with the strain gradient that was also documented in the visio-plastic flow line analysis (see Figure 4).
For sample orientation X, the bands are generally oriented at different angles within former grains (Figure 6a,c). EBSD analysis of bands located in the lower section of the deformed billet (Figure 6f) showed that they exhibit crystal orientations of <101> for one type of band and more complex orientations with a maximum near <104>, which is close to the initial orientation of the cast material, as well as a wider spread of orientations for the other bands. The bands with an orientation near <101> consist of fine globular sub-grains (1, see Figure 6h) with a high density of low-angle grain boundaries. The bands with the more complex orientation exhibit comparatively coarse, horizontally elongated substructures (2) with a lower density of low-angle grain boundaries. This may indicate local strain partitioning with a higher degree of deformation in the bands with smaller sub-grain size (1), which is supported by the fact that the grain boundaries within these bands exhibit significantly higher tilt angles after shearing (see Figure 5f). Comparing the microstructural observations for the two different sample orientations, we note in passing that the somewhat finer bands for // correlate with a higher hardness level, whereas strain partitioning (which results in a bimodal structure) for X leads to the lower hardness level, as indicated in Figure 4c.
The texture measurements by means of XRD were performed at three locations on the fully deformed cross sections in order to obtain global texture information and to compare them with our local EBSD data. The corresponding pole figures are given in Figure 7. For sample orientation //, the preferred crystal orientation <313> in the upper region of the billet (a) corresponds to an orientation between <111> and <110>. In the center of the deformed billet (b), the preferred crystal orientation is similar, but the texture is less pronounced. In the lower region (c), two crystal orientations are present simultaneously: in addition to the <111> orientation already documented in the middle and upper area of the semi-finished product, there is a <100> orientation. The occurrence of two orientations in the lower semi-finished product area is consistent with the microstructural observation of the formed band structures. For sample direction X, the preferred orientation of the crystals is close to <100> for all measurement positions (top, middle, and bottom of the billet). While the proportion of <110>-oriented crystals apparent in the color-coded orientation image cannot be identified in the pole figures obtained from XRD, the dominant <100> orientation agrees well with the predominant texture component determined using EBSD (see Figure 4 and Figure 5).
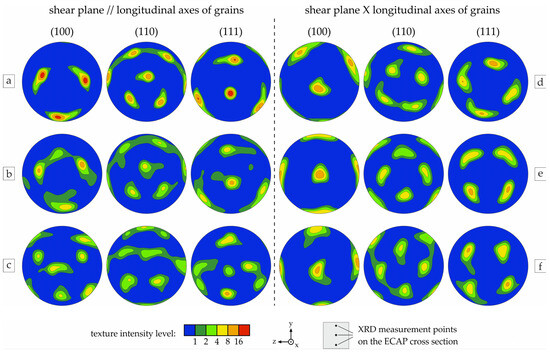
Figure 7.
Pole figures obtained from XRD measurements on fully deformed cross sections after ECAP with the orientations // (a–c) and X (d–f).
In closing, we briefly attempt to combine our observations of local flow lines, microstructural changes, and local and global texture changes into a coherent picture. Our observations of the orientation changes in the elongated grains, which are fully in line with the theoretical considerations embodied in Equations (3)–(5), show that the elongated grains in the case of // orientation need to rotate only a little, and that the main shear deformation can proceed primarily by plastic slip on slip planes that are close to the longitudinal grain axes. In contrast, for orientation X, the pronounced rotation required by the ECAP process also needs to be generated by plastic slip on available slip systems. This necessitates slip on crystallographic planes that are more strongly inclined away from the longitudinal grain axes—and that provide considerably shorter mean free paths for dislocation movement. Dislocation slip, consequently, is impeded by the high density of grain boundaries in slip direction, and the much more frequent interaction of dislocations with grain boundaries is likely to affect the hardening behavior, the local stress state in the PDZ, and thus, ultimately, the distribution of n-values across the billet’s cross-section. This may well explain why the distribution of n-values for X differs more strongly from the monotonic increase typically observed in metals with initially globular grains, and why the X orientation is more prone to pronounced strain partitioning by shear banding. The resulting microstructure, consisting of less deformed bands adjacent to severely deformed bands, notably leads to a lower hardness level compared to the // orientation. Ultimately, the measured hardness distributions (Figure 4c) are affected by the increased anisotropy and complexity of the band structures documented here for the first time, and more detailed investigations by nanoindentation (ideally in different loading directions) are envisioned as a possible approach to fully understand these interesting results. Even though more advanced modeling approaches, like the self-consistent visco-plastic model employed by Beyerlein and Tomé [45], may be needed to mathematically describe the texture changes documented in the present study, our results strongly highlight the effect of grain orientation and microstructural anisotropy on microstructural evolution, and particularly on the phenomenon of strain partitioning by shear banding.
4. Summary and Conclusions
In this study we have analyzed the deformation behavior of a commercially pure aluminum alloy with coarse, directionally grown columnar grains during ECAP. For the two examined sample orientations—with the longitudinal axes of the grains tilted either in the same direction as the ECAP shear plane (//) or opposite to it (X)—the local material flow and microstructural evolution differ significantly. For sample orientation //, the resulting material flow is more in line with the conventional deformation behavior of polycrystalline materials. The microstructure is characterized by narrow, elongated grains oriented parallel to the direction of shearing. Horizontal band-like structures near the bottom of the billet likely result from activation of different slip systems in adjacent regions within the coarse grains. The more complex type of shear banding with bands oriented perpendicular to the direction of shearing observed in the lower section of the billet for sample orientation X has not yet been reported for polycrystalline materials. The different characteristics in sub-grain morphology indicate that some kind of strain partitioning takes place, similar to our previous observations of shear bands and matrix bands in alternating structures in an AA6060 aluminum alloy. Clearly, shear banding phenomena can be observed in a wider class of materials, and it is likely that suitable pre-ECAP textures are needed to trigger this interesting effect.
Author Contributions
Conceptualization, N.B. and M.F.-X.W.; methodology, N.B.; software, N.B.; validation, N.B. and M.F.-X.W.; formal analysis, N.B.; investigation N.B.; resources, M.F.-X.W.; data curation, N.B.; writing—original draft preparation, N.B.; writing—review and editing, M.F.-X.W.; visualization, N.B.; supervision, M.F.-X.W.; project administration, M.F.-X.W.; funding acquisition, M.F.-X.W. All authors have read and agreed to the published version of the manuscript.
Funding
This research was funded by the German Research Foundation (Deutsche Forschungsgemeinschaft, DFG) in the project WA 2602/19-1.
Data Availability Statement
The original contributions presented in this study are included in the article. Further inquiries can be directed to the corresponding author.
Acknowledgments
The authors would like to thank Tom Petschowsky for his assistance in carrying out the ECAP experiments and Jenny Roßmann for carrying out the hardness measurements.
Conflicts of Interest
The authors declare no conflicts of interest.
Abbreviations
The following abbreviations are used in this manuscript:
| CD | Casting Direction |
| EBSD | Electron-Backscatter Diffraction |
| ECAP | Equal-Channel Angular Pressing |
| PDZ | Plastic Deformation Zone |
| RD | Radial Direction |
| XRD | X-ray Diffraction |
References
- Srinivasan, R.; Cherukuri, B.; Chaudhury, P.K. Scaling up of Equal Channel Angular Pressing (ECAP) for the Production of Forging Stock. In Proceedings of the 3rd International Conference on Nanomaterials by Severe Plastics Deformation, NanoSPD3, Fukuoka, Japan, 22–26 September 2005; Trans Tech Publications Ltd.: Fukuoda, Japan, 2006; pp. 371–378. [Google Scholar]
- Sun, J.; Xu, B.; Yang, Z.; Zhuo, X.; Han, J.; Wu, Y.; Song, D.; Liu, H.; Jiang, J.; Ma, A. Developing an Industrial-Scale ECAP Mg-Al-Zn Alloy with Multi-Heterostructure for Synchronously High Strength and Good Ductility. Mater. Charact. 2020, 164, 110341. [Google Scholar] [CrossRef]
- Awasthi, A.; Gupta, A.; Saxena, K.K.; Diwedi, R.K. Equal Channel Angular Processing on Aluminium and Its Alloys—A Review. Mater. Today Proc. 2022, 56, 2388–2391. [Google Scholar] [CrossRef]
- Varone, A.; Fabrizi, A.; Ferro, P.; Montanari, R.; Berto, F.; Bonollo, F. AZ31 Alloy Produced by ECAP: Metallurgical and Mechanical Investigation. J. Mater. Sci. 2024, 60, 495–518. [Google Scholar] [CrossRef]
- Chinna Maddaiah, K.; Naresh, K.; Veeresh Kumar, G.B.; Pramod, R.; Baburao, T.; Rama Sreekanth, P.S. Influence of Equal Channel Angular Extrusion on Mechanical Characteristics and Associated Microstructural Changes of Aluminum, Copper, Titanium and Magnesium Alloys and Their Metal Matrix Composites—A Review. J. Test. Eval. 2023, 51, 1219–1252. [Google Scholar] [CrossRef]
- Bian, Y.L.; Feng, Z.D.; Zhang, N.B.; Li, Y.X.; Wang, X.F.; Zhang, B.B.; Cai, Y.; Lu, L.; Chen, S.; Yao, X.H.; et al. Ultrafast Severe Plastic Deformation in High-Entropy Alloy Al0.1CoCrFeNi via Dynamic Equal Channel Angular Pressing. Mater. Sci. Eng. A 2022, 847, 143221. [Google Scholar] [CrossRef]
- Naseri, M.; Moghadam, A.O.; Anandkumar, M.; Sudarsan, S.; Bodrov, E.; Samodurova, M.; Trofimov, E. Enhancing the Mechanical Properties of High-Entropy Alloys through Severe Plastic Deformation: A Review. J. Alloys Metall. Syst. 2024, 5, 100054. [Google Scholar] [CrossRef]
- Hendriok, L.; Nienaber, M.; Kurz, G.; Ben Khalifa, N. Die Geometry Influence on the Texture and Microstructure Development during Extrusion of AZ31 and ZK60 Magnesium Alloy Chips. Mater. Des. 2025, 249, 113545. [Google Scholar] [CrossRef]
- Krolo, J.; Gudić, S.; Vrsalović, L.; Lela, B.; Dadić, Z. Fatigue and Corrosion Behavior of Solid-State Recycled Aluminum Alloy EN AW 6082. J. Mater. Eng. Perform. 2020, 29, 4310–4321. [Google Scholar] [CrossRef]
- Iwahashi, Y.; Wang, J.; Horita, Z.; Nemoto, M.; Langdon, T.G. Principle of Equal-Channel Angular Pressing for the Processing of Ultra-Fine Grained Materials. Scr. Mater. 1996, 35, 143–146. [Google Scholar] [CrossRef]
- Skrotzki, W. Deformation Heterogeneities in Equal Channel Angular Pressing. Mater. Trans. 2019, 60, 1331–1343. [Google Scholar] [CrossRef]
- da Silva Lima, M.N.; Rodrigues, S.F.; Al-Maharbi, M.; Muñoz, J.C.; Cabrera Marrero, J.M.; Gomes de Abreu, H.F. Effect of ECAP Processing Temperature on an Austenitic TWIP Steel’s Microstructure, Texture and Mechanical Properties. J. Mater. Res. Technol. 2023, 24, 1757–1775. [Google Scholar] [CrossRef]
- Gupta, A.; Saxena, K.K.; Bharti, A.; Lade, J.; Chadha, K.; Paresi, P.R. Influence of ECAP Processing Temperature and Number of Passes on Hardness and Microstructure of Al-6063. Adv. Mater. Process. Technol. 2022, 8, 1635–1646. [Google Scholar] [CrossRef]
- Li, S.; Bourke, M.A.M.; Beyerlein, I.J.; Alexander, D.J.; Clausen, B. Finite Element Analysis of the Plastic Deformation Zone and Working Load in Equal Channel Angular Extrusion. Mater. Sci. Eng. A 2004, 382, 217–236. [Google Scholar] [CrossRef]
- Suo, T.; Li, Y.; Guo, Y.; Liu, Y. The Simulation of Deformation Distribution during ECAP Using 3D Finite Element Method. Mater. Sci. Eng. A 2006, 432, 269–274. [Google Scholar] [CrossRef]
- Panigrahi, A.; Scheerbaum, N.; Chekhonin, P.; Scharnweber, J.; Beausir, B.; Hockauf, M.; Sankaran, S.; Skrotzki, W. Effect of Back Pressure on Material Flow and Texture in ECAP of Aluminum. IOP Conf. Ser. Mater. Sci. Eng. 2014, 63, 012153. [Google Scholar] [CrossRef]
- Mckenzie, P.W.J.; Lapovok, R.; Estrin, Y. The Influence of Back Pressure on ECAP Processed AA 6016: Modeling and Experiment. Acta Mater. 2007, 55, 2985–2993. [Google Scholar] [CrossRef]
- Daghigh, M.; Mohri, M.; Nili-ahmadabadi, M. Tailoring Deformation Homogeneity of WE43 Alloy through Strain Rate Sensitivity and Back Pressure during Equal Channel Angular Pressing. J. Mater. Eng. Perform. 2024, 33, 12604–12619. [Google Scholar] [CrossRef]
- An, X.H.; Wu, S.D.; Zhang, Z.F. Influence of Stacking Fault Energy on the Microstructures and Grain Refinement in the Cu-Al Alloys during Equal-Channel Angular Pressing. Mater. Sci. Forum 2011, 667–669, 379–384. [Google Scholar] [CrossRef]
- Asano, M.; Yuasa, M.; Miyamoto, H. Effects of Stacking Fault Energy and Solute Atoms on Microstructural Evolution of Cu, Ag and Cu–Al Alloys Processed by Equal Channel Angular Pressing. Mater. Sci. Eng. A 2021, 803, 140716. [Google Scholar] [CrossRef]
- Fukuda, Y.; Oh-Ishi, K.; Furukawa, M.; Horita, Z.; Langdon, T.G. Influence of Crystal Orientation on the Processing of Copper Single Crystals by ECAP. J. Mater. Sci. 2007, 42, 1501–1511. [Google Scholar] [CrossRef]
- Meng, Q.; Yang, X.; Liu, X.; Luo, L. Effects of Initial Grain Size on Microstructure and Properties of Pure Ti Processed by ECAP. Rare Met. Mater. Eng. 2022, 51, 1949–1956. [Google Scholar] [CrossRef]
- Bian, L.; Liu, X.; Wang, T.; Liang, W.; Zheng, Y. Influence of Various Initial Microstructures on Microstructure and Mechanical Property of ECAP Processed Mg-8.4Li-3.58Al-0.36Si-0.05Ti-0.01B Alloys. Mater. Sci. Eng. A 2023, 872, 144022. [Google Scholar] [CrossRef]
- Frint, P.; Wagner, M.F.-X. Strain Partitioning by Recurrent Shear Localization during Equal-Channel Angular Pressing of an AA6060 Aluminum Alloy. Acta Mater. 2019, 176, 306–317. [Google Scholar] [CrossRef]
- Fukuda, Y.; Oh-ishi, K.; Furukawa, M.; Horita, Z.; Langdon, T.G. The Application of Equal-Channel Angular Pressing to an Aluminum Single Crystal. Acta Mater. 2004, 52, 1387–1395. [Google Scholar] [CrossRef]
- Fukuda, Y.; Oh-ishi, K.; Furukawa, M.; Horita, Z.; Langdon, T.G. Influence of Crystal Orientation on ECAP of Aluminum Single Crystals. Mater. Sci. Eng. A 2006, 420, 79–86. [Google Scholar] [CrossRef]
- Furukawa, M.; Kawasaki, Y.; Miyahara, Y.; Horita, Z.; Langdon, T.G. An Investigation of the Deformation Process during Equal-Channel Angular Pressing of an Aluminum Single Crystal. Mater. Sci. Eng. A 2005, 410–411, 194–200. [Google Scholar] [CrossRef]
- Miyamoto, H.; Ikeda, T.; Uenoya, T.; Vinogradov, A.; Hashimoto, S. Reversible Nature of Shear Bands in Copper Single Crystals Subjected to Iterative Shear of ECAP in Forward and Reverse Directions. Mater. Sci. Eng. A 2011, 528, 2602–2609. [Google Scholar] [CrossRef]
- Guo, T.; Wei, S.; Wang, C.; Li, Q.; Jia, Z. Texture Evolution and Strengthening Mechanism of Single Crystal Copper During ECAP. Mater. Sci. Eng. A 2019, 759, 97–104. [Google Scholar] [CrossRef]
- Grosdidier, T.; Fundenberger, J.J.; Goran, D.; Bouzy, E.; Suwas, S.; Skrotzki, W.; Tóth, L.S. On Microstructure and Texture Heterogeneities in Single Crystals Deformed by Equal Channel Angular Extrusion. Scr. Mater. 2008, 59, 1087–1090. [Google Scholar] [CrossRef]
- Syarif, J.; Altoyuri, A.; Mohamed, I.F. Equal Channel Angular Pressing of Single Crystal Aluminum: A Molecular Dynamics Simulation. J. Mater. Res. Technol. 2022, 17, 888–897. [Google Scholar] [CrossRef]
- Altoyuri, A.H.; Syarif, J.; Sajuri, Z. Deformation Behavior of Single-Crystal Magnesium during Nano-ECAP Simulation. Heliyon 2022, 8, e11837. [Google Scholar] [CrossRef]
- Yang, P.; Zhang, H.; Luan, T.; Jin, Y. Molecular Dynamics Analysis of Microstructural Deformation Mechanisms in Single Crystal Copper Undergoing Equal Channel Angular Pressing. AIP Adv. 2025, 15, 015110. [Google Scholar] [CrossRef]
- Lee, C.S.; Duggan, B.J.; Smallman, R.E. A Theory of Deformation Banding in Cold Rolling. Acta Metall. Mater. 1993, 41, 2265–2270. [Google Scholar] [CrossRef]
- Zhu, L.; Seefeldt, M.; Verlinden, B. Deformation Banding in a Nb Polycrystal Deformed by Successive Compression Tests. Acta Mater. 2012, 60, 4349–4358. [Google Scholar] [CrossRef]
- Tóth, L.S. Texture Evolution in Severe Plastic Deformation by Equal Channel Angular Extrusion. Adv. Eng. Mater. 2003, 5, 308–316. [Google Scholar] [CrossRef]
- Tóth, L.S.; Massion, R.A.; Germain, L.; Baik, S.C.; Suwas, S. Analysis of Texture Evolution in Equal Channel Angular Extrusion of Copper Using a New Flow Field. Acta Mater. 2004, 52, 1885–1898. [Google Scholar] [CrossRef]
- Berndt, N.; Böhme, M.; Wagner, M.F.-X. Multi-Gradient Structures by Cold Extrusion of Strongly Textured Continuously Cast Commercially Pure Aluminum. J. Mater. Res. Technol. 2024, 31, 1355–1366. [Google Scholar] [CrossRef]
- Wagner, M.F.-X.; Nostitz, N.; Frint, S.; Frint, P.; Ihlemann, J. Plastic Flow During Equal-Channel Angular Pressing with Arbitrary Tool Angles. Int. J. Plast. 2020, 134, 102755. [Google Scholar] [CrossRef]
- Berndt, N.; Reiser, N.A.; Wagner, M.F.-X. Evolution of Plastic Deformation during Multi-Pass ECAP of an AA6060 Aluminum Alloy—An Experimental Flow Line Analysis. J. Mater. Res. Technol. 2025, 34, 359–371. [Google Scholar] [CrossRef]
- Bachmann, F.; Hielscher, R.; Schaeben, H. Texture Analysis with MTEX- Free and Open Source Software Toolbox. Solid State Phenom. 2010, 160, 63–68. [Google Scholar] [CrossRef]
- Niemann, R.; Hahn, S.; Diestel, A.; Backen, A.; Schultz, L.; Nielsch, K.; Wagner, M.F.-X.; Fähler, S. Reducing the Nucleation Barrier in Magnetocaloric Heusler Alloys by Nanoindentation. APL Mater. 2016, 4, 064101. [Google Scholar] [CrossRef]
- Schleifenbaum, S.; Prietzel, T.; Aust, G.; Boldt, A.; Fritsch, S.; Keil, I.; Koch, H.; Möbius, R.; Scheidt, H.A.; Wagner, M.F.X.; et al. Acellularization-Induced Changes in Tensile Properties Are Organ Specific—An In-Vitro Mechanical and Structural Analysis of Porcine Soft Tissues. PLoS ONE 2016, 11, e0151223. [Google Scholar] [CrossRef] [PubMed]
- Rade, L.; Westergren, B. Mathematics Handbook for Science and Engineering, 5th ed.; Springer: Berlin/Heidelberg, Germany, 2004. [Google Scholar]
- Beyerlein, I.J.; Tomé, C.N. Analytical modeling of material flow in equal channel angular extrusion (ECAE). Mater. Sci. Eng. A 2004, 380, 171–190. [Google Scholar] [CrossRef]


Disclaimer/Publisher’s Note: The statements, opinions and data contained in all publications are solely those of the individual author(s) and contributor(s) and not of MDPI and/or the editor(s). MDPI and/or the editor(s) disclaim responsibility for any injury to people or property resulting from any ideas, methods, instructions or products referred to in the content. |
© 2025 by the authors. Licensee MDPI, Basel, Switzerland. This article is an open access article distributed under the terms and conditions of the Creative Commons Attribution (CC BY) license (https://creativecommons.org/licenses/by/4.0/).