Article

Electrodeposition and Corrosion Behavior of Cu-Sn Alloys in 3.5 wt.% NaCl and 0.1 M HNO3 Solutions

1
Key Laboratory of Near-Net Forming of Light Metals of Liaoning Province, Dalian Jiaotong University, Dalian 116028, China
2
Engineering Research Center of Continuous Extrusion, Ministry of Education, Dalian Jiaotong University, Dalian 116028, China
*
Author to whom correspondence should be addressed.
Metals 2025, 15(4), 426; https://doi.org/10.3390/met15040426
Submission received: 6 March 2025 / Revised: 9 April 2025 / Accepted: 9 April 2025 / Published: 10 April 2025

Abstract

:
In this study, Cu-Sn alloys with varying compositions were synthesized using nickel sulfate as a structure-directing agent during electrodeposition. The crystalline structure of the alloys and the influence of nickel sulfate on the morphology were systematically investigated. The corrosion behavior of these alloys was examined in 3.5 wt.% NaCl and 0.1 M HNO3 solutions using kinetic potential polarization and electrochemical impedance spectroscopy (EIS) techniques. X-ray diffractometry (XRD), scanning electron microscopy (SEM), and X-ray photoelectron spectroscopy (XPS) were employed to analyze the corrosion products of the alloys. The result revealed that the absolute value of corrosion potential of Cu43Sn57 alloy prepared by adding nickel sulfate in 3.5 wt. % NaCl solution decreased from 0.259 V to 0.186 V, and the corrosion current density decreased from 9.456 × 10⁻⁶ mA cm−2 to 1.248 × 10⁻⁶ mA cm−2. In 0.1 M HNO3 solution, the absolute values of corrosion potential of Cu43Sn57 alloy prepared by adding nickel sulfate decreased from 0.065 V to 0.028 V, and the corrosion current density decreased from 5.384 × 10⁻⁵ mA cm−2 to 2.63 × 10⁻⁵ mA cm−2. This research contributes to the understanding of how structural modification affects the electrochemical performance of Cu-Sn alloys.

1. Introduction

Cu-Sn alloys find extensive application across diverse sectors, including shipbuilding, marine engineering, electronic and electrical equipment, machinery manufacturing, and decorative art, due to their excellent polishing properties, corrosion resistance, and hardness [1]. These alloys often function in highly challenging environments, such as seawater, chemical contamination, and high temperatures, making it crucial to investigate the corrosion behavior of Cu-Sn alloys [2]. In recent years, one effective strategy to enhance the corrosion resistance of materials has been by forming a dense and stable microstructure [3]. Dense metals typically represent fine-grained, tightly arranged morphologies with fewer defects. This structural characteristic reduces the diffusion pathways for corrosive media within the material, thereby decreasing the corrosion rate and improving corrosion resistance.
Currently, there are many methods for the preparation of Cu-Sn alloys, including metallurgical deposition [4], vapor phase deposition [5], electrodeposition [6,7], etc. Among them, the metallurgical deposition process shows various advantages, especially in fine control, complex shape treatment, surface engineering, and repair and remanufacturing [8]. However, this technique is relatively complex to operate. Vapor deposition technology allows for high purity and diverse material selection with tight bonding [9], but it has drawbacks such as high equipment cost, high operating requirements, and limited deposition rate. In comparison, electrodeposition techniques stand out for their numerous advantages [10]. The composition and morphology can be tailored through modulation of deposition parameters and deposits are adaptable to a wide variety of substrates. In addition, electrodeposition allows for the co-deposition of a wide range of ions into composites, including ceramic and metal particles into polymer matrices and nanoparticles into alloy matrices, which offer excellent mechanical properties, lightweight characteristics, and impressive thermal conductivity and corrosion resistance [11,12].
So far, studies on the preparation of Cu-Sn alloys using electrodeposition techniques have focused on the effect of different electrolyte systems on the morphology of Cu-Sn alloys. For example, Bengoa et al. demonstrated that the electrodeposition of Cn-Sn alloy in benzyl alcohol methane sulfonic acid electrolyte yielded a morphology with small spherical protrusions composed of Cu, α-CuSn, ε-Cu3Sn, and h0-Cu6Sn5 [13]. Meng et al. suggested that pyrophosphate-based electrolytes can also be used to obtain Cu-Sn alloy coatings with dispersed clusters [14]. Pewnim et al. electrodeposited Cu-Sn coatings consisting of tetragonal tin and hexagonal Cu-Sn intermetallic compounds in methane sulphonic acid electrolyte solution [7]. These works show that different electrodeposition parameters have a significant effect on the morphology of electrodeposited Cu-Sn alloys.
Research indicates that structure-directing agents are frequently employed in electroplating to achieve several key objectives: obtaining clean metal surfaces [15], optimizing the size of deposited crystals [16], minimizing pitting [17], and forming various distinct morphologies such as pinecone [18,19], cone [20], sphere [21], and sponge-like structures [22,23]. According to Guglielmi’s two-step weak adsorption theory [24,25], structure-directing agents improve the wettability and suspension of particles in the plating solution. So far, the commonly used structure-directing agents are citric acid (CA), tetrabutylammonium bromide (TBR), etc. P. Sivasakthi et al. [26] used citric acid in the preparation of nickel by pulsed electrodeposition technique, which effectively changed the surface morphology of the nickel from loose cones to a spongy structure. This significant structural change improved the electrocatalytic activity of nickel in glycerol oxidation, enabling it to exhibit higher activity and lower onset potential for electrocatalytic applications. Meilin Zhang et al. proposed [27] that mesoporous Pt-Co films are successfully prepared by micelle-assisted electrodeposition using Pluronic F127 as a structure-directing agent, which exhibited excellent electrocatalytic hydrogen evolution performance over commercial Pt/C and exhibited remarkable durability in the 24 h long-term aging stability test. Yuxi Chen et al. proposed [28] that copper–nickel foam thin films are successfully prepared by adding a uniform magnetic field during electrodeposition using hydrogen bubbles as a template, which exhibited the highest hydrogen reactivity. In this study, we prepared alloys with different Cu-Sn contents by adding nickel sulfate as a structure-directing agent during Cu-Sn electrodeposition and investigated the corrosion behavior of Cu-Sn alloys in 3.5 wt.% NaCl solution and 0.1 M HNO3 solution, respectively. The corrosion behavior of Cu43Sn57 and Cu56Sn44 was investigated using kinetic potential polarization and electrochemical impedance spectroscopy (EIS) techniques. The surface products were analyzed by X-ray diffractometry (XRD), scanning electron microscopy (SEM), and X-ray photoelectron spectroscopy (XPS). This study not only reveals the regulatory mechanism of nickel sulfate on the corrosion performance of copper–tin alloys, but also provides a theoretical basis and practical guidance for the development of new corrosion-resistant copper-based alloys.

2. Materials and Methods

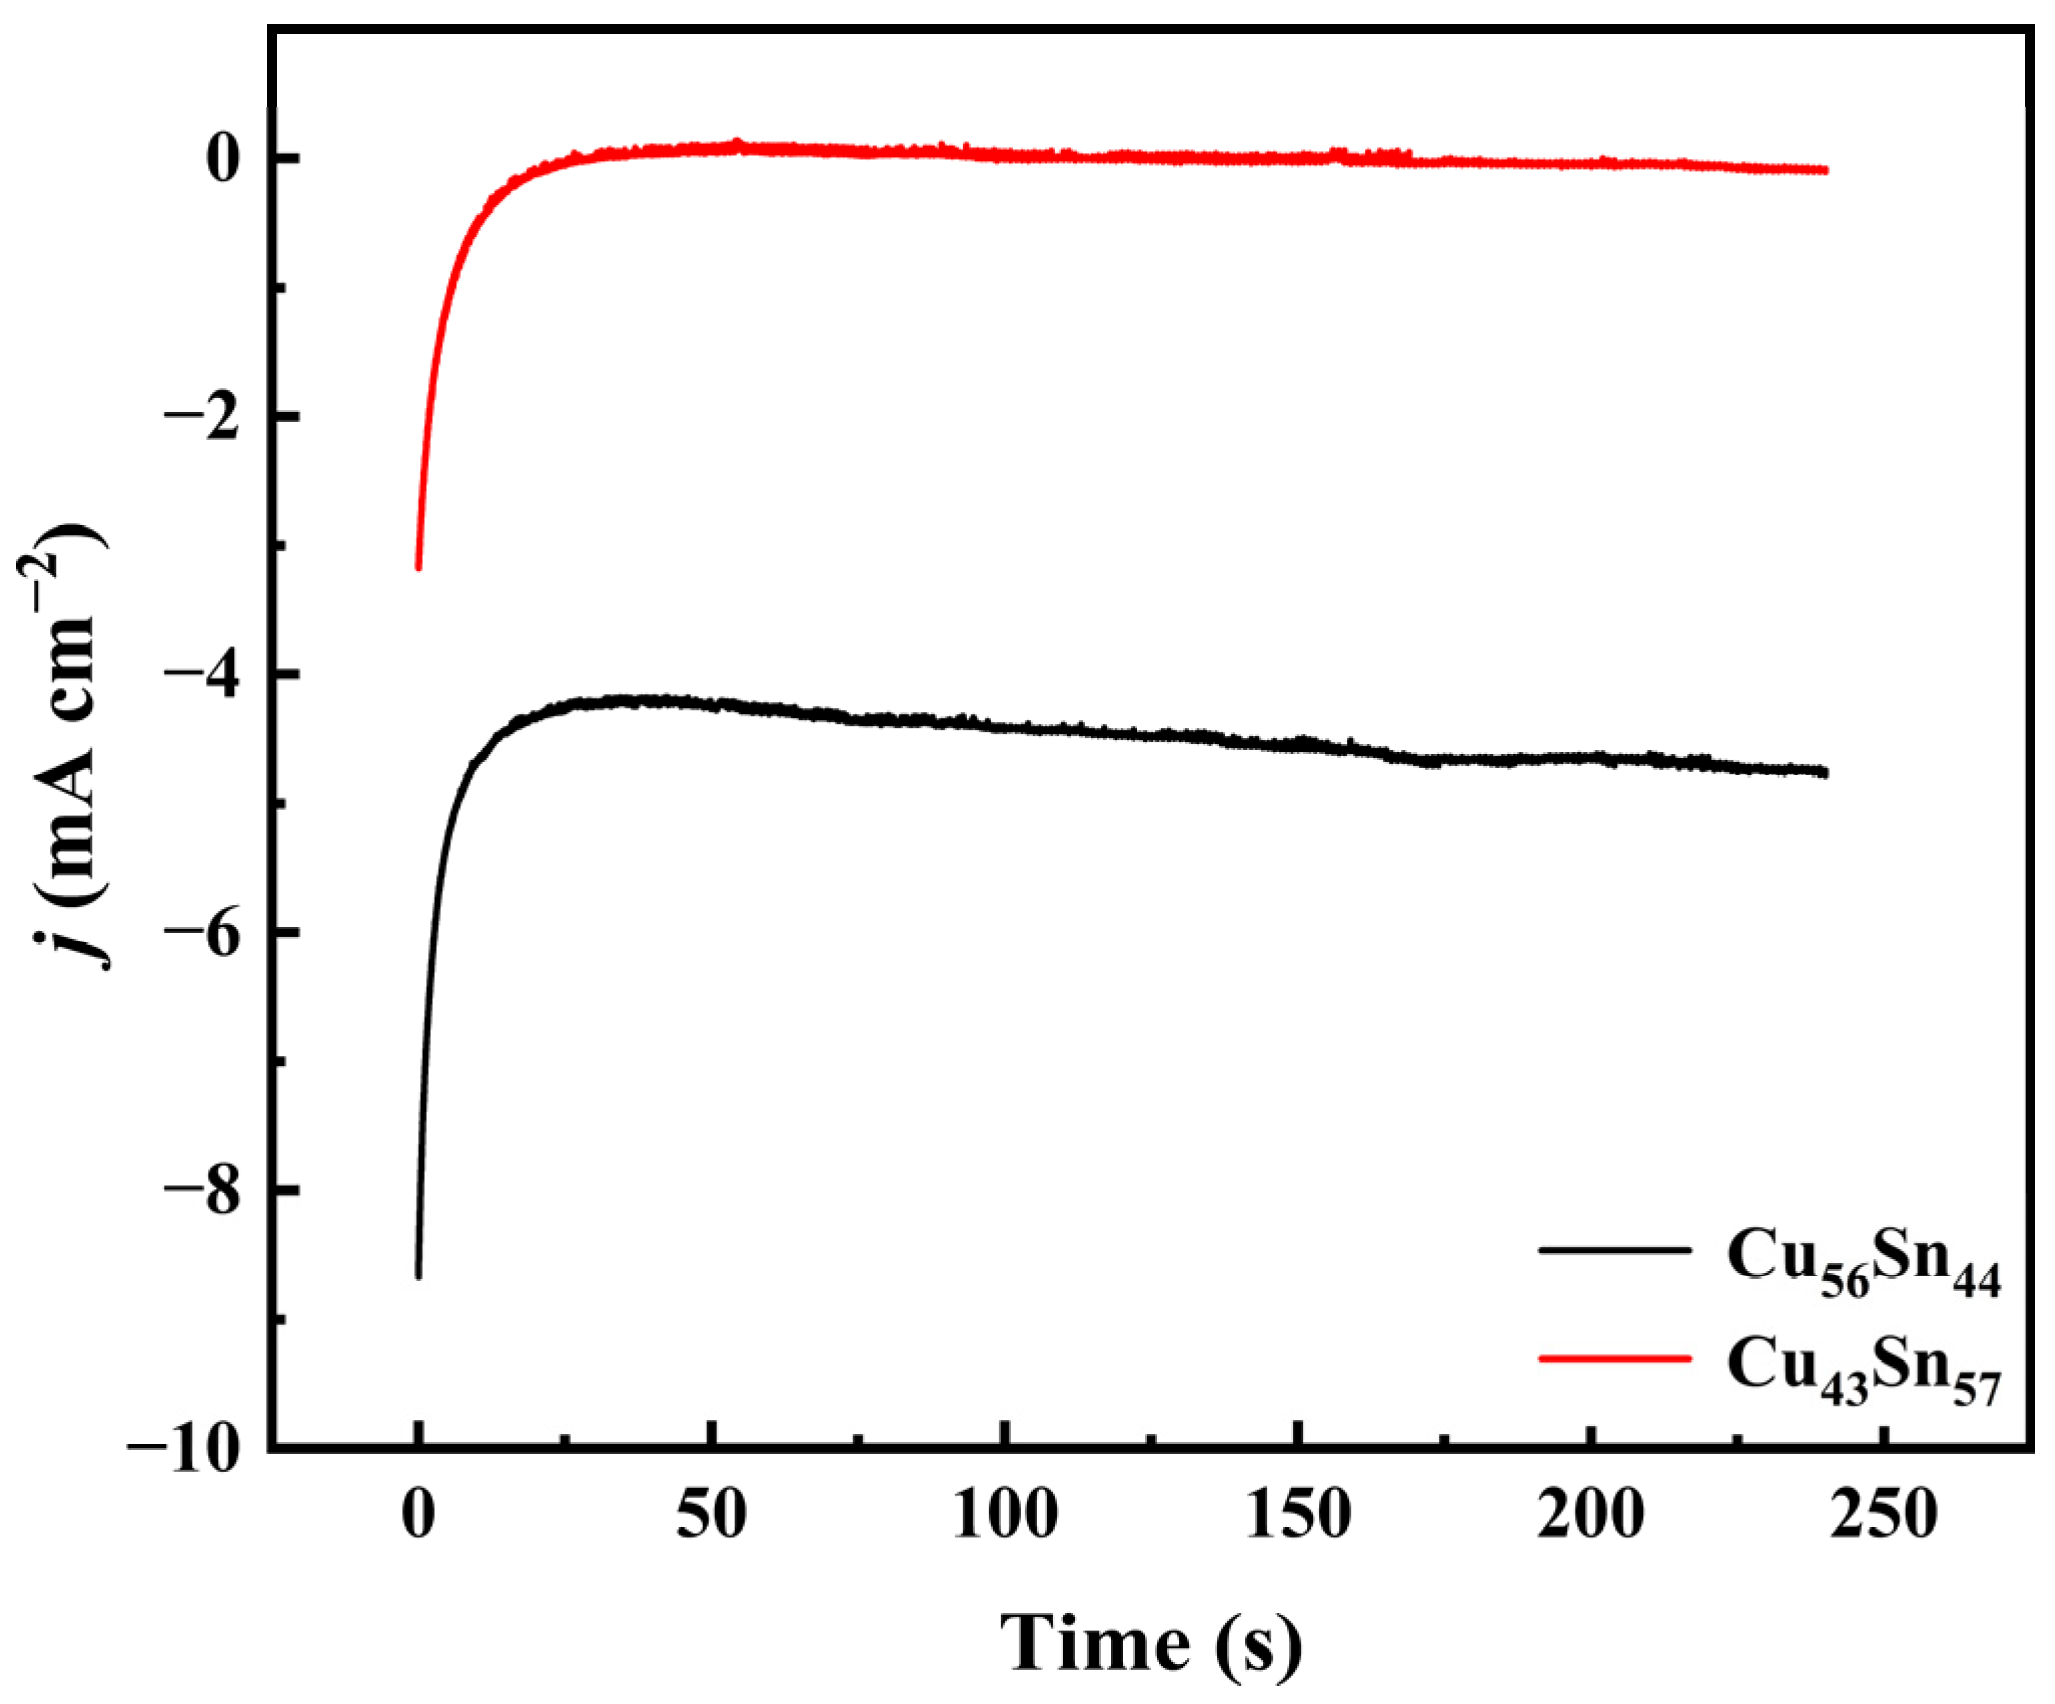
2.1. Synthesis of Cu-Sn Alloys

Electrodeposition was performed using 100 mL of electrolyte consisting of 368 g/L NiSO4·6H2O, 62.4 g/L CuSO4·5H2O, 62.2 g/L C7H8O7·H2O (citric acid monohydrate), 0.2 g/L NaC12H25SO4 (sodium lauryl sulphate), 1.5 g/L C7H5NO3S (saccharine), and 5.0 g/L SnCl2·2H2O. Analytical-grade reagents and ultrapure water were used to prepare the electrolytes. The electrolyte used in this study was sulfate-based and contained citrate as a complexing agent; saccharin was added as it is known to cause grain refinement while inhibiting dendrite growth. Thin films were deposited in a three-electrode system connecting to a Chenhua electrochemical workstation (CHI 760 E, Chenhua, Shanghai, China). Si/Ti (25 nm)/Au (125 nm) sheets with a size of 0.5 × 1 × 0.05 cm were used as the working electrode, and the effective working area was 0.5 × 0.5 cm. A platinum wire was used as the counter electrode. Before deposition, the surface of the Au sheet was first degreased with acetone and subsequently immersed in dilute sulfuric acid to remove any oxide residues present on the Au surface. In addition, a double-junction Ag|AgCl (E = +0.210 V), which is relative to a standard hydrogen electrode (SHE), with a 3 M KCl inner solution and a 1 M NaSO4 outer solution was used as the reference electrode. Electrodeposition was carried out potential statically at −0.6 V with a stirring rate of 50 rpm at room temperature. Before each deposition, the electrolyte (100 mL) was degassed with a stream of nitrogen, and a nitrogen overlay was maintained at the top of the solution during Cu-Sn growth. Thin film samples were named according to their Cu-Sn elemental content, such as Cu56Sn44, which represents the thin film with a Cu content of 56% and a tin content of 44%.

2.2. Structural Characterization

Inductively Coupled Plasma Mass Spectrometry (ICP-MS, PerkinElmer NexION 300X, Waltham, MA, USA) was employed to measure the absolute mass of Cu and Sn in thin films. Specifically, the deposited film was dissolved in aqua regia composed of HNO3 (100%, v/v) and HCl (37%, v/v) with a volume ratio of 1:3 and diluted to ppb (part per billion) level for analysis. Moreover, a field emission scanning electron microscope (FESEM, ZEISS-SUPRA55, ZEISS, Oberkochen, Germany) equipped with energy-dispersive X-ray spectroscopy (EDX) was used to observe the surface morphology and composition of all samples. X-ray diffraction (XRD, Panalytical B.V., Almelo, The Netherlands) patterns of the Cu-Sn alloy were recorded with a Philips X’ Pert diffractometer in the 40–60° 2θ-range (step size = 0.03°, step time = 2 s) using Cu Kα radiation (λ = 0.15257 nm). Average crystallite size and phase percentages were estimated using the Rietveld full-pattern fitting procedure (GSAS software 2.2.0, EXPGUI, B. H. Toby, Gaithersburg, MD, USA version).

2.3. Electrochemical Measurements

Tests were performed using a CHI 760 E electrochemical workstation. The electrochemical measurement experiments were also carried out in a typical three-electrode system. Oxygen was removed by degassing for ten min with high-purity N2. In these studies, the electrodeposited Cu-Sn alloys were employed as the working electrode, while a platinum wafer served as the counter electrode. The reference electrode used was Ag|AgCl, which featured a 3 M potassium chloride (KCl) internal solution.
The corrosion behavior in 3.5 wt.% NaCl solution and 0.1 M nitric acid solution were investigated using electrochemical impedance spectroscopy and polarization curve analysis. Electrochemical impedance spectroscopy was performed in the frequency range of 100 kHz to 0.01 Hz at a stable open-circuit potential. CV scan activation was performed. Polarization curves were performed at a scan rate of 10 mV/s over a scan range of ±500 mV concerning the open-circuit potential. The experimentally obtained AC impedance and kinetic potential polarization curves were analyzed using ZView software 3.0.0.22. They were calculated by the following formula, Rp = (βa×βc)/[2.3(βa + βc) × I], where βa is the anodic slope of the polarization curve, βc is the cathodic slope of the polarization curve, and I is the corrosion current of the polarization curve.

3. Results and Discussion

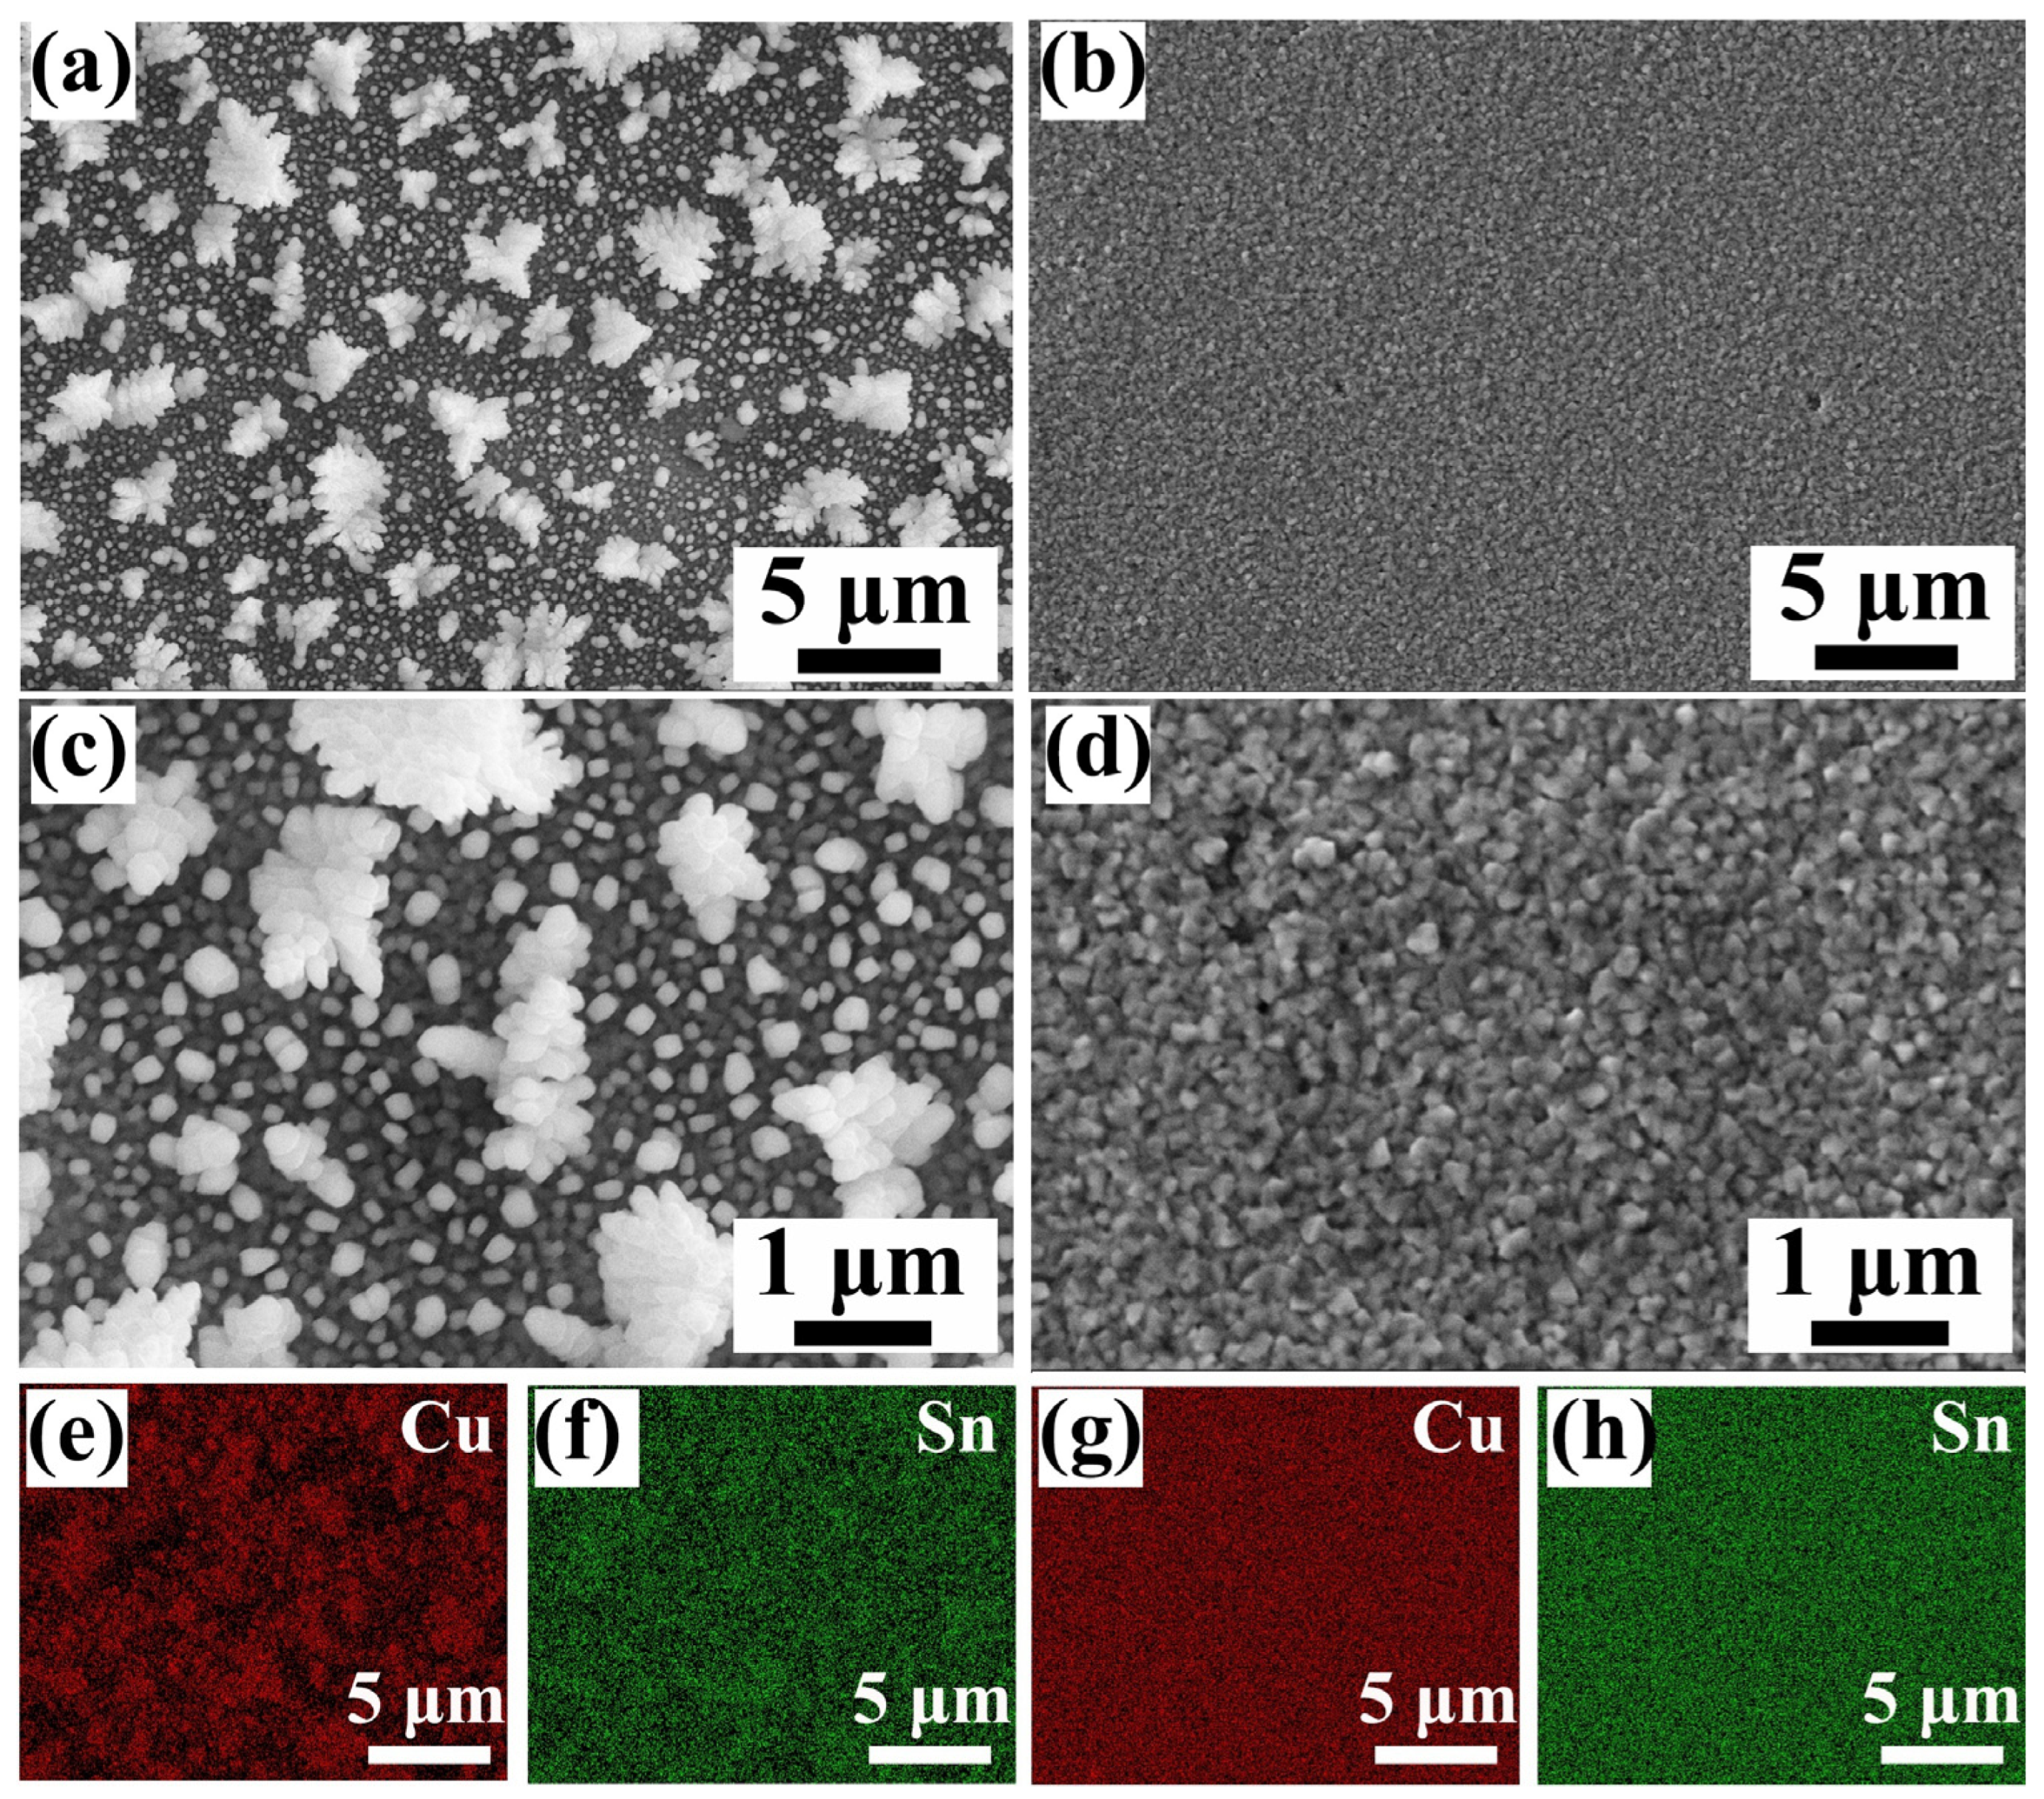
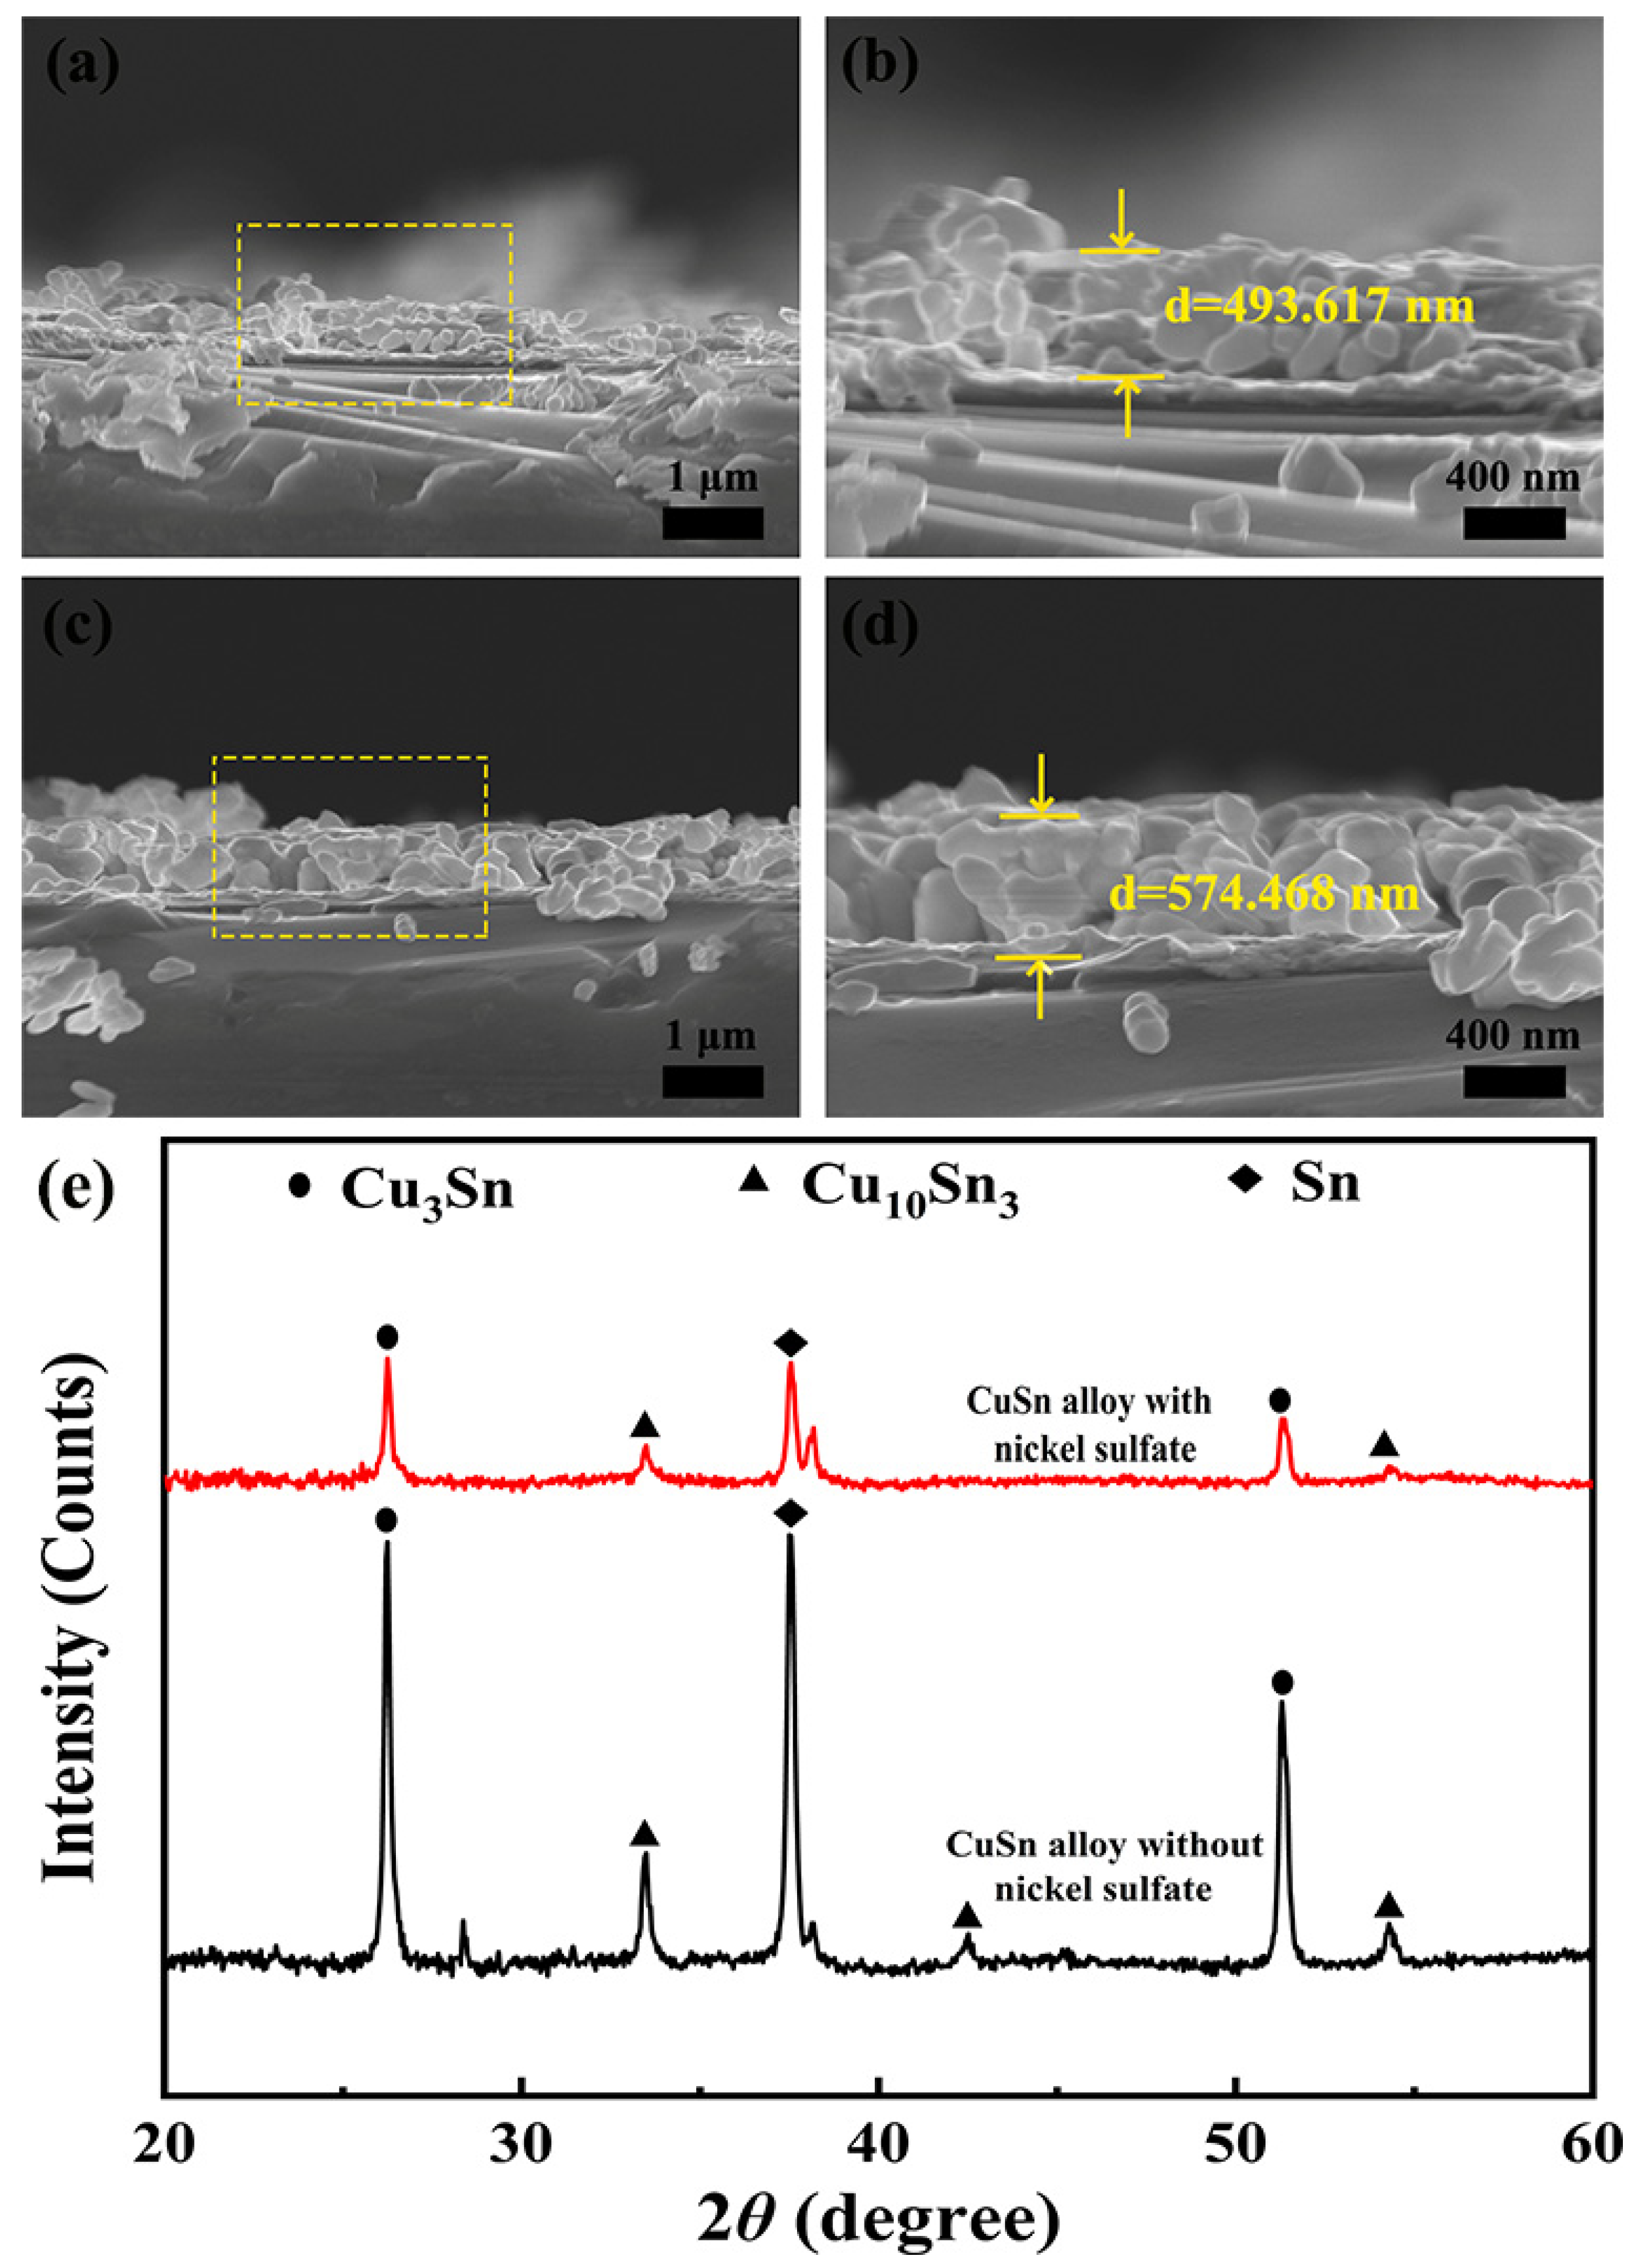
3.1. Morphology and Structure of Cu-Sn Alloys

Cu-Sn alloys with different morphologies were successfully prepared on the Au sheet by electrodeposition. The deposition process was initiated at room temperature (25 °C) while a potential of −0.6 V. ICP-MS was employed to determine the atomic percentage of the Cu-Sn films. At the same deposition potential, without the introduction of nickel sulfate, the content of Cu in the Cu-Sn film is 56% and the content of Sn is 44%, so we name it Cu56Sn44; with the introduction of nickel sulfate, the content of Cu in the Cu-Sn film is 43% and the content of Sn is 57%, so we name it Cu43Sn57. In particularly, it was found that the oxygen content did not exceed 10% by SEM-EDX monitoring for all films. And it is impossible to determine whether the oxygen in the SEM-EDS results comes from the deposited film or the substrate [29]. Therefore, the oxygen and other impurities in the film are not considered.
The morphology of Cu-Sn alloys prepared with and without NiSO4 is shown in Figure 1. These scanned images depict a uniform distribution. In the absence of nickel sulfate, the electrodeposited Cu-Sn alloys obtained a loose granular structure (Figure 1a,c). This may be due to the relatively fast reduction rate during electrodeposition. Such particles have an irregular polygonal structure, as shown in Figure 1c. When nickel sulfate is incorporated into the electrolyte, the applied potential is insufficient to reduce Ni2+, since the reduction process is controlled by charge transfer. Excessive anions in the electrolyte occupy the space near the working electrode, thereby inhibiting the reduction rate of Cu2+ and Sn2+. Consequently, in the presence of nickel sulfate, the resulting particle morphology exhibits a dense and relatively smooth structure (Figure 1b,d). The representative EDX mapping images (Figure 1e–h) show that in both samples, Cu and Sn elements are homogeneously distributed.
The results show that the more uniform distribution of major elements in the Cu43Sn57 coating at the microscopic scale, without obvious segregation, allows for the corrosion resistance to be fully realized. A typical constant potential curve of Cu-Sn deposition recorded on a Au sheet is shown in Figure 2. It is well known that structure-directing agents affect the stabilization potential of the electrodeposition curves [30]. These curves are characterized by a short initial spike followed by a relaxation of the potential towards a stable value. When NiSO4 is added, the stabilization potential value becomes smaller.
In order to investigate the differences in the phase composition of the films obtained by deposition within the electrolytes with or without the participation of nickel sulfate, the structural properties of the Cu56Sn44 and Cu43Sn57 films were investigated by X-ray diffractometry, as shown in Figure 3e. The X-ray diffraction (XRD) pattern of the Cu-Sn films consists of broad diffraction peaks. Two phases, Cu10Sn3 and Cu3Sn, can be observed in the XRD patterns. The deposits with high tin content are mainly composed of Cu10Sn3 and Cu3Sn with the addition of nickel sulfate, leading to a decrease in the intensity of the associated Cu10Sn3 and Cu3Sn peaks, which in turn corresponds to the changes in the figure. The cross-sectional microstructure of Cu56Sn44 and Cu43Sn57 is shown in Figure 3a,c, and the enlarged images after the selected areas of Figure 3a,c are shown in Figure 3b,d, respectively. According to Figure 3b,d, it can be seen that the thickness of Cu56Sn44 is about 493.617 nm and the thickness of Cu43Sn57 is about 574.468 nm. It can also be seen that the surface morphology of Cu43Sn57 has become more homogeneous and denser compared to Cu56Sn44.

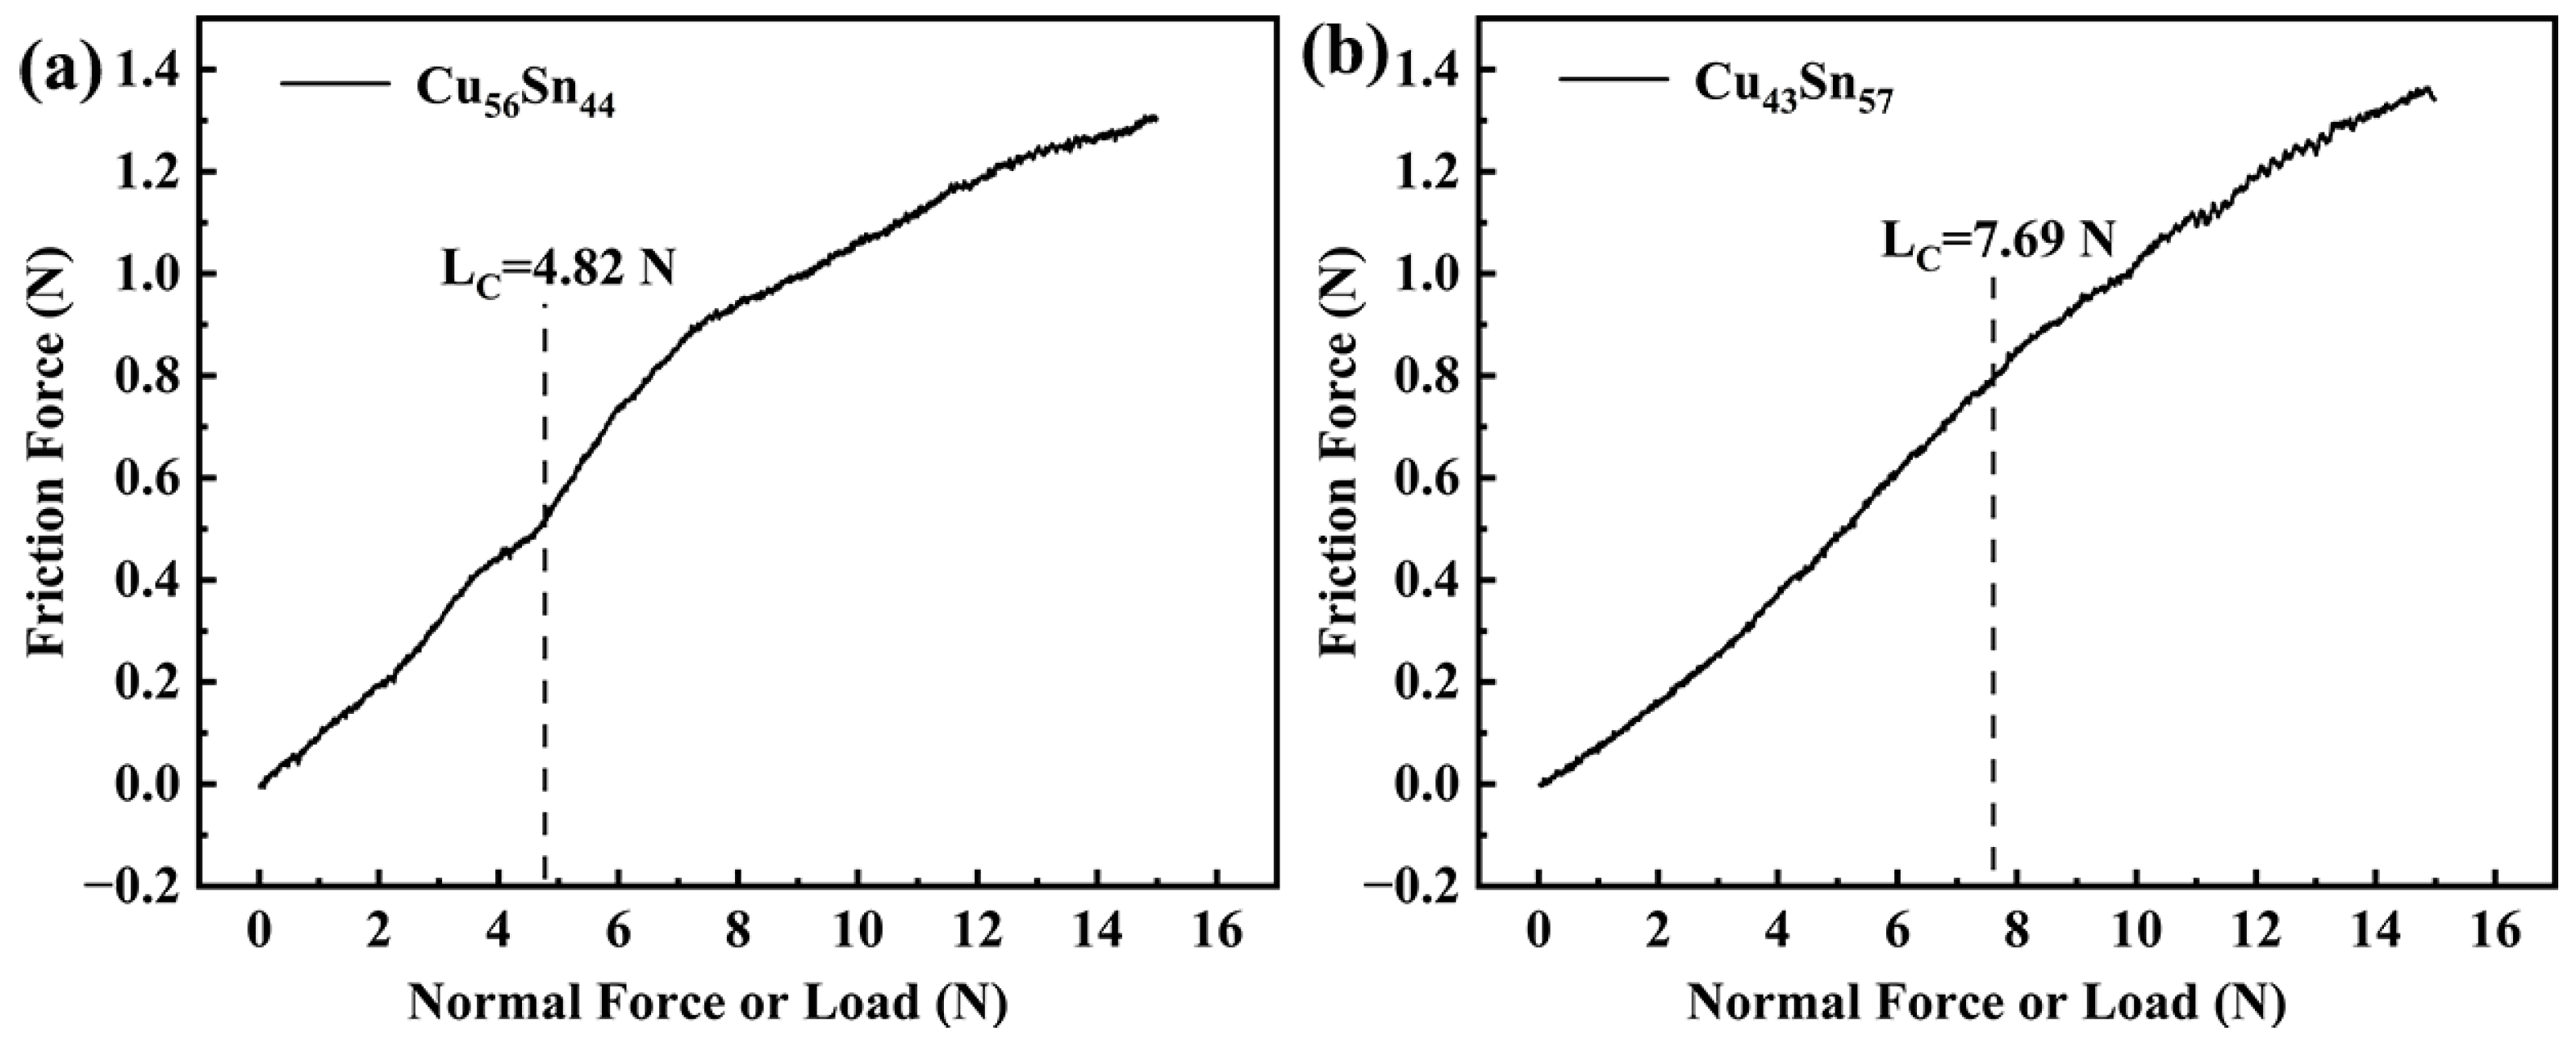
3.2. Adhesion Test Analysis

Figure 4 demonstrates the critical loads for the Cu-Sn thin film samples. As the load or normal force increases from 1 N to 4.82 N (for Cu56Sn44 film) and from 1 N to 7.69 N (for Cu43Sn57 film), the friction force increases gradually at a particular slope. When the load reaches 4.82 N for the Cu56Sn44 film and 7.69 N for the Cu43Sn57 film, the friction force increases abruptly, indicating that the contact condition has changed between the diamond tip indenter and Cu-Sn films. The critical load (Lc) at which the Cu-Sn films fail effectively by cracking and delamination reveals the adhesion strength of the Cu-Sn films. The Cu56Sn44 films prepared without the addition of nickel sulfate exhibit weaker adhesion compared to the Cu43Sn57 films prepared with the addition of nickel sulfate. This may be attributed to the inhomogeneous morphology of Cu56Sn44, as shown in Figure 1a,c. The inhomogeneous coating has improper adhesion to the substrate owing to its varying porosities and voids.

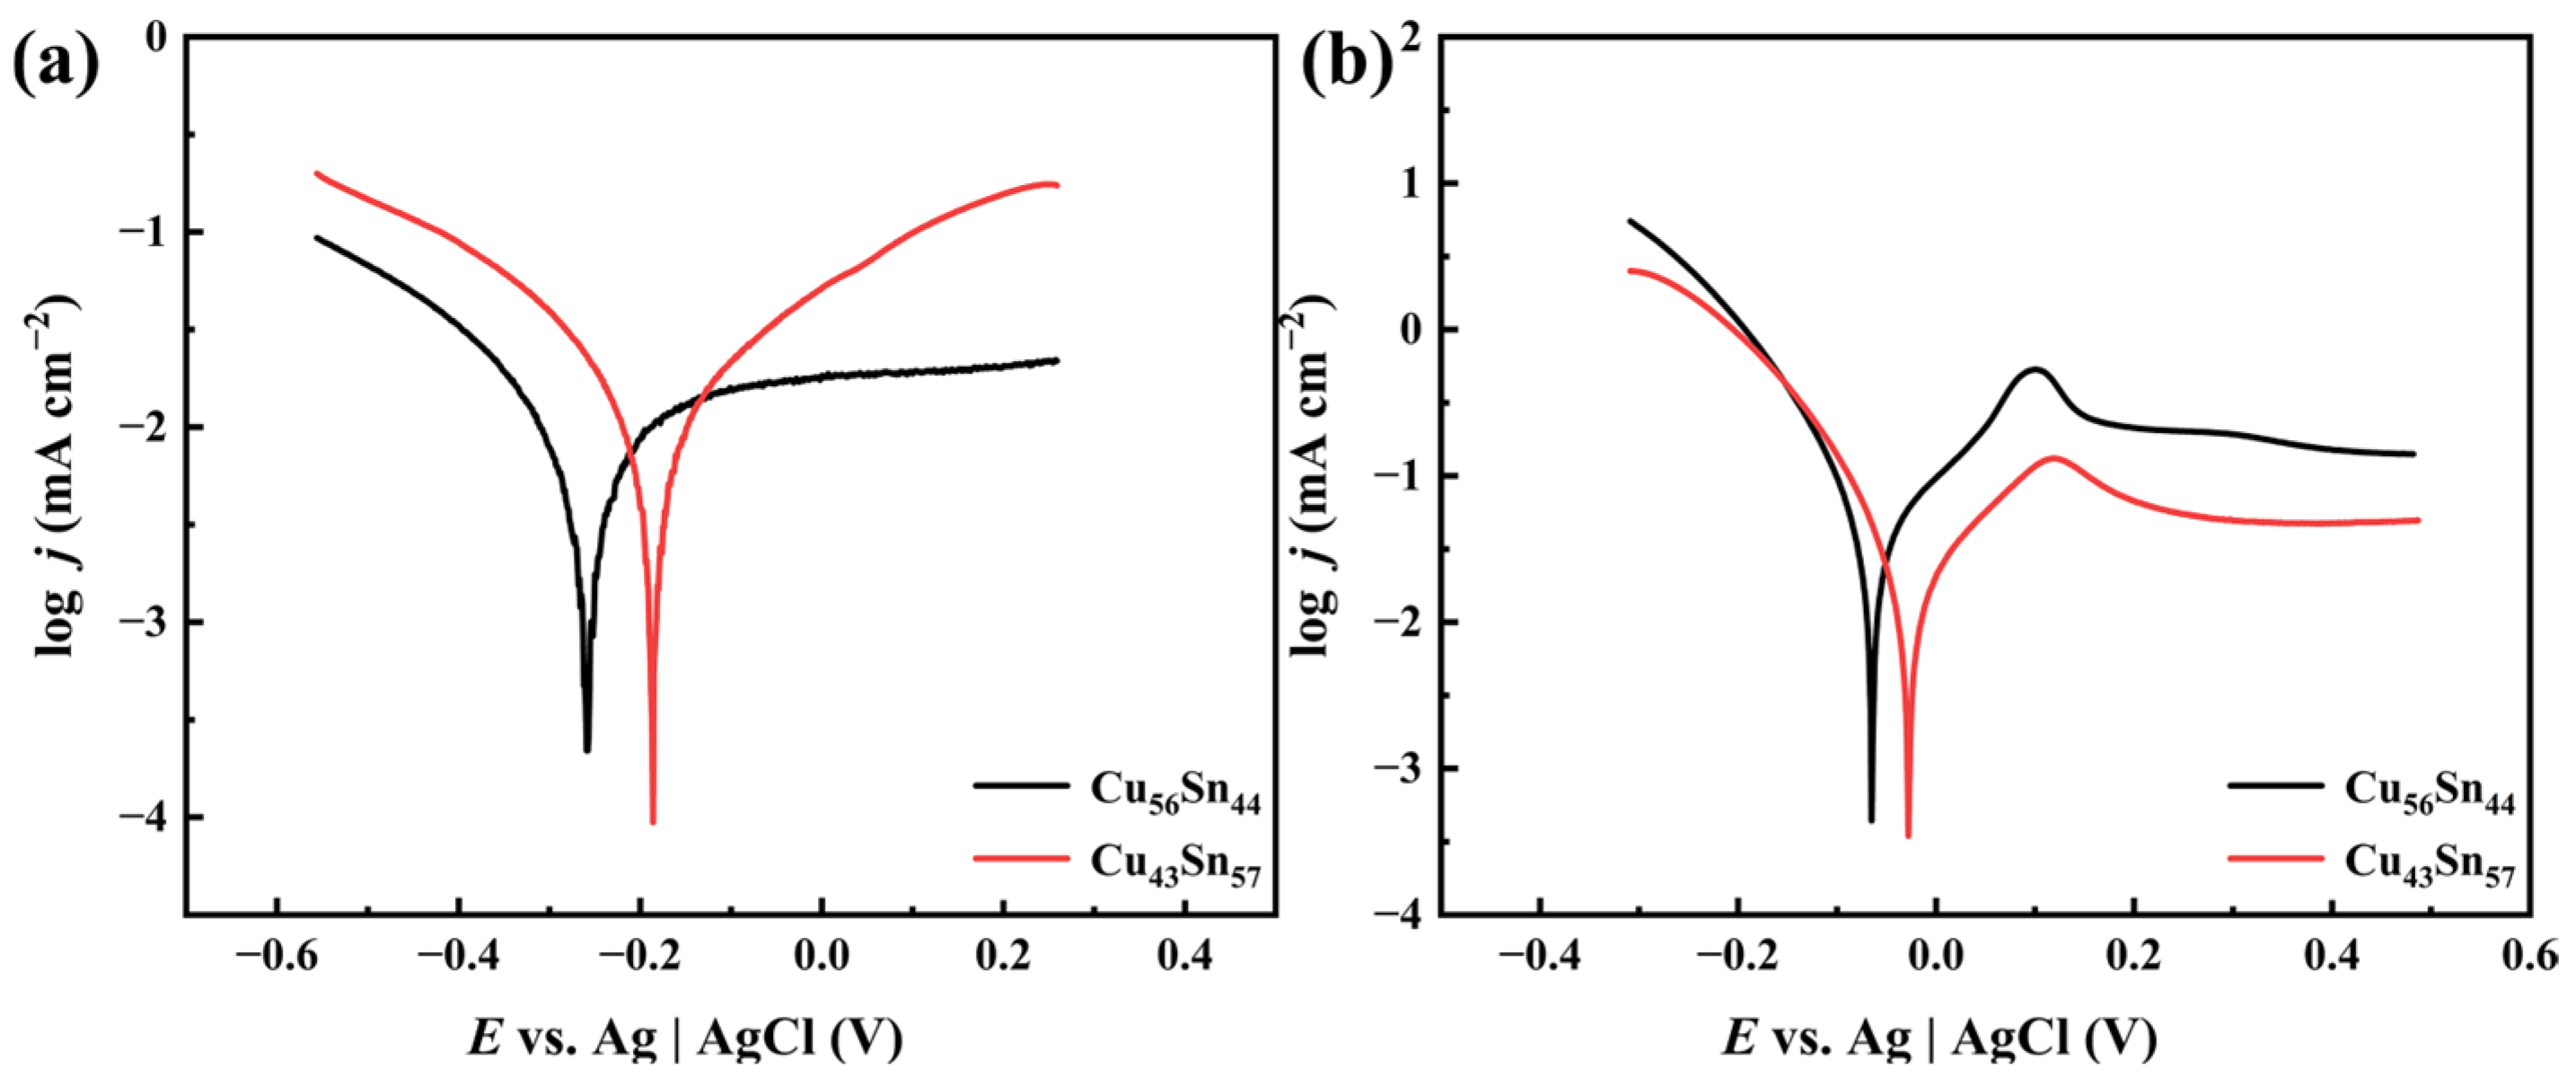
3.3. Polarization Behavior in 3.5 wt.% NaCl Solution

In order to investigate the corrosion resistance of the two prepared Cu-Sn alloys, polarization measurements were performed. Tafel curves for two samples in 3.5 wt.% NaCl solution are illustrated in Figure 5a. The polarization curves were fitted using CHI 760 software 22.4.0.0, and the results are shown in Table 1. From Table 1, it can be seen that in 3.5 wt. % NaCl solution, the corrosion current density (jcorr) of Cu56Sn44 is 9.456 × 10⁻⁶ mA cm−2, and the corrosion current density (jcorr) of Cu43Sn57 is 1.248 × 10⁻⁶ mA cm−2; a lower corrosion current density means better corrosion resistance. That is, the corrosion resistance of Cu43Sn57 is better than that of Cu56Sn44. The results show that the alloys show a trend towards lower corrosion potentials and corrosion current densities as the Sn content increases. The fitting results show that the corrosion potential of the Cu-Sn alloy increases from −0.259 V to −0.186 V with the increase in Sn content from 44% to 57%. By the Stern–Geary formula, Rp = βa × βc/[2.3(βa + βc) × Icorr] (βa and βc are the Tafel slopes of the anode and the cathode, respectively, and Rp is the polarization resistance), Rp1(Cu43Sn57) = 0.39 × 10⁶, Rp2(Cu56Sn44) = 0.35 × 10⁶, and Rp1(Cu43Sn57) > Rp2(Cu56Sn44). The higher the polarization resistance, the higher the corrosion resistance of the alloy. Cu43Sn57 alloy shows strong corrosion resistance [31]. In addition, the kinetic potential polarization curves in the figure do not have steep slopes in the anodic range, which implies that no passivation film is formed on the surface of the Cu-Sn alloy.
In conventional electrode reactions, Sn acts as an anode and reacts with Cl in the medium to form SnCl2, leading to pitting corrosion and severe dissolution of Sn. In contrast, the corrosion product of Cu is mainly CuCl, which is an unstable intermediate product because it releases chloride ions during hydrolysis and oxidation [32], leading to the continuous dissolution of the Cu-Sn alloy matrix and the formation of Cu2O on the surface [33,34,35,36]. According to Wang [37], the corrosion product of tin is mainly SnO2, and the corrosion behavior of the alloy is influenced by the tin content. Alloys with higher tin content exhibit lower corrosion current density and higher corrosion resistance [38]. SnO and SnO2 can be readily formed from tin hydroxide.

3.4. Polarization Behavior in 0.1 M HNO3 Nitrate Solution

According to K.F. Khaled [39], HNO3 is a strong copper oxidizer capable of rapidly attacking copper. Copper can be directly dissolved in the HNO3 solution. Copper is corroded in nitric acid solution and does not form an oxide film to protect the surface. Therefore, the dissolution of copper is considered to be the main reaction in nitric acid solution. The electrochemical reaction of copper in nitric acid solution can be described as follows:
Anodic reaction:
Cu → Cu2+ + 2e
Cathodic reaction [40]:
2H+ + 2e → H2
Figure 5b shows the kinetic potential polarization curves of Cu-Sn alloys in HNO3 solution. According to the polarization process, the corresponding corrosion process of these alloys can be considered as consisting of two stages. The first stage is the cathodic polarization reaction, and in the second stage, the current density increases rapidly. The main reason for this is that the corrosion products cover the surface of the corroded alloy and form a passivation film. This passivation film hinders the movement of cathodic ions through the alloy surface and avoids further dissolution of the Sn-rich phase. According to research, the formation of a passivation film can provide physical barrier protection for Cu-Sn alloys during corrosion [41]. The corrosion electrochemical parameters, such as corrosion current density score, corrosion potential Ecorr, anodic Tafel constant βa, and cathodic Tafel constant βc, were calculated by fitting the polarization curves using the CHI 760 software, and the results are shown in Table 2. From Table 2, it can be seen that in 0.1 M HNO3 solution, the corrosion current density (jcorr) of Cu56Sn44 is 5.384 × 10⁻⁵ mA cm−2, and the corrosion current density (jcorr) of Cu43Sn57 is 2.630 × 10⁻⁵ mA cm−2; a lower corrosion current density means better corrosion resistance. That is, the corrosion resistance of Cu43Sn57 is better than that of Cu56Sn44. The results show that the corrosion potential and corrosion current density of the alloy decrease with the increase in Sn content. According to the corrosion theory [42], the right shift in the cathodic curve indicates that the corrosion is mainly accelerated by the cathodic reaction. In addition, the kinetic potential polarization curves in the figure have steep slopes in the anodic range, which implies that a passivation film is formed on the surface of the Cu-Sn alloy. This is attributed to the fact that Sn is more reactive than Cu in HNO3 solution, and therefore Sn is initially oxidized to form a protective Sn-rich passivation film on the surface to prevent further corrosion. Only when the passivation film is consistently eroded or destroyed does the copper begin to corrode. Due to the high Sn content in the Cu43Sn57 sample, the passivation film has strong protective properties and high corrosion resistance. The fitting results show that the corrosion potential of the Cu-Sn alloy decreases from −0.065 V to −0.028 V as the Sn content increases from 44% to 57%. According to Stern’s formula, Rp3(Cu43Sn57) = 2.11 × 10⁵, Rp4(Cu56Sn44) = 1.21 × 10⁵, and Rp3(Cu43Sn57) > Rp4(Cu56Sn44). Cu43Sn57 also showed strong corrosion resistance in the HNO3 solution, and Rp1(Cu43Sn57) > Rp2(Cu56Sn44) > Rp3(Cu43Sn57) > Rp4(Cu56Sn44).
The corrosion behavior of Cu-Sn alloys in the HNO3 solution environment can be considered as an anodic process of the metal, summarized in the following anodic oxidation mechanism:
Sn → Sn2+ + 2e
Sn2+→Sn4+ + 2e
2Sn + O2 + 4H+→2Sn2+ + 2H2O
2Sn2+ + O2 + 4H+→2Sn4+ + 2H2O
SnO and SnO2 can be readily formed from tin hydroxide, and during anodic polarization, a stable passivation film is formed on the surface of the metal alloy. The shift to a negative potential means that a more stable passivation film is formed, increasing its corrosion resistance [43,44,45]. The corrosion products consist of tin oxides and hydroxides.

3.5. Electrochemical Impedance Spectroscopy

Figure 6 shows the Nyquist plot of the electrochemical impedance spectrum of the Cu-Sn alloy in 3.5 wt.% NaCl and 0.1 M HNO3 solution. In the Nyquist plot, the horizontal and vertical coordinates correspond to the real part (Z′) and imaginary part (Z″) of the complex transfer function. Under the high-frequency region, the Nyquist curve shows a concave semicircle, and this high-frequency semicircle is due to the single time constants of the charge-transfer resistance (Rct) and the double-layer capacitance (CPE) [46,47]. In the high-frequency region, the electrode reaction is controlled by the charge transfer process, and the diameter of the semicircle represents the charge transfer resistance. The capacitive arc of the alloy increases with increasing Sn concentration. The magnitude of the capacitive arc can be used to determine the charge transfer resistance and hence the corrosion rate. From the Nyquist plot, the radius of the capacitive arc is observed for different Cu-Sn contents. A lower capacitive arc radius may be associated with poorer corrosion resistance. Therefore, according to the EIS results, the Cu43Sn57 alloy exhibits better corrosion resistance compared to the Cu56Sn44 alloy.
The equivalent circuit model was obtained by fitting the Nyquist diagram, as shown in Figure 6. The electrolyte resistance (Rs) was obtained from the circuit calculations, which is attributed to the ion migration behavior in the electrolyte [31]. The fitting parameters of the equivalent circuits are shown in Table 3 and Table 4. Rs is the solution resistance; R1 and CPE-1 are the resistance and capacitance of the corrosion product layer, respectively. The calculated values of these parameters (from ZView software, version 3.1, Ziffnet, San Francisco, CA, USA) according to the corresponding equivalent circuits are listed in the table. Standard deviation (λ2) is used to indicate the degree of fitting efficiency. In addition, a reasonable fitting criterion with an error of less than 10−4 orders of magnitude is considered acceptable.
The equivalent circuit of Cu-Sn alloy in 3.5 wt.% NaCl solution is shown in Figure 6a. Table 3 provides the fitting results of the electrochemical components of the equivalent circuit of Cu-Sn alloy in 3.5 wt.% NaCl solution. The fitting results show that Rs decreases gradually with increasing Sn content, which leads to a decrease in resistance. This is because the conductivity of the solution decreases with increasing Sn content. Rct is an important indicator of corrosion rate. Higher charge transfer resistance indicates better corrosion resistance of the alloy. From the EIS test and fitting results (Table 3), in 3.5 wt.% NaCl solution, it can be seen that the Rct of Cu56Sn44 is 19582 Ω cm2, while the Rct of Cu43Sn57 is 35530 Ω cm2, and Rct (Cu43Sn57) > Rct (Cu56Sn44). That is, the corrosion resistance of Cu43Sn57 is better than that of Cu56Sn44 in 3.5 wt. % NaCl solution.
From the EIS test and fitting results, it can be seen that the charge transfer resistance (Rct) gradually increases with the increase in Sn content. In the NaCl solution, Cu43Sn57 shows better corrosion resistance than Cu56Sn44, indicating that Sn content is the main factor influencing the change in impedance. The results of Tafel and EIS tests are consistent and confirm that the increase in Sn content helps to reduce the corrosion rate in Cu-Sn alloys.
The equivalent circuit diagram of Cu-Sn alloy in 0.1 M HNO3 solution is shown in Figure 6b. Table 4 provides the results of fitting the electrochemical components of the equivalent circuit for Cu-Sn alloy in HNO3 solution. The fitting results show that the conductivity of the solution decreases with increasing Sn content. From the EIS and fitting results (Table 4), in 0.1 M HNO3 solution, it can be seen that the Rct of Cu56Sn44 is 12,056 Ω cm2, while the Rct of Cu43Sn57 is 27,479 Ω cm2, and Rct (Cu43Sn57) > Rct (Cu56Sn44). That is, the corrosion resistance of Cu43Sn57 is better than that of Cu56Sn44 in 0.1 M HNO3 solution. The charge transfer resistance (Rct) increases gradually with the increase in Sn content. In the HNO3 solution, Cu43Sn57 shows better corrosion resistance than Cu56Sn44, and the results of Tafel and EIS tests are consistent, which further confirms that the increase of Sn content helps to reduce the corrosion rate and improve the corrosion resistance of Cu-Sn alloys. The same conclusion as in 3.5 wt.% NaCl solution was reached.

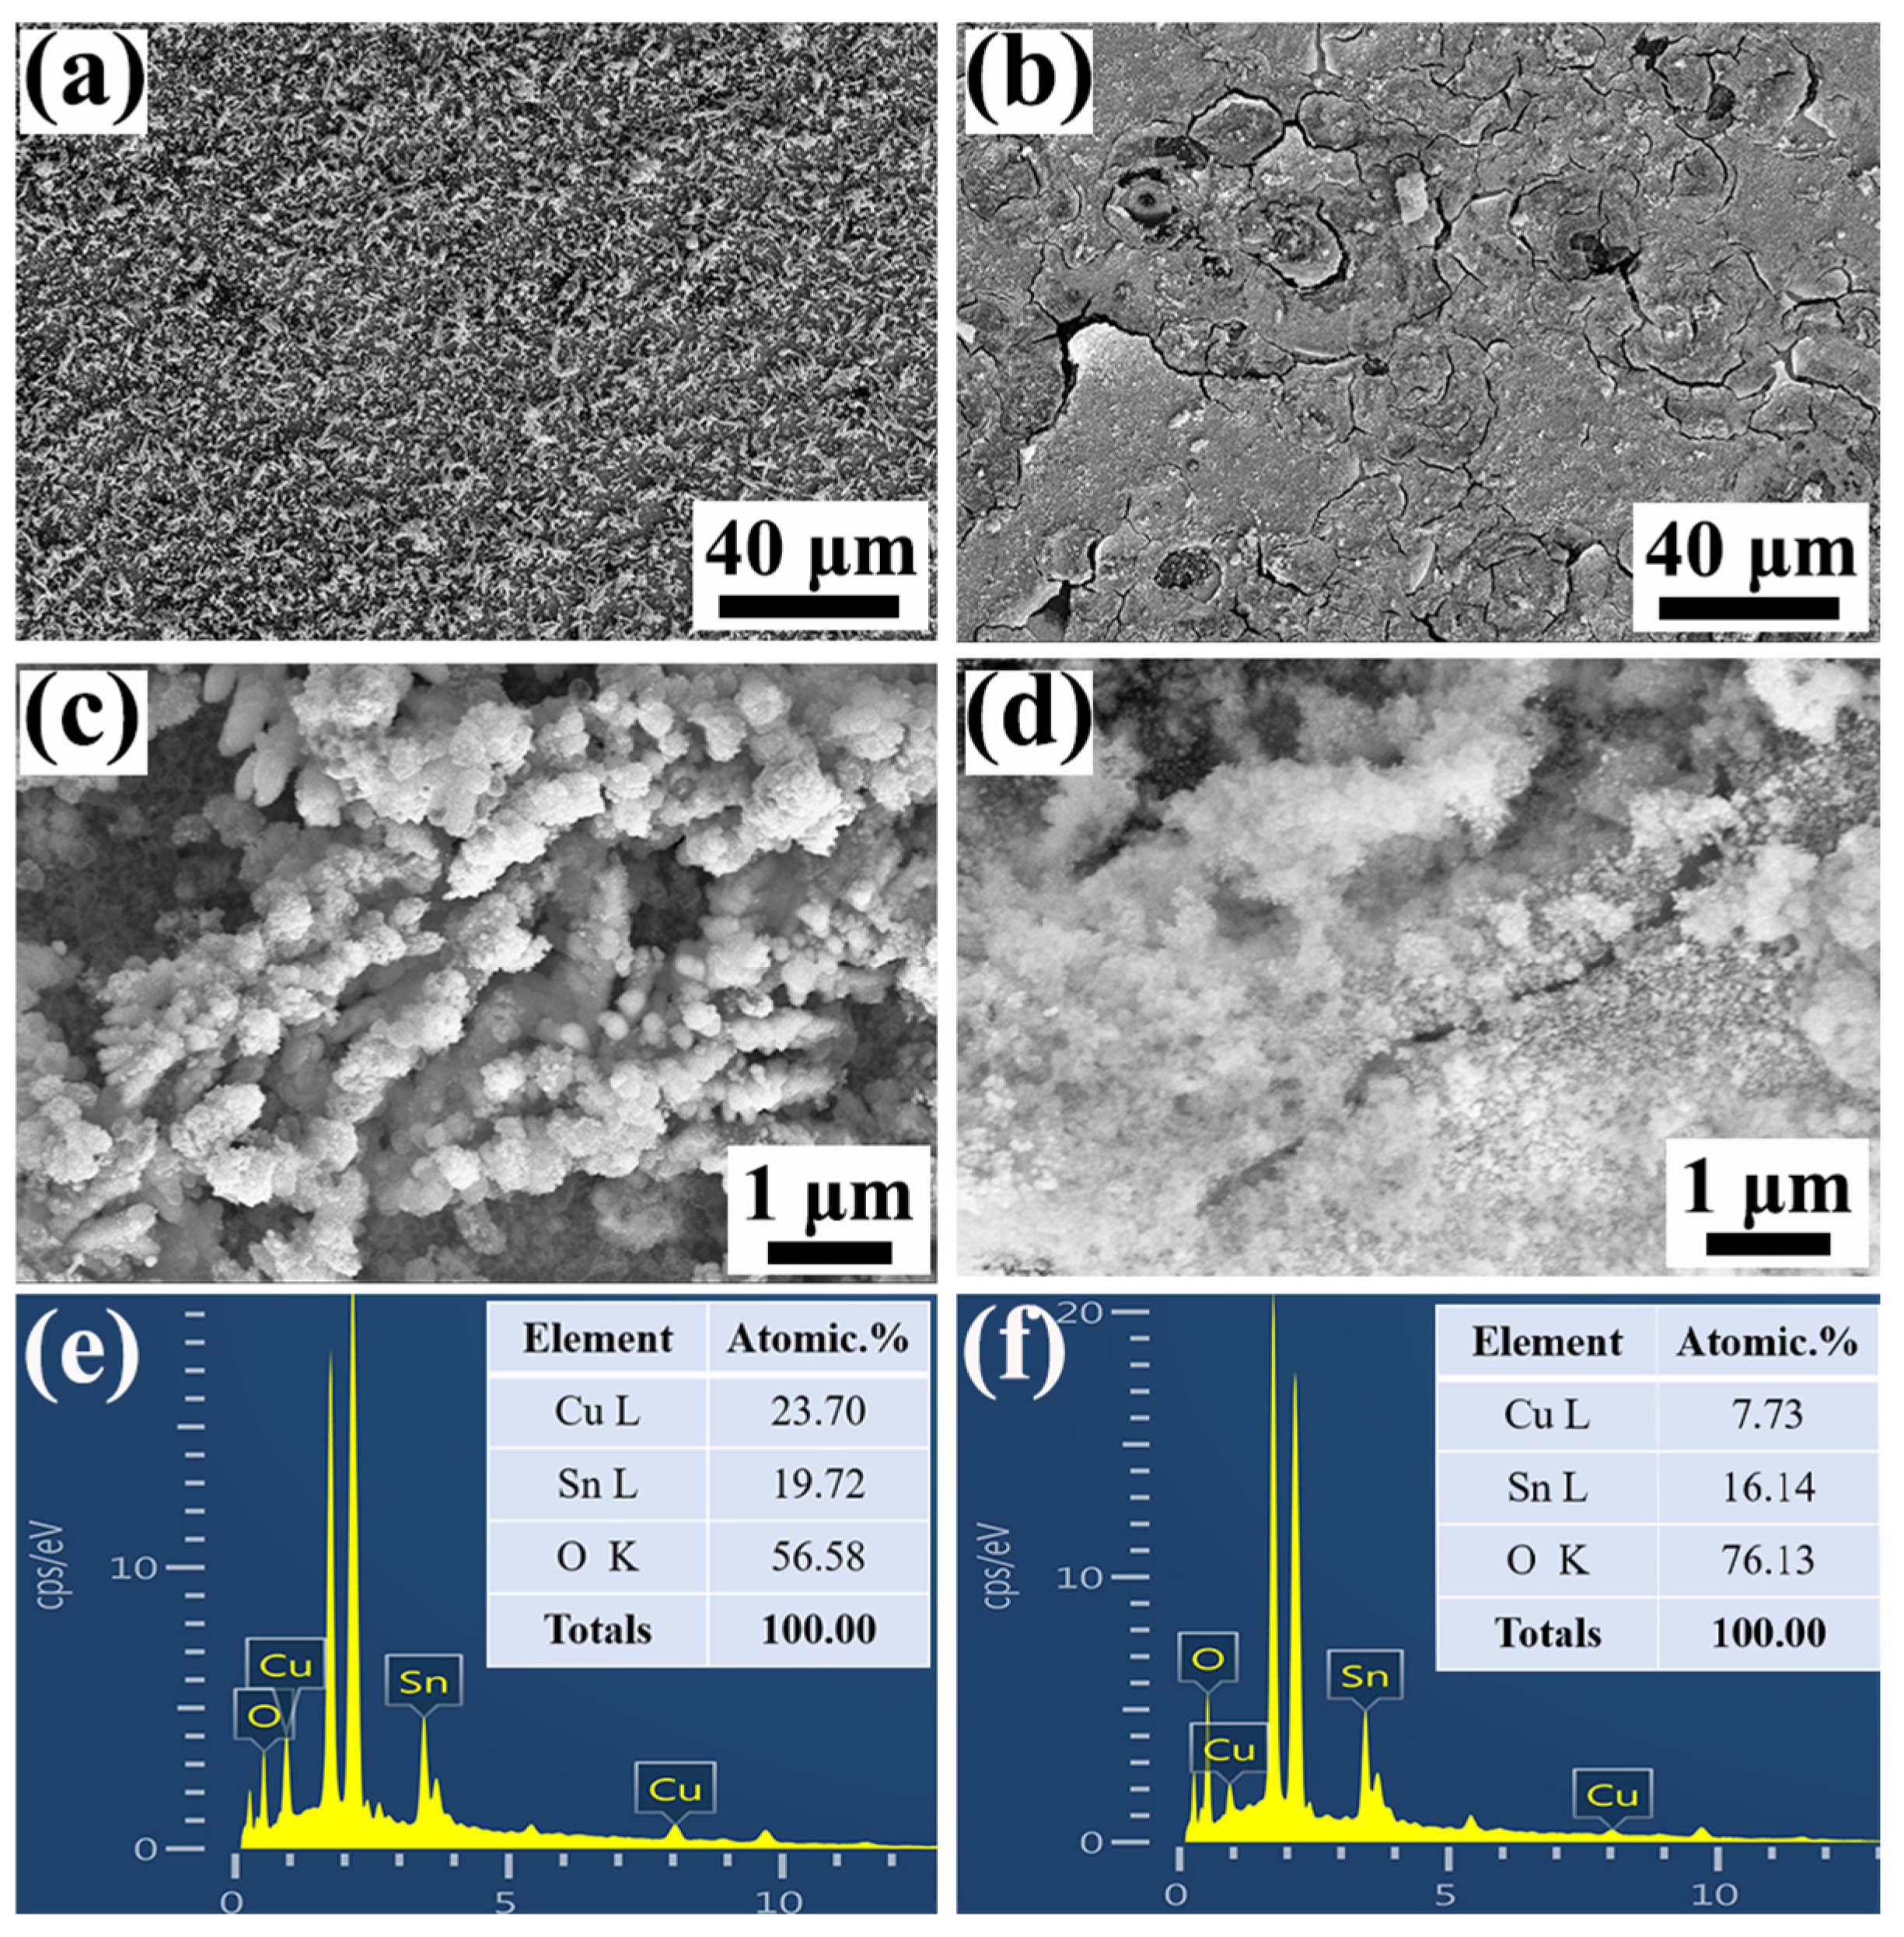
3.6. Microscopic Morphology of Corrosion Products

Figure 7 shows the surface corrosion morphology of Cu-Sn films after corrosion in 3.5 wt.% NaCl solution; it can be seen that the loose porous massive corrosion products are attached to the film surface. Corrosion cracks also exist; the distribution of patchy massive corrosion scale is sufficient to prove the degree of corrosion, indicating that the corrosion of the dendrites in the inter-dendritic region is more intense. Figure 8 is a SEM image of the Cu-Sn film after corrosion in 0.1 M HNO3 solution; the surface morphology has no obvious change, indicating that the prepared Cu-Sn film has good corrosion resistance in 0.1 M HNO3 solution. EDX analysis shows that the oxygen content in the corrosion products is relatively high, which reveals that the corrosion products mainly consist of oxides of copper and tin.

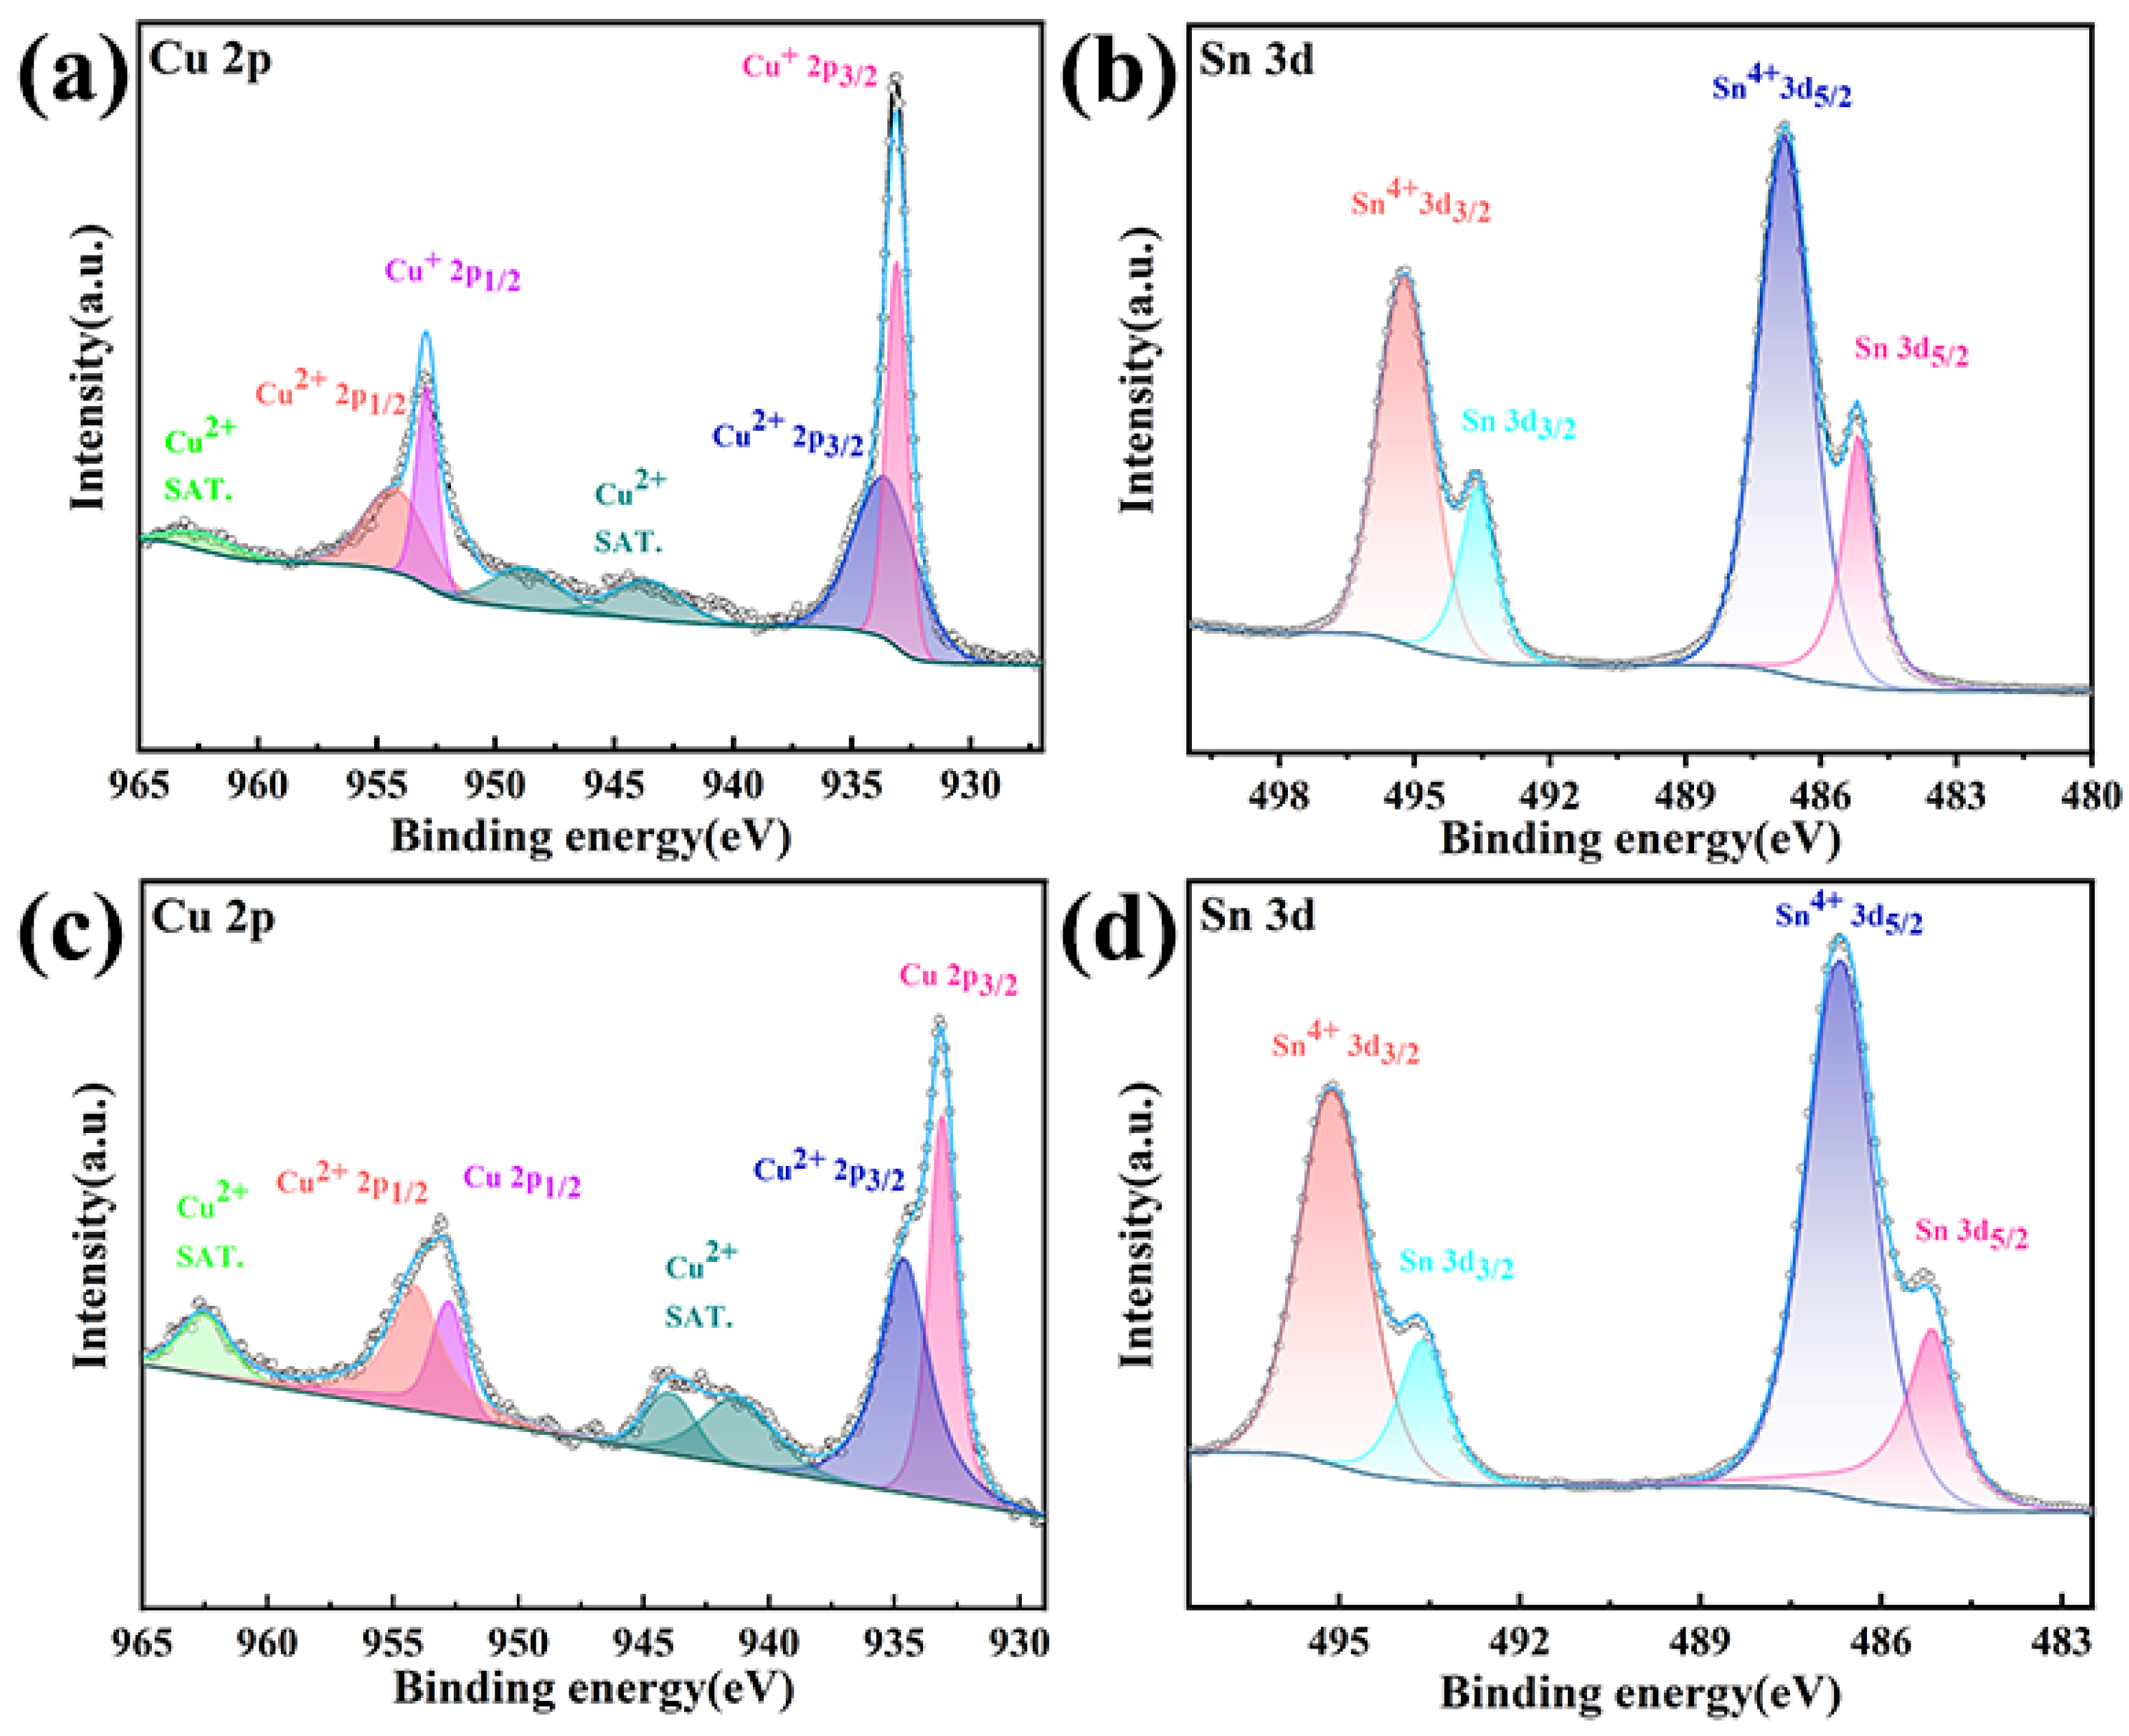
3.7. Analysis of Electronic Valence States in the Corrosion Reactions of Cu56Sn44 and Cu43Sn57 Alloys

To further investigate the valence states of the constituent elements inside the corrosion products formed on the surface of the Cu-Sn alloys and to determine their internal chemical composition and structure, it is necessary to determine the structural composition of the corrosion products by analyzing the high-resolution narrow spectrograms of the different elements in the corrosion products and compare them with the standard data. Since the Cu-Sn film was severely corroded by 3.5 wt.% NaCl solution, only the XPS results of the Cu-Sn film corroded by 0.1 M HNO3 are shown. For the surface chemical analysis of the alloys, the samples after corrosion testing by 0.1 M HNO3 were analyzed by XPS.
Shown in Figure 9a,b are the high-resolution XPS spectra of Cu2p and Sn4d in the as-prepared Cu56Sn44, respectively. In Figure 9a, the Cu 2p spectrum shows the spin–orbit double peaks of Cu 2p 1/2 (952.35 eV) and Cu 2p 3/2 (932.69 eV), and the existence of Cu (II) can also be proved by the satellite peaks near 943.23 eV and 962.20 eV. According to Figure 9c, the binding energy of Cu 2p 3/2 and Cu 2p 1/2 after corrosion test is 932.56 eV and 952.37 eV, indicating the appearance of Cu (0). The peaks at 944.79 eV and 949.08 eV can be attributed to satellite peaks. Cu (II) and Cu (I) can be formed on the surface of Cu-Sn when Cu56Sn44 alloy is immersed in an acidic solution. In Figure 9b, the Sn 4d spectrum of the prepared film is shown, in which SnO2 and Sn are detected. The presence of SnO2 may be due to the reaction of Sn metal with oxygen contact (i.e., surface passivation). It is worth noting that Sn (IV) is the main reason for the passivation of the oxide film, which can prevent further corrosion of the coating and improve the corrosion resistance of the film. On the other hand, in the Sn 4d spectrum obtained after the corrosion test, the fraction of Sn (IV) increased, which can be attributed to the formation of a passivation film during the corrosion process. The high-resolution XPS spectra of Cu 2p and Sn 4d in the as-prepared Cu43Sn57 are shown in Figure 10a,b, respectively. In Figure 10a, like Cu56Sn44, the Cu 2p spectrum also exhibits spin–orbit double peaks of Cu 2p 1/2(952.35 eV) and Cu 2p 3/2 (932.69 eV), and there are two satellite peaks near the two main peaks with a high binding energy of 19.75 eV (i.e., corresponding to the binding energies of 952.85 eV and 952.35 eV), which are obviously satellite peaks belonging to CuO. Cu (II) and Cu (I) can also be formed on the surface of Cu-Sn when Cu43Sn57 alloy is immersed in acidic solution. According to Figure 10c, Cu 2p 3/2 and Cu 2p 1/2 after the corrosion test have peaks near the binding energy of 932.56 eV and 952.37 eV, and Cu (0) also appears. In Figure 10b, the Sn 4d spectrum in the prepared state is shown, and SnO2 and Sn are also detected. The difference is that compared with Cu56Sn44 alloy, the exposed surface of Cu43Sn57 coating shows a higher fraction of protective oxide Sn (IV) and is expected to provide higher corrosion resistance, which is consistent with the polarization resistance results of Cu56Sn44 and Cu43Sn57. According to Figure 9d, Sn (IV) showed a higher fraction after the corrosion test, which was mainly attributed to the formation of a passivation film.
According to [39], both Cu and Sn elements have certain pitting resistance, but Sn is more prominent. Sn in the corrosion products of Cn-Sn alloys exists in various forms, such as SnO2, SnO, etc., and different forms of Sn are in different layers of the corrosion products, which may have different effects on the corrosion resistance of Cu-Sn alloys. SnO is usually in the inner layer of the corrosion product, which acts as a barrier layer of the corrosion product, while SnO2 is in the surface layer of the corrosion product. Due to its amorphous state, the hydroxide in the surface layer will be dehydrated to induce the barrier layer to continue to grow and thicken. It was found [47] that when the Sn content reaches a certain fixed value, in the alloy indicates that a protective corrosion product film will be formed; this film is amorphous in structure, and can well avoid due to compositional segregation, grain boundaries, dislocations, and other defects caused by the presence of corrosion products caused by the rupture of the film of corrosion products caused by the corrosion resistance of alloys to reduce the corrosion performance. And Cu43Sn57 with a tin content of 57 wt.% shows the formation of a better density of corrosion product film, so the corrosion resistance of Cu43Sn57 is better than Cu56Sn44. The above study shows that the corrosion resistance of Cu43Sn57 maintains its advantage in 0.1 M HNO3 solution. With the addition of NiSO4, the Cu-Sn alloy exhibits higher corrosion resistance. This demonstrates the role of NiSO4 incorporation in Cu-Sn coatings in modifying the texture and improving the corrosion resistance.

4. Conclusions

In conclusion, Cu43Sn57 alloy was prepared by electrodeposition using nickel sulfate as a structure-directing agent on gold sheets in aqueous sulfate solution and compared with Cu56Sn44 alloy prepared without nickel sulfate. SEM and ICP-MS analyses revealed that its morphology changed from loose and irregular particles to dense and homogeneous morphology, which can play the role of a physical barrier. XRD analysis shows that Cu43Sn57 is mainly composed of two phases, Cu10Sn3 and Cu3Sn. Compared with commercially available Cu-Sn alloys, Cu43Sn57 alloy has excellent corrosion resistance and stability not only in saline solution but also in acidic solution. The results of this paper lay the foundation for the synthesis of low-cost, high-efficiency, high-binding Cu-Sn alloys.

Author Contributions

Conceptualization, X.J. and J.Z.; methodology, X.J. and J.Z.; software, X.J. and R.G.; validation, Z.Y., J.Y. and X.C.; formal analysis, X.J. and R.G.; investigation, X.J. and Z.Y.; resources, J.Z., X.C. and R.G.; data curation, Z.Y., X.C. and J.Y.; writing—original draft preparation, X.J.; writing—review and editing, Z.Y. and J.Z.; visualization, X.J., Z.Y. and J.Y.; supervision, J.Z., X.C. and R.G.; project administration, J.Z. and R.G.; funding acquisition, J.Z. and R.G. All authors have read and agreed to the published version of the manuscript.

Funding

This research was funded by the National Key Research and Development Program of China (2022YFE0137900), Liaoning Province “Xingliao Talent Plan” (XLYC2002070), Young Elite Scientists Sponsorship Program by CAST (2022QNRC001), and Dalian High-level Talents Innovation Support Program (2021RD06).

Data Availability Statement

The original contributions presented in this study are included in the article. Further requests can be directed to the corresponding author.

Acknowledgments

The National Key Research and Development Program of China, Liaoning Province, Young Elite Scientists Sponsorship Program, and Dalian High-level Talents Innovation Support Program are acknowledged.

Conflicts of Interest

The authors declare that they have no known competing financial interests or personal relationships that could have appeared to influence the work reported in this paper.

References

  1. Faiyaz Ahmed, A.; Ibrahim Shaikh, M.; Ali, Z. Investigations on mechanical behaviour of nano zirconium oxide and graphite particles reinforced copper-tin alloy metal composites. Mater. Today Proc. 2023, 92, 849–855. [Google Scholar] [CrossRef]
  2. Huttunen-Saarivirta, E.; Isotahdon, E.; Carpén, L. Behaviour of leaded tin bronze in simulated seawater in the absence and presence of tribological contact with alumina counterbody: Corrosion, wear and tribocorrosion. Tribol. Int. 2019, 129, 257–271. [Google Scholar] [CrossRef]
  3. Sun, B.; Zuo, X.; Li, X. The role of chromium content in the long-term atmospheric corrosion process. npj. Mater. Degrad. 2020, 4, 37. [Google Scholar] [CrossRef]
  4. Ghosh, S.; Roy, S. Codeposition of Cu-Sn from Ethaline Deep Eutectic Solvent. Electrochim. Acta 2015, 183, 27–36. [Google Scholar] [CrossRef]
  5. Hu, R.Z.; Zhang, Y.; Zhu, M. Microstructure and electrochemical properties of electron-beam deposited Sn–Cu thin film anodes for thin film lithium ion batteries. Electrochim. Acta 2008, 53, 3377–3385. [Google Scholar] [CrossRef]
  6. Low, C.T.J.; Walsh, F.C. Electrodeposition of tin, copper and tin–copper alloys from a methanesulfonic acid electrolyte containing a perfluorinated cationic surfactant. Surf. Coat. Technol. 2008, 202, 1339–1349. [Google Scholar] [CrossRef]
  7. Pewnim, N.; Roy, S. Electrodeposition of tin-rich Cu–Sn alloys from a methanesulfonic acid electrolyte. Electrochim. Acta 2013, 90, 498–506. [Google Scholar] [CrossRef]
  8. Saba, T.; Saad, K.S.K.; Rashid, A.B. Precise surface engineering: Leveraging chemical vapor deposition for enhanced biocompatibility and durability in biomedical implants. Heliyon 2024, 10, e37976. [Google Scholar] [CrossRef]
  9. Najah, M.N.; Rahmania, F.A.; Nur, H. Parameter influences of FTO/ZnO/Cu2O photodetectors fabricated by electrodeposition and spray pyrolysis techniques. S. Afr. J. Chem. Eng. 2025, 51, 188–201. [Google Scholar] [CrossRef]
  10. Wang, T.; Li, W.; Meng, J. A novel and facile synthesis of black TiO2 with improved visible-light photocatalytic H2 generation: Impact of surface modification with CTAB on morphology, structure and property. Appl. Surf. Sci. 2017, 426, 325–332. [Google Scholar] [CrossRef]
  11. Walsh, F.C.; Wang, S.; Zhou, N. The electrodeposition of composite coatings: Diversity, applications and challenges. Curr. Opin. Electrochem. 2020, 20, 8–19. [Google Scholar] [CrossRef]
  12. Guan, T.; Zhang, N. Recent Advances in Electrodeposition of Nickel-Based Nanocomposites Enhanced with Lubricating Nanoparticles. Nanomanuf. Metrol. 2024, 7, 25. [Google Scholar] [CrossRef] [PubMed]
  13. Bengoa, L.N.; Pary, P.; Egli, W.A. Electrodeposition of Cu-Sn alloys from a methanesulfonic acid electrolyte containing benzyl alcohol. Electrochim. Acta 2017, 256, 211–219. [Google Scholar] [CrossRef]
  14. Meng, G.; Sun, F.; Wang, F. Effect of electrodeposition parameters on the hydrogen permeation during Cu–Sn alloy electrodeposition. Electrochimi. Acta 2010, 55, 2238–2245. [Google Scholar] [CrossRef]
  15. Zhang, S.; Nishi, Y.; Kubota, Y. Efficient synthesis of MSE-type zeolite using a highly effective organic structure-directing agent and excellent catalytic performance of its derived titanosilicate. Microporous Mesoporous Mater. 2025, 384, 113452. [Google Scholar] [CrossRef]
  16. Shi, Z.; Wang, L.; Liu, J. Designing organic structure-directing agent for cost-effective production of multipore MSE zeolite. Fuel 2025, 381, 133274. [Google Scholar] [CrossRef]
  17. Mallette, A.J.; Espindola, G.; Rimer, J.D. Highly efficient synthesis of zeolite chabazite using cooperative hydration-mismatched inorganic structure-directing agents. Chem. Sci. 2024, 15, 573–583. [Google Scholar] [CrossRef]
  18. Su, F.; Yao, K. Facile Fabrication of Superhydrophobic Surface with Excellent Mechanical Abrasion and Corrosion Resistance on Copper Substrate by a Novel Method. ACS. Appl. Mater. Int. 2014, 6, 8762–8770. [Google Scholar] [CrossRef]
  19. Esmailzadeh, S.; Khorsand, S.; Ashrafizadeh, F. Microstructural evolution and corrosion resistance of super-hydrophobic electrodeposited nickel films. Surf. Coat. Technol. 2015, 283, 337–346. [Google Scholar] [CrossRef]
  20. Benea, L.; Caron, N.; Raquet, O. Tribological behavior of a Ni matrix hybrid nanocomposite reinforced by titanium carbide nanoparticles during electro-codeposition. RSC Adv. 2016, 6, 59775–59783. [Google Scholar] [CrossRef]
  21. Diaz, L.A.; Coppola, R.E.; Ocón, P. Alkali-doped polyvinyl alcohol—Polybenzimidazole membranes for alkaline water electrolysis. J. Membr. Sci. 2017, 535, 45–55. [Google Scholar] [CrossRef]
  22. Zhu, X.; Tian, J.; Shan, Z. A novel compact cathode using sponge-like RANEY® nickel as the sulfur immobilizer for lithium–sulfur batteries. RSC Adv. 2017, 7, 35482–35489. [Google Scholar] [CrossRef]
  23. Zhao, C.X.; Liu, J.N.; Zhang, Q. Multiscale Construction of Bifunctional Electrocatalysts for Long-Lifespan Rechargeable Zinc–Air Batteries. Adv. Funct. Mater. 2020, 30, 2003619. [Google Scholar] [CrossRef]
  24. Jiang, S.W.; Yang, L.; Wang, Z.Q. Electrodeposition of Ni-Al2O3 composite coatings with combined addition of SDS and HPB surfactants. Surf. Coat. Technol. 2016, 286, 197–205. [Google Scholar] [CrossRef]
  25. Li, X.; Gao, R.; Sun, L. Study of deposition patterns of plating layers in SiC/Cu composites by electro-brush plating. Appl. Surf. Sci. 2011, 257, 10294–10299. [Google Scholar] [CrossRef]
  26. Sivasakthi, P.; Sangaranarayanan, M.V. Pulse electrodeposited nickel with structure directing agents as an electrocatalyst for oxidation of glycerol. New J. Chem. 2019, 43, 8352–8362. [Google Scholar] [CrossRef]
  27. Zhang, M.; Shi, Y.; Guan, R. Micelle-assisted electrodeposition of mesoporous PtCo nodular films and their electrocatalytic activity towards the hydrogen evolution reaction in acidic media. Fuel 2025, 381, 133288. [Google Scholar] [CrossRef]
  28. Chen, Y.; Zhang, J.; Guan, R. Magnetic field-controlled bubble templated CuNi foam films and their performance towards hydrogen evolution reaction in alkaline media. Int. J. Hydrogen Energy 2024, 59, 625–634. [Google Scholar] [CrossRef]
  29. Eiler, K.; Fornell, J.; Sort, J. Tailoring magnetic and mechanical properties of mesoporous single-phase Ni–Pt films by electrodeposition. Nanoscale 2020, 12, 7749–7758. [Google Scholar] [CrossRef]
  30. Eugénio, S.; Silva, T.M.; Montemor, M.F. Electrodeposition and characterization of nickel–copper metallic foams for application as electrodes for supercapacitors. J. Appl. Electrochem. 2014, 44, 455–465. [Google Scholar] [CrossRef]
  31. Laschuk, N.O.; Easton, E.B.; Zenkina, O.V. Reducing the resistance for the use of electrochemical impedance spectroscopy analysis in materials chemistry. RSC Adv. 2021, 11, 27925–27936. [Google Scholar] [CrossRef] [PubMed]
  32. Zhou, Q.; Li, G.; Li, R. Preparation and antioxidation of Cu-Sn composite coating on the surface of Cu-coated carbon fibers. Surf. Interf. 2022, 31, 102016. [Google Scholar] [CrossRef]
  33. Liao, X.-N.; Cao, F.-H.; Cao, C.-N. In-situ investigation of atmospheric corrosion behavior of bronze under thin electrolyte layers using electrochemical technique. Trans. Nonferrous Met. Soc. China 2012, 22, 1239–1249. [Google Scholar] [CrossRef]
  34. Yang, X.; Wu, W.; Chen, K. Investigation on the electrochemical evolution of the Cu-sn-Pb ternary alloy covered with CuCl in a simulated atmospheric environment. J. Electroanal. Chem. 2022, 921, 116636. [Google Scholar] [CrossRef]
  35. Kear, G.; Barker, B.D.; Walsh, F.C. Electrochemical corrosion of unalloyed copper in chloride media––A critical review. Corros. Sci. 2004, 46, 109–135. [Google Scholar] [CrossRef]
  36. Chmielová, M.; Seidlerová, J.; Weiss, Z. X-ray diffraction phase analysis of crystalline copper corrosion products after treatment in different chloride solutions. Corros. Sci. 2003, 45, 883–889. [Google Scholar] [CrossRef]
  37. Grayburn, R.; Dowsett, M.; Adriaens, A. Tracking the progression of bronze disease—A synchrotron X-ray diffraction study of nantokite hydrolysis. Corros. Sci. 2015, 91, 220–223. [Google Scholar] [CrossRef]
  38. Wang, T.; Wang, J.; Wu, Y. The inhibition effect and mechanism of l-cysteine on the corrosion of bronze covered with a CuCl patina. Corros. Sci. 2015, 97, 89–99. [Google Scholar] [CrossRef]
  39. Khaled, K.F.; Fadl-Allah, S.A.; Hammouti, B. Some benzotriazole derivatives as corrosion inhibitors for copper in acidic medium: Experimental and quantum chemical molecular dynamics approach. Mater. Chem. Phys. 2009, 117, 148–155. [Google Scholar] [CrossRef]
  40. Kellenberger, A.; Vaszilcsin, N.; Duteanu, N. Kinetics of hydrogen evolution reaction on skeleton nickel and nickel–titanium electrodes obtained by thermal arc spraying technique. Int. J. Hydrogen Energy 2007, 32, 3258–3265. [Google Scholar] [CrossRef]
  41. Li, B.; Qu, H.; Chen, H. Copper alloying content effect on pitting resistance of modified 00Cr20Ni18Mo6CuN super austenitic stainless steels. Corros. Sci. 2020, 173, 108791. [Google Scholar] [CrossRef]
  42. Meddings, N.; Heinrich, M.; Park, J. Application of electrochemical impedance spectroscopy to commercial Li-ion cells: A review. J. Power. Sources 2020, 480, 228742. [Google Scholar] [CrossRef]
  43. Gateman, S.M.; Gharbi, O.; Vivier, V. On the use of a constant phase element (CPE) in electrochemistry. Curr. Opin. Electrochem. 2022, 36, 101133. [Google Scholar] [CrossRef]
  44. Tsao, L.C.; Chen, C.W. Corrosion characterization of Cu–Sn intermetallics in 3.5wt.% NaCl solution. Corros. Sci. 2012, 63, 393–398. [Google Scholar] [CrossRef]
  45. Zeng, C.; Zhang, B.; Guo, S. Mechanical, thermal, and corrosion properties of Cu-10Sn alloy prepared by laser-powder-bed-fusion additive manufacturing. Addit. Manuf. 2020, 35, 101411. [Google Scholar] [CrossRef]
  46. Feng, Y.; Teo, W.K.; Hsieh, A.K. The corrosion behaviour of copper in neutral tap water. Part I: Corrosion mechanisms. Corros. Sci. 1996, 38, 369–385. [Google Scholar] [CrossRef]
  47. Barcia, O.E.; D’Elia, E.; Tribollet, B. Application of the impedance model of de Levie for the characterization of porous electrodes. Electrochim. Acta 2002, 47, 2109–2116. [Google Scholar] [CrossRef]
Figure 1. (a,c) SEM images of Cu56Sn44 obtained without addition of nickel sulfate at the same potential; (b,d) SEM images of Cu43Sn57 obtained with the addition of nickel sulfate at the same potential; (e,f) elemental distribution of Cu56Sn44, (g,h) elemental distribution of Cu43Sn57.
Metals 15 00426 g001
Figure 2. Potentiostatic curves for Cu56Sn44 and Cu43Sn57.
Metals 15 00426 g002
Figure 3. The cross-section SEM of Cu56Sn44 (a,b) and Cu43Sn57 (c,d). (e) X-ray diffraction spectra of Cu56Sn44 and Cu43Sn57 Cu-Sn alloys in the 20–60° 2θ range.
Metals 15 00426 g003
Figure 4. Adhesion strength of (a) Cu56Sn44 film and (b) Cu43Sn57.
Metals 15 00426 g004
Figure 5. Tafel curves of Cu56Sn44 and Cu43Sn57 in NaCl (a) and HNO3 (b), respectively.
Metals 15 00426 g005
Figure 6. EIS Nyquist curves for Cu56Sn44 and Cu43Sn57 in 3.5 wt.% NaCl (a) and 0.1 M HNO3 (b), respectively, with equivalent circuits in the inset. Rs denotes the electrolyte resistance, Rct denotes the charge transfer resistance, and CPE denotes the conventional double-layer capacitance considering nonuniform diffusion.
Metals 15 00426 g006
Figure 7. (a,c) SEM images of Cu56Sn44 (without NiSO4) after corrosion in 3.5 wt.% NaCl solution; (b,d) SEM images of Cu43Sn57 (with NiSO4) after corrosion in 3.5 wt.% NaCl solution; (e) EDX spectrum of Cu56Sn44 after corrosion in 3.5 wt.% NaCl solution; (f) EDX spectrum of Cu43Sn57 after corrosion in 3.5 wt.% NaCl solution.
Metals 15 00426 g007
Figure 8. (a,c) SEM images of Cu56Sn44 (without NiSO4) after corrosion in 0.1 M HNO3 solution; (b,d) SEM images of Cu43Sn57 (with NiSO4) after corrosion in 0.1 M HNO3 solution; (e) EDX spectrum of Cu56Sn44 after corrosion in 0.1 M HNO3 solution; (f) EDX spectrum of Cu43Sn57 after corrosion in 0.1 M HNO3 solution.
Metals 15 00426 g008
Figure 9. High-resolution XPS spectra of Cu56Sn44: (a) Cu 2p of Cu56Sn44 prior to corrosion in 0.1 M HNO3, (b) Sn 3d of Cu56Sn44 prior to corrosion in 0.1 M HNO3, (c) Cu 2p of Cu56Sn44 after corrosion in 0.1 M HNO3, (d) Sn 3d of Cu56Sn44 after corrosion in 0.1 M HNO3.
Metals 15 00426 g009
Figure 10. High-resolution XPS spectra of Cu43Sn57: (a) Cu 2p of Cu43Sn57 prior to corrosion in 0.1 M HNO3, (b) Sn 3d of Cu43Sn57 prior to corrosion in 0.1 M HNO3, (c) Cu 2p of Cu43Sn57 after corrosion in 0.1 M HNO3, (d) Cu43Sn57 after corrosion in 0.1 M HNO3 Sn 3d after corrosion.
Metals 15 00426 g010
Table 1. Parameters of fitted Tafel curves in 3.5 wt.% NaCl solution.
SampleEcorr (V)jcorr (mA cm−2)Rp
(Ω cm2)
βa
(V dec−1)
βc
(V dec−1)
Cu56Sn44−0.259 V9.456 × 10−60.35 × 1065.3672.920
Cu43Sn57−0.186 V1.248 × 10−60.39 × 1065.7804.587
Table 2. Parameters of fitted Tafel curves in 0.1 M HNO3 solution.
SampleEcorr (V)jcorr (mA cm−2)Rp
(Ω cm2)
βa
(V dec−1)
βc
(V dec−1)
Cu56Sn44−0.065 V5.384 × 10−51.21 × 1059.9786.032
Cu43Sn57−0.028 V2.630 × 10−52.11 × 1059.8754.722
Table 3. Best fit estimates of electric equivalent circuit parameters obtained from the impedance of Cu56Sn44 and Cu43Sn57 in 3.5 wt.% NaCl solution.
SampleCu56Sn44Cu43Sn57
Rs (Ω cm2)11.39.95
Rct (Ω cm2)19,58235,530
CPE1-T (Sn−1 cm−2)4.12 × 10−53.15 × 10−5
CPE1-P0.850.93
Table 4. Best fit estimates of electric equivalent circuit parameters obtained from the impedance of Cu56Sn44 and Cu43Sn57 in 0.1 M HNO3 solution.
SampleCu56Sn44Cu43Sn57
Rs (Ω cm2)16.1512.48
Rct (Ω cm2)12,05627,479
CPE1-T (Sn−1 cm−2)4.58 × 10−51.16 × 10−5
CPE1-P0.920.93
Disclaimer/Publisher’s Note: The statements, opinions and data contained in all publications are solely those of the individual author(s) and contributor(s) and not of MDPI and/or the editor(s). MDPI and/or the editor(s) disclaim responsibility for any injury to people or property resulting from any ideas, methods, instructions or products referred to in the content.

