Article

Sound Velocities in Vanadium Reveal Complex Elastic Behavior at High Pressures

1
Department of Geosciences, Stony Brook University, Stony Brook, NY 11794, USA
2
Mineral Physics Institute, Stony Brook University, Stony Brook, NY 11794, USA
*
Authors to whom correspondence should be addressed.
Metals 2025, 15(4), 427; https://doi.org/10.3390/met15040427
Submission received: 25 February 2025 / Revised: 4 April 2025 / Accepted: 8 April 2025 / Published: 10 April 2025

Abstract

:
Compressional (VP) and shear (VS) wave velocities of polycrystalline vanadium were measured simultaneously up to 11.5 GPa at room temperature using ultrasonic interferometry in a multi-anvil press. Complex softening behavior in VS and resulting shear moduli are discovered, possibly revealing a precursor to the reported phase transition within 30–60 GPa. The current data enables a comprehensive assessment of the elastic and mechanical properties of vanadium at high pressures, including bulk and shear moduli, Young’s modulus, Poisson’s ratio, and Pugh’s ratio. Through fitting to the 3rd-order finite strain equations, the elastic moduli and their pressure derivatives were determined to be KS0 = 151 (2) GPa, G0 = 46.9 (8) GPa, K’S0 = 3.47 (5), and G’0 = 0.62 (1). These experimental results allow us to compare with and benchmark the existing Steinberg–Guinan models for extrapolations to extreme pressure and temperature conditions.

1. Introduction

Vanadium (V), a transition metal in Group 5 (V, Nb, Ta), possesses varioususes in engineering due to its attractive material properties such as adding strength and corrosion resistance to various steel alloys. These vanadium steel alloys, which account for 93% of vanadium use in the USA [1], can be found in spacecraft, nuclear reactors, and aircraft carriers [2]. The vanadium–titanium alloys used in jet engines and airframes are irreplaceable in those extreme conditions [2]. Therefore, it is evident that understanding vanadium’s material properties at extreme conditions of pressure and temperature is needed.
Group 5 metals were originally thought to remain stable in the body-centered cubic (BCC) structure to ultrahigh pressures until the softening in the transverse acoustic phonon mode of vanadium at high pressures was predicted by density functional theory (DFT) calculations [3]. As shown in [4,5], the C44 elastic constant of vanadium was found to continually decrease to zero and become negative, suggesting that a mechanical instability in the BCC structure was reached within 120–280 GPa [4,5]. In contrast, tantalum (also a Group 5 metal) remained in the BCC structure up to 174 GPa [6]. Subsequent experimental investigations showed that vanadium underwent a BCC to rhombohedral structural phase transition at pressures lower than originally predicted by DFT studies, with observations at hydrostatic conditions around 62 GPa in a diamond anvil cell (DAC) [7] and purposefully non-hydrostatic conditions of 30 GPa [8]. This transition was proposed to occur due to a combination of Fermi surface nesting, Jahn–Teller band effects, and Kohn anomalies [4,5,7,9,10,11]. DFT calculations confirmed these experimental results, concluding that the rhombohedral phase was stable above 84 GPa [12,13]. Recently, Stevenson et al. [14] conducted a series of powder and single crystal diffraction studies on vanadium with various pressure media, revealing inconsistencies with many of these reported studies on the nature of the BCC to rhombohedral phase transition. Stevenson et al. [14] were uncertain if the BCC to rhombohedral structural phase transition was significantly below 120 GPa due to the ever-so-slight change in the α angle of the primitive BCC unit cell. Furthermore, Stevenson et al. [14] proposed that vanadium may have a very high sensitivity to the hydrostaticity of the sample environment as was first hypothesized by Ding et al. [7] and Jenei et al. [8].
The literature has focused on vanadium’s phase transitions at moderate- to ultrahigh-pressures (30–300 GPa), however, its elastic behavior and physical properties at low to moderate pressure regimes (<30 GPa) have rarely been directly studied by experiments or theoretical investigations. To date, most experimental studies have used DACs or gas guns and primarily utilized XRD to determine volume changes as a function of pressure and/or temperature which have led to a considerable understanding of vanadium’s structural and compressional behavior to extremely high pressures [7,8,9,14], but there is a gap in understanding vanadium’s experimentally derived material properties, such as its shear moduli, even at moderate pressures. To date, much of our knowledge on vanadium’s shear behavior at high pressure has been from DFT studies, such as those performed by Koci et al. [11] and Wang et al. [15] who determined vanadium’s elastic constants (C11, C12, and C44) and calculated the shear modulus [9,16]. There is a lack of direct experimental determination of the longitudinal (VP) and shear wave (VS) velocities at high pressures to corroborate these DFT studies and compare them with those from shock experiments [16,17,18,19].
In this study, both compressional and shear wave travel times were measured simultaneously at moderate pressures with ultrasonic techniques for the first time, allowing us to determine the bulk (K) and shear (G) moduli at high pressures. In addition, from K and G, the Poisson’s ratio, Young’s modulus, and Pugh’s ratio were calculated. The elastic moduli and their pressure derivatives at ambient conditions were determined by fitting the measured velocity data to the third-order finite strain equations. Lastly, we compare these experimental results to Steinberg–Guinan models.

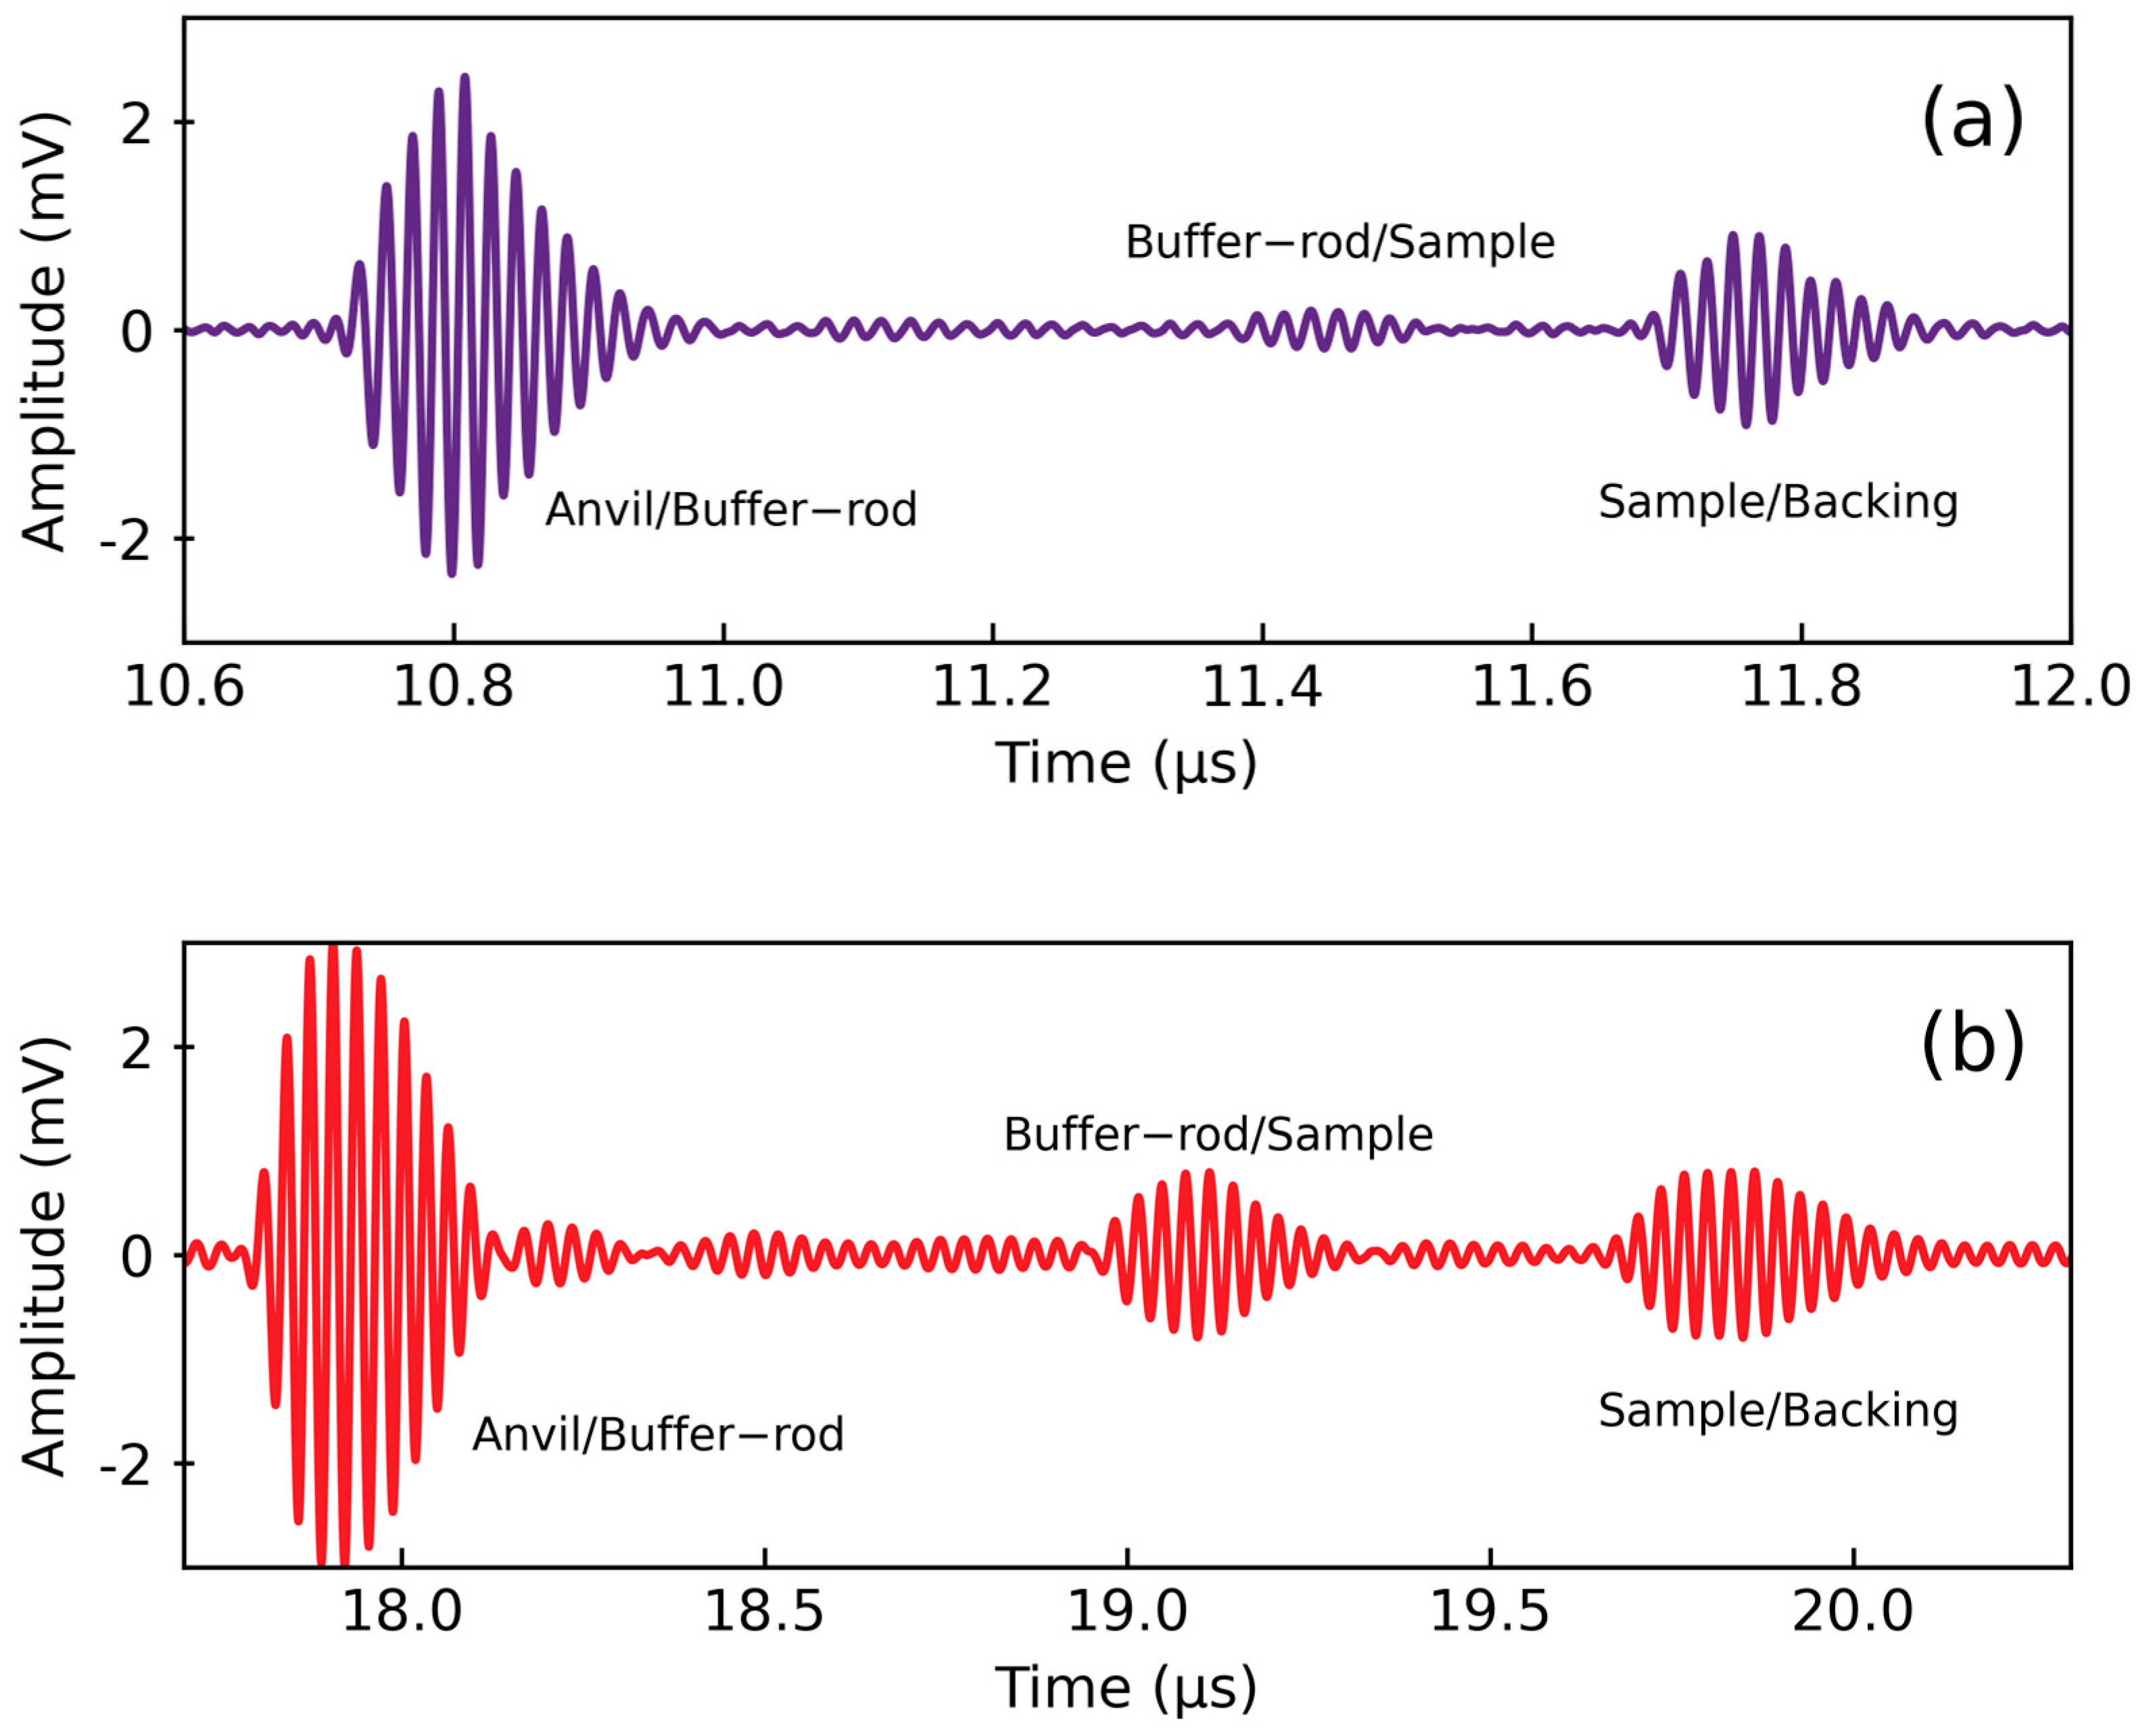
2. Materials and Methods

Polycrystalline vanadium was cut from a vanadium rod (purity 99.8%) obtained from ESPI Metals in Ashland, OR, USA. The vanadium specimen was a cylinder with a final diameter of 2.809 (1) mm and was 1.020 (1) mm in length. The bulk density was determined to be 6.07 (2) g/cm3 with the Archimedes immersion method and is within 0.33% of the theoretical value of 6.090 g/cm3 [17].
High-pressure compressional and shear wave velocities were measured up to 11.4 GPa at room temperature using ultrasonic interferometry in a 1000-ton uniaxial split cylinder apparatus (USCA-1000) with a Walker-type multi-anvil module (Rockland Research Corp. West Nyack, NY, USA) in the High-Pressure Lab at the State University of New York at Stony Brook. A 14/8 cell assembly for ultrasonic measurements was used and has been described in depth elsewhere [20,21] (Figure 1).
Briefly, tungsten carbide (WC) cubes with a truncation edge length of 8 mm and an MgO octahedron with 14 mm edge lengths were used as the second-stage anvils and pressure transmitting medium, respectively. A dual-mode LiNbO3 piezoelectric transducer (50 MHz for P-waves and 30 MHz for S-waves) was mounted on a truncated and polished corner of one WC anvil to generate and receive the P and S-waves across the entire frequency range (20–75 MHz). The acoustic response from the sample chamber was acquired using the transfer function method [22]. P- and S-wave travel times were determined using the pulse-echo-overlap technique at the frequency associated with P- and S-waves for the LiNbO3 transducer, 50 and 30 MHz, respectively [22,23]. A detailed overview of measuring the ultrasonic travel times is provided in sources [22,23]. Travel times measured with this method have an uncertainty of 0.2 ns due to the time resolution of the oscilloscope. Besides travel time measurements, no additional processing was performed. An example of the acoustic signals can be seen in Figure 2a,b.
As shown in Figure 1, a NaCl disk and an Al2O3 buffer rod were in contact with the specimen front and rear surfaces to serve as backing material and the acoustic buffer rod, respectively. There was also an additional lead disk behind the NaCl as more backing material to ensure pseudo-hydrostatic conditions. The polycrystalline Al2O3 buffer rod was 3.76 (1) mm long and its S-wave travel time served as the internal pressure marker, developed by Wang et al. [21]. This pressure scale has an uncertainty of ± 0.18 GPa at ambient temperatures [21]. The specimen, truncated corners of the WC cubes, and the Al2O3 buffer rod surfaces were all polished with 1 μm diamond paste before compression to ensure acoustic data quality.

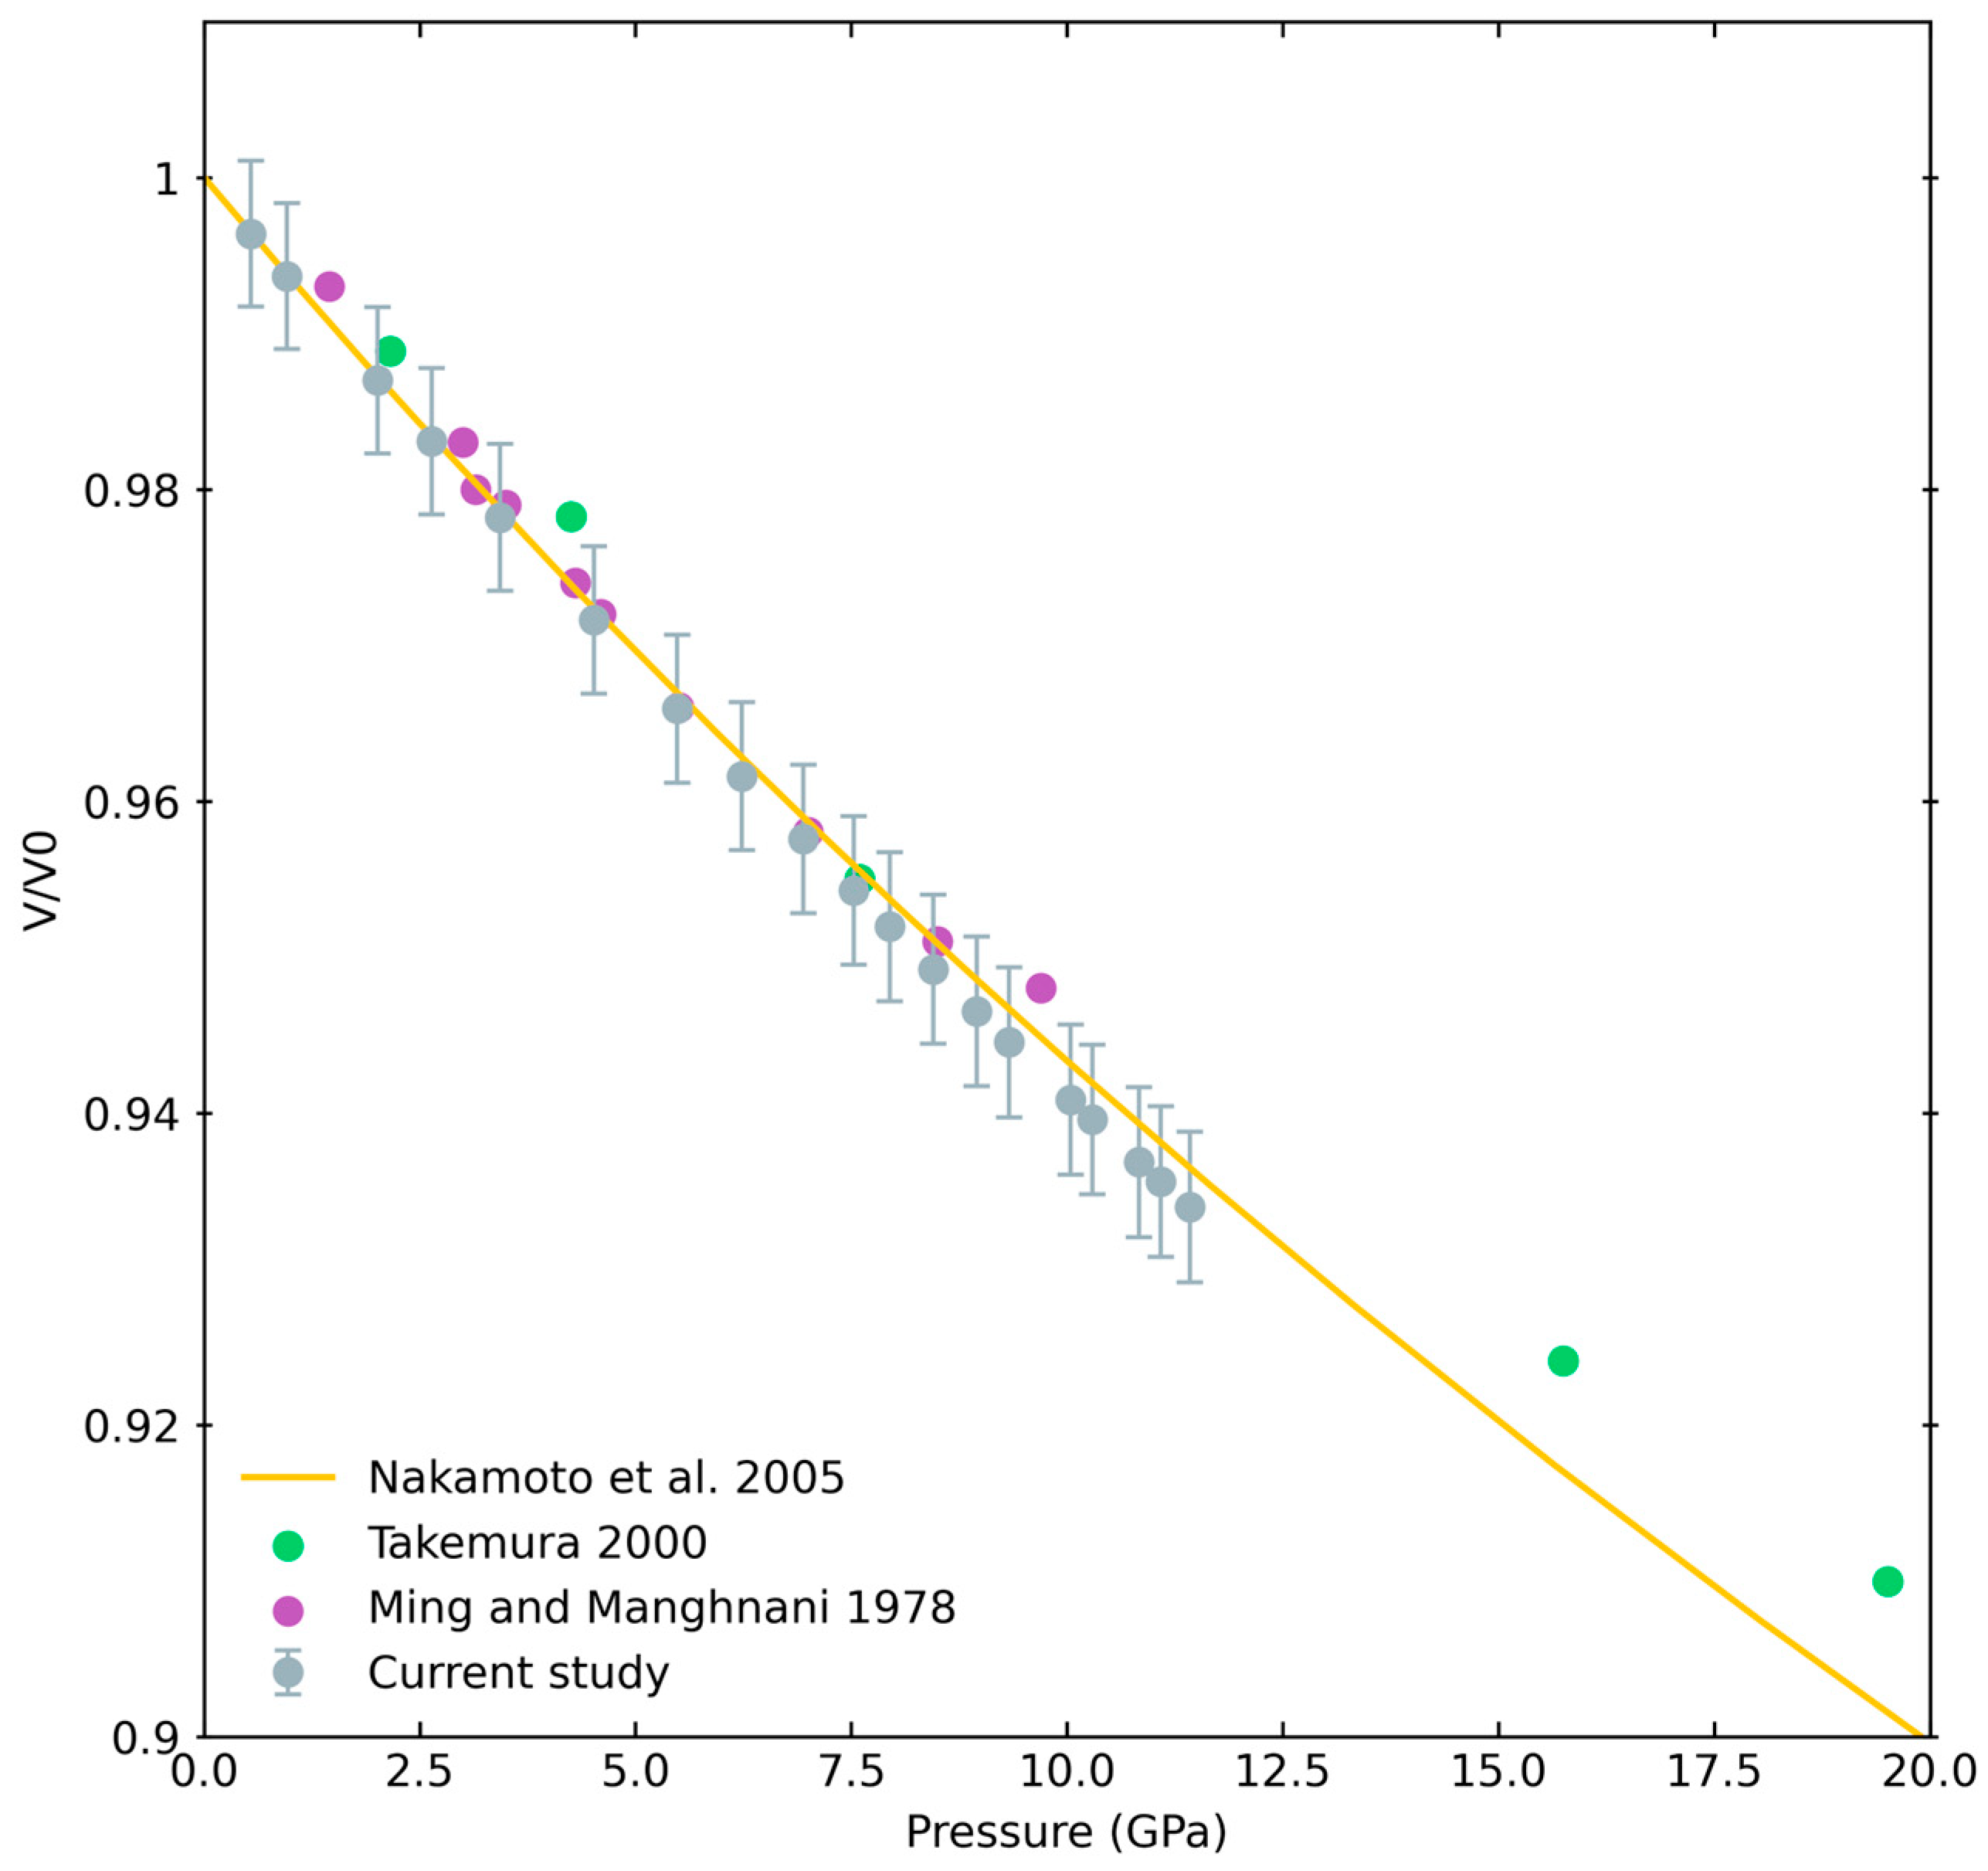
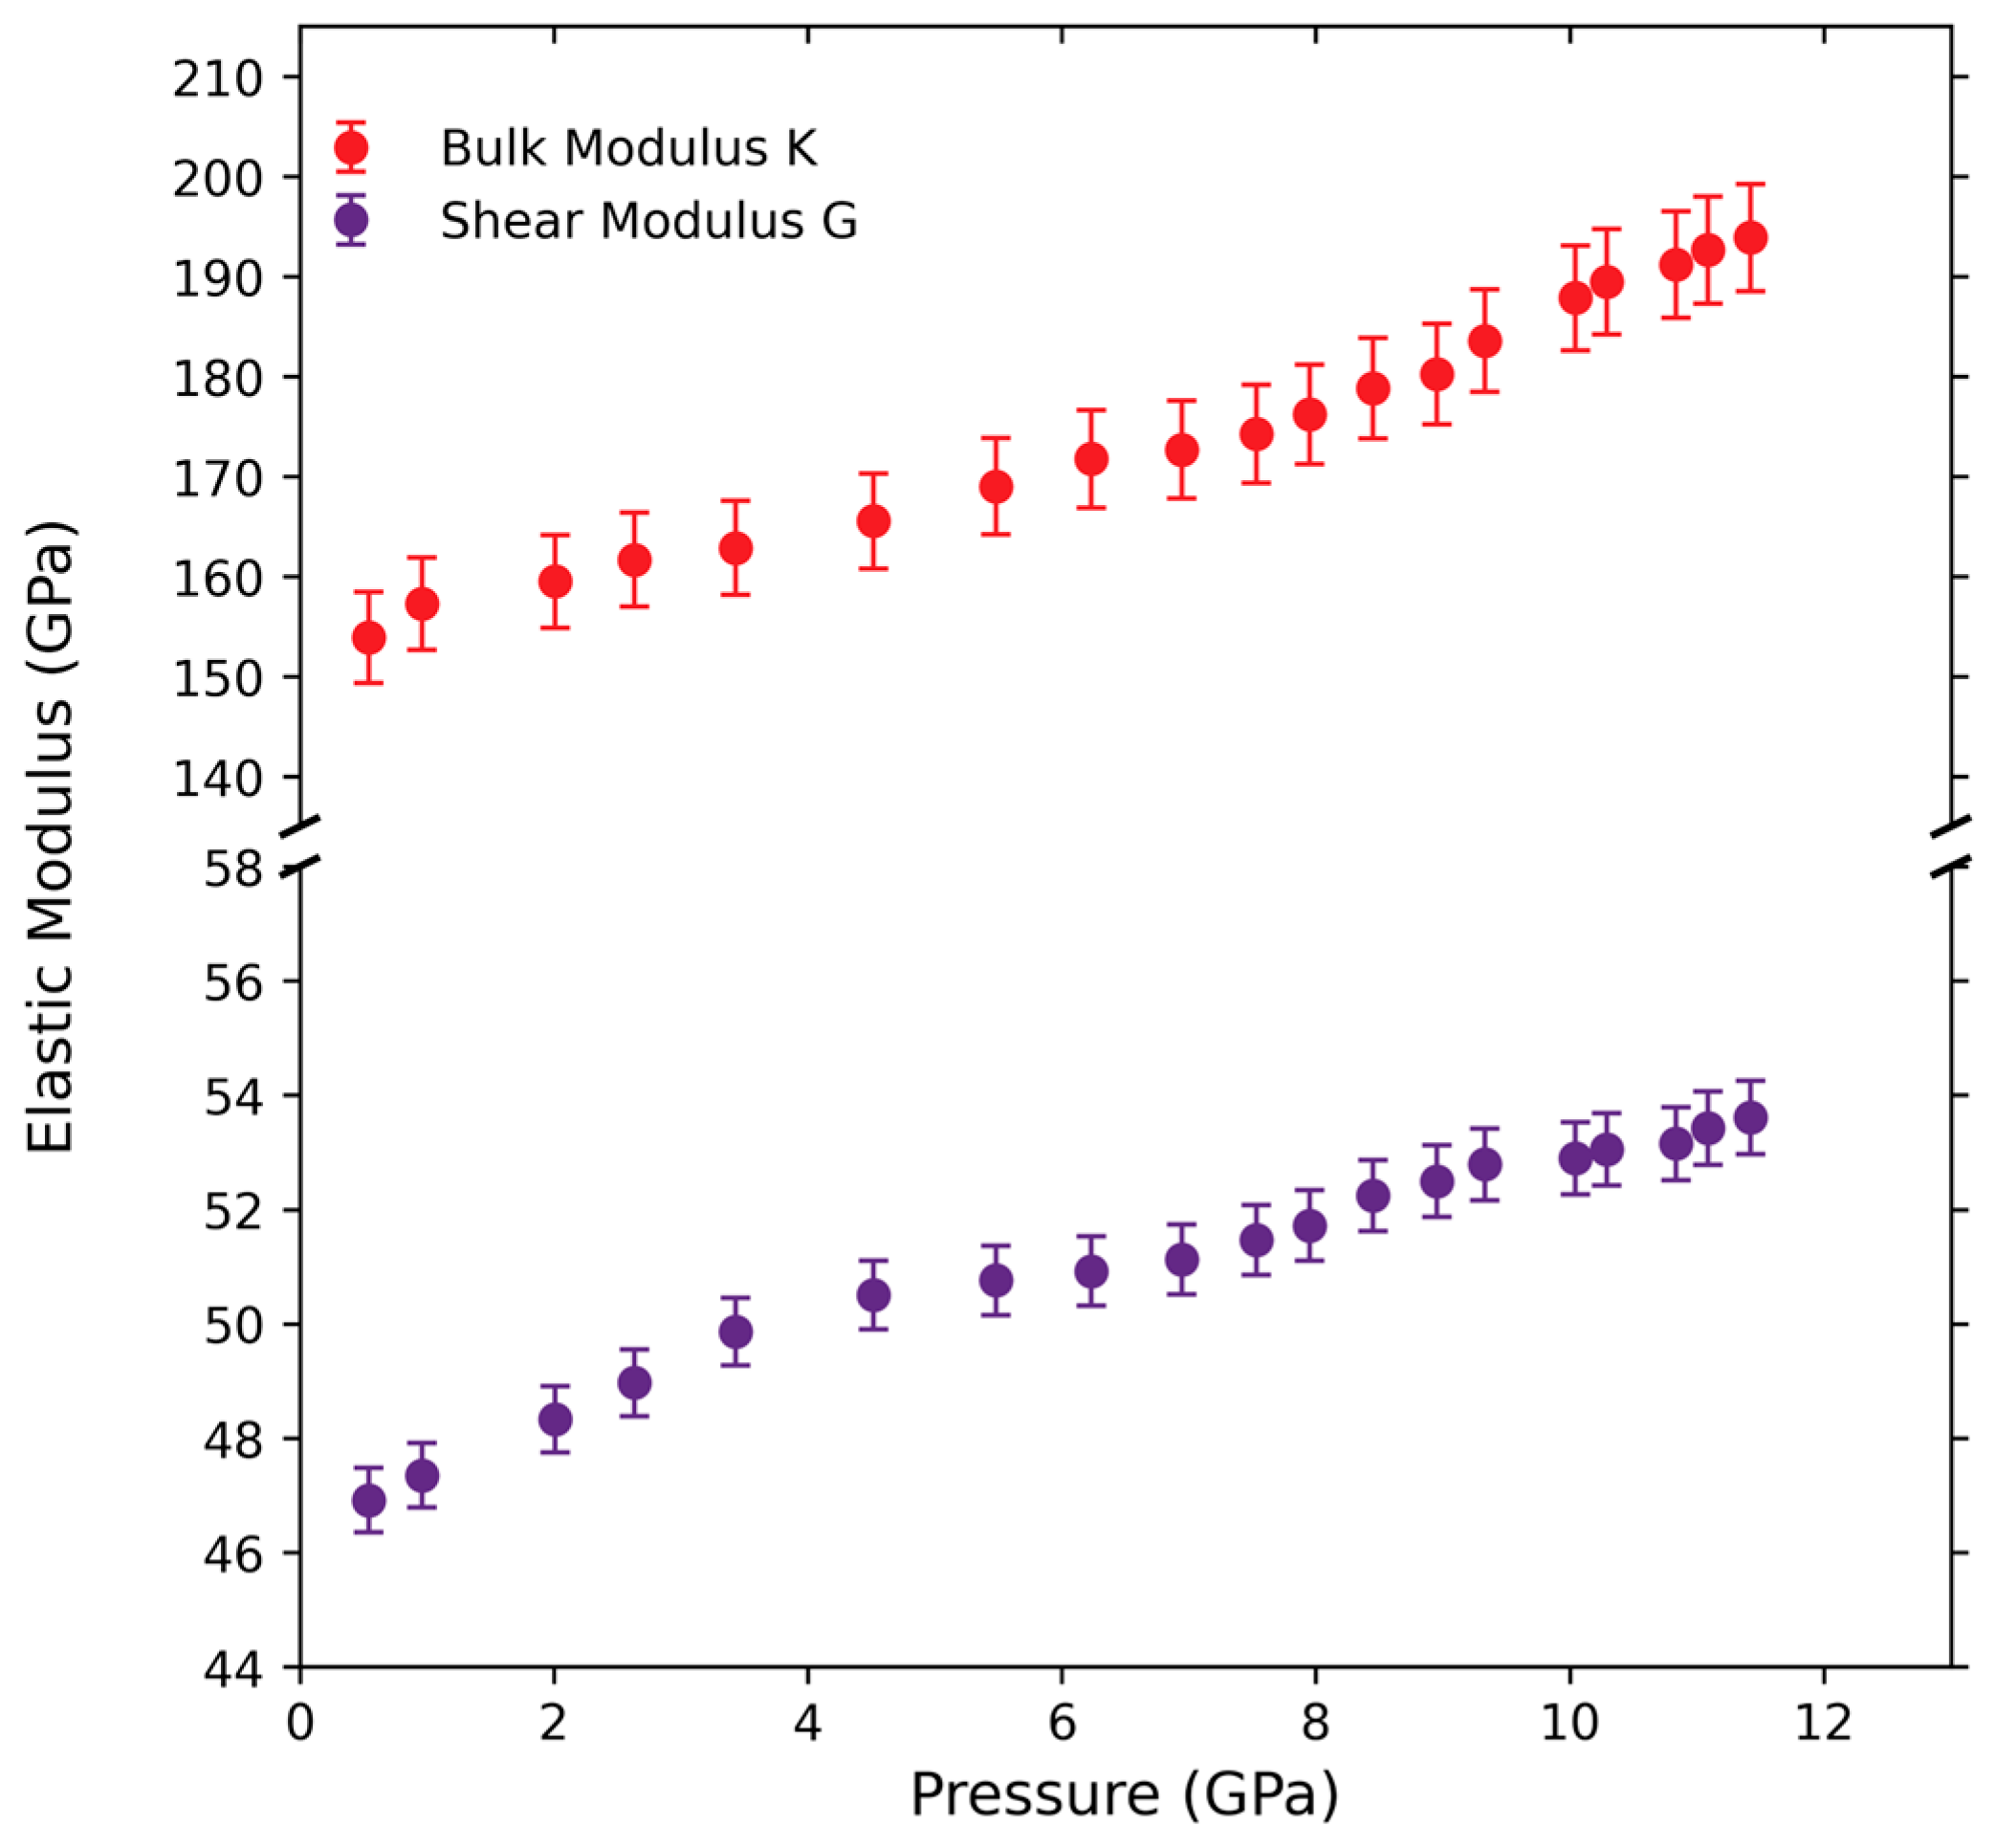
3. Results and Discussion

The travel times of the P- and S-waves were measured by shifting the sample/backing echo to overlap with the buffer-rod/sample echo shown in Figure 2. The long tail of the S waveform signal of the sample/backing echo suggested that it was likely affected by interferences from spurious sources, causing a gradual phase shift in the later part of the waveform. Thus, the first peak of the waveforms was used in the pulse echo overlap technique instead of the entire waveform. This likely results in greater uncertainties in the highest-pressure measurements than shown with error bars. After the high-pressure experiment, the cylindrical specimen was measured to have the same dimensions within mutual uncertainties, suggesting that the specimen had experienced no plastic deformation under a quasi-hydrostatic environment. The velocities at high pressure were calculated with Equation (1):
V P / S = L T P / S ,
where VP and VS are the P- (compressional) and S-wave (shear) velocities, respectively, L is the specimen’s length at each high-pressure datum, and TP/S is the measured one-way travel time for the P- and S-waves. The specimen’s length at each high-pressure datum was determined using Cook’s method [24], Equation (2):
L 0 L = 1 + 1 + α γ T 12 ρ 0 L 0 2 0 P 1 1 ( 2 T P ) 2 4 3 ( 2 T S ) 2 d P ,
where L0 is the original length of the specimen at ambient conditions, α is the thermal expansion coefficient, γ is the Gruneisen parameter, T is the temperature in Kelvin, and ρ0 is the specimen’s density at ambient conditions. Values adopted in the current study are = 4.6 ( 6 ) × 1 0 5   K 1 [25], γ = 1.23 [26], ρ0 = 6.07(2) g/cm3 (Archimedes immersion method), and T = 300 K. From the lengths determined with Cook’s method, the densities were calculated at each pressure using Equation (3):
ρ 0 ρ = L L 0 3 .
With the derived densities and velocities, the bulk (K) and shear (G) moduli were calculated at each high-pressure datum with Equations (4) and (5), respectively.
K = ρ V P 2 4 V S 2 3 ,
G = ρ V S 2 .
From these high-pressure K and G values, Young’s modulus, E, and Poisson’s ratio, ν, were calculated at each high-pressure datum with Equations (6) and (7), respectively:
E = 9 K G 3 K + G ,
ν = 3 K 2 G 2 ( 3 K + G ) .
These experimental results and calculated elastic properties are summarized in Table 1. The resulting uncertainties are less than 0.5% and 1.5% for the elastic wave velocities and elastic moduli, respectively. The sources of propagated uncertainty come from the travel time measurement using the pulse echo overlap technique, the initial length of the specimen, the pressure calibration, the density determined with the Archimedes immersion method, and the thermodynamical constant α. No uncertainties resulting from sample alignment are considered since the specimen remained the same length before and after compression. The volumetric compression of vanadium from the current data was compared to previous studies at room temperature in Figure 3. The excellent agreement with the data from hydrostatic compressions [27,28,29] further confirms that the current vanadium specimen maintained a quasi-hydrostatic environment in the entire course of the current experiment.
The compressional (VP) and shear (VS) wave velocities as a function of pressure are plotted in Figure 4. The VP increases monotonically at nearly a linear rate of 0.037 km/s/GPa within error (Figure 4) whereas the VS, although marginal within experimental errors, appears to exhibit a slope change at pressures within 4–5 GPa (Figure 4). VS increases at an initial larger rate of 0.0205 km/s/GPa until 4 GPa after which softening occurs, resulting in a much slower (0.0043 km/s/GPa) increase in VS, increasing from 2.85 km/s to 2.87 km/s and from 4.5 GPa to 11.4 GPa in pressure.
Antonangeli et al. [9] conducted inelastic X-ray scattering (IXS) experiments and reported a near pressure-independent C44 within 0–30 GPa, which is in excellent agreement with predictions by previous DFT studies on vanadium [30]. The softening in VS we observed, that is, the decrease in the slope of the pressure dependence of VS to a much-reduced lower rate, is also consistent with the IXS experimental data as well as previous DFT calculations [4,5,7,9,10,11,15]. The softening in the VS we observed is interpreted as a precursor to the onset of the BCC to a rhombohedral phase transition, which is seen at pressures as low as 30 GPa [8]. Further studies should be performed on vanadium single crystals to carefully determine the C44 (shear), C11, and C12 elastic constants. A similar trend to the VP and VS is visible in K and G (albeit less pronounced) at high pressures (Figure 5).
Young’s modulus (Figure 6a), Poisson’s ratio (Figure 6b), and the Pugh ratio (K/G) (Figure 6b) are important when determining a material’s strength and ductility and evaluating when failure may occur (Table 1). Based on the current data, Young’s modulus increases monotonically within error from 128.9 GPa to 147.1 GPa (Figure 6a) with a slight change in slope at ~4.5 GPa corresponding to the softening of the shear modulus in Figure 4. In contrast, despite the large errors, Poisson’s ratio (Figure 6b) shows only a slight increase from 0.363 to 0.373 over the pressure range of the current study. This observation is in good agreement with the weak pressure dependence of the Poisson’s ratio of tantalum within 0–13.6 GPa reported by Qi et al. [30]. A commonly used indicator that a material is ductile or brittle is the Pugh ratio, K/G, and, when K/G > 1.75, the material is defined as being ductile [31]. As shown in Figure 6b, a change in the pressure dependence of the Pugh ratio can be clearly seen at ~4.5 GPa. At P < 4.5 GPa, the Pugh ratio exhibits negligible variation with pressure, whereas, at P > 4.5 GPa, vanadium becomes even more ductile as pressure increases with a Pugh value reaching ~3.6 at 11.4 GPa (Figure 6b).
To obtain the adiabatic bulk and shear moduli and their pressure derivatives at ambient conditions, the velocity and density data were fitted to the third order finite strain equations, Equations (8) and (9) [32]:
V P 2 = ( 1 2 ε ) 5 2 ( L 1 + L 2 ε ) ,
V S 2 = ( 1 2 ε ) 5 2 M 1 + M 2 ε ,
ε = 1 2 1 ρ ρ 0 2 3 ,
where ε is the Eulerian finite strain and defined in Equation (10), and L1, L2, M1, and M2 are the fitted coefficients, and they are related to the bulk and shear modulus at ambient conditions as shown in Equations (11)–(14):
K S 0 = L 1 4 3 M 1 ,
G 0 = M 1 ,
K S 0 = 5 L 1 L 2 3 K S 0 4 3 G 0 , T ,
G 0 = 5 M 1 M 2 3 K S 0 .
In the least squares fitting procedure, L1, L2, M1, and M2 were refined by minimizing the difference between the calculated (from Equations (8) and (9)) and the directly observed P- and S-wave velocities (from Equation (1), see also Table 1) (Figure 4). These fitted coefficients were then used to calculate the adiabatic bulk (KS0) and shear (G0) moduli as well as their pressure derivatives K’S0 and G’0, respectively, using Equations (11)–(14). With the data in Table 1, the current least-squares fitting yielded KS0 = 151 (2) GPa, G0 = 46.9 (8) GPa, K’S0 = 3.47 (5), and G’0 = 0.62 (1). The fitted velocities and the experimental velocities are compared in Figure 4. The resulted P- and S-wave velocities at ambient conditions from this study are VP0 = 5.93 (4) km/s and VS0 = 2.78 (2) km/s, respectively, which agree within 2σ uncertainties with the values for an isotropic and homogeneous polycrystalline vanadium, VP0 = 6.02 km/s and VS0 = 2.80 km/s, which are derived from the elastic constants from Katahara et al. (1979) [33].
The results for the bulk and shear moduli and their pressure derivatives are compared to previous studies in Table 2. The bulk modulus and its pressure derivative derived from past pressure–volume compression studies exhibit a wide variation, ranging from 150.4 to 179 GPa and from 3.11 to 5.5, respectively. Our results are in closer agreement with the lower bounds of these literature values. In brief, our bulk modulus K0 value agrees with previous ultrasonic data from Katahara et al. [33] and Bolef et al. [34] within 3.8%. Our K0 value also agrees with many hydrostatic DAC XRD studies [25,27,29] and disagrees with the nonhydrostatic DAC studies [7,8], which had a K0 of 179 and 195 GPa. K0 values determined with DFT calculations seem to be unreliable and highly varied, with a K0 range from 143 to 183 GPa (Table 2) [4,11,15,25,35]. In contrast, the shear modulus from this study, G0 = 46.9(8) GPa, is in excellent agreement with the experimentally reported value of 46.8(5) GPa by Yu et al. [19] and within 2.3% of those from Bolef et al. [34] and Katahara et al. [33]. While the ambient shear modulus results, G0, from all experimental studies show a reasonable agreement within 46.8–48.1 GPa, they are significantly different than the DFT calculated values of Koci et al. [11] and Wang et al. [15], which are 35.26 GPa and 32.02 GPa, respectively. As explained by Wang et al. [36], DFT calculations with current exchange-correlation functionals, including the local-density approximation (LDA), generalized gradient approximation (GGA), meta-GGA, hybrid LDA and GGA, DFT+U, and van der Waals, all underestimate the shear modulus of vanadium (and other Group 5 metals) significantly. This phenomenon has also been observed in DFT calculations by Qi et al. [30] on another Group 5 metal, tantalum.
Our pressure derivative of the bulk modulus is ~18% lower than that from measurements made at pressures up to 0.5 GPa. By contrast, the pressure derivative of the shear modulus from our study is 24% higher than that reported by Katahara et al. [33]. Despite the different pressure ranges between these two studies, the lower density of the vanadium specimen compared to those in Katahara et al. [33] may also have contributed to the discrepancies.
The Steinberg–Guinan (SG) model [40,41] for the shear modulus, Equation (15), has a wide range of applications due to its capability to separate the effects of pressure and temperature on the elasticity of materials.
G P , T = G 0 + d G d P P V 0 V 1 3 d G d T T T 0
where G is the shear modulus at a particular pressure, P, and temperature, T, G0 is the ambient shear modulus, dG/dP is the pressure derivative of the shear moduli, V0 is the volume at ambient conditions, V is the volume at each (P,T), dG/dT is the temperature derivative of the shear modulus, and T0 is the ambient temperature. Its applications include understanding how to manufacture metals for shock and impact engineering uses. The standard SG model assumes that increasing pressure should cause a material to harden, that is, its elastic moduli to increase, and that increasing temperature should soften a material, that is, cause its elastic moduli to decrease [40,41] (Figure 7b). These basic assumptions have been disproven for some metals, such as vanadium [4], where, at high pressures (>100 GPa), the C44 elastic constant decreased to negative values, becoming imaginary. This introduced the compression-induced softening (CIS) concept to Group 5 metals at high pressure. This led Wang et al. [15] to develop a modified SG (MSG) model for vanadium to adequately describe the CIS by adding a corrective term to the original SG model (see Equations (3) and (4) in [16]). Our data serves as a benchmark for the MSG model at these moderate pressures, and now, predictions from SG models can be reevaluated at lower pressures with our new KT0, K’T0, G0, and G’0 values. When Wang et al.’s [15] G0 and G’0 values are modified to our values, the results obtained from the proposed MSG model are remarkably similar to both our experimental and finite strain values at low pressures (Figure 7a brown diamonds). At higher pressures, the results from the original models converge around the BCC to rhombohedral phase transition (~60 GPa) (Figure 7b). For investigations below 30 GPa, Wang et al.’s [15] modified SG model with our G0 and G’0 should be utilized.
Using the fitted finite strain velocities, G was recalculated with Equation (5) and extrapolated to higher pressures (Figure 7b). The standard SG model [41] is linear, and our finite strain derived values match the SG model predictions of [41] at pressures below 30 GPa within mutual uncertainties but start to gradually deviate from the SG data (Figure 7b) with further increase in pressure. One discrepancy lies in that the SG model of [41] has a G0 = 48.1 GPa and a G’0 = 0.4906, and the lower pressure derivative G’0 of [41] is believed to be responsible for the increased deviations at pressures greater than 30 GPa. In comparison, Foster et al. [42] assumed shear moduli from the standard SG model based on their shocked vanadium XRD measurements. Their lowest pressure data was at 11.7 GPa, just above our highest at 11.4 GPa, and their extrapolated data to our pressure range are also similar (Figure 7a). Foster et al. [42] overall data are mostly in line with the standard SG model, with lower values at high pressure, but they do not capture the CIS anomaly that has been observed [4,36]. Rudd and Klepeis [43] incorporated the CIS at high pressures that Wang et al. [15] also included, however, the severity of this CIS is much reduced (Figure 7b). Nonetheless, the values of the shear modulus predicted by different models (Figure 7b) are in good agreement within mutual errors up to 30 GPa, except for those from Wang et al. [15] which derived a significantly lower G0 = 32.02 GPa from their DFT calculations. The discrepancies in these models are strongly tied to the input parameters, G0 and G’0, highlighting the importance of direct determination of the shear properties at high pressures for accurate predictions. More experimental shear modulus data at higher pressures are needed to verify these existing models and calculations.
Figure 7. (a) Comparison of shear modulus from this study’s experimental data (green square), finite strain analysis (purple star), the standard SG model [40,41] (dark red X), the Rudd and Klepeis updated SG model (orange plus) [43], the modified Steinberg–Guinan model [15] (yellow circle), [15] with this study’s G0 and G’0 (brown diamond), and Foster [42] (blue right triangular marker). (b) High pressure extrapolation of finite strain (purple), standard SG model [40] (dark red), Rudd and Klepeis (orange) [43], modified Steinberg–Guinan model [15] (yellow), [15] and this current study’s G0 and G’0 (brown), and Foster [42] (blue).
Metals 15 00427 g007

4. Conclusions

The compressional and shear wave velocities of bcc vanadium at room temperature were measured simultaneously for the first time up to 11.4 GPa in a large volume press with ultrasonic interferometry. Complex behavior of the shear modulus was described, possibly a precursor to its instability at much higher pressures relating to the BCC to rhombohedral phase transition. Using finite strain theory, the bulk and shear moduli, as well as their pressure derivatives, were determined to be KS0 = 151 (2) GPa, G0 = 46.9 (8) GPa, K’S0 = 3.47 (5), and G’0 = 0.62 (1). Further complex behavior of vanadium as a function of pressure was seen in its mechanical properties of Young’s modulus, Poisson’s ratio, and Pugh’s ratio, likely resulting from the softening of the C44. When compared to the SG and MSG models, our study shows that the shear modulus of vanadium predicted by the SG and MSG models agrees well with the finite strain calculations at moderate pressures (0–30 GPa), beyond which large discrepancy can be observed, presumably due to the difference in the effectiveness in describing the CIS anomaly in these empirical models. Further studies should be performed on vanadium single crystals to experimentally determine the C44, C12, and C11 elastic tensor values. Also, DFT studies on vanadium are needed to understand the complex P- and S-wave velocities observed in the pressure range of this study.

Author Contributions

Conceptualization, X.Q., B.L. and B.G.; methodology, X.Q. and B.L.; software, B.L.; validation, B.L. and R.W.; formal Analysis, B.G.; investigation, B.G. and X.Q.; resources, B.L.; data curation, X.Q., B.L. and B.G.; writing—original draft preparation, B.G.; writing—review and editing, B.L. and R.W.; visualization, B.G.; supervision, B.L.; project administration, B.L.; funding acquisition, B.L. All authors have read and agreed to the published version of the manuscript.

Funding

This research was funded by DOE/NNSA funding under grant NA0004085.

Data Availability Statement

The raw data supporting the conclusions of this article will be made available by the authors on request.

Conflicts of Interest

The authors declare no conflicts of interest.

Abbreviations

The following abbreviations are used in this manuscript:
GPaGigapascal
PPressure
TTemperature
BCCBody Centered Cubic
DACDiamond Anvil Cell
DFTDensity Functional Theory
LVPLarge Volume Press
XRDX-ray Diffraction
LDALocal-density approximation
GGAGeneralized gradient approximation
VPP-wave velocity
VSS-wave velocity
WCTungsten Carbide
MHzMegahertz
KBulk modulus
GShear modulus
EYoung’s modulus
νPoisson’s ratio
ρDensity
TPTravel time of the P-wave
TSTravel time of the S-wave
IXSInelastic X-ray scattering
SGSteinberg-Guinan model
VISARVelocity interferometer system for any reflector
VASPVienna Ab initio Simulation Package
PAWProjector-Augmented-Wave
CALPHADComputer Coupling of Phase Diagrams and Thermochemistry
MSGModified Steinberg-Guinan model
CISCompression Induced Softening

References

  1. Polyak, D.E. Vanadium Report; U.S. Geological Survey: Reston, VA, USA, 2013. [Google Scholar]
  2. Kelley, K.D.; Scott, C.; Polyak, D.E.; Kimball, B.E. Vanadium; U.S. Geological Survey: Reston, VA, USA, 2017. [Google Scholar]
  3. Suzuki, N.; Otani, M. Theoretical Study on the Lattice Dynamics and Electron–Phonon Interaction of Vanadium under High Pressures. J. Phys. Condens. Matter 2002, 14, 10869. [Google Scholar] [CrossRef]
  4. Landa, A.; Klepeis, J.; Söderlind, P.; Naumov, I.; Velikokhatnyi, O.; Vitos, L.; Ruban, A. Ab Initio Calculations of Elastic Constants of the Bcc V–Nb System at High Pressures. J. Phys. Chem. Solids 2006, 67, 2056–2064. [Google Scholar] [CrossRef]
  5. Landa, A.; Klepeis, J.; Söderlind, P.; Naumov, I.; Velikokhatnyi, O.; Vitos, L.; Ruban, A. Fermi Surface Nesting and Pre-Martensitic Softening in V and Nb at High Pressures. J. Phys. Condens. Matter 2006, 18, 5079. [Google Scholar] [CrossRef]
  6. Cynn, H.; Yoo, C.-S. Equation of State of Tantalum to 174 GPa. Phys. Rev. B 1999, 59, 8526–8529. [Google Scholar] [CrossRef]
  7. Ding, Y.; Ahuja, R.; Shu, J.; Chow, P.; Luo, W.; Mao, H. Structural Phase Transition of Vanadium at 69 GPa. Phys. Rev. Lett. 2007, 98, 085502. [Google Scholar] [CrossRef]
  8. Jenei, Z.; Liermann, H.P.; Cynn, H.; Klepeis, J.-H.P.; Baer, B.J.; Evans, W.J. Structural Phase Transition in Vanadium at High Pressure and High Temperature: Influence of Nonhydrostatic Conditions. Phys. Rev. B 2011, 83, 054101. [Google Scholar] [CrossRef]
  9. Antonangeli, D.; Farber, D.L.; Bosak, A.; Aracne, C.M.; Ruddle, D.G.; Krisch, M. Phonon Triggered Rhombohedral Lattice Distortion in Vanadium at High Pressure. Sci. Rep. 2016, 6, 31887. [Google Scholar] [CrossRef]
  10. Bosak, A.; Hoesch, M.; Antonangeli, D.; Farber, D.L.; Fischer, I.; Krisch, M. Lattice Dynamics of Vanadium: Inelastic X-Ray Scattering Measurements. Phys. Rev. B 2008, 78, 020301. [Google Scholar] [CrossRef]
  11. Koci, L.; Ma, Y.; Oganov, A.R.; Souvatzis, P.; Ahuja, R. Elasticity of the Superconducting Metals V, Nb, Ta, Mo, and W at High Pressure. Phys. Rev. B 2008, 77, 214101. [Google Scholar] [CrossRef]
  12. Lee, B.; Rudd, R.E.; Klepeis, J.E.; Söderlind, P.; Landa, A. Theoretical Confirmation of a High-Pressure Rhombohedral Phase in Vanadium Metal. Phys. Rev. B 2007, 75, 180101. [Google Scholar] [CrossRef]
  13. Lee, B.; Rudd, R.E.; Klepeis, J.E.; Becker, R. Elastic Constants and Volume Changes Associated with Two High-Pressure Rhombohedral Phase Transformations in Vanadium. Phys. Rev. B 2008, 77, 134105. [Google Scholar] [CrossRef]
  14. Stevenson, M.G.; Pace, E.J.; Storm, C.V.; Finnegan, S.E.; Garbarino, G.; Wilson, C.W.; McGonegle, D.; Macleod, S.G.; McMahon, M.I. Pressure-Induced Bcc-Rhombohedral Phase Transition in Vanadium Metal. Phys. Rev. B 2021, 103, 134103. [Google Scholar] [CrossRef]
  15. Wang, H.; Gan, Y.-C.; Chen, X.-R.; Wang, Y.-X.; Geng, H.Y. Modified Steinberg–Guinan Elasticity Model to Describe Softening–Hardening Dual Anomaly in Vanadium. J. Appl. Phys. 2024, 135, 115901. [Google Scholar] [CrossRef]
  16. Wang, H.; Li, J.; Zhou, X.M.; Tan, Y.; Hao, L.; Yu, Y.Y.; Dai, C.D.; Jin, K.; Wu, Q.; Jing, Q.M.; et al. Evidence for Mechanical Softening-Hardening Dual Anomaly in Transition Metals from Shock-Compressed Vanadium. Phys. Rev. B 2021, 104, 134102. [Google Scholar] [CrossRef]
  17. Gathers, G.R. Hugoniot Measurements for Vanadium. J. Appl. Phys. 1986, 59, 3291–3293. [Google Scholar] [CrossRef]
  18. Dai, C.; Jin, X.; Zhou, X.; Liu, J.; Hu, J. Sound Velocity Variations and Melting of Vanadium under Shock Compression. J. Phys. Appl. Phys. 2001, 34, 3064. [Google Scholar] [CrossRef]
  19. Yu, Y.; Tan, Y.; Dai, C.; Li, X.; Li, Y.; Wu, Q.; Tan, H. Phase Transition and Strength of Vanadium under Shock Compression up to 88 GPa. Appl. Phys. Lett. 2014, 105, 201910. [Google Scholar] [CrossRef]
  20. Li, B.; Liebermann, R.C. Study of the Earth’s Interior Using Measurements of Sound Velocities in Minerals by Ultrasonic Interferometry. Phys. Earth Planet. Inter. 2014, 233, 135–153. [Google Scholar] [CrossRef]
  21. Wang, X.; Chen, T.; Qi, X.; Zou, Y.; Kung, J.; Yu, T.; Wang, Y.; Liebermann, R.C.; Li, B. Acoustic Travel Time Gauges for In-Situ Determination of Pressure and Temperature in Multi-Anvil Apparatus. J. Appl. Phys. 2015, 118, 065901. [Google Scholar] [CrossRef]
  22. Papadakis, E.P. Ultrasonic Phase Velocity by the Pulse-Echo-Overlap Method Incorporating Diffraction Phase Corrections. J. Acoust. Soc. Am. 1967, 42, 1045–1051. [Google Scholar] [CrossRef]
  23. Li, B.; Chen, K.; Kung, J.; Liebermann, R.C.; Weidner, D.J. Sound Velocity Measurement Using Transfer Function Method. J. Phys. Condens. Matter 2002, 14, 11337. [Google Scholar] [CrossRef]
  24. Cook, R.K. Variation of Elastic Constants and Static Strains with Hydrostatic Pressure: A Method for Calculation from Ultrasonic Measurements. J. Acoust. Soc. Am. 1957, 29, 445–449. [Google Scholar] [CrossRef]
  25. Errandonea, D.; MacLeod, S.G.; Burakovsky, L.; Santamaria-Perez, D.; Proctor, J.E.; Cynn, H.; Mezouar, M. Melting Curve and Phase Diagram of Vanadium under High-Pressure and High-Temperature Conditions. Phys. Rev. B 2019, 100, 094111. [Google Scholar] [CrossRef]
  26. Delaire, O.; Kresch, M.; Muñoz, J.A.; Lucas, M.S.; Lin, J.Y.Y.; Fultz, B. Electron-Phonon Interactions and High-Temperature Thermodynamics of Vanadium and Its Alloys. Phys. Rev. B 2008, 77, 214112. [Google Scholar] [CrossRef]
  27. Ming, L.; Manghnani, M.H. Isothermal Compression of Bcc Transition Metals to 100 Kbar. J. Appl. Phys. 1978, 49, 208–212. [Google Scholar] [CrossRef]
  28. Takemura, K. Equation of State of V and Nb under Truly Hydrostatic Conditions. In Proceedings of the 17th AIRAPT Honolulu Conference, Honolulu, HI, USA, 25–30 July 1999. [Google Scholar]
  29. Nakamoto, Y.; Takemura, K.; Ishizuka, M.; Shimizu, K.; Kikegawa, T. Equation of State for Vanadium Under Hydrostatic Conditions. In Proceedings of the Joint 20th AIRAPT-43rd EHPRG Conference on Science and Technology of High Pressure, Karlsruhe, Germany, 27 June–1 July 2005; p. 120. [Google Scholar]
  30. Qi, X.; Wang, S.; Chen, S.; Cai, N.; Li, B. Anomalous Elastic Behavior of Tantalum at High Pressures: Experimental and Theoretical Studies. Int. J. Refract. Met. Hard Mater. 2021, 101, 105691. [Google Scholar] [CrossRef]
  31. Pugh, S.F. XCII. Relations between the Elastic Moduli and the Plastic Properties of Polycrystalline Pure Metals. Lond. Edinb. Dublin Philos. Mag. J. Sci. 1954, 45, 823–843. [Google Scholar] [CrossRef]
  32. Davies, G.F.; Dziewonski, A.M. Homogeneity and Constitution of the Earth’s Lower Mantle and Outer Core. Phys. Earth Planet. Inter. 1975, 10, 336–343. [Google Scholar] [CrossRef]
  33. Katahara, K.W.; Manghnani, M.H.; Fisher, E.S. Pressure Derivatives of the Elastic Moduli of BCC Ti-V-Cr, Nb-Mo and Ta-W Alloys. J. Phys. F Met. Phys. 1979, 9, 773. [Google Scholar] [CrossRef]
  34. Bolef, D.I.; Smith, R.E.; Miller, J.G. Elastic Properties of Vanadium. I. Temperature Dependence of the Elastic Constants and the Thermal Expansion. Phys. Rev. B 1971, 3, 4100–4108. [Google Scholar] [CrossRef]
  35. Karbasi, A.; Saxena, S.; Hrubiak, R. The Thermodynamics of Several Elements at High Pressure. Calphad 2011, 35, 72–81. [Google Scholar] [CrossRef]
  36. Wang, Y.X.; Geng, H.Y.; Wu, Q.; Chen, X.R. Orbital Localization Error of Density Functional Theory in Shear Properties of Vanadium and Niobium. J. Chem. Phys. 2020, 152, 024118. [Google Scholar] [CrossRef] [PubMed]
  37. Crichton, W.A.; Guignard, J.; Bailey, E.; Dobson, D.P.; Hunt, S.A.; Thomson, A.R. High-Temperature Equation of State of Vanadium. High Press. Res. 2016, 36, 16–22. [Google Scholar] [CrossRef]
  38. Mcqueen, R.G.; Marsh, S.P.; Taylor, J.W.; Fritz, J.N.; Carter, W.J. Chapter VII—The equation of state of solids from shock wave studies. In High-Velocity Impact Phenomena; Kinslow, R., Ed.; Academic Press: Cambridge, MA, USA, 1970; pp. 293–417. ISBN 978-0-12-408950-1. [Google Scholar]
  39. Martin, M.; Shen, T.; Thadhani, N.N. Instrumented Anvil-on-Rod Impact Experiments for Validating Constitutive Strength Model for Simulating Transient Dynamic Deformation Response of Metals. Mater. Sci. Eng. A 2008, 494, 416–424. [Google Scholar] [CrossRef]
  40. Steinberg, D.J.; Cochran, S.G.; Guinan, M.W. A Constitutive Model for Metals Applicable at High-strain Rate. J. Appl. Phys. 1980, 51, 1498–1504. [Google Scholar] [CrossRef]
  41. Steinberg, D.J. Equation of State and Strength Properties of Selected Materials; Lawrence Livermore National Lab: Livermore, CA, USA, 1991. [Google Scholar]
  42. Foster, J.M.; Comley, A.J.; Case, G.S.; Avraam, P.; Rothman, S.D.; Higginbotham, A.; Floyd, E.K.R.; Gumbrell, E.T.; Luis, J.J.D.; McGonegle, D.; et al. X-Ray Diffraction Measurements of Plasticity in Shock-Compressed Vanadium in the Region of 10–70 GPa. J. Appl. Phys. 2017, 122, 025117. [Google Scholar] [CrossRef]
  43. Rudd, R.E.; Klepeis, J.E. Multiphase Improved Steinberg–Guinan Model for Vanadium. J. Appl. Phys. 2008, 104, 093528. [Google Scholar] [CrossRef]
Figure 1. Cross-section diagram of the cell assembly for ultrasonic measurements at high pressure and room temperature; not to scale. The ultrasonic signals at the anvil/buffer-rod, buffer-rod/sample, and sample/backing interfaces are discussed in detail in Figure 2a,b. The input acoustic signals are the dashed lines and at each material interface a reflected signal is sent back to the transducer as a received signal. The black arrows represent the acoustic signals within the WC anvil, the green arrows represent the acoustic signals within the buffer rod, and the yellow arrows represent the sample acoustic signals.
Metals 15 00427 g001
Figure 2. Acoustic measurement example of (a) P-wave (50 MHz) and (b) S-wave (30 MHz) at 11.1 GPa and room temperature. The travel time inside the sample is determined by shifting sample/backing echo to overlap with the buffer-rod/sample echo, and the time difference is the travel time.
Metals 15 00427 g002
Figure 3. Volume change of vanadium as a function of pressure; current study (grey dots), Takemura et al., 2000 [28] (green dots), Ming and Manghnani 1978 [27] (purple dots), and Nakamoto et al. [29] plotted quasihydrostatic curve (yellow curve).
Metals 15 00427 g003
Figure 4. Experimental and finite strain-derived VP and VS of vanadium at high pressure.
Metals 15 00427 g004
Figure 5. Experimental bulk (K) and shear (G) moduli of vanadium at high pressures.
Metals 15 00427 g005
Figure 6. Young’s modulus (a), Poisson’s ratio and Pugh ratio (b) of vanadium at high pressures.
Metals 15 00427 g006
Table 1. Experimental elastic properties of polycrystalline vanadium up to 11.4 GPa and room temperature.
Pressure (GPa)2 TP (μs)2 TS (μs)L (mm) *ρ (g/cm3)VP (km/s)VS (km/s)K (GPa)G (GPa)E (GPa)ν
0.5 (2)0.3420 (2)0.7346 (2)1.019 (4)6.09 (2)5.96 (3)2.77 (1)153.7 (3.2)46.9 (6)127.6 (4.0)0.362 (14)
1.0 (2)0.3392 (2)0.7318 (2)1.018 (4)6.11 (2)6.00 (3)2.78 (1)157.0 (3.3)47.3 (6)128.9 (4.0)0.363 (14)
2.0 (2)0.3368 (2)0.7250 (2)1.016 (4)6.15 (2)6.03 (3)2.80 (1)159.3 (3.4)48.3 (6)131.5 (4.1)0.362 (14)
2.6 (2)0.3348 (2)0.7208 (2)1.014 (4)6.17 (2)6.06 (3)2.81 (1)161.5 (3.4)48.9 (6)133.2 (4.2)0.362 (14)
3.4 (2)0.3334 (2)0.7150 (2)1.013 (4)6.21 (2)6.07 (3)2.83 (1)162.6 (3.5)49.8 (6)135.5 (4.2)0.361 (14)
4.5 (2)0.3312 (2)0.7112 (2)1.010 (4)6.25 (2)6.10 (3)2.84 (1)165.3 (3.5)50.4 (6)137.3 (4.3)0.362 (14)
5.5 (2)0.3288 (2)0.7100 (2)1.008 (4)6.28 (2)6.13 (3)2.84 (1)168.8 (3.6)50.7 (6)138.2 (4.3)0.363 (14)
6.2 (2)0.3270 (2)0.7094 (2)1.007 (4)6.31 (2)6.16 (3)2.84 (1)171.5 (3.6)50.9 (6)138.8 (4.3)0.365 (14)
6.9 (2)0.3264 (2)0.7084 (2)1.005 (4)6.34 (2)6.16 (3)2.84 (1)172.5 (3.6)51.1 (6)139.5 (4.3)0.365 (14)
7.5 (2)0.3252 (2)0.7064 (2)1.004 (4)6.36 (2)6.18 (3)2.84 (1)174.1 (3.7)51.4 (6)140.4 (4.4)0.366 (14)
7.9 (2)0.3238 (2)0.7050 (2)1.003 (4)6.38 (2)6.20 (3)2.85 (1)176.0 (3.7)51.7 (6)141.2 (4.4)0.366 (14)
8.5 (2)0.3218 (2)0.7018 (2)1.002 (4)6.39 (2)6.23 (3)2.86 (1)178.6 (3.8)52.2 (6)142.7 (4.4)0.367 (14)
9.0 (2)0.3208 (2)0.7004 (2)1.002 (4)6.41 (2)6.24 (3)2.86 (1)180.1 (3.8)52.5 (6)143.4 (4.4)0.367 (14)
9.3 (2)0.3186 (2)0.6988 (2)1.001 (4)6.43 (2)6.28 (3)2.86 (1)183.3 (3.8)52.7 (6)144.3 (4.5)0.369 (14)
10.0 (2)0.3160 (2)0.6984 (2)1.000 (4)6.45 (2)6.33 (3)2.86 (1)187.7 (3.9)52.9 (6)145.0 (4.5)0.371 (14)
10.3 (2)0.3150 (2)0.6976 (2)0.999 (4)6.46 (2)6.34 (3)2.86 (1)189.3 (3.9)53.0 (6)145.4 (4.5)0.372 (14)
10.8 (2)0.3140 (2)0.6972 (2)0.998 (4)6.48 (2)6.36 (3)2.86 (1)191.0 (3.9)53.1 (6)145.8 (4.5)0.373 (14)
11.1 (2)0.3130 (2)0.6956 (2)0.998 (4)6.49 (2)6.37 (3)2.87 (1)192.5 (4.0)53.4 (6)146.6 (4.5)0.373 (14)
11.4 (2)0.3122 (2)0.6946 (2)0.997 (4)6.50 (2)6.39 (3)2.87 (1)193.7 (4.0)53.6 (6)147.1 (4.5)0.373 (14)
* Derived from Cook’s method.
Table 2. Summary of elastic moduli and their pressure derivatives from current study and published literature values.
SourceKS0 (GPa)KT0 (GPa)K’S0K’T0G0 (GPa)G’0Notes
Current study151 (2) 3.47 (2) 47 (1)0.62 (1)Ultrasonic LVP, 0–11.4 GPa
[33] Katahara, 1979155.6 4.27 47.85 0.48Ultrasonic, 0–0.5 GPa
[34] Bolef, 1971157.1 48.1 Ultrasonic benchtop
[19] Yu, 2014 46.8 (5) Ultrasonic benchtop
[37] Crichton, 2016 150.4 (6.2) 5.5 (1.0) LVP XRD, 0–11.5 GPa
[7] Ding, 2007158 (1) 3.9 (2) DAC XRD, 0–155 GPa
[27] Ming and Manghnani, 1978154 (5) DAC XRD, 0–10 GPa
[29] Nakamoto, 2005152.1 4.1 DAC XRD, 0–224 GPa
[25] Errandonea, 2019152 (4) 5.4 (4) DAC XRD, 0–120 GPa
[14] Stevenson, 2021158.9 (1) 3.58 (6) DAC XRD single-Crystal, 0–154 GPa
[7] Ding, 2007195 (3) 3.5 (5) DAC (nonhydrostatic) XRD, 0–155 GPa
[8] Jenei, 2011179 (8) 3.11 (1.23) DAC (nonhydrostatic) XRD, 0–82 GPa
[38] McQueen, 1970157 3.5 Shock
[11] Koci, 2008 182 3.7535.26 VASP: GGA and PAW, 0–400 GPa
[25] Errandonea, 2019 143 4.4 VASP QMD PBE, 0–400 GPa
[35] Karbasi, 2011 162 3.5 CALPHAD, 0–400 GPa
[15] Wang, 2024 168.5 3.8632.02 MSG model, 0–500 GPa
[4] Landa, 2006 183.2 DFT, 0–600 GPa
[39] Martin, 2008 48.10.4906SG model
[39] Martin, 2008 47.9 Shock, VISAR
Calculated with Voight–Reuss–Hill average from C11, C12, and C44 elastic constants.
Disclaimer/Publisher’s Note: The statements, opinions and data contained in all publications are solely those of the individual author(s) and contributor(s) and not of MDPI and/or the editor(s). MDPI and/or the editor(s) disclaim responsibility for any injury to people or property resulting from any ideas, methods, instructions or products referred to in the content.

