Article

Laser Beam Welding of IN625 Alloy with Equiaxed Grains: Influence of Process Parameters

1
National Research Council of Italy (CNR), Institute of Condensed Matter Chemistry and Energy Technologies (ICMATE), Via R. Cozzi 53, 20125 Milan, Italy
2
Department for Sustainability, Research Centre of Casaccia, ENEA, Via Anguillarese 301, Santa Maria di Galeria, 00123 Rome, Italy
3
Department of Management and Engineering, University of Padua, Stradella S. Nicola 3, 36100 Vicenza, Italy
4
Department of Industrial Engineering, University of Rome Tor Vergata, Via del Politecnico 1, 00133 Rome, Italy
*
Author to whom correspondence should be addressed.
Metals 2025, 15(12), 1296; https://doi.org/10.3390/met15121296
Submission received: 10 October 2025 / Revised: 17 November 2025 / Accepted: 21 November 2025 / Published: 25 November 2025
(This article belongs to the Special Issue Weldability and Reparability of Nickel-Base Alloys)

Abstract

Ni-based superalloys, known for their excellent mechanical strength and corrosion resistance at high temperature, are widely used in aeronautic, aerospace, and energy industries. Since both the materials and manufacturing processes required to produce high-performance components made of these alloys are expensive, the welding repair of damaged components plays a crucial role in industrial applications. High energy density welding techniques, such as laser beam welding (LBW) and electron beam welding (EBW), are the most promising to achieve high-quality welds. Nevertheless, welding processes significantly affect the microstructure and mechanical properties of both the melted zone (MZ) and the heat-affected zone (HAZ). This may result in alloying element segregation, precipitation of undesired secondary phases, and the presence of residual stresses that can lead to crack formation. Therefore, a comprehensive investigation of the effects of process parameters on weld seam properties is essential to maintain high performance standards. In this work, LBW was employed to join 2.5 mm thick plates of equiaxed IN625 superalloy. The seams were produced by varying three parameters: the two characteristic parameters of LBW, i.e., laser power (P = 1700, 2000, 2300 W) and welding speed (v = 15, 20, 25 mm/s), alongside power modulation (Γ = Pmin/Pmax = 0.6, 0.8, 1). The scope of this work is to evaluate the effect of the combined variation of all these welding parameters on the final characteristics of welded seams. The resulting microstructures were characterized by using digital radiography, Light Microscopy (LM), Scanning Electron Microscopy (SEM), and X-ray Diffraction (XRD). Vickers microhardness measurements were performed across the weld seams to evaluate the mechanical properties in the MZ and HAZ. The optimal set of welding parameters, producing defect-free seams without cracks and pores, was identified as P = 2000 W, v = 25 mm/s, and Γ = 0.6.

Graphical Abstract

1. Introduction

Ni-based superalloys exhibit excellent mechanical properties at high temperatures and resistance to corrosive environments. In addition to the presence of the ordered γ′ phase, their performances result from solid solution and precipitation strengthening due to alloying elements, such as Cr, Ti, Al, Co, Fe, Nb, Mo, W, and Ta [1,2,3,4]. These alloys are particularly suitable for manufacturing mechanical components that must withstand severe conditions in aeronautic [5,6], aerospace, and military applications, as well as in the chemical, oil, and gas industry [7,8,9].
One of the main challenges associated with this class of alloys is the reduction of the high costs arising from both the raw materials and the manufacturing processes required to achieve their complex microstructure. For this reason, in the case of minor damages, repair processes are often preferred to complete replacement of components, and welding technologies play a key role in extending service life and in joining components of complex geometry.
Nevertheless, welding of Ni-based superalloys presents serious problems, mainly related to the formation of defects, such as cracks and pores, as well as to the segregation of alloying elements [10], variations in microstructure, and mechanical properties in the melted zone (MZ) and heat-affected zone (HAZ) [11,12]. For instance, conventional welding methods, such as gas tungsten arc (GTA) welding, often result in significant shrinkage stresses with consequent high cracking susceptibility [13,14].
High energy density welding techniques, such as laser beam welding (LBW) and electron beam welding (EBW), can improve the weldability of Ni superalloys and mitigate the formation of defects [15,16,17,18]. In fact, these techniques involve lower heat input, which results in (i) narrower MZ and HAZ [19]; (ii) reduced grain growth and segregation in the HAZ [20]; and (iii) lower residual stresses [21,22,23]. Additionally, high-energy beams enable single-pass welding, avoiding repeated thermal cycles, typical of conventional welding techniques, which promote grain coarsening and elemental segregation [24].
Moreover, high energy density welding techniques give the opportunity to easily vary process parameters, primarily beam power and speed, to control melting and solidification and optimize both macro- and microstructural features of welded joints [25,26,27,28,29,30]. Extensive work on the research of optimal high energy welding process parameters for Ni-based superalloys has been carried out in past years by some of the authors of the present paper, mainly focused on directionally solidified IN792 [31,32,33,34].
Among Ni-based superalloys, IN625 is widely employed in different fields, including aerospace, chemical, petrochemical, and marine, operating from cryogenic to high temperature (>1000 °C) [35,36,37]. IN625 is a solid solution strengthened alloy [38] with mechanical properties that can be further improved by precipitation [39,40,41] of (i) a fine ordered metastable γ″ phase (Ni3Nb), obtained after annealing in the temperature range 550–850 °C [41], and (ii) metal carbides [42], namely MC, M6C, and M23C6. The MC carbides, rich in Nb, precipitate during solidification, while M6C (Nb- and Mo-rich) and M23C6 (Cr-rich) originate from the transformation of MC during aging treatment.
Moreover, owing to its reduced Ti and Al content, IN625 demonstrates superior weldability and workability compared to other Ni-based superalloys [43]. Previous studies [43,44] showed the formation of a fully dendritic structure in the MZ with precipitates located in the interdendritic regions. The same authors also observed an increasing amount of Laves phases (Ni, Cr)2(Mo, Nb) and NbC carbides with higher laser power, suggesting the employment of lower welding energy, since these phases favor liquation and solidification cracking.
The results presented in this work are part of a research project aimed at optimizing the LBW process for Ni-based superalloys for producing joints free from macro-defects. Specifically, the study evaluated the influence of three key parameters, namely laser scan speed (v), laser power (P), and laser power modulation (Γ = Pmin/Pmax), on the quality and properties of IN625-welded joints. While P and v are widely recognized as the primary LBW parameters and their combined effects on weld quality have been extensively investigated [10,43,45,46,47], only a limited number of studies have explored the influence of power modulation. These few works, mostly conducted on other alloys, suggest that modulation can reduce the melted volume [48,49], inhibit hot cracking [50], and decrease porosity [49,51]. Moreover, other researchers [52,53] reported that power modulation helps stabilize the keyhole and enables higher welding speeds at fixed P, without detrimental effects on seam characteristics. However, these effects were typically evaluated while keeping P and v constant, and therefore, no systematic investigation has examined the combined variation of laser power, scan speed, and modulation ratio in the LBW of IN625 or other Ni-based superalloys.
In this scenario, the aim of the present work is to optimize the LBW process for IN625 by simultaneously varying laser power (P), scan speed (v), and modulation ratio (Γ), in order to minimize defect formation, reduce the melted volume, and limit residual stresses.
After welding, the microstructural characteristics of the MZ, HAZ, and base material (BM) were investigated by using light microscopy (LM), scanning electron microscopy (SEM), and X-ray diffraction (XRD). Mechanical properties were evaluated by means of Vickers micro-hardness measurements across the weld seams.

2. Materials and Methods

2.1. IN625

The examined IN625 alloy was supplied by ATI –Flat Rolled Products (ATI –Flat Rolled Products, Dallas, TX, USA), and its nominal chemical composition is reported in Table 1. The material was solution annealed at 817 °C and cooled in air. It exhibits a microstructure consisting of equiaxed grains, with an average size d = 15 ± 5 μm, as well as several twins (Figure 1). A high number of precipitates is also present, which can be divided into two groups: (i) larger size ones (7 ± 1 μm), highlighted in red, and (ii) smaller size ones (<1 μm), in blue. The larger ones present a polygonal shape and are mainly located at grain boundaries.
In order to optimize the LBW process, IN625 plates with a thickness of 2.5 mm were laser re-melted using the parameters reported in Section 2.2.

2.2. Welding Equipment and Parameters

The welding equipment consists of an IPG ytterbium fiber laser with a nominal power of 4 kW and continuous or modulated emission. The laser spot size at focus was 250 μm, and the Rayleigh length was 4.8 mm. The welds were performed in wobbling mode, impressing a circular motion to the focused spot with 0.3 mm amplitude (D) and a 500 Hz frequency (f), which adds to the linear feed rate. Wobbling was introduced to prevent the formation of defects, such as underfill and incomplete fusion, when the joint gap exceeded half of the spot size (i.e., 0.125 mm) [54,55].
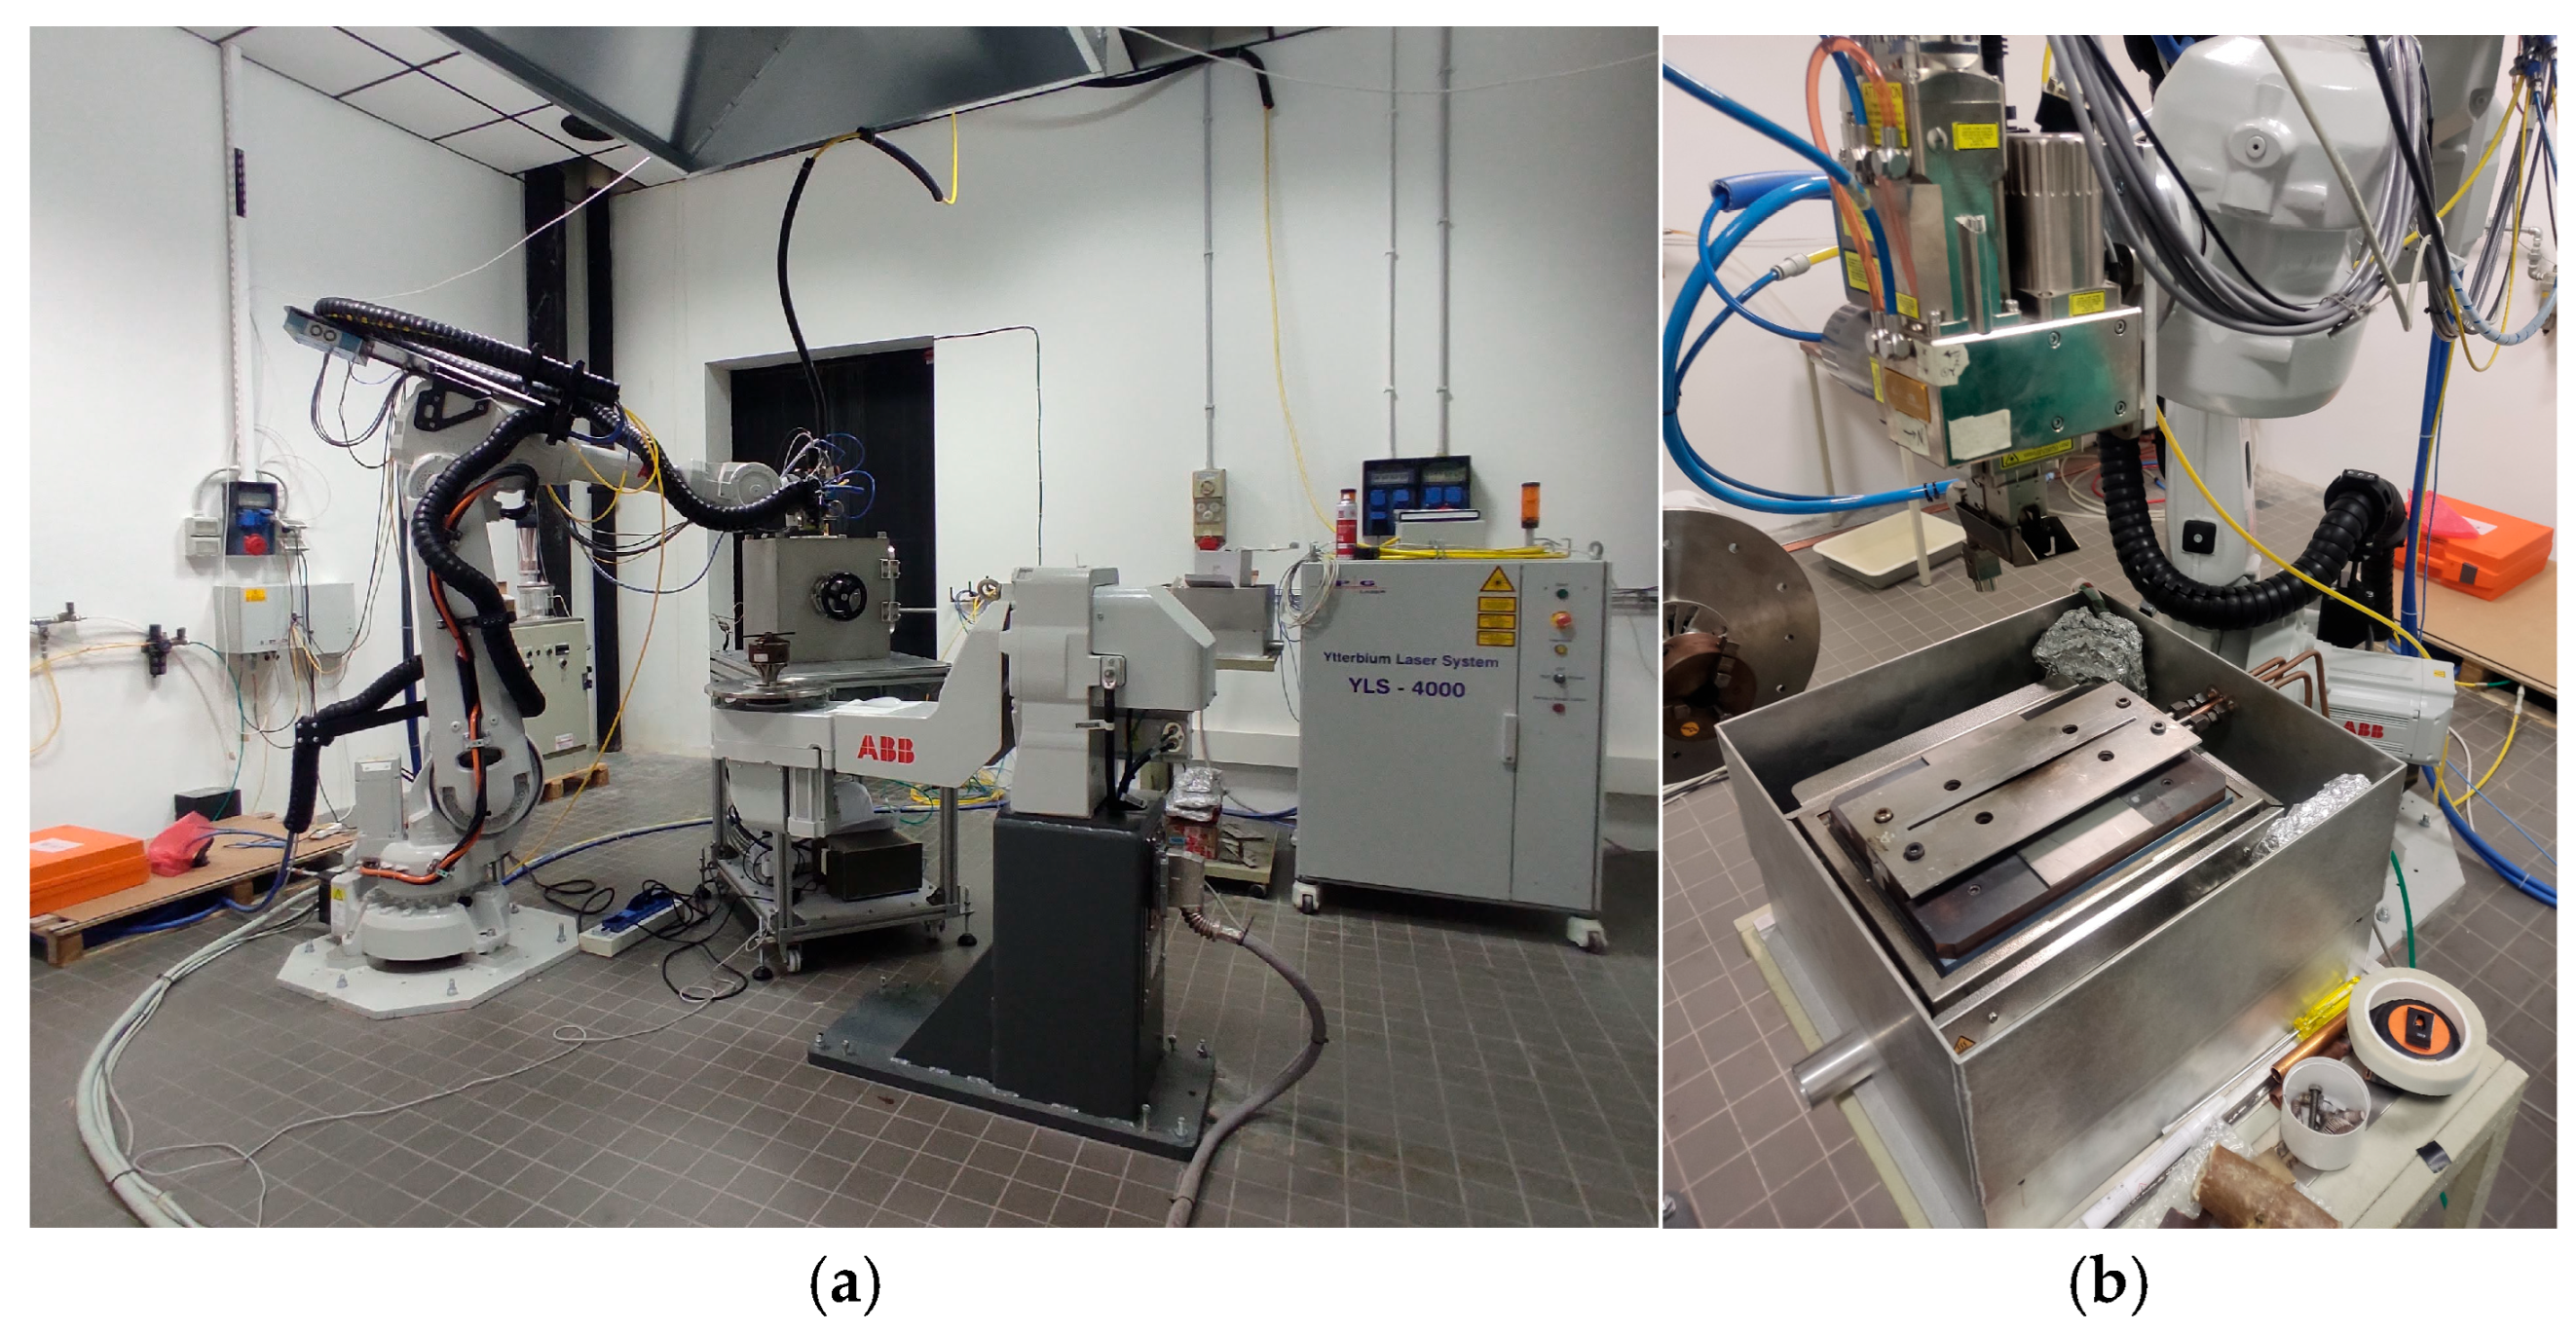
The laser focusing head is mounted on an ABB robotic arm (Figure 2a) with 6 degrees of freedom, 2.05 m maximum reach, and 60 kg payload. The welding apparatus is equipped with a clamping system, which also has the function of supplying the inert shielding gas (Figure 2b); it consists of a steel base (capable of pre-heating up to 400 °C) and two fixing brackets that allow alignment and block sheets up to 3 mm thick, while simultaneously supplying shielding gas along the entire length of the joint (200 mm max). Helium was used as shielding gas both on the face and root sides of the weld at flow rates of 20 and 5 NL/min, respectively.
A series of welding tests, details in Table 2, were performed by varying three factors at three levels: average laser power (P), laser scan speed (v), and power modulation (Γ = Pmin/Pmax). Wobbling was not treated as an experimental factor, and its parameters (D and f) were intentionally kept constant in all tests, as it served exclusively as a process-stabilizing mechanism.
To ensure uniform representation of all two-factor level combinations, limiting the number of experiments, a fractional factorial design, with nine weldings, was employed [56]. The intermediate values of P (2000 W) and v (20 mm/s) were chosen on the basis of previous unreported trials that ensured full penetration of the plates without macroscopic defects. The other values were obtained by varying speed and laser power by ±25% and ±15%, respectively. The resulting P and v ranges yielded a joining efficiency ( J E = s H I , where s is the plate thickness and HI the heat input HI = P/v) between 16.3 and 36.8 mm2/kJ, consistent with values reported by other researchers [55].
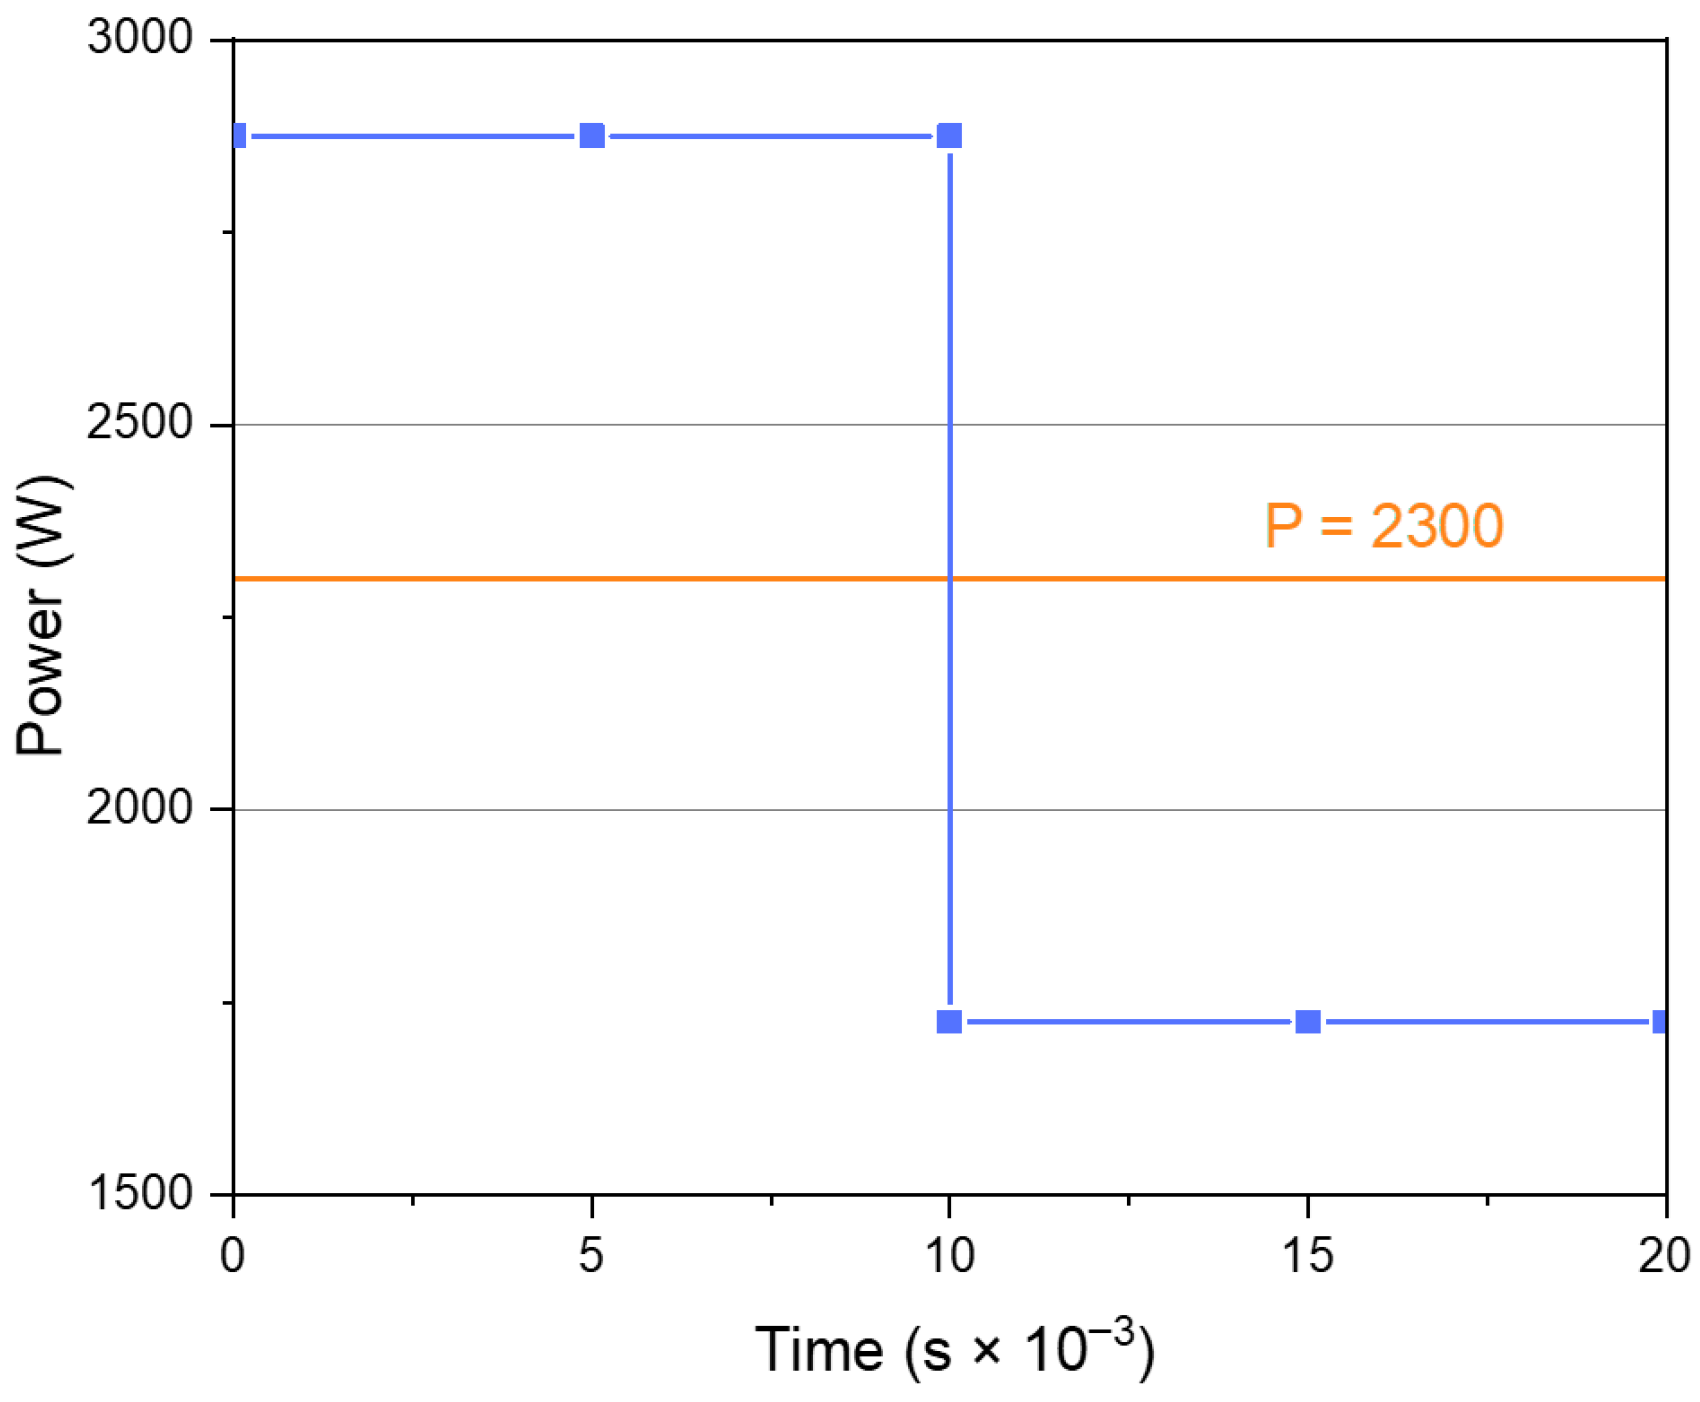
The modulation ratio Γ was investigated at three levels: 1 (continuous mode), 0.8, and 0.6, selected to cover a representative range while keeping the peak power below 3000 W to avoid instability (e.g., spatter). Power modulation was applied at 50 Hz with a duty cycle of 50% (Figure 3). Previous studies [34] indicated that pulses with similar timing can reduce porosity during the welding of Ni-based superalloys.
The modulation period (20 ms) and the wobbling frequency (500 Hz) were chosen so that the beam completes five full wobble revolutions within each 10 ms semi-pulse, regardless of welding speed; thus, the power modulation and the beam oscillation act independently. The path of the laser spot on the material results from the superposition of linear and wobbling motions. Different welding speeds cause a different degree of overlap of the path on itself, quantified by the following expression for the overlap ratio (OR) [57]:
O R = 2 v f D 2 + v f D
For constant wobbling parameters (D = 0.3 mm, f = 500 Hz) and scan speeds of 15, 20, and 25 mm/s, the resulting OR were almost similar (90%, 88%, and 85%, respectively), suggesting that the interaction between speed variation and wobbling can be neglected as a first approximation.
The values of ΔP = PmaxPmin, HI, and P·v, calculated for each combination of welding parameters, are also reported in Table 2. The use of the P·v parameter follows the approach proposed by Unocic and DuPont [58], according to which the melting efficiency ηₘ increases proportionally with the product of laser power and scan speed. Although P·v (J·mm/s2) does not represent an energy quantity, it is a convenient process parameter combining the effects of both laser power and travel speed, and it reflects the process intensity that governs the melting efficiency.

2.3. Characterization of the Seams

The welded samples were preliminarily examined by digital radiography (Gilardoni XE-L HE, Mandello del Lario, Italy) to detect the presence of macro-defects, such as porosities and cracks.
The cross-sections of the seams were then subjected to mechanical polishing by grit papers and Al2O3 suspension (0.3 μm); chemical etching in a solution of 10 mL of HNO3, 10 mL of acetic acid, 15 mL of HCl, and 2 drops of glycerol; and examined by LM (Hirox RX-100 digital microscope (Hirox Co., Ltd., Tokyo, Japan) equipped with HR-2500(E) high range turret zoom lens) to investigate the microstructure in the MZ, HAZ, and BM.
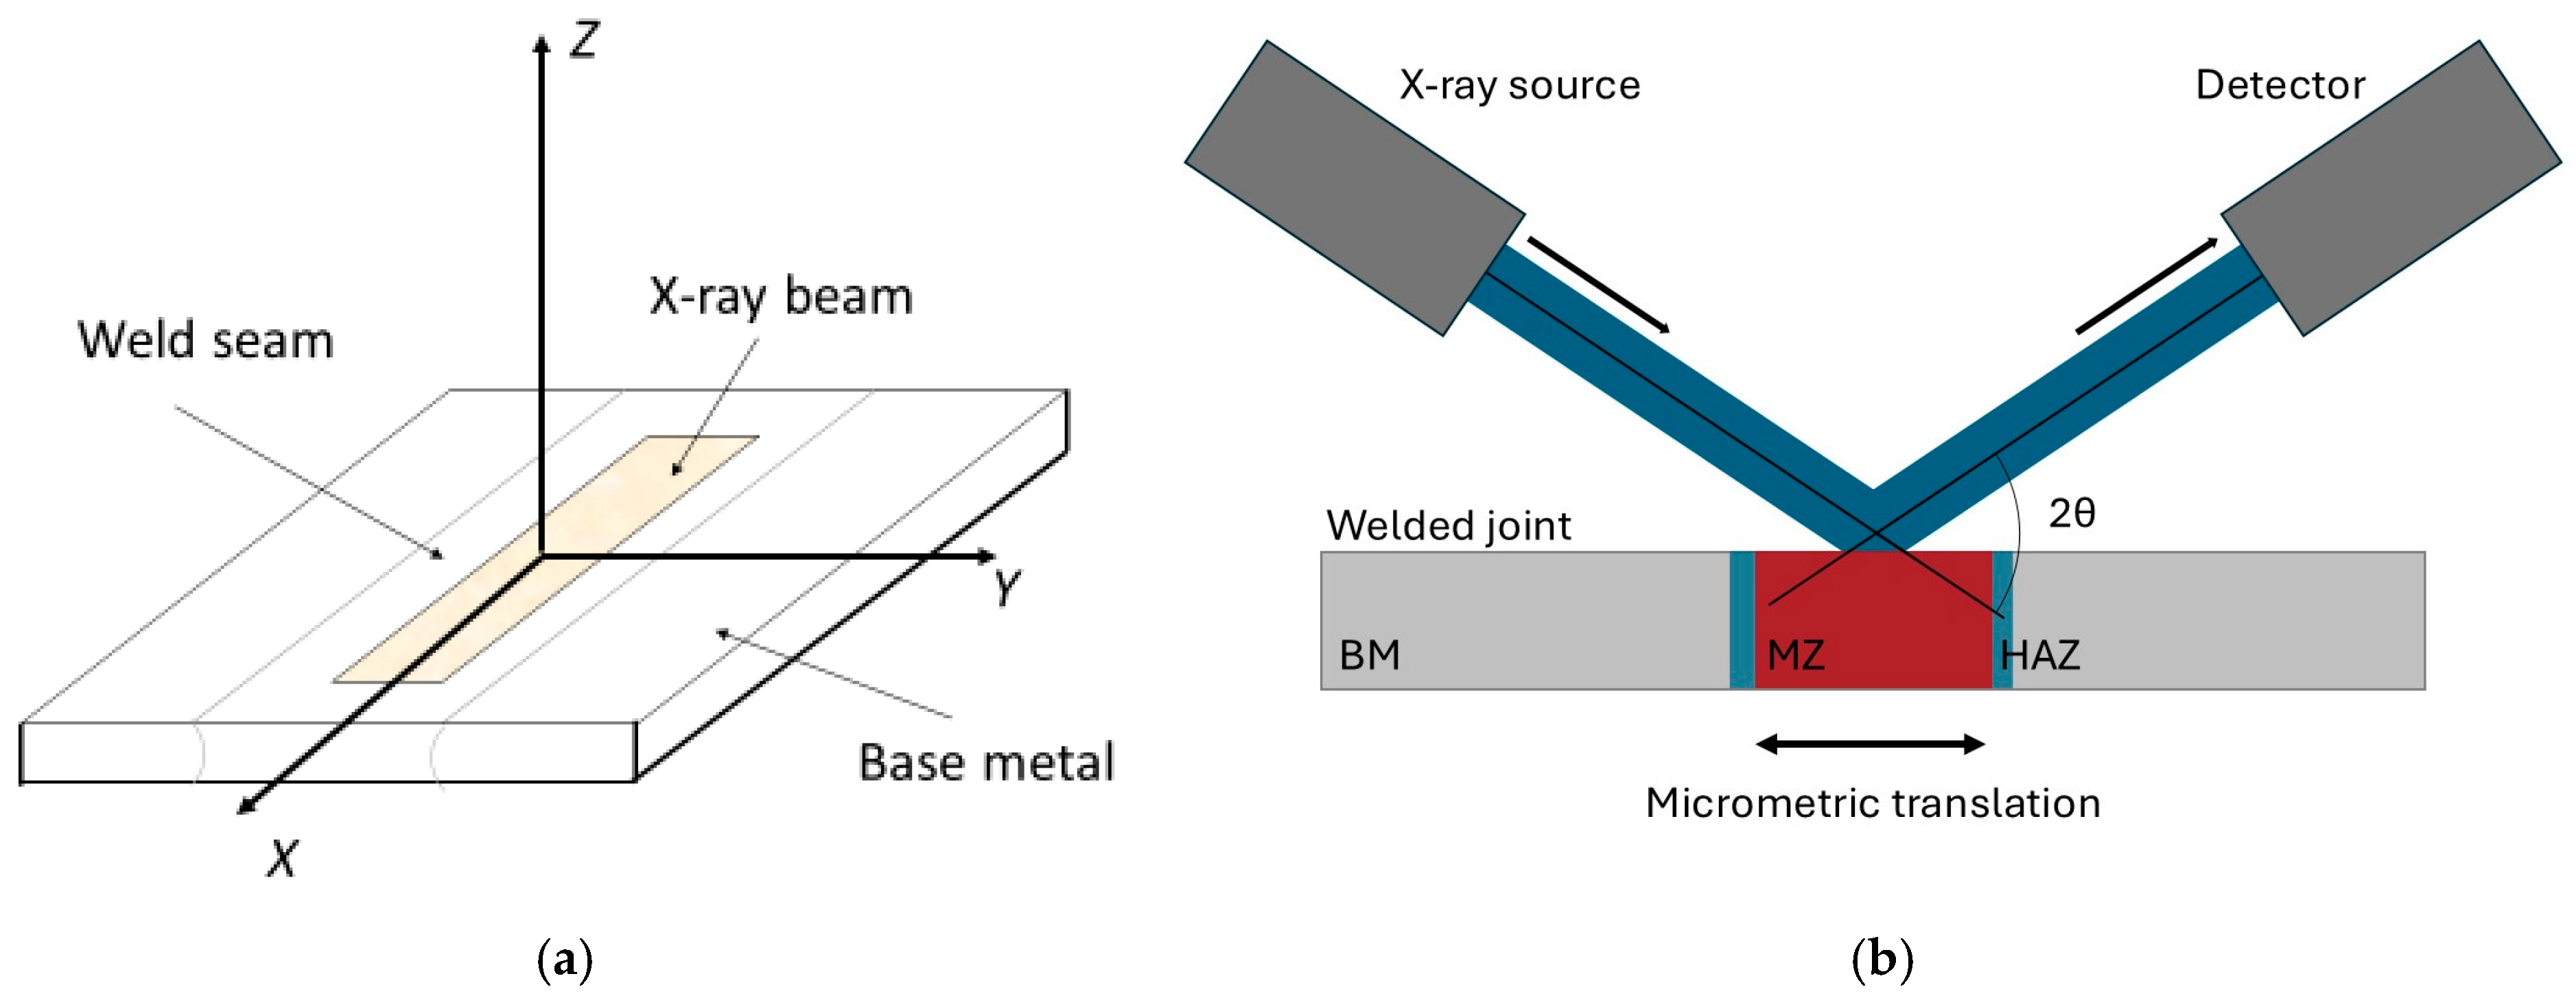
XRD measurements were made on the top surface of weld seams by using the Mo-Kα radiation (λ = 0.709 Å). The patterns were collected in the 2θ angular range 15–45° with steps of 0.05° and a counting time per step of 5 s. The rectangular X-ray spot had a constant length of 15 mm and a width changing with the 2θ angle, and, at the maximum angle of analysis (2θ = 45°), it was about 350 μm. As shown in Figure 4a, the measurements were performed with the longer side of the spot parallel to the welding direction.
The samples were mounted onto a micrometric translation stage (Figure 4b) that allowed for irradiating the desired zones, namely the BM and MZ. Measurements could not be performed on the HAZ because its width is extremely small, approximately 20–30 μm.
Possible preferred orientations of grains were evaluated by comparing the relative intensities of XRD peaks with those of the JCPDS-ICDD database (File 4-850) [59] obtained from Ni with randomly oriented grains.
High-precision XRD peak profiles were collected with 2θ angular steps of 0.005° and a counting time per step of 10 s. After background subtraction, the peak profiles were fitted by Lorentzian curves to remove the 2 component and determine the correct peak positions. As shown in Figure 4a, in the conditions of the present experiments, the measured elastic strain corresponds to εZ, namely, the component along the Z direction. It was calculated from the relative variation of interplanar spacings dZ with respect to d0, the value of the BM, here considered as stress-free material.
Equation (2) relates the strain εZ to the stresses in the principal directions:
ε Z = d Z d 0 d 0 = 1 E σ Z ν σ X + σ Y
being E = 207 GPa and υ = 0.3 [60], when σZ = 0, it is possible to calculate the sum (σX + σY) from εZ. Due to the geometry of our samples, it was not possible to use the sin2ψ method to obtain the specific values of stress along X and Y directions.
To evaluate potential changes in mechanical properties across the weld seam, different indentation techniques [61] could be successfully employed. However, given the very narrow seam produced by the LBW process, Vickers micro-hardness tests (load = 200 g) result in being more suitable compared to other methods, thanks to their higher sensitivity to microscale variations. In this study, Vickers microhardness measurements were performed along two distinct lines, one near the top and one near the bottom of the cross-section. Indentations were taken at intervals of 200 μm, moving from the BM to MZ.
The morphology of the precipitates in the BM, HAZ, and MZ was examined by SEM (FEG-SEM Leo 1530, Zeiss Group, Oberkochen, Germany) equipped with an energy dispersive X-ray spectroscopy EDS detector (AZTEC, Oxford Instruments, Abingdon, UK).

3. Results

3.1. Quality of Welds

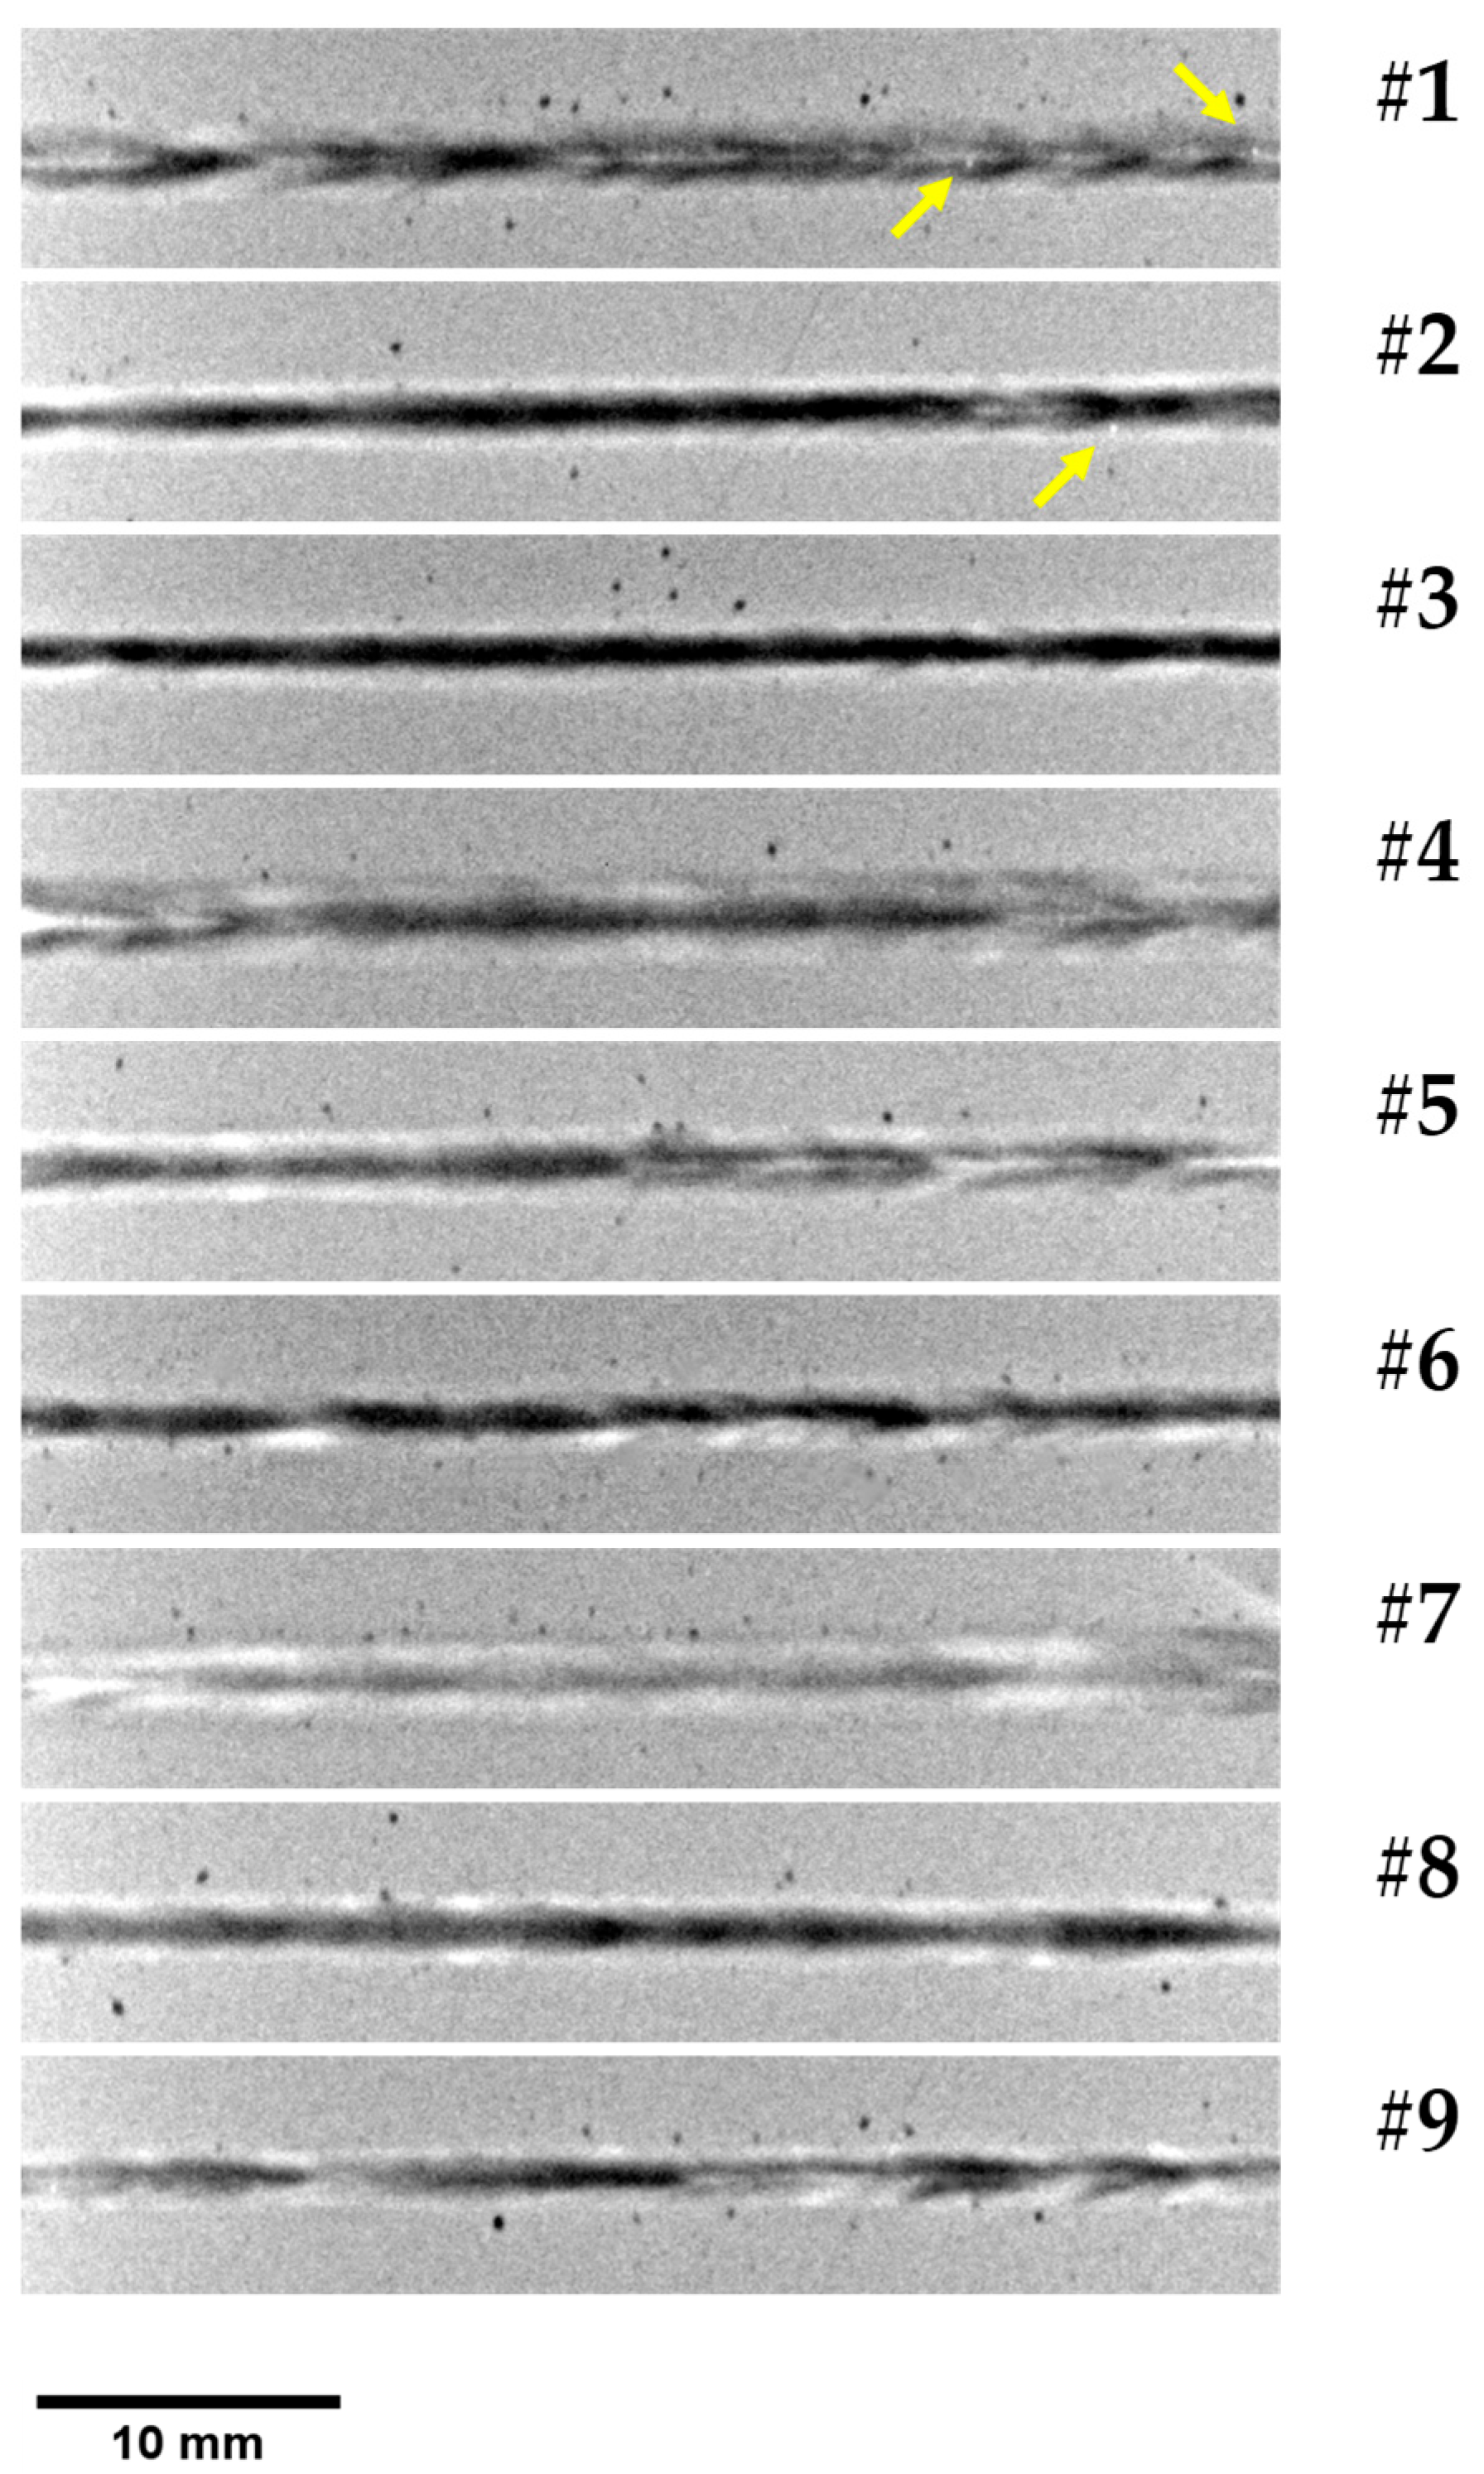
Figure 5 shows the radiographic images of the nine welds. All the process parameter combinations lead to seams free from cracks and pores. A limited incidence of isolated porosity is revealed (yellow arrow).
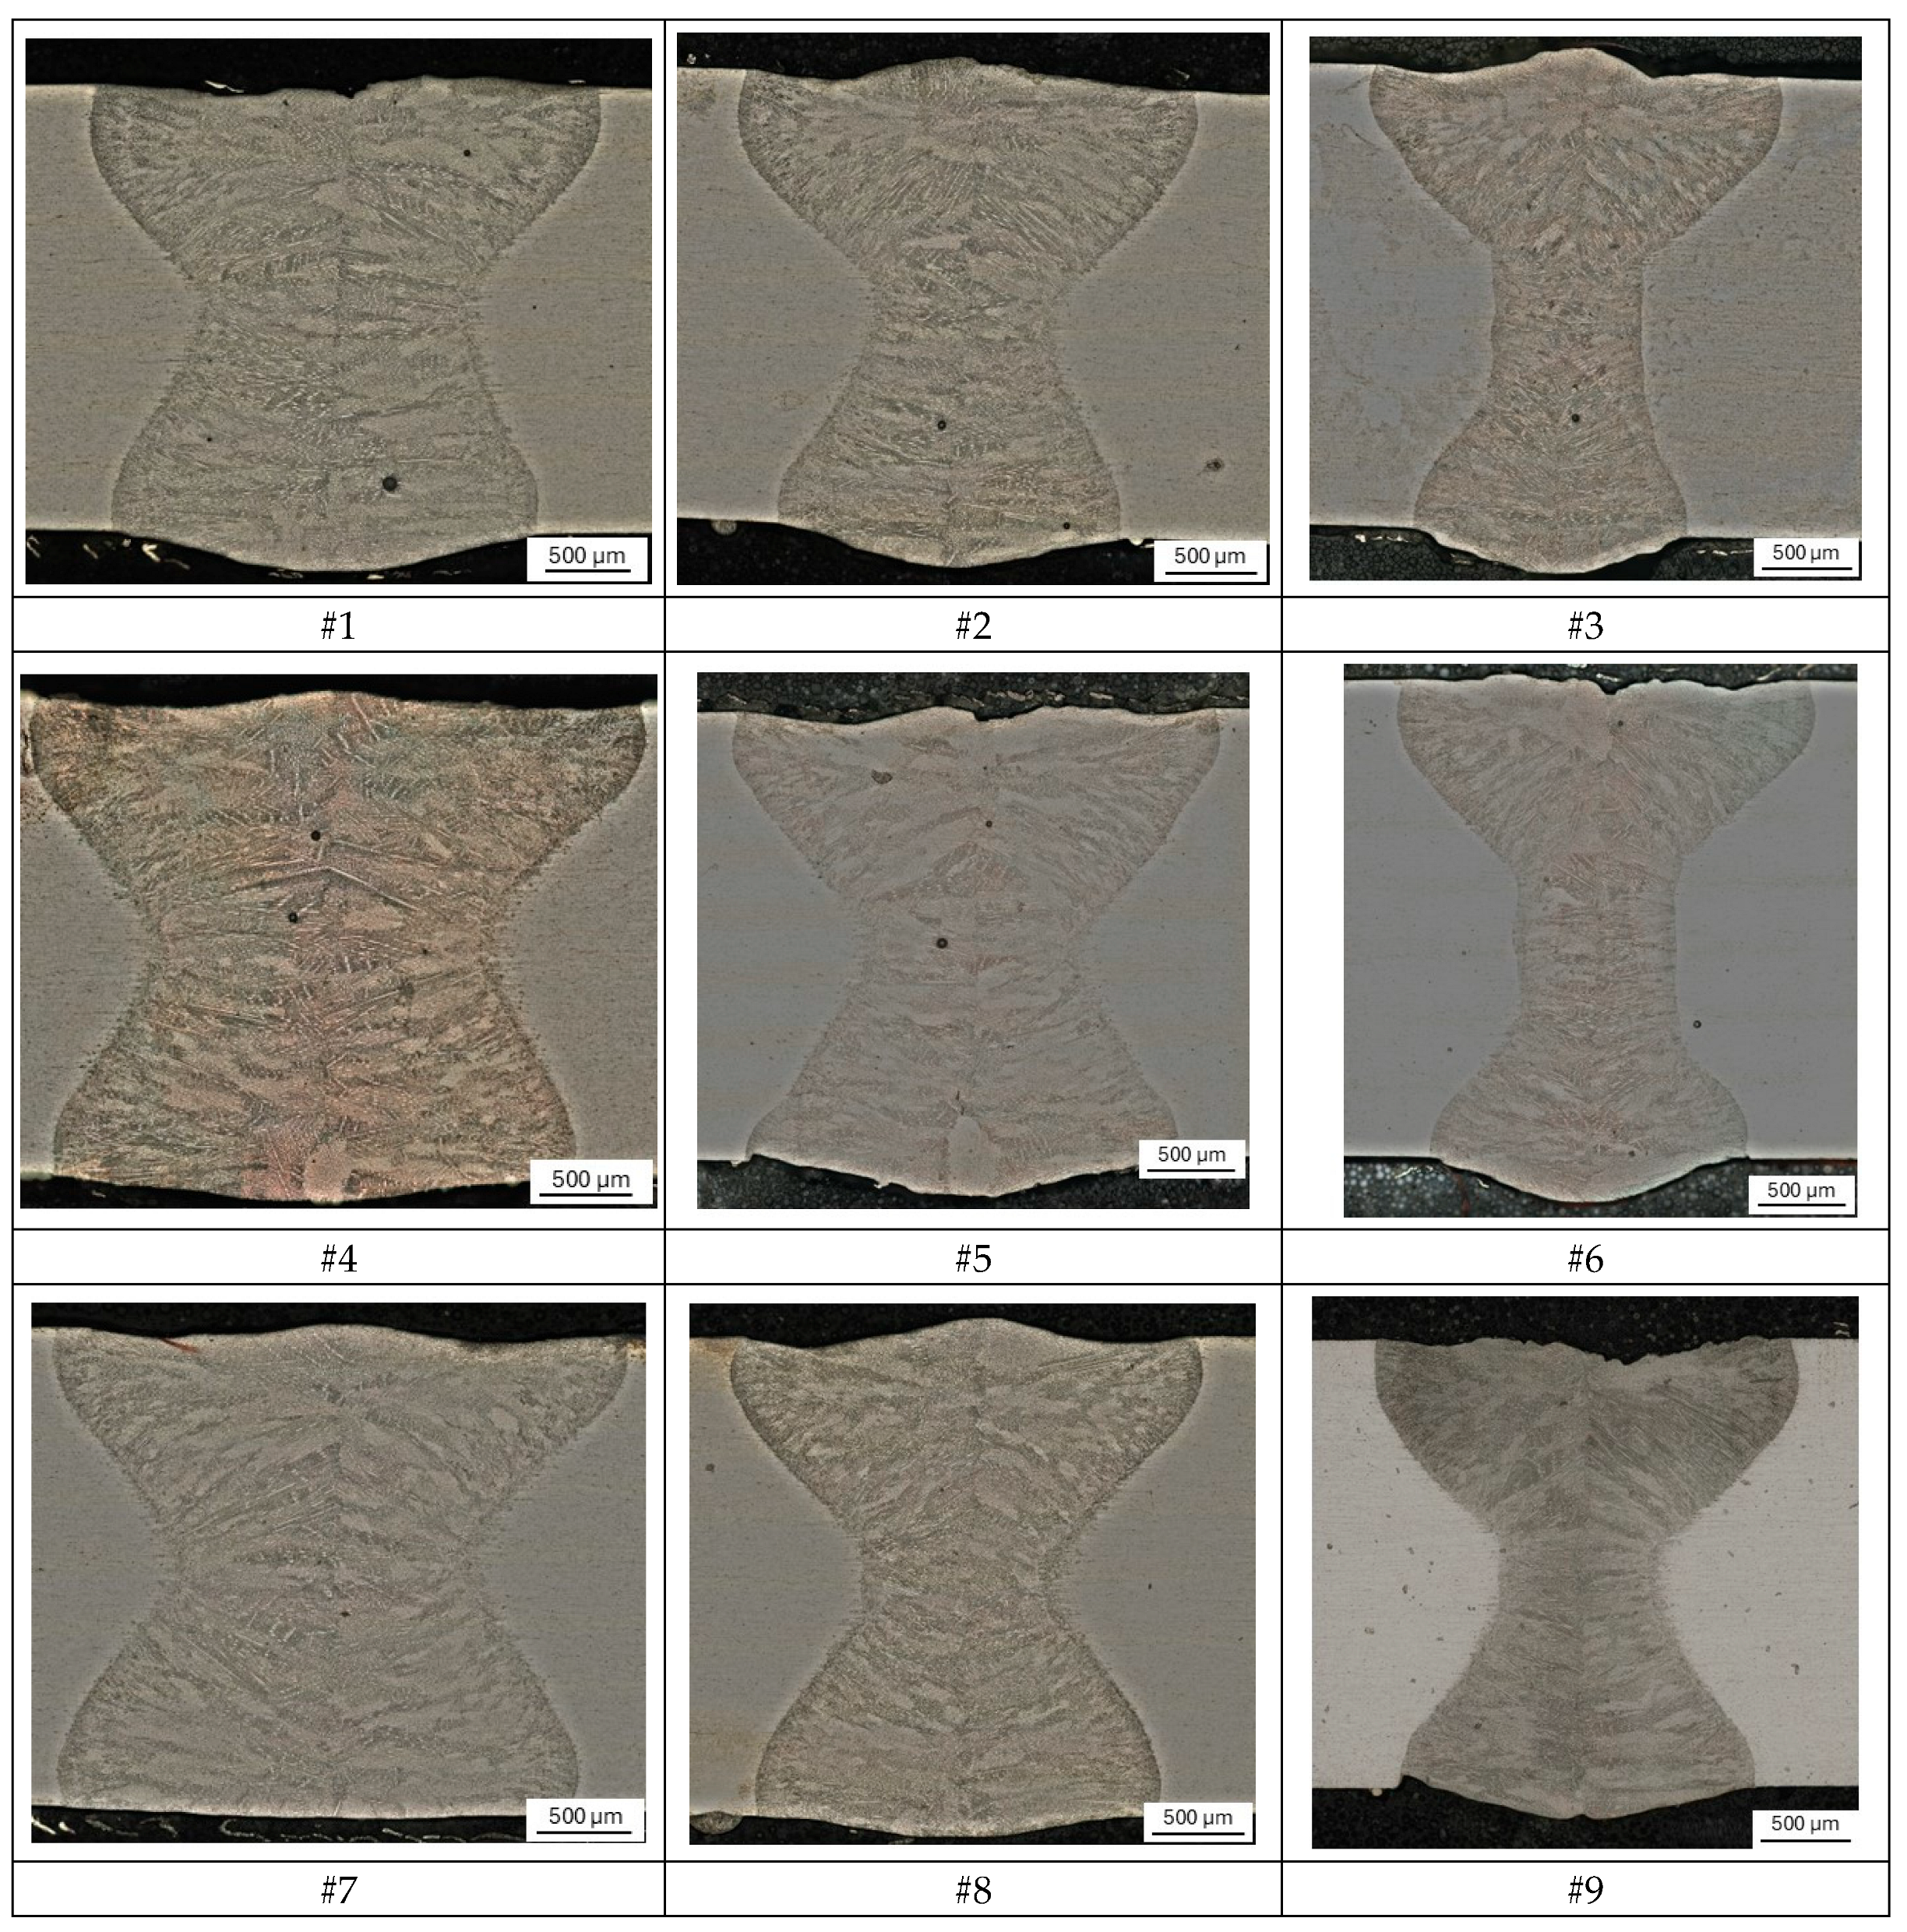
Figure 6 shows the cross-section of the obtained seams: in each row, P is constant, while in each column, v is constant. As a reminder, the ratio between minimum and maximum power (Γ) was set to 1 for seams 3, 5, and 7; to Γ = 0.8 for seams 2, 4, and 9; and to Γ = 0.6 for seams 1, 6, and 8.
LM observations confirm full penetration in all the weld seams, with no evidence of cracks, indicating that the process parameters selected in this study are appropriate.
The seams exhibit an hourglass morphology already observed in full-penetration laser beam welds of thin plates by other investigators [62,63,64]. This feature is likely attributed to partial laser beam reflection from the lower surface of the clamping system. Nevertheless, samples #3 and #6 display a cross-section morphology intermediate between the purely hourglass one and the sink profile characteristic of the keyhole regime. This phenomenon is linked to heat distribution and will be further explained in Section 4. Discussion.
To obtain information about the amount of volume affected by the welding process, the seam area (A) was determined from measurements of the cross-sections by means of the Hirox optical microscope’s built-in software for image analysis (Table 3). The measured areas are directly proportional to the total volume (V) affected by the welding process (V = A·l, where l = 85 mm is the total length of the seam for all the seams).
The lowest amount of volume affected by the welding process is obtained for seam #6 (A = 3.56 mm2). As expected, the amount of BM that melts is influenced by the HI involved in the LBW: lower HI produces narrower seams, and v has a higher influence than P (e.g., see seams #3, #6, and #9 in Figure 7), as also observed by other investigators [64]. This happens because, as v increases, the laser beam moves more quickly along the weld line, with a consequent lower heat absorption that leads to a smaller amount of melted material and might also lead to grain size refinement [64]. It should be noted that there is a critical value for the welding speed above which no full penetration can be achieved. Although the volume change with power is limited, power, and in particular its modulation, plays a key role in laser penetration depth, as reported in the work of Kuo [52,53]: the lower the value of Γ, meaning the higher ΔP, the deeper the weld penetration. Therefore, employing a pulsed laser with lower Γ values increases the value of the critical speed and allows for working with higher ones with a further reduction in the melted volume.
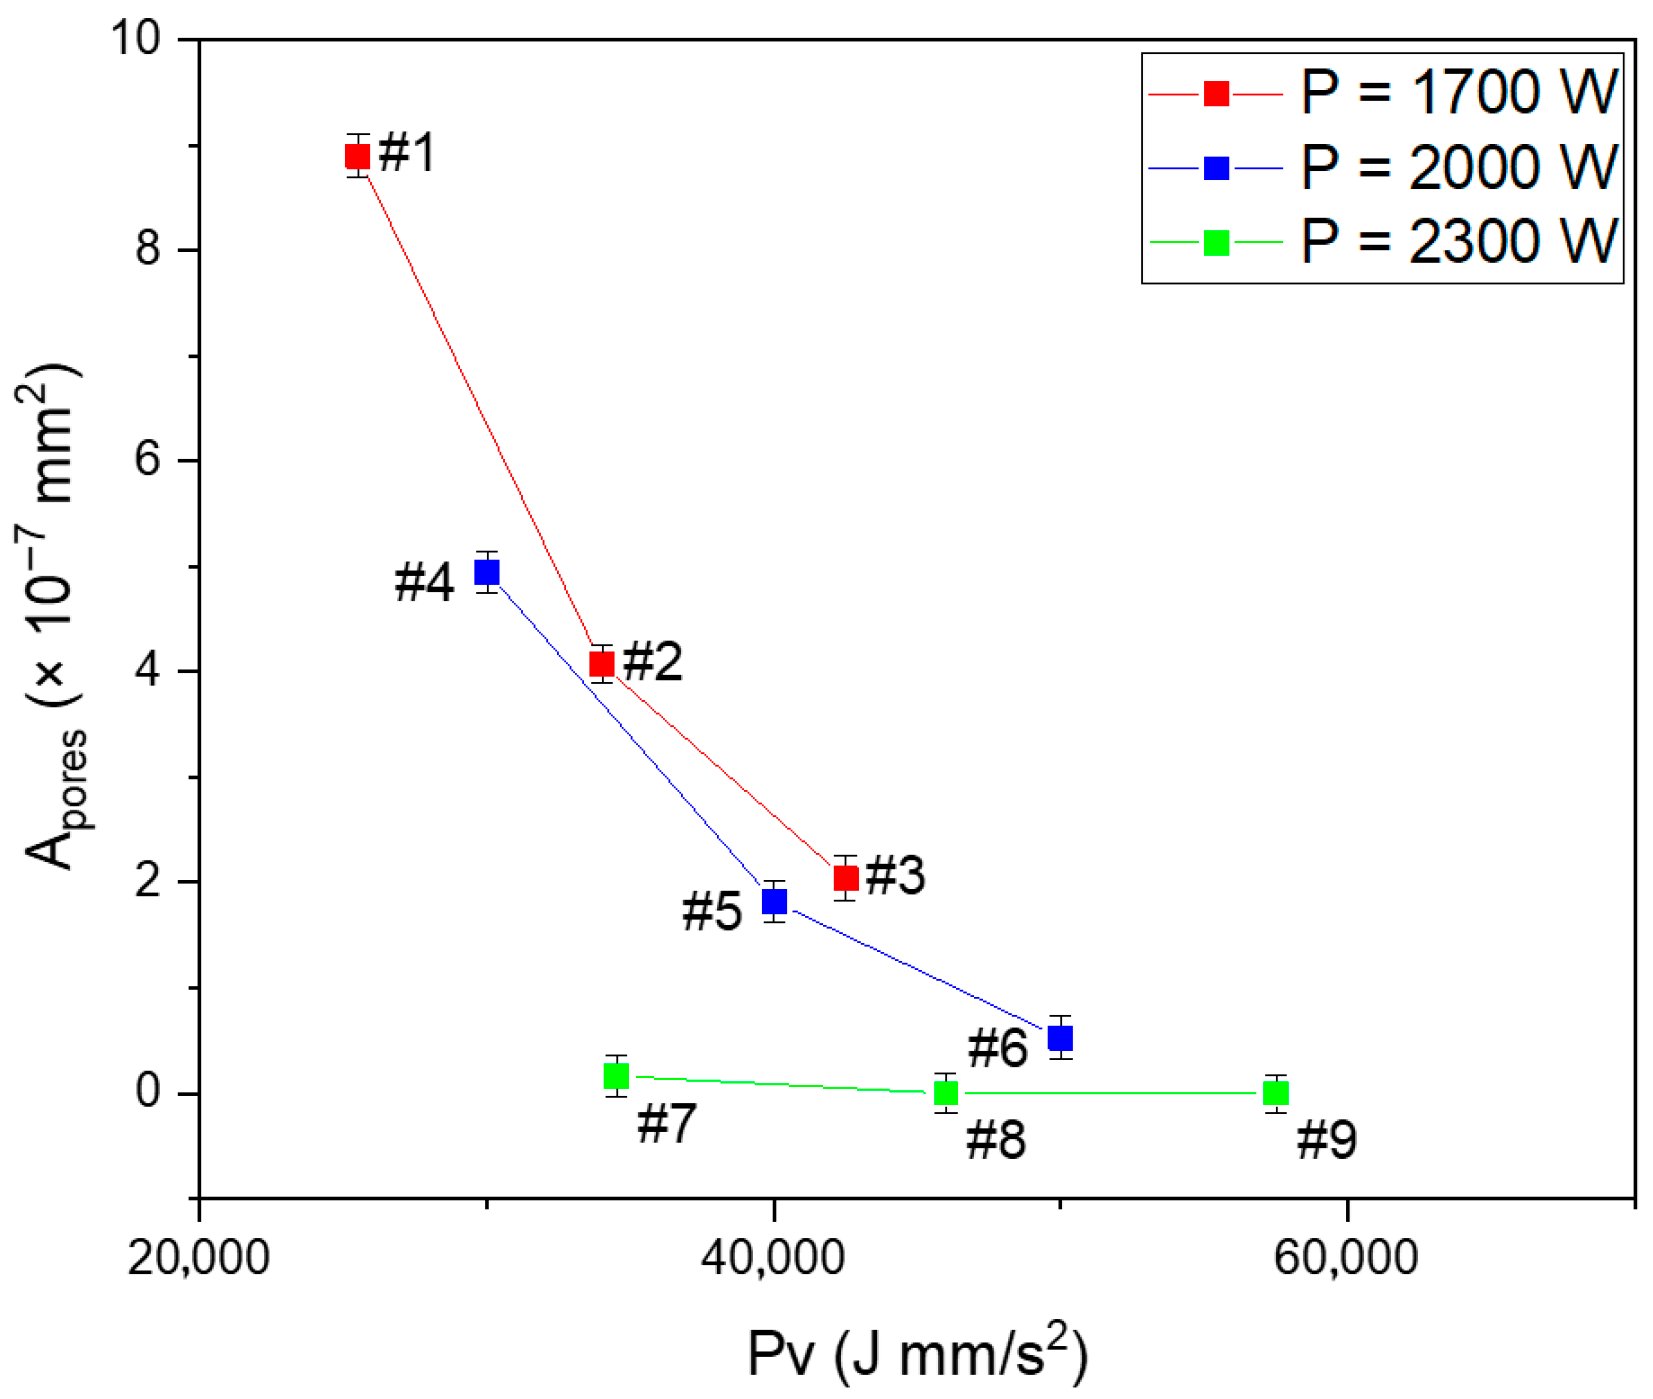
Some micrometric pores are present in the MZ, and a correlation with the welding parameters was observed. The average diameter (davg) and total area of the pores in the MZ (Apores) have been evaluated from high magnification images (1000×). The average values, obtained considering four different cross-sections for each seam, are reported in Table 4.
Figure 8 illustrates the total area of the pores as a function of the combined parameter P·v, and higher P·v values correspond to a substantial reduction in porosity. This effect is most pronounced at lower power levels, where variations in welding speed strongly influence gas entrapment. Conversely, in the high-power regime (P = 2300 W), porosity is essentially negligible across all speeds. This suggests that the increased melt-pool agitation induced by high power is already sufficient to promote efficient gas escape, making the influence of speed comparatively marginal.

3.2. Microstructural and Mechanical Characterization of Welds

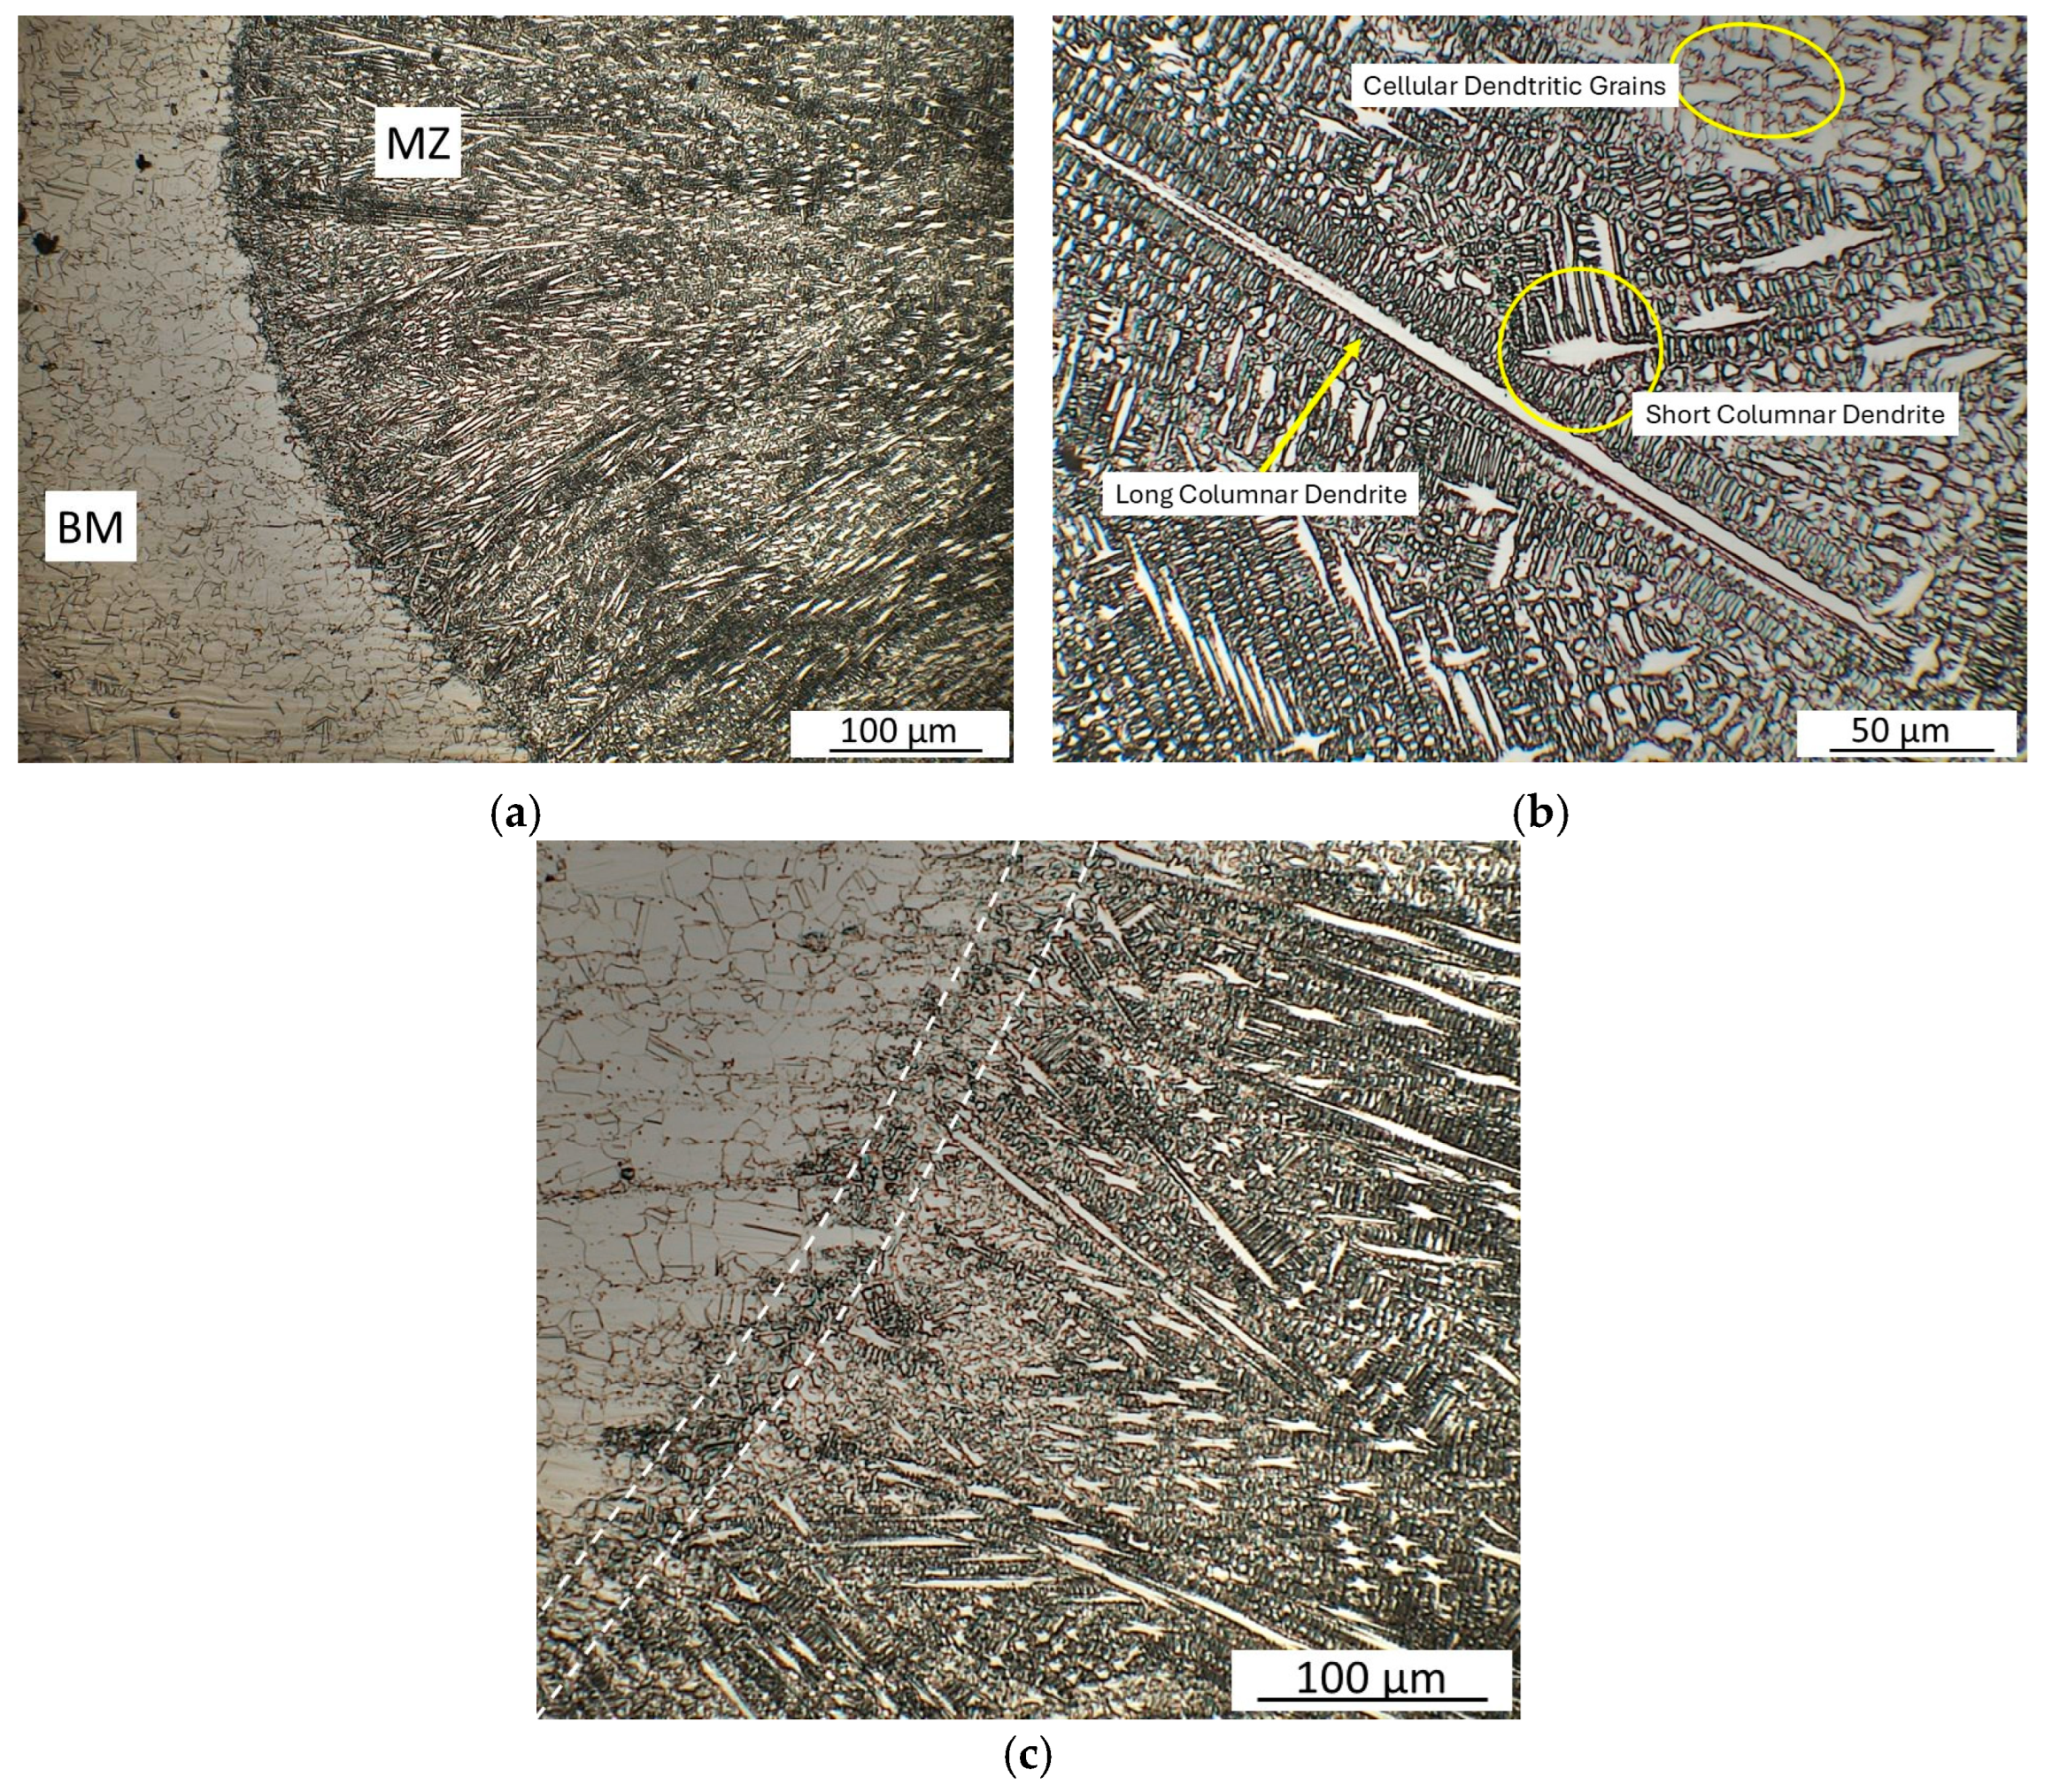
The microstructure in the BM, HAZ, and MZ (Figure 9a–c) is similar in each sample obtained with different process parameters. All the seams are characterized by a very narrow HAZ (~30 μm) highlighted between the dashed lines in Figure 9c.
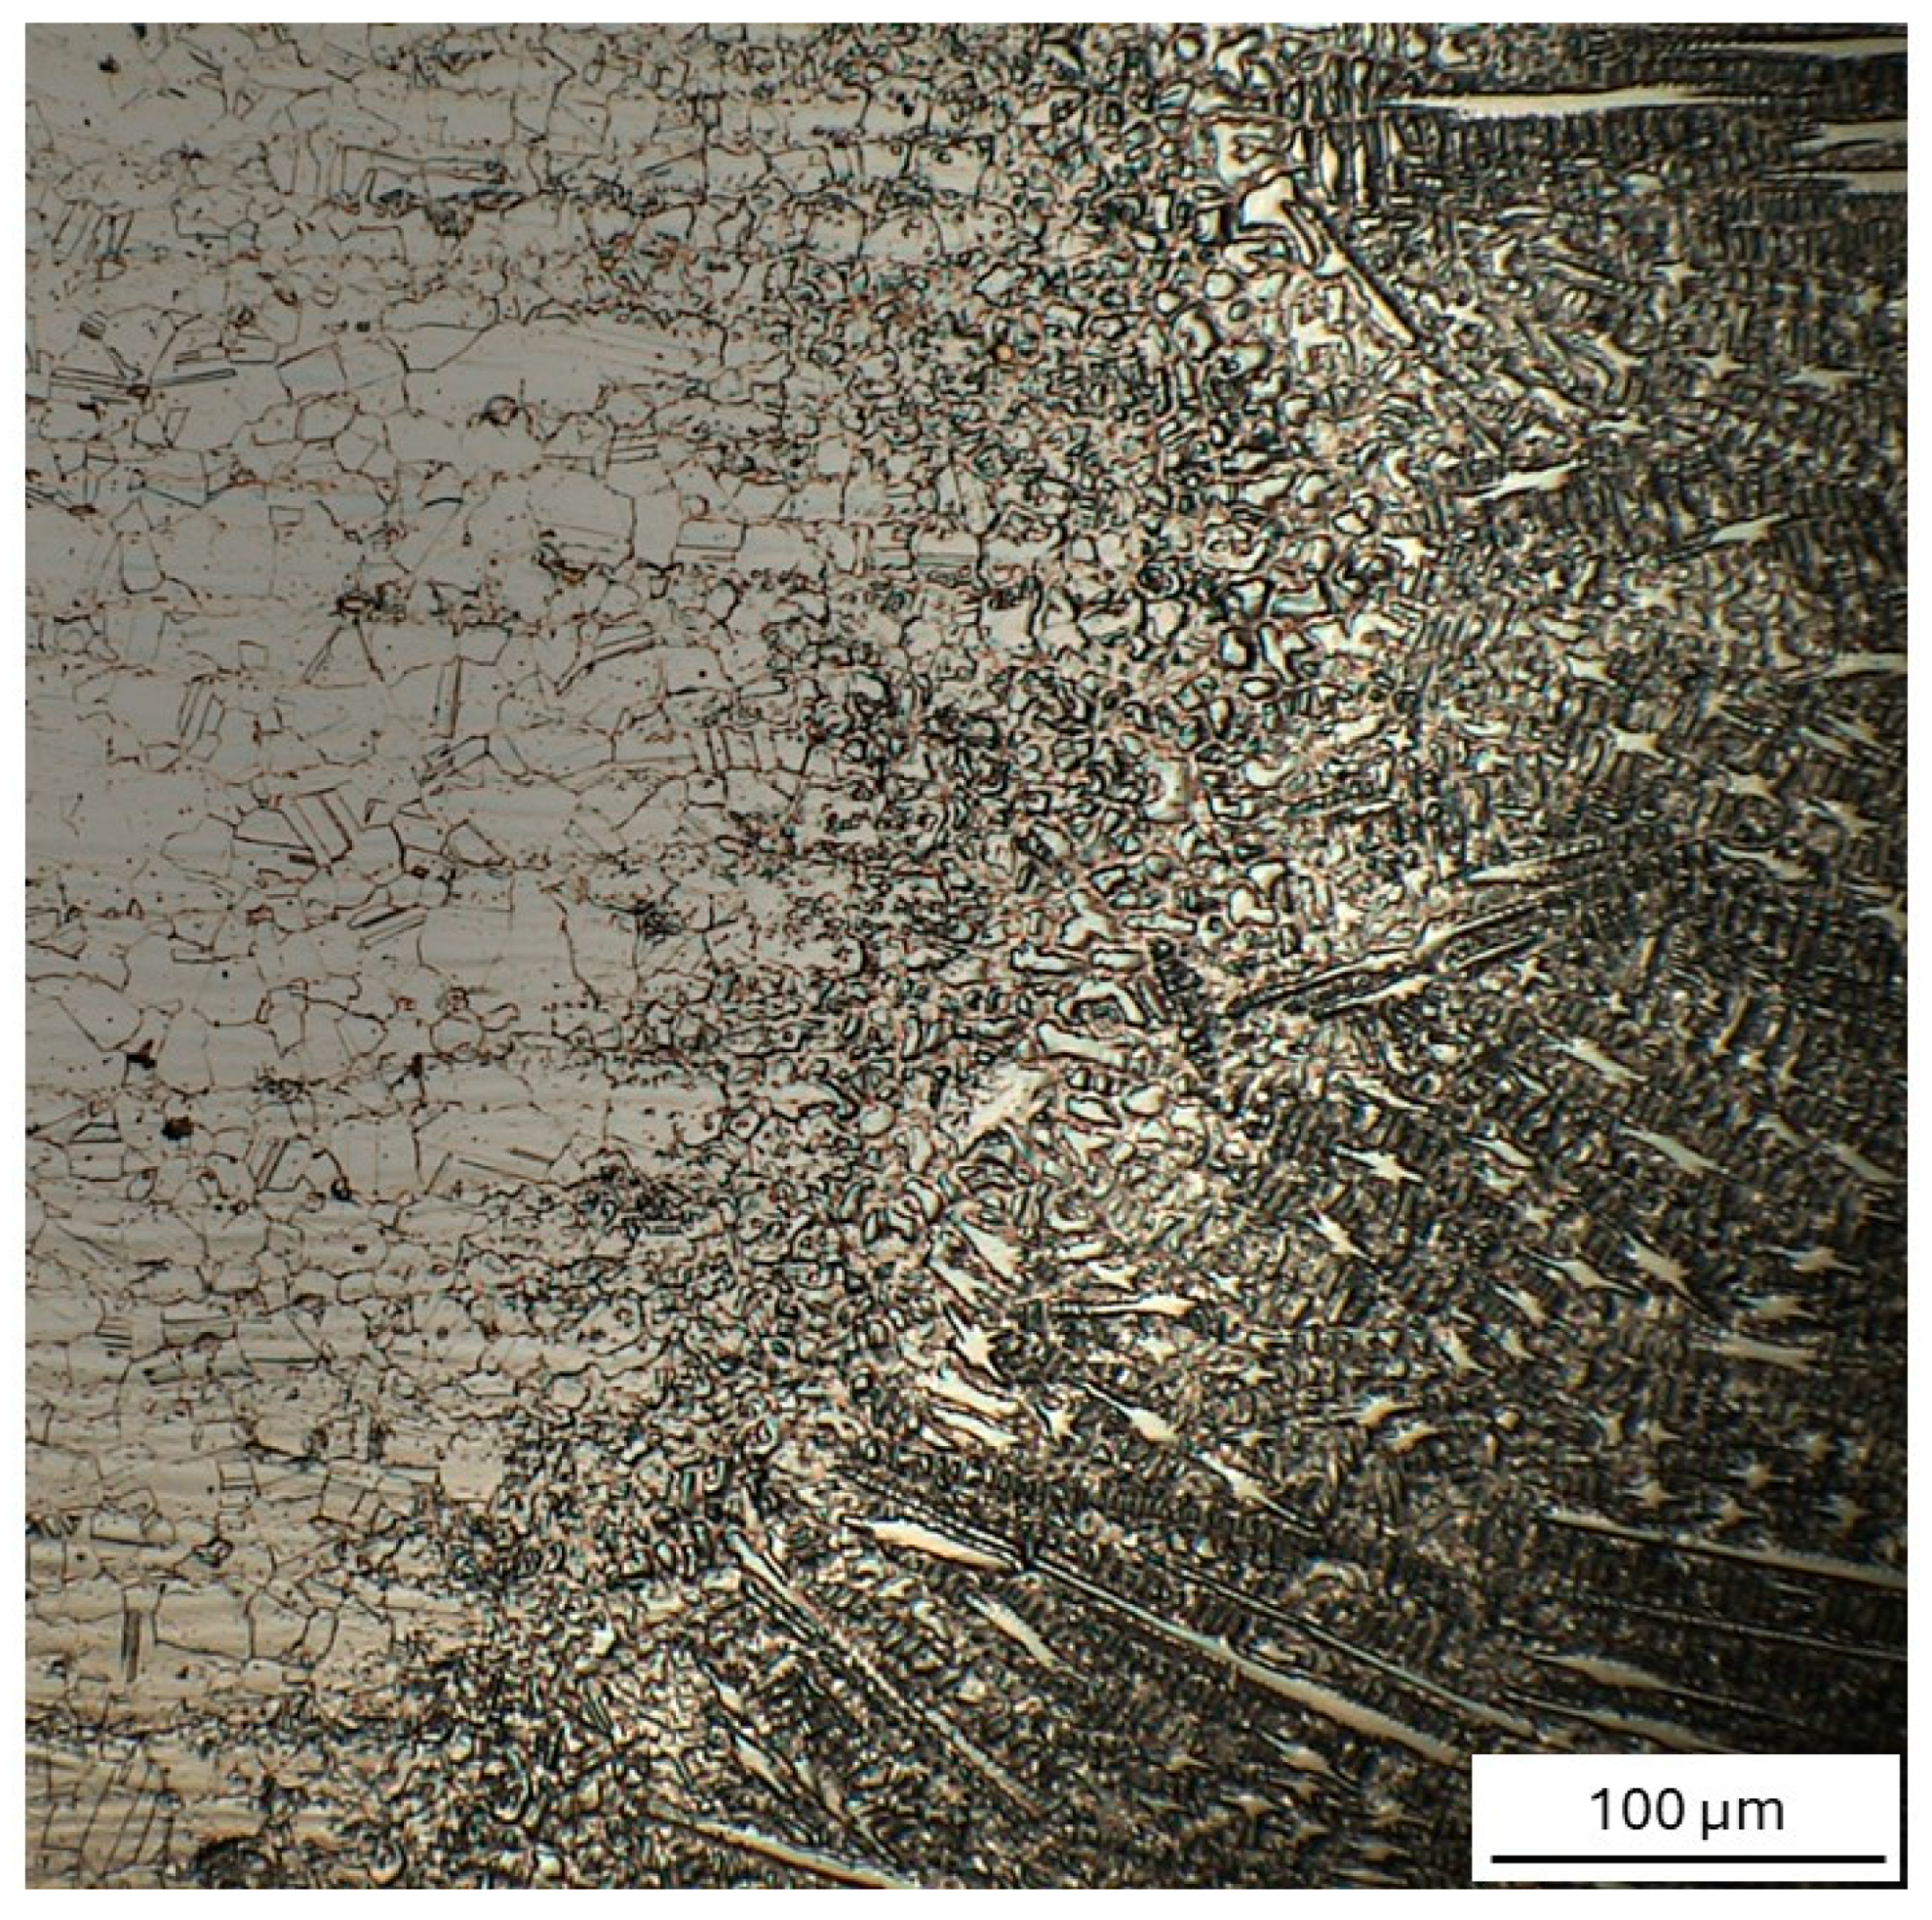
At the HAZ/MZ interface, typical epitaxial growth is clearly observed (Figure 9c and Figure 10). From this boundary, long columnar dendrites grow toward the center of the MZ, following the direction of the thermal gradient. This morphology results from the solidification conditions, which depend on the ratio G/R (where G is the temperature gradient in the liquid in front of the advancing solid–liquid interface and R interface speed), while dendrite size is governed by the product G × R [65]. Near the HAZ/MZ boundary, the combination of a steep thermal gradient (high G/R) and relatively low G × R promotes the formation of long, well-oriented columnar dendrites, as shown in Figure 9b.
Moving towards the center, the low temperature gradient and the increase in the solidification rate lead to finer dendritic structures with short arms that evolve into a cellular structure at the center of the seam (Figure 9b) with a consequent grain size reduction, as already observed by other investigators [65,66].
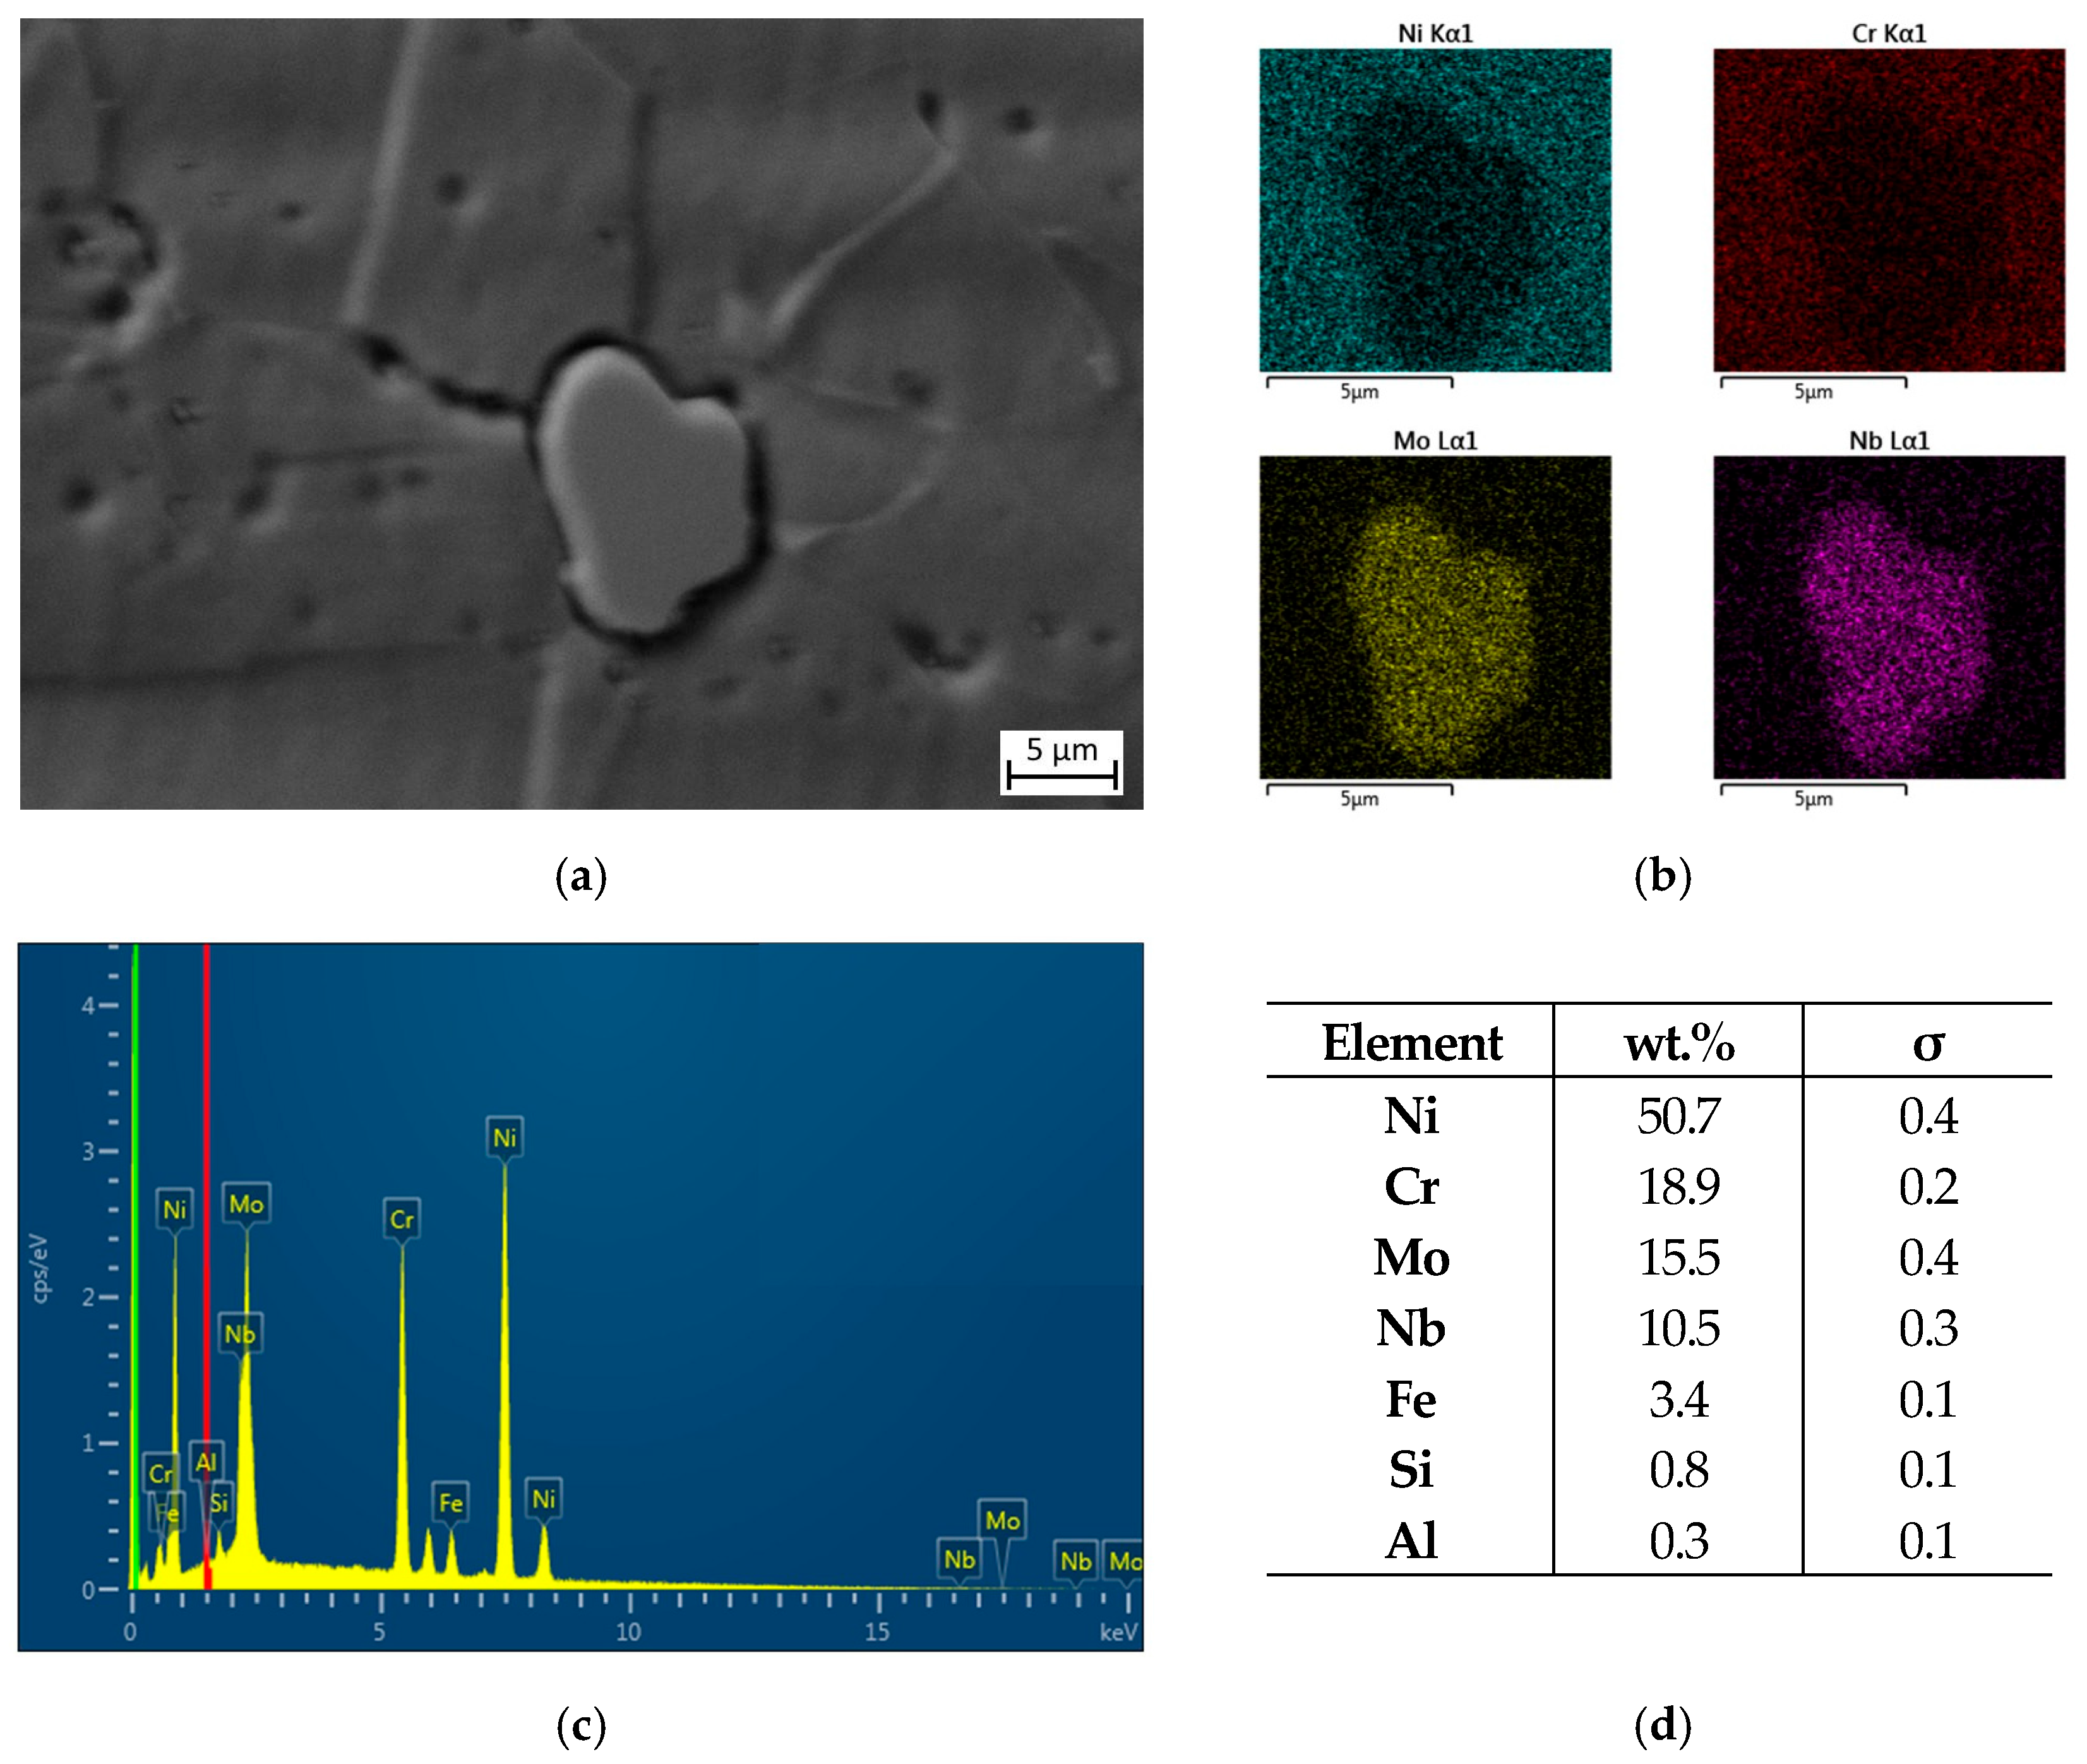
SEM observations confirmed the presence of precipitates in both the BM (Figure 11) and MZ (Figure 11), identified as (Nb, Ti, Mo)C (Figure 10 and Figure 11) from a comparison of EDS analysis and literature data [67,68].
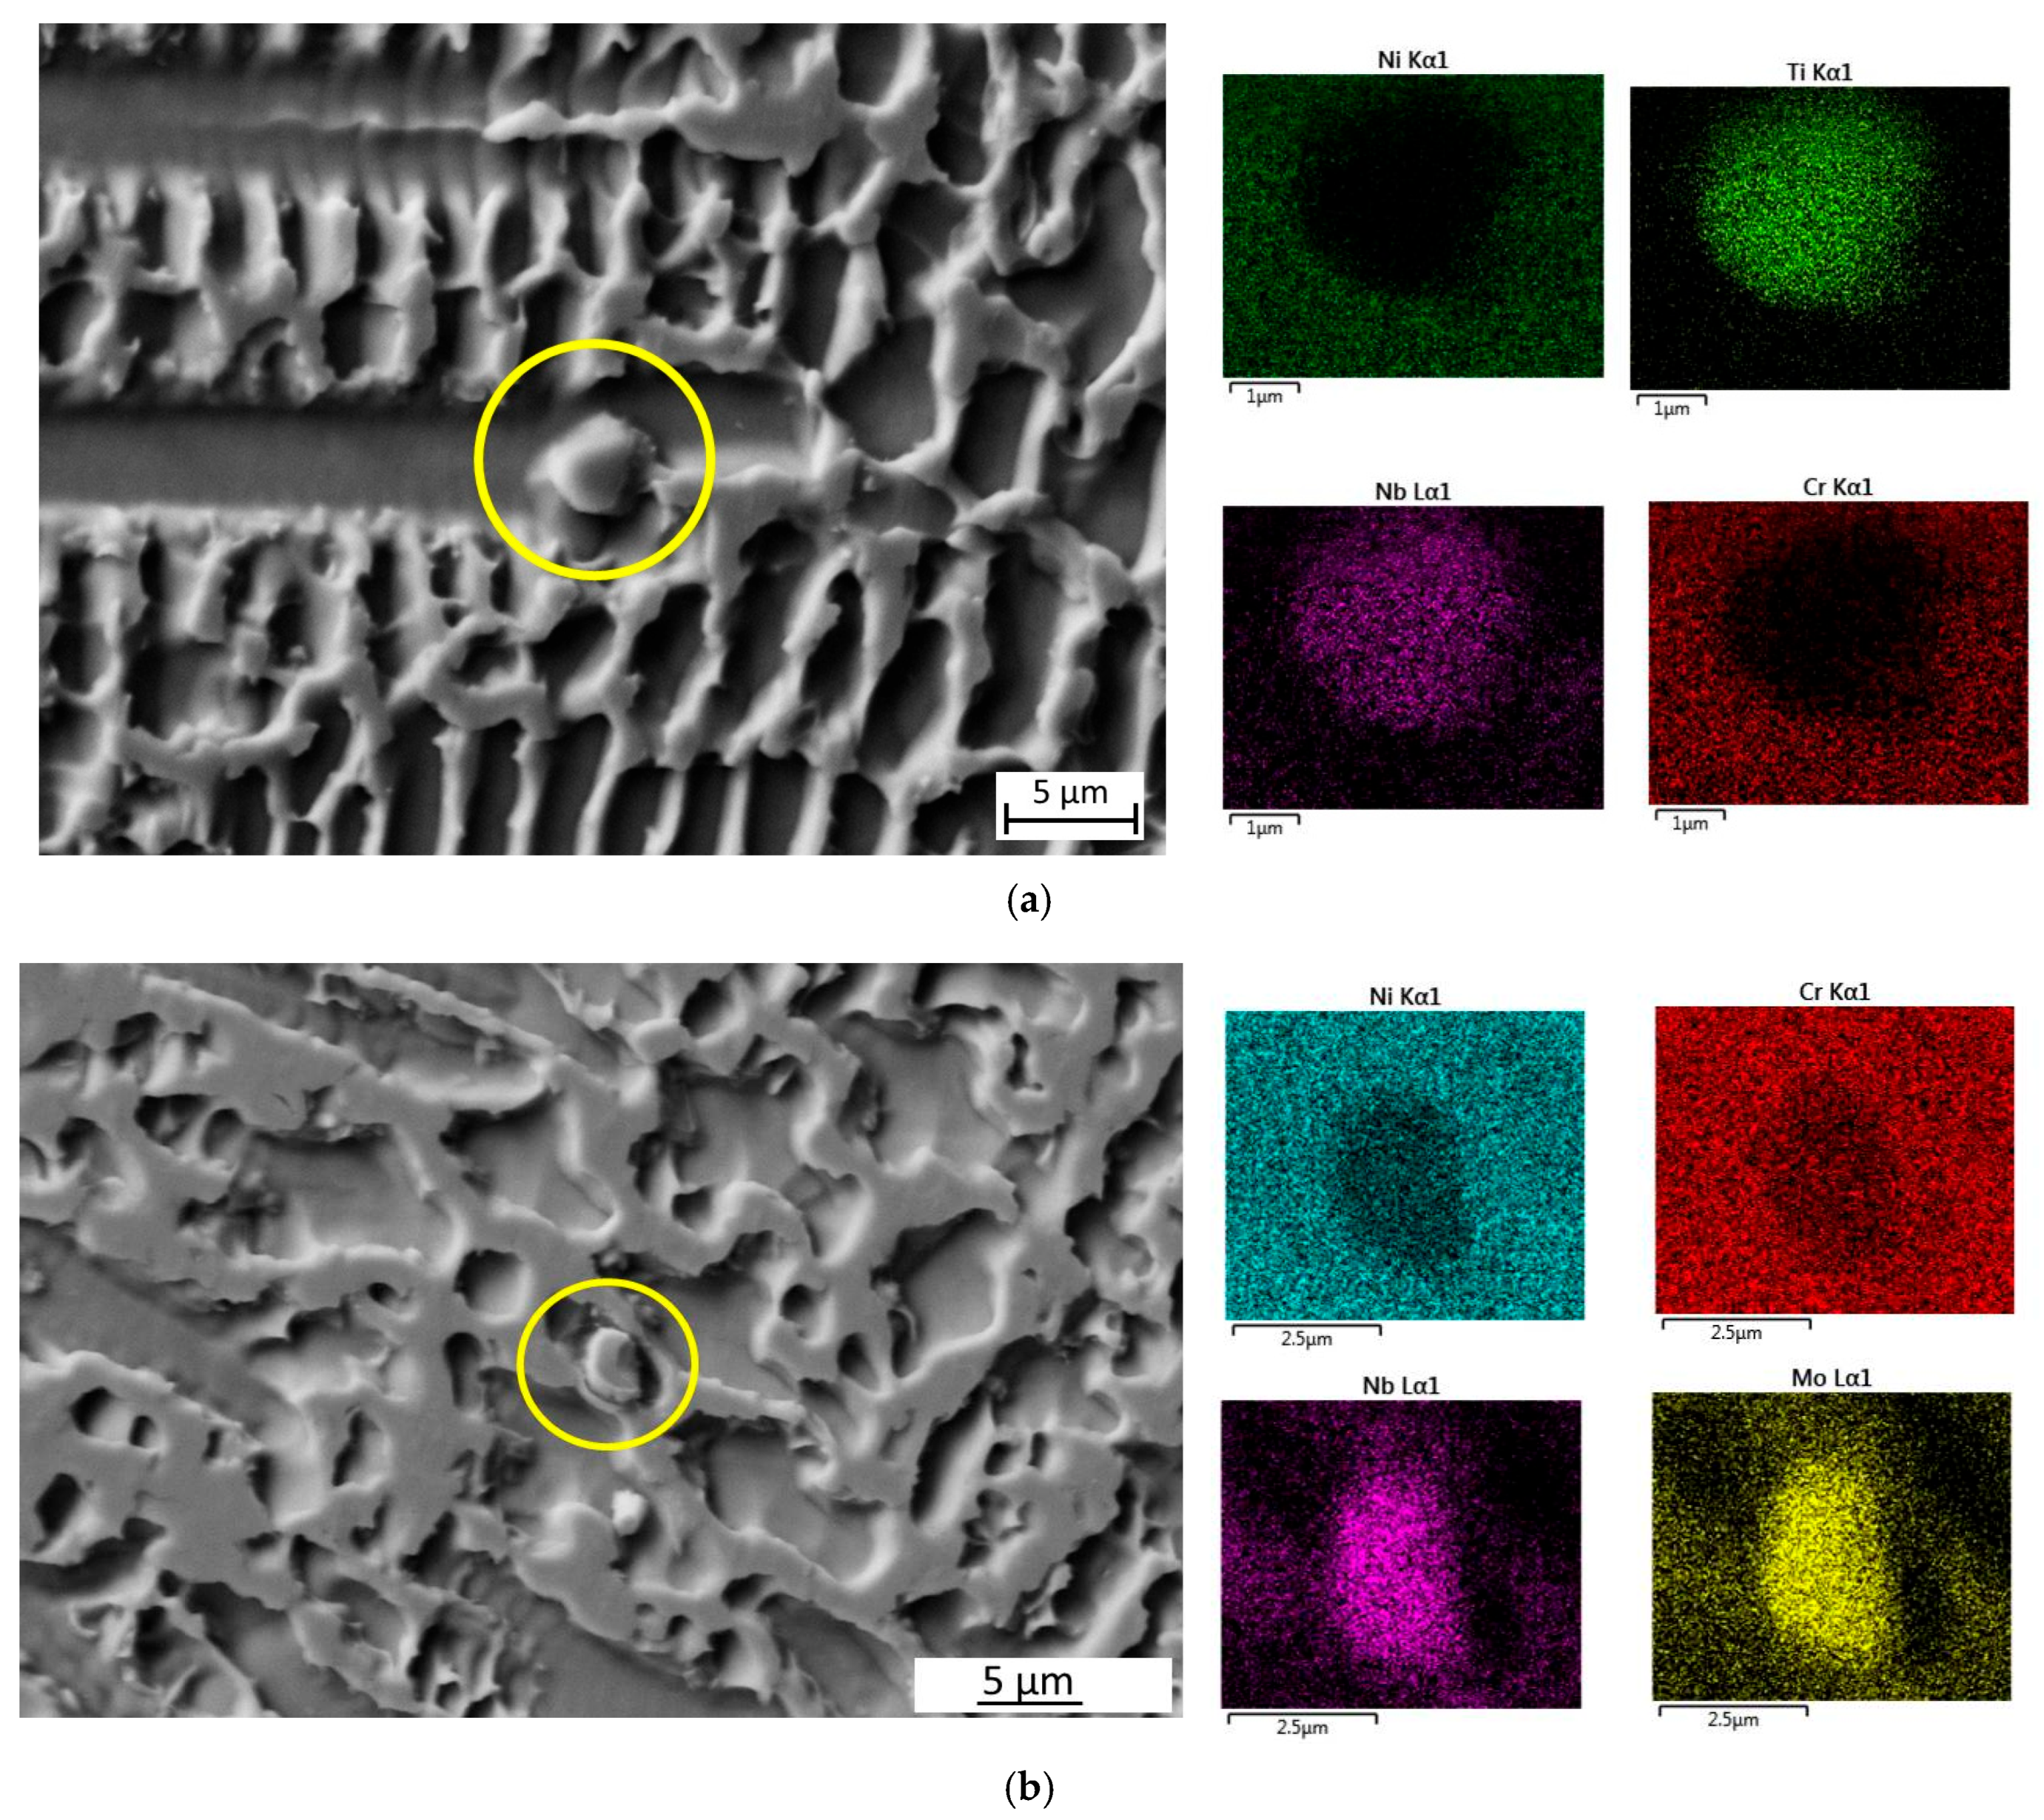
After the welding process, the shape of the precipitates is rounder, and their size is ~5 ± 1 μm, has shown in Figure 12.

3.2.1. XRD Analysis

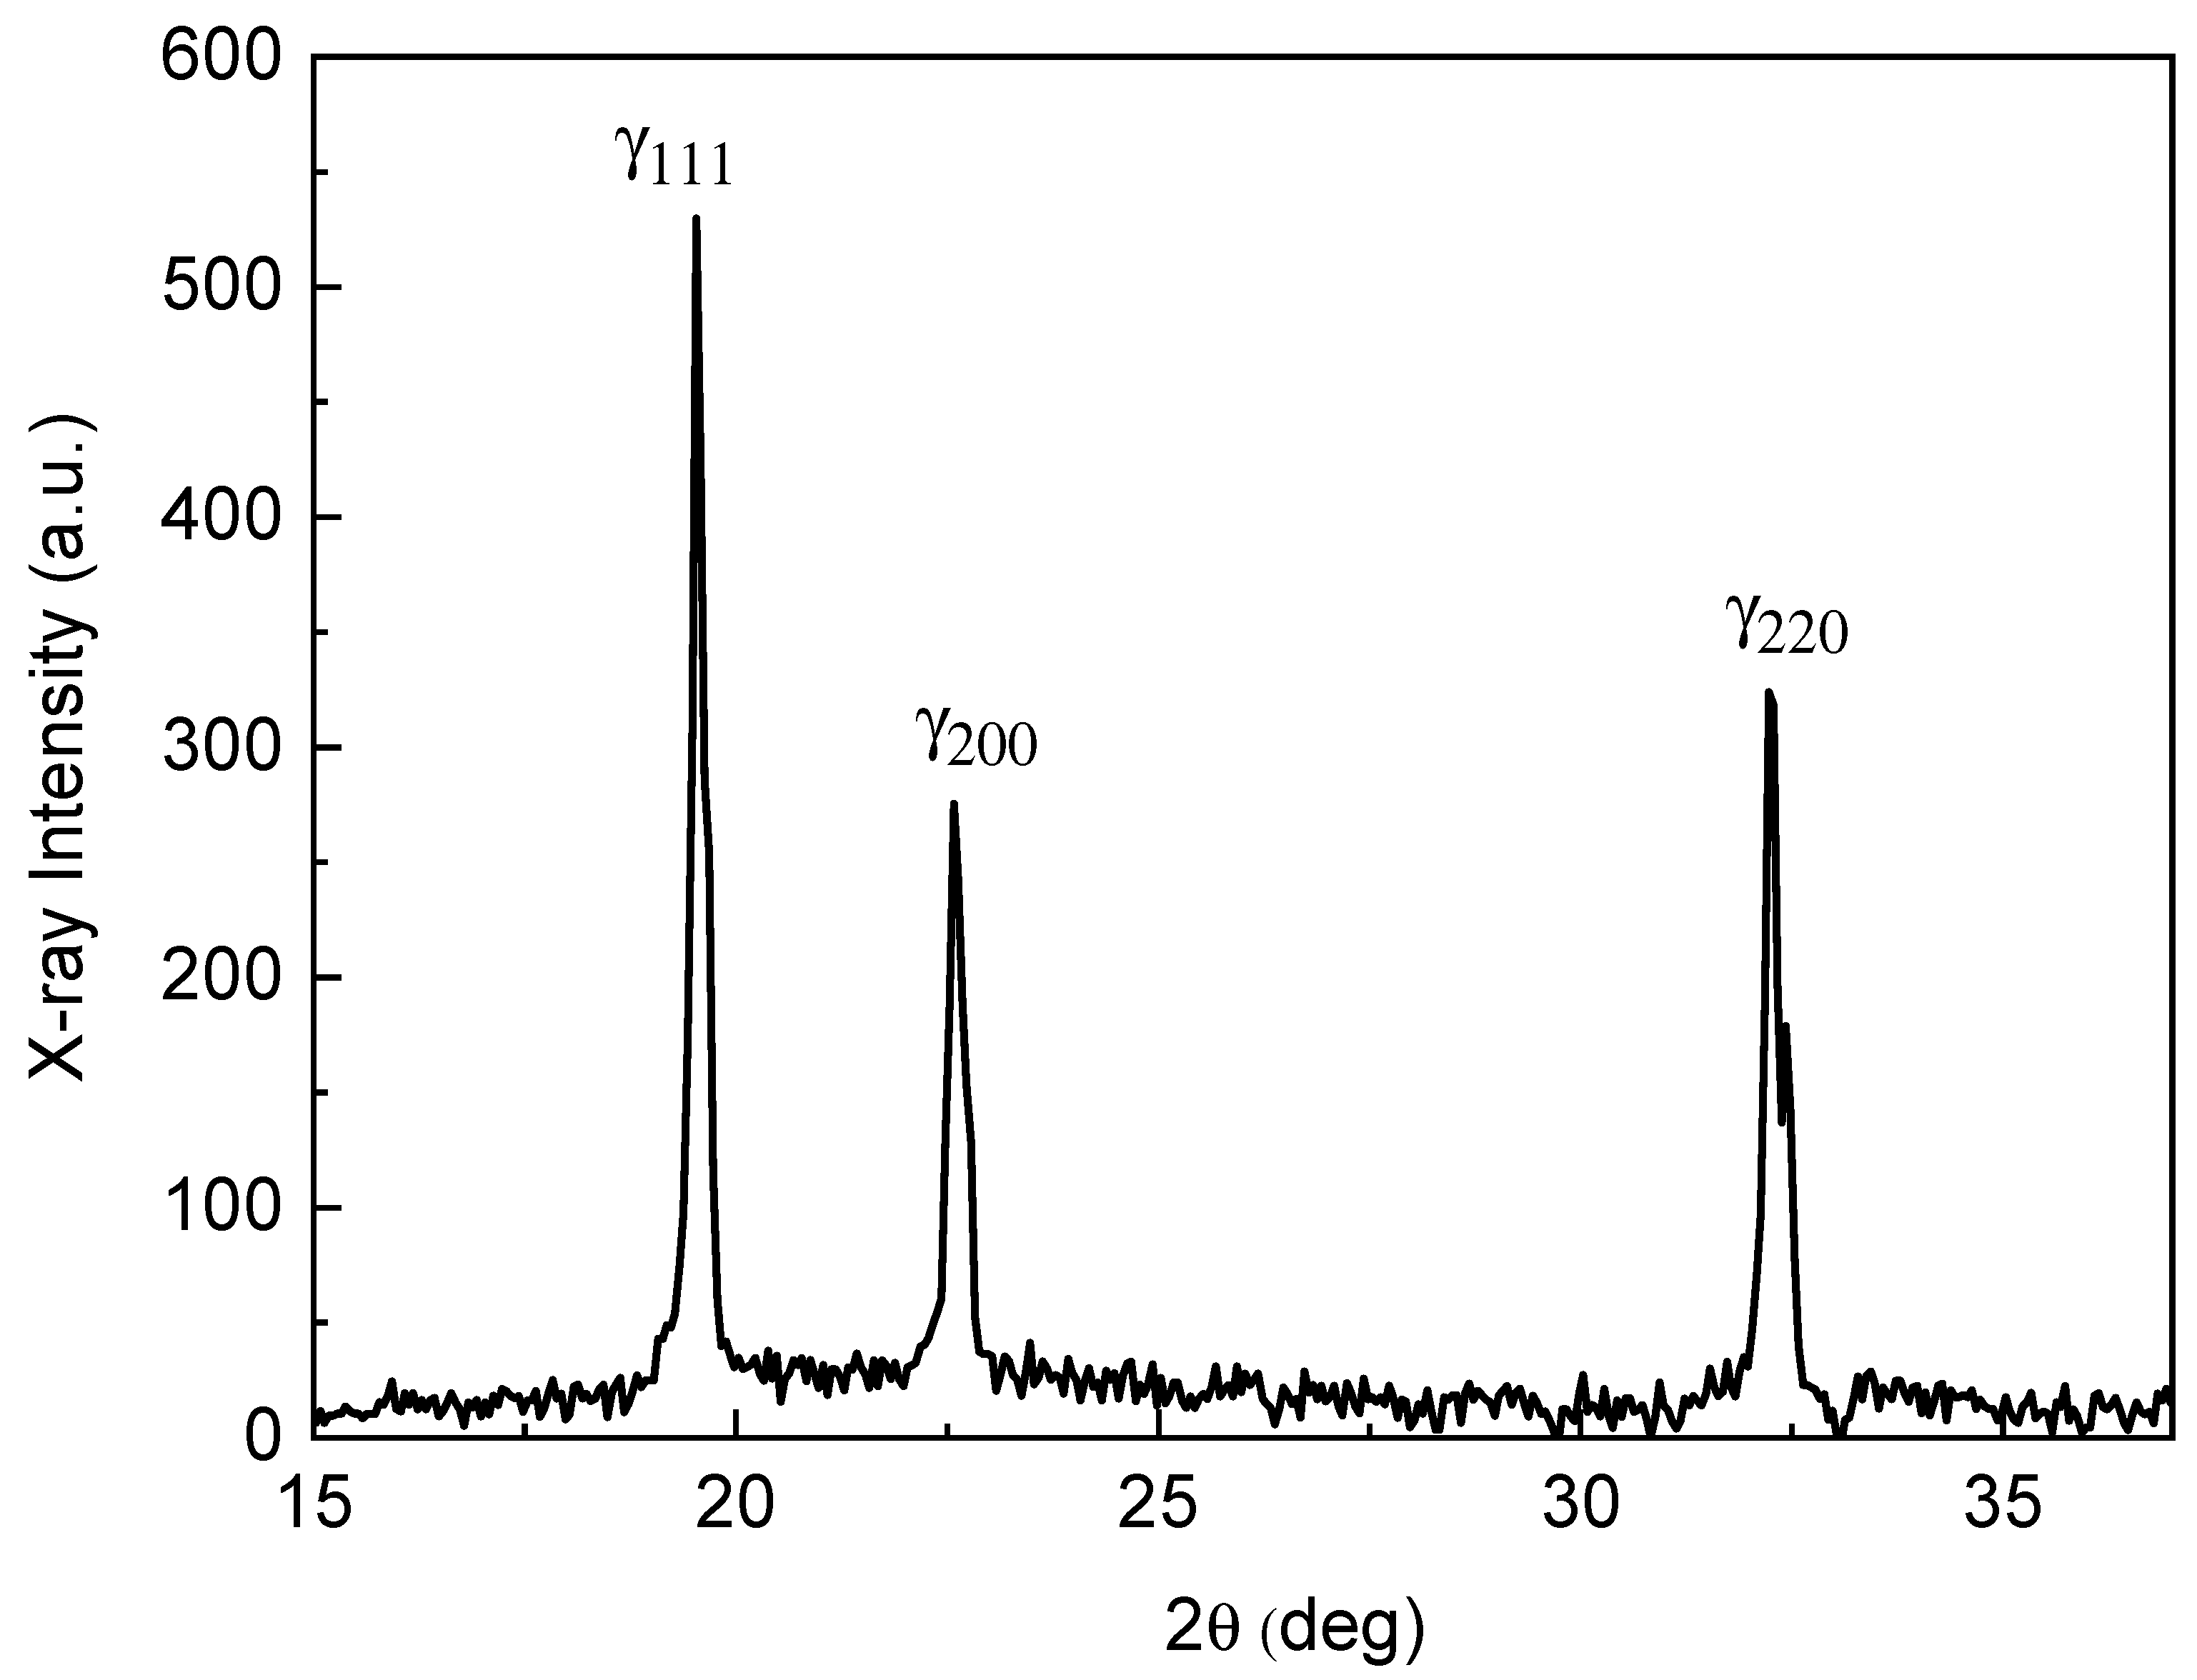
The XRD pattern of the original material, obtained by focusing the beam on the BM, displays the typical reflections of the Ni γ-phase (Figure 13).
From the pattern of Figure 13, the relative intensities of the strongest XRD reflections were calculated and reported in Table 5. To evaluate possible preferred grain orientations, they were compared to those of Ni with randomly oriented grains (JCPDS 4-850). The BM exhibits a strong [110] texture: the I(220)/I(111) ratio is 0.60, namely about three times that of Ni with randomly oriented grains (0.21).
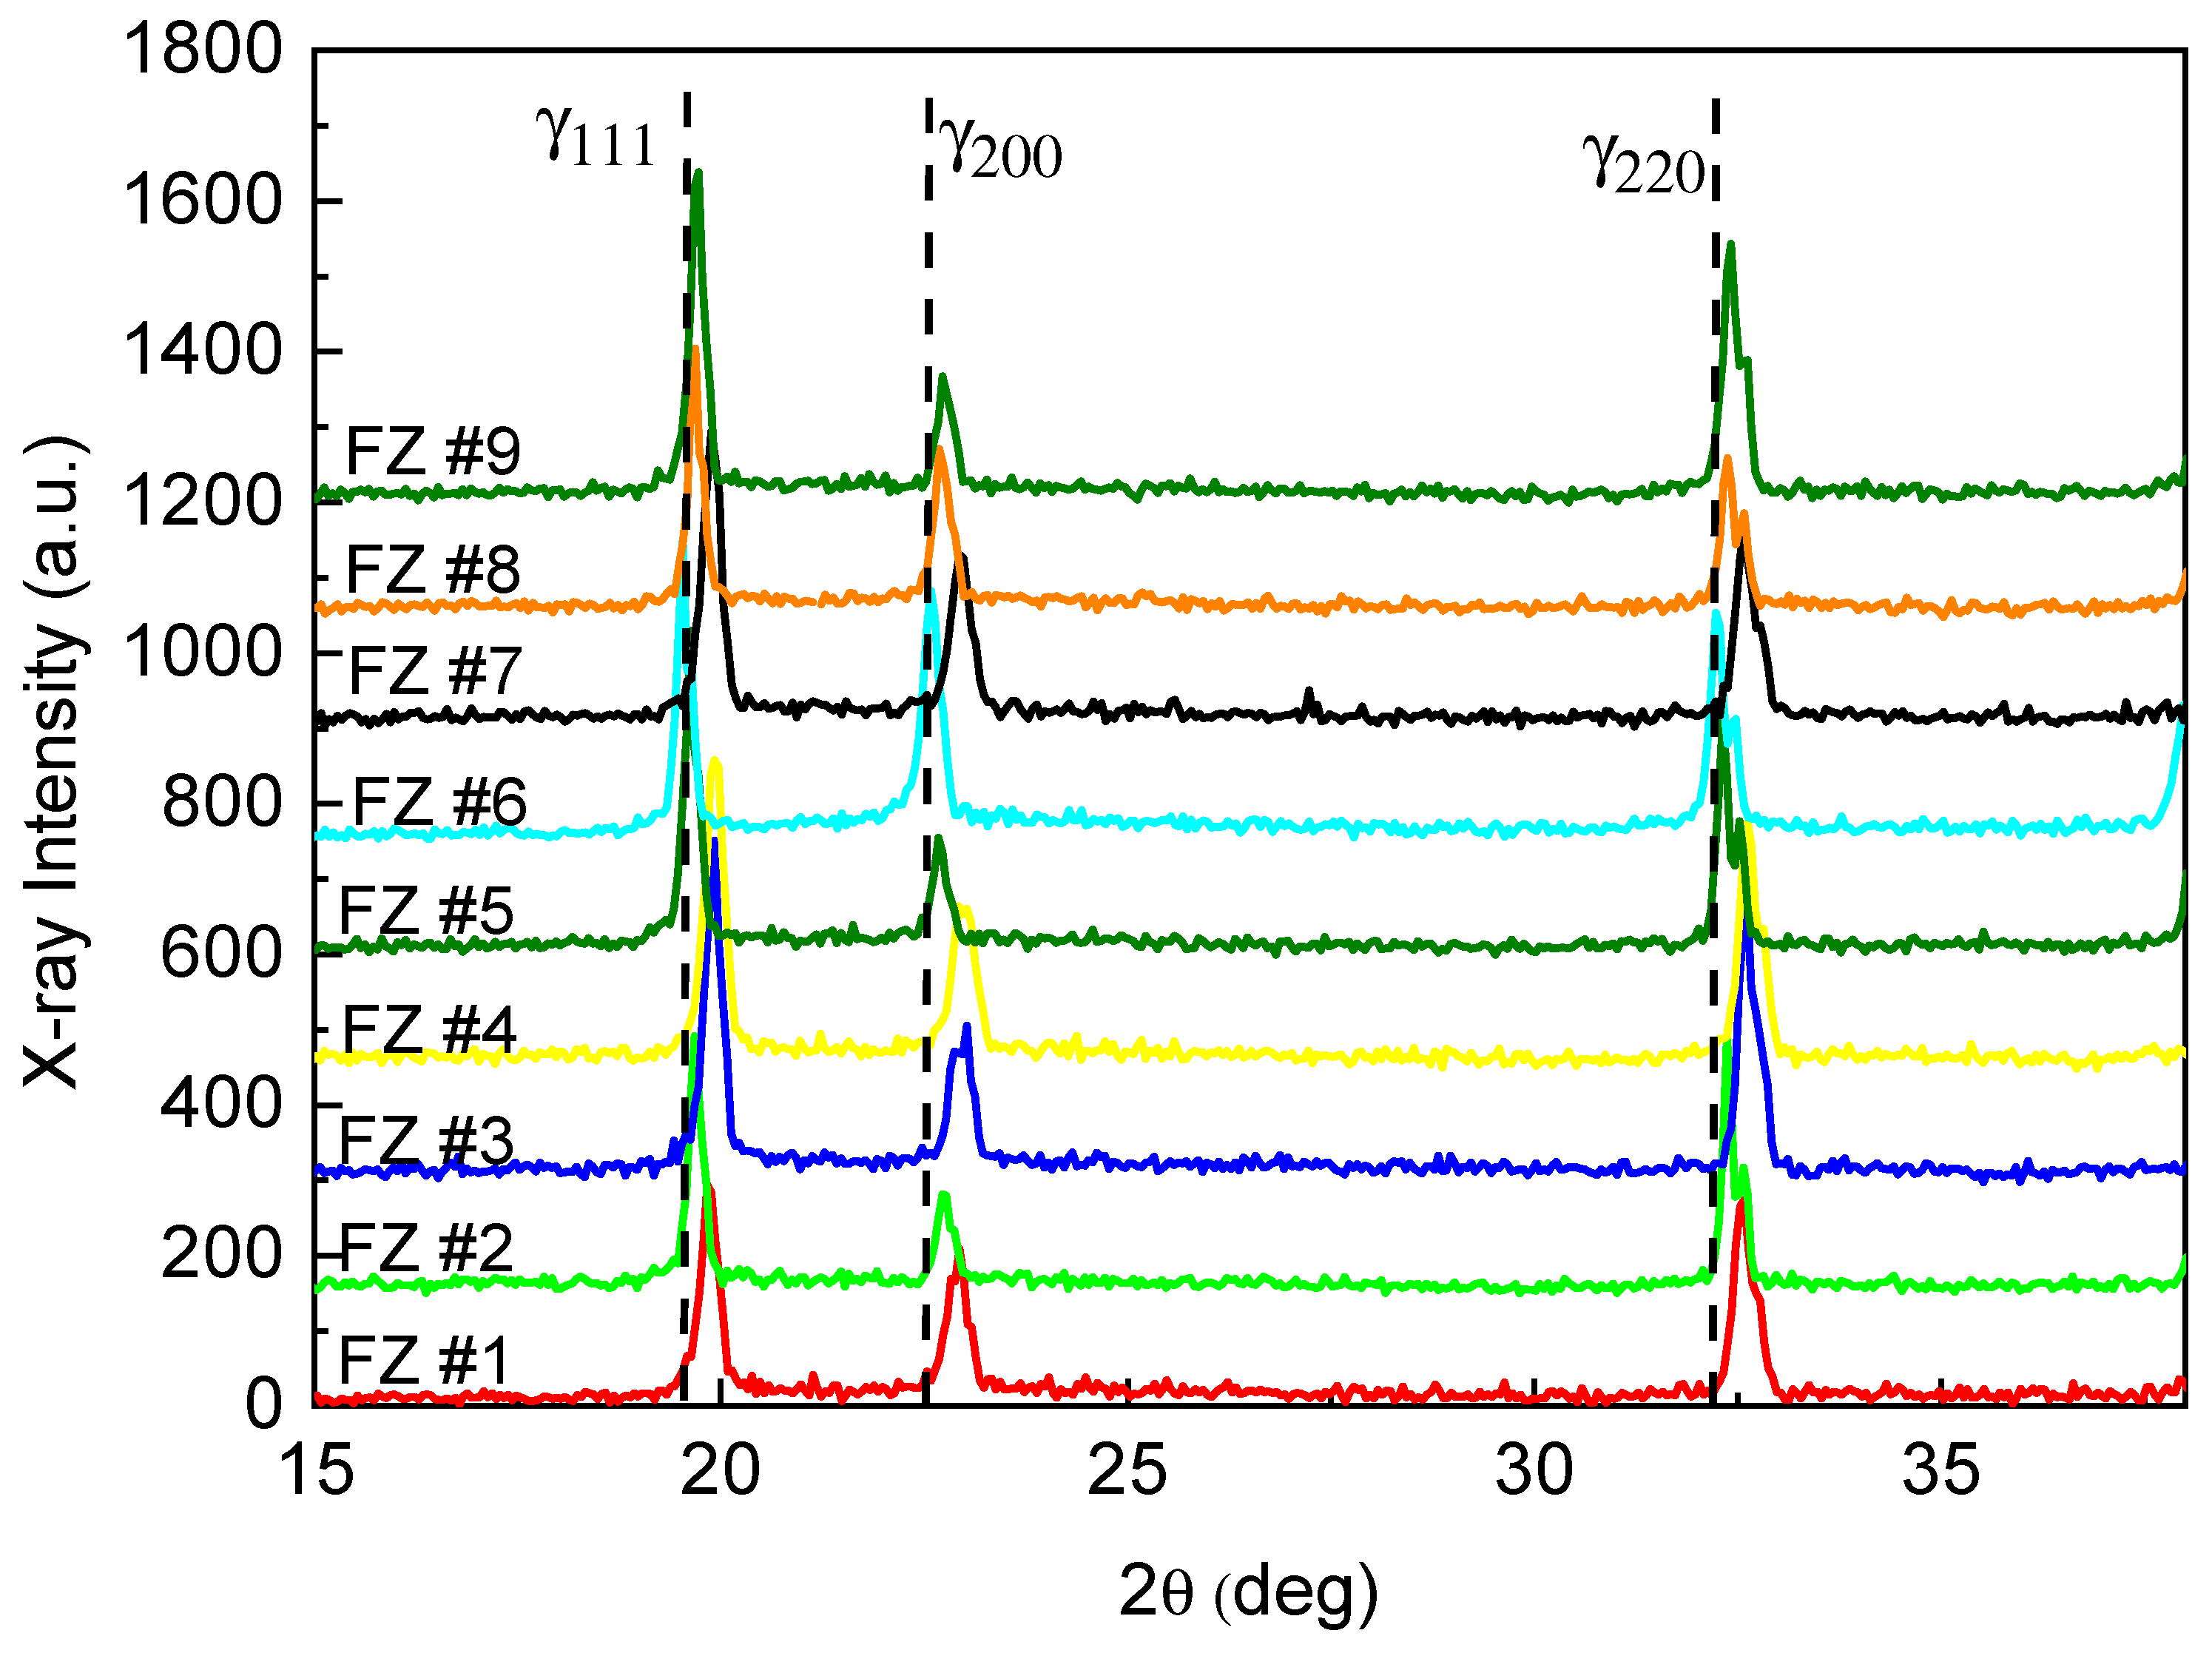
After the welding process, XRD measurements were performed by focusing the X-ray beam on the MZ of each seam (Figure 14).
The comparison of the relative intensities of the main XRD peaks in the MZ and BM reveals that a preferred grain orientation is still present after welding because the I₍220₎/I₍111₎ ratio remains always higher than 0.21 (Table 6). Generally, the [110] texture results are further strengthened.
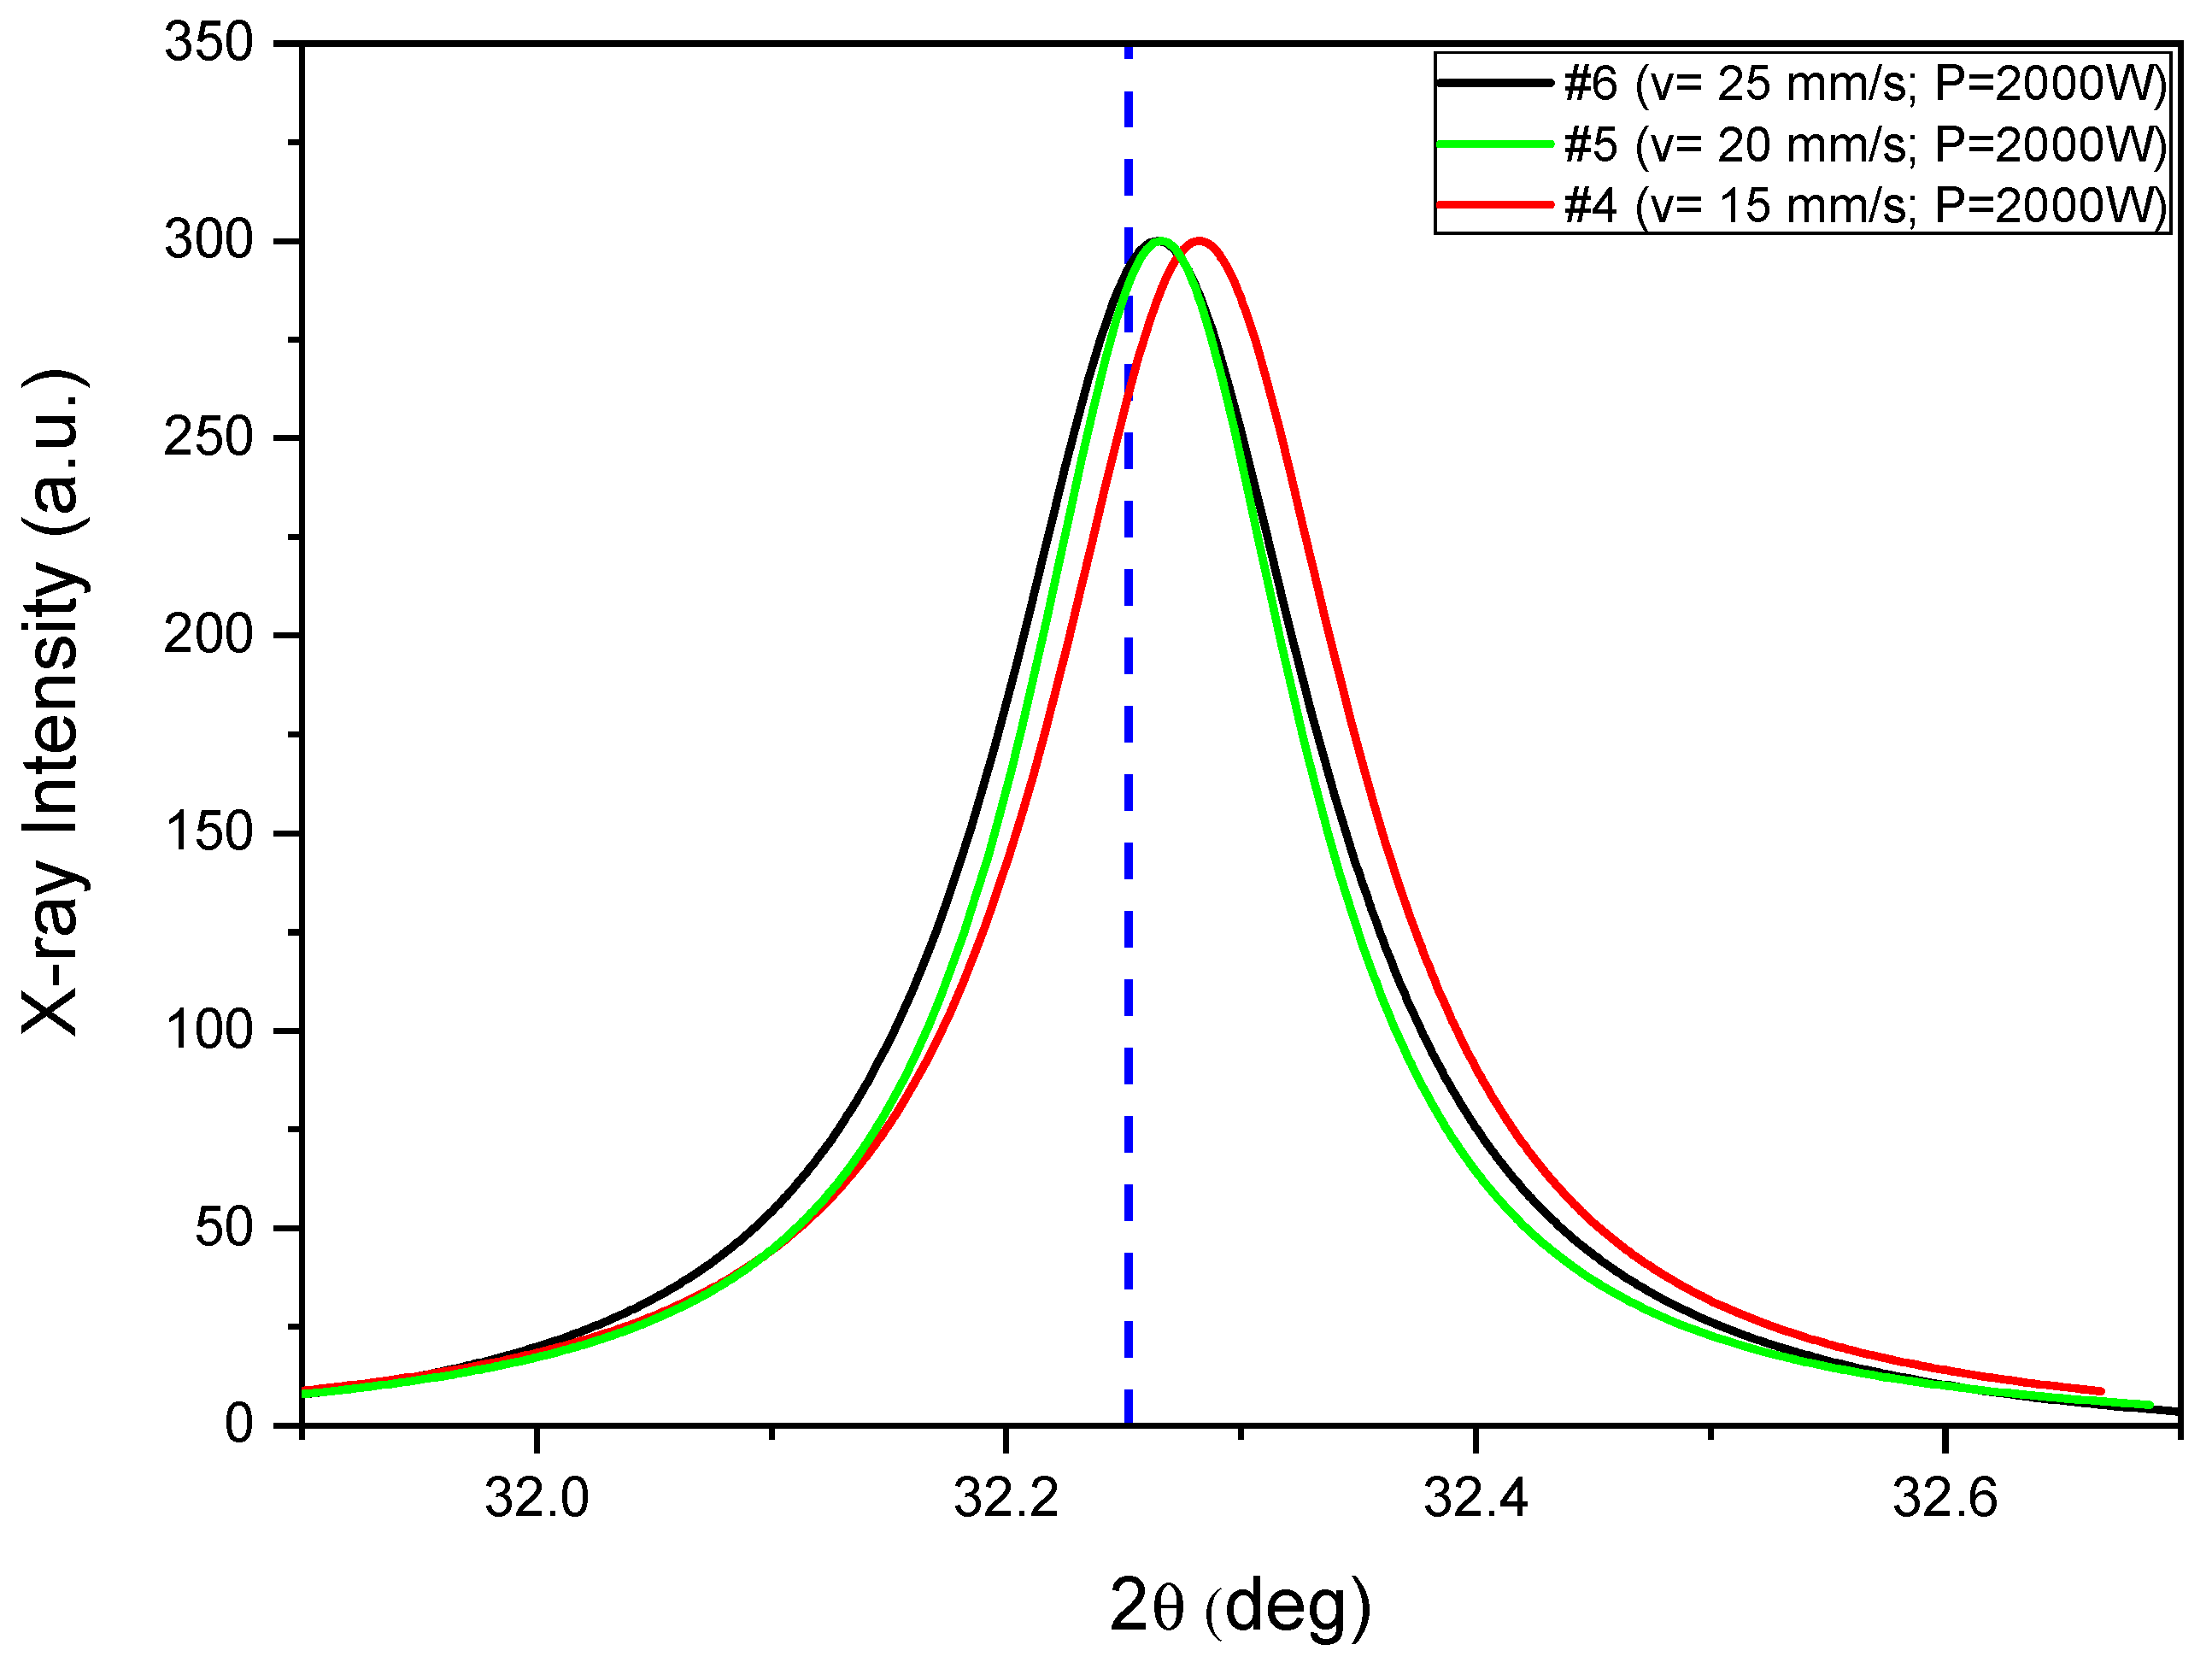
Moreover, in all the weld seams, the peak positions shift towards higher angles compared to the BM. Peak shifts indicate changes in lattice spacings due to residual stresses arising from the welding process. The strains ε depend on welding conditions. For example, Figure 15 shows the XRD precision peak profiles collected by focusing the beam in the MZ of seams #4, #5, and #6, welded with the same P but different v. The blue dashed line represents the {220} peak position in the BM (considered as stress-free material), and the peak intensities have been normalized to facilitate the comparison. The shift of the {220} peak towards the higher angle increases with heat input (HI#4 > HI#5 > HI#6), indicating greater elastic strain ε. The minimum value is observed in seam #6, produced by using the greater laser speed.
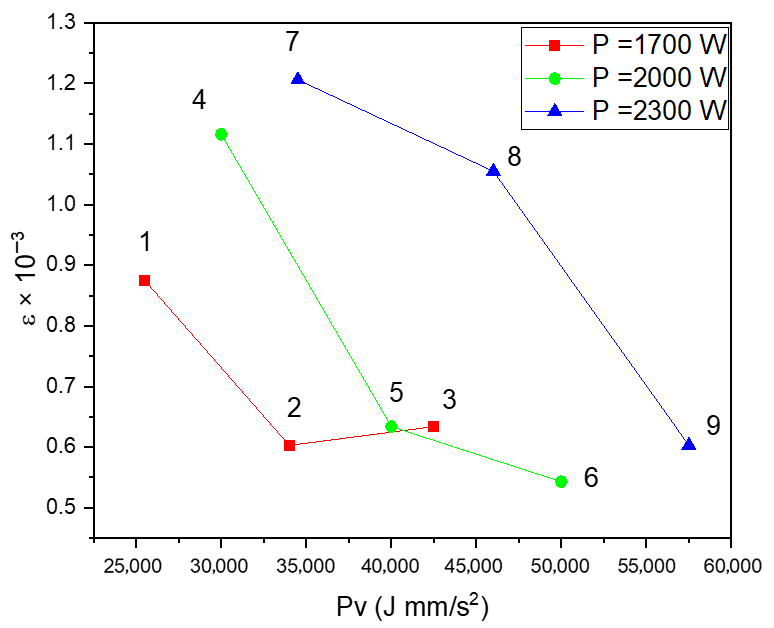
The values of elastic strain ε measured by XRD for the different welding conditions and the corresponding stresses are reported in Table 7 and Figure 16.
Figure 16 shows the residual strain ε as a function of the combined parameter P·v for the three power levels investigated (1700, 2000, 2300 W). For each set obtained with the same P, ε decreases with increasing P·v, meaning that a higher scan speed reduces the amount of strain accumulated during the welding process. Therefore, residual strain is primarily governed by HI, and, at fixed P, can be decreased by increasing v. This behavior is fully consistent with findings reported in the literature, which demonstrate that higher heat input, during the welding process, leads to increased elastic distortion [13].
Regarding the effect of modulation, these results indicated that modulation does not directly act on ε but indirectly enables operation at lower effective heat input: the process can be operated at higher welding speeds while maintaining stability, effectively expanding the low-HI operating window.

3.2.2. Micro-Hardness Testing

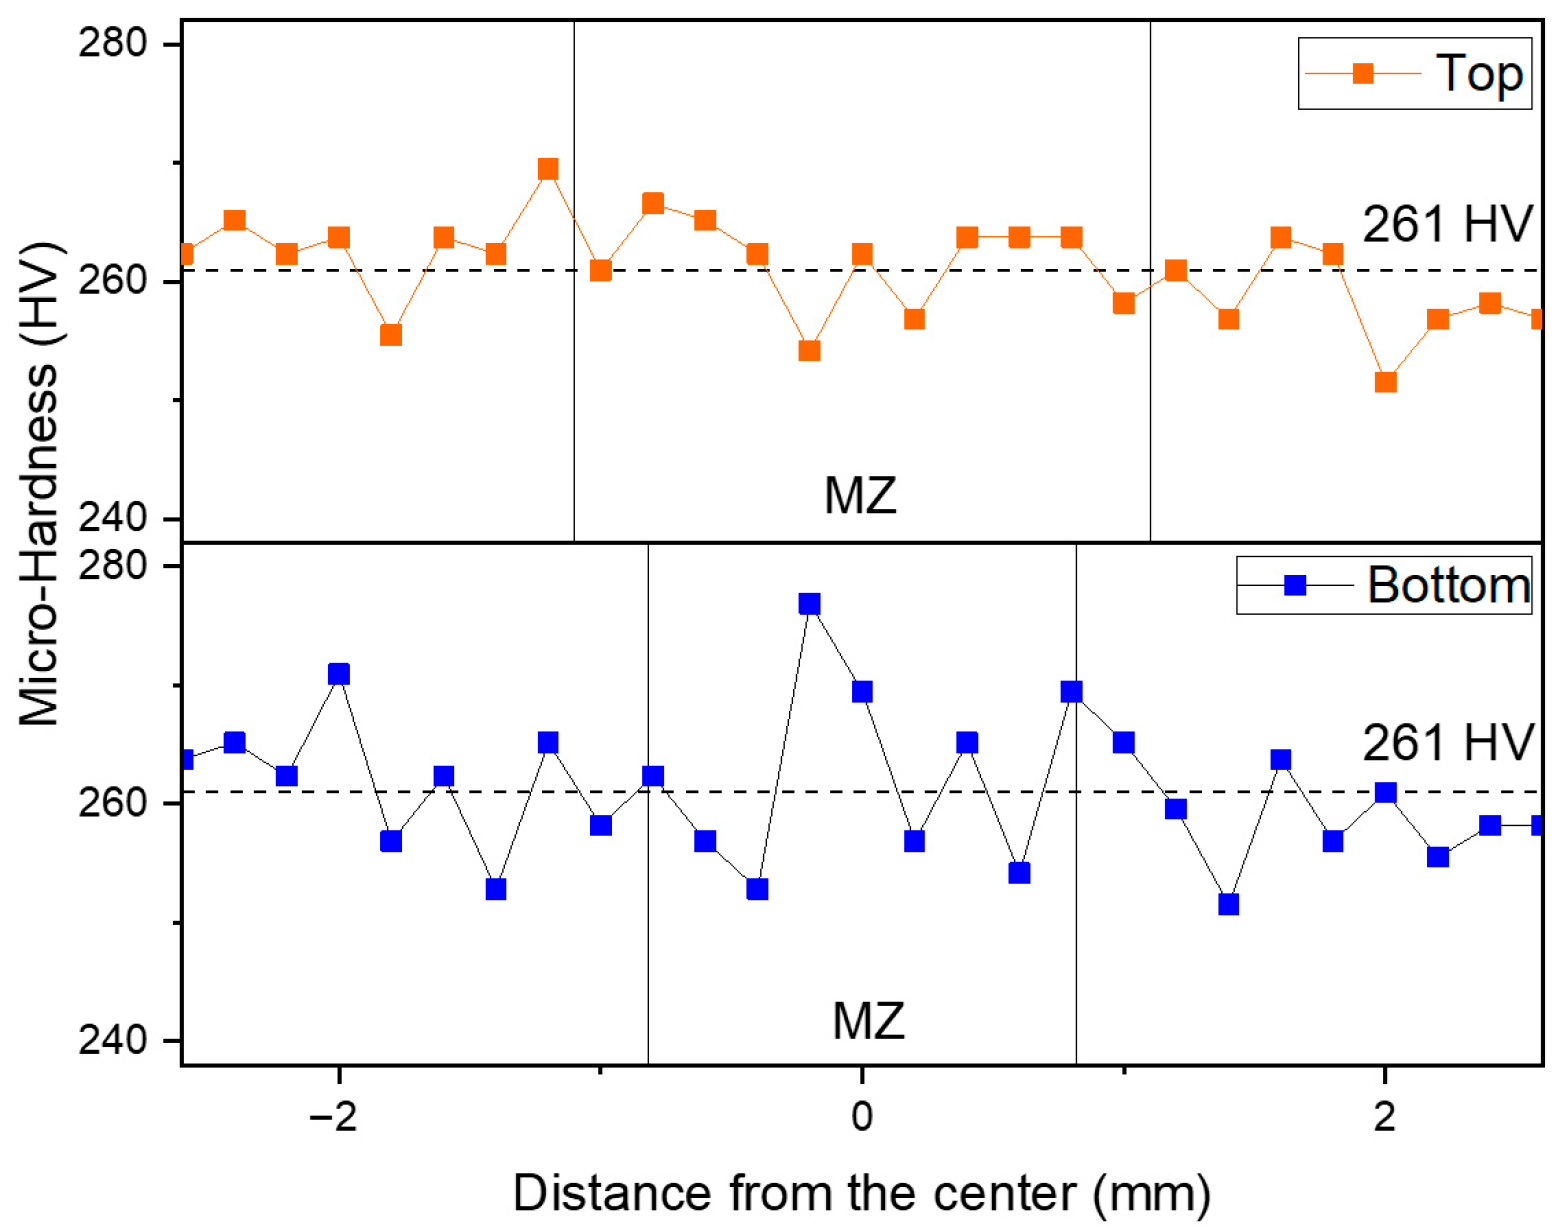
Vickers micro-hardness profiles have been performed in the cross-section of all welded seams near the top and bottom. The Vickers micro-hardness profiles include the BM, HAZ, and MZ. Figure 17 shows the profile of sample #6 (v = 25 mm/s; P = 2000 W).
The results obtained at the top and at the bottom of the seams are comparable.
No significant differences have been observed in varying welding parameters, as shown by the average micro-hardness values in the MZ for all the samples (Table 8).
The average value of micro-hardness in the MZ, both at the top and at the bottom of the seams, is always slightly higher compared to the values in the BM (261 ± 5 HV).
The comparable values in the BM and MZ can be explained by taking into account similar findings by Hong et al. [69]: the MZ is characterized by a higher amount of elements in solid solution, a finer distribution of precipitates, and smaller grains compared to the BM. These features have competitive effects on the mechanical properties and, in the conditions chosen for these experiments, they lead to values comparable with those of the BM.
Consequently, under the selected processing conditions, the as-welded joints exhibit homogeneous mechanical behavior, eliminating the need for post-welding heat treatment.

4. Discussion

All the welds produced in this study exhibit an hourglass morphology and, as confirmed by radiographic (Figure 5) and LM (Figure 6) images, they are free from cracks and other macro-defects. This indicates that the selected process parameters substantially guarantee the integrity and quality of the joints. The hardness profile is nearly constant across the seams. The microstructure of the melted zone (MZ) is refined compared to the base material (BM), but this refinement is partly compensated by a lower density of precipitates, resulting in no significant discontinuities in the mechanical properties. Only a few micrometric pores were observed in the MZ. Porosity is known to be affected by shielding gas, metal viscosity, and the difference between maximum and minimum power ΔP [52,53,67]. In the case of IN625, the use of He as shielding gas led to relatively low porosity compared with Ar [53]. Moreover, our analysis shows a decrease in porosity with P·v, related to higher agitation in the melt pool, which enhances fluid flow and facilitates the escape of gas bubbles to the surface. Power modulation, and therefore ΔP, has a beneficial indirect effect since it allows for an increase in laser speed.
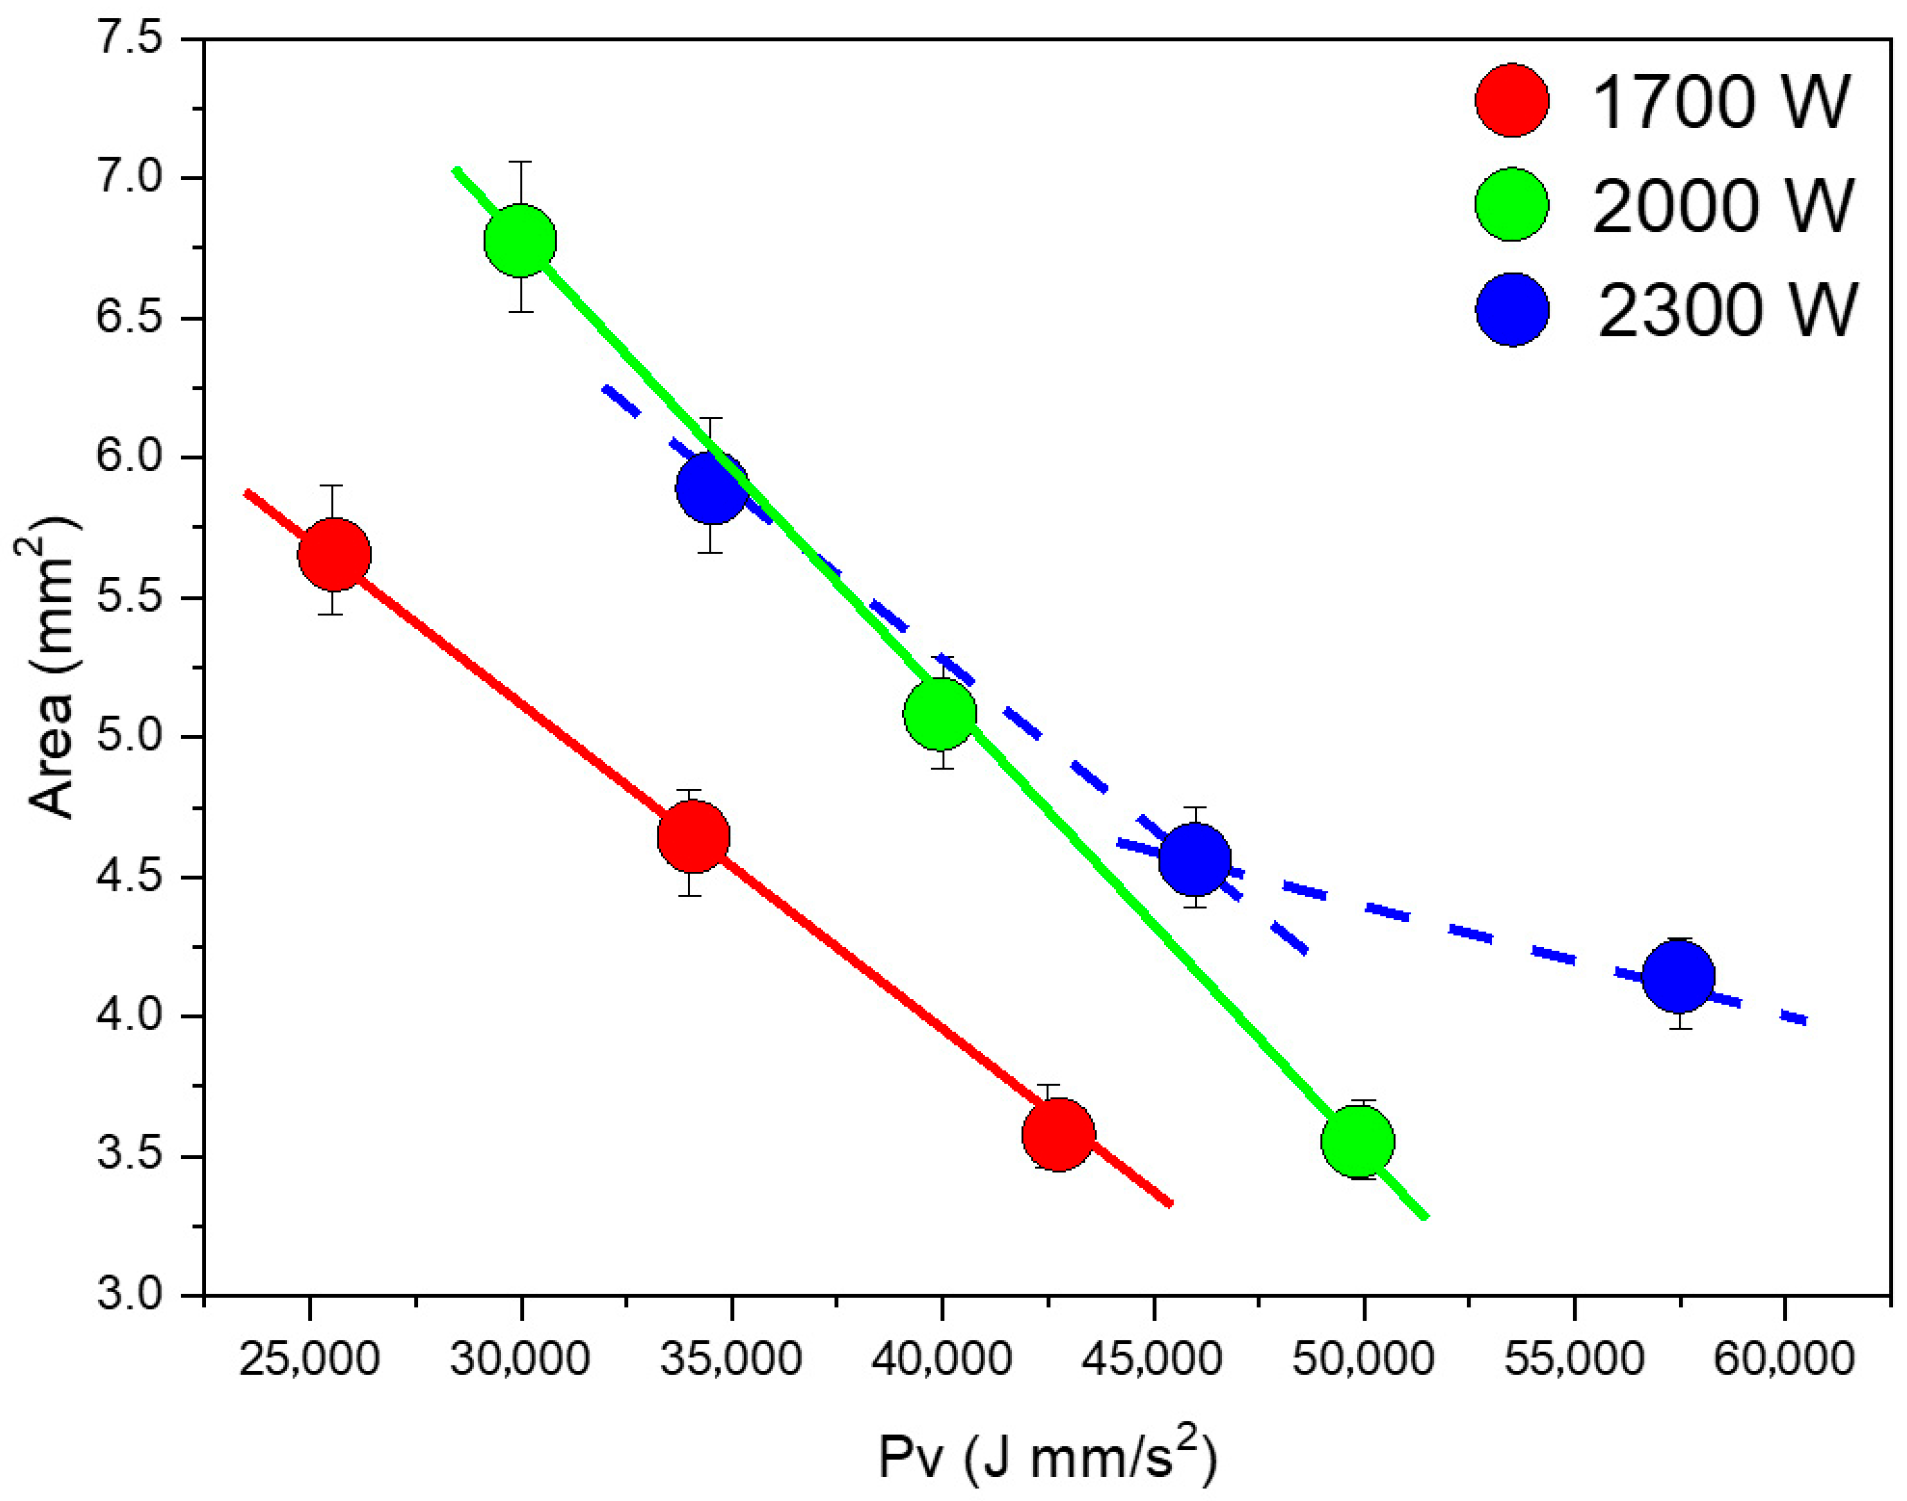
Therefore, to optimize the process parameters, attention has been focused on the reduction of the seam area (A), which is directly related to the quantity of molten metal involved in the welding process. The experimental results (Table 3 and Figure 18) show that the seam area decreases with increasing P·v for the three investigated power levels (1700, 2000, and 2300 W). At 1700 W and 2000 W, the data follow a nearly linear decrease, while at 2300 W, the experimental data deviate from the linear trend and tend to plateau.
These results can be interpreted by considering the melting efficiency:
η M = Q m e l t i n g Q a b s o r b e d
Q m e l t i n g = V T 0 T c p T d T + H f is the heat required to melt a given volume (V) of material, and Q a b s o r b e d is the total heat content absorbed by the workpiece. In low-power regimes, Q a b s o r b e d is a fraction of the heat input depending on the laser energy transfer efficiency η* [58], and can be expressed as:
Q a b s o r b e d = Q l a s e r = η * P t = η * P l v = η * H I   l
However, in high-power regimes (our experiments), additional physical phenomena influence Q a b s o r b e d . Part of the incident energy contributes to the formation of a plasma plume above the keyhole, reducing the amount of laser energy directly reaching the surface. Nevertheless, the plasma can re-emit part of this energy ( Q p l a s m a ), which may be reabsorbed by the material. In addition, a secondary melting region can be observed on the rear surface, attributed to laser reflection on the clamping system ( Q b a c k s i d e ).
Therefore, the absorbed heat can be expressed as:
  Q a b s o r b e d = Q l a s e r +   Q p l a s m a +   Q b a c k s i d e
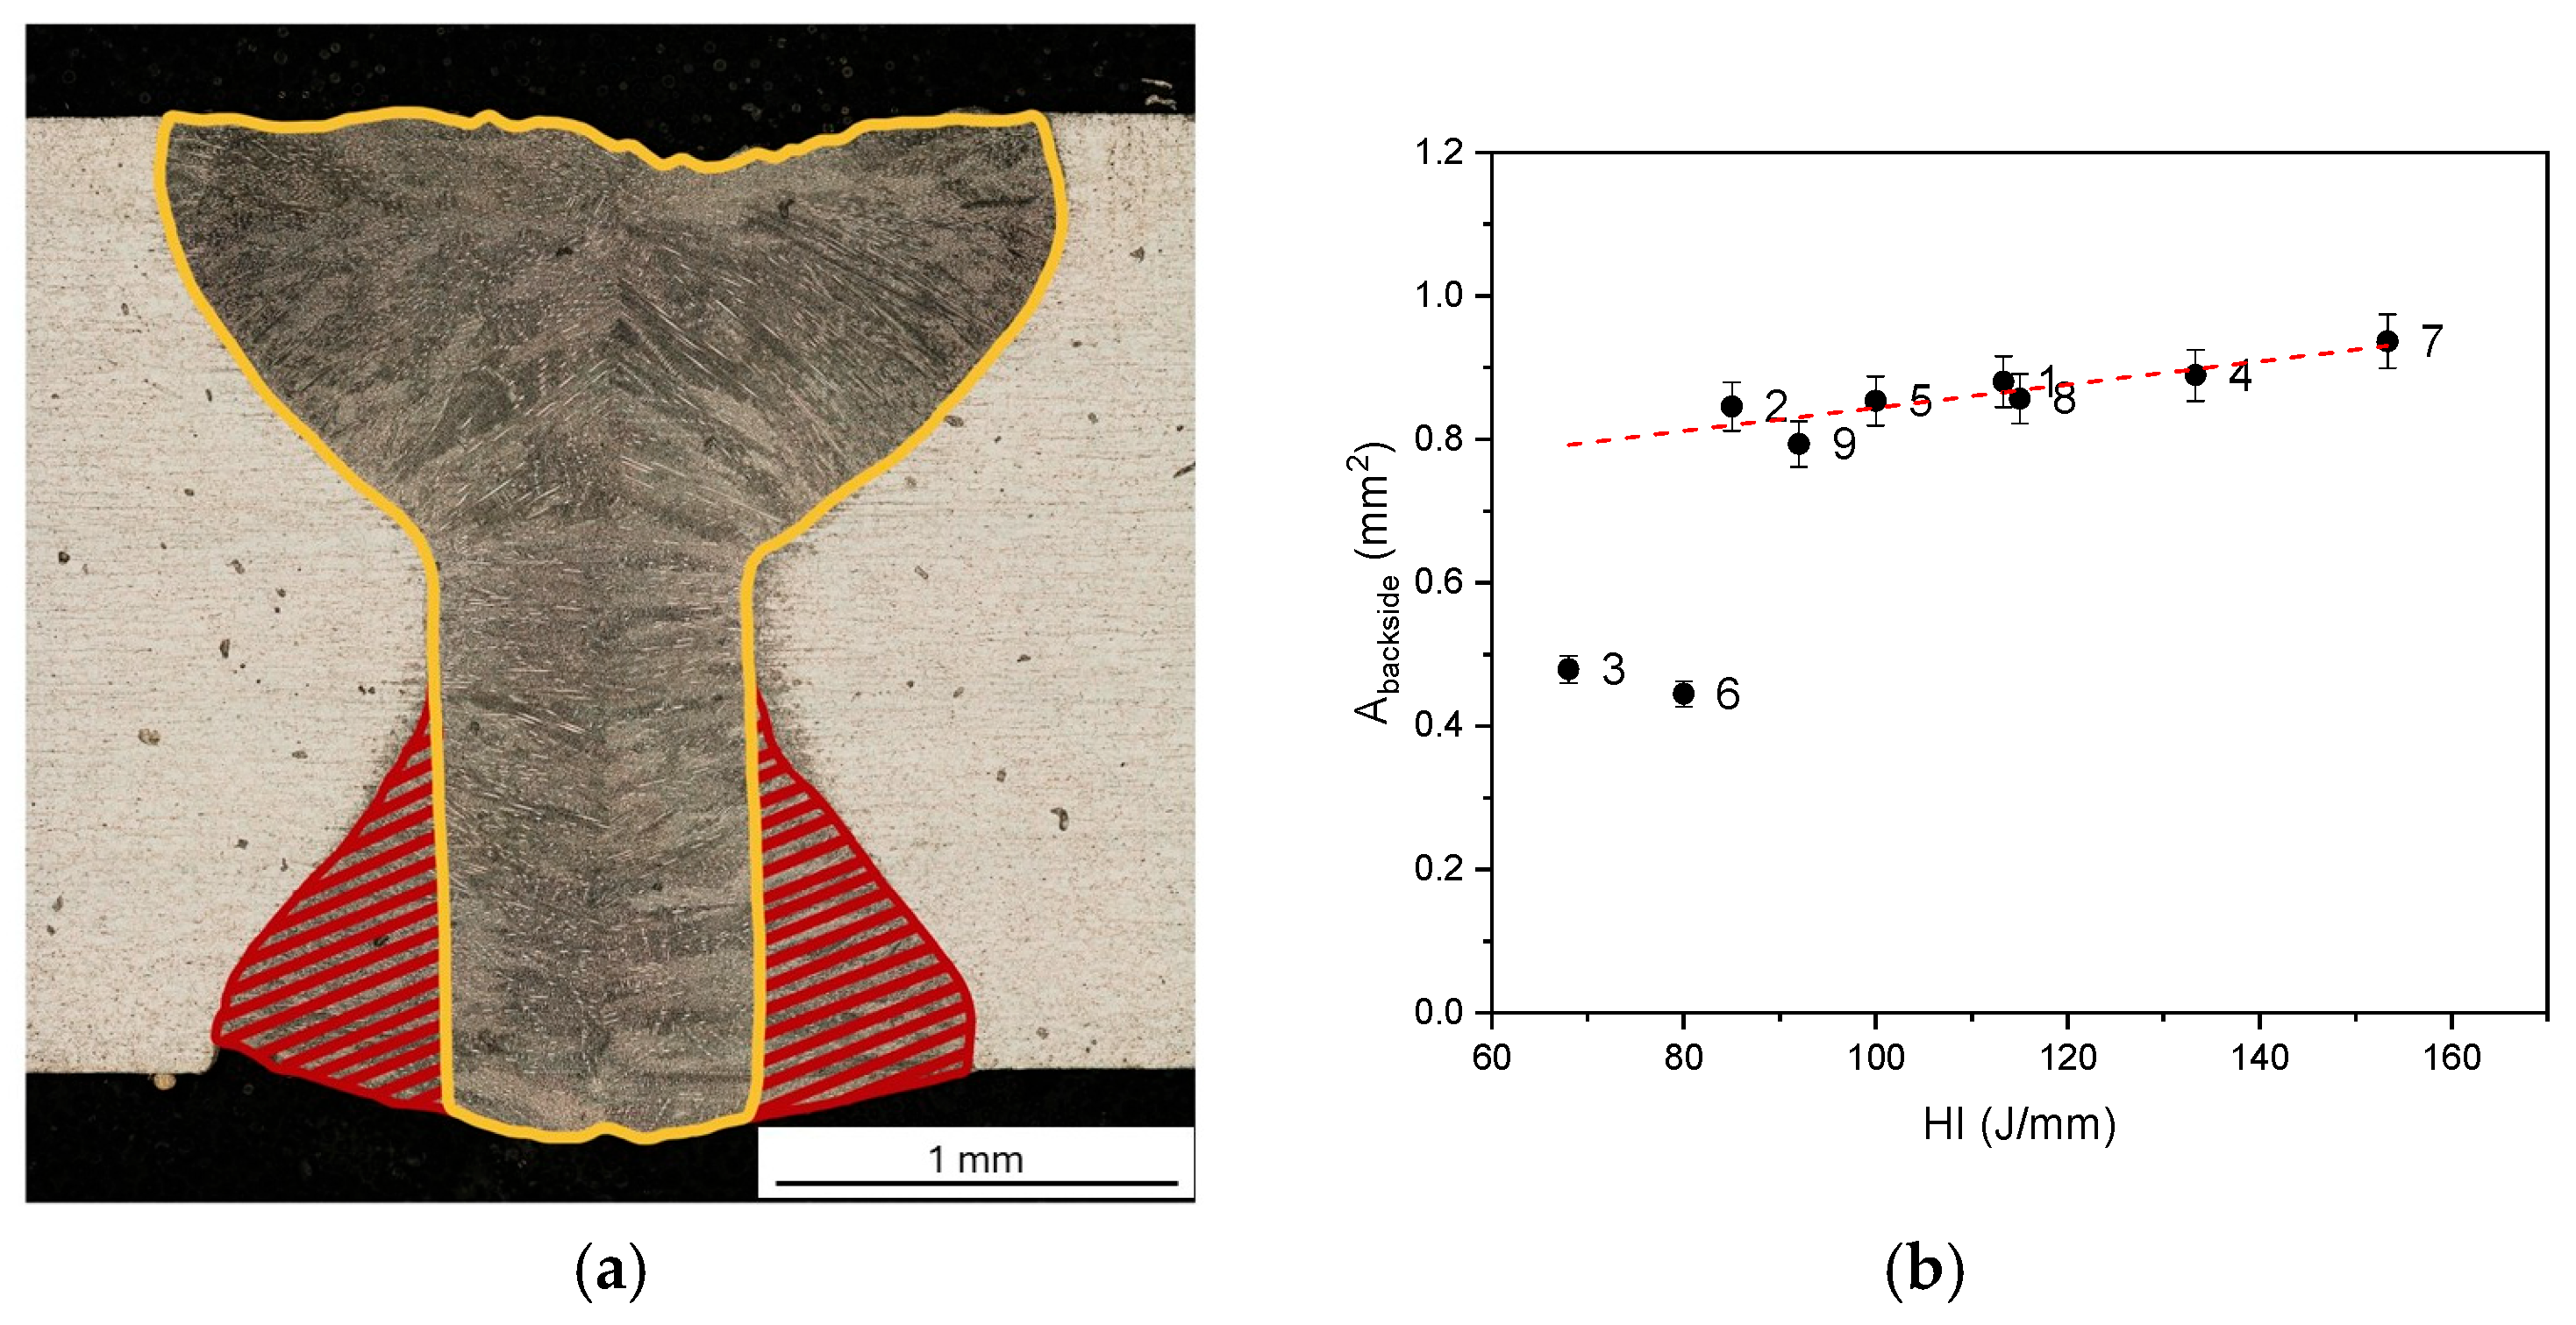
While Q p l a s m a is always present in high-power regimes, Q b a c k s i d e   is evaluated considering the shape variation in the seams with respect to the ideal sink shape. When Q b a c k s i d e is low or zero, the melted volume exhibits a sink-shaped morphology; when it becomes significant, it produces an additional melted volume at the bottom of the seam. This contribution is evident from the morphological analysis in Figure 6: samples #3 and #6, produced at high speed (25 mm/s) and low HI, exhibit a mixed hourglass/sink shape, whereas sample #9, obtained with the same speed but higher HI, shows a fully hourglass profile due to enhanced backside reflection.
The contribution of Q b a c k s i d e was evaluated as the difference between the experimental melted area (hourglass morphology) and the ideal sink-shaped morphology, as illustrated in Figure 19a. The resulting Abackside values (Figure 19b) remain nearly constant at low HI and increase sharply beyond 85 J/mm, confirming that this term is no longer negligible, and therefore, the backside reflection becomes an additional heat source in this regime.
Moreover, as widely reported in the literature [70,71,72], the plasma plume is not a fully transparent medium: it absorbs and scatters part of the laser radiation through inverse bremsstrahlung absorption. This interaction increases the electron temperature and density of the plasma, enhancing its emission but simultaneously reducing the fraction of laser intensity transmitted to the workpiece surface. The resulting plasma shielding effect reduces the coupling efficiency between the laser beam and the material, leading to a saturation of the absorbed energy. The intensity of this effect increases with increasing laser power [71], which explains the deviation from linearity and the plateau observed at 2300 W.
Overall, the observed trends suggest that at higher power levels (≥2300 W), the plasma shielding effect and backside reflection interact competitively. The first one limits the effective melting efficiency, while the latter partially compensates for this loss by increasing the molten volume at the bottom of the seam. As a result, the reduction in melted area with increasing P·v becomes less pronounced and reaches a plateau, indicating that further increases in power or speed do not lead to significant benefits in terms of process efficiency.

5. Conclusions

Laser welding of the IN625 superalloy has been studied to identify optimal process parameters for producing defect-free joints, specifically avoiding macroscopic imperfections such as cracks and porosity. The findings can be summarized as follows:
-
Complete full penetration of 2.5 mm thick IN625 superalloy plates was obtained. All the welded seams were crack-free, indicating that the process parameters adopted in the research were appropriate;
-
Some micrometric pores (davg < 0.6 μm) were observed, and their average size decreases when P·v increases. In high-power regimes, the porosity tends to disappear completely due to a stronger agitation in the melt pool and, therefore, a higher bubble mobility;
-
The amount of volume affected by the welding process is mainly affected by the welding speed. It decreases as v increases, and the lowest value (A = 3.56 mm2) was obtained for seam #6;
-
The base metal structure consists of equiaxed grains, with an average size of d = 15 ± 5 μm, and several twins. Precipitates of the (Nb, Mo, Ti)C type of larger size (7 ± 1 μm) are present alongside a finer dispersion of smaller ones (<1 μm) at the grain boundaries;
-
In the melt zone, microstructure is characterized by columnar dendrites that evolve from long dendrite arms toward a cellular dendritic structure as a result of the different temperature gradients and solidification rates within the melted material;
-
The BM exhibits a preferred grain orientation of grains with a strong [110] component: the I(220)/I(111) ratio is 0.60, while it is 0.21 for Ni with randomly oriented grains. After welding, the preferred orientation of grains is still present;
-
Residual stresses, caused by the welding process, are always below the yield stress. The elastic distortion increases with the HI and can be reduced by increasing the laser speed.
-
Power modulation has a positive indirect influence: it allows employment of higher laser speed compared to the ones required in continuous mode, with a consequent reduction in melted volume, porosity, and residual stresses;
-
The MZ hardness slightly increases compared to the BM for all the seams, and no influence of process parameters has been observed. Moreover, the difference between the BM and MZ is within the experimental error, and no post-process treatments are needed.
In conclusion, the best result was obtained with the following parameters: welding speed of 25 mm/s, average laser power of 2000 W, and Γ of 0.6. These conditions not only allow for obtaining a seam without macro-defects but also minimize (i) the porosity, (ii) the volume involved in the welding due to minimal laser reflection contribution, and (iii) the elastic distortion without the need for post-process heat treatments.

Author Contributions

Conceptualization, P.F. and A.V.; methodology, A.V.; validation, A.P.; formal analysis, A.P. and A.V.; investigation, A.P., A.V., A.F., F.B. and F.C.; data curation, A.P.; writing—original draft preparation, A.P. and A.V.; writing—review and editing, G.A., F.B., F.C., A.F., P.F., A.P., M.R. and A.V.; supervision, A.V.; funding acquisition, P.F., A.V. and G.A. All authors have read and agreed to the published version of the manuscript.

Funding

This research was supported by the Italian Ministry of University and Research, Grant Number PRIN 20225YNH4M “ELAPSE”.

Data Availability Statement

The original contributions presented in this study are included in the article. Further inquiries can be directed to the corresponding author.

Conflicts of Interest

The authors declare no conflict of interest.

References

  1. Su, R.; Hao, D.; He, P.; Wu, D.; Wang, Q.; Dong, H.; Ma, H. Effect of Co on creep and stress rupture properties of nickel-based superalloys—A review. J. Alloys Compd. 2023, 967, 171744. [Google Scholar] [CrossRef]
  2. Reed, R.C. The Superalloys, Fundamentals and Applications; Cambridge University Press: Cambridge, UK, 2006. [Google Scholar]
  3. Cottrell, A.H.; Bilby, B.A. Dislocation theory of yielding and strain ageing of iron. Proc. Phys. Soc. Sect. A 1949, 62, 49–62. [Google Scholar] [CrossRef]
  4. Goodfellow, A.J. Strengthening mechanisms in polycrystalline nickel-based superalloys. Mater. Sci. Technol. 2018, 34, 1793–1808. [Google Scholar] [CrossRef]
  5. AL-Nafeay, R.H.; AL-Roubaiy, A.O.; Omidvar, H. Overview of Joining and Repairing Techniques of Ni-Based Superalloy for Industrial Gas Turbine Applications. IOP Conf. Ser. Mater. Sci. Eng. 2021, 1094, 012141. [Google Scholar] [CrossRef]
  6. Zhang, C.; Wang, P.; Wen, Z.; Xu, Z.; He, P.; Yue, Z. Study on creep properties of nickel-based superalloy blades based on microstructure characteristics. J. Alloys Compd. 2022, 890, 161710. [Google Scholar] [CrossRef]
  7. Wu, Y.; Li, C.; Xia, X.; Liang, H.; Qi, Q.; Liu, Y. Precipitate coarsening and its effects on the hot deformation behavior of the recently developed γ′-strengthened superalloys. J. Mater. Sci. Technol. 2021, 67, 95–104. [Google Scholar] [CrossRef]
  8. Thellaputta, G.R.; Chandra, P.S.; Rao, C.S.P. Machinability of Nickel Based Superalloys: A Review. Mater. Today Proc. 2017, 4, 3712–3721. [Google Scholar] [CrossRef]
  9. Selvaraj, S.K.; Sundaramali, G.; Dev, S.J.; Swathish, R.S.; Karthikeyan, R.; Vishaal, K.E.V.; Paramasivam, V. Recent Advancements in the Field of Ni-Based Superalloys. Adv. Mater. Sci. Eng. 2021, 2021, 9723450. [Google Scholar] [CrossRef]
  10. Donnini, R.; Varone, A.; Palombi, A.; Spiller, S.; Ferro, P.; Angella, G. High Energy Density Welding of Ni-Based Superalloys: An Overview. Metals 2025, 15, 30. [Google Scholar] [CrossRef]
  11. Dong, S.; Zhou, M.; Gao, K.; Shen, X. Polycrystal modeling and micromechanical simulation of nickel-based superalloy electron beam welded joint. Mater. Sci. Eng. A 2023, 883, 145507. [Google Scholar] [CrossRef]
  12. Barbieri, G.; Cognini, F.; Fava, A.; Kaciulis, S.; Mezzi, A.; Moncada, M.; Montanari, R.; Palombi, A.; Richetta, M.; Varone, A. Segregation and Crack Formation in Laser Welded IN792 Equiaxed Superalloy. Surf. Interface Anal. 2025, 57, 485–491. [Google Scholar] [CrossRef]
  13. Wang, H.-S.; Huang, C.-Y.; Ho, K.-S.; Deng, S.-J. Microstructure evolution of laser repair welded René 77 nickel-based superalloy cast. Mater. Trans. 2011, 52, 2197–2204. [Google Scholar] [CrossRef]
  14. Kim, K.M.; Lee, U.; Lee, H.; Seo, S.M.; Chun, F.J. Quantifying Susceptibility to Solidification Cracking in Oscillated CM247LC Superalloy Welds via Varestraint Testing. Met. Mater. Int. 2023, 29, 777–794. [Google Scholar] [CrossRef]
  15. Henderson, M.B.; Arrell, D.; Larsson, R.; Heobel, M.; Marchant, G. Nickel based superalloy welding practices for industrial gas turbine applications. Sci. Technol. Weld. Join. 2004, 9, 13–21. [Google Scholar] [CrossRef]
  16. Patterson, T.; Hochanadel, J.; Sutton, S.; Panton, B.; Lippold, J. A review of high energy density beam processes for welding and additive manufacturing applications. Weld. World 2021, 65, 1235–1306. [Google Scholar] [CrossRef]
  17. Saurabh, S.K.; Chand, P.; Yadav, U.S. Study of the effect of laser beam welding on joint of Nimonic 80A superalloy: An experimental approach. Int. J. Adv. Manuf. Technol. 2024, 133, 5501–5513. [Google Scholar] [CrossRef]
  18. Siddharth, P.N.; Narayanan, C.S. A review on Electron Beam Welding process. J. Phys. Conf. Ser. 2020, 1706, 012208. [Google Scholar] [CrossRef]
  19. Thejasree, P.; Manikandan, N.; Binoj, J.S.; Varaprasad, K.C.; Palanisamy, D.; Raju, R. Numerical simulation and experimental investigation on laser beam welding of Inconel 625. Mater. Today Proc. 2020, 39, 268–273. [Google Scholar] [CrossRef]
  20. Choudhury, B.; Singh, V.; Selvarajan, L.; Goel, S.; Chandrasekaran, M. Synergic investigation of microstructure, precipitation, and micro-segregation on Inconel 825 weldments: A comparative study between GTAW and EBW. Mater. Chem. Phys. 2024, 318, 129249. [Google Scholar] [CrossRef]
  21. Zhang, H.; Li, J.K.; Guan, Z.W.; Liu, Y.J.; Qi, D.K.; Wang, Q.Y. Electron beam welding of Nimonic 80A: Integrity and microstructure evaluation. Vacuum 2018, 151, 266–274. [Google Scholar] [CrossRef]
  22. Vemanaboina, H.; Gundabattini, E.; Akella, S.; Rao, A.C.U.M.; Buddu, R.K.; Ferro, P.; Berto, F. Mechanical and metallurgical properties of co2 laser beam inconel 625 welded joints. Appl. Sci. 2021, 11, 7002. [Google Scholar] [CrossRef]
  23. Saurabh, S.K.; Chand, P.; Yadav, U.S. Multi-objective optimization and fracture analysis of laser weld joints of Ni-Cr superalloy 80 A for gas turbine components. J. Mech. Sci. Technol. 2024, 38, 4867–4876. [Google Scholar] [CrossRef]
  24. Aqeel, M.; Gautam, J.P.; Shariff, S.M. Comparative study on autogenous diode laser, CO2 laser-MIG hybrid and multi-pass TIG welding of 10-mm thick Inconel 617 superalloy. Mater. Sci. Eng. A 2022, 856, 143967. [Google Scholar] [CrossRef]
  25. Tlili, I.; Baleanu, D.; Mohammad Sajadi, S.; Ghaemi, F.; Fagiry, M.A. Numerical and experimental analysis of temperature distribution and melt flow in fiber laser welding of Inconel 625. Int. J. Adv. Manuf. Technol. 2022, 121, 765–784. [Google Scholar] [CrossRef]
  26. Norouzian, M.; Amne Elahi, M.; Plapper, P. A review: Suppression of the solidification cracks in the laser welding process by controlling the grain structure and chemical compositions. J. Adv. Join. Process. 2023, 7, 100139. [Google Scholar] [CrossRef]
  27. Yan, S.; Meng, Z.; Chen, B.; Tan, C.; Song, X.; Wang, G. Experimental study on the grain evolution induced by thermal characteristics during oscillation laser welding of IN718. Mater. Lett. 2022, 323, 132581. [Google Scholar] [CrossRef]
  28. Sun, W.; Wang, S.; Tan, G.; Xin, J.; Hong, M.; Wu, M.; Chen, Y. Microstructure and mechanical properties of Inconel713C Ni3Al-based superalloy joint welded by electron beam feeding wire welding technology. J. Manuf. Process 2023, 89, 50–63. [Google Scholar] [CrossRef]
  29. Choudhury, B.; Chandrasekaran, M. Microstructural Investigation and Integrated Optimization of Weld Bead Characteristics in Electron Beam Welding of Inconel 825. Trans. Indian Inst. Met. 2021, 74, 2681–2701. [Google Scholar] [CrossRef]
  30. Li, J.; Yao, J.; Zhao, G.; Li, H.; Li, Y.; Liu, J. The Influence of Different Focusing Currents on the Microstructure Evolution and Wear Properties of a Scanning Electron Beam Modified Inconel 625 Nickel Base Alloy Surface. Crystals 2023, 13, 325. [Google Scholar] [CrossRef]
  31. Montanari, R.; Varone, A.; Barbieri, G.; Soltani, P.; Mezzi, A.; Kaciulis, S. Welding of IN792 DS superalloy by electron beam. Surf. Interface Anal. 2016, 48, 483–487. [Google Scholar] [CrossRef]
  32. Angella, G.; Barbieri, G.; Donnini, R.; Montanari, R.; Richetta, M.; Varone, A. Electron Beam Welding of IN792 DS: Effects of Pass Speed and PWHT on Microstructure and Hardness. Materials 2017, 10, 1033. [Google Scholar] [CrossRef] [PubMed]
  33. Spiller, S.; Varone, A.; Angella, G.; Cognini, F.; Fabrizi, A.; Bonollo, F.; Ferro, P. Hot Cracking in Laser Welding of Equiaxed and Directionally Solidified Nickel-Based Alloy IN792: Experimental and Numerical Study. Mater. Des. 2025, 257, 114413. [Google Scholar] [CrossRef]
  34. Barbieri, G.; Cognini, F.; de Crescenzo, C.; Fava, A.; Moncada, M.; Montanari, R.; Richetta, M.; Varone, A. Process Optimization in Laser Welding of IN792 DS Superalloy. Metals 2024, 14, 124. [Google Scholar] [CrossRef]
  35. Shankar, V.; Bhanu Sankara Rao, K.; Mannan, S.L. Microstructure and mechanical properties of Inconel 625 superalloy. J. Nucl. Mater. 2001, 288, 222–232. [Google Scholar] [CrossRef]
  36. Shoemaker, L.E. Alloys 625 and 725: Trends properties and applications. In Proceedings of the Superalloys 718, 625, 706 and Various Derivatives, Pittsburgh, PA, USA, 2–5 October 2005; pp. 409–418. [Google Scholar]
  37. Gessinger, G.H.; Bomford, M. Powder metallurgy of superalloys. Int. Metall. Rev. 1974, 19, 51–76. [Google Scholar] [CrossRef]
  38. Special Metals Corporation Products. INCONEL® Alloy 625 (Technical Bulletins). Available online: https://www.specialmetals.com/products/ (accessed on 10 December 2024).
  39. Quist, W.E.; Taggart, R.; Polonis, D.H. The influence of iron and aluminum on the precipitation of metastable Ni3Nb phases in the Ni-Nb system. Metall. Trans. 1971, 2, 825–832. [Google Scholar] [CrossRef]
  40. Sundararaman, M.; Mukhopadhyay, P.; Banerjee, S. Precipitation of the δ-Ni3Nb phase in two nickel base superalloys. Metall. Trans. A 1988, 19, 453–465. [Google Scholar] [CrossRef]
  41. Kohl, H.; Peng, K. Thermal stability of the superalloys Inconel 625 and Nimonic 86. J. Nucl. Mater. 1981, 101, 243–250. [Google Scholar] [CrossRef]
  42. Muzyka, D.R. The Superalloys; John Wiley & Sons: New York, NY, USA, 1972. [Google Scholar]
  43. Jelokhani-Niaraki, M.R.; Arab, N.B.M.; Naffakh-Moosavy, H.; Ghoreishi, M. The systematic parameter optimization in the Nd:YAG laser beam welding of Inconel 625. Int. J. Adv. Manuf. Technol. 2016, 84, 2537–2546. [Google Scholar] [CrossRef]
  44. Caiazzo, F.; Alfieri, V.; Cardaropoli, F.; Sergi, V. Investigation on edge joints of Inconel 625 sheets processed with laser welding. Opt. Laser Technol. 2017, 93, 180–186. [Google Scholar] [CrossRef]
  45. Tom Saju, M. Velu, Review on welding and fracture of nickel based superalloys. Mater. Today Proc. 2021, 46, 7161–7169. [Google Scholar] [CrossRef]
  46. Kumar, P.; Farah, J.; Akram, J.; Teng, C.; Ginn, J.; Misra, M. Influence of laser processing parameters on porosity in Inconel 718 during additive manufacturing. Int. J. Adv. Manuf. Technol. 2019, 103, 1497–1507. [Google Scholar] [CrossRef]
  47. Odabaşı, A.; Ünlü, N.; Göller, G.; Eruslu, M.N. A Study on Laser Beam Welding (LBW) Technique: Effect of Heat Input on the Microstructural Evolution of Superalloy Inconel 718. Metall. Mater. Trans. A 2010, 41, 2357–2365. [Google Scholar] [CrossRef]
  48. Caprio, L.; Demir, A.G.; Previtali, B. Comparative study between CW and PW emissions in selective laser melting. J. Laser Appl. 2018, 30, 032305. [Google Scholar] [CrossRef]
  49. Ariaseta, A.; Pick, D.; Andersson, J.; Ojo, O. Study of Pulsed Laser Beam Welding of Nickel-Based Superalloy G27. In Ebook Volume 52: Sustainable Production Through Advanced Manufacturing, Intelligent Automation and Work Integrated Learning; Advances in Transdisciplinary Engineering; IOS Press: Amsterdam, The Netherlands, 2024; pp. 39–49. [Google Scholar] [CrossRef]
  50. Zhang, Z.; Zhao, Y.; Chen, Y.; Su, Z.; Shan, J.; Wu, A.; Sato, Y.S.; Gu, H.; Tang, X. The role of the pulsed-wave laser characteristics on restraining hot cracking in laser cladding non-weldable nickel-based superalloy. Mater. Des. 2021, 198, 109346. [Google Scholar] [CrossRef]
  51. Jiang, Z.; Tao, W.; Yu, K.; Tan, C.; Chen, Y.; Li, L.; Li, Z. Comparative study on fiber laser welding of GH3535 superalloy in continuous and pulsed waves. Mater. Des. 2016, 110, 728–739. [Google Scholar] [CrossRef]
  52. Kuo, T.-Y. Effects of pulsed and continuous Nd–YAG laser beam waves on welding of Inconel alloy. Sci. Technol. Weld. Join. 2005, 10, 557–565. [Google Scholar] [CrossRef]
  53. Kuo, T.-Y.; Lin, Y.-D. Effects of Different Shielding Gases and Power Waveforms on Penetration Characteristics and Porosity Formation in Laser Welding of Inconel 690 Alloy. Mater. Trans. 2007, 48, 219–226. [Google Scholar] [CrossRef]
  54. Hensel, J.; Köhler, M.; Uhlenberg, L.; e Castro, J.D.; Dilger, K.; Faß, M.; Baumgartner, J. Laser welding of 16MnCr5 butt welds with gap: Resulting weld quality and fatigue strength assessment. Weld. World 2022, 66, 1867–1881. [Google Scholar] [CrossRef]
  55. Steen, W.M.; Mazumder, J. Laser Material Processing; Springer Science & Business Media: Berlin/Heidelberg, Germany, 2010. [Google Scholar]
  56. Montgomery, D.C. Design and Analysis of Experiments, 9th ed.; John Wiley & Sons: Hoboken, NJ, USA, 2022. [Google Scholar]
  57. Huang, T.-Y.; Cheng, C.-W.; Lee, A.-C.; Chang, T.-W.; Tsai, M.-C. Influence of Wobble-Based Scanning Strategy on Surface Morphology of Laser Powder Bed-Fabricated Permalloy. Materials 2023, 16, 2062. [Google Scholar] [CrossRef]
  58. Unocic, R.R.; DuPont, J.N. Process Efficiency Measurements in the Laser Engineered Net Shaping Process. Metall. Mater. Trans. B 2004, 35, 143–152. [Google Scholar] [CrossRef]
  59. JCPDS-International Centre for Diffraction Data, Newtown Square, PA 19073, USA. Available online: https://www.icdd.com/ (accessed on 10 November 2025).
  60. Available online: https://www.espimetals.com/index.php/technical-data/89-inconel-625#:~:text=Density:%208.44%20g/cm3,Resistivity:%201290%20n%CE%A9%20%E2%8B%85%20m (accessed on 10 November 2025).
  61. Montanari, R.; Varone, A. Flat-top cylinder indenter for mechanical characterization: A report of industrial applications. Materials 2021, 14, 1742. [Google Scholar] [CrossRef]
  62. Ahn, J.; Chen, L.; He, E.; Dear, J.P.; Davies, C.M. Optimisation of process parameters and weld shape of high power Yb-fibre laser welded 2024-T3 aluminium alloy. J. Manuf. Process. 2018, 34, 70–85. [Google Scholar] [CrossRef]
  63. Palanivel, R.; Dinaharan, I.; Laubscher, R.F.; Alarifi, I.M. Effect of Nd:YAG laser welding on microstructure and mechanical properties of Incoloy alloy 800. Opt. Laser Technol. 2021, 140, 107039. [Google Scholar] [CrossRef]
  64. Sharma, S.K.; Biswas, K.; Nath, A.K.; Manna, I.; Dutta Majumdar, J. Microstructural change during laser welding of Inconel 718. Optik 2020, 218, 165029. [Google Scholar] [CrossRef]
  65. Saha, D.; Pal, S. Study of mechanical behaviour and microsegregation in interdendritic region of a single-pass plasma arc welding of thick IN625 plate. Arch. Civ. Mech. Eng. 2025, 25, 105. [Google Scholar] [CrossRef]
  66. Wang, L.; Huang, Y.; Yang, D.; Li, H.; Peng, Y.; Wang, K. Multi-scale simulation of grain growth during laser beam welding of nickel-based superalloy. J. Mater. Res. Technol. 2020, 9, 15034–15044. [Google Scholar] [CrossRef]
  67. Yue, N.; Pei, L.; Xu, P.; Jiang, Z.; Lin, T.; Zhou, L.; Liang, Y. Porosity suppression of nickel-based superalloy by modulated base temperature in laser welding and mechanism analysis. J. Mater. Res. Technol. 2024, 30, 4725–4738. [Google Scholar] [CrossRef]
  68. Ramkumar, K.D.; Mulimani, S.S.; Ankit, K.; Kothari, A.; Ganguly, S. Effect of grain boundary precipitation on the mechanical integrity of EBW joints of Inconel 625. Mater. Sci. Eng. A. 2021, 808, 140926. [Google Scholar] [CrossRef]
  69. Hong, M.; Wang, S.; Sun, W.; Geng, Z.; Xin, J.; Ke, L. Effect of welding speed on microstructure and mechanical properties of selective laser melting Inconel 625 alloy laser welded joint. J. Mater. Res. Technol. 2022, 19, 2093–2103. [Google Scholar] [CrossRef]
  70. Tenner, F.; Brock, C.; Klämpfl, F.; Schmidt, M. Analysis of the correlation between plasma plume and keyhole behavior in laser metal welding for the modeling of the keyhole geometry. Opt. Lasers Eng. 2015, 64, 32–41. [Google Scholar] [CrossRef]
  71. Gao, M.; Chen, C.; Hu, M.; Guo, L.; Wang, Z.; Zeng, X. Characteristics of plasma plume in fiber laser welding of aluminum alloy. Appl. Surf. Sci. 2015, 326, 181–186. [Google Scholar] [CrossRef]
  72. Xu, J.; Luo, Y.; Zhu, L.; Han, J.; Zhang, C.; Chen, D. Effect of shielding gas on the plasma plume in pulsed laser welding. Measurement 2019, 134, 25–32. [Google Scholar] [CrossRef]
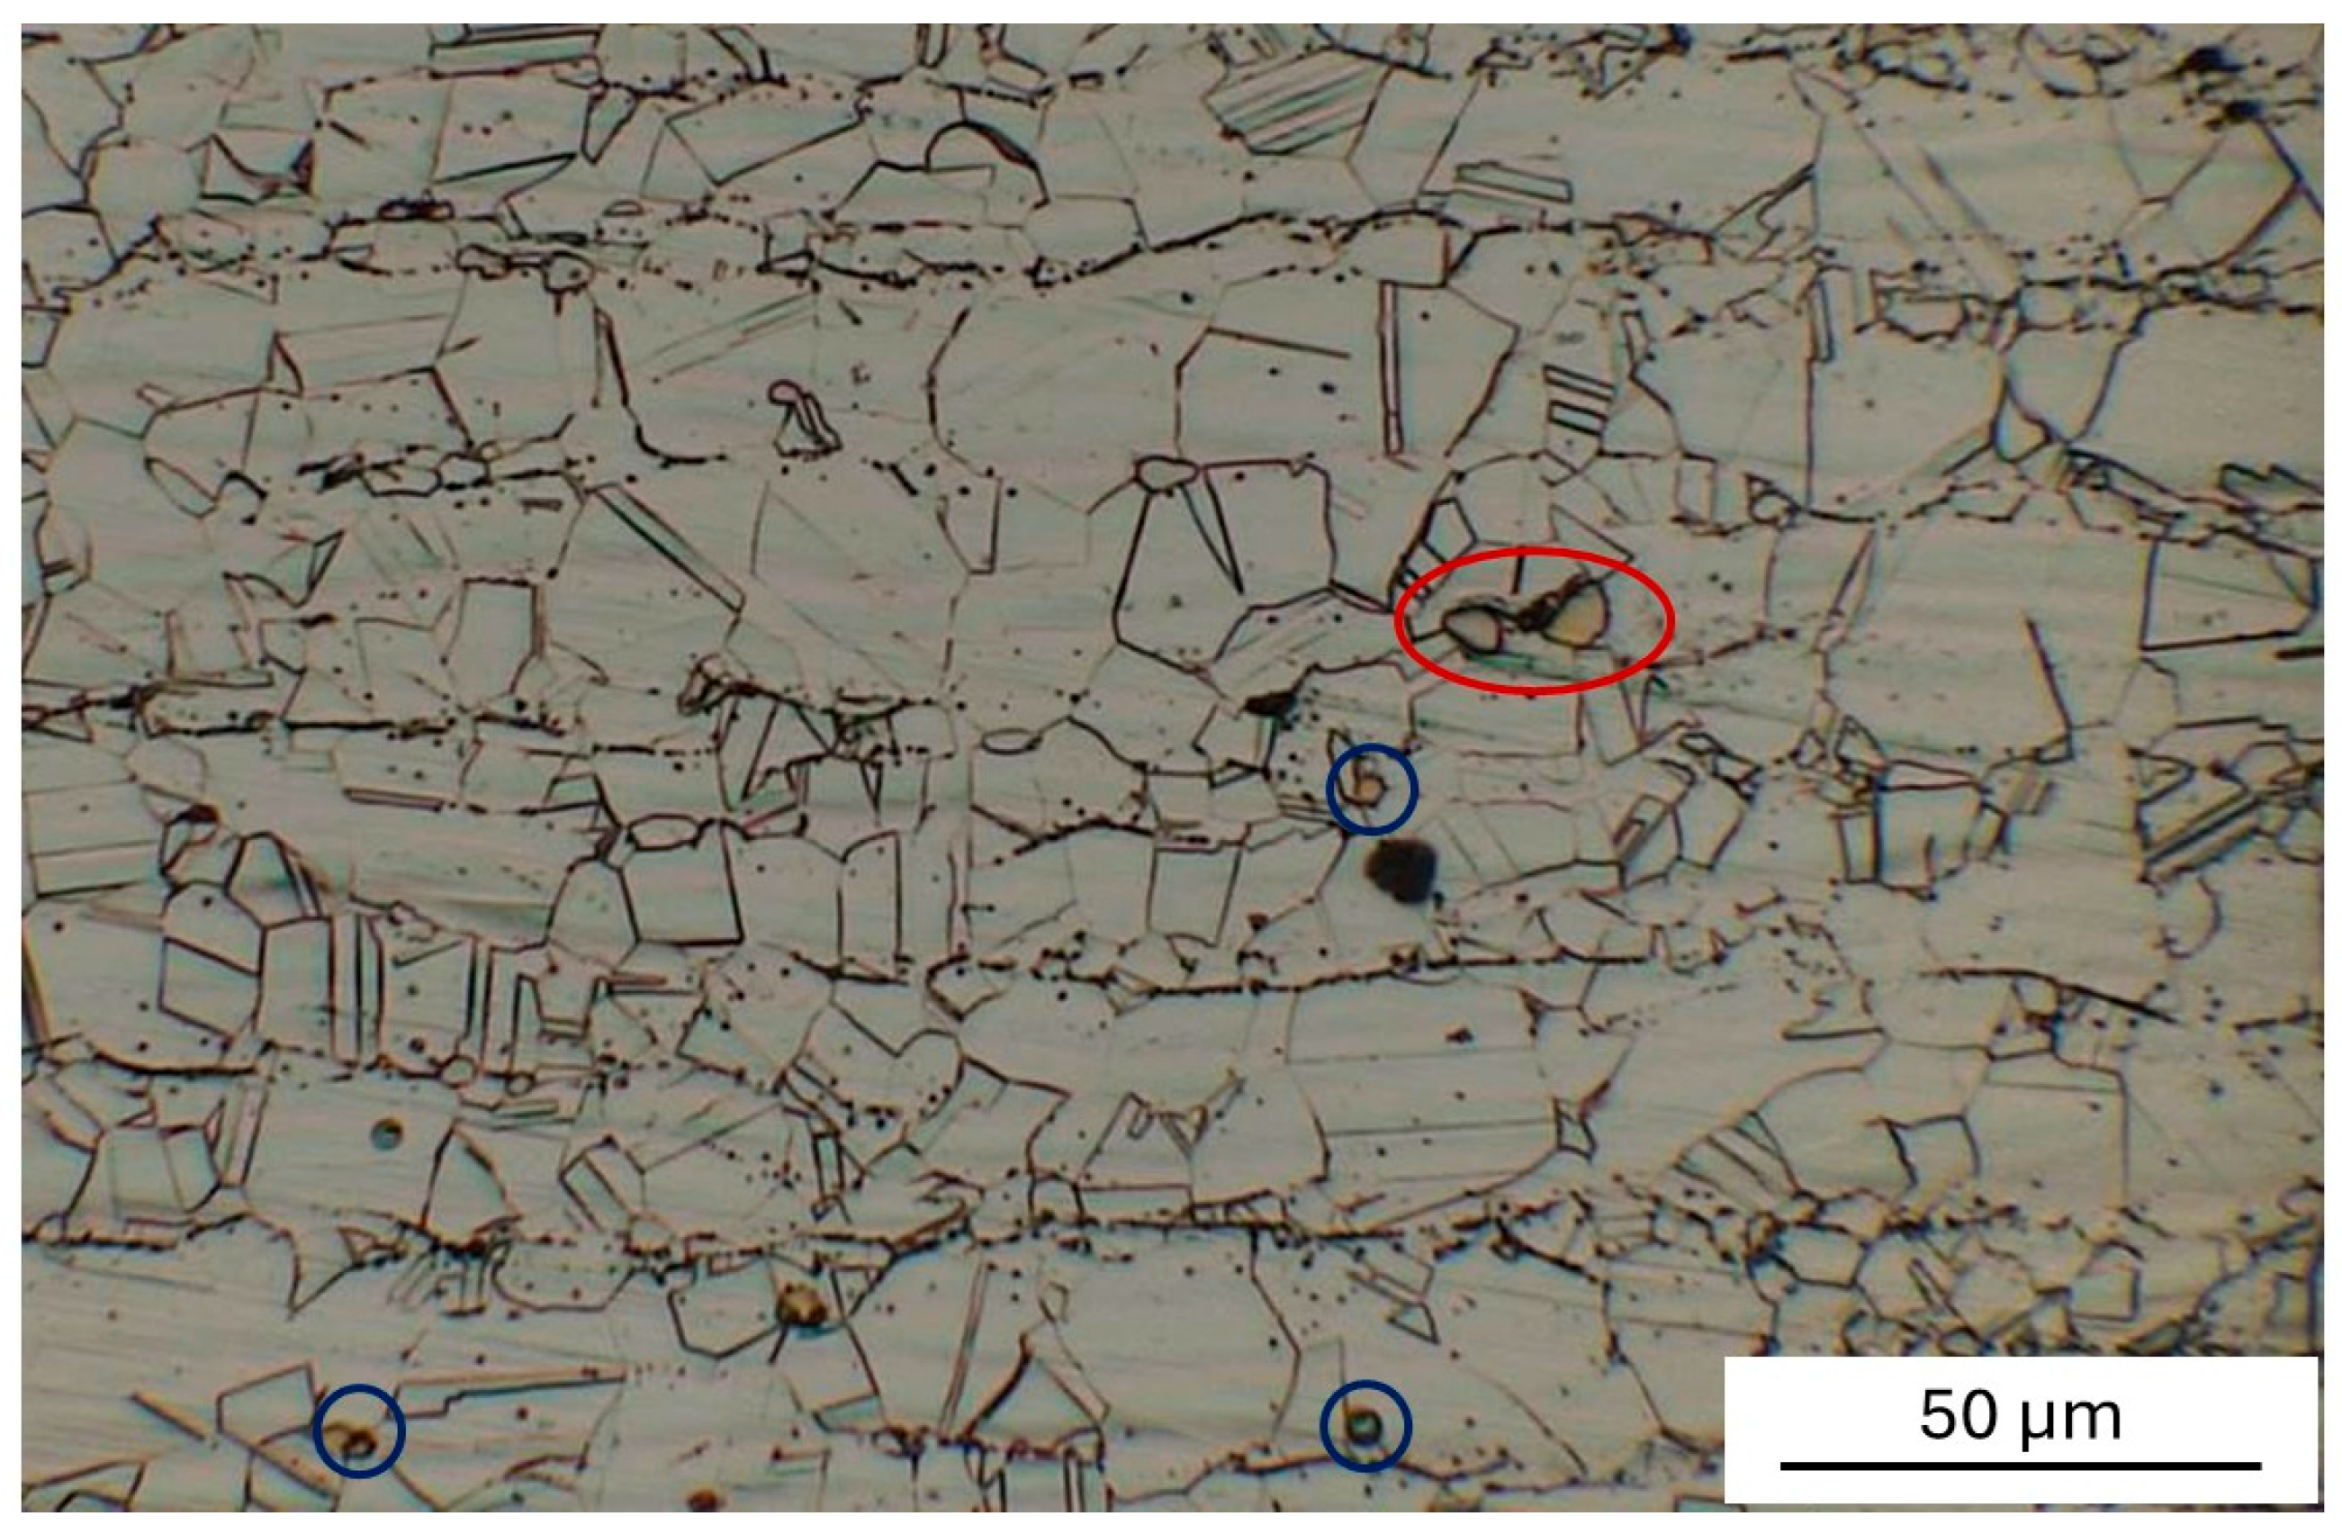
Figure 1. Microstructure of the original material. Precipitates of larger size (7 ± 1 μm) are highlighted in red, while smaller size ones (<1 μm) are in blue.
Metals 15 01296 g001
Figure 2. The ABB robotic arm that carries the laser focusing head (a) and the clamping (b).
Metals 15 01296 g002
Figure 3. Schematic view of power vs. time in pulsed laser conditions (blue line) for one set of the chosen process parameter values. The orange horizontal line represents the average laser power P.
Metals 15 01296 g003
Figure 4. Experimental set-up used for focusing the X-ray beam on the BM and MZ of the seams: the rectangular X-ray spot focused on the MZ of the seam (a); the micrometric translation stage (b).
Metals 15 01296 g004
Figure 5. Radiographic image of the seams. Yellow arrows highlight the presence of isolated porosity.
Metals 15 01296 g005
Figure 6. Cross-section images of the welded seams. The numbers indicate seams obtained with the corresponding sets of parameters listed in Table 2.
Metals 15 01296 g006
Figure 7. Area (A) affected by the welding process vs. average laser power (P).
Metals 15 01296 g007
Figure 8. Total area of the pores in the MZ vs. the combined parameter (P·v).
Metals 15 01296 g008
Figure 9. LM images of MZ microstructure of seam #6 at different magnifications (a,b). MZ/HAZ interface (dashed lines) with epitaxial grain growth (c).
Metals 15 01296 g009
Figure 10. LM images of HAZ/MZ microstructure of seam #4.
Metals 15 01296 g010
Figure 11. SEM images of precipitate (a) and EDS map analysis (b) and EDS spectrum (c,d) of a precipitate in BM.
Metals 15 01296 g011
Figure 12. SEM images of precipitate in the outer (a) and inner (b) zone of the MZ of seams #2 (a) and #6 (b). The yellow circles highlight the precipitates.
Metals 15 01296 g012
Figure 13. XRD pattern collected in the BM.
Metals 15 01296 g013
Figure 14. XRD patterns performed by focusing the X-ray beam on the MZ. The dashed lines indicate the peak positions of the main reflections in the BM.
Metals 15 01296 g014
Figure 15. {220} peak profile of seams #4 (red line), #5 (green line), and #6 (black line). The vertical blue line indicates the peak position of base material (BM) free from the stresses arising from welding.
Metals 15 01296 g015
Figure 16. Elastic distortion ε measured by XRD as a function of the combined parameter P·v.
Metals 15 01296 g016
Figure 17. Vickers micro-hardness tests at the top and bottom of the welded seam #6 obtained with a laser speed v = 25 mm/s and average power P = 2000 W.
Metals 15 01296 g017
Figure 18. Area of seam vs. P·v for welds made with three different values of laser power. For the data of the set obtained at P = 2300 W, a dashed line has been used to highlight the non-linear trend.
Metals 15 01296 g018
Figure 19. (a) Schematic representation of the method used to evaluate Abackside and (b) its values vs. HI: the black dots represent the experimental data, for HI > 85 J/mm a sharp increase is observed, then the values follow a liner trend (dashed red line).
Metals 15 01296 g019
Table 1. Chemical composition (wt%) of the IN625 alloy.
CrFeMoNbCoMnAlTiTaSiS + PCNi
22.264.548.333.430.040.350.220.200.010.24<0.010.04balance
Table 2. Combination of welding parameters.
WeldingP (W)Pmax (W)Pmin (W)ΔP (W)v (mm/s)ΓHI
(J/mm)
P·v
(J mm/s2)
#1170021251275850150.611325,500
#2170018891511378200.88534,000
#317001700170002516842,500
#4200022221778444150.813330,000
#5200020002000020110040,000
#62000250015001000250.68050,000
#7230023002300015115334,500
#82300287517251150200.611546,000
#9230025562044512250.89257,500
Table 3. Area (A) affected by the welding process measured on the cross-section of weld seams.
Sample#1#2#3#4#5#6#7#8#9
A (mm2)5.674.623.616.795.093.565.904.574.12
Table 4. Average diameter (davg) and total area (Apores) of the pores observed in the cross-section of the welded seams.
#1#2#3#4#5#6#7#8#9
davg (μm)0.370.290.510.560.200.170.10--
Apores (×10−7 mm2)8.924.072.044.951.820.530.082--
Table 5. Relative intensities determined from XRD patterns in Figure 13. Data from JCPDS-ICDD database (JCPDS 4-850), obtained from Ni with randomly oriented grains, are reported for comparison.
111200220I200/I111I220/I111
BM10052600.520.60
JCPDS 4-85010042210.420.21
Table 6. Relative intensities determined from XRD patterns in Figure 14.
111200220I220/I111
#110058670.67
#210039990.99
#310046800.80
#410052800.80
#510036740.74
#610083760.76
#710071930.93
#810052590.59
#910038780.78
Table 7. Elastic strain measured by XRD and calculated values of σX + σY for the different welding conditions.
Sample#1#2#3#4#5#6#7#8#9
ε (× 10−3)0.8750.6030.6341.1160.6340.5431.2061.0550.603
(σX + σY) (MPa)603.5416.3437.1769.8437.1374.7832.1728.2416.3
HI (J/mm)11385681331008015311592
Table 8. Average micro-hardness values in the MZ of different samples.
Sample#1#2#3#4#5#6#7#8#9
HV in MZ264 ± 3263 ± 6266 ± 5264 ± 4263 ± 6263 ± 8264 ± 4260 ± 4264 ± 6
Disclaimer/Publisher’s Note: The statements, opinions and data contained in all publications are solely those of the individual author(s) and contributor(s) and not of MDPI and/or the editor(s). MDPI and/or the editor(s) disclaim responsibility for any injury to people or property resulting from any ideas, methods, instructions or products referred to in the content.