Abstract
In this study, nanoindentation was employed to determine residual stresses in copper after compression and tension deformations with different deformation levels. Rectangular and cylindrical compression specimens were prepared in order to produce residual stresses parallel or perpendicular to the stress direction. For the compression deformation, with the increase in compressive strain, the residual compression stress parallel to the compression direction increased and exhibited a linear relationship with the compressive strain, , while the residual compression stress perpendicular to the compression direction were as follows: . For the tension deformation, with the increase in tensile strains, the residual tension stress parallel to the tension direction increased and exhibited a linear relationship with the tensile strain, , while the residual tension stress perpendicular to the tension direction were as follows: . The residual stresses parallel to the stress direction exhibited significant anisotropic characteristics, while the residual stresses perpendicular to the stress direction exhibited significant isotropic characteristics. Based on the above results, the relationship between strains and residual stress were successfully determined, providing valuable data reference for engineering applications.
1. Introduction
Residual stress refers to the self-equilibrating stress that remains within a material in the absence of external forces. The formation of residual stress primarily arises from plastic deformation, phase transformations, or thermal shock within the material, such as those caused by tension or compression deformation, heat treatment, chemical processing, etc. [1,2]. When the residual stress is improperly distributed, it may lead to component failure or fracture, and, in severe cases, threaten the safety of equipment [3,4,5]. Therefore, the accurate measurement and evaluation of residual stress are not only essential for predicting structural life and preventing failure but also serve as an important basis for process optimization in machining, heat treatment, and plastic deformation.
Residual stresses can usually be measured by specialized instruments, including X-ray diffraction, neutron diffraction, the hole-drilling method, stress corrosion methods, and nanoindentation techniques; however, each has some limitations: diffraction-based methods require expensive equipment, traditional mechanical and corrosion methods are limited in spatial resolution and measurement depth, while the nanoindentation technique demands small dimensions and smooth samples with low surface roughness [6,7,8,9,10,11,12]. Thus, obtaining residual stress based on their plastic deformation process, rather than using the methods mentioned above, becomes very interesting, and is necessary for research and application. Previous studies, such as that by Singh et al. [13], have demonstrated that plastic deformation can induce complex residual stress fields, typically characterized by compressive surface stress and tensile core stress. Wang et al. [14] measured the residual stress of 0.19 mm electronic copper foil after rolling using the XRD method and reported surface compressive stresses of 35 MPa in the rolling direction and 32 MPa in the transverse direction. Greco et al. [15] employed nanoindentation combined with finite element analysis to establish a method for deriving surface residual stress distributions from indentation responses. Cao et al. [16] used nanoindentation to evaluate the residual stress in C194 lead-frame copper strips. However, these studies primarily focused on specific loading stress states and did not establish explicit relationships between the macroscopic plastic strain and the direction-dependent residual stresses. This thus forms the main objective of the present work.
For this purpose, this paper investigates the relationship between plastic deformation and residual stress. Compression and tension have been employed, and by loading different compression plastic deformations or tension plastic deformations, different compression residual stresses or tension residual stresses can be produced. Rectangle compression specimens and plate tension specimens are used to evaluate the residual stress parallel to the compression direction or tension direction, while cylinder compression specimens and cylinder tension specimens are used to evaluate the residual stress perpendicular to the compression direction or tension direction. Residual stress is measured using the nanoindentation technique.
To measure residual stress using the nanoindentation method, the fixed indentation-depth mode in the highly reliable Suresh equation is utilized [17,18,19,20,21]. The equation for calculating residual compressive stress and tensile stress under the fixed indentation depth mode is as follows:
where H is the nanoindentation hardness, calculated using the Oliver–Pharr (O&P) [22] method, and its expression is given by , Pmax is maximum indentation load, A is the contact area between the indenter and the specimen surface in the residual stress state, A0 is the contact area between the indenter and the specimen surface in the stress-free state, , hc is the contact depth, and α = 0.25 for the Berkovich indenter. Thus, by these equations, the residual stress can be obtained.
In this study, nanoindentation is employed to systematically measure the residual stress components in copper subjected to parallel and perpendicular compression and tension at different strain levels. The obtained data are used to establish quantitative relationships between strain and residual stress, providing valuable references for engineering applications.
2. Materials and Methods
T2-type copper (Chinese standard grade) produced in China was used in this study, and its nominal chemical composition is listed in Table 1. Compression and tension specimens with different shapes and dimensions were prepared, as shown in Figure 1. For the rectangle compression specimens and plate tension specimens, stress-relief annealing was performed before test. The annealing process is as follows: heating to 300 °C within 35 min, holding at 300 °C for 1 h, and then furnace cooling to room temperature. For the cylinder compression specimens and cylinder tension specimens, no stress-relief annealing was performed before the test, and the specimens were tested in their as-extruded condition (supply status), to ensure two different stress states.

Table 1.
Nominal chemical composition range of T2 copper (wt.%).
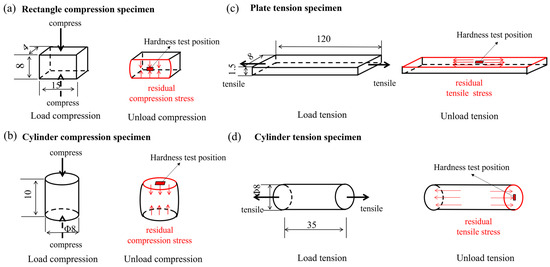
Figure 1.
Schematic of residual stress distribution of specimens under compression (tension): (a) rectangle compression specimens; (b) cylinder compression specimen; (c) plate tension specimen; (d) cylinder tension specimen.
The compression tests were conducted on a Gleeble-1500 thermo-mechanical simulator (Duffers Scientific, Poestenkill, NY, USA) under the same strain rate of 1 × 10⁻³ s−1. Tensile tests were performed on an MTS-810 universal testing machine at a constant strain rate of 1 × 10⁻³ s−1, using an extensometer with a gauge length of 20 mm. The cylindrical tension specimens were gripped by a threaded joint with testing machine tension, to ensure that deformation occurred throughout the specimen. To avoid non-uniform deformation during loading, strain levels of 5%, 7.5%, and 10% were applied to the rectangular specimens, whereas strains of 10%, 20%, and 30% were applied to the cylindrical specimens. Before tension and compression, the specimens were ground and polished in order to minimize the effect of grinding and polishing on residual stress. The specimen surfaces were prepared by sequential grinding with 400#, 800#, 1200#, and 2000# grit silicon carbide papers, followed by polishing with diamond suspensions of 3 µm, 1 µm, and 0.05 µm, respectively.
The hardness of the material was determined using a Nano Indenter G200 (Agilent, Santa Clara, CA, USA) system equipped with a Berkovich three-sided pyramidal diamond tip. For the Berkovich indenter, the indentation side length is 7.53 times the penetration depth (a = 7.53 h, a is the indentation side length, and h is the actual penetration depth of the indenter into the material during loading). A fixed penetration depth of 2000 nm was adopted in the nanoindentation tests. After deformation, the ground and polished specimens were used for nanoindentation, no cut from the deformed specimens.
Hardness was calculated using the Oliver and Pharr (O&P) method [23], and residual stress was calculated using the existing Suresh model. Compressive stress is defined as a negative value, and tensile stress is defined as a positive value.
The indentation impressions were observed under the secondary electron mode of a scanning electron microscope (SEM). No etching was performed before the SEM observation. The SEM observations were carried out at an accelerating voltage of 5 kV and a beam current of 10 µA.
3. Results and Analysis
3.1. Determination of Residual Stresses Under Different Compression Strains
3.1.1. Compression Deformation
The rectangle specimens and cylinder specimens were compressed with different compression stresses. Figure 2 shows the compression curves of the rectangle specimens with different compression stresses, which were 248.1 MPa, 284.3 MPa, and 299.8 MPa, respectively. Correspondingly, the compression strains were 0%, 5.0%, 7.5%, and 10.0% for rectangle compression specimens. Figure 3 shows the compression curves of the cylinder specimens with different compression stresses, which were 376.5 MPa, 420.3 MPa, and 510.5 MPa, respectively. Correspondingly, the compression strains were 0%, 10.0%, 20.0%, and 30.0% for the cylinder compression specimens. The compression stress, compression strain, and the marks of the rectangle and cylinder compression specimens are shown in Table 2.
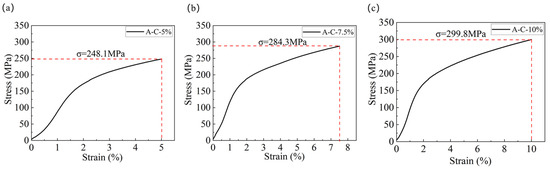
Figure 2.
Compression curve of rectangle compression specimens: (a) A-C-5%; (b) A-C-7.5%; (c) A-C-10%.
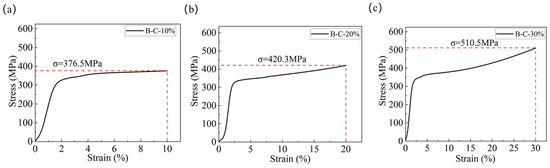
Figure 3.
Compression curves of cylinder compression specimens: (a) B-C-10%; (b) B-C-20%; (c) B-C-30%.
Table 2.
Compression strains and marks of compression tests.
3.1.2. Residual Stresses
The indentation morphologies of the rectangle compression specimens after the nanoindentation test are shown in Figure 4. It can be seen that, in the A-C-0% specimen (Figure 4a), the protrusions of the three edges are almost identical, at approximately 0.58 µm. After 5.0%, 7.5%, and 10.0% compressive deformation, the edge protrusions parallel to the compression direction remain almost unchanged. These are approximately 0.58 µm, while the edge protrusions non-parallel to the compression direction increase to 0.619 µm, 0.657 µm, and 0.714 µm for the left side, and increase from 0.639 µm to 0.653 µm and to 0.723 µm for the right side. These results indicate that directional residual compression stresses exist with the increasing compressive strain, as shown in Figure 4.
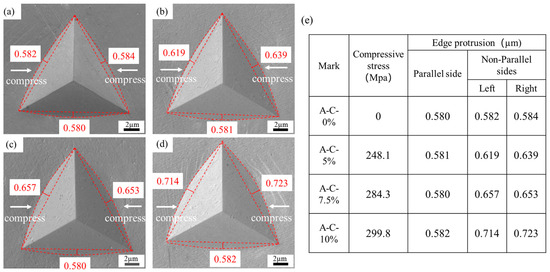
Figure 4.
SE images of nanoindentation impressions of rectangle compression specimens: (a) A-C-0%; (b) A-C-5%; (c) A-C-7.5%; (d) A-C-10%; (e) edge protrusion data.
The indentation morphologies of the cylinder compression specimens after the nanoindentation test are shown in Figure 5. It can be seen that, in the B-C-0% specimen (Figure 5a), the protrusions of the three edges are almost identical, at approximately 0.56 µm. After 10.0%, 20.0%, and 30.0% compressive deformation, the protrusions of all three edges perpendicular to the compression stress increase with the increase in compressive strain, indicating that isotropic residual compression stress exists with the increasing compressive strain, as shown in Figure 5.
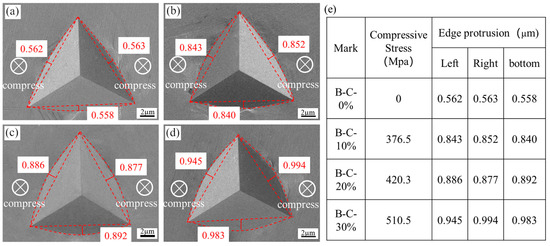
Figure 5.
SE images of nanoindentation impressions of cylinder compression specimens: (a) B-C-0%; (b) B-C-10%; (c) B-C-20%; (d) B-C-30%; (e) edge protrusion data.
Figure 6 shows the load–displacement curves of the rectangle and cylinder compression specimens. It can be seen that, for both the rectangle and cylinder compression specimens, the loading curves and unloading curves shift towards upper left with the increase in penetration depths, indicating the existence of residual compression stresses.
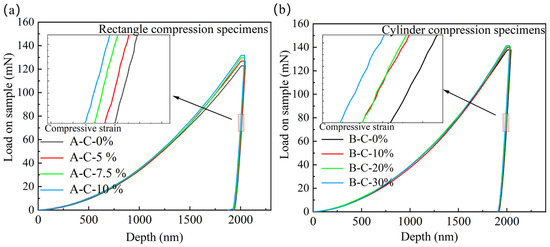
Figure 6.
Load–displacement curves under compression at a fixed penetration depth of 2000 nm: (a) rectangle compression specimens; (b) cylinder compression specimens.
The hardness and residual stresses of the rectangle compression specimens were obtained from the load–displacement curves and calculated using the formulas mentioned above; the results are shown in Table 3. When the compression strain is 0%, the nanoindentation hardness is 1.29 GPa, with no residual compressive stress. With increasing strain, both the hardness and residual stress increase. When the compression strain is 5.0%, the nanoindentation hardness increases to 1.33 GPa, and the residual stress is −7.4 MPa. When the compression strain is 7.5%, the nanoindentation hardness is 1.4 GPa, with a residual stress of −12.1 MPa. When the compression strain is 10.0%, the nanoindentation hardness further increases to 1.39 GPa, and the residual stress is −15.4 MPa.
Table 3.
Nanoindentation hardness and residual stress of rectangle compression specimens at a fixed penetration depth of 2000 nm.
The hardness and residual stress of the cylinder compression specimens are obtained from the load–displacement curves and calculated using the corresponding formulas; the results are shown in Table 4. When the compressive strain is 0%, the nanoindentation hardness is 1.48 GPa, with no residual compressive stress. With increasing strain, both the hardness and the residual stress increase. When the compressive strain is 10.0%, the nanoindentation hardness increases to 1.50 GPa, and the residual stress is −3.2 MPa. When the compressive strain is 20.0%, the nanoindentation hardness is 1.52 GPa, with a residual stress of −4.6 MPa. When the compressive strain is 30.0%, the nanoindentation hardness is 1.52 GPa, and the residual stress is −6.0 MPa.
Table 4.
Nanoindentation hardness and residual stress of cylinder compression specimens at a fixed penetration depth of 2000 nm.
3.1.3. The Relationships Between Residual Stresses with the Compression Strains
The relationships between nanoindentation hardness, residual stress, and compressive stress for the rectangle and cylinder compression specimens are shown in Figure 7(a1) and Figure 7(b1), respectively. It can be seen that, for the rectangle compression specimens and cylinder compression specimens, both the hardness and the residual compression stress increase with increasing compressive stress. The relationships between residual compression stress and compression strain are shown in Figure 7(a2,b2). It can be seen that, for both the rectangle and cylinder compression specimens, the residual compression stress increases linearly with increasing compressive strain. By fitting the curve of residual compression stress versus compressive strain, the following equation can be obtained: rectangle compression specimens: cylinder compression specimens: .
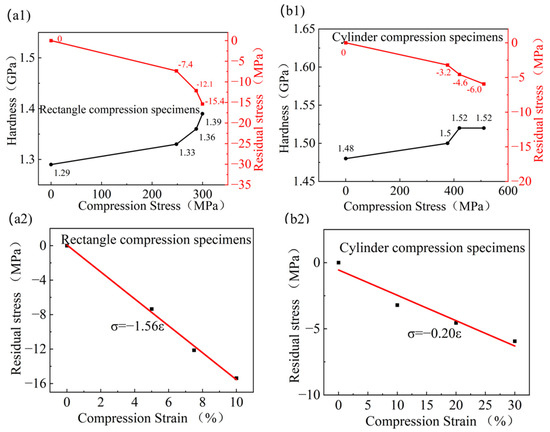
Figure 7.
(a1) Hardness and residual stress curves of rectangle compression specimens with compression stress; (a2) residual stress curves of rectangle compression specimens with compression strain; (b1) hardness and residual stress curves of cylinder compression specimens with compression stress; (b2) residual stress curves of cylinder compression specimen with compression strain.
From the load–displacement curves shown in Figure 6, as well as Equations (1) and (2), the residual compression stress in the specimen can be identified. However, combined with the nanoindentation morphologies shown in Figure 4 and Figure 5, it can be deduced that the residual compression stress parallel to the compression direction is, to some extent, somehow different from the residual compression stress perpendicular to the compression direction. The residual compression stress parallel to the compression direction exhibits anisotropy: as the compression strain increases, the protrusion of the non-parallel edges differs from that of the parallel edge. In contrast, the residual compression stress perpendicular to the compression direction exhibits isotropy: as the compression strain increases, the protrusion changes along the three edges follow the same trend.
3.2. Determination of Residual Stresses Under Different Tension Strains
3.2.1. Tension Deformation
The plate specimens and cylinder specimens were tensed with different tension stresses. Figure 8 shows the tension curves of the plate specimens with different tension stresses, which were 220.6 MPa, 225.6 MPa, and 230.9 MPa, respectively. Correspondingly, the tension strains were 0%, 5.0%, 7.5%, and 10.0% for the plate tension specimens. Figure 9 shows the tension curves of the cylinder specimens with different tension stresses, which were 258.8 MPa, 265.8 MPa, and 270.8 MPa, respectively. Correspondingly, the tension strains were 0%, 10.0%, 20.0%, and 30.0% for the cylinder tension specimens. The tension stress, tension strain, and marks of the plate and cylinder tension specimens are shown in Table 5.
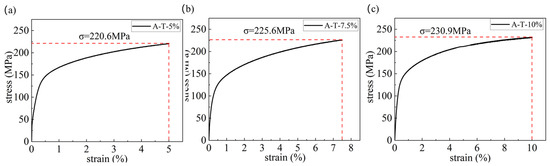
Figure 8.
Tension curves of plate tension specimens: (a) A-T-5%; (b) A-T-7.5%; (c) A-T-10%.
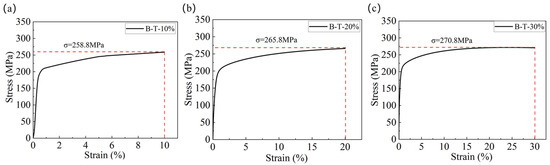
Figure 9.
Tension curve of cylinder tension specimens: (a) B-T-10%; (b) B-T-20%; (c) B-T-30%.
Table 5.
Tension strains and marks of tension tests.
3.2.2. Residual Stresses
The indentation morphologies of the plate tension specimens after the nanoindentation test are shown in Figure 10. It can be seen that, in the A-T-0% specimen (Figure 10a), the protrusions of the three edges are almost identical, approximately 0.55 µm. After 5.0%, 7.5%, and 10.0% tensile deformation, the edge protrusions parallel to the tension direction remain almost unchanged, at approximately 0.55 µm. Meanwhile, the edge protrusions non-parallel to the tension direction decrease from 0.549 µm to 0.434 µm and to 0.385 µm for the left side, and decrease to 0.462 µm, 0.454, and 0.384 µm for the right side, indicating that directional residual tension stresses exist with the increasing tensile strain, as shown in Figure 10.
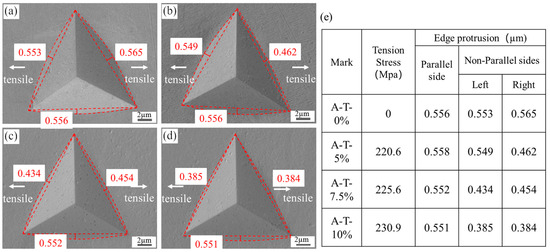
Figure 10.
SE images of nanoindentation impressions of plate tension specimens: (a) A-T-0%; (b) A-T-5%; (c) A-T-7.5%; (d) A-T-10%; (e) edge protrusion data.
The indentation morphologies of the cylinder tension specimens after the nanoindentation test are shown in Figure 11. It can be seen that, in the B-T-0% specimen (Figure 11a), the protrusions of the three edges are almost identical, approximately 0.56 µm. After 10.0%, 20.0%, and 30.0% tensile deformation, the protrusions of all three edges perpendicular to the compression stress all decrease with the increase in tensile strain, indicating that isotropic residual tension stress exists with the increasing tensile strain, as shown in Figure 11.
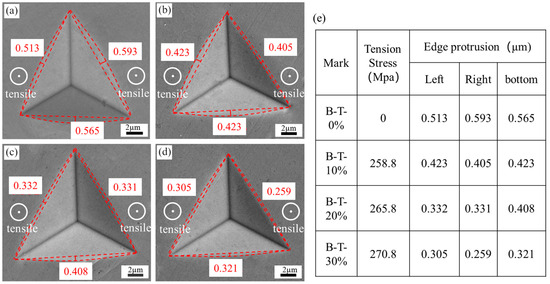
Figure 11.
SE images of nanoindentation impressions of cylinder tension specimens: (a) B-T-0%; (b) B-T-10%; (c) B-T-20%; (d) B-T-30%; (e) edge protrusion data.
Figure 12 shows the load–displacement curves of the plate and cylinder tension specimens. It can be seen that, for both the plate and cylinder tension specimens, the loading curves and unloading curves shift towards the lower right with the increase in penetration depths, indicating the existence of the residual tension stresses.
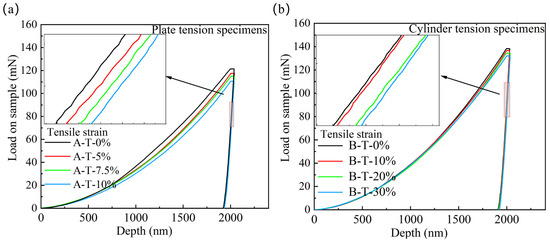
Figure 12.
Load–displacement curves under compression at a fixed penetration depth of 2000 nm: (a) plate tension specimens; (b) cylinder tension specimens.
The hardness and residual stress of the plate tension specimens are obtained from the load–displacement curves and calculated using the formulas mentioned above; the results are shown in Table 6. When the tension strain is 0%, the nanoindentation hardness is 1.30 GPa, with no residual tension stress. With increasing strain, the hardness decreases and residual stress increases. When the tension strain is 5.0%, the nanoindentation hardness decreases to 1.25 GPa, and the residual stress increases to 3.1 MPa. When the tension strain is 7.5%, the nanoindentation hardness decreases to 1.22 GPa, with a residual stress increase to 5.6 MPa. When the tension strain is 10.0%, the nanoindentation hardness further decreases to 1.17 GPa, and the residual stress further increases to 11.0 MPa.
Table 6.
Nanoindentation hardness and residual stress of plate tension specimens at a fixed penetration depth of 2000 nm.
The hardness and residual stress of the cylinder tension specimens are obtained from the load–displacement curves and calculated using the corresponding formulas, the results are shown in Table 7. When the tension strain is 0%, the nanoindentation hardness is 1.46 GPa with no residual tension stress. With increasing strain, the hardness decreases and residual stress increases. When the tension strain is 10.0%, the nanoindentation hardness decreases to 1.44 GPa, and the residual stress increases to 1.1 MPa. When the tension strain is 20.0%, the nanoindentation hardness decreases to 1.42 GPa, with a residual stress increase to 3.8 MPa. When the tension strain is 30.0%, the nanoindentation hardness further decreases to 1.39 GPa, and the residual stress further increases to 6.2 MPa.
Table 7.
Nanoindentation hardness and residual stress of cylinder tension specimens at a fixed penetration depth of 2000 nm.
3.2.3. Relationships Between Residual Stresses and Tension Strains
The relationships between nanoindentation hardness, residual stress, and tension stress for the plate and cylinder tension specimens are shown in Figure 13(a1) and Figure 13(b1), respectively. It can be seen that, for the plate tension specimens and cylinder tension specimens, the hardness decreases and the residual stress increases with increasing tensile stress. The relationships between the residual tension stress and the tensile strain are shown in Figure 13(a2,b2). It can be seen that, for both the plate and cylinder tension specimens, the residual tension stress increases linearly with increasing tensile strain. By fitting the curve of the residual tension stress versus the tensile strain, the following equation can be obtained: plate tension specimens: ; cylinder tension specimens: .
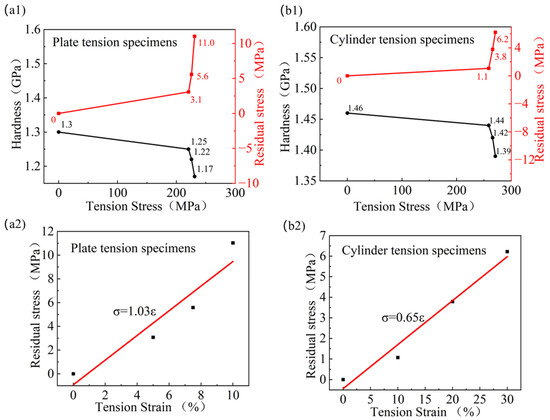
Figure 13.
(a1) Hardness and residual stress curves of plate tension specimens with tension stress; (a2) residual stress curves of plate tension specimens with tension strain; (b1) hardness and residual stress curves of cylinder tension specimens with tension stress; (b2) residual stress curves of cylinder tension specimen with tension strain.
From the load–displacement curves shown in Figure 12, as well as Equations (1) and (2), the residual tension stress in the specimen can be identified. However, combined with the nanoindentation morphologies shown in Figure 10 and Figure 11, it can be deduced that the residual tension stress parallel to the tension direction is, to some extent, somehow different from the residual tension stress perpendicular to the tension direction. The residual tension parallel to the tension direction exhibits anisotropy: as the tension strain increases, the protrusion of the non-parallel edges differs from that of the parallel edge. In contrast, the residual tension stress perpendicular to the tension direction exhibits isotropy: as the tension strain increases, the protrusion changes along the three edges follow the same trend.
4. Conclusions
- 1.
- Residual compression stresses, parallel to the compression direction and perpendicular to the compression direction, were separately produced by compressing a rectangular specimen and a cylindrical specimen. The residual tension stresses, parallel to the tension direction and perpendicular to the tension direction, were separately produced by tensioning a plate specimen and a cylinder specimen.
- 2.
- With the increase in compressive strains, the residual compression stress parallel to the compression direction increased and exhibited a linear relationship with the compressive strain, which was ; meanwhile, the residual compression stress perpendicular to the compression direction increased and exhibited the relationship of
- 3.
- With the increase in tensile strains, the residual tension stress parallel to the tension direction increased and exhibited a linear relationship with the tensile strain, which was , while the residual tension stress perpendicular to the tension direction increased and exhibited the relationship of .
- 4.
- The residual compression stresses or residual tension stresses, parallel to the stress direction, exhibited significant, direction-dependent anisotropic characteristics. Meanwhile, the residual compression stresses or residual tension stresses, perpendicular to the stress direction, exhibited significant, direction-independent isotropic characteristics.
Author Contributions
Conceptualization, X.S.; methodology, G.L., H.Q., and J.M.; software, G.L., H.Q., and J.M.; validation, G.L., H.Q., and J.M.; formal analysis, G.L., H.Q., and J.M.; investigation, G.L.; resources, G.L., H.Q., and J.M.; data curation, G.L., H.Q., and J.M.; writing—original draft preparation, G.L.; writing—review and editing, G.L., and X.S.; visualization, G.L., and X.S.; supervision, X.S.; project administration, X.S.; funding acquisition, X.S. All authors have read and agreed to the published version of the manuscript.
Funding
This research was funded by National Key Research and Development Program of China (2023YFB3710401, 2023YFB3710403).
Data Availability Statement
The original contributions presented in this study are included in the article. Further inquiries can be directed to the corresponding author.
Conflicts of Interest
The authors declare no conflicts of interest.
References
- Mi, G. Generation of Residual Stress and Countermeasures; Mechanical Industry Press: Beijing, China, 1983; pp. 10–60. [Google Scholar]
- Kumar, D.; Idapalapati, S.; Wang, W. Effect of surface mechanical treatments on the microstructure-property-performance of engineering alloys. Materials 2019, 12, 2503–2543. [Google Scholar] [CrossRef] [PubMed]
- Cao, Z.; Shi, Z.; Yu, F.; Sugimoto, K.; Cao, W. Effects of double quenching on fatigue properties of high carbon bearing steel with extra-high purity. Int. J. Fatigue 2019, 128, 105176. [Google Scholar] [CrossRef]
- Xiong, Z.; Naoe, T.; Futakawa, M. Effect of artificial defects on the very high cycle fatigue behavior of 316L stainless steel. Metals 2019, 9, 412–422. [Google Scholar] [CrossRef]
- Bayraktar, E.; Garcias, I.; Bathias, C. Failure mechanisms of automotive metallic alloys in very high cycle fatigue range. Int. J. Fatigue 2006, 28, 1590–1602. [Google Scholar] [CrossRef]
- Nagy, W.; Van, P.; Schotte, K.; De, B. Measuring residual stresses in orthotropic steel decks using the incremental hole-drilling technique. Exp. Tech. 2017, 41, 215–226. [Google Scholar] [CrossRef]
- Nervi, S.; Szabo, B. On the estimation of residual stresses by the crack compliance method. Comput. Methods Appl. Mech. Eng. 2007, 196, 3577–3584. [Google Scholar] [CrossRef]
- Schajer, G.; Whitehead, P. Hole-Drilling Method for Measuring Residual Stresses; Synthesis SEM Lectures on Experimental Mechanics; Springer: Berlin/Heidelberg, Germany, 2018; Volume 1.1, pp. 19–86. [Google Scholar]
- Yin, B.; Zhao, H.; Wang, X. Basic Knowledge of Residual Stress Measurement-Lecture 7: Mechanical Method for Residual Stress Measurement. J. Phys. Chem. Test. 2007, 43, 642–645. [Google Scholar]
- Ma, C.; Wu, Y.; Guo, J. X-ray Diffraction Method for Measuring Residual Stress in Aluminum Alloys and Error Analysis. Hot Work. Technol. 2010, 39, 5–8. [Google Scholar]
- Song, J.; Huang, X.; Gao, Y. Residual Stress Testing and Analysis Techniques. Surf. Technol. 2016, 45, 75–82. [Google Scholar]
- Zhu, L.; Xu, B.; Wang, H.; Wang, C. Measurement of residual stresses using nanoindentation method. Crit. Rev. Solid State Mater. Sci. 2015, 40, 77–89. [Google Scholar] [CrossRef]
- Singh, G.; Kalita, B.; Vishnu, N. Finite Element Analysis and Experimental Evaluation of Residual Stress of Zr-4 alloys Processed through Swaging. Metals 2020, 10, 2–15. [Google Scholar] [CrossRef]
- Wang, B.; Liu, Y.; Zhu, Q. Microstructure and residual stress gradient evolution mechanism of electronic copper strip for lead frame. J. Alloys Compd. 2024, 1009, 2–10. [Google Scholar] [CrossRef]
- Greco, A.; Sgambitterra, E.; Guagliano, M. Measurement of laser shock peening induced residual stress by nanoindentation and comparison with XRD technique. J. Mater. Res. Technol. 2024, 30, 5701–5710. [Google Scholar] [CrossRef]
- Cao, T.; Su, P.; Xu, Z. Evaluation of residual stress in lead frame copper strips by nanoindentation. J. Mater. Sci. 2023, 58, 5884–5900. [Google Scholar] [CrossRef]
- Saha, R.; Nix, W. Soft films on hard substrates-nanoindentation of tungsten films on sapphire substrates. Mater. Sci. Eng. A 2001, 319, 898–901. [Google Scholar] [CrossRef]
- Kværndrup, F.; Engelbrekt, C.; Christiansen, T.; Winther, G. Area determination with pile-up and sink-in in nanoindentation of oxygen containing titanium. Mater. Today Commun. 2022, 30, 3–8. [Google Scholar] [CrossRef]
- Zhang, L.; Cheng, G.; Ding, J.; Lin, Z.; Zhang, Z. Study of residual stress in the 304 stainless steel by nanoindentation method. Chin. J. Sens. Actuators 2012, 25, 766–770. [Google Scholar]
- Zhu, L. Study on Coating Residual Stress Based on Nanoindentation Technology. Ph.D. Dissertation, China University of Geosciences, Beijing, China, 2013. [Google Scholar]
- Zhu, L.; Xu, B.; Wang, H.; Wang, C. Effect of residual stress on the nanoindentation response of (100) copper single crystal. Mater. Chem. Phys. 2012, 136, 561–565. [Google Scholar] [CrossRef]
- Liu, M.; Zheng, Q.; Wang, X.; Xu, C. Characterization of distribution of residual stress in shot-peened layer of nickel-based single crystal superalloy DD6 by nanoindentation technique. Mech. Mater. 2022, 164, 4–12. [Google Scholar] [CrossRef]
- Guo, J.; Fu, H.; Pan, B. Recent progress of residual stress measurement methods: A review. Chin. J. Aeronaut. 2021, 34, 54–78. [Google Scholar] [CrossRef]
Disclaimer/Publisher’s Note: The statements, opinions and data contained in all publications are solely those of the individual author(s) and contributor(s) and not of MDPI and/or the editor(s). MDPI and/or the editor(s) disclaim responsibility for any injury to people or property resulting from any ideas, methods, instructions or products referred to in the content. |
© 2025 by the authors. Licensee MDPI, Basel, Switzerland. This article is an open access article distributed under the terms and conditions of the Creative Commons Attribution (CC BY) license (https://creativecommons.org/licenses/by/4.0/).