Article

Effect of CMT Welding Heat Input on Microstructure and Mechanical Properties of Different Groove Angles for Al-6061-T6 Alloy Joint

1
Intelligent Manufacturing College, Jinhua University of Vocational Technology, Jinhua 321017, China
2
Zhejiang Academy of Special Equipment Science, Hangzhou 310009, China
3
Department of Architecture and Civil Engineering, University of Bath, Bath BA2 7AY, UK
*
Author to whom correspondence should be addressed.
Metals 2025, 15(12), 1290; https://doi.org/10.3390/met15121290
Submission received: 1 October 2025 / Revised: 12 November 2025 / Accepted: 16 November 2025 / Published: 25 November 2025
(This article belongs to the Special Issue Advances in Welding and Joining of Alloys and Steel)

Abstract

Air suspension components are critical elements of automotive chassis and are commonly fabricated by welding 6061-T6 aluminum using 4043 filler wire with the cold metal transfer (CMT) process. Variations in vehicle architecture necessitate different groove angles and matching parameter windows. This study aims to elucidate how groove angle and heat input govern weld quality to inform process optimization. Two groove angles (120° and 90°) were investigated under distinct heat-input conditions (denoted 120-H and 90-L). Characterization covered chemical composition, macroscopic morphology, porosity, microstructure, hardness, and mechanical properties. The key novelty lies in elucidating the relationship between liquation cracking and metal flow lines, which jointly govern crack propagation. Integrating evidence from porosity measurements, crack characterization, and numerical simulations indicates that the 120-H parameter set requires further optimization. Overall, the results underscore the pivotal roles of groove angle and heat input in CMT welding of 6061-T6 aluminum and provide a basis for process parameter optimization in air suspension manufacturing.

1. Introduction

Lightweighting is a key technological pathway in the automotive industry, aiming to reduce vehicle mass while maintaining safety and performance to improve fuel economy and energy efficiency [1,2,3]. For battery electric vehicles, mass reduction translates directly into extended driving range. Owing to their high specific strength (e.g., 6061-T6 exhibits ultimate tensile strength ≥ 310 MPa at a density of only 2.7 g/cm3), along with excellent corrosion resistance and formability, aluminum alloys have become the materials of choice for lightweight applications [4]. Among critical automotive components, the air suspension system—serving as the primary load-bearing and vibration-damping unit—must simultaneously meet the demands of lightweighting and high reliability; 6061-T6 is widely used in this domain due to its superior fatigue performance [5,6].
The cold metal transfer (CMT) process, developed by Fronius (Pettenbach, Austria), is a variant of metal inert gas/gas metal arc welding (MIG/GMAW) tailored for aluminum alloys [7,8]. It features a controlled short-circuit transfer governed by a high-frequency push–pull wire motion, which markedly reduces heat input to roughly 30% of that in conventional MIG. Owing to its low heat input and favorable bead formation, CMT is widely regarded as the preferred welding method for aluminum components in air suspension systems. Nevertheless, substantial variations in component geometry and wall thickness across manufacturers lead to divergent groove designs, necessitating targeted adjustment of welding parameters [9].
Research on CMT-welded AA6061-T6 joints is already substantial, covering process parameter optimization, microstructural characterization, and mechanical performance [1,5,9,10,11,12,13,14,15,16,17]. Nevertheless, important gaps persist. At the microstructural level, the evolution and spatial distribution of phases in Al–Si weld metal remain insufficiently resolved in a systematic, quantitative manner, and acid-etched microstructures are often reported qualitatively with ambiguous mechanistic interpretation [18,19,20,21]. In terms of mechanical properties, validation based on actual product geometries and service-relevant boundary conditions is limited; most studies rely on flat-plate butt joints, introducing extrapolation bias relative to in-service behavior [2,3,22]. Particularly lacking are systematic designs of the CMT parameter space for different groove geometries and the construction of robust process windows. Furthermore, the multiscale coupling between weld microstructure and mechanical response has not been rigorously elucidated or linked to measurable performance metrics. These deficiencies constrain the transferability and predictiveness of process optimization to engineering applications, highlighting the need for standardized sampling, quantitative microstructural analysis, and cross-scale mechanical characterization deployed in a coordinated framework.
This study systematically investigates, across controlled heat-input regimes, the influence of CMT welding parameters on the weld microstructure of AA6061-T6 (including grain size/constituent morphology, porosity, and solidification cracking) and on the resultant mechanical properties (ultimate tensile strength and hardness). We further elucidate the governing mechanisms that couple process conditions to microstructural evolution and, in turn, to mechanical response. The outcomes provide a quantitative basis and actionable guidance for optimizing welding procedures for aluminum air suspension components, with an emphasis on establishing robust process windows and improving performance predictability.

2. Methods

2.1. Manufacturing

Two groove geometries, 120° and 90°, were prepared for the base material and designated as 120-H and 90-L, respectively (see Figure 1d,e). The chemical compositions of the filler wire and the base metal are listed in Table 1 and are essentially the same for 120-H and 90-L. Welding was carried out using a Fronius CMT Advanced 4000 power source integrated with a KUKA robotic system (Pettenbach, Austria); the corresponding process parameters are provided in Table 2. Because the 120-H groove is wider, the travel speed was markedly reduced to increase the heat input, thereby ensuring adequate weld fill and minimizing lack of fusion or incomplete penetration. Based on the parameters in Table 2, the overall heat input for 120-H is approximately 1.5 times that for 90-L. At the 120° groove, the metal flow lines in the left and right base plates are clearly visible (highlighted by yellow dashed lines). The flow lines on the two sides exhibit different orientations, attributable to forging with different dies tailored to the sample geometry.

2.2. Characterization and Mechanical Test

Figure 1b,c illustrate the sampling locations for metallographic specimens. To obtain a comprehensive assessment of the weld along its full length, specimens were extracted from both the arc-start region and the steady-state welding region. The areas marked by red and cyan rectangles were sampled. Macroscopic observations were first conducted using a stereomicroscope to identify features such as porosity, cracks, and weld pool morphology, followed by microstructural characterization with optical microscopy (OM) and scanning electron microscopy (SEM). The chemical compositions of the base and weld metals were compared to assess metallurgical alterations introduced by welding, including element segregation, dilution, and potential loss of volatile constituents.
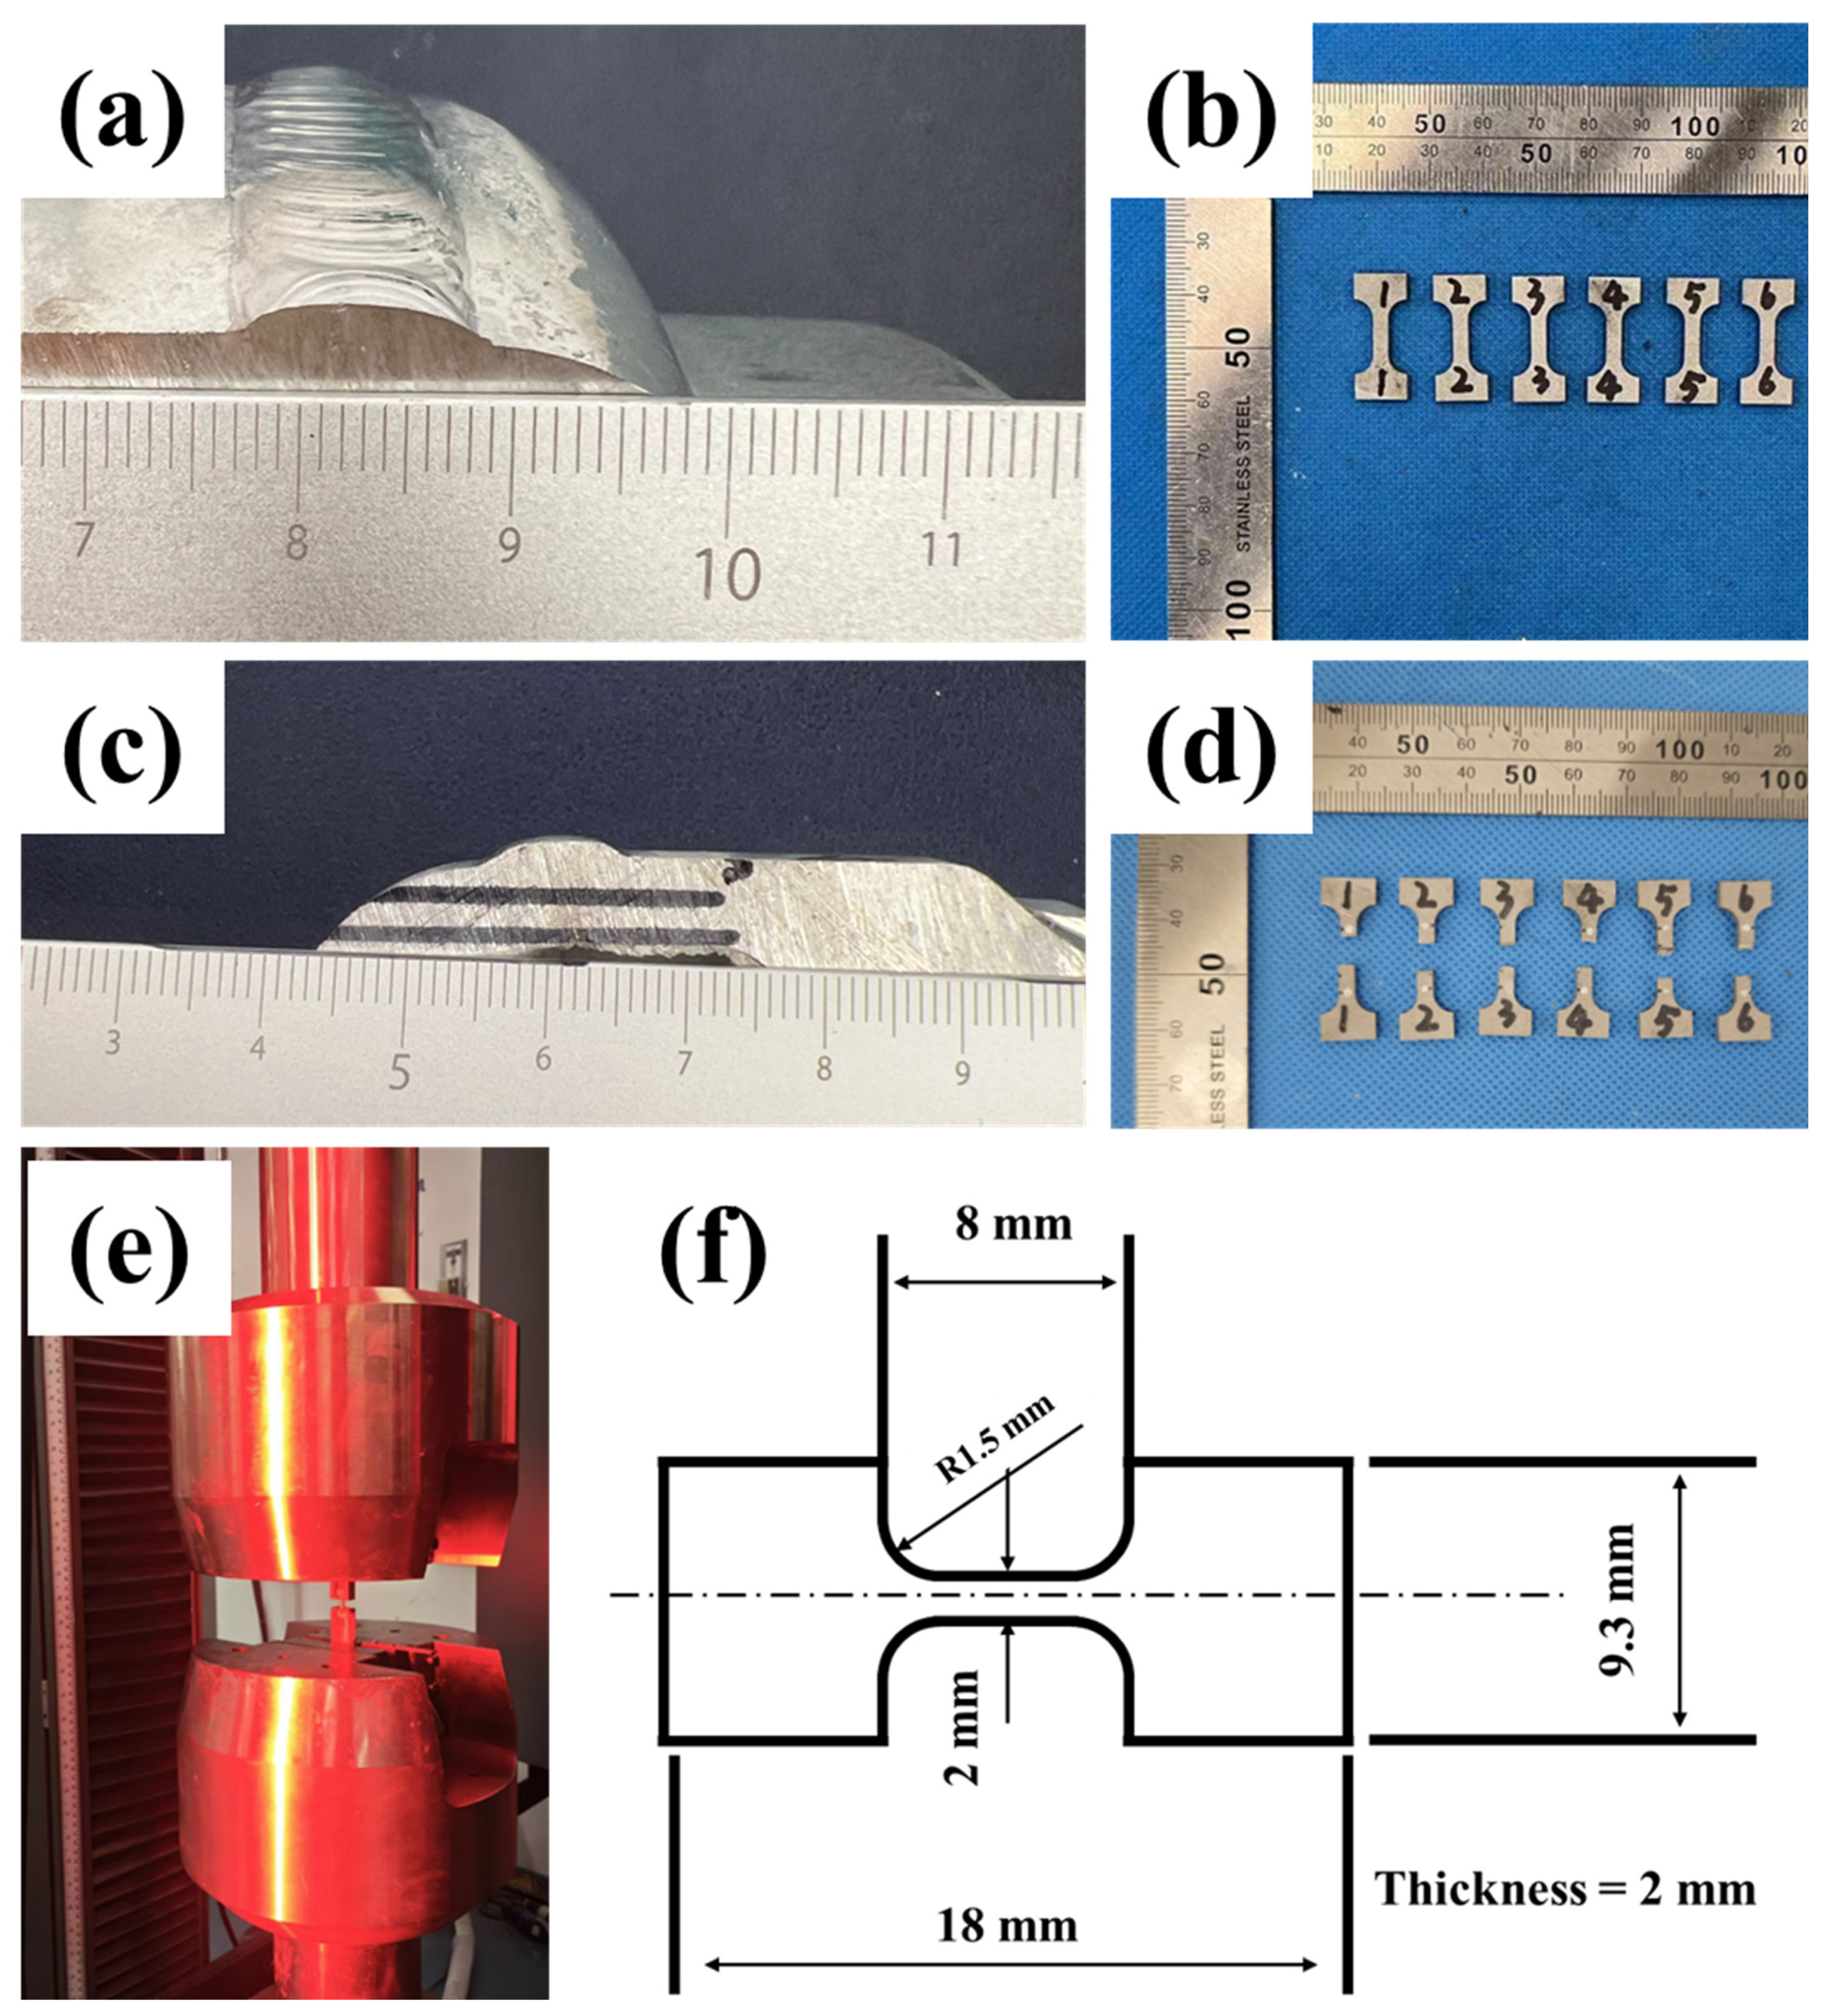
Mechanical testing of single-pass circumferential welds has been rarely documented. Most studies extract test samples from flat butt-welded plates, which differ from finished parts in geometry and constraint. Accordingly, tensile specimens were machined directly from the finished components (Figure 2a,c). Owing to the different groove angles, sampling difficulty varied: the 120° groove exhibits relatively shallow penetration, increasing the likelihood of incomplete penetration in extracted specimens. To mitigate this source of variability, six room-temperature tensile specimens were extracted from each part, and any specimen exhibiting evident lack of penetration or comparable defects was excluded in accordance with predefined validity criteria. Representative appearances before and after testing are shown in Figure 2b,d. The tensile procedure and specimen geometry are provided in Figure 2e,f.

2.3. Thermal Analysis

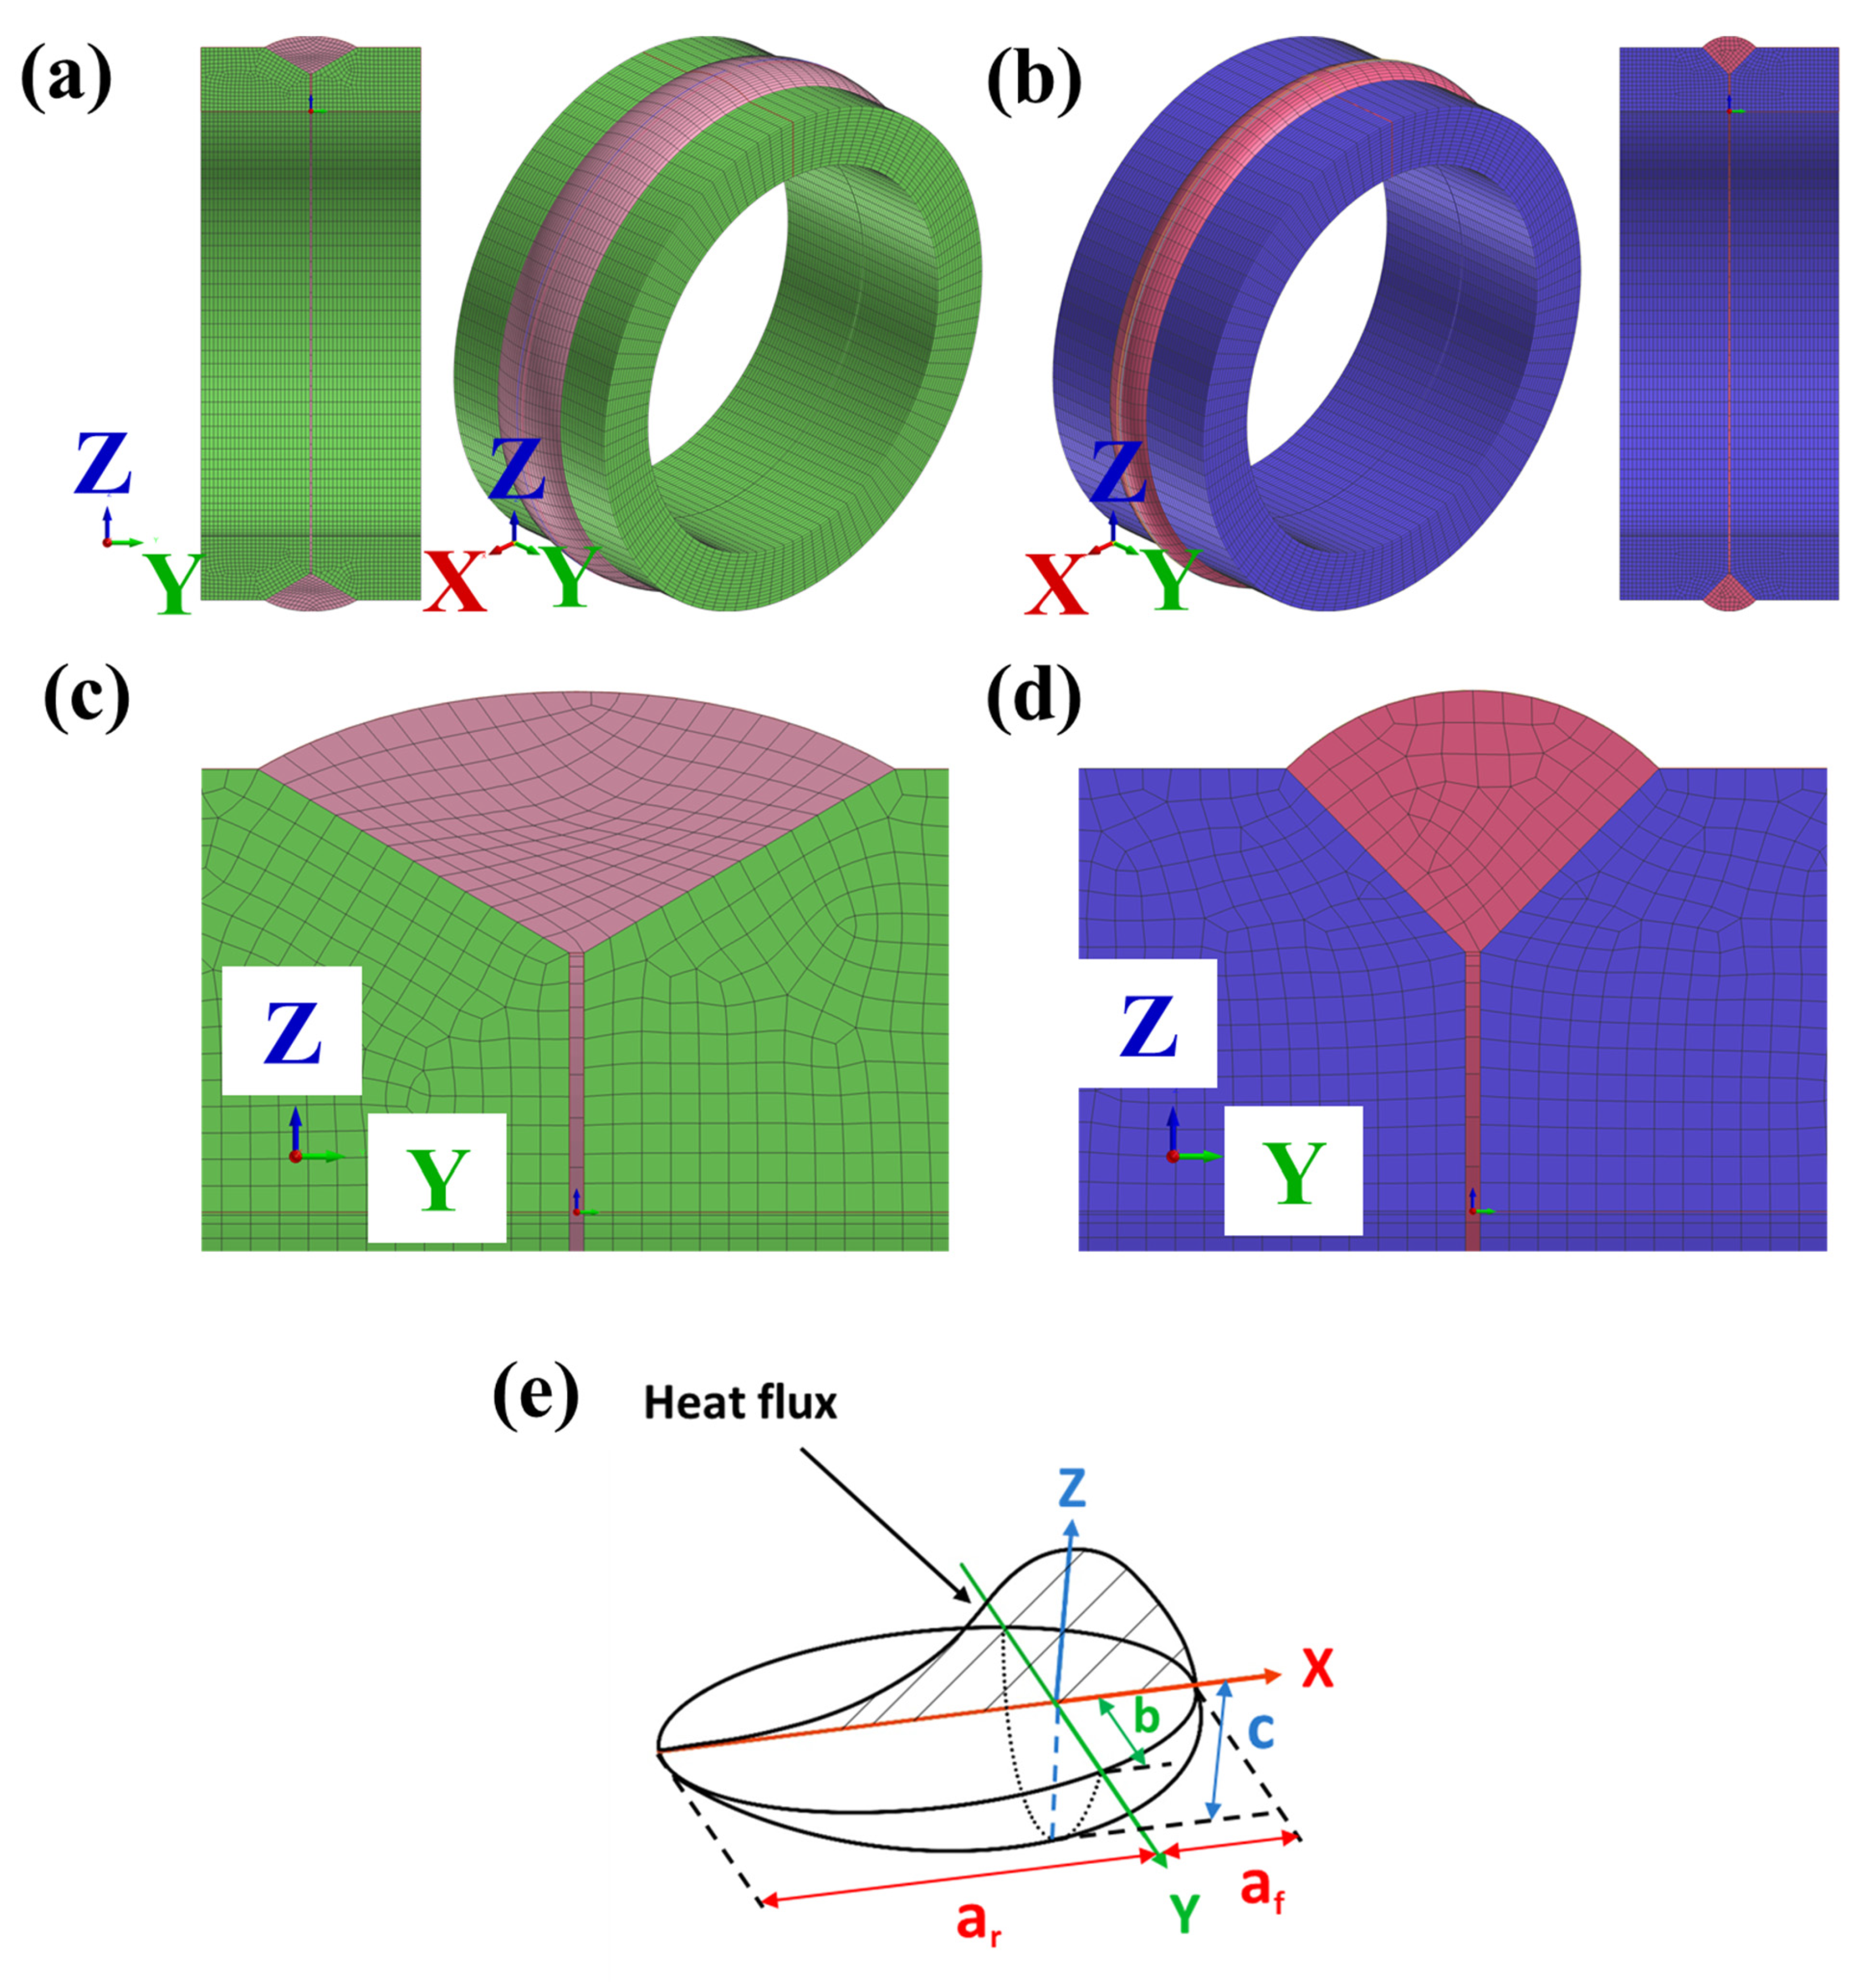
To simulate Al-Si alloy welding, a finite element thermal model was developed in SYSWELD (ESI Group, Paris, France). Figure 3 shows the meshed specimens with different groove angles of 120 and 90 degrees, consistent with the experimentally observed morphology. The height and width of the weld pool shape in the model were matched to measurements obtained from the weld metal. The mesh geometry was hexahedral-dominant, with a characteristic element size of approximately 0.4 mm. The mesh was constructed predominantly with hexahedral elements and a minimal number of pentahedral elements, as hexahedra generally provide superior accuracy and convergence compared with tetrahedra in finite element analyses. The final discretization comprised 198 one-dimensional elements, 15,500 two-dimensional elements, and 86,900 three-dimensional elements. Moreover, at least eight 3D elements were ensured within each weld pool region. The parameters used to construct the model are listed in Table 3. During CMT welding, heat input was represented by a double-ellipsoidal (Goldak) heat source. The corresponding power densities in the front and rear quadrants, q f x , y , z and q r x , y , z , are defined by Equations (1) and (2) [23]:
q f x , y , z = 6 3 f f Q a f b c π π · e 3 x 2 a f 2 · e 3 y 2 b 2 · e 3 z 2 c 2
q r x , y , z = 6 3 f r Q a r b c π π · e 3 x 2 a r 2 · e 3 y 2 b 2 · e 3 z 2 c 2
Here, Q is the effective heat power (W) given by Q = η U I, where η is the process efficiency, U the arc voltage (V), and I the current (A). The coefficients f f and f r are the fractional weights for the front and rear ellipsoids, respectively, with f f + f r = 2. The parameters a f , a r , b , and c are the semi-axes that define the front/rear lengths, width, and depth of the double ellipsoid, respectively. The variables x , y , and z denote the local model coordinates.
To simplify the thermal analysis, the following assumptions were made:
  • The initial temperature was 20 °C.
  • Fluid flow within the molten pool was neglected.
  • Heat exchange with the environment was modeled as convection and radiation from exposed surfaces to ambient air at 20 °C.

3. Results

3.1. Chemical Composition

The chemical compositions of the base metal and weld metal were measured by inductively coupled plasma optical emission spectrometry (ICP-OES) as shown in Table 4. The results indicate that, except for Si, most elemental concentrations in the weld metal are lower than those in both the base metal and the filler metal, primarily due to high-temperature evaporation, burn-off, and oxidation/volatilization during welding. In contrast, the Si content increases relative to the base metal because the 4043 filler is Si-rich. A comparison between the 120-H and 90-L heat-input conditions shows comparable residual elemental levels, suggesting that, between different heat inputs, the influence on elemental burn-off is limited.

3.2. Macrostructure

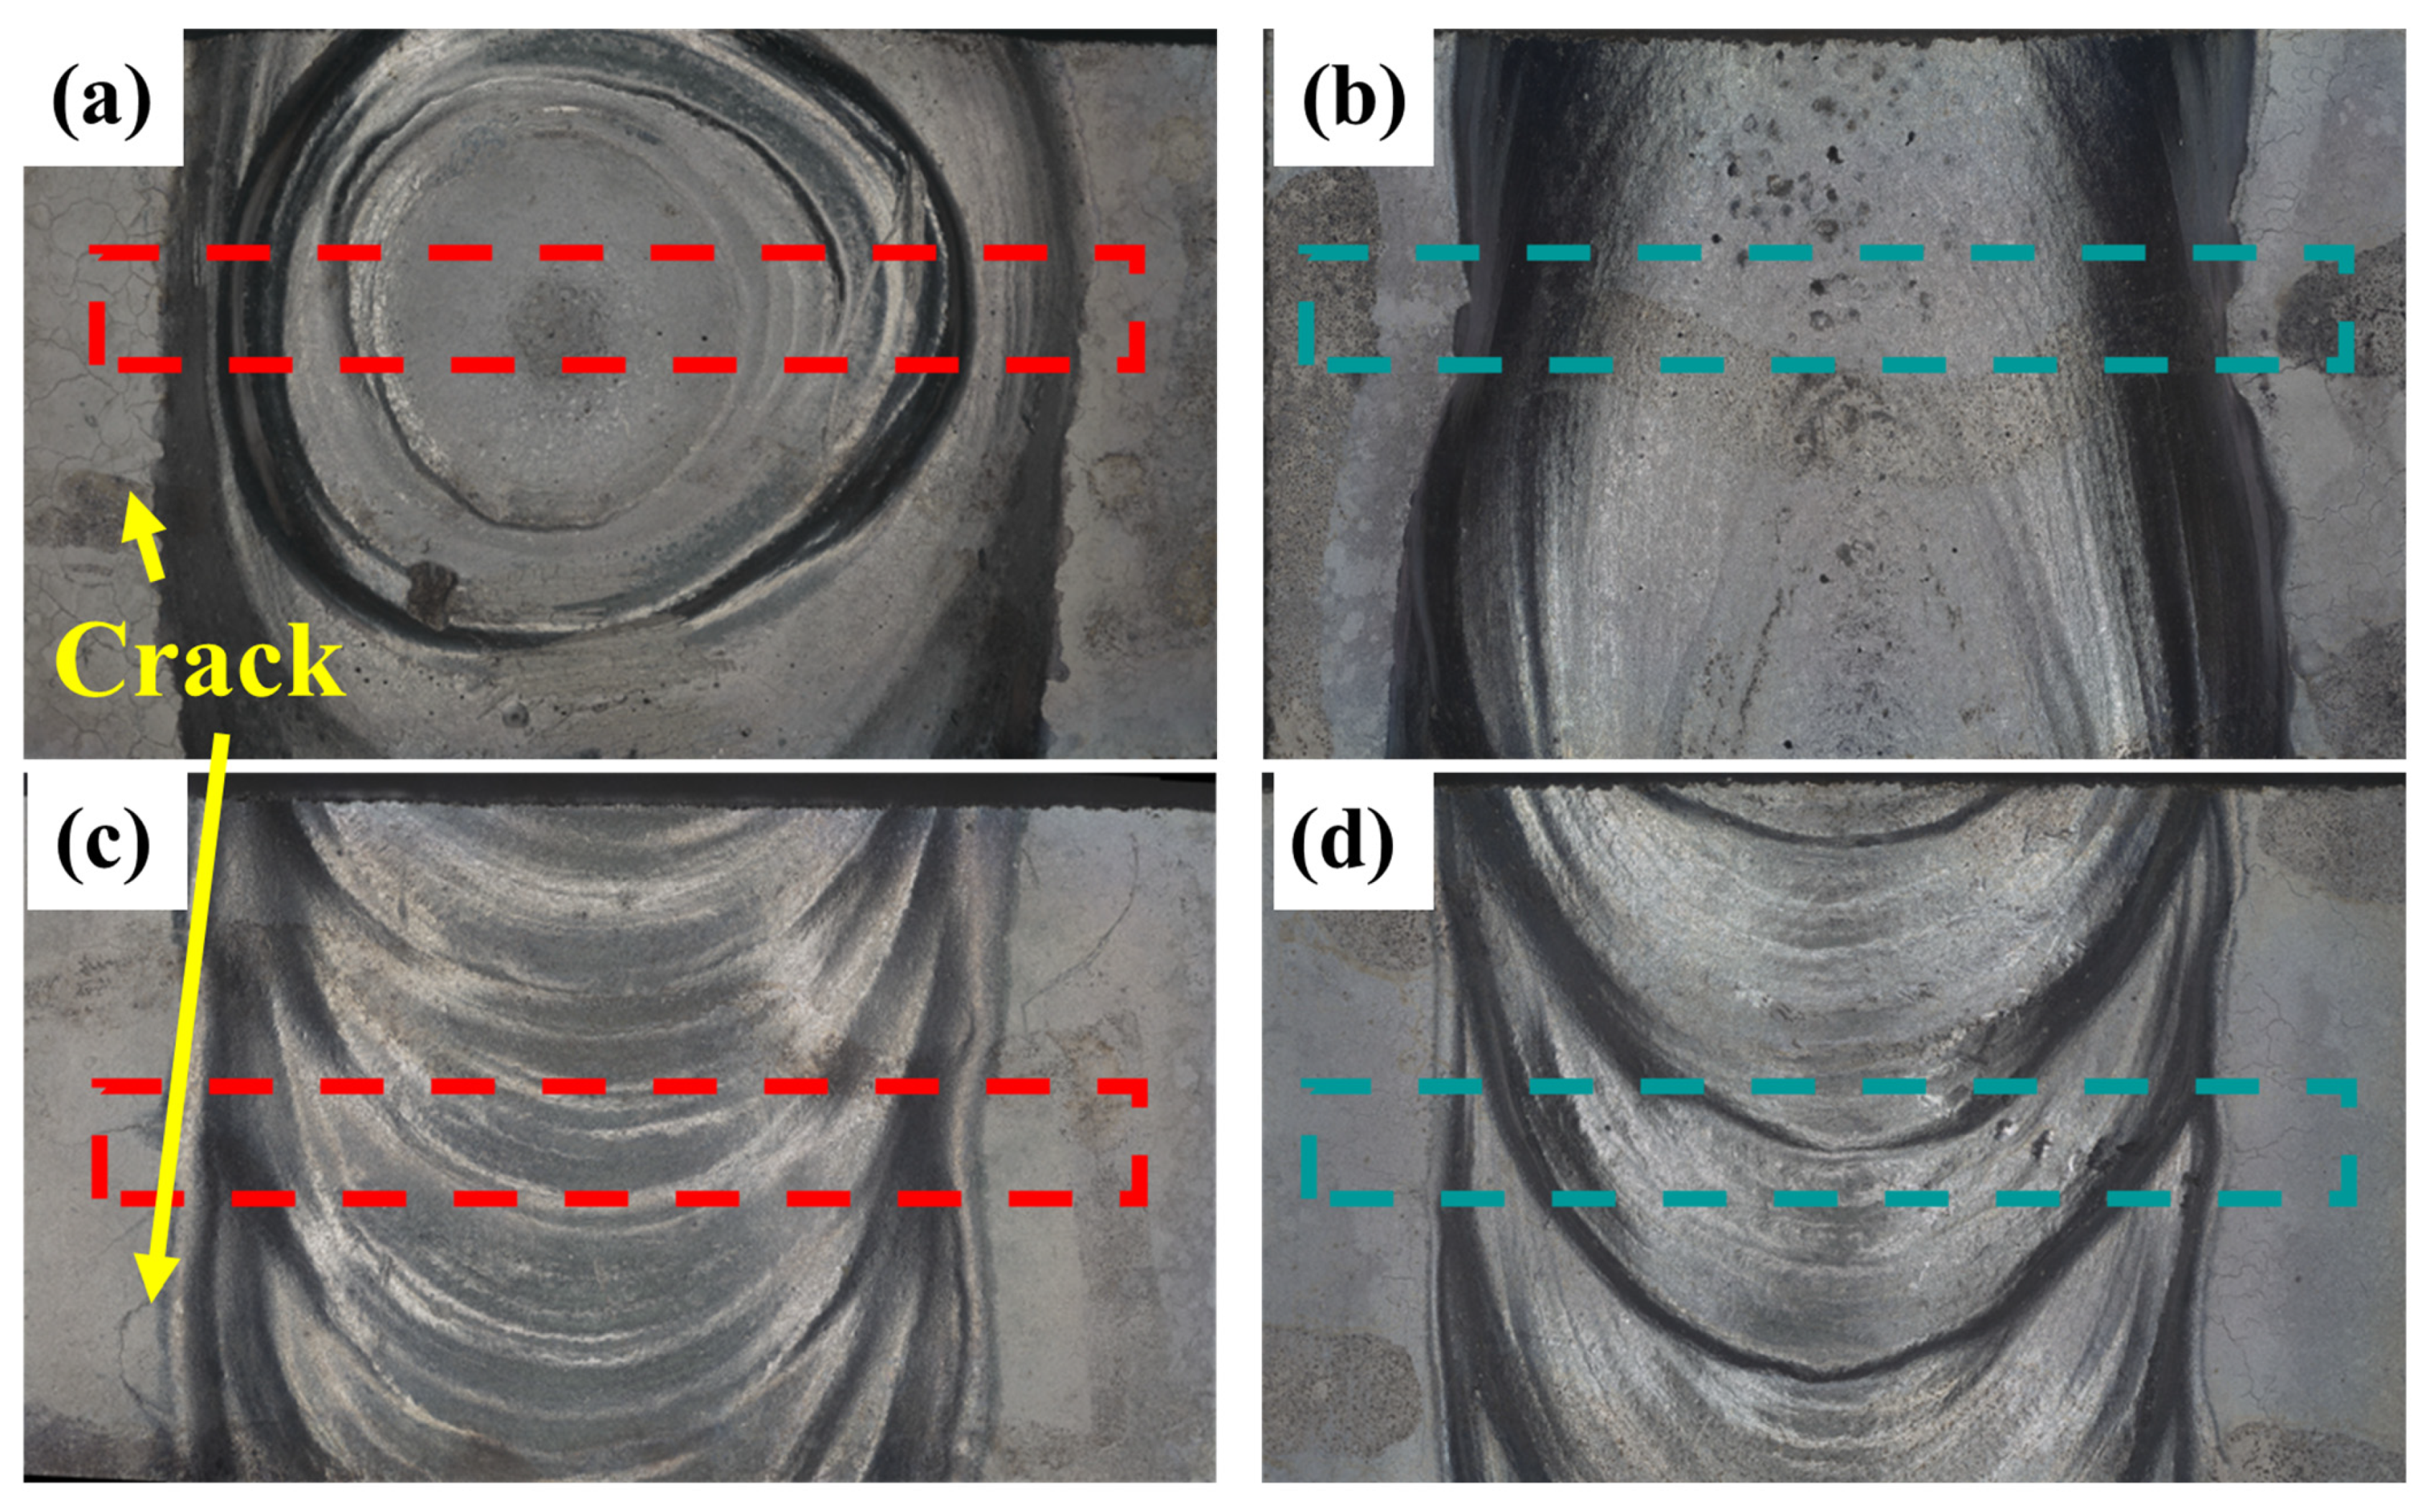
Figure 4 presents the macrostructures of welds produced under different heat inputs. Red and cyan dashed rectangles indicate the locations selected for subsequent microstructural examination. Figure 4a,b correspond to the 120-H specimen with higher heat input, with Figure 4a showing the arc-start region and Figure 4b the steady-state weld region; Figure 4c,d represent the lower-heat-input 90-L condition. Macroscopic cracks are more numerous in Figure 4a,b than in Figure 4c,d, and they are more prevalent at the arc start (Figure 4a) than in the steady-state region (Figure 4b). These cracks are located in the heat-affected zone (HAZ) and exhibit features consistent with liquation cracking, which initiates near the end of solidification under shrinkage and/or tensile stresses. Because higher heat input increases liquation-cracking susceptibility, the 120-H samples show more cracks than the 90-L samples, and the arc-start region exhibits more cracking than the steady-state region.
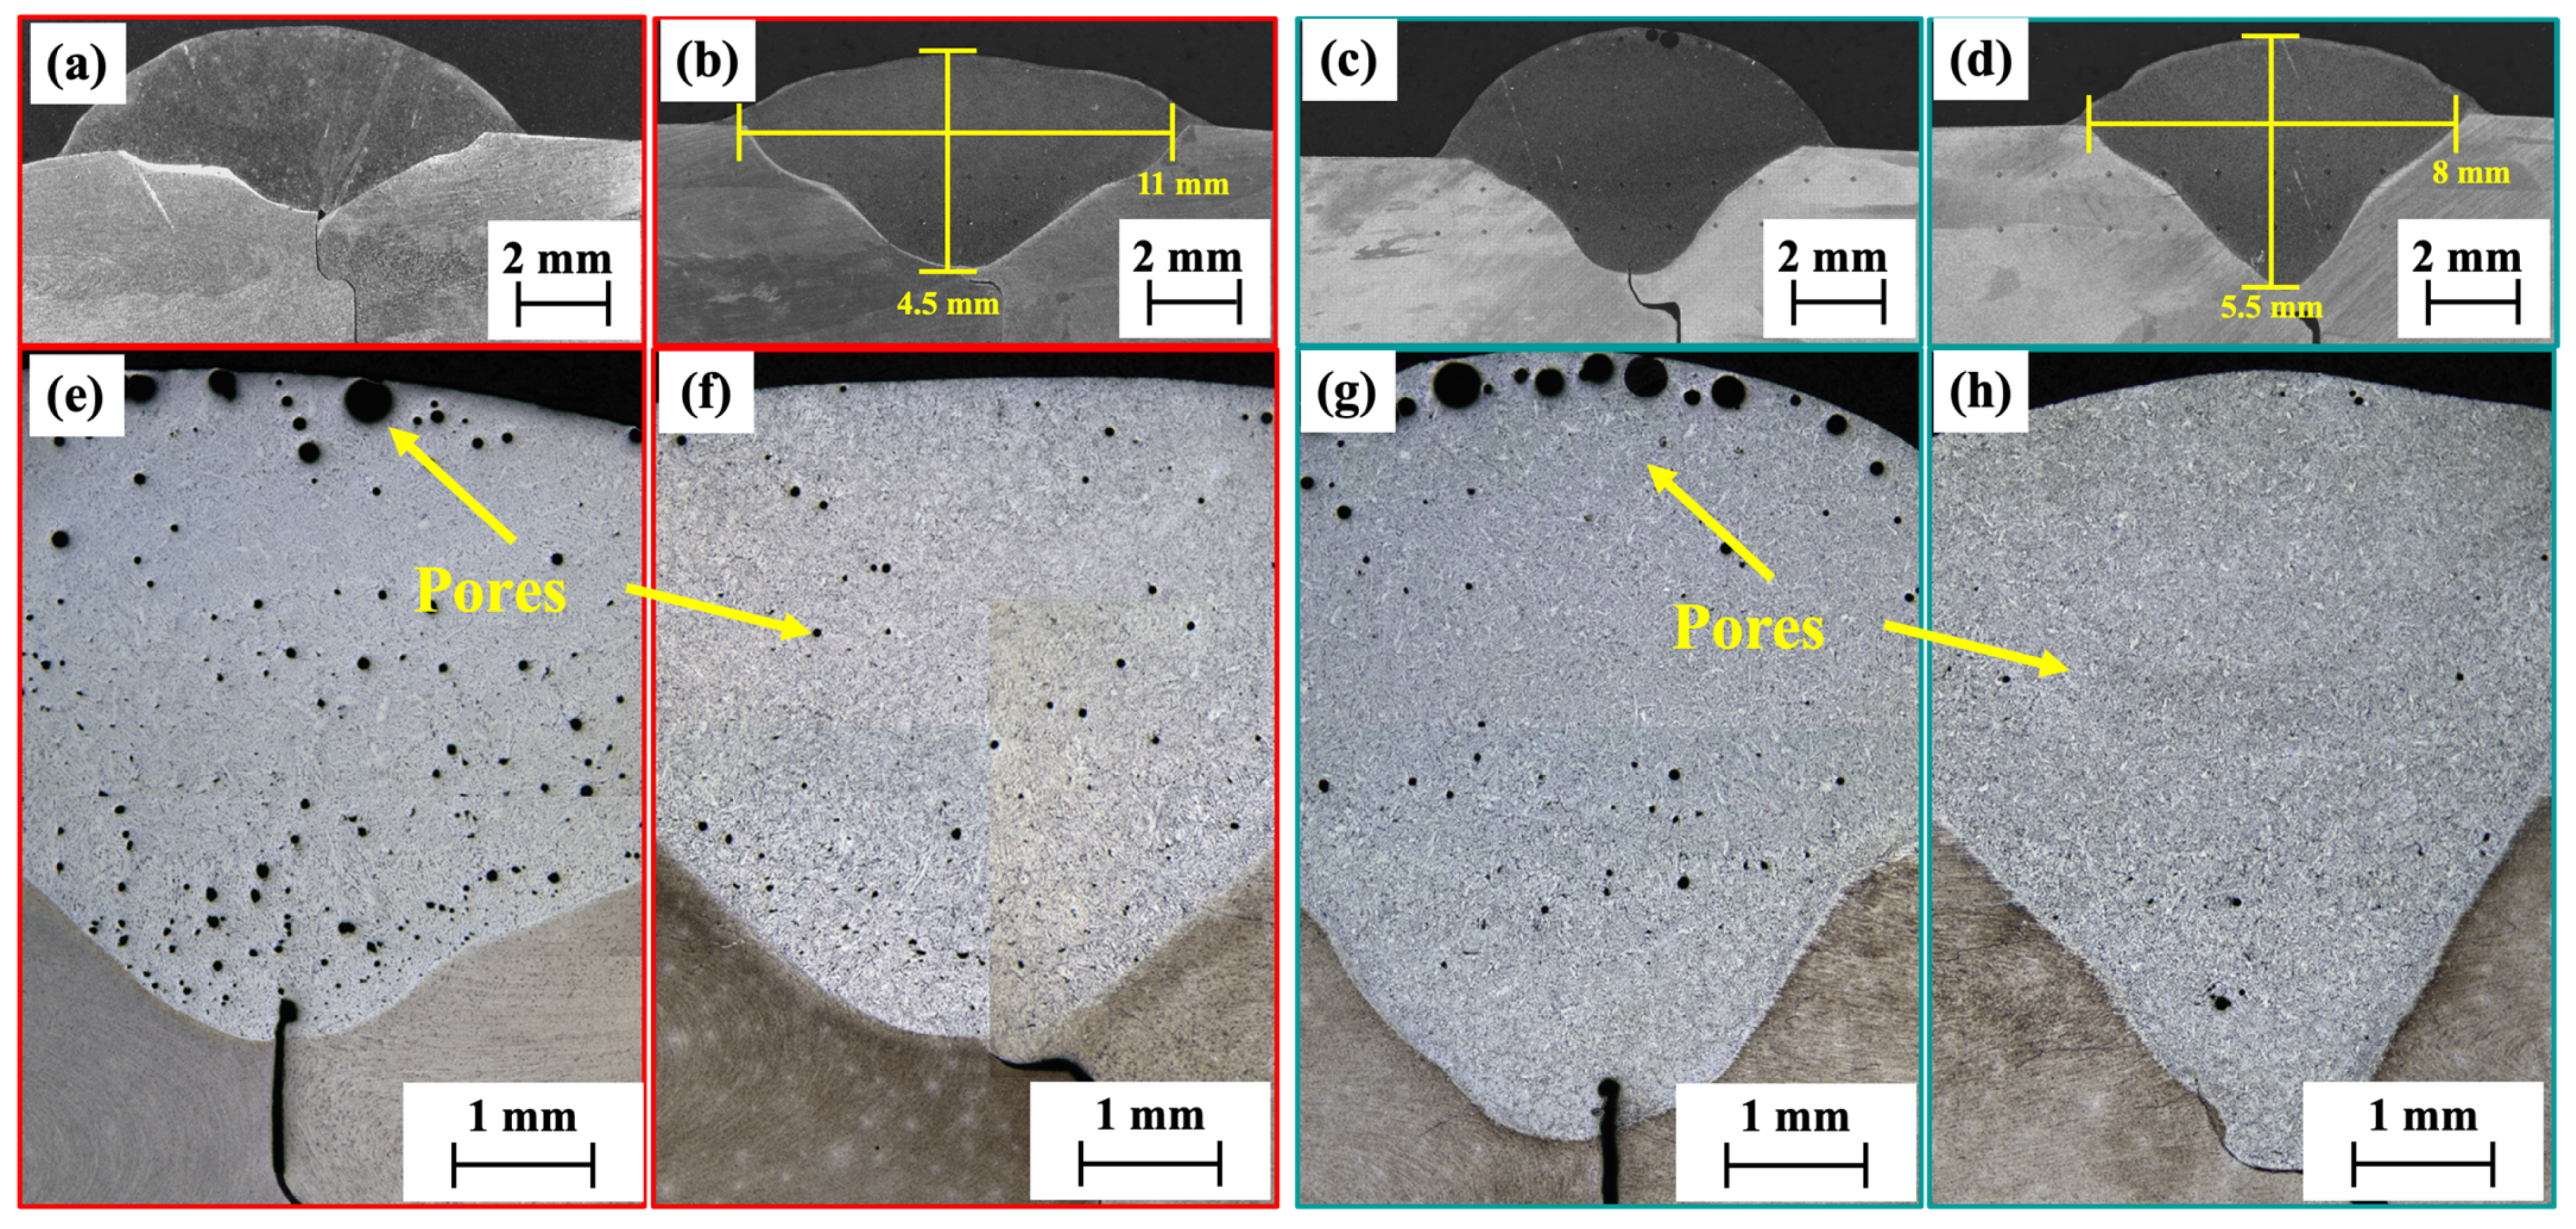
Figure 5 shows the weld pool morphology and porosity under different heat inputs. Figure 5a–d are stereomicroscope macrographs used to assess weld-pool width and penetration depth, whereas Figure 5e–h are optical-microscopies (OM) that reveal pores and microstructural features over a larger field of view. Relative to 90-L, the 120-H condition produces a wider shallower weld pool. At lower magnification of microstructure, porosity is markedly higher in the arc-start region than in the steady-state region. This is attributed to transient arc ignition with higher heat input and less stable shielding, which increases hydrogen pickup in liquid aluminum; upon solidification, the sharp decrease in hydrogen solubility promotes pore formation. Once steady state is reached, porosity is substantially lower for 90-L than for 120-H, consistent with prior findings [24] that reduced heat input mitigates hydrogen-induced porosity in aluminum welding.

3.3. Microstructure

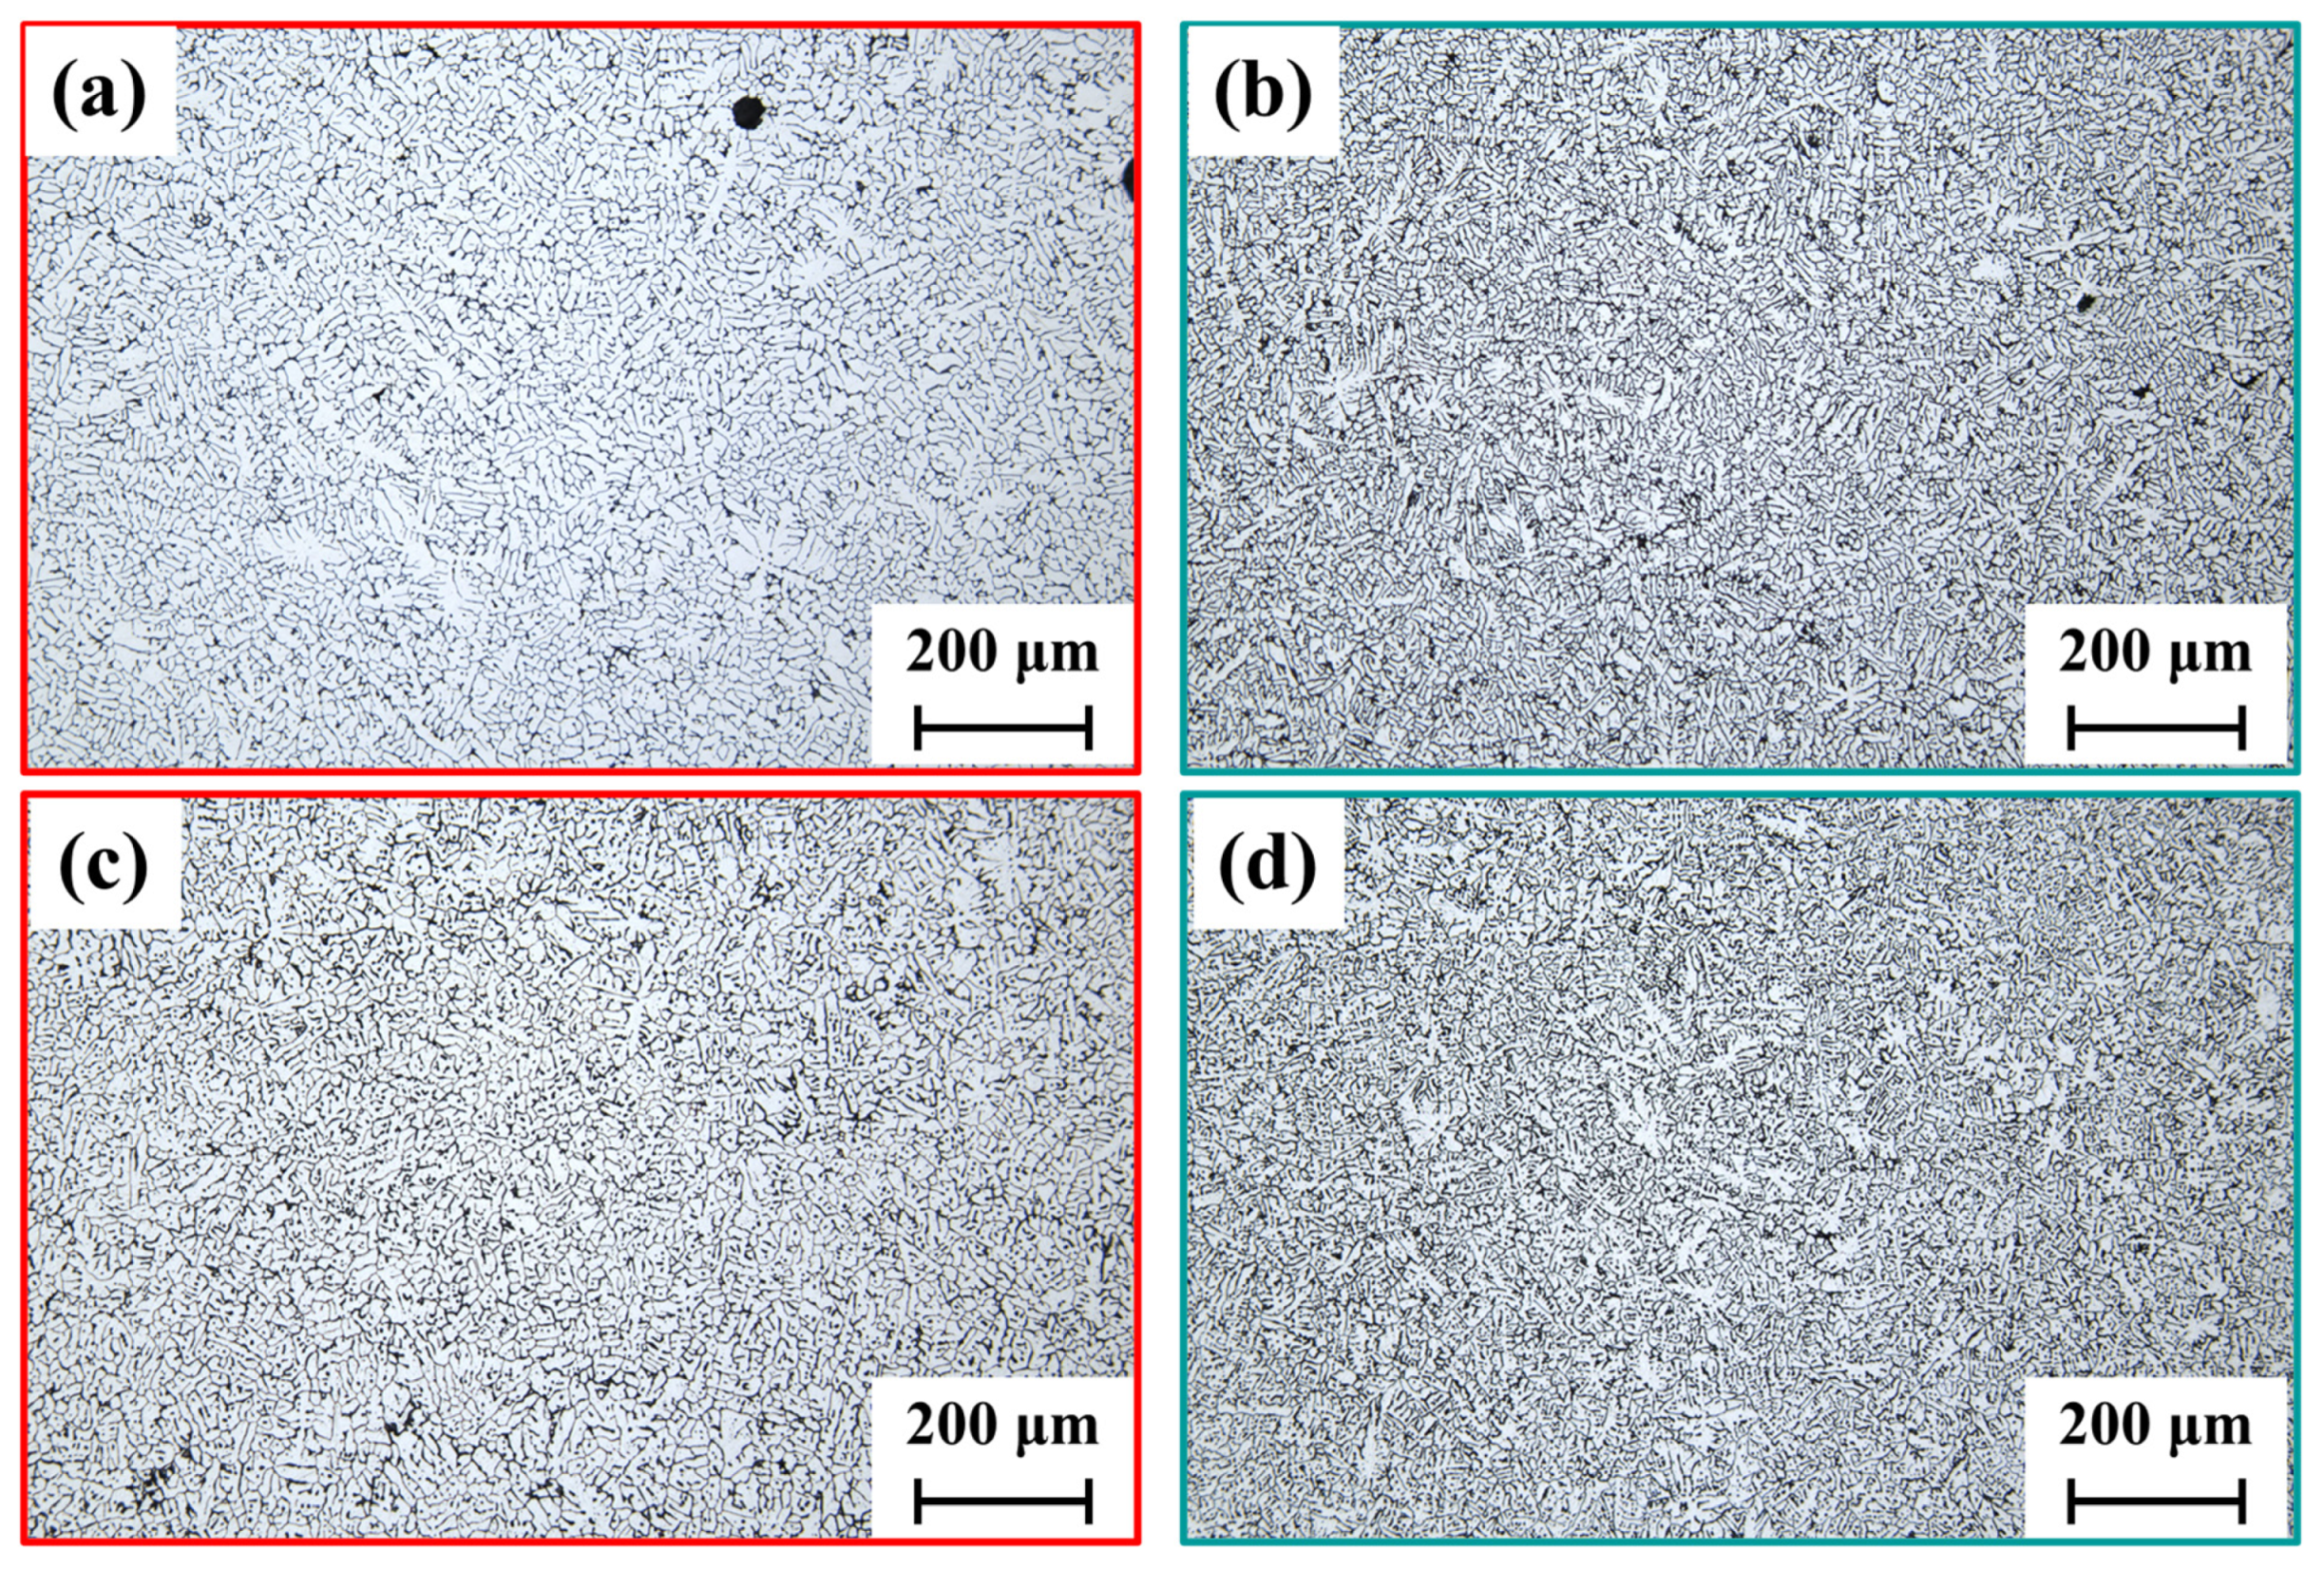
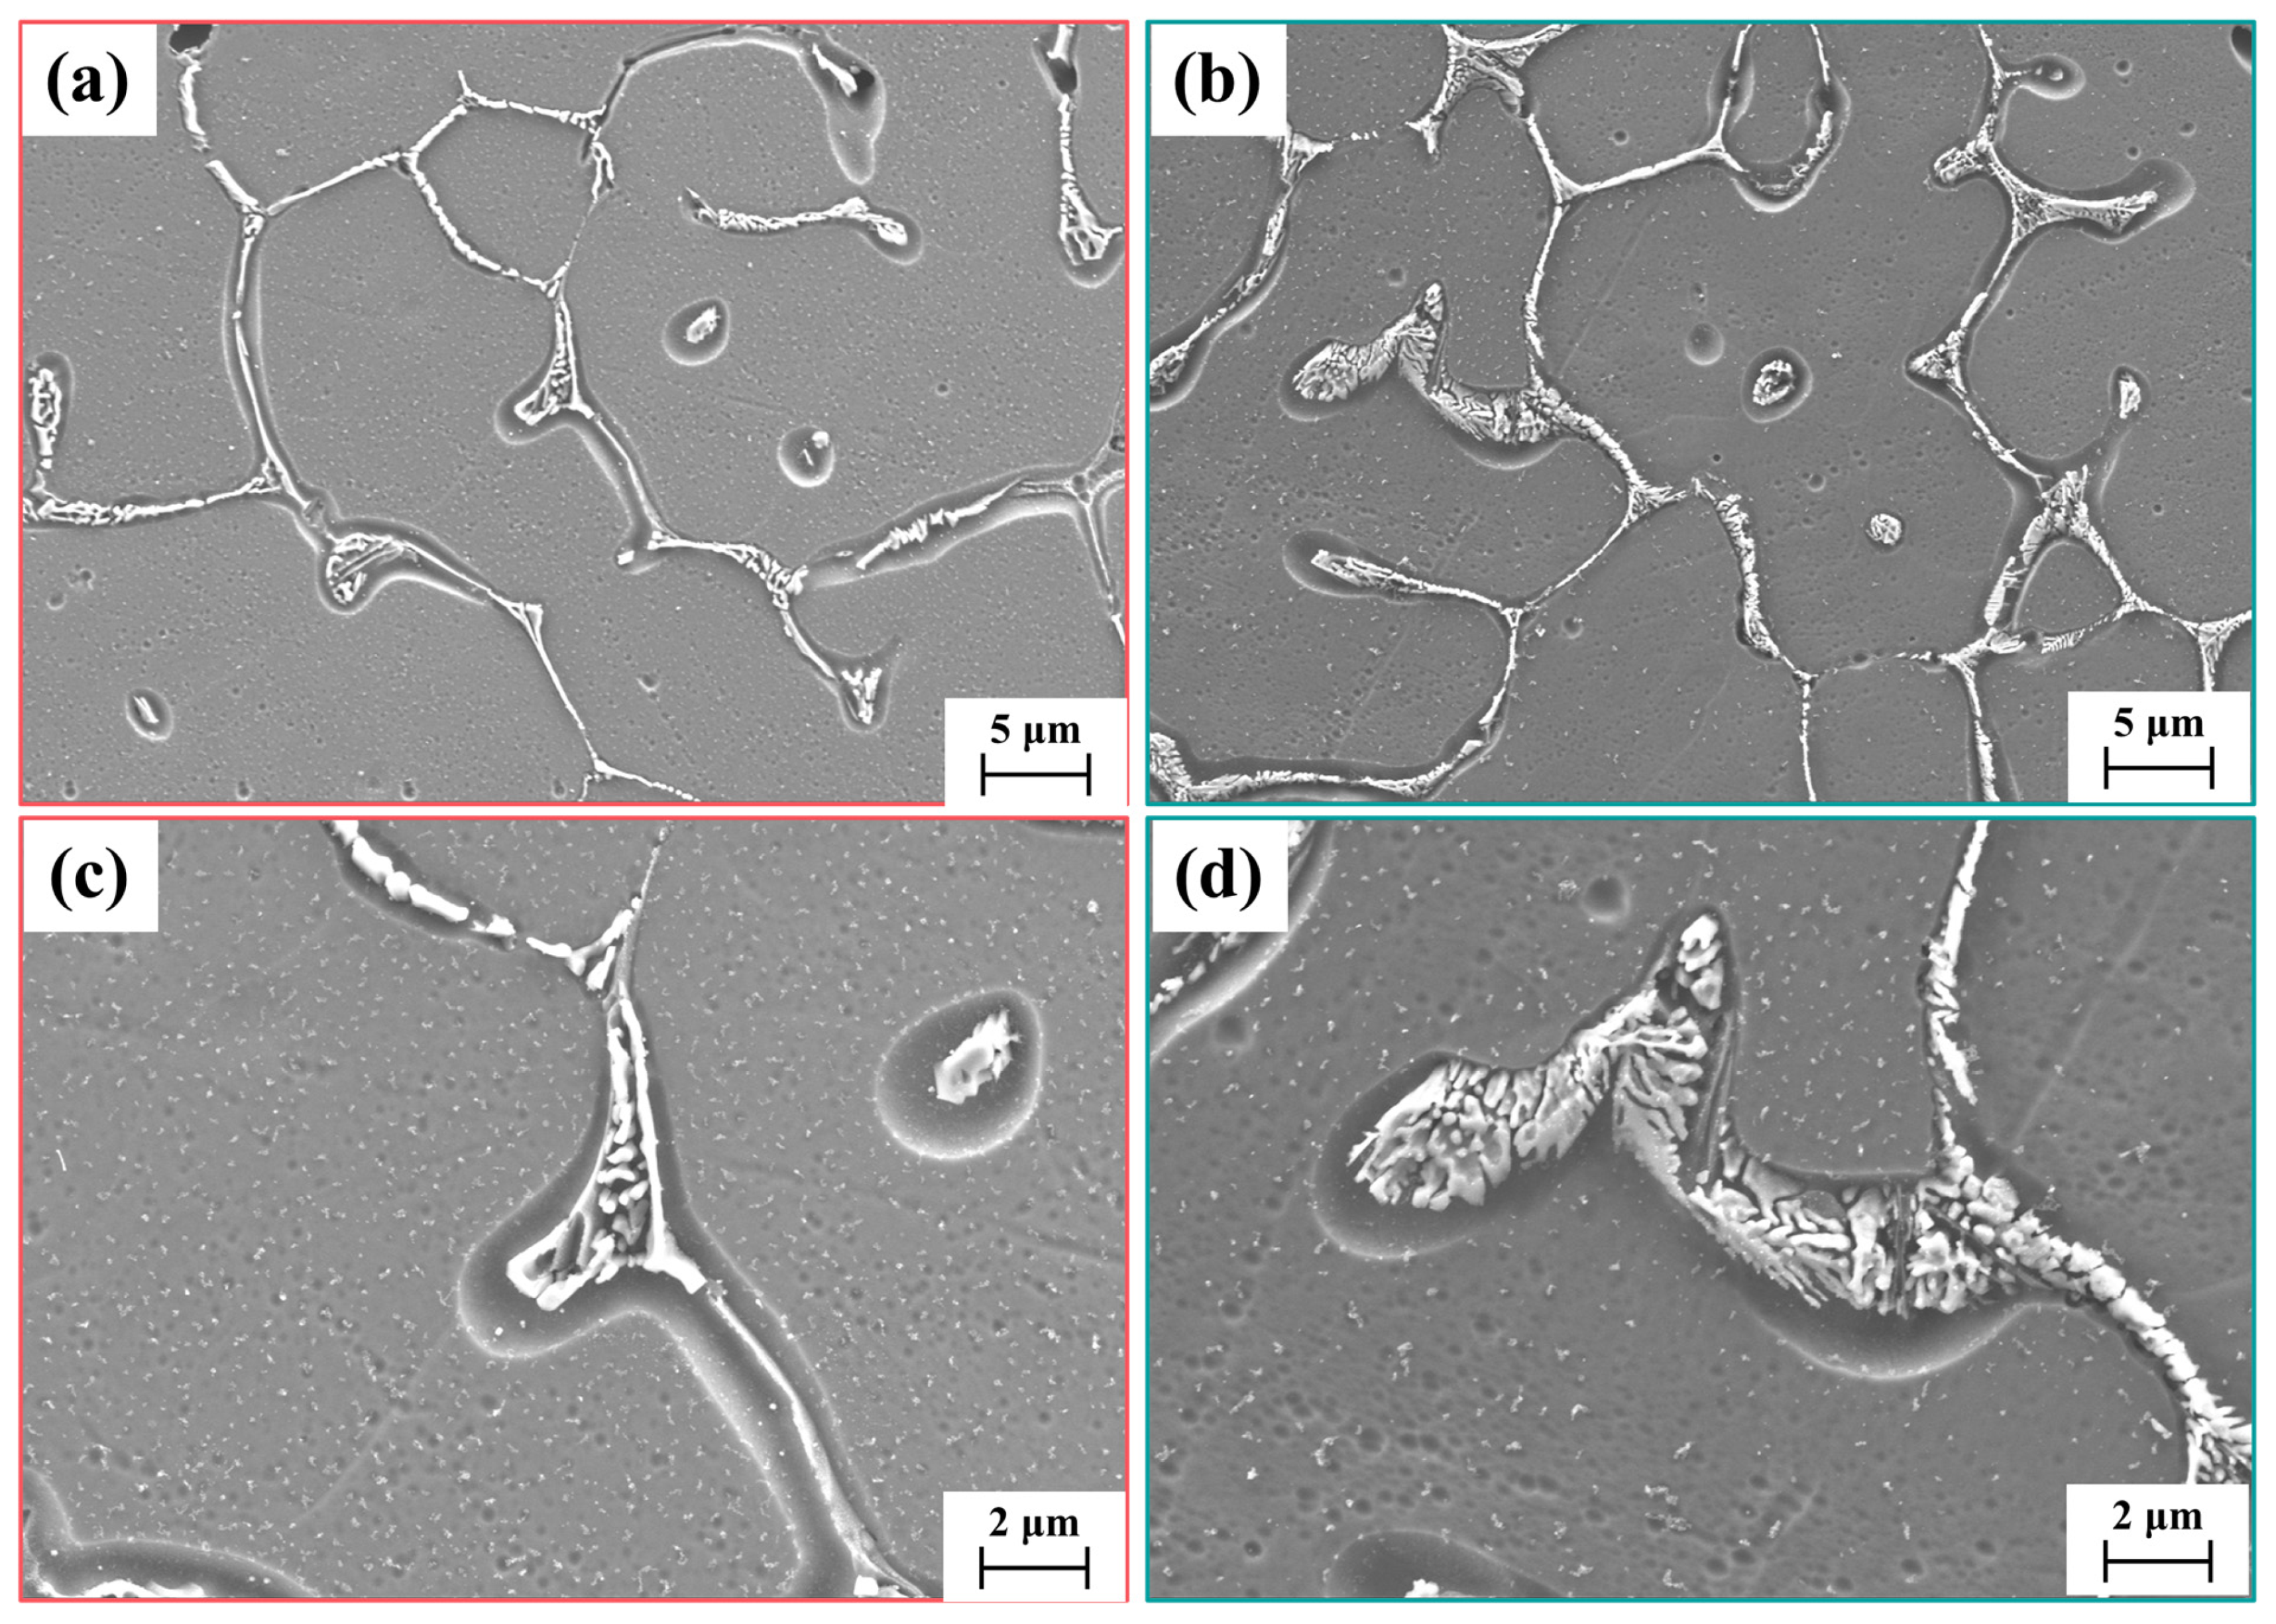
Figure 6 presents the microstructures of the 120-H and 90-L conditions at the arc-start and steady-state stages. Figure 6a,b correspond to the arc-start stage, whereas Figure 6c,d represent steady-state welding. The Al–Si weld exhibits a dendritic morphology, the bright regions are α-Al, and the dark regions are the eutectic Si, predominantly occupying interdendritic areas. Overall, the dendrite arm spacing (DAS) in Figure 6a,b is markedly larger than that in Figure 6c,d, attributable to the higher instantaneous heat input and reduced cooling rate during arc beginning. Under steady-state conditions, the 120-H weld shows a noticeably coarser DAS than 90-L because the larger groove angle necessitated a higher heat input. Corresponding SEM micrographs for the regions in Figure 6c,d are provided in Figure 7. At high magnification, the eutectic Si exhibits two characteristic morphologies: intergranular networks along grain boundaries and intragranular/interdendritic colonies. In both cases, the eutectic appears coarser in the 90-L specimens than in the 120-H specimens, as observed in this study. Given that the eutectic is substantially harder than α-Al, its volume fraction and characteristic length scale are key determinants of the mechanical property. Further mechanistic analysis is provided in the Section 4.

3.4. Hardness and Tensile Test

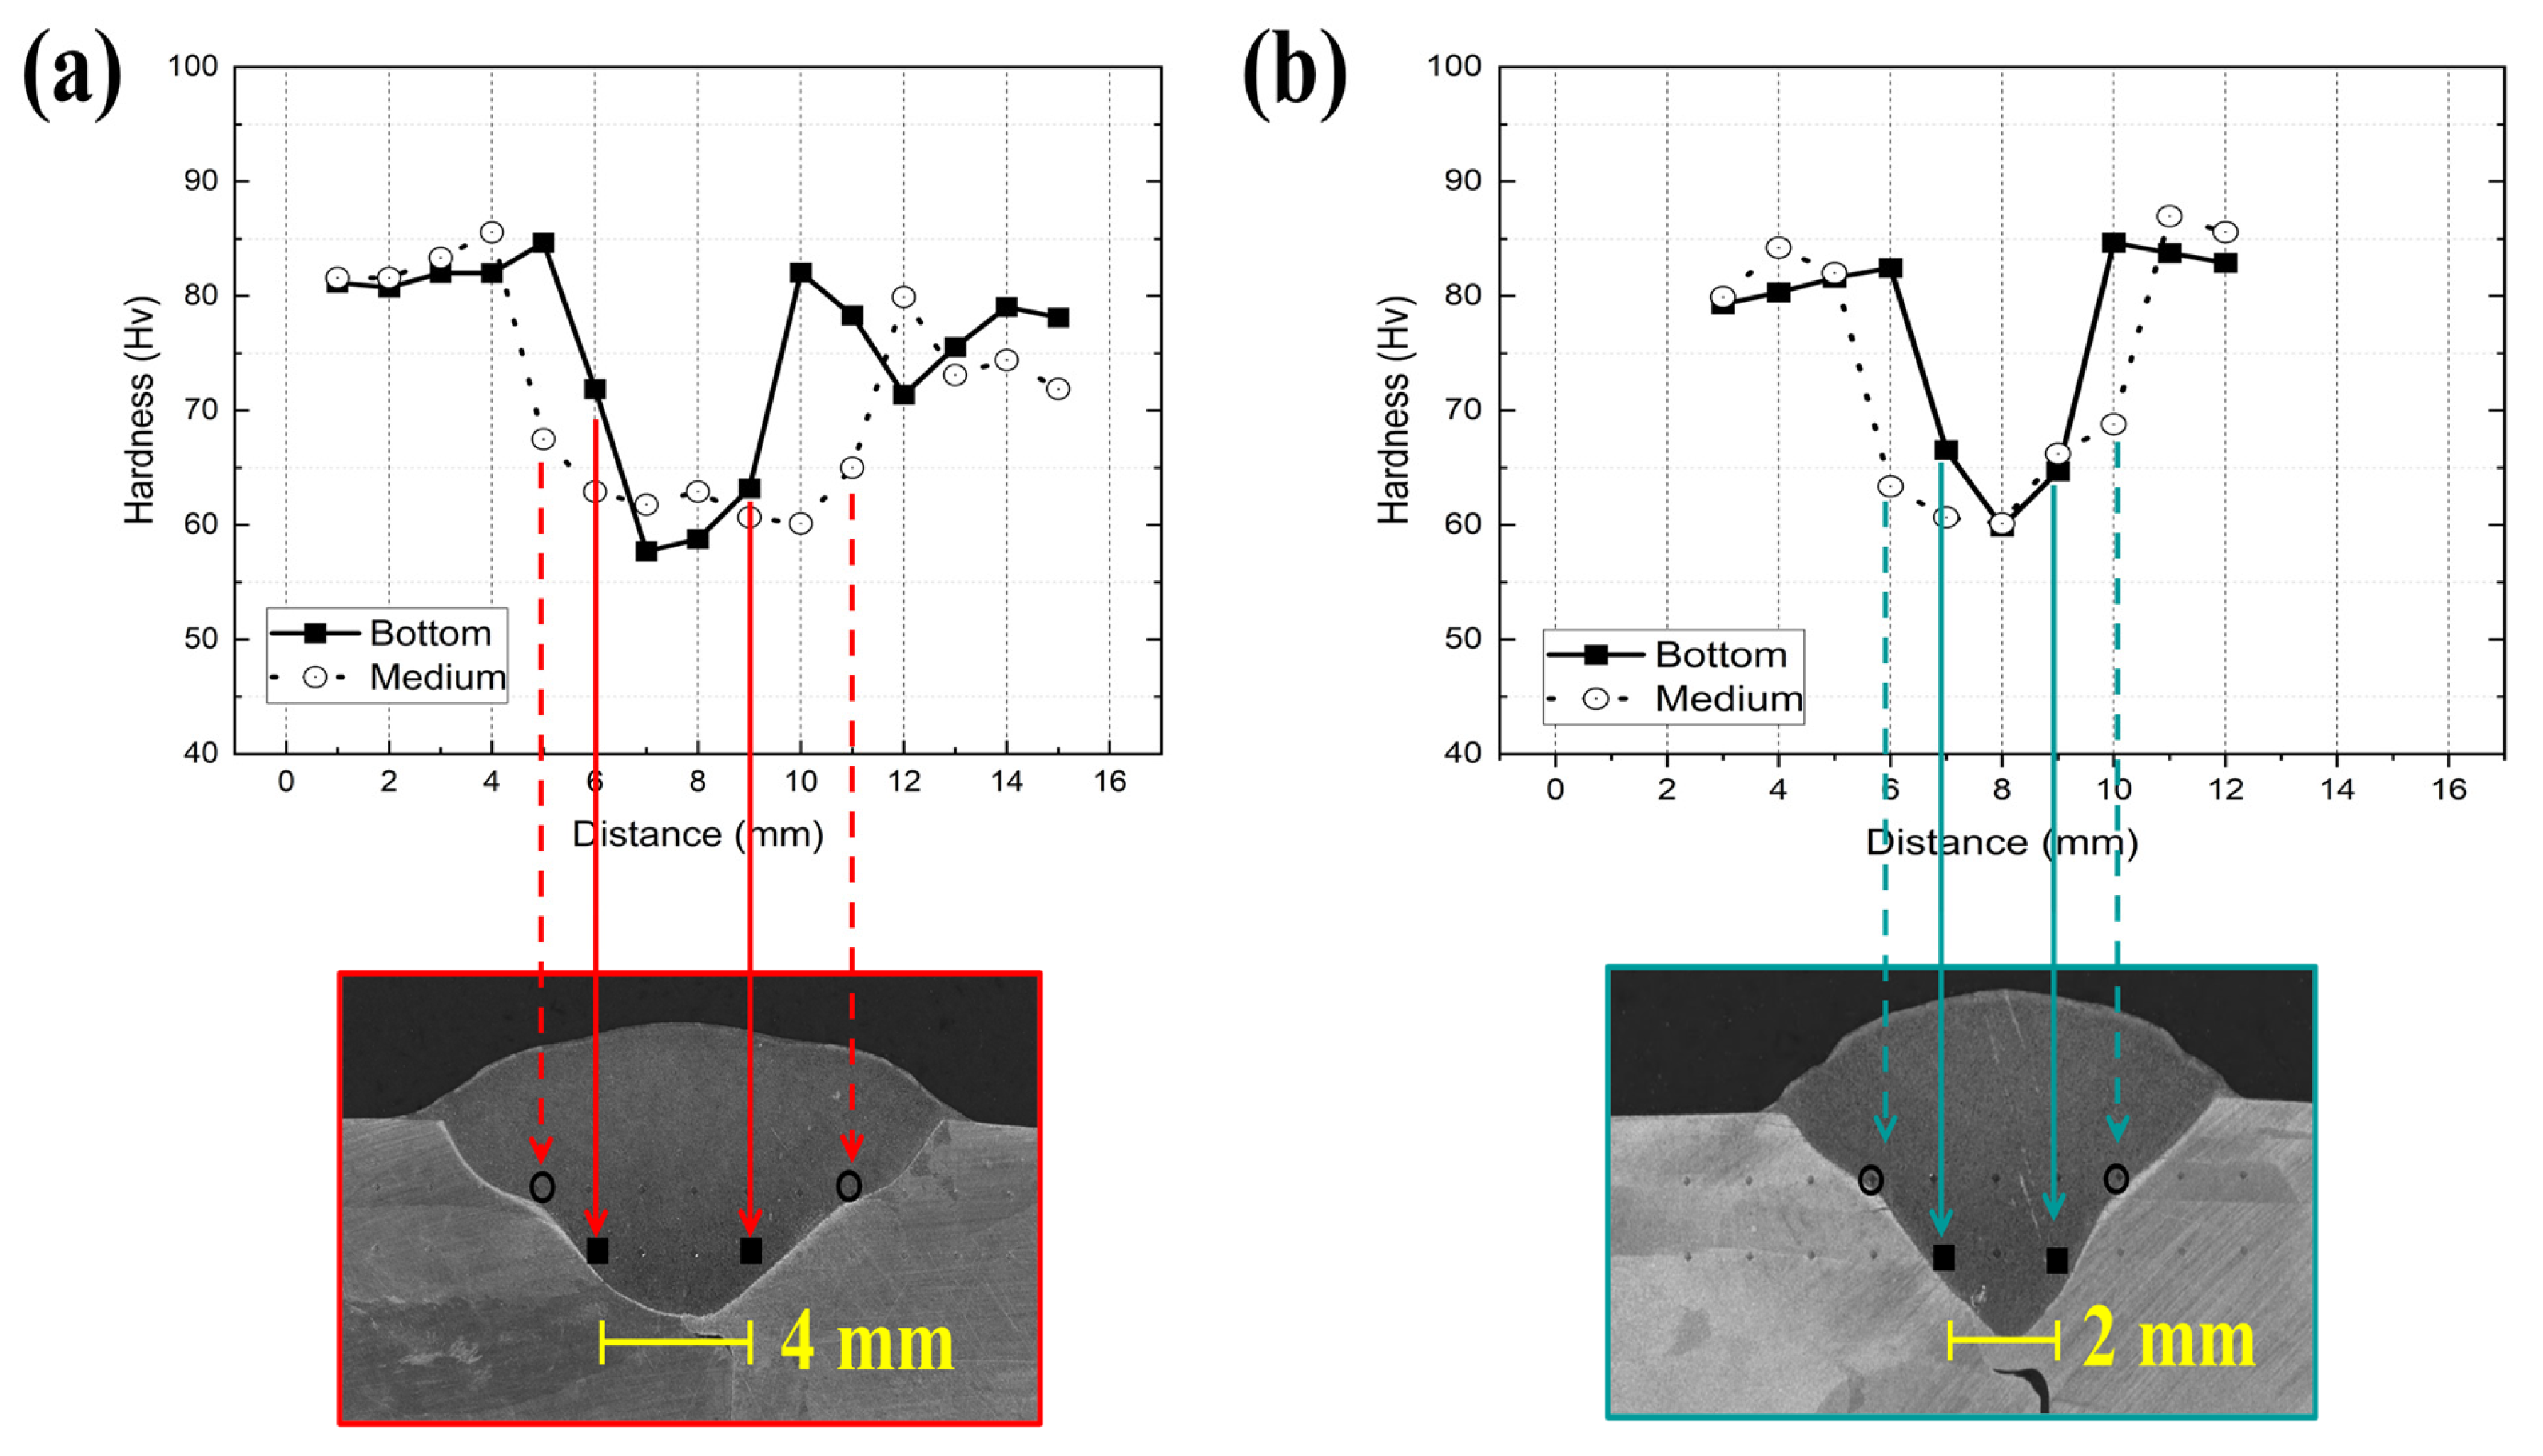
Figure 8 shows the Vickers hardness (HV) distribution across the weld and base metal. Measurements were taken from the base-metal side at 1 mm intervals; open circles denote mid-section hardness values and solid squares denote values at the weld root. For the 4043 Al–Si filler weld, the hardness is about 60 HV, with negligible difference between 120-H and 90-L. The 6061-T6 base metal exhibits a hardness of approximately 75 HV, consistent with its T6 heat treatment. The hardness value also identifies the weld-pool shape: at ~1 mm above the root, the weld width expands from ~3 mm to ~6 mm under 120-H, and from ~2 mm to ~4 mm under 90-L, in full agreement with the macro-morphology of the 120° and 90° groove welds.
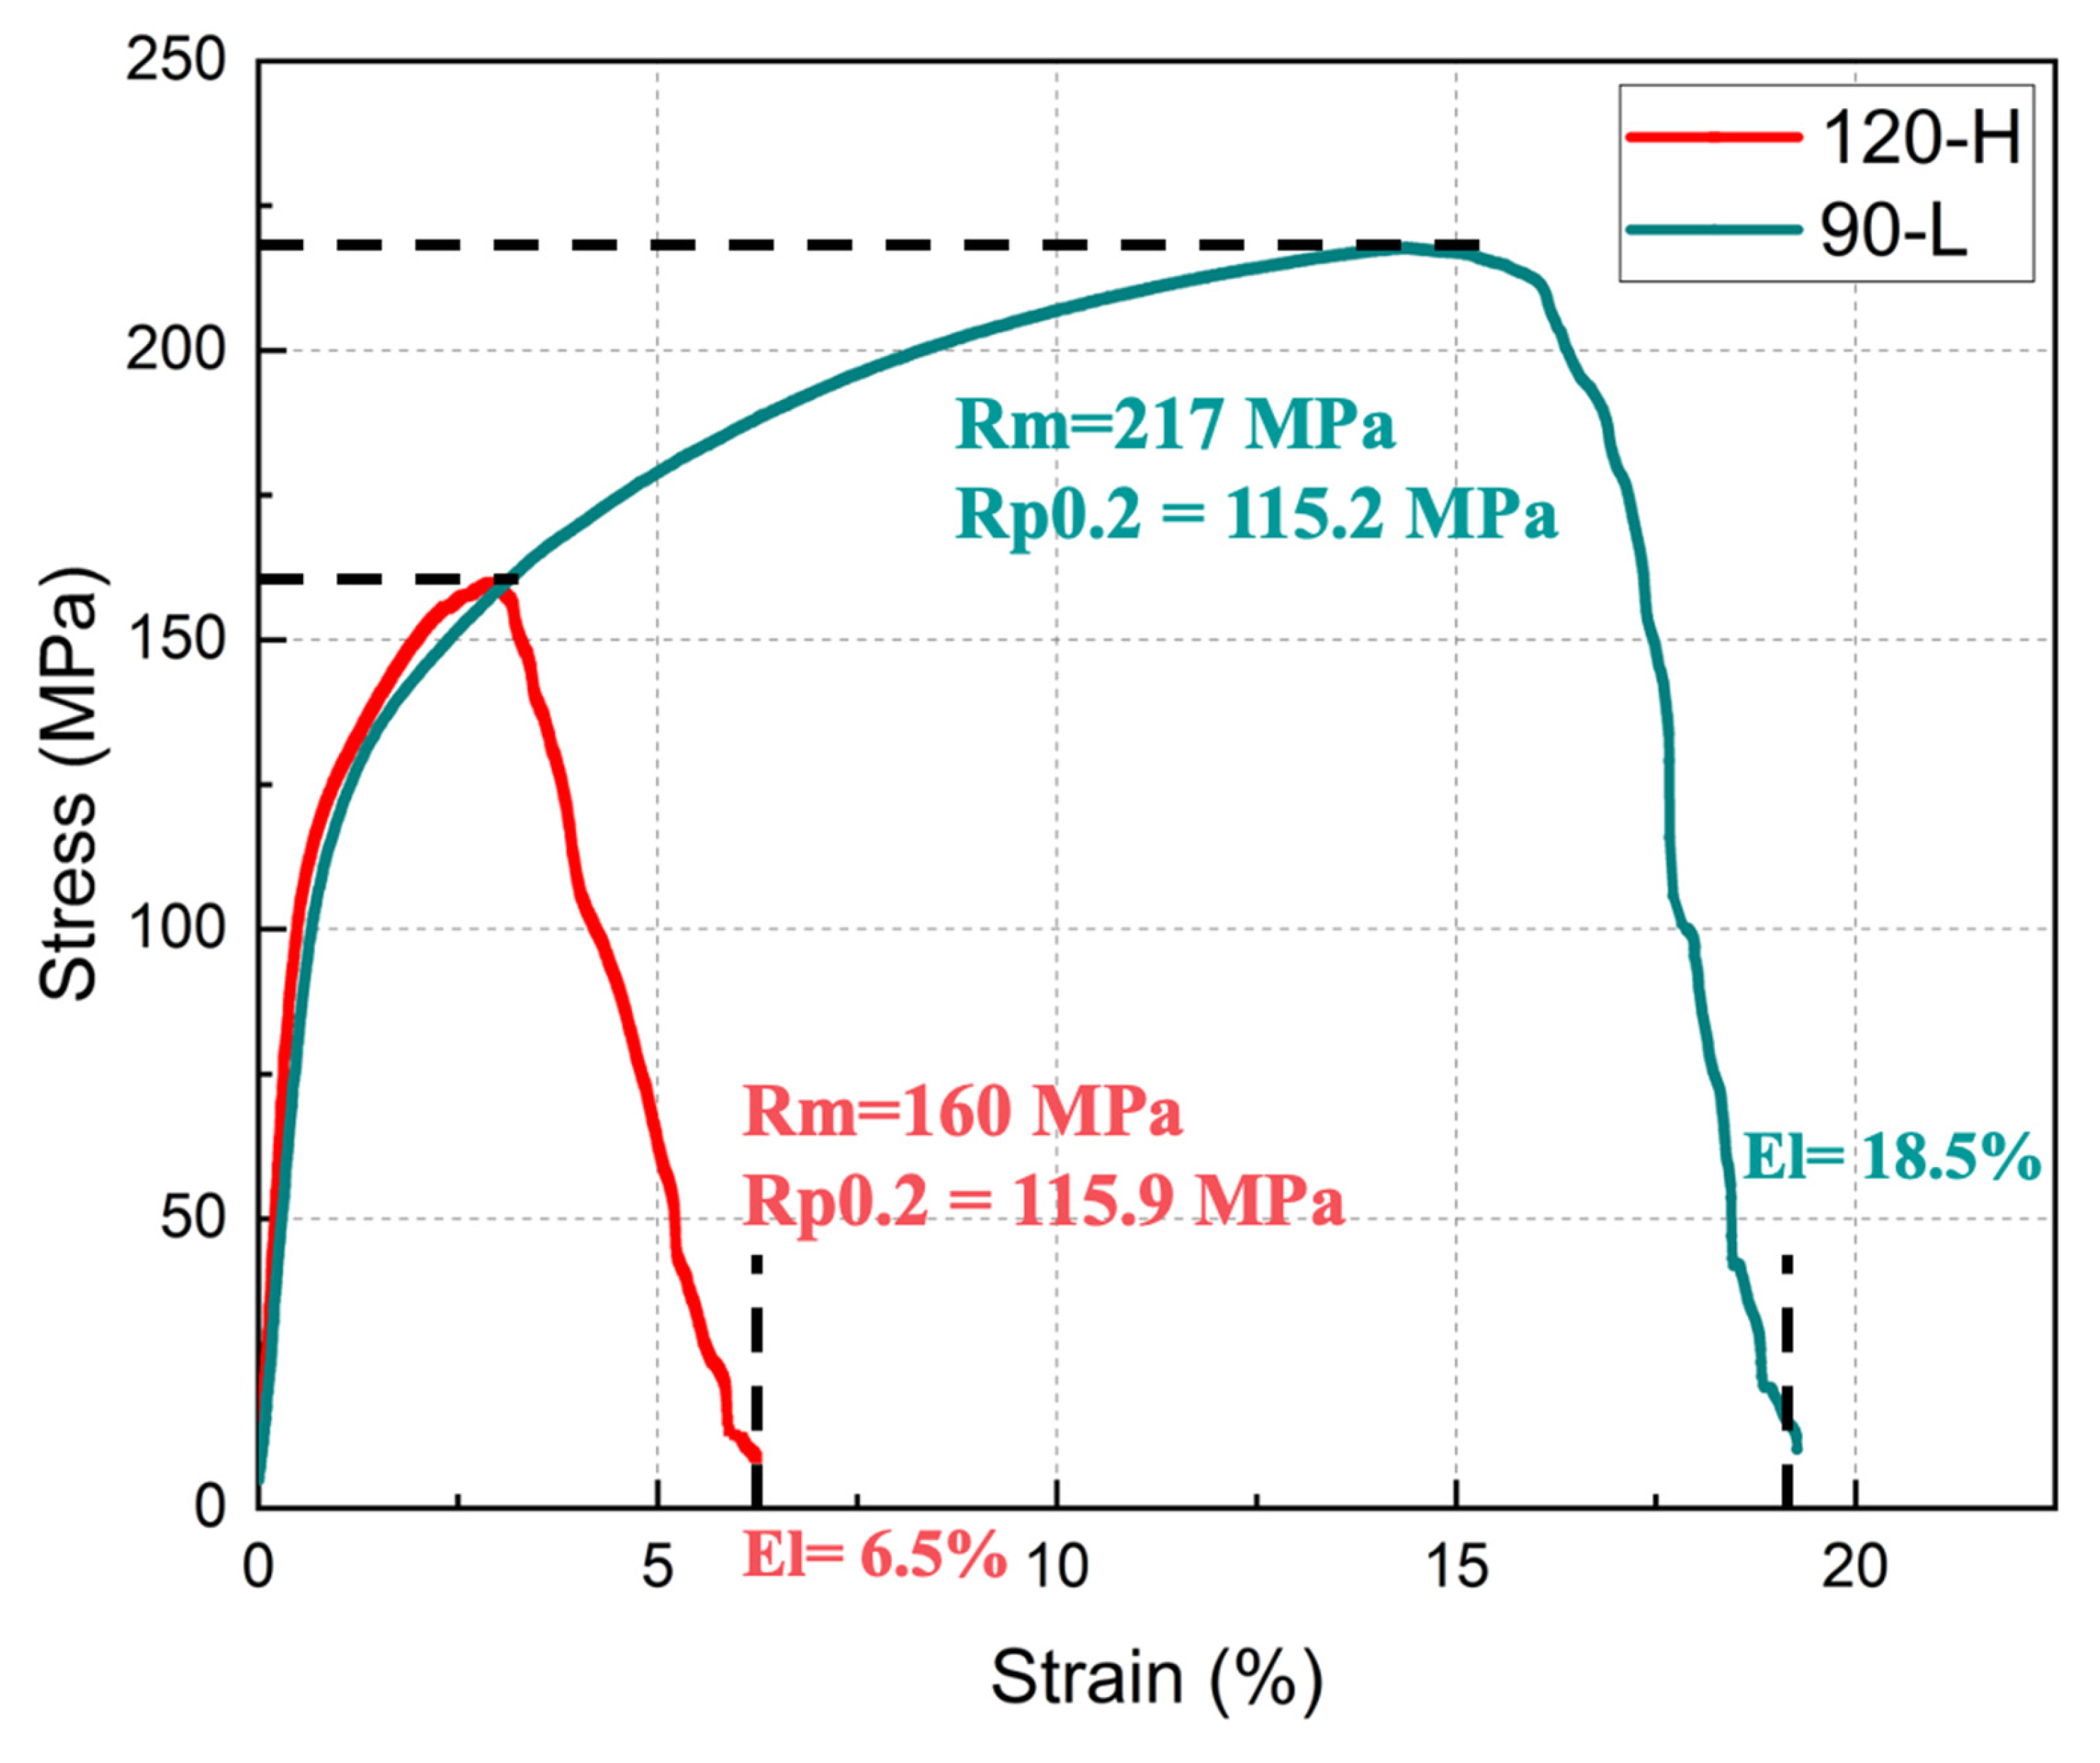
Figure 9 shows the stress–strain (S–S) curves for 120-H (red) and 90-L (cyan). Substantial differences are observed in tensile strength and ductility: the 90-L condition exhibits an ultimate tensile strength approximately 57 MPa higher than that of 120-H, with an elongation roughly three times greater. These discrepancies are primarily attributed to the combined effects of defects and microstructure. The primary source of performance variability is welding defects—namely porosity and cracking. Large, widely distributed pores reduce the effective load-bearing area and act as stress concentrators, thereby markedly degrading mechanical properties. Macro- and microstructural examinations indicate that cracking is dominated by liquation cracking; increases in crack length and density further deteriorate its mechanical response. Beyond these overtly detrimental defects, microstructural features also exert a measurable influence: dendrite arm spacing (DAS), the morphology and spatial distribution of eutectic Si, and the grain size of primary α-Al collectively modulate local strengthening/embrittlement mechanisms and deformation compatibility, affecting strength, ductility, and fracture behavior. A quantitative comparison and mechanistic analysis of these factors—including pore volume fraction and size distribution, crack density and propagation paths, calibrated DAS, eutectic Si morphology metrics, and primary α-Al grain size—will be presented in the Section 4.

3.5. Numerical Simulation Results

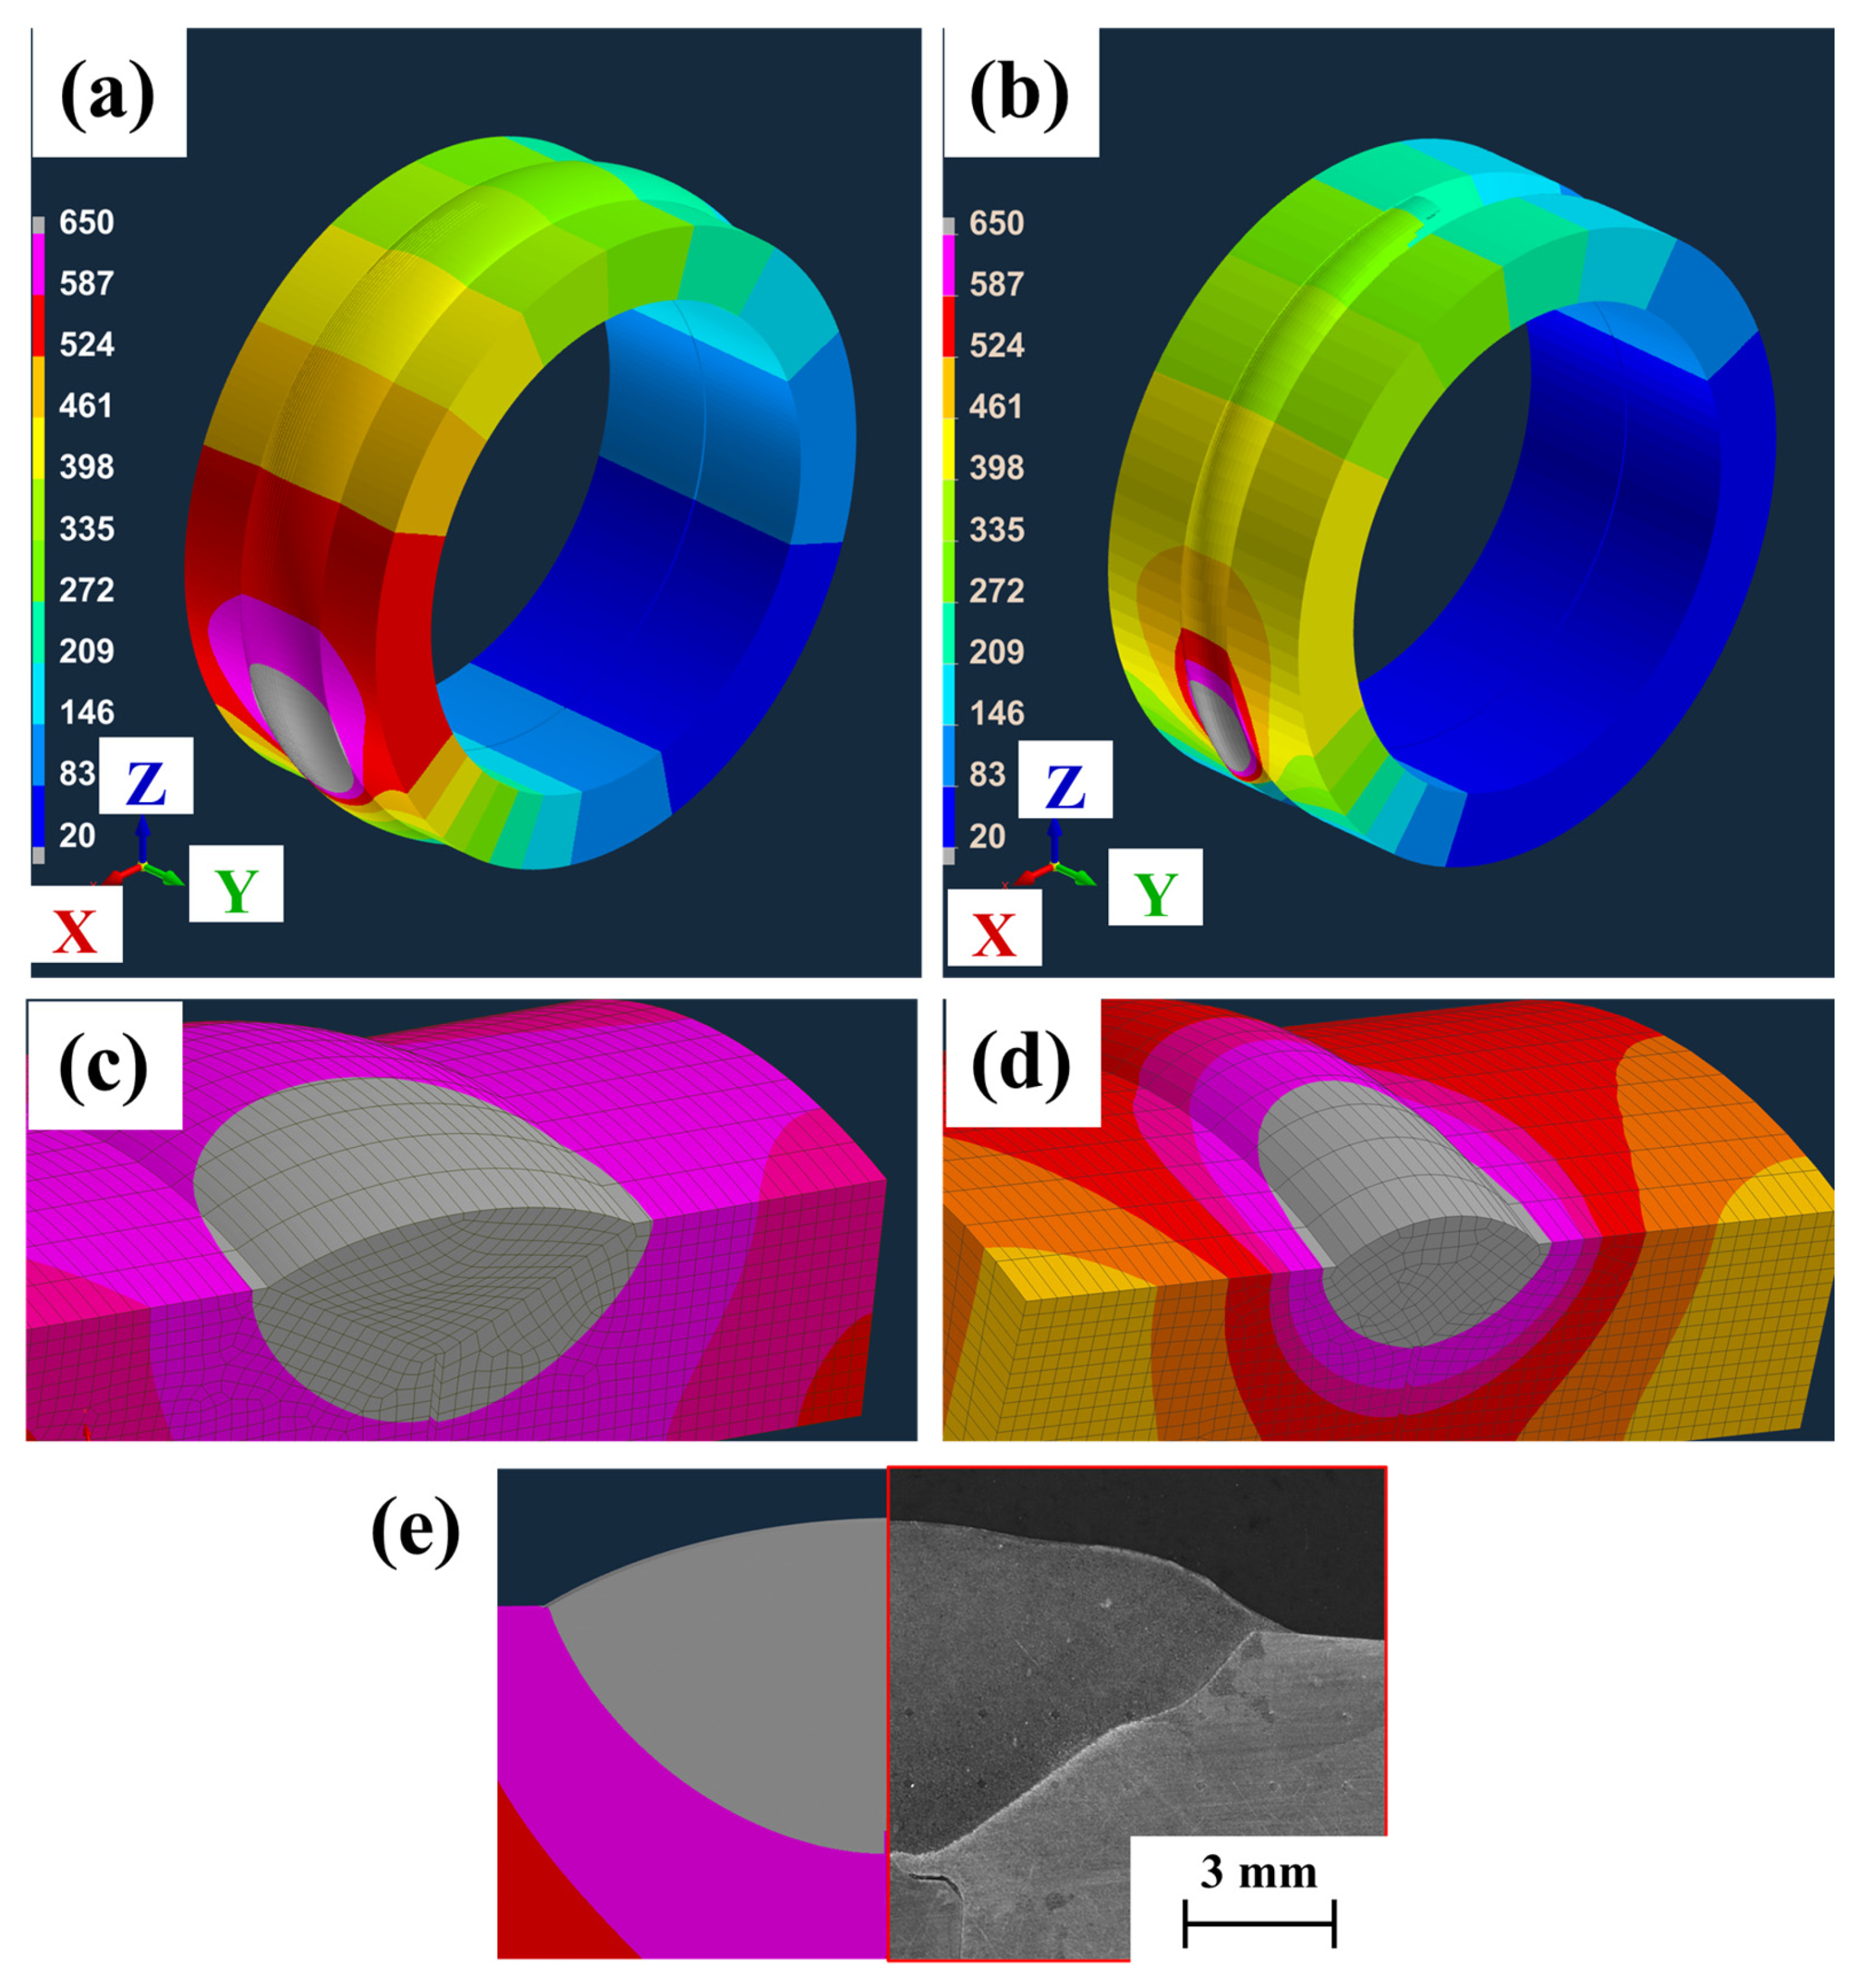
Figure 10 compiles results from SYSWELD thermal simulations. In particular, Figure 10a,b depict how the temperature field evolves during welding of the air suspension component. Meanwhile, Figure 10c,d resolve the weld-pool temperature distribution on cross-sections at representative times. Based on the solidification range of Al–Si alloys, regions exceeding approximately 650 °C are marked in gray to indicate liquid zones. As seen in Figure 10c, the 120° groove (120-H) retains a substantial overheated region, while the 90° groove (90-L) exhibits a more balanced and appropriate thermal distribution under the selected parameters. These findings suggest that the 120-H process parameters require further optimization. Moreover, the simulated temperature features are consistent with the microstructural defects observed subsequently.

4. Discussion

4.1. Effect of Heat Input on Liquation Crack and Porosity

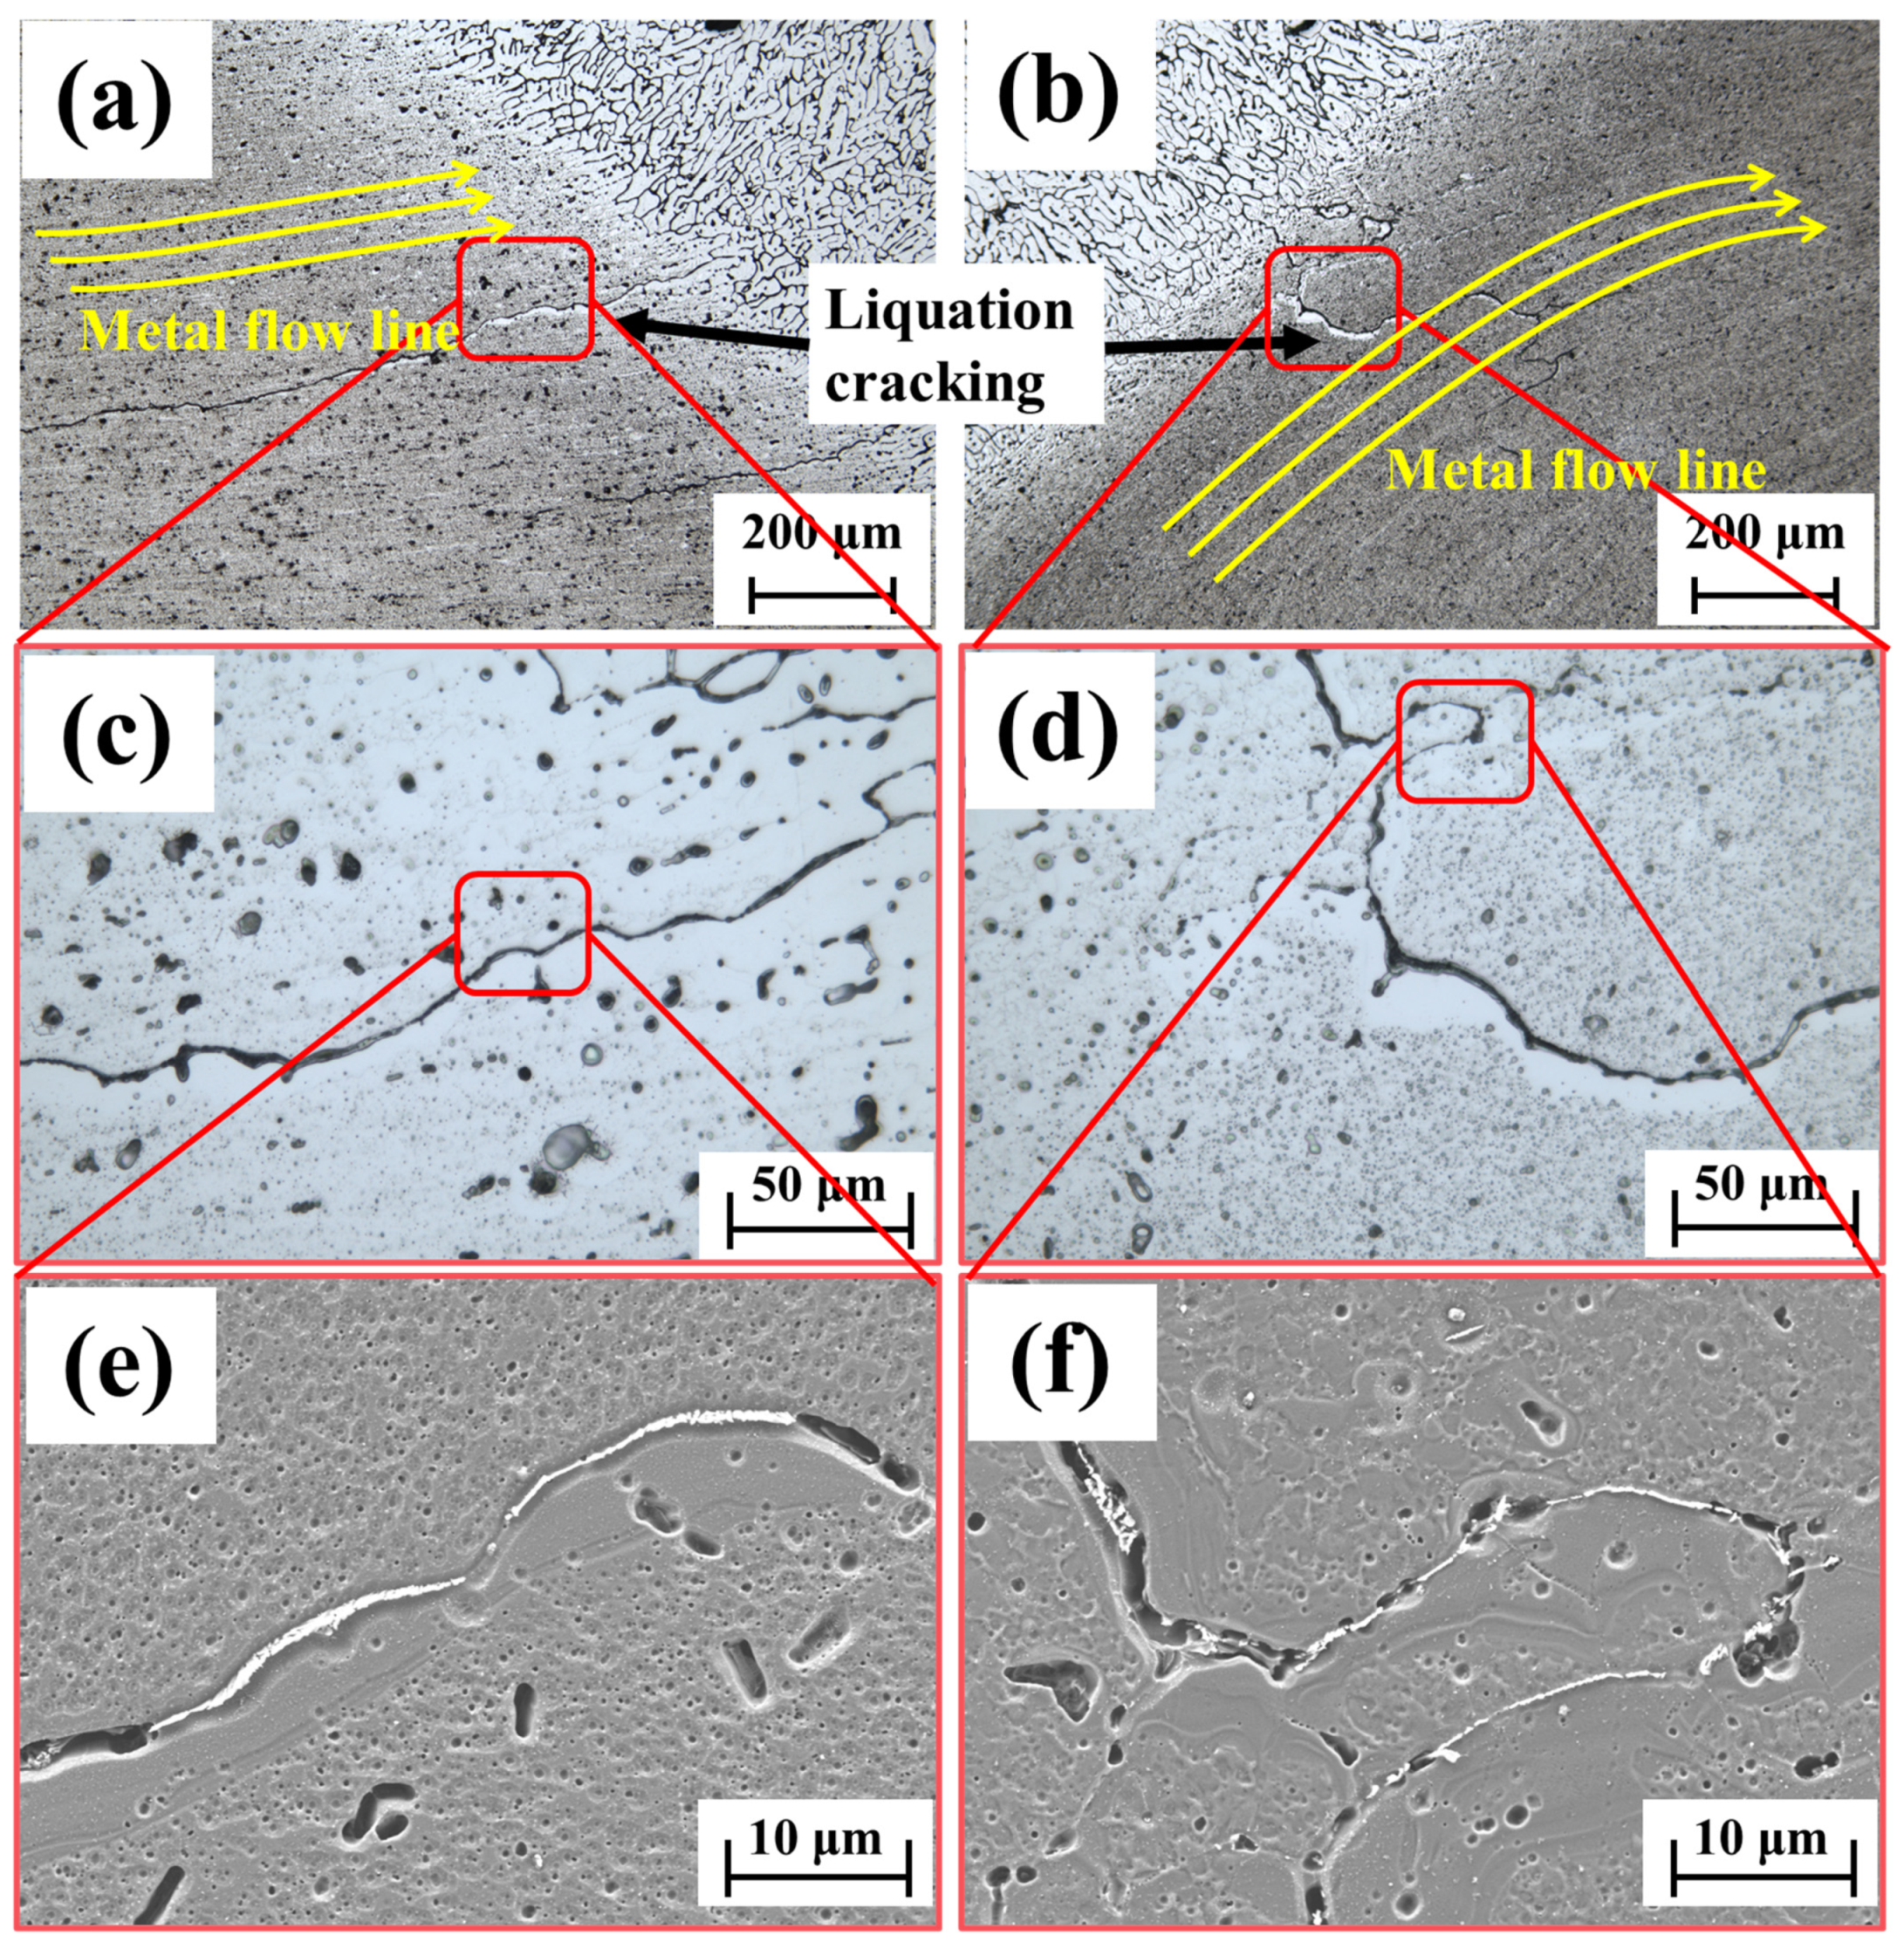
The macrographs in Figure 4 reveal numerous cracks in the HAZ, particularly pronounced under the 120-H condition, motivating a more detailed analysis of this sample. Figure 11 presents optical microscopy (OM) images of the weld metal and the HAZ on both sides of the 120-H steady-state weld. Liquation cracks are typically accompanied by bright Al-rich bands and are located on the base-metal side adjacent to the weld; the features in Figure 11a,b are consistent with this description and, thus, identify the defects as liquation cracks. As-built differences in end geometry and forging schedules impose disparate HAZ flow-line orientations, which alter local anisotropy and, consequently, the crack growth length and trajectory. On the side shown in Figure 11a, the forging flow lines are approximately parallel to the crack-propagation direction, leading to elongated cracks that propagate more readily (Figure 11c,d). Because the propagation direction in Figure 11b is nearly perpendicular to the forging metal flow lines, the crack is impeded and micro-branches into secondary cracks; consequently, the total crack length is lower than in Figure 11a. These observations suggest a design strategy that accounts for the coupling between forging flow-line orientation and potential crack paths: wherever possible, align the flow lines in the base metal adjacent to the weld approximately perpendicular to the likely crack-growth direction to suppress continuous liquation-crack propagation.
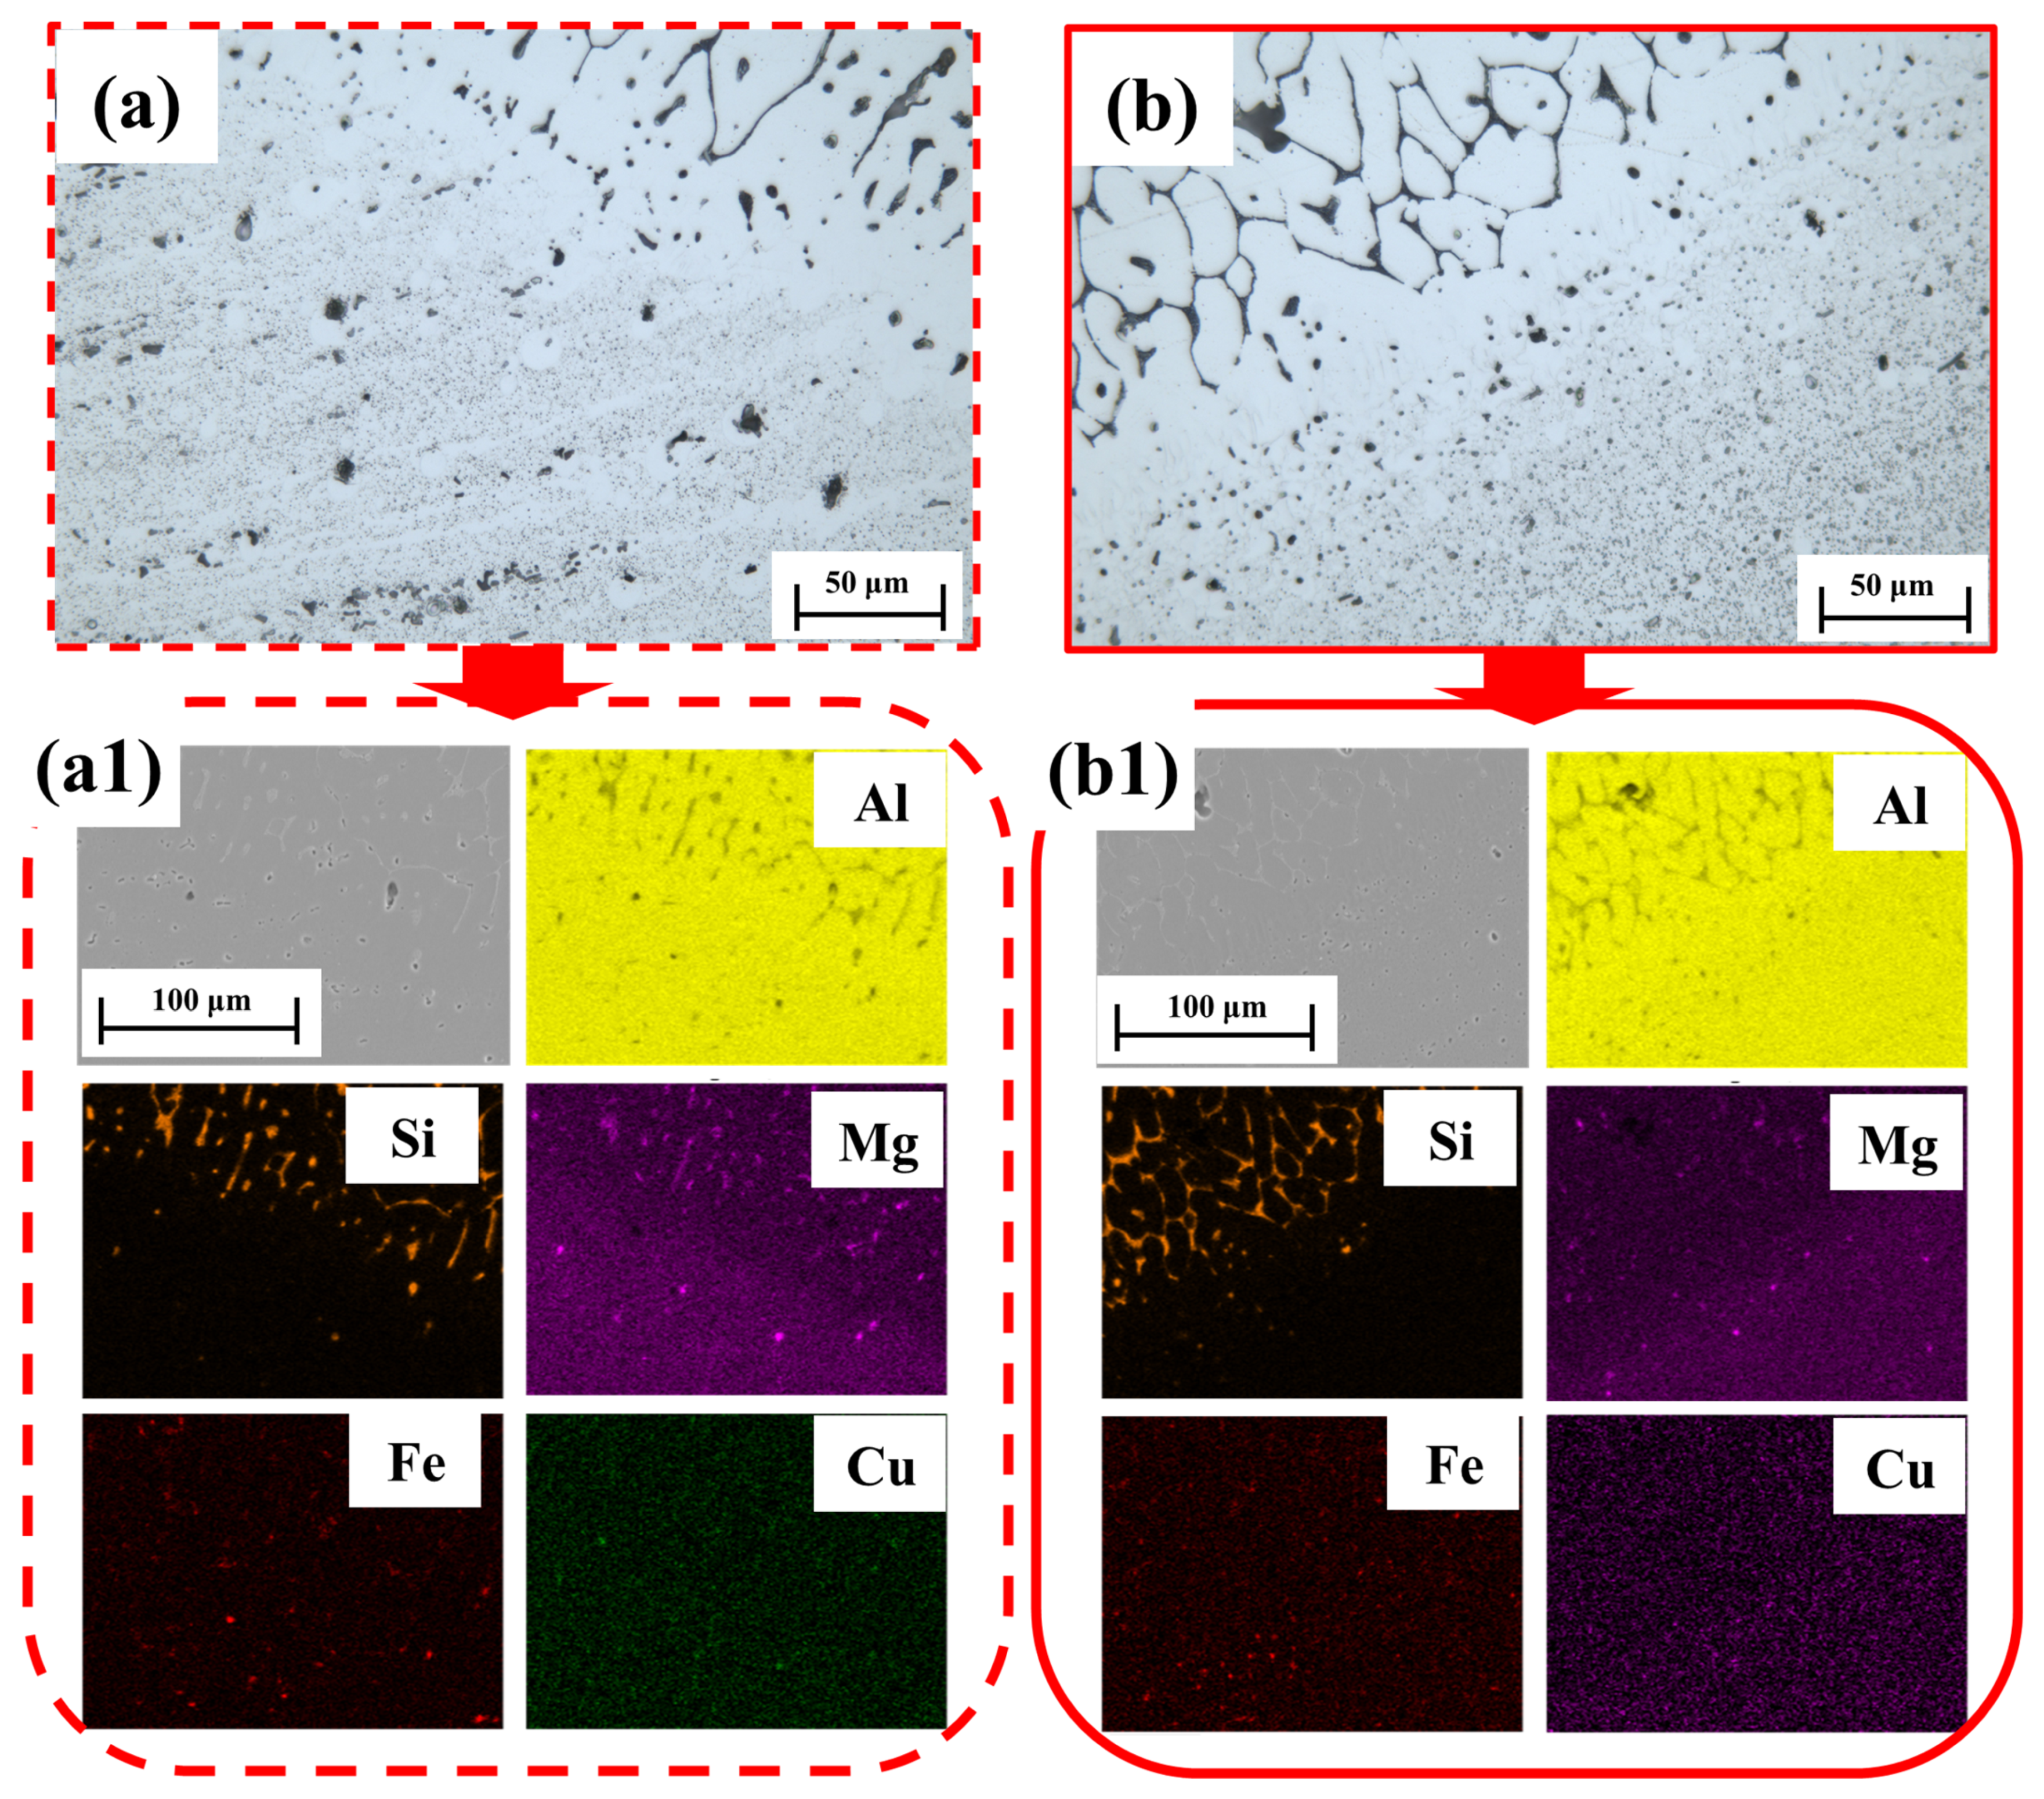
Figure 12 presents the microstructure of the HAZ and the corresponding energy-dispersive spectroscopy (EDS) maps for specimens produced with different forging metal flow lines. The region contains the molten pool, the HAZ, and portions of the substrate with metal flow-line features. Mapping was performed for the major elements expected in the aluminum alloy: Al, Si, Mg, Fe, and Cu. Figure 12a,a1 correspond to regions where metal flow lines are parallel to the liquation cracks, while Figure 12b,b1 correspond to regions where metal flow lines are approximately perpendicular to the cracks. Energy-dispersive X-ray spectroscopy (EDS) maps reveal no systematic compositional contrast between the two sides. In both regions, the dominant precipitates are Si- and Mg-rich, with minor Fe- and Cu-bearing phases. Accordingly, within the spatial resolution and detection limits of EDS mapping, the flow-line orientation does not introduce resolvable elemental heterogeneity, and the maps show no apparent spatial correlation with liquation-crack initiation or propagation.
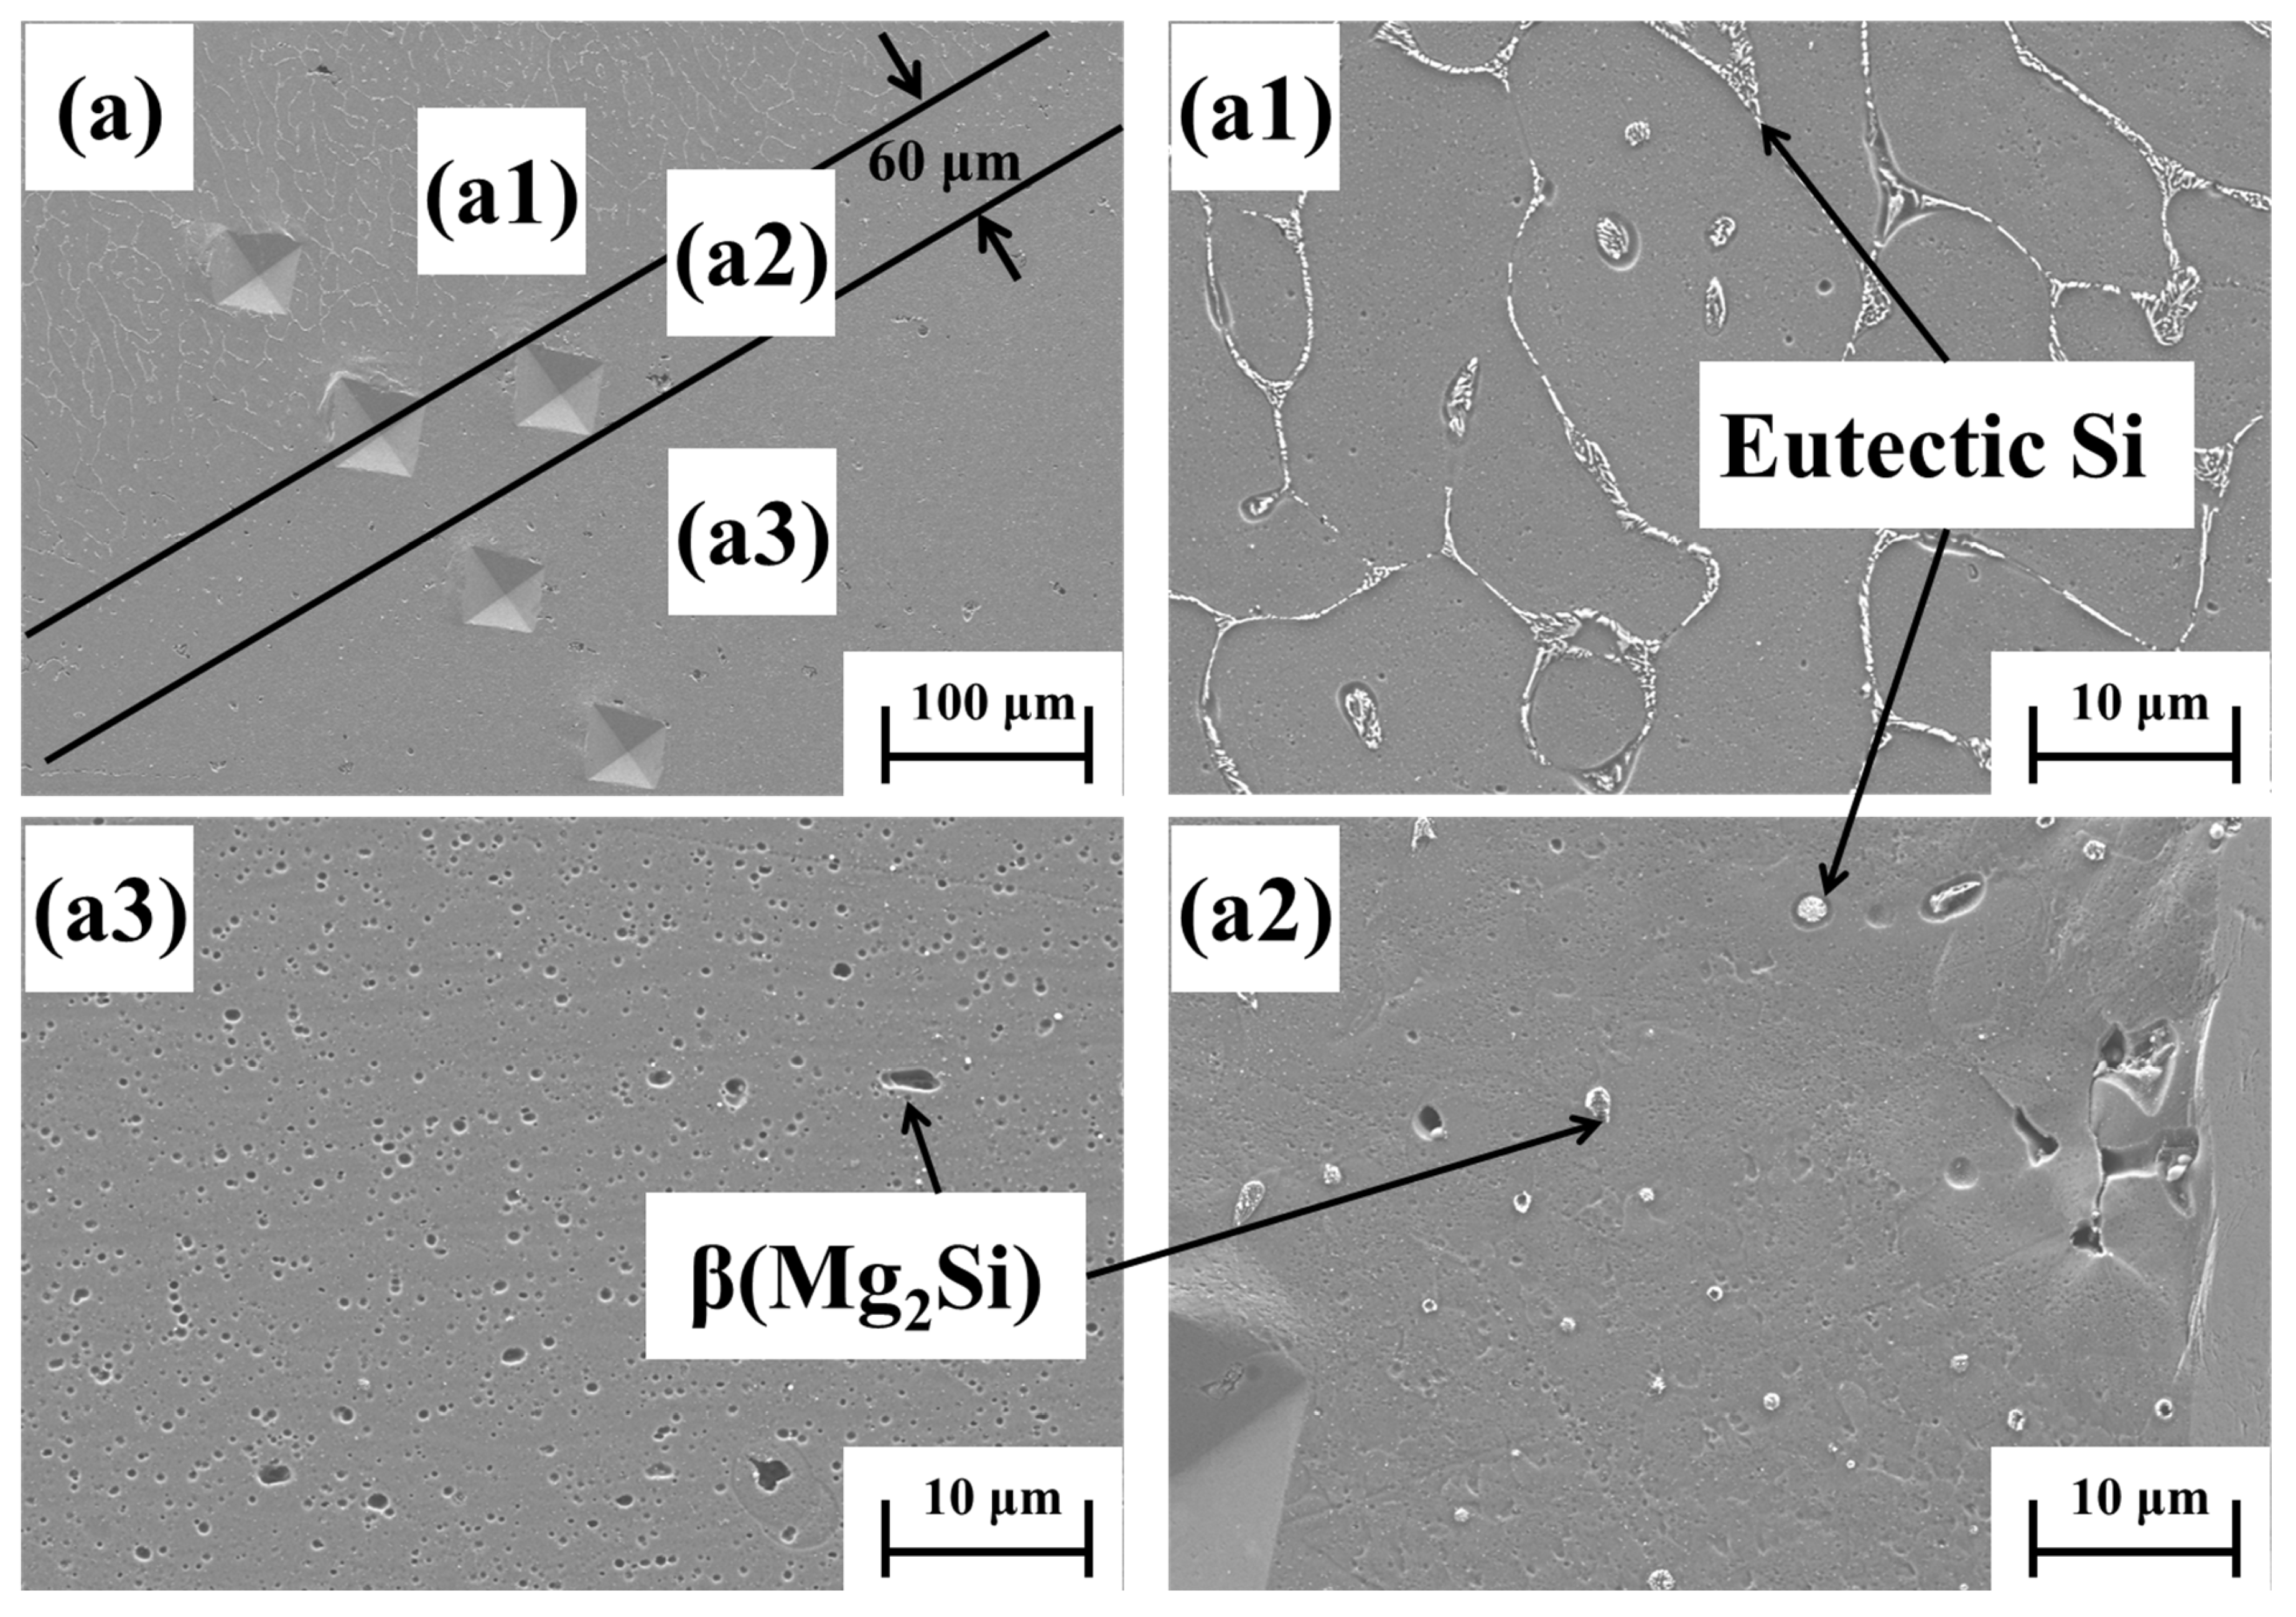
To delineate sub-zones within the heat-affected zone (HAZ), a microhardness line-indentation approach was employed. Five indents were placed from the weld metal toward the base metal, with an additional indent positioned across the steepest hardness gradient to localize microstructural sampling; this gradient spans approximately 60 μm (Figure 13a2). Points a1 and a3 mark sampling sites in the weld metal and base metal, respectively. At higher magnification, the weld metal is dominated by eutectic-Si constituents, whereas the base metal contains abundant β-Mg2Si. These phase assignments are consistent with the EDS maps in Figure 12. In the mid-HAZ, a continuous eutectic-Si network is absent; only discrete remnants are observed, together with sparse β-Mg2Si particles.

4.2. Effect of Heat Input on Microstructure and Mechanical Property

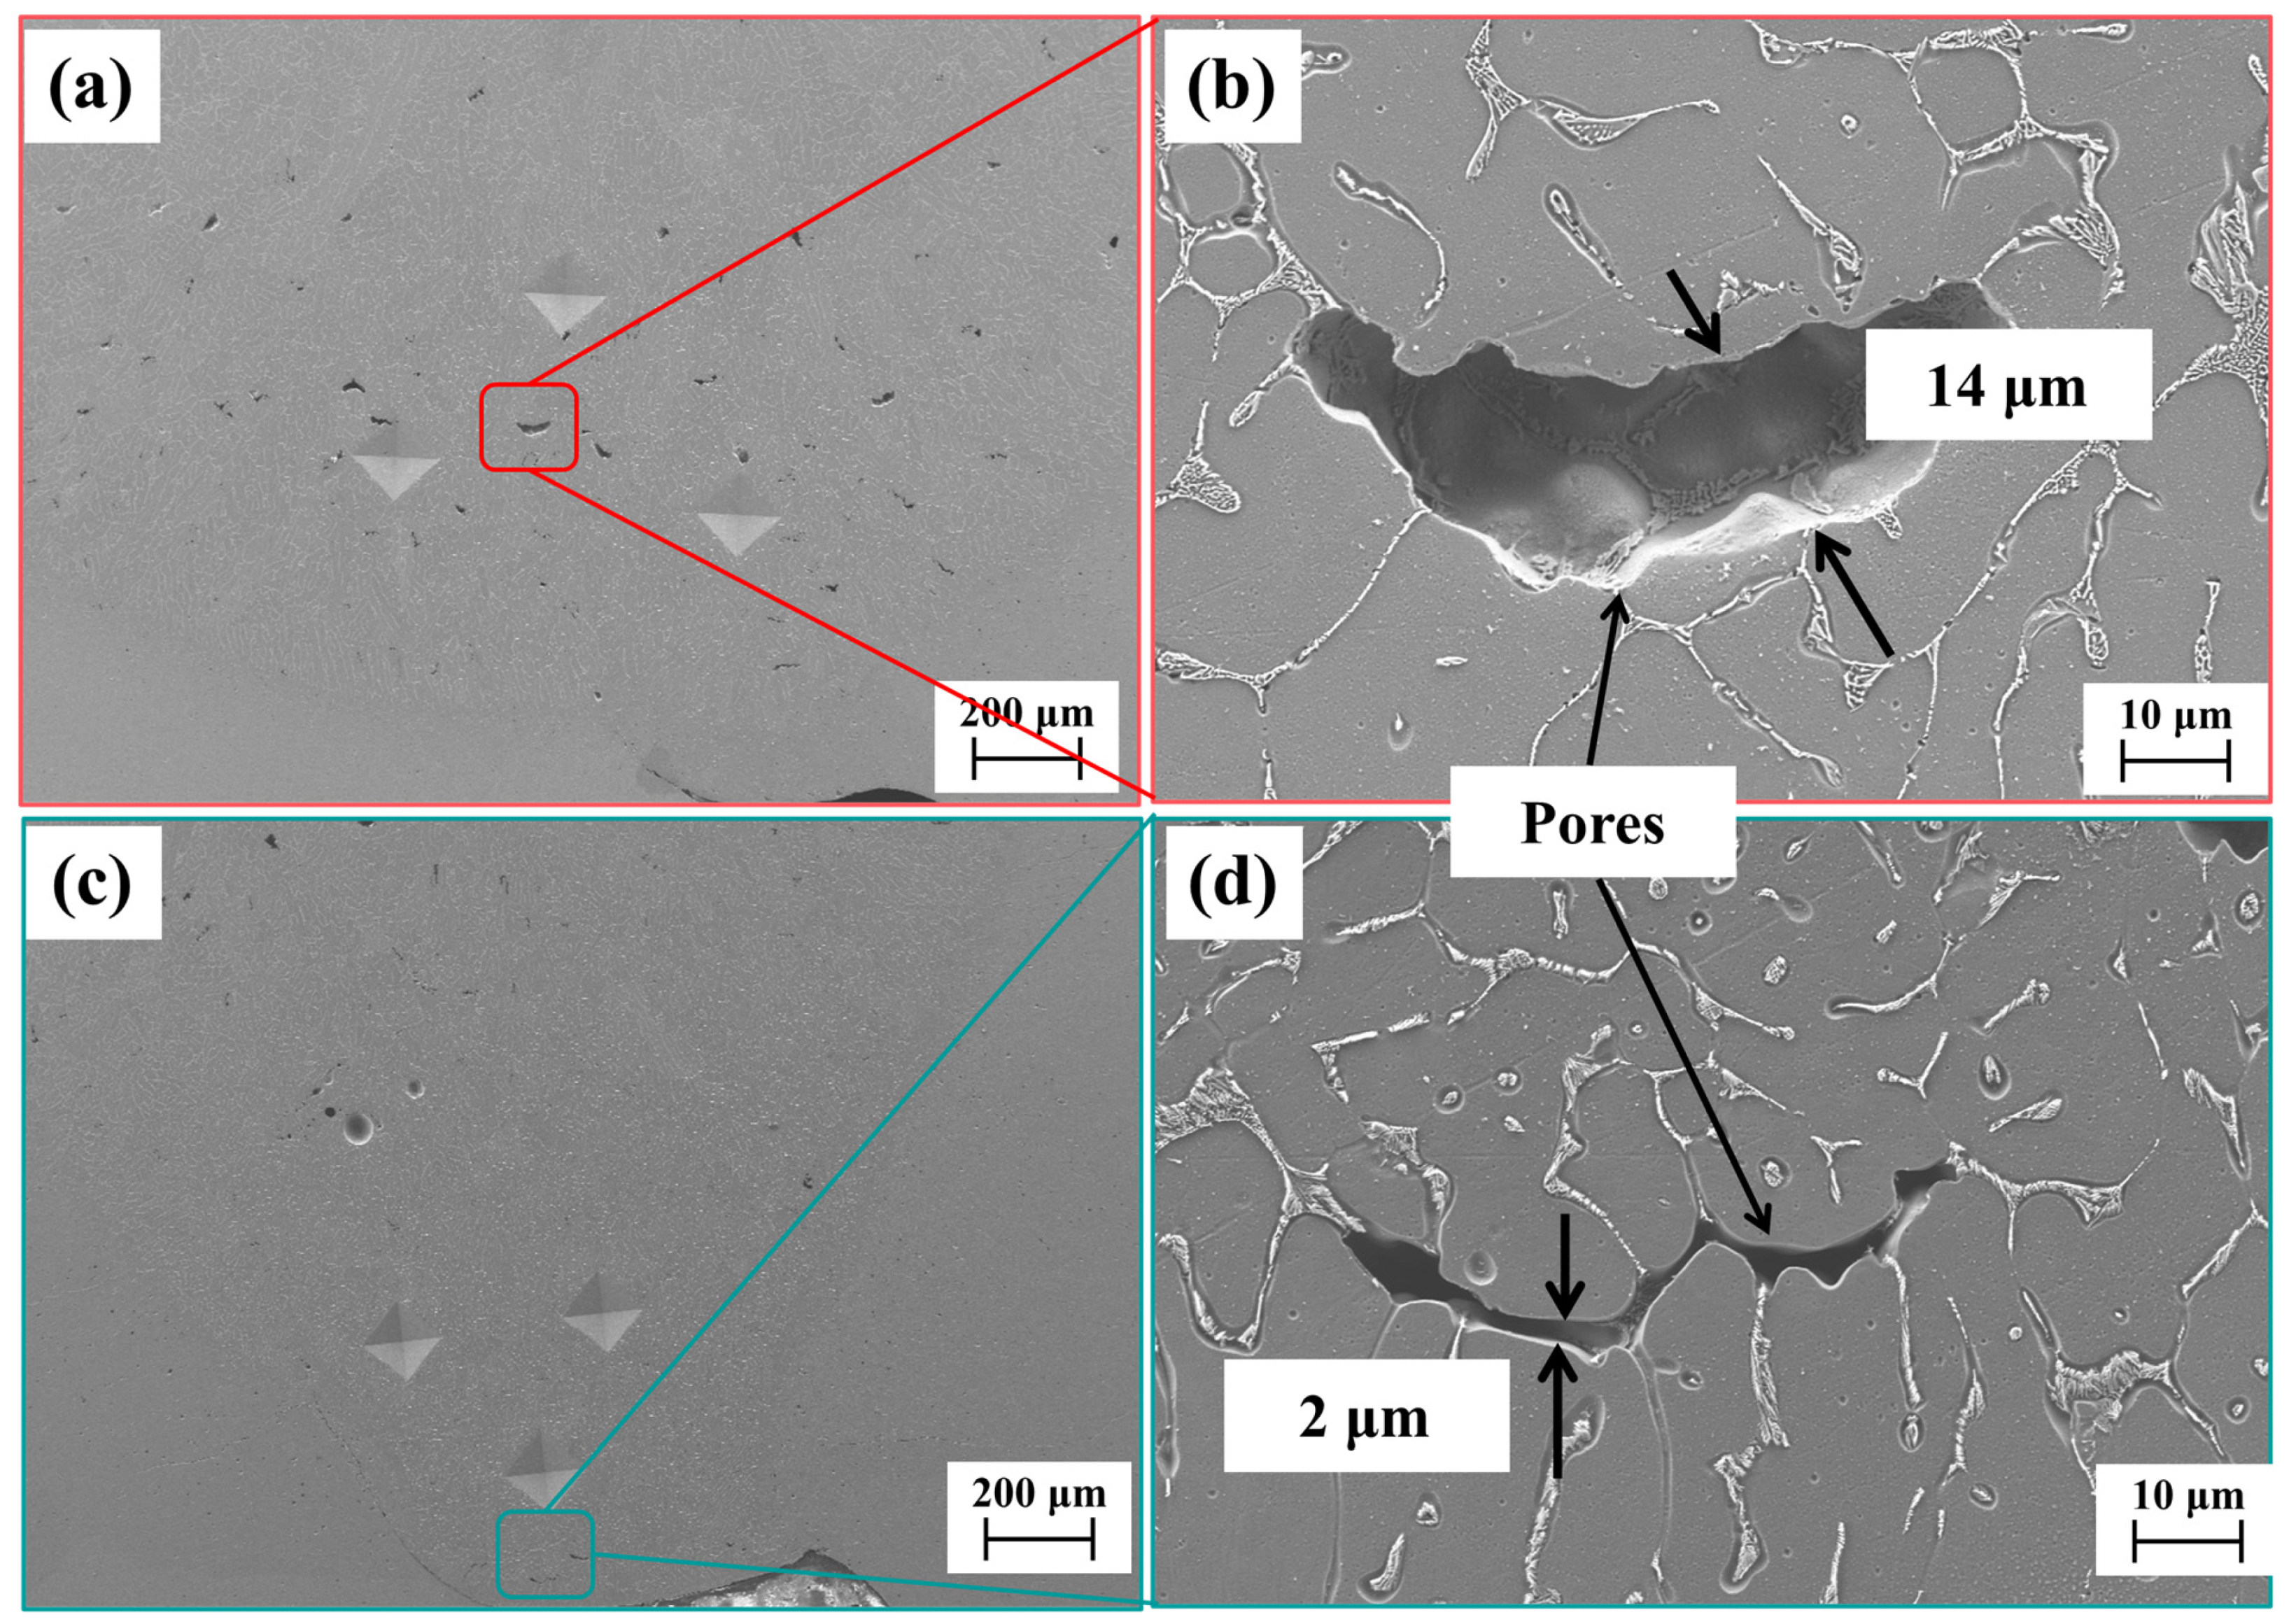
Given the mechanical property differences between 120-H and 90-L, this section focuses on micro-porosity. Figure 14 documents pore morphologies at different heat inputs; Figure 14a and Figure 14c show the weld root regions for 120-H and 90-L, highlighted by red and cyan boxes, respectively. SEM observations reveal that the high heat input condition exhibits more numerous and larger pores, typically non-spherical and crescent-shaped. At approximately 1000× magnification, the pore termini are rounded rather than sharp, and no radiating microcracks are observed, consistent with these features being pores rather than cracks. For 120-H, a representative pore width is approximately 14 µm, with substantial eutectic Si retained inside. In contrast, pores in 90-L are much smaller, on the order of ~2 µm—comparable to the width of the eutectic Si—and are characteristic of interdendritic porosity, likely arising from gas entrapment or solidification shrinkage, consistent with prior reports [25]. Differences in pore size and number density markedly reduce load-bearing capacity and are the primary contributor to the inferior performance of 120-H relative to 90-L; disparities in dendrite arm spacing (DAS) further exacerbate the mechanical property gap.
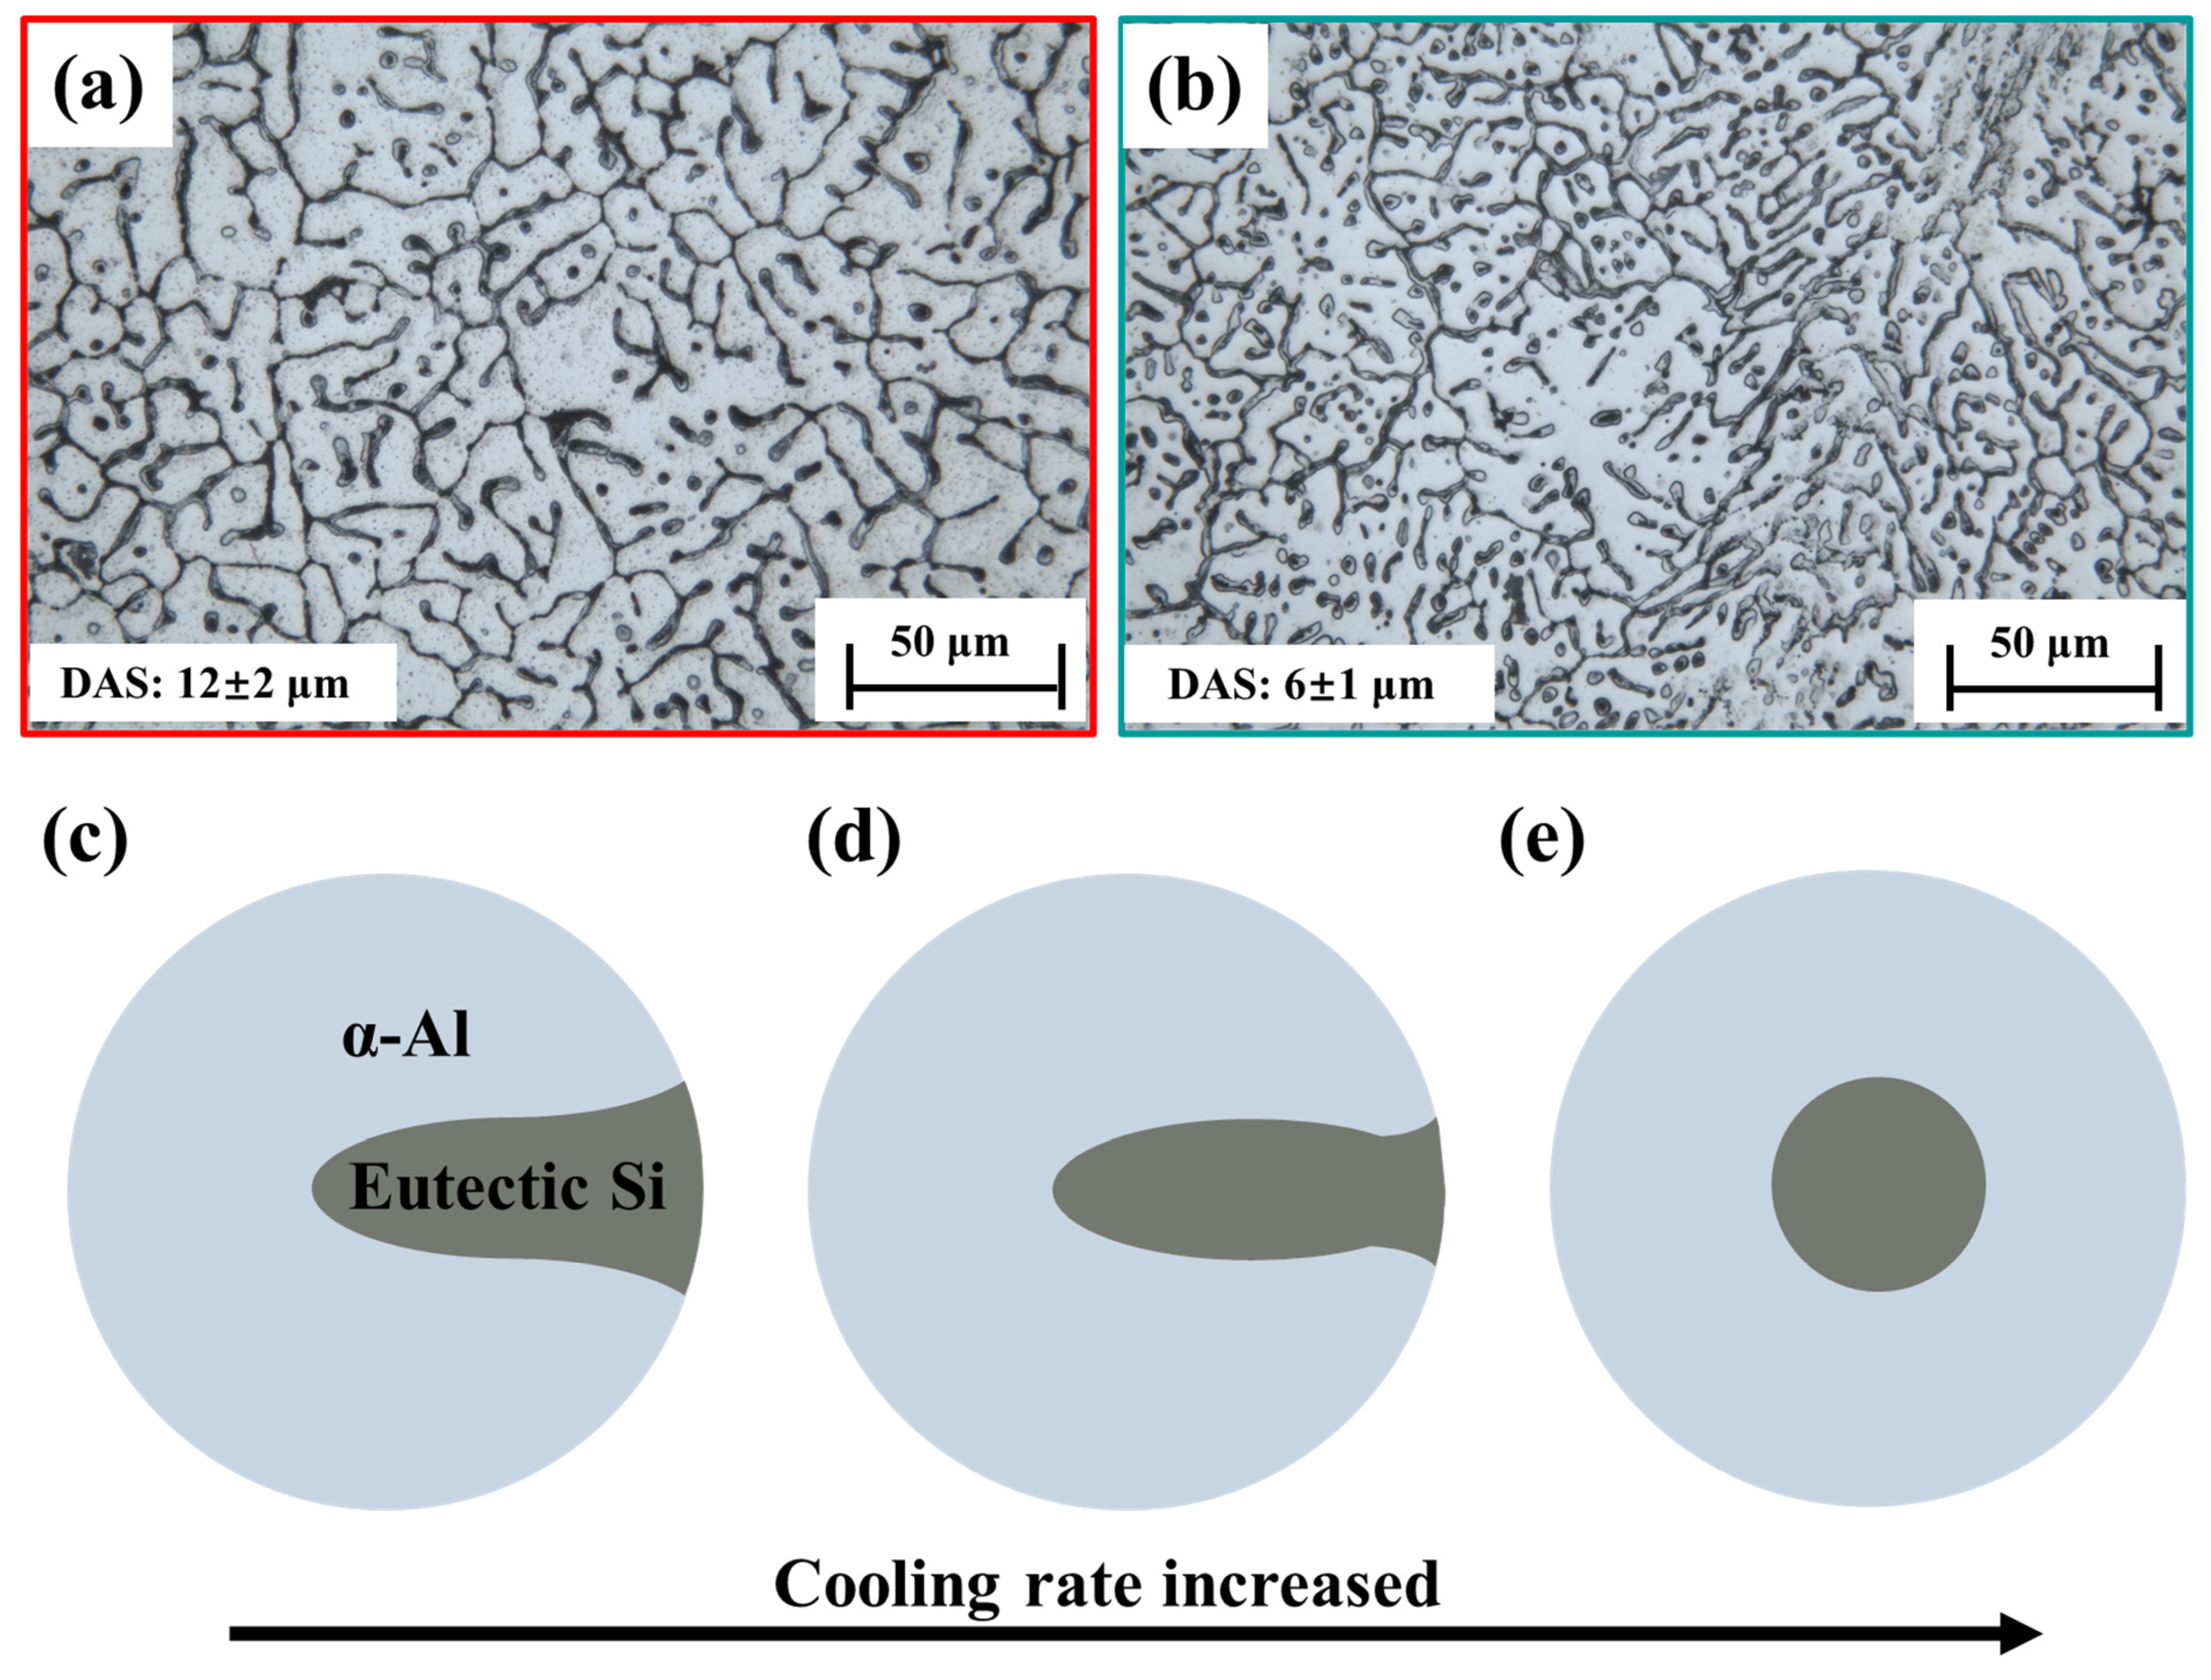
The 120-H and 90-L conditions were analyzed to quantify the dendrite arm spacing (DAS). In Al–Si welds, continuous grain boundaries are difficult to delineate; the microstructure is characterized by α-Al dendrites with the Al–Si eutectic filling interdendritic regions. Accordingly, DAS is widely used as a key metric linking cooling conditions to mechanical performance. The average DAS was determined from at least 20 measurements. The 120-H sample exhibits a DAS of approximately 12 µm, about twice that of the 90-L sample. Beyond DAS, the morphology of the eutectic Si varies systematically with cooling rate due to interfacial energy considerations and the relative solidification kinetics of Al and Si: primary α-Al nucleates and grows first, whereas Si forms later during the eutectic reaction within interdendritic regions. Under slower cooling, Si tends to form elongated/dendritic networks, and with an increasing cooling rate, the earlier-formed α-Al envelopes the lagging Si, promoting a more discontinuous, island-like distribution. Representative morphologies at different cooling rates are shown in Figure 15c–e. The higher prevalence of island-like Si in 90-L corroborates its faster cooling relative to 120-H.
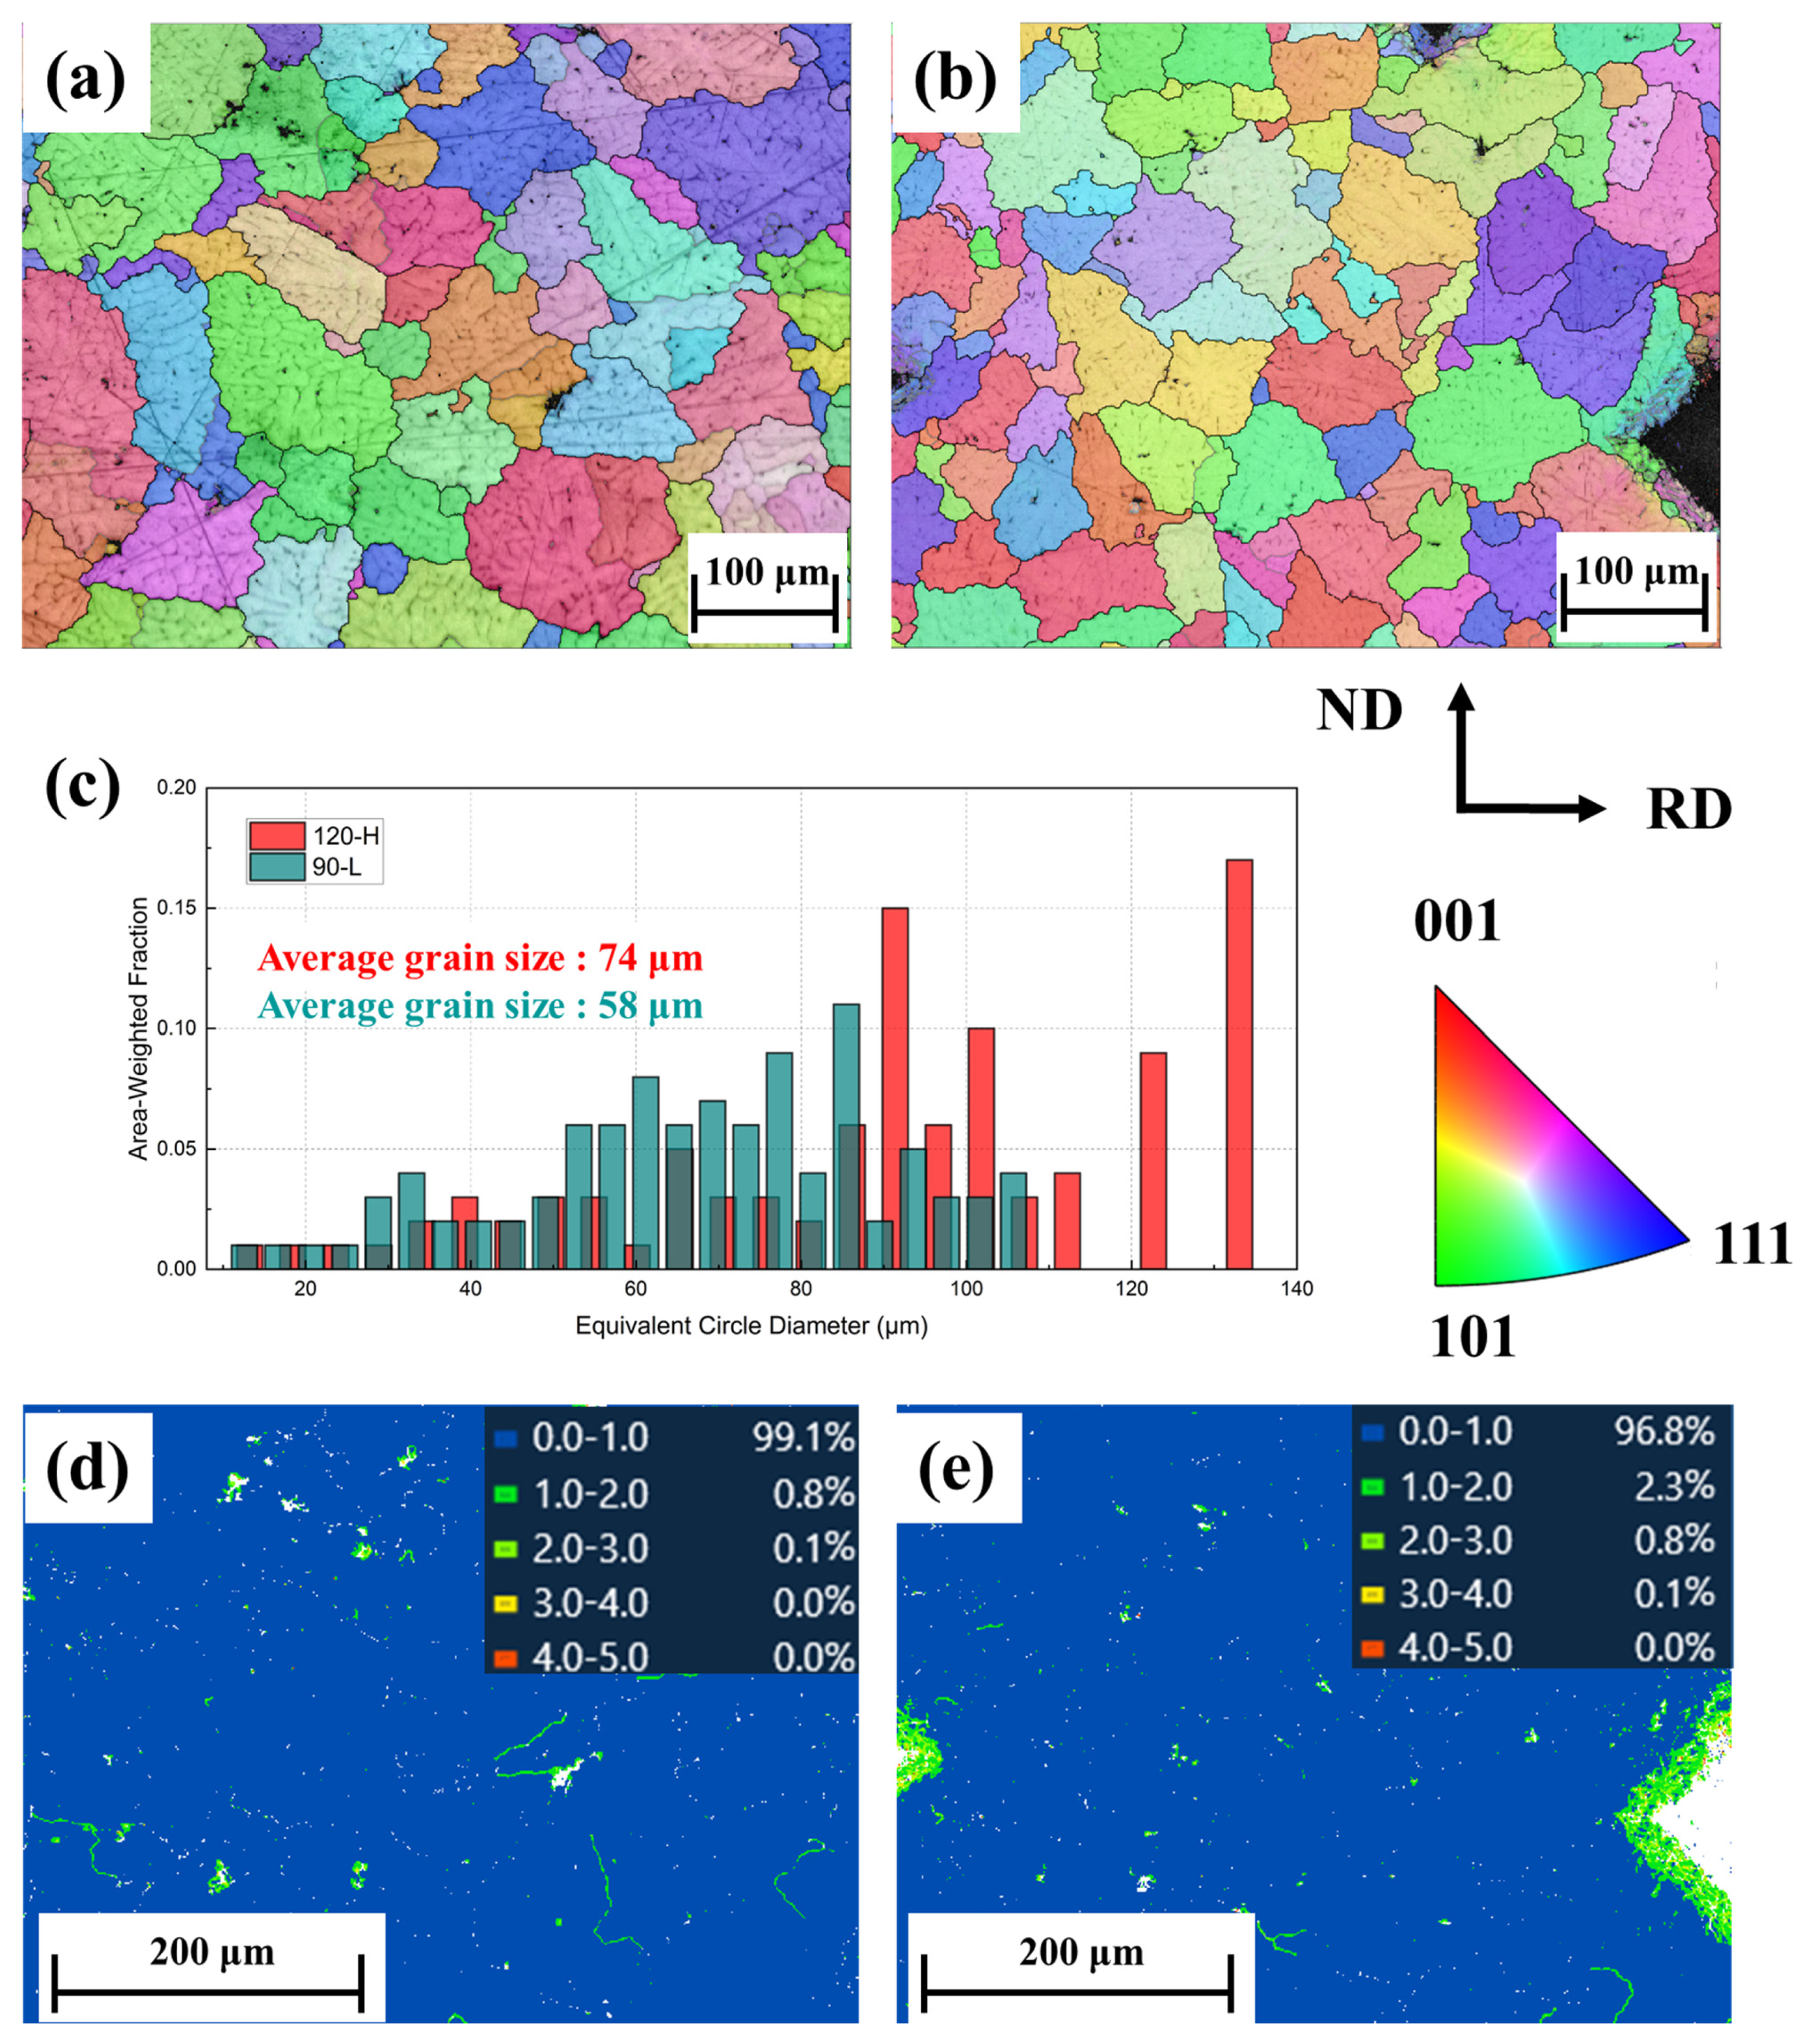
Beyond dendrite arm spacing (DAS), the α-Al grain size was quantified. Because conventional etching yields insufficient boundary contrast in OM/SEM, electron backscatter diffraction (EBSD) was used to delineate grain boundaries by orientation contrast and to measure α-Al grain size. Residual eutectic-Si particles remain visible within grains, albeit faintly, but boundary definition is based on EBSD misorientation criteria. The mean grain size in 120-H is approximately 74 μm, notably larger than the ~58 μm measured in 90-L; the corresponding size distributions are shown in Figure 16c. Thus, grain refinement in 90-L contributes to its superior mechanical performance relative to 120-H, via Hall–Petch strengthening and enhanced crack-path tortuosity [26,27,28,29]. KAM showed no appreciable variation with higher or lower heat input.
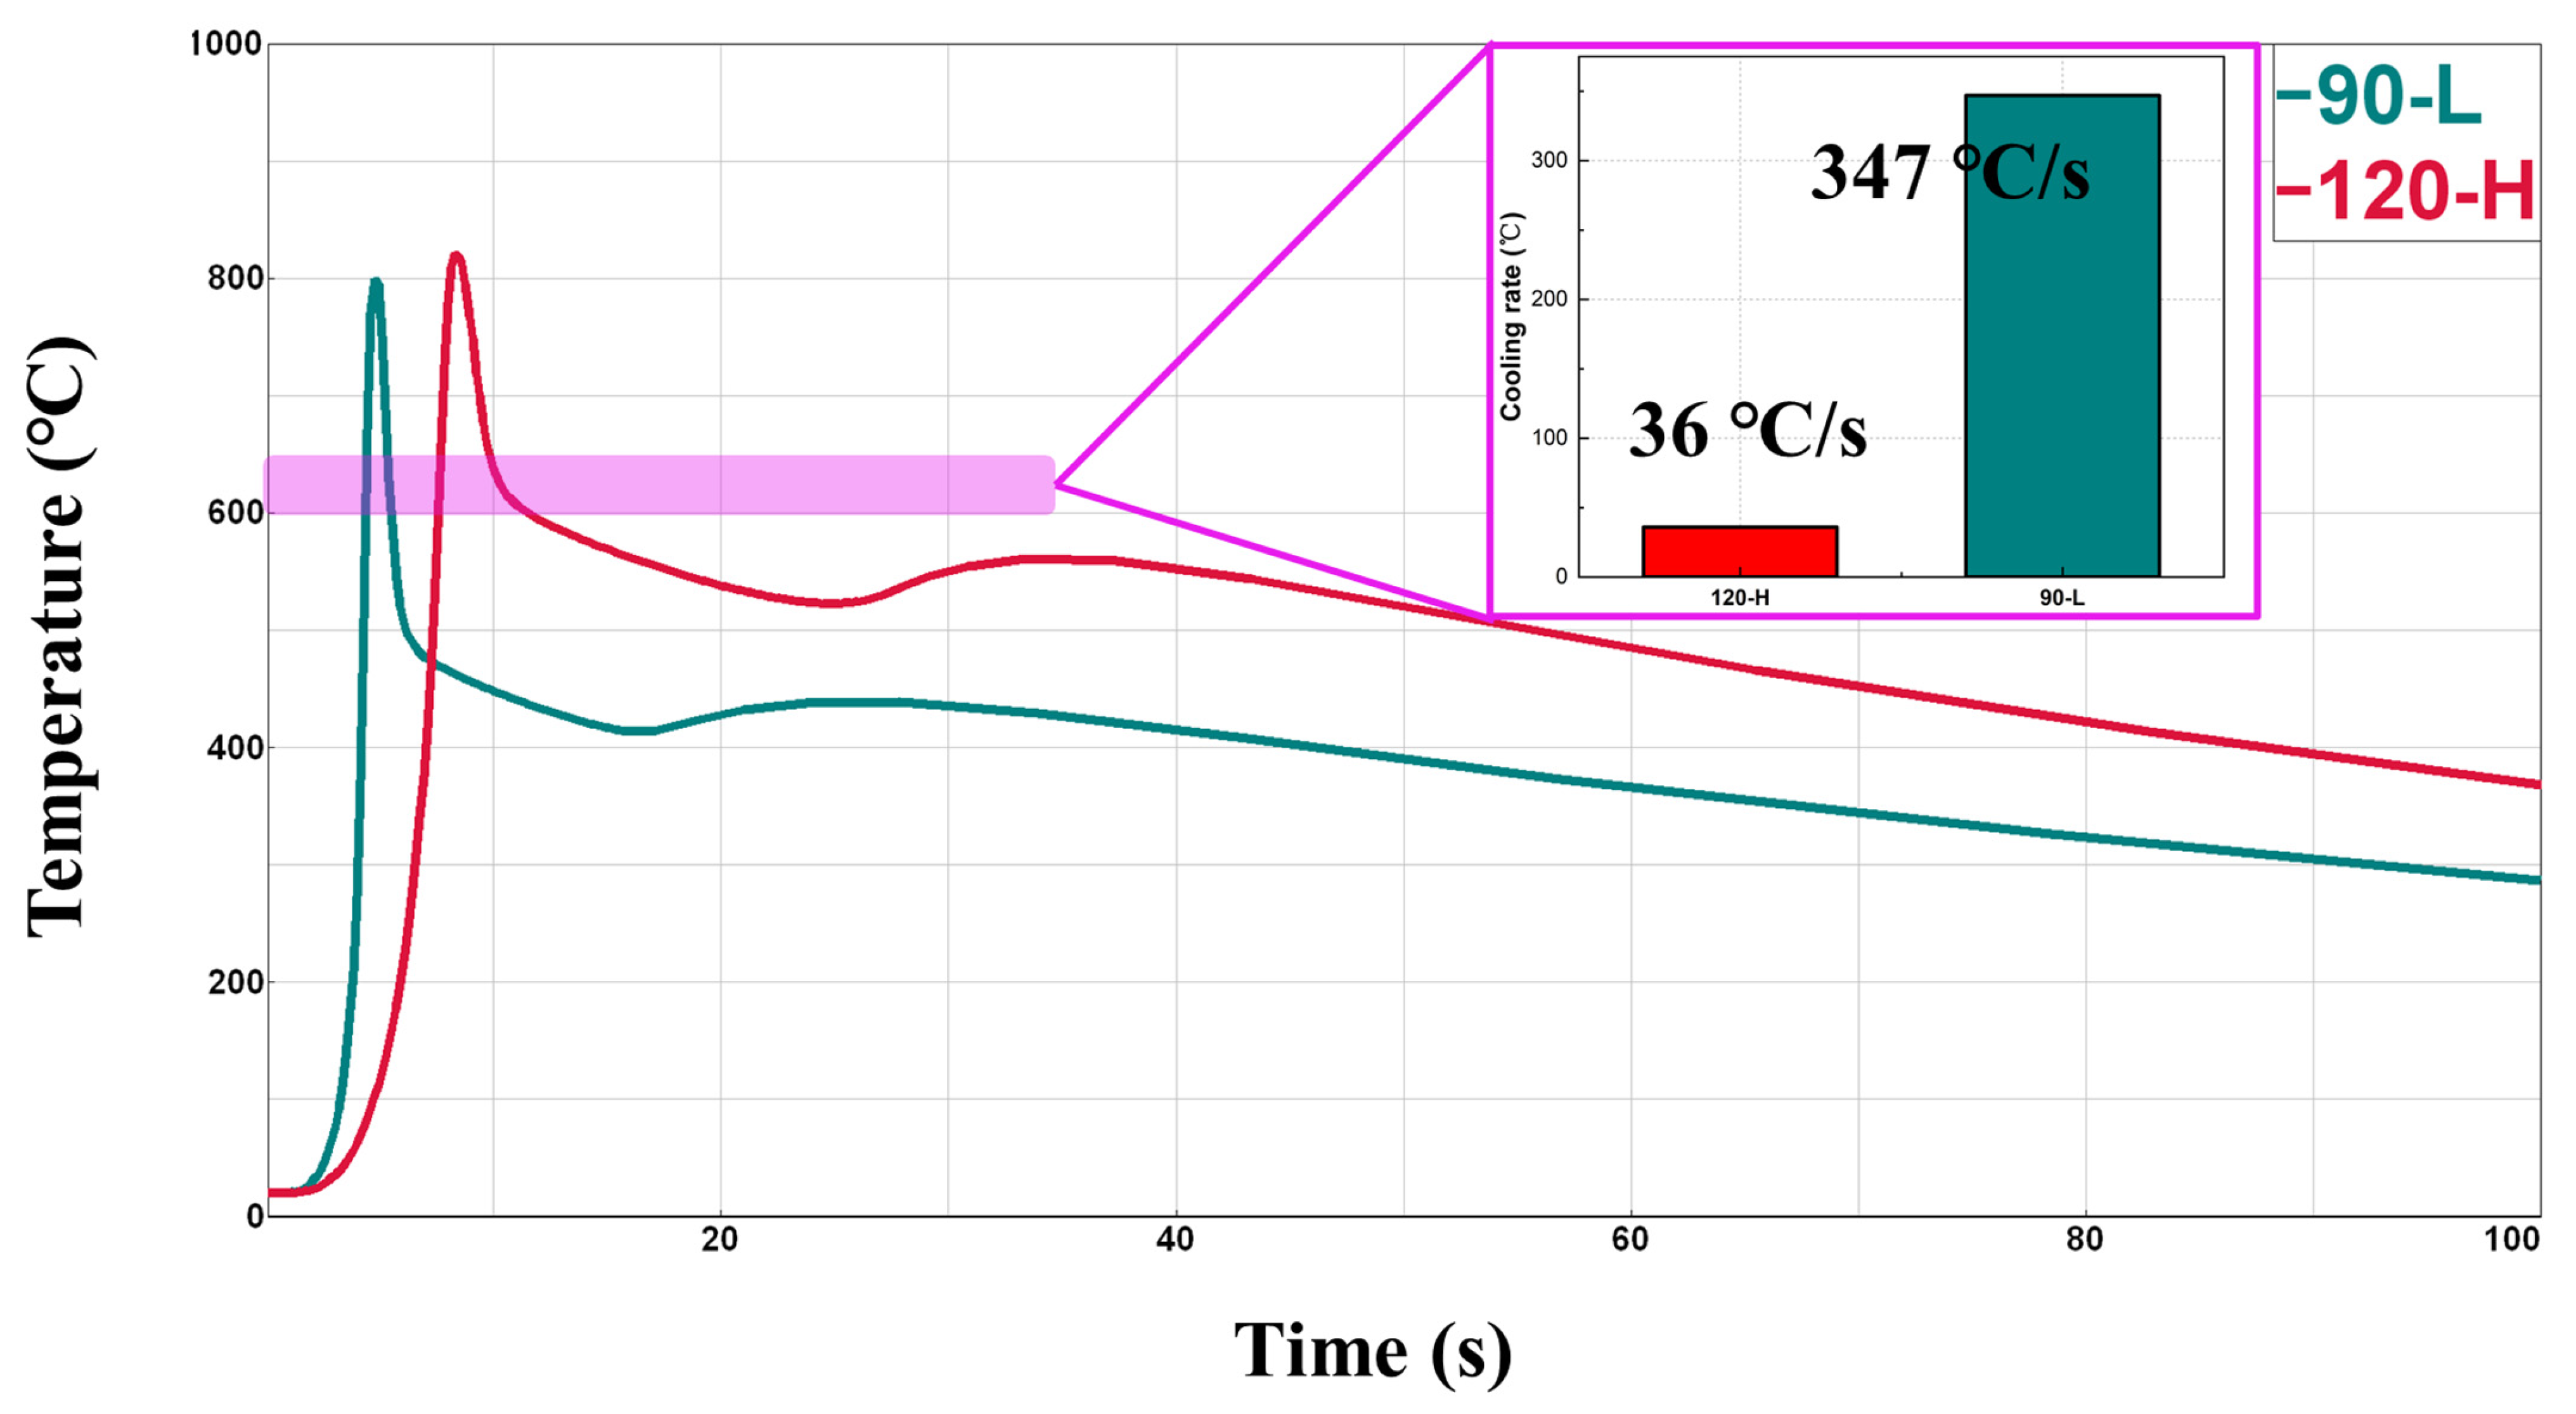
Figure 17 shows thermal history extracted at a representative computational node from the numerical simulations: 120-H is plotted in red and 90-L in cyan. Within the solidification range (600–650 °C), the computed cooling rate for 90-L exceeds that for 120-H by roughly one order of magnitude (~10×). Thus, across the phase-transformation range, 120-H cools more slowly than 90-L. Consistent with solidification kinetics, the slower cooling in 120-H produces a coarser microstructure and larger primary α-Al grains, increased dendrite arm spacing (DAS), and a more continuous eutectic-Si morphology, whereas 90-L exhibits reduced DAS, finer primary α-Al, and a more discontinuous eutectic-Si dispersion. These trends quantitatively reconcile the simulations with the observed microstructures.

5. Conclusions

  • Porosity concentrates in the arc start transient relative to the steady-state region for both 120-H and 90-L, identifying arc initiation as a critical weak link. This underscores the need to optimize ignition energy, shielding stability, and welding parameters.
  • Relative to low heat input (90-L), high heat input (120-H) produces higher porosity and a less favorable microstructure, leading to inferior mechanical performance. Within the present process window, a 90° groove is preferred unless substantial improvements are implemented for the 120° groove.
  • Faster cooling under 90-L reduces dendrite arm spacing (DAS), shifts eutectic Si morphology from coarse plate/needle-like to finer, more discontinuous forms, and measurably refines the α-Al grain structure. While these grains are not readily resolved by optical microscopy, EBSD orientation mapping delineates the refinement.
  • Liquation cracks exhibit preferential growth along forging metal flow lines in the base metal, and their interaction with groove geometry degrades joint performance. Co-optimization of flow line orientation and groove/root geometry, combined with low heat input strategies, is recommended to mitigate cracking.

Author Contributions

Conceptualization, G.X.; Methodology, Z.G.; Software, X.Q.; Validation, J.P.; Formal analysis, Z.G.; Investigation, Y.F.; Resources, X.Q.; Data curation, Z.G.; Writing—original draft, G.X.; Writing—review & editing, J.P.; Visualization, Z.G.; Supervision, Z.D.; Project administration, Y.F.; Funding acquisition, Z.D. All authors have read and agreed to the published version of the manuscript.

Funding

This research received no external funding.

Data Availability Statement

The original contributions presented in this study are included in the article. Further inquiries can be directed to the corresponding author.

Conflicts of Interest

The authors declare no conflict of interest.

References

  1. Nie, Y.; Zhang, P.; Wu, X.; Li, G.; Yan, H.; Yu, Z. Rapid Prototyping of 4043 Al-Alloy Parts by Cold Metal Transfer. Sci. Technol. Weld. Join. 2018, 23, 527–535. [Google Scholar] [CrossRef]
  2. Kazmi, K.H.; Das, A.K.; Sharma, S.K.; Mandal, A.; Shukla, A.K. Wire Arc Additive Manufacturing of ER-4043 Aluminum Alloy: Evaluation of Bead Profile, Microstructure, and Wear Behavior. Weld. World 2023, 67, 2187–2200. [Google Scholar] [CrossRef]
  3. Ahmed, M.; Javidani, M.; Maltais, A.; Chen, X.-G. Microstructure and Mechanical Properties of High-Strength AA6011 Aluminum Alloy Welding with Novel 4xxx Filler Metals. Materials 2024, 17, 380. [Google Scholar] [CrossRef]
  4. Ortega, A.G.; Corona Galvan, L.; Salem, M.; Moussaoui, K.; Segonds, S.; Rouquette, S.; Deschaux-Beaume, F. Characterisation of 4043 Aluminium Alloy Deposits Obtained by Wire and Arc Additive Manufacturing Using a Cold Metal Transfer Process. Sci. Technol. Weld. Join. 2019, 24, 538–547. [Google Scholar] [CrossRef]
  5. Nur Azida, C.L.; Ibrahim, M.F.A.; Jalar, A.; Sharif, J.; Othman, N.K.; Rashdi, N.M. The Effect of Filler ER4043 and ER5356 on Porosity Distribution of Welded AA6061 Aluminum Alloy. Adv. Mater. Res. 2010, 146–147, 987–990. [Google Scholar] [CrossRef]
  6. Liang, Y.; Shen, J.; Hu, S.; Wang, H.; Pang, J. Effect of TIG current on microstructural and mechanical properties of 6061-T6 aluminium alloy joints by TIG–CMT hybrid welding. J. Mater. Process. Technol. 2018, 255, 161–174. [Google Scholar] [CrossRef]
  7. Herzog, D.; Seyda, V.; Wycisk, E.; Emmelmann, C. Additive Manufacturing of Metals. Acta Mater. 2016, 117, 371–392. [Google Scholar] [CrossRef]
  8. Pickin, C.G.; Young, K. Evaluation of Cold Metal Transfer (CMT) Process for Welding Aluminium Alloy. Sci. Technol. Weld. Join. 2006, 11, 583–585. [Google Scholar] [CrossRef]
  9. Ding, Y.; Muñiz-Lerma, J.A.; Trask, M.; Chou, S.; Walker, A.; Brochu, M. Microstructure and Mechanical Property Considerations in Additive Manufacturing of Aluminum Alloys. MRS Bull. 2016, 41, 745–751. [Google Scholar] [CrossRef]
  10. Kah, P.; Martikainen, J.; Hiltunen, E.; Brhane, F.; Karkhin, V. Hot Cracking Susceptibility of Wrought 6005 and 6082 Aluminium Alloys. In Hot Cracking Phenomena in Welds III; Lippold, J., Böllinghaus, T., Cross, C., Eds.; Springer: Berlin/Heidelberg, Germany, 2011; pp. 59–69. [Google Scholar]
  11. Vargas, J.A.; Torres, J.E.; Pacheco, J.A.; Hernandez, R.J. Analysis of Heat Input Effect on the Mechanical Properties of Al-6061-T6 Alloy Weld Joints. Mater. Des. 2013, 52, 556–564. [Google Scholar] [CrossRef]
  12. Gulshan, F.; Ahsan, Q. Effect of Heat Input on the Structure and Properties of Aluminium Weldment TIG Welded with 4043 Filler Rod. Chem. Mater. Eng. 2014, 2, 25–32. [Google Scholar] [CrossRef]
  13. Dorta-Almenara, M.; Capace, M.C. Microstructure and Mechanical Properties of GTAW Welded Joints of AA6105 Aluminum Alloy. Rev. Facultad Ingeniería 2016, 25, 7–19. [Google Scholar] [CrossRef]
  14. Knapp, G.L.; Gussev, M.; Shyam, A.; Feldhausen, T.; Plotkowski, A. Microstructure, Deformation and Fracture Mechanisms in Al-4043 Alloy Produced by Laser Hot-Wire Additive Manufacturing. Addit. Manuf. 2022, 59, 103150. [Google Scholar] [CrossRef]
  15. Dada, M.; Popoola, P. Recent Advances in Joining Technologies of Aluminum Alloys: A Review. Discov. Mater. 2024, 4, 86. [Google Scholar] [CrossRef]
  16. Habibi, I.; Triyono; Muhayat, N. A Review on Aluminum Arc Welding and Its Problems. In Proceedings of the 6th International Conference and Exhibition on Sustainable Energy and Advanced Materials, Surakarta, Indonesia, 16–17 October 2019; Sabino, U., Imaduddin, F., Prabowo, A.R., Eds.; Springer: Singapore, 2020; pp. 819–826. [Google Scholar]
  17. Nunes, R.; Faes, K.; De Waele, W.; Simar, A.; Verlinde, W.; Lezaack, M.; Sneyers, W.; Arnhold, J. A Review on the Weldability of Additively Manufactured Aluminium Parts by Fusion and Solid-State Welding Processes. Metals 2023, 13, 1724. [Google Scholar] [CrossRef]
  18. Henry, S.; Minghetti, T.; Rappaz, M. Dendrite Growth Morphologies in Aluminium Alloys. Acta Mater. 1998, 46, 6431–6443. [Google Scholar] [CrossRef]
  19. Shankar, S.; Riddle, Y.W.; Makhlouf, M.M. Eutectic Solidification of Aluminum–Silicon Alloys. Metall. Mater. Trans. A 2004, 35, 3038–3043. [Google Scholar] [CrossRef]
  20. Rosa, D.M.; Spinelli, J.E.; Garcia, A. Tertiary Dendrite Arm Spacing during Downward Transient Solidification of Al–Cu and Al–Si Alloys. Mater. Lett. 2006, 60, 1871–1874. [Google Scholar] [CrossRef]
  21. Coniglio, N.; Cross, C.E.; Dörfel, I.; Österle, W. Phase Formation in 6060/4043 Aluminum Weld Solidification. Mater. Sci. Eng. A 2009, 517, 321–327. [Google Scholar] [CrossRef]
  22. Ujjwal, K.; Anand Kumar, K.; Anand, M.; Singh Raman, R.K.; Das, A.K. Effect of Current Waveforms during Directed Energy Deposition of 4043 Aluminum Alloy on Microstructure, Hardness, and Wear of Alloy. Materials 2023, 16, 6716. [Google Scholar] [CrossRef]
  23. Kelly, S.M. Thermal and Microstructure Modeling of Metal Deposition Processes with Application to Ti-6Al-4V. Ph.D. Thesis, Virginia Polytechnic Institute & State University, Blacksburg, VA, USA, 2004. [Google Scholar]
  24. Fu, R.; Tang, S.; Lu, J.; Cui, Y.; Li, Z.; Zhang, H.; Xu, T.; Chen, Z.; Liu, C. Hot-Wire Arc Additive Manufacturing of Aluminum Alloy with Reduced Porosity and High Deposition Rate. Mater. Des. 2021, 199, 109419. [Google Scholar] [CrossRef]
  25. Kou, S. Welding Metallurgy, 2nd ed.; John Wiley & Sons: Hoboken, NJ, USA, 2003. [Google Scholar]
  26. Wang, B.B.; Xie, G.M.; Wu, L.H.; Xue, P.; Ni, D.R.; Xiao, B.L.; Liu, Y.D.; Ma, Z.Y. Grain Size Effect on Tensile Deformation Behaviors of Pure Aluminum. Mater. Sci. Eng. A 2021, 820, 141504. [Google Scholar] [CrossRef]
  27. Schempp, P.; Cross, C.E.; Häcker, R.; Pittner, A.; Rethmeier, M. Influence of Grain Size on Mechanical Properties of Aluminium GTA Weld Metal. Weld. World 2013, 57, 245–254. [Google Scholar] [CrossRef]
  28. Yuan, T.; Kou, S.; Luo, Z. Grain Refining by Ultrasonic Stirring of the Weld Pool. Acta Mater. 2016, 106, 144–154. [Google Scholar] [CrossRef]
  29. Zhang, D.; Qiu, D.; Gibson, M.; Zheng, Y.; Fraser, H.; StJohn, D.; Easton, M. Additive Manufacturing of Ultrafine-Grained High-Strength Titanium Alloys. Nature 2019, 576, 91–95. [Google Scholar] [CrossRef]
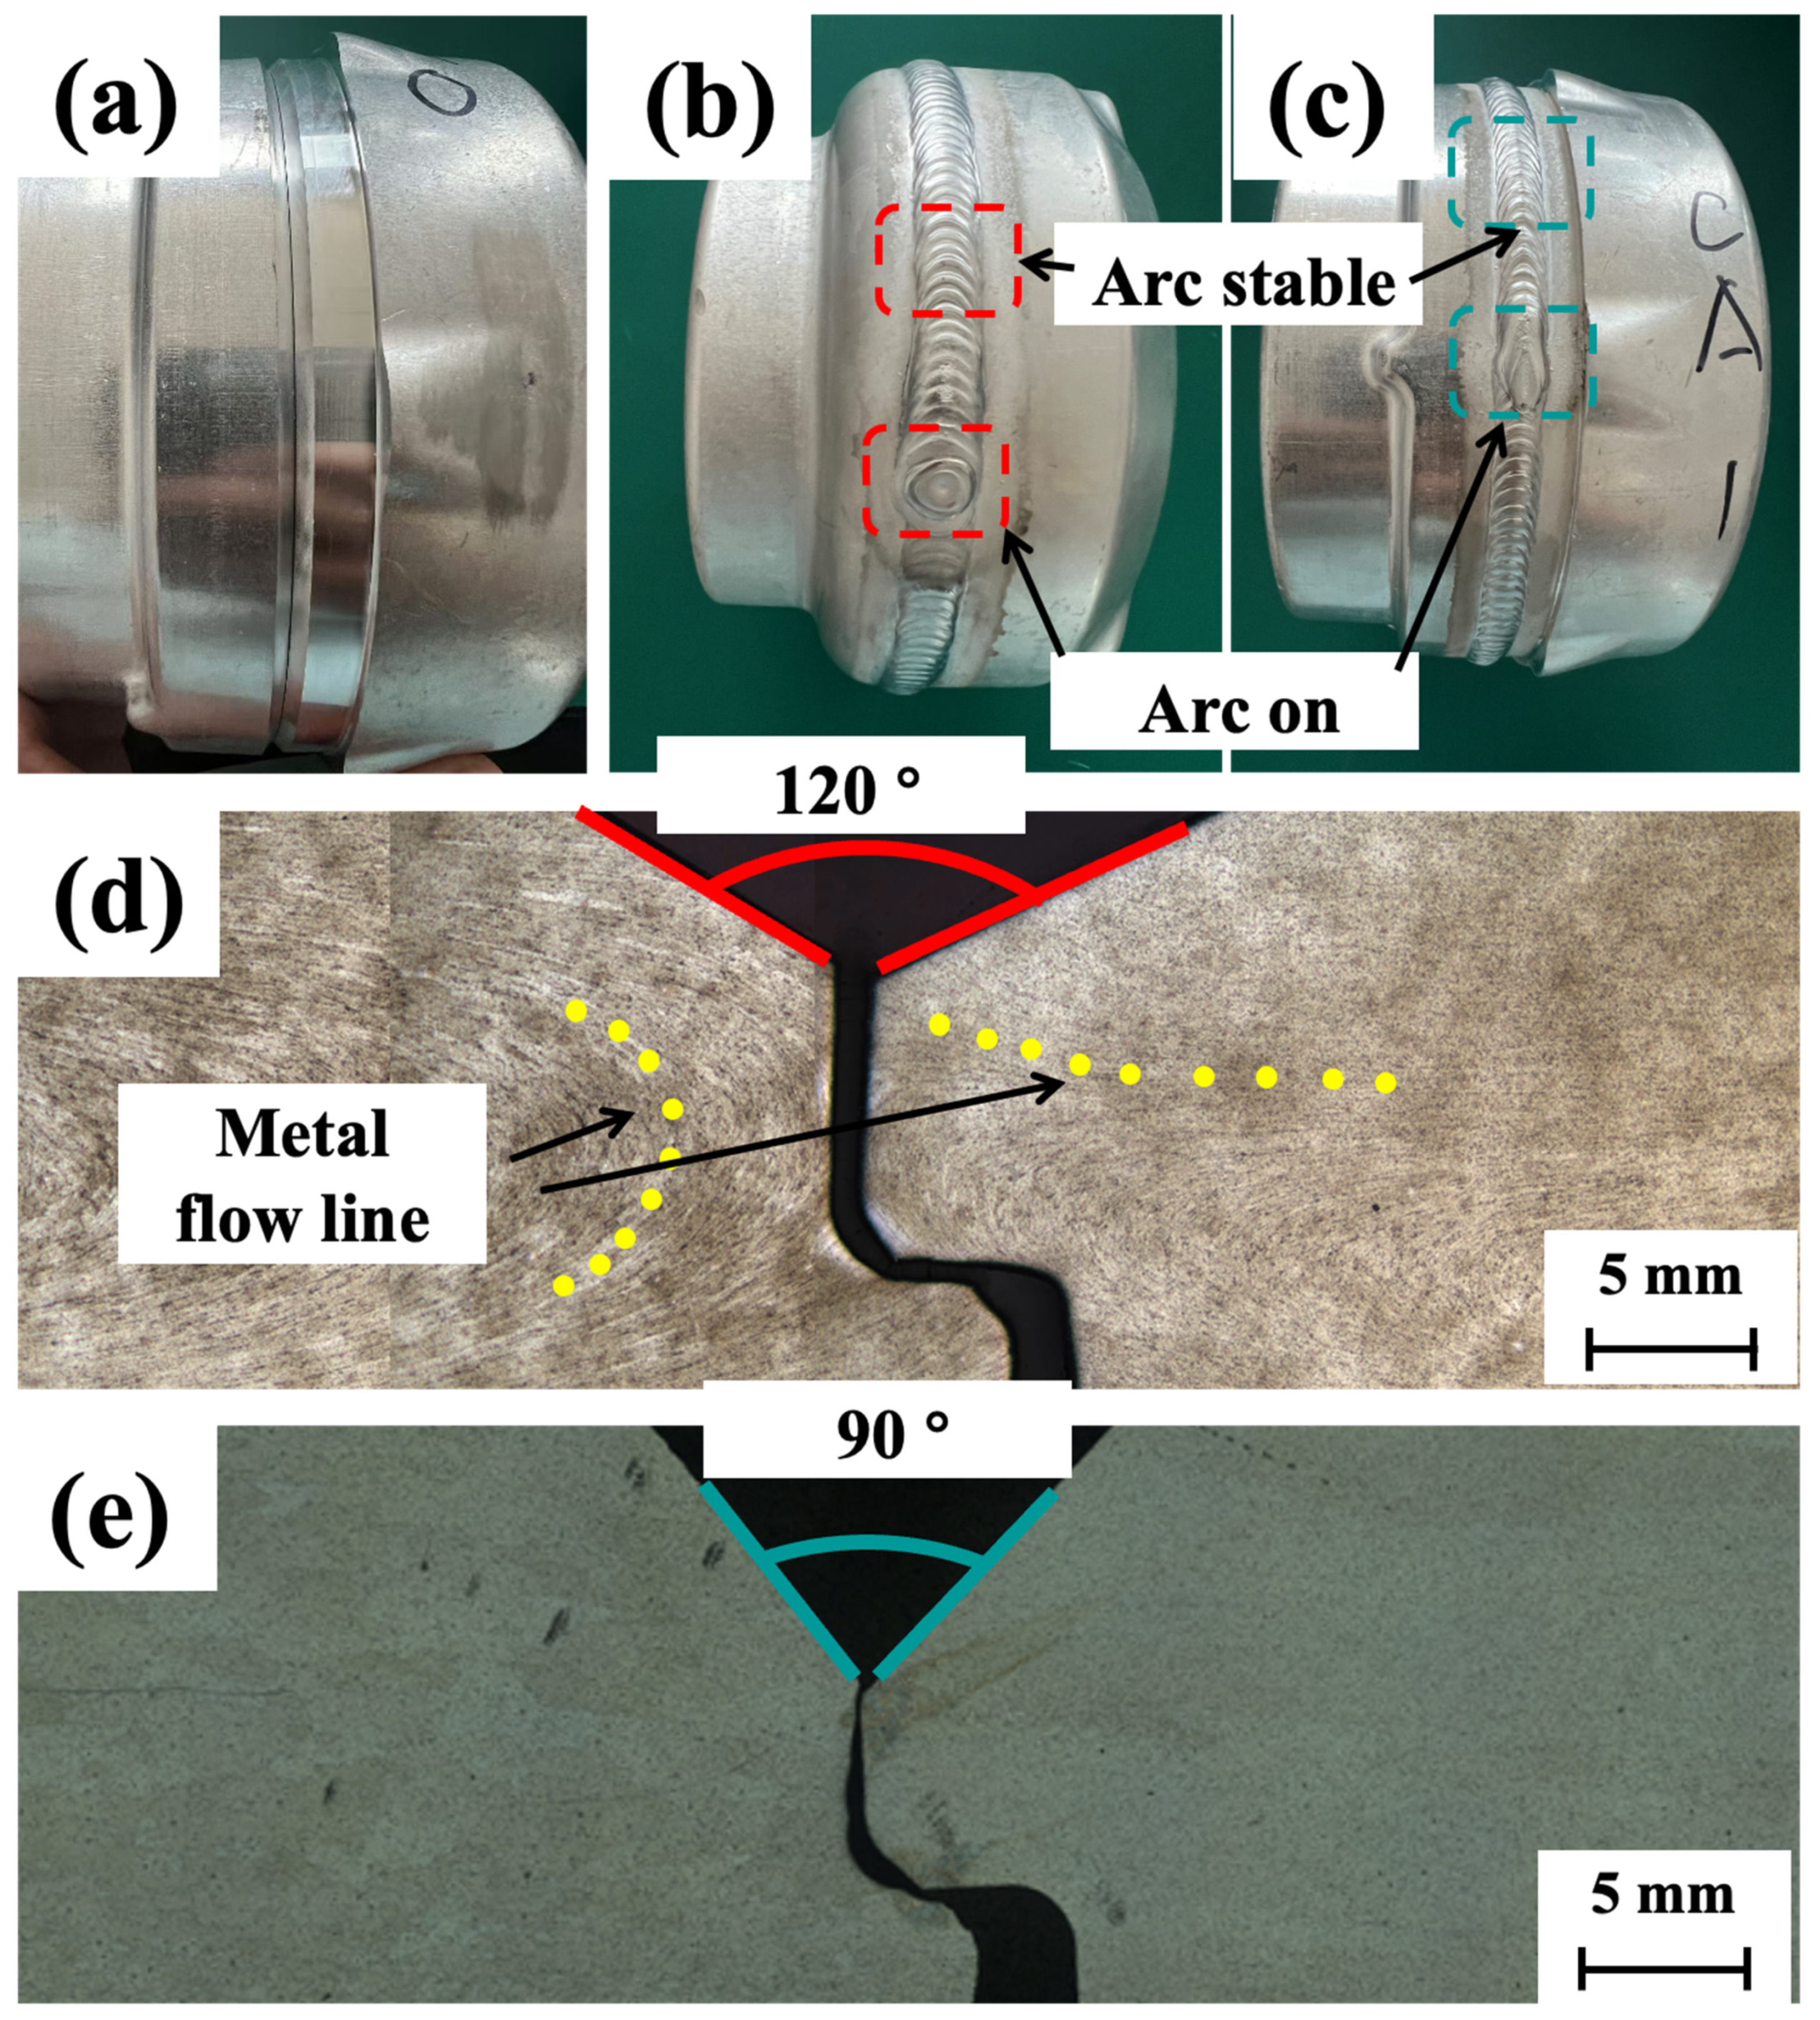
Figure 1. Morphology of the specimens before and after welding: (a) overall morphology prior to welding; (b,c) as-welded surface morphology of 120-H and 90-L, respectively; (d,e) cross-sectional morphology of the weld groove for 120-H and 90-L, respectively.
Metals 15 01290 g001
Figure 2. Tensile testing of the weld metal: (a,c) sampling locations for 120-H and 90-L; (b,d) appearances of the tensile specimens before and after testing; (e) universal testing machine equipped with a laser extensometer; (f) dimensions of the miniature specimen.
Metals 15 01290 g002
Figure 3. Finite element analysis (FEA) model development for 120° and 90° groove configurations: (a,b) overall models for 120-H and 90-L; (c,d) cross-sectional views of the respective groove geometries; (e) Goldak’s bi-ellipsoidal model.
Metals 15 01290 g003
Figure 4. Top-view macrographs for 120° and 90° groove configurations: (a,b) arc-ignition regions of 120-H (red) and 90-L (cyan); (c,d) steady-state regions of 120-H (red) and 90-L (cyan).
Metals 15 01290 g004
Figure 5. Cross-sectional weld geometry and microporosity analysis for 120° and 90° groove configurations: (a,e) arc-start region of 120-H; (b,f) steady-arc region of 120-H; (c,g) arc-start region of 90-L; (d,h) steady-arc region of 90-L.
Metals 15 01290 g005
Figure 6. Microstructures for 120° and 90° groove configurations: (a,b) arc-start regions of 120-H and 90-L; (c,d) steady-state regions of 120-H and 90-L.
Metals 15 01290 g006
Figure 7. SEM micrographs of the steady-arc regions for 120° and 90° groove configurations: (a,b) 2000× for 120-H and 90-L, respectively; (c,d) 5000× for 120-H and 90-L, respectively.
Metals 15 01290 g007
Figure 8. Hardness distribution in the steady-arc region for different groove configurations: (a) 120-H; (b) 90-L.
Metals 15 01290 g008
Figure 9. Mechanical properties of 120-H and 90-L.
Metals 15 01290 g009
Figure 10. Numerically predicted temperature field and molten pool: (a,c) 120-H; (b,d) 90-L; (e) cross-section structure of the welded joint and the temperature distribution.
Metals 15 01290 g010
Figure 11. Morphologies of liquation crack propagation under different flow-line orientations: (a,c,e) parallel flow lines; (b,d,f) quasi-perpendicular flow lines.
Metals 15 01290 g011
Figure 12. EDS analyses of microstructures adjacent to two types of liquation cracks: (a) near flow lines parallel to the welding direction; (b) near quasi-perpendicular flow lines. (a1,b1) EDS map of element distribution.
Metals 15 01290 g012
Figure 13. Microstructure of the liquation-cracking region: (a) overview of the liquated zone; (a1) microstructure of the 4043 alloy; (a2) fusion interface between 4043 and 6061; (a3) microstructure of the 6061 alloy.
Metals 15 01290 g013
Figure 14. Porosity morphology and distribution at the weld root for different groove angles (defects were identified by black arrows): (a,b) 120-H; (c,d) 90-L.
Metals 15 01290 g014
Figure 15. Eutectic Si morphology and dendrite arm spacing under different heat inputs: (a) 120-H; (b) 90-L; (ce) evolution of eutectic Si morphology with cooling rate. Note: dendrite arm spacing refers to the secondary dendrite arm spacing (SDAS).
Metals 15 01290 g015
Figure 16. Aluminum grain size characterized by EBSD inverse pole Figure (IPF) maps under different heat inputs: (a) 120-H (red); (b) 90-L (cyan); (c) grain size statistics; (d,e) KAM results for 120-H and 90-L.
Metals 15 01290 g016
Figure 17. Quantitative thermodynamic simulation analysis of cooling rates within the solidification interval under different heat inputs.
Metals 15 01290 g017
Table 1. Chemical composition of the base metal and filler wire.
SiFeCuMgMnZnCrTiV
4043Filler metal60.80.30.050.050.100.2-
120-HBase metal0.690.380.281.040.110.0160.140.050.015
90-LBase metal0.70.1550.241.010.080.0090.090.080.024
Table 2. Welding parameters for the cold metal transfer (CMT) process.
Feed Rate
(m/min)
Voltage
(V)
Current
(A)
Welding Speed
(cm/min)
Q
(J)
Heat Input (J/mm)
120-H5.917.9135392416.5223
90-L6.318.4143642631.2149
Table 3. Modelling parameters applied in SYSWELD.
Model Parameters120-H90-L
Material (base metals)6061
Material (weld metals)AlMgSi
Density (kg/m3)2.7
Specific heat (J/kg·K)900
Thermal conductivity (W/m·K)560
Ambient temperature (°C)20
Element size (mm3)~0.4
Heat source parameter (af + ar)10 mm10 mm
Heat source parameter (b)9 mm5 mm
Heat source parameter (c)2 mm2 mm
Arc typeMIG
Arc efficiency60%
Table 4. Post-weld chemical composition of the base metal and weld metal.
SiFeCuMgMnZnCrTiV
120-HBase metal0.690.380.281.040.110.0160.140.050.015
120-HWeld metal3.10.210.1480.440.050.0160.080.050.014
90-LBase metal0.70.1550.241.010.080.0090.090.080.024
90-LWeld metal3.070.120.120.480.050.0130.050.050.016
Disclaimer/Publisher’s Note: The statements, opinions and data contained in all publications are solely those of the individual author(s) and contributor(s) and not of MDPI and/or the editor(s). MDPI and/or the editor(s) disclaim responsibility for any injury to people or property resulting from any ideas, methods, instructions or products referred to in the content.